Cambridge IGCSE Environmental Management 0680 — 2023 Feb/March Paper 2 · Variant 2
0680/22/F/M/23 · 4 questions · 80 marks · ≈90 min
The question paper and its mark scheme, free to read here and free to download. This is Cambridge’s own paper, exactly as it was sat.
Question paper20 pages

Mark scheme11 pages
Answers below. Sit the paper first if you are practising.
Questions as text
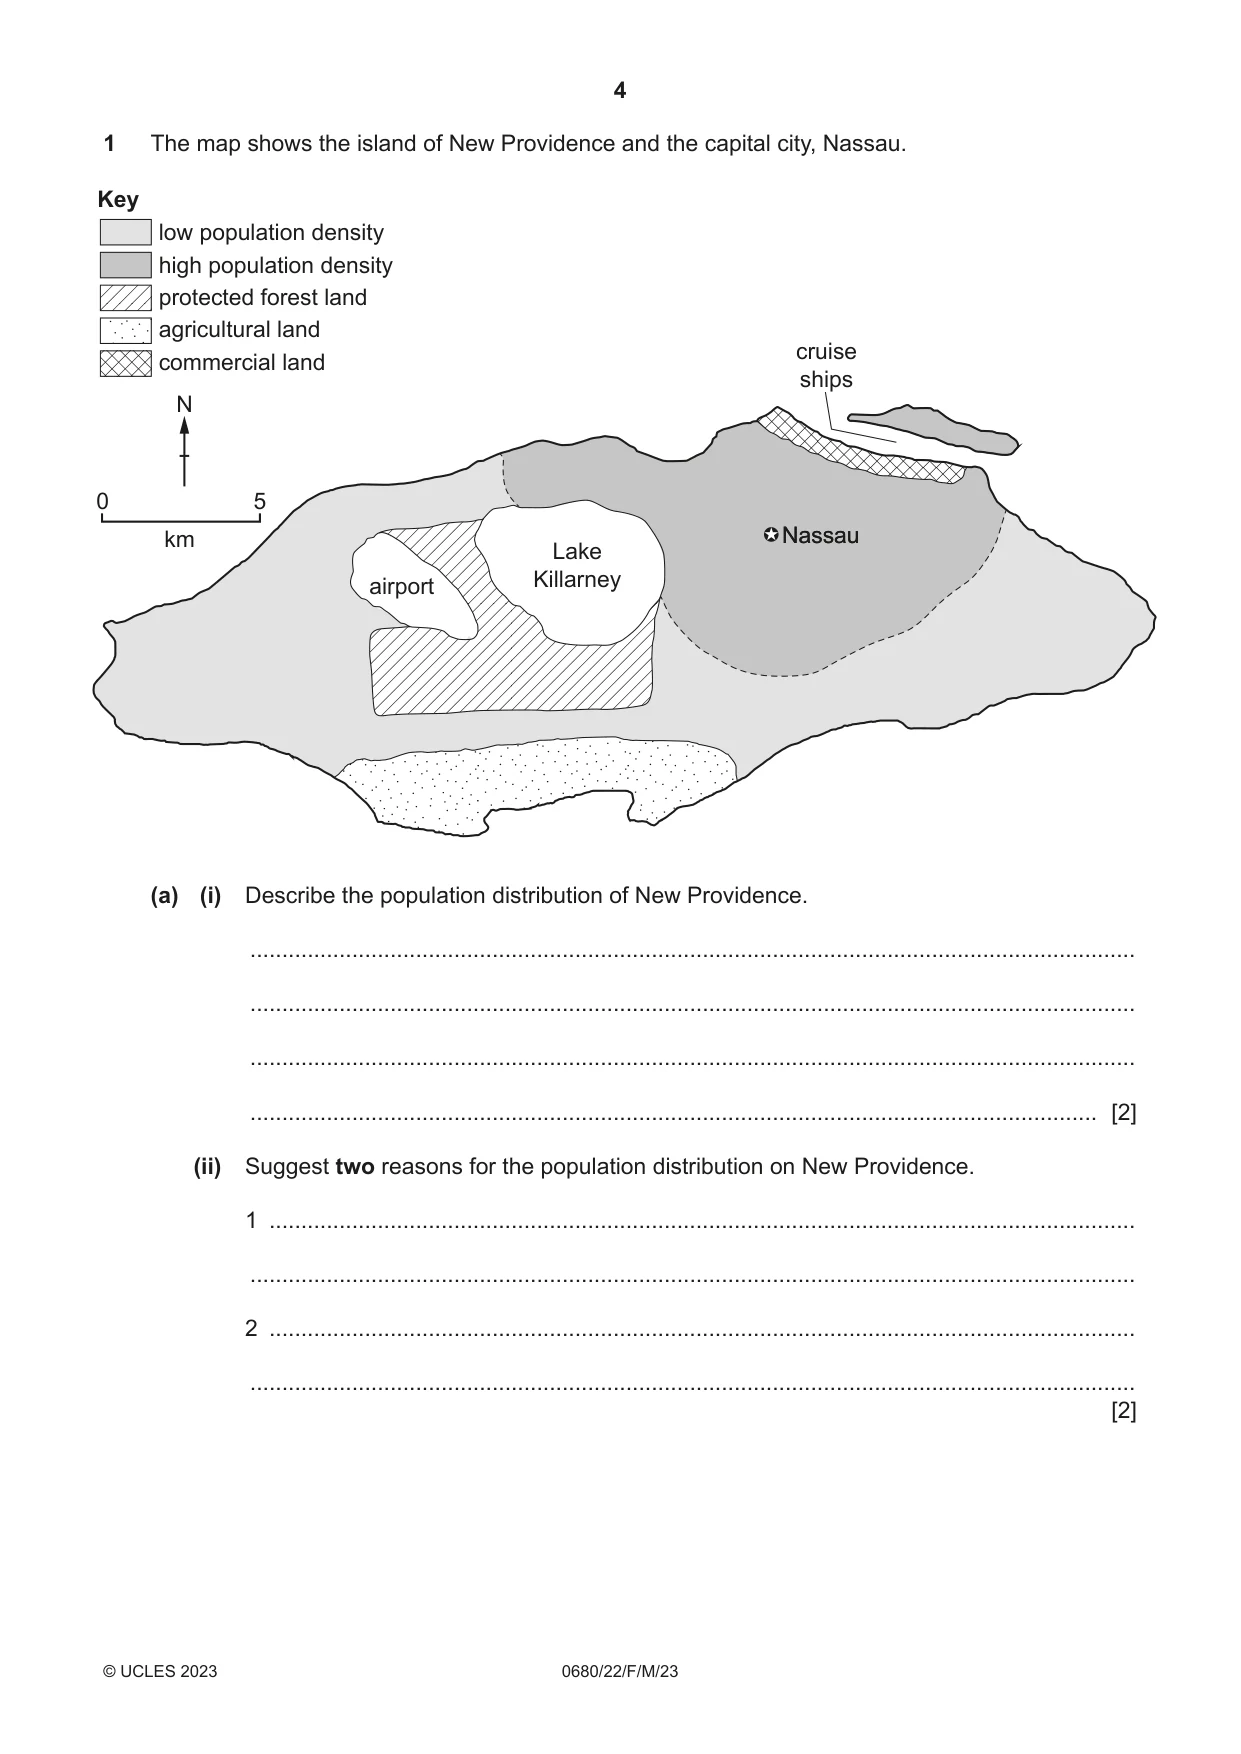
Q1 · The map shows the island of New Providence and the capital city, Nassau
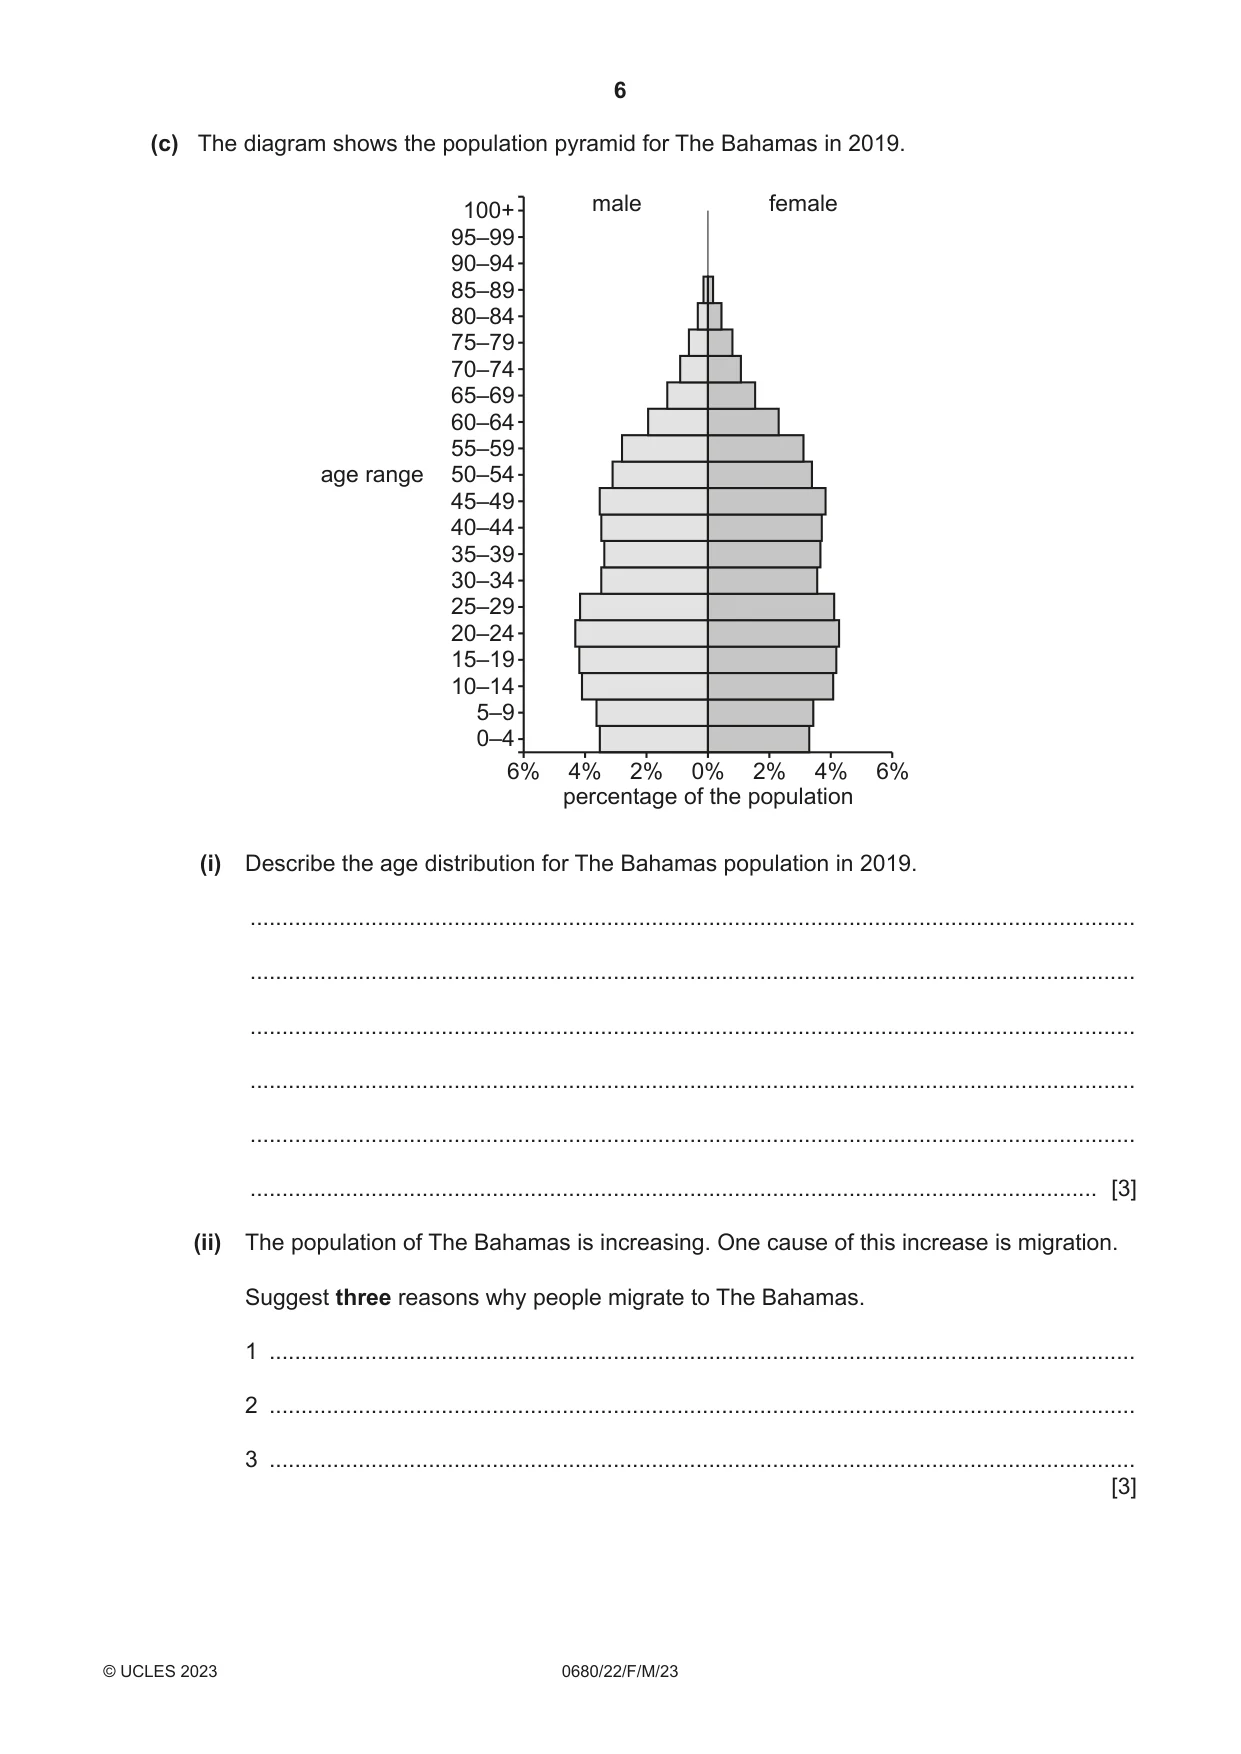
1 The map shows the island of New Providence and the capital city, Nassau. Key low population density high population density protected forest land agricultural land cruise commercial land ships N 0 5 km NassauNassau Lake Killarney airport (a) (i) Describe the population distribution of New Providence. ........................................................................................................................................... ........................................................................................................................................... ........................................................................................................................................... ..................................................................................................................................... [2] (ii) Suggest two reasons for the population distribution on New Providence. 1 ........................................................................................................................................ ........................................................................................................................................... 2 ........................................................................................................................................ ........................................................................................................................................... [2] (b) It is estimated that 70% of the population of The Bahamas live on New Providence. Calculate the number of people living on New Providence. number of people = ......................................................... [1] (c) The diagram shows the population pyramid for The Bahamas in 2019. male female 100+ 95–99 90–94 85–89 80–84 75–79 70–74 65–69 60–64 55–59 age range 50–54 45–49 40–44 35–39 30–34 25–29 20–24 15–19 10–14 5–9 0–4 6% 4% 2% 0% 2% 4% 6% percentage of the population (i) Describe the age distribution for The Bahamas population in 2019. ........................................................................................................................................... ........................................................................................................................................... ........................................................................................................................................... ........................................................................................................................................... ........................................................................................................................................... ..................................................................................................................................... [3] (ii) The population of The Bahamas is increasing. One cause of this increase is migration. Suggest three reasons why people migrate to The Bahamas. 1 ........................................................................................................................................ 2 ........................................................................................................................................ 3 ........................................................................................................................................ [3] (d) There are no rivers in The Bahamas. However, Andros Island has large stores of fresh water located in underground rocks. The water is extracted using wells. To meet the demand for fresh water in the capital city, water is transported from Andros Island using water barges. Water barges are large ships designed to carry water. (i) State the name of the water source located in underground rocks. ..................................................................................................................................... [1] (ii) State two other sources of fresh water that can be used in The Bahamas. 1 ........................................................................................................................................ 2 ........................................................................................................................................ [2] (iii) Describe the benefits and limitations of using water barges to meet the demand for fresh water. benefits .............................................................................................................................. ........................................................................................................................................... ........................................................................................................................................... ........................................................................................................................................... ........................................................................................................................................... limitations .......................................................................................................................... ........................................................................................................................................... ........................................................................................................................................... ........................................................................................................................................... ........................................................................................................................................... [4] [Total: 18]
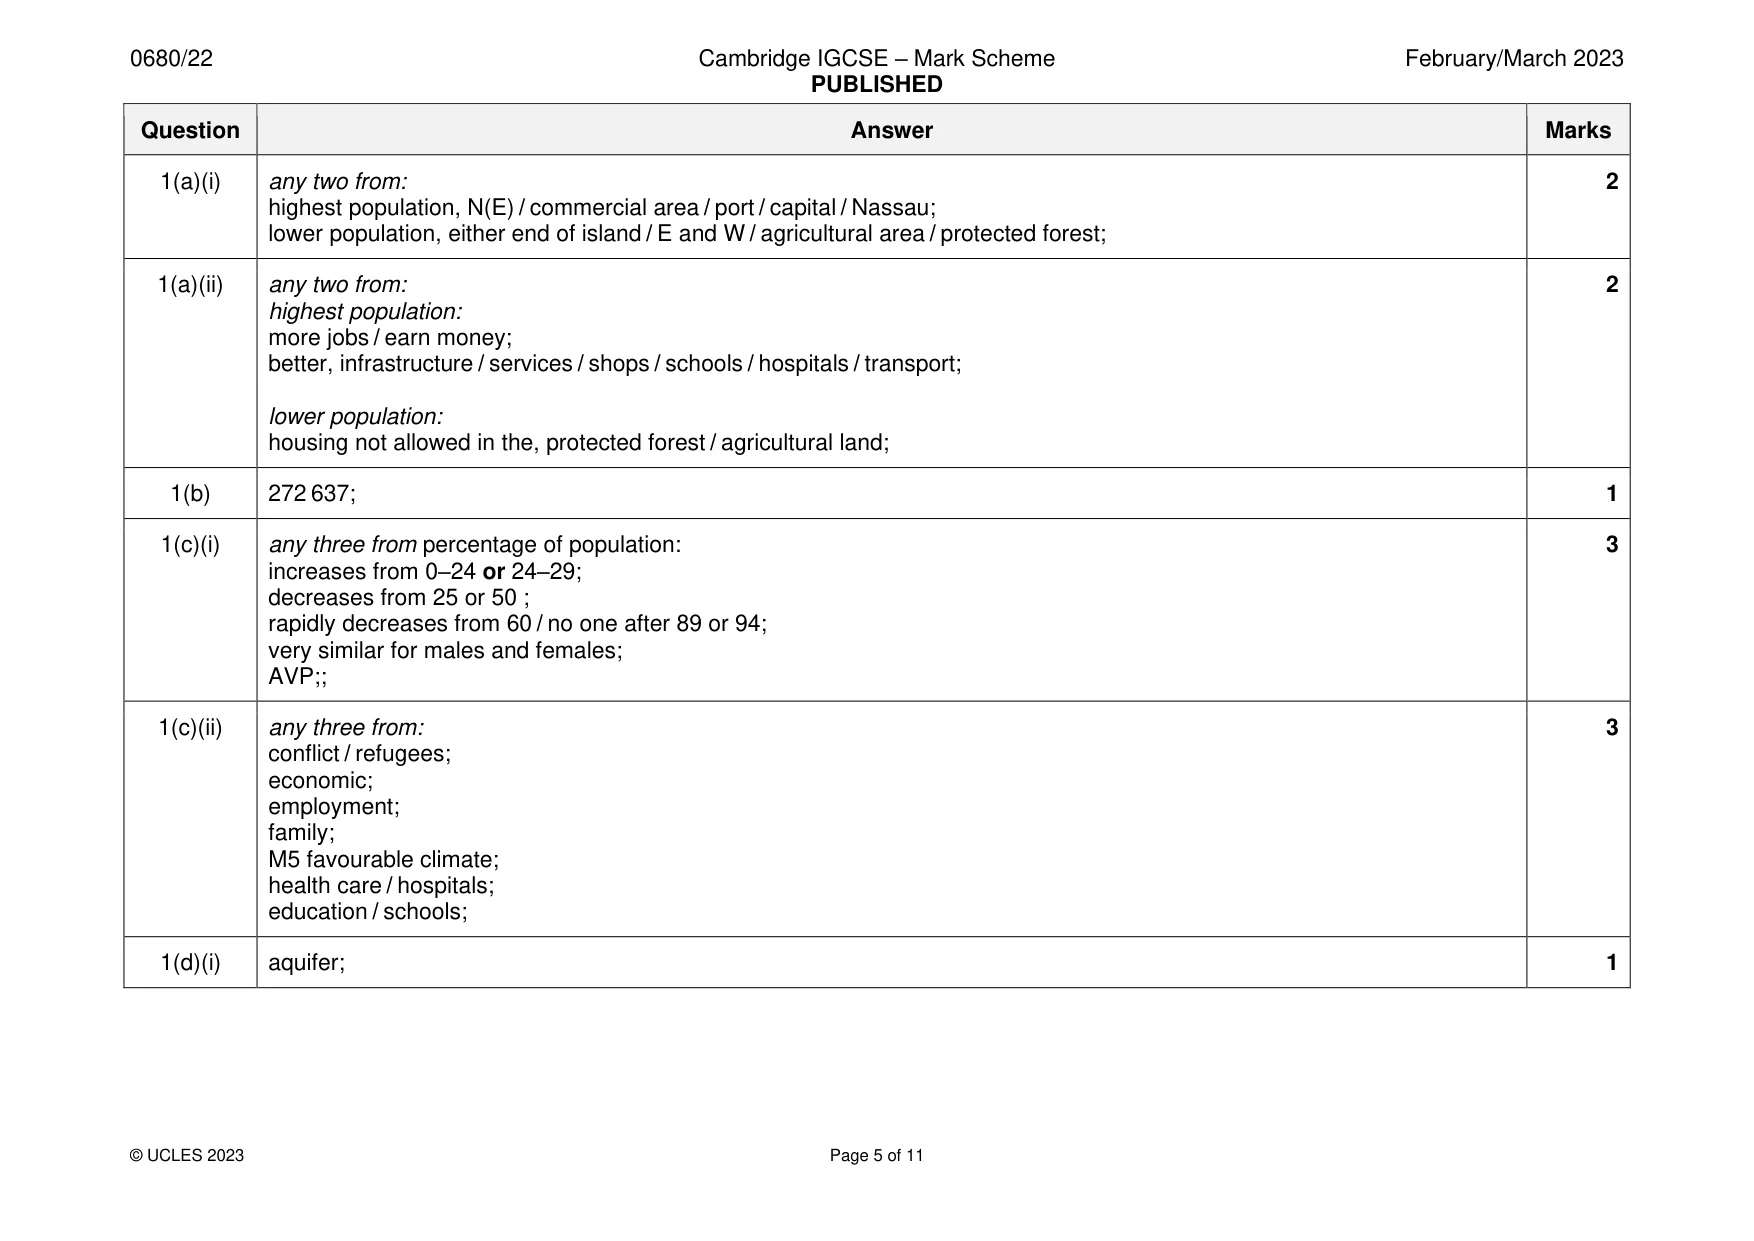
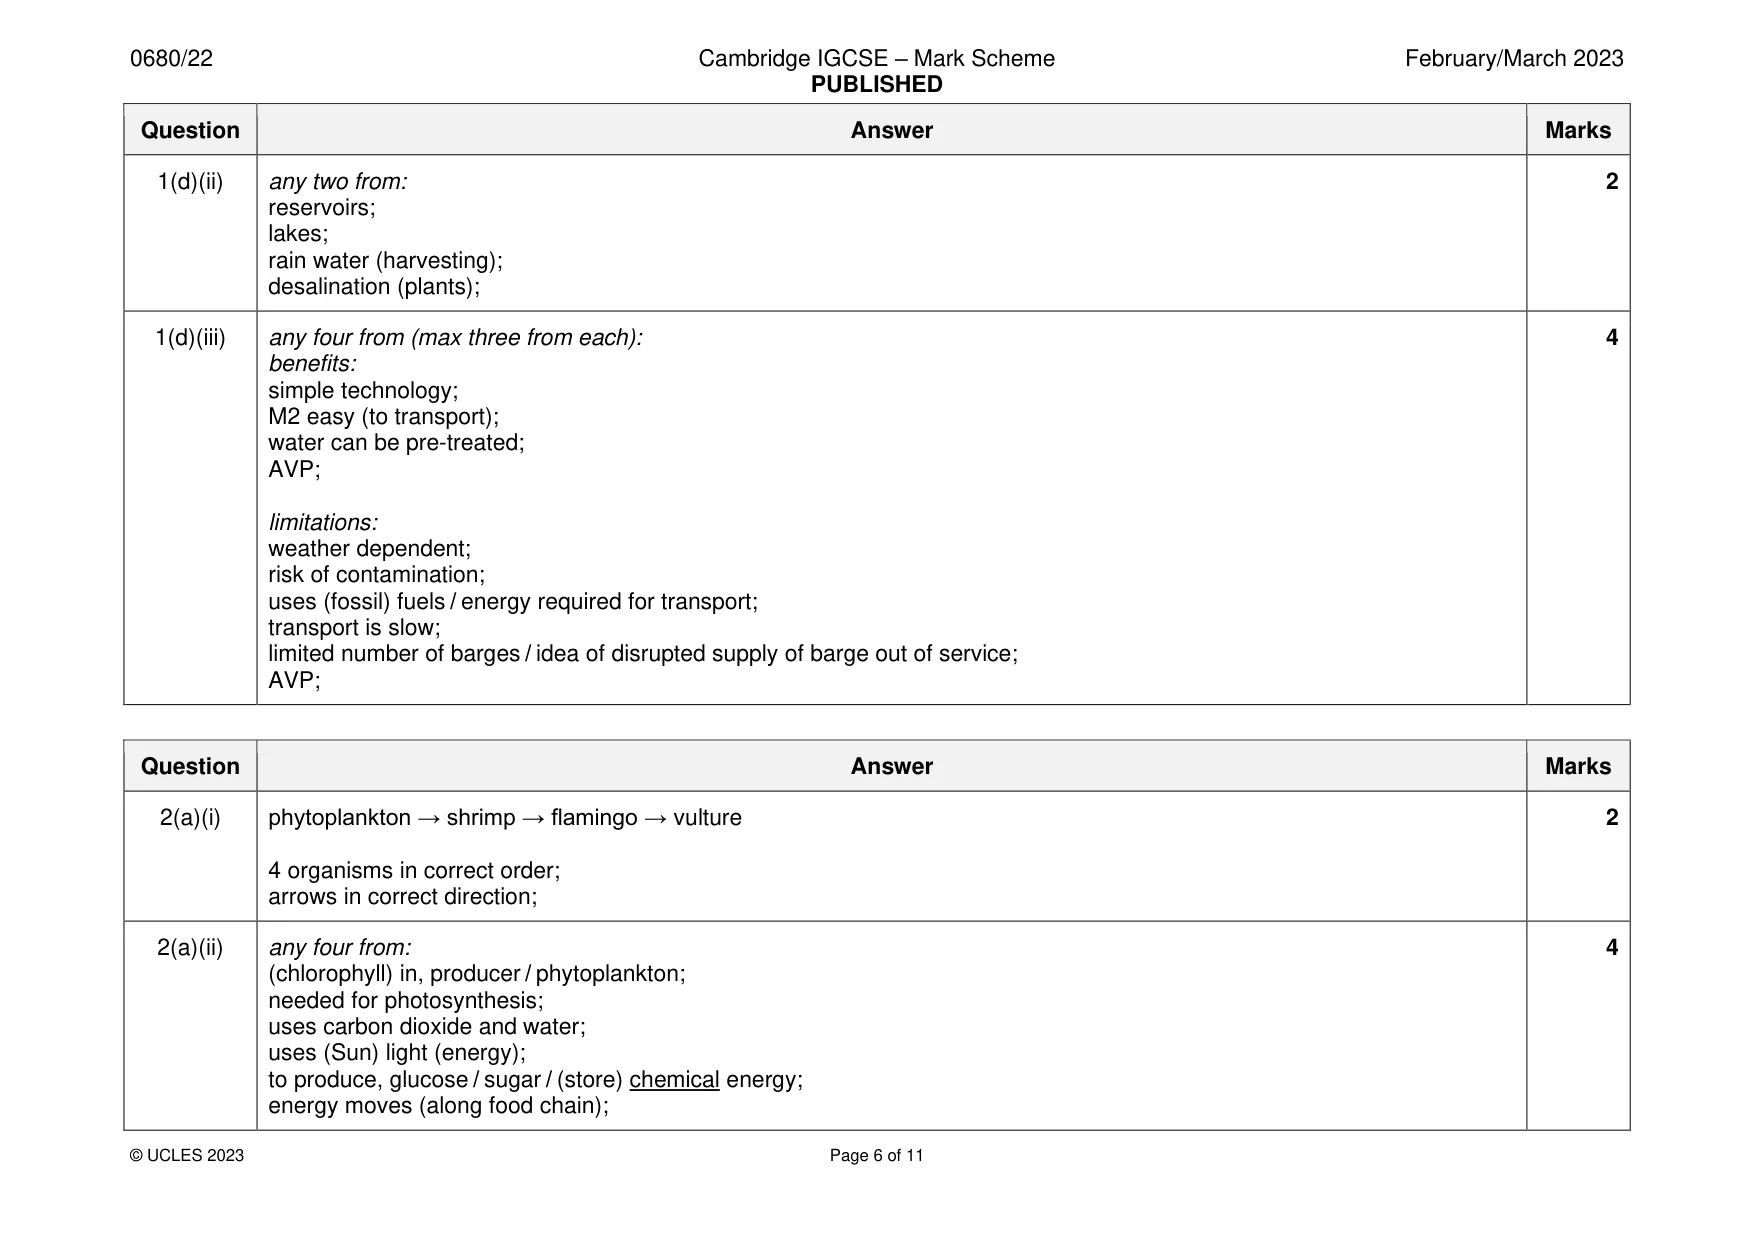
Mark scheme: Question Answer Marks 1(a)(i) any two from: 2 highest population, N(E) / commercial area / port / capital / Nassau; lower population, either end of island / E and W / agricultural area / protected forest; 1(a)(ii) any two from: 2 highest population: more jobs / earn money; better, infrastructure / services / shops / schools / hospitals / transport; lower population: housing not allowed in the, protected forest / agricultural land; 1(b) 272 637; 1 1(c)(i) any three from percentage of population: 3 increases from 0–24 or 24–29; decreases from 25 or 50 ; rapidly decreases from 60 / no one after 89 or 94; very similar for males and females; AVP;; 1(c)(ii) any three from: 3 conflict / refugees; economic; employment; family; M5 favourable climate; health care / hospitals; education / schools; 1(d)(i) aquifer; 1 1(d)(ii) any two from: 2 reservoirs; lakes; rain water (harvesting); desalination (plants); 1(d)(iii) any four from (max three from each): 4 benefits: simple technology; M2 easy (to transport); water can be pre-treated; AVP; limitations: weather dependent; risk of contamination; uses (fossil) fuels / energy required for transport; transport is slow; limited number of barges / idea of disrupted supply of barge out of service; AVP;
Q2 · The fact sheet gives information on the Caribbean flamingo
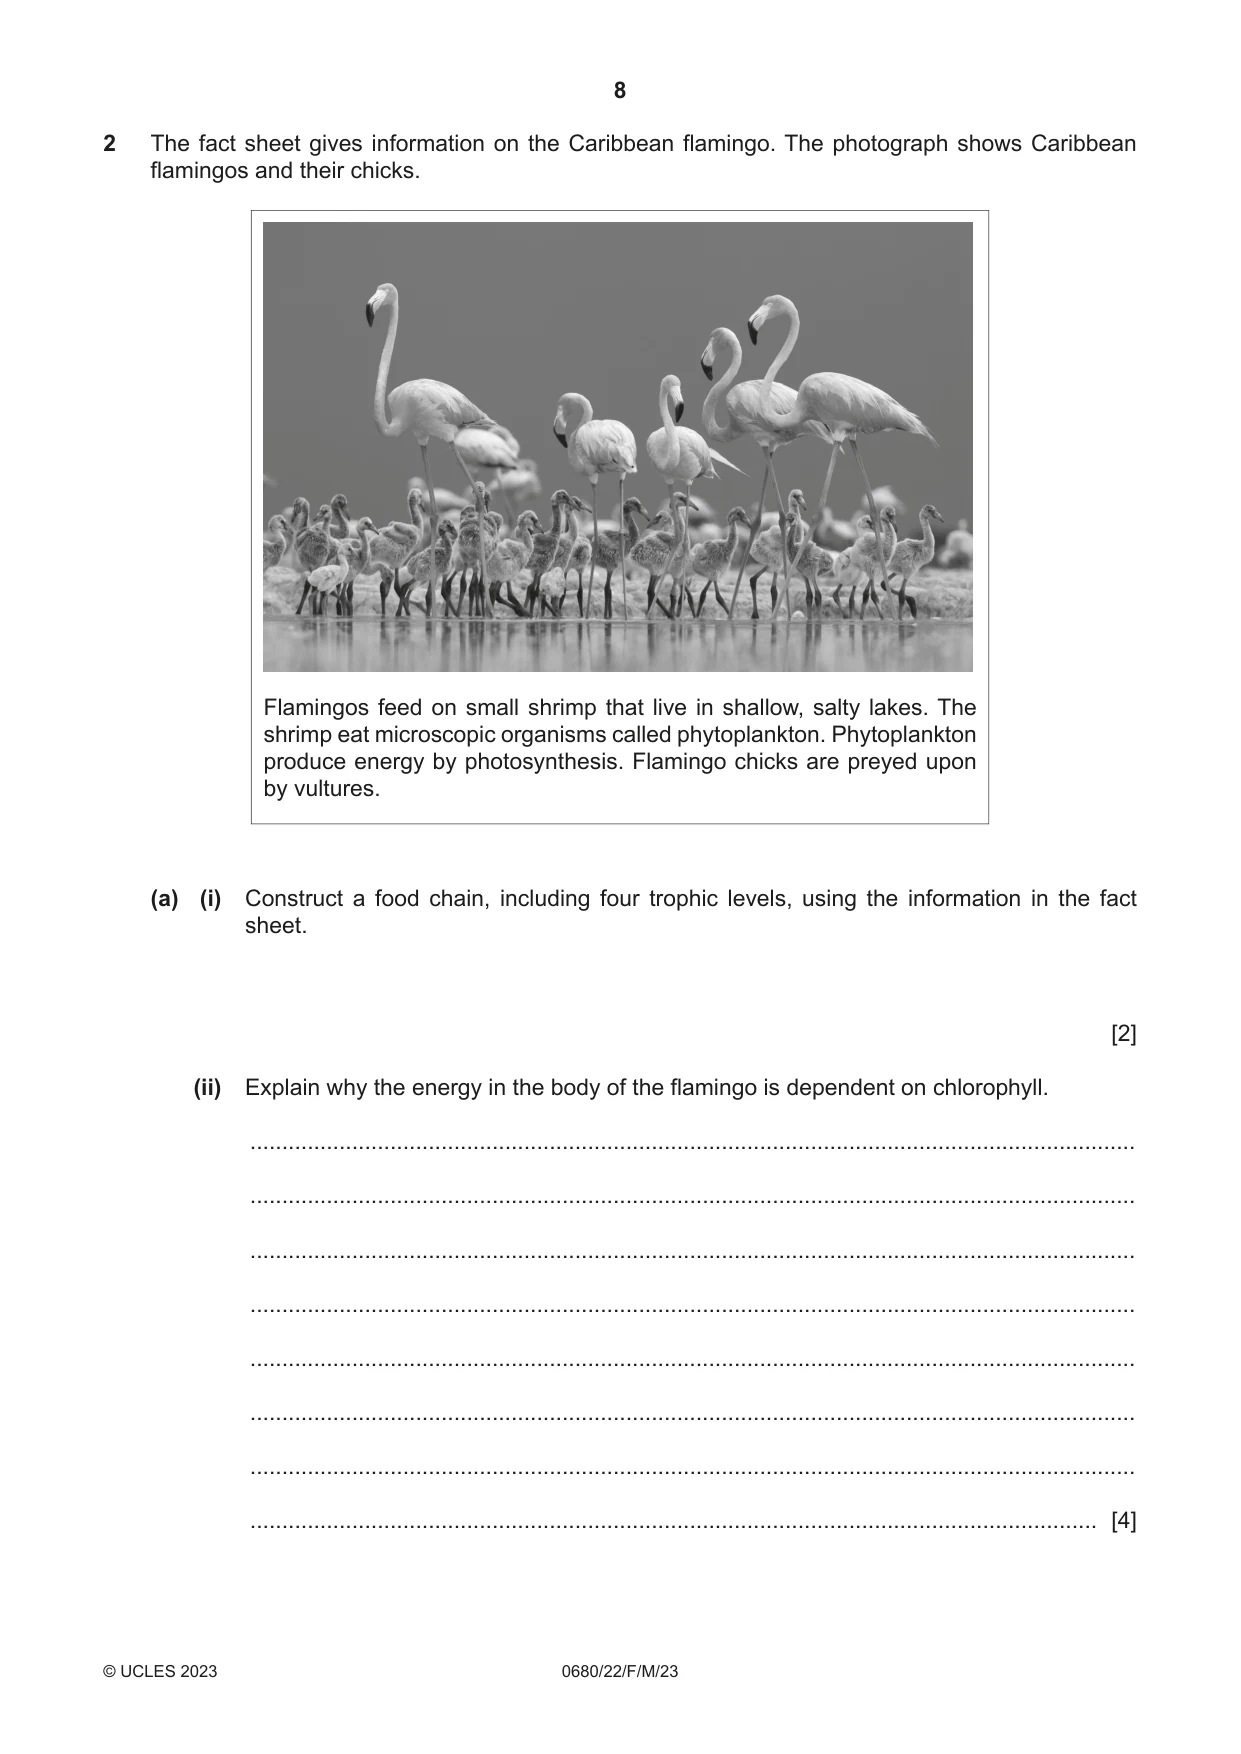
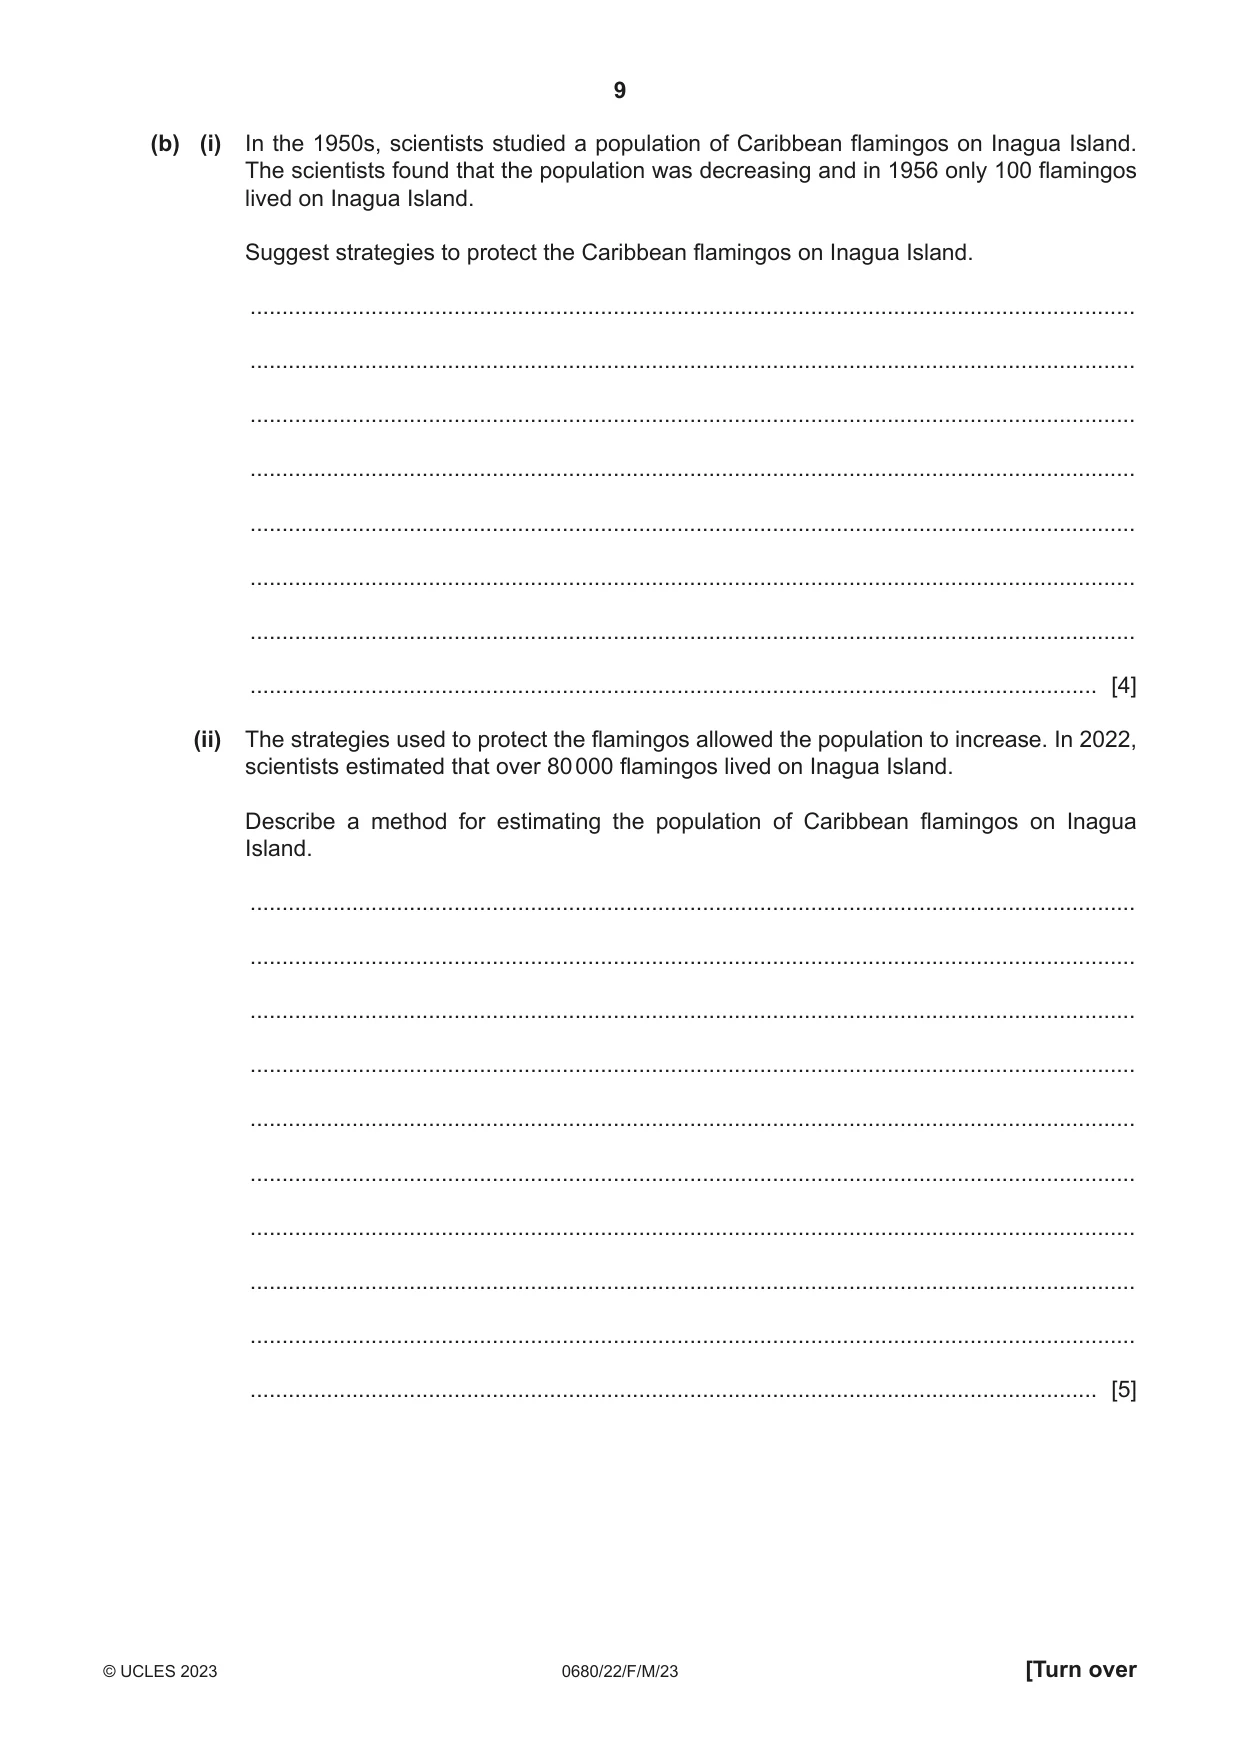
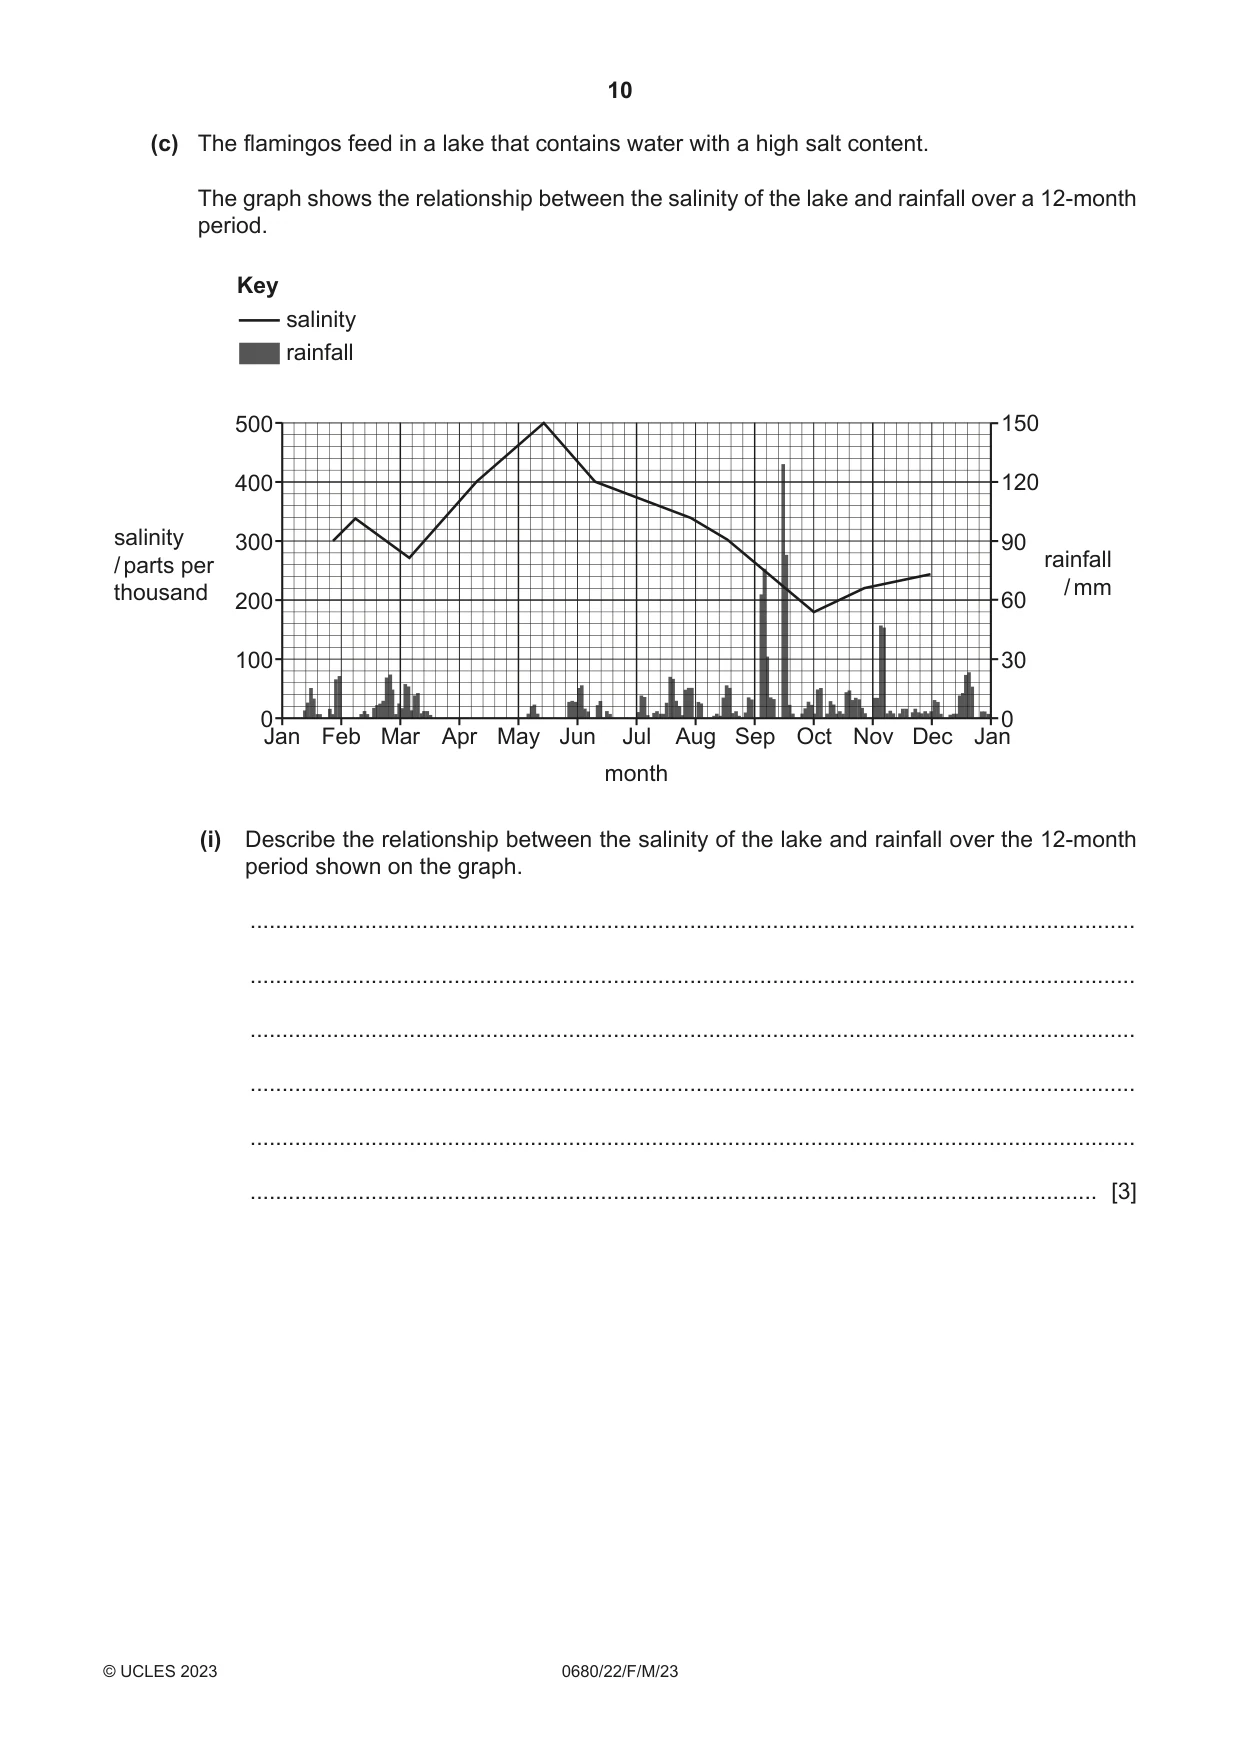
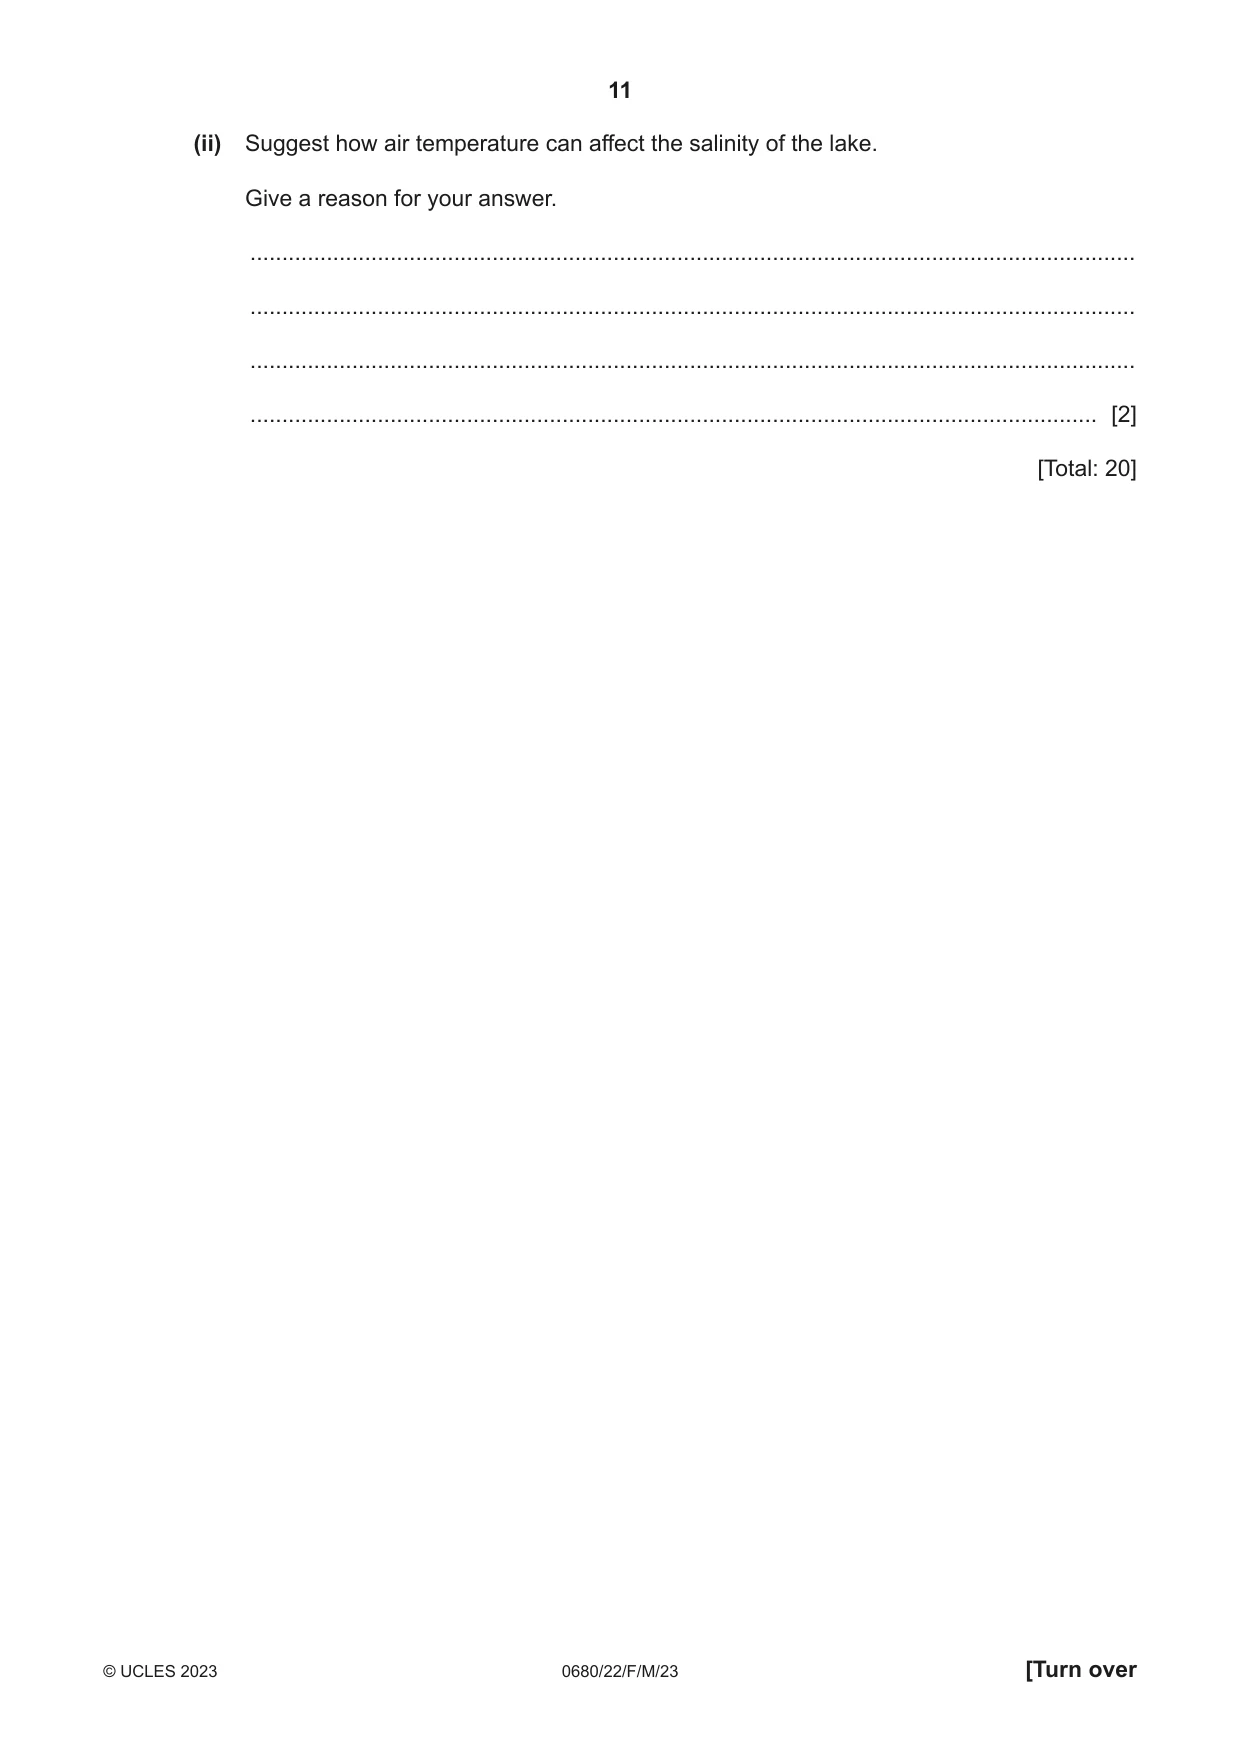
2 The fact sheet gives information on the Caribbean flamingo. The photograph shows Caribbean flamingos and their chicks. Flamingos feed on small shrimp that live in shallow, salty lakes. The shrimp eat microscopic organisms called phytoplankton. Phytoplankton produce energy by photosynthesis. Flamingo chicks are preyed upon by vultures. (a) (i) Construct a food chain, including four trophic levels, using the information in the fact sheet. [2] (ii) Explain why the energy in the body of the flamingo is dependent on chlorophyll. ........................................................................................................................................... ........................................................................................................................................... ........................................................................................................................................... ........................................................................................................................................... ........................................................................................................................................... ........................................................................................................................................... ........................................................................................................................................... ..................................................................................................................................... [4] (b) (i) In the 1950s, scientists studied a population of Caribbean flamingos on Inagua Island. The scientists found that the population was decreasing and in 1956 only 100 flamingos lived on Inagua Island. Suggest strategies to protect the Caribbean flamingos on Inagua Island. ........................................................................................................................................... ........................................................................................................................................... ........................................................................................................................................... ........................................................................................................................................... ........................................................................................................................................... ........................................................................................................................................... ........................................................................................................................................... ..................................................................................................................................... [4] (ii) The strategies used to protect the flamingos allowed the population to increase. In 2022, scientists estimated that over 80 000 flamingos lived on Inagua Island. Describe a method for estimating the population of Caribbean flamingos on Inagua Island. ........................................................................................................................................... ........................................................................................................................................... ........................................................................................................................................... ........................................................................................................................................... ........................................................................................................................................... ........................................................................................................................................... ........................................................................................................................................... ........................................................................................................................................... ........................................................................................................................................... ..................................................................................................................................... [5] (c) The flamingos feed in a lake that contains water with a high salt content. The graph shows the relationship between the salinity of the lake and rainfall over a 12-month period. Key salinity rainfall 500 150 400 120 salinity 300 90 / parts per rainfall thousand / mm 200 60 100 30 0 0 Jan Feb Mar Apr May Jun Jul Aug Sep Oct Nov Dec Jan month (i) Describe the relationship between the salinity of the lake and rainfall over the 12-month period shown on the graph. ........................................................................................................................................... ........................................................................................................................................... ........................................................................................................................................... ........................................................................................................................................... ........................................................................................................................................... ..................................................................................................................................... [3] (ii) Suggest how air temperature can affect the salinity of the lake. Give a reason for your answer. ........................................................................................................................................... ........................................................................................................................................... ........................................................................................................................................... ..................................................................................................................................... [2] [Total: 20]
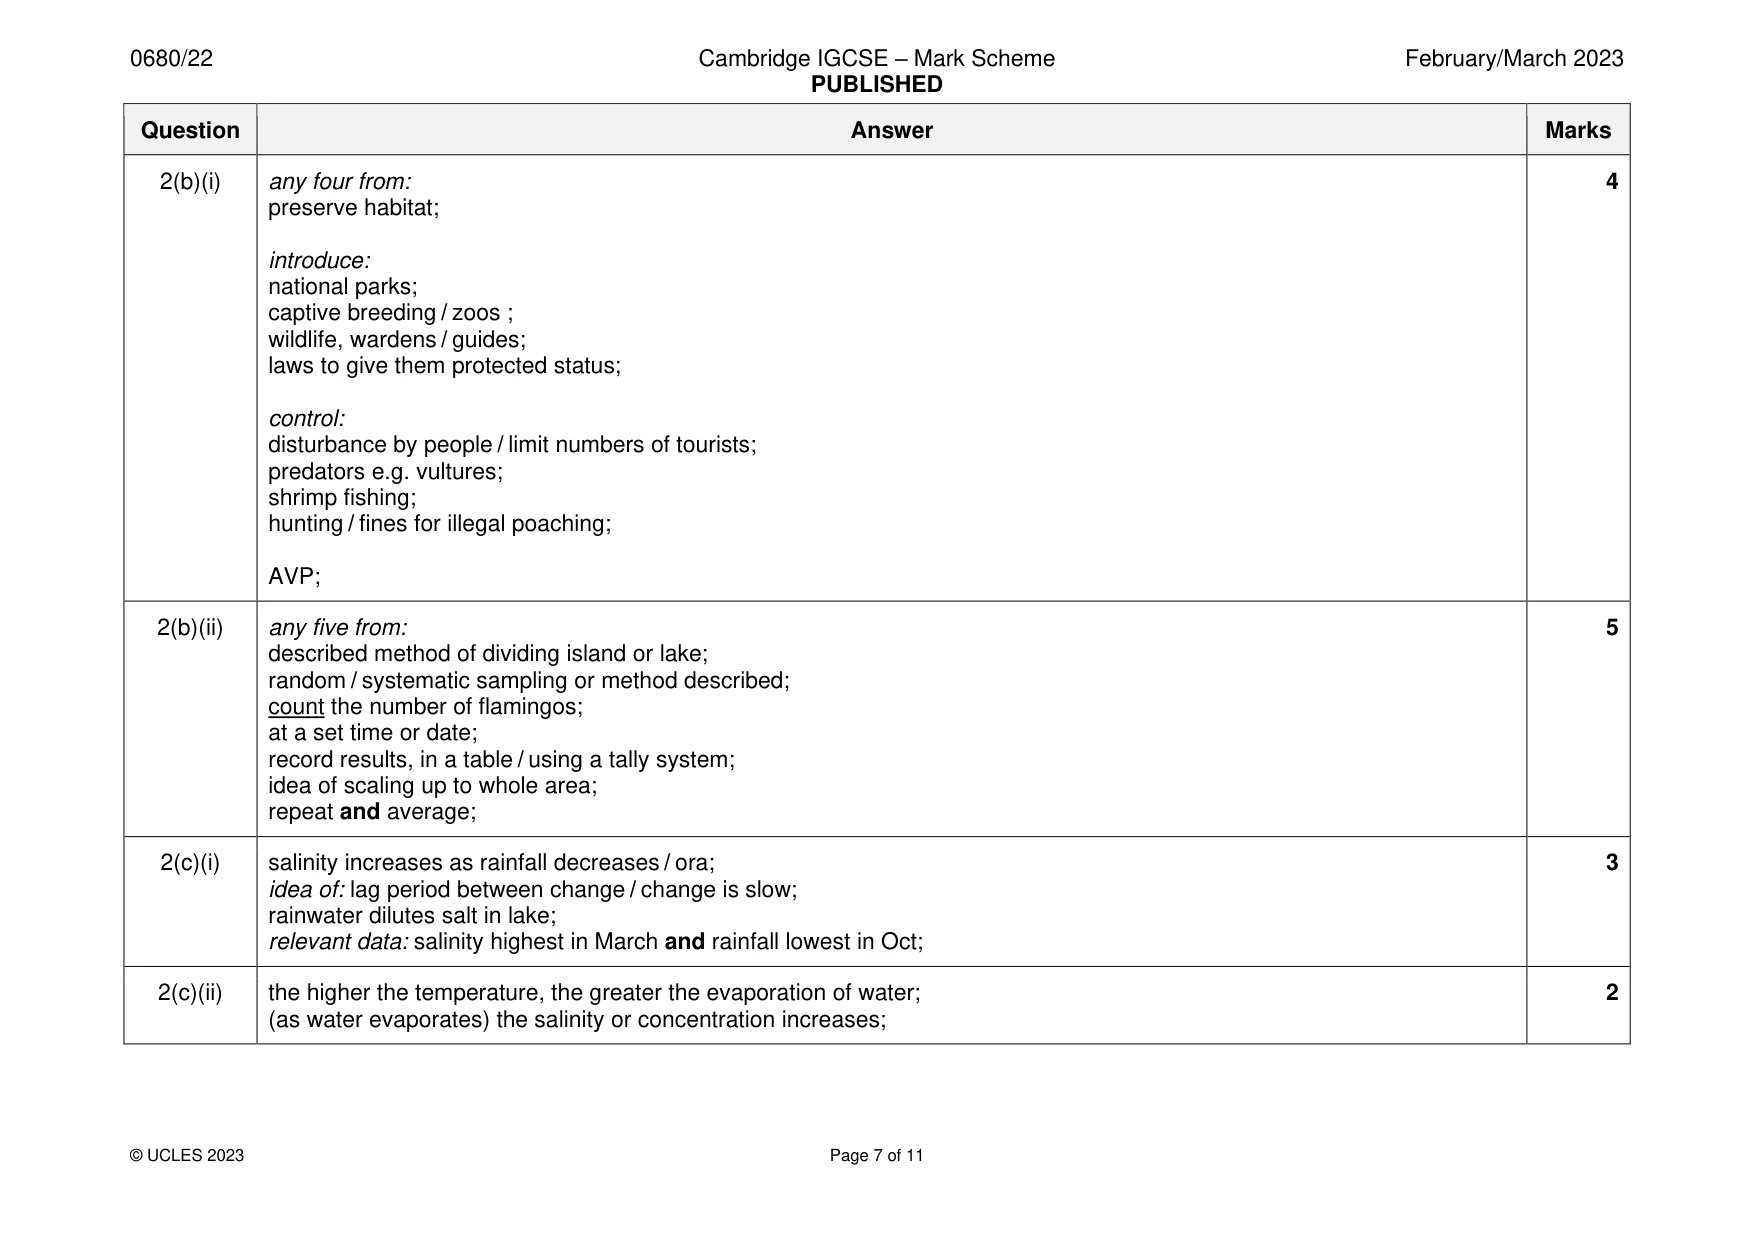
Mark scheme: 2(a)(i) phytoplankton → shrimp → flamingo → vulture 2 4 organisms in correct order; arrows in correct direction; 2(a)(ii) any four from: 4 (chlorophyll) in, producer / phytoplankton; needed for photosynthesis; uses carbon dioxide and water; uses (Sun) light (energy); to produce, glucose / sugar / (store) chemical energy; energy moves (along food chain); 2(b)(i) any four from: 4 preserve habitat; introduce: national parks; captive breeding / zoos ; wildlife, wardens / guides; laws to give them protected status; control: disturbance by people / limit numbers of tourists; predators e.g. vultures; shrimp fishing; hunting / fines for illegal poaching; AVP; 2(b)(ii) any five from: 5 described method of dividing island or lake; random / systematic sampling or method described; count the number of flamingos; at a set time or date; record results, in a table / using a tally system; idea of scaling up to whole area; repeat and average; 2(c)(i) salinity increases as rainfall decreases / ora; 3 idea of: lag period between change / change is slow; rainwater dilutes salt in lake; relevant data: salinity highest in March and rainfall lowest in Oct; 2(c)(ii) the higher the temperature, the greater the evaporation of water; 2 (as water evaporates) the salinity or concentration increases;
Q3 · The Bahamas processes large amounts of oil
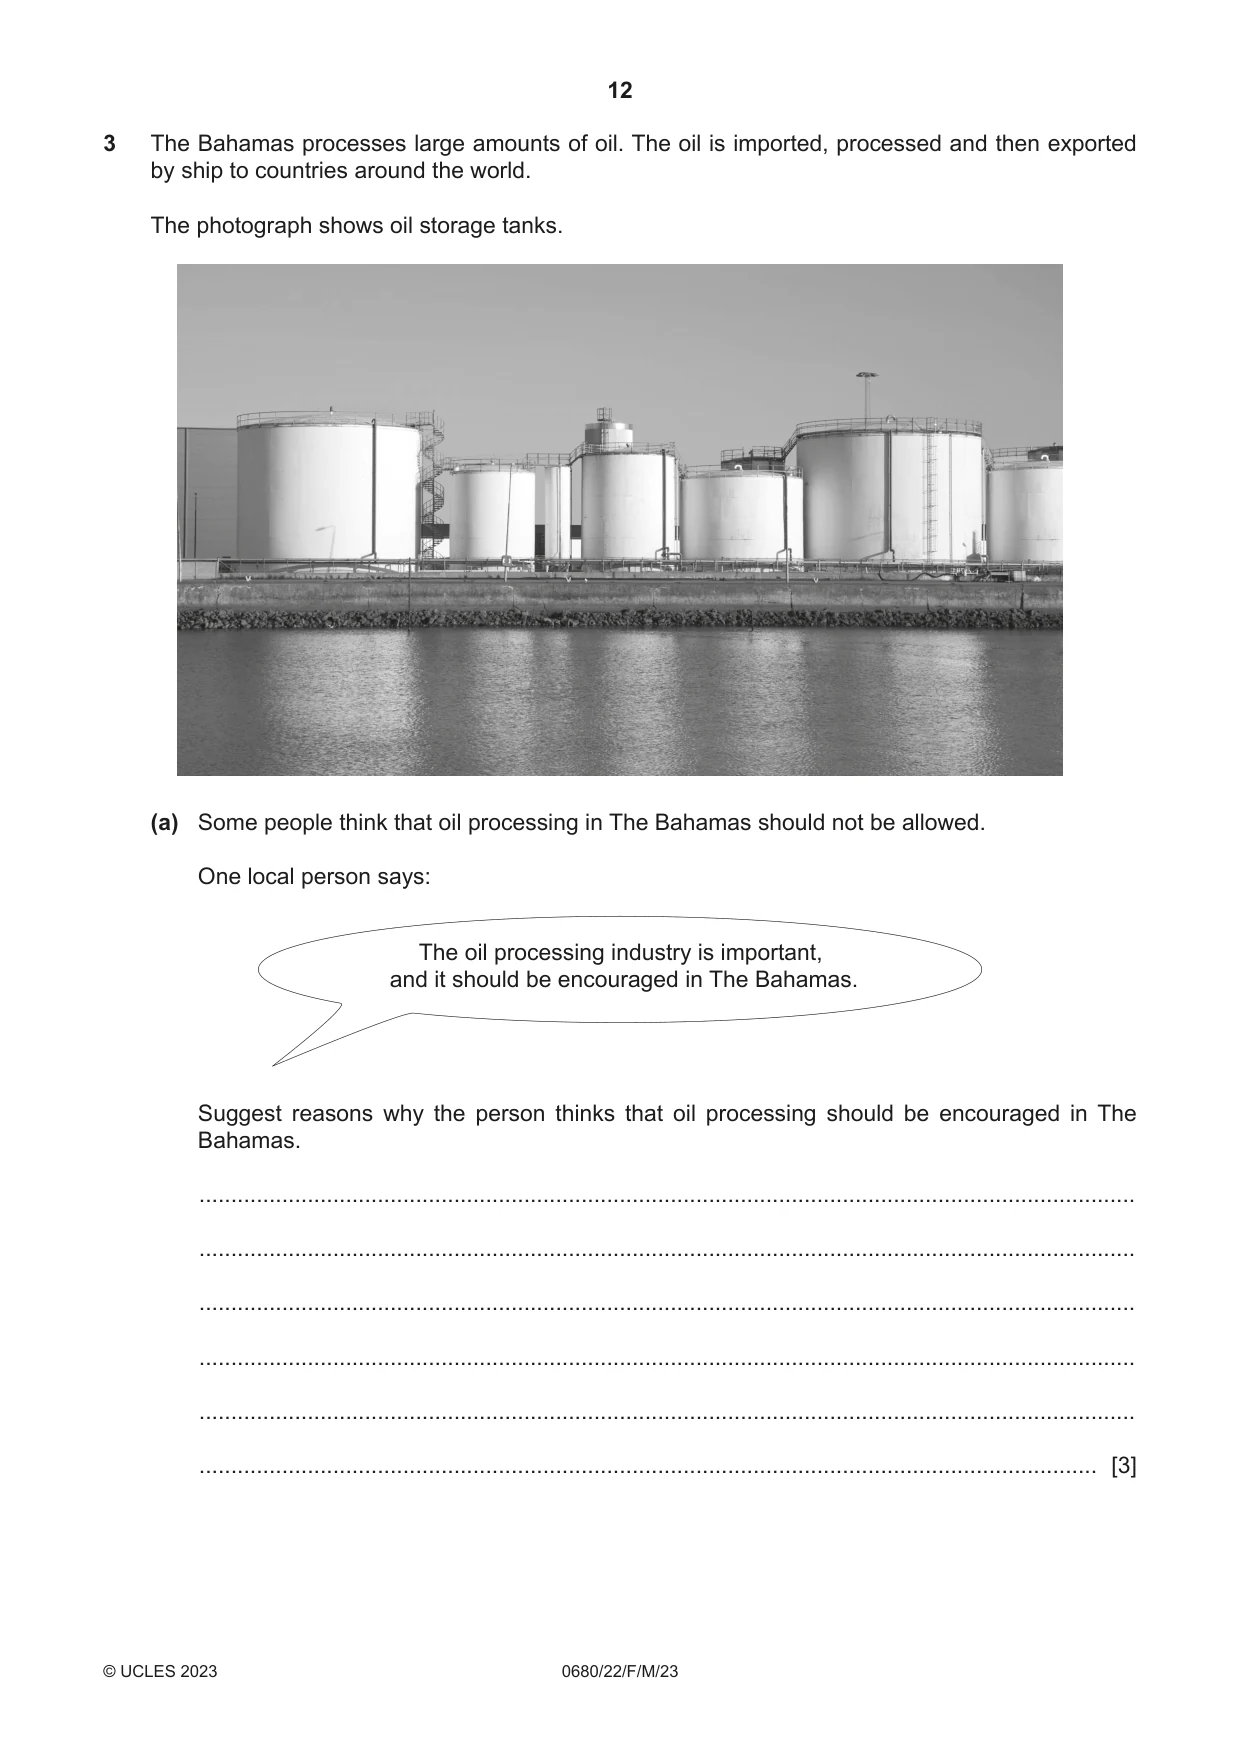
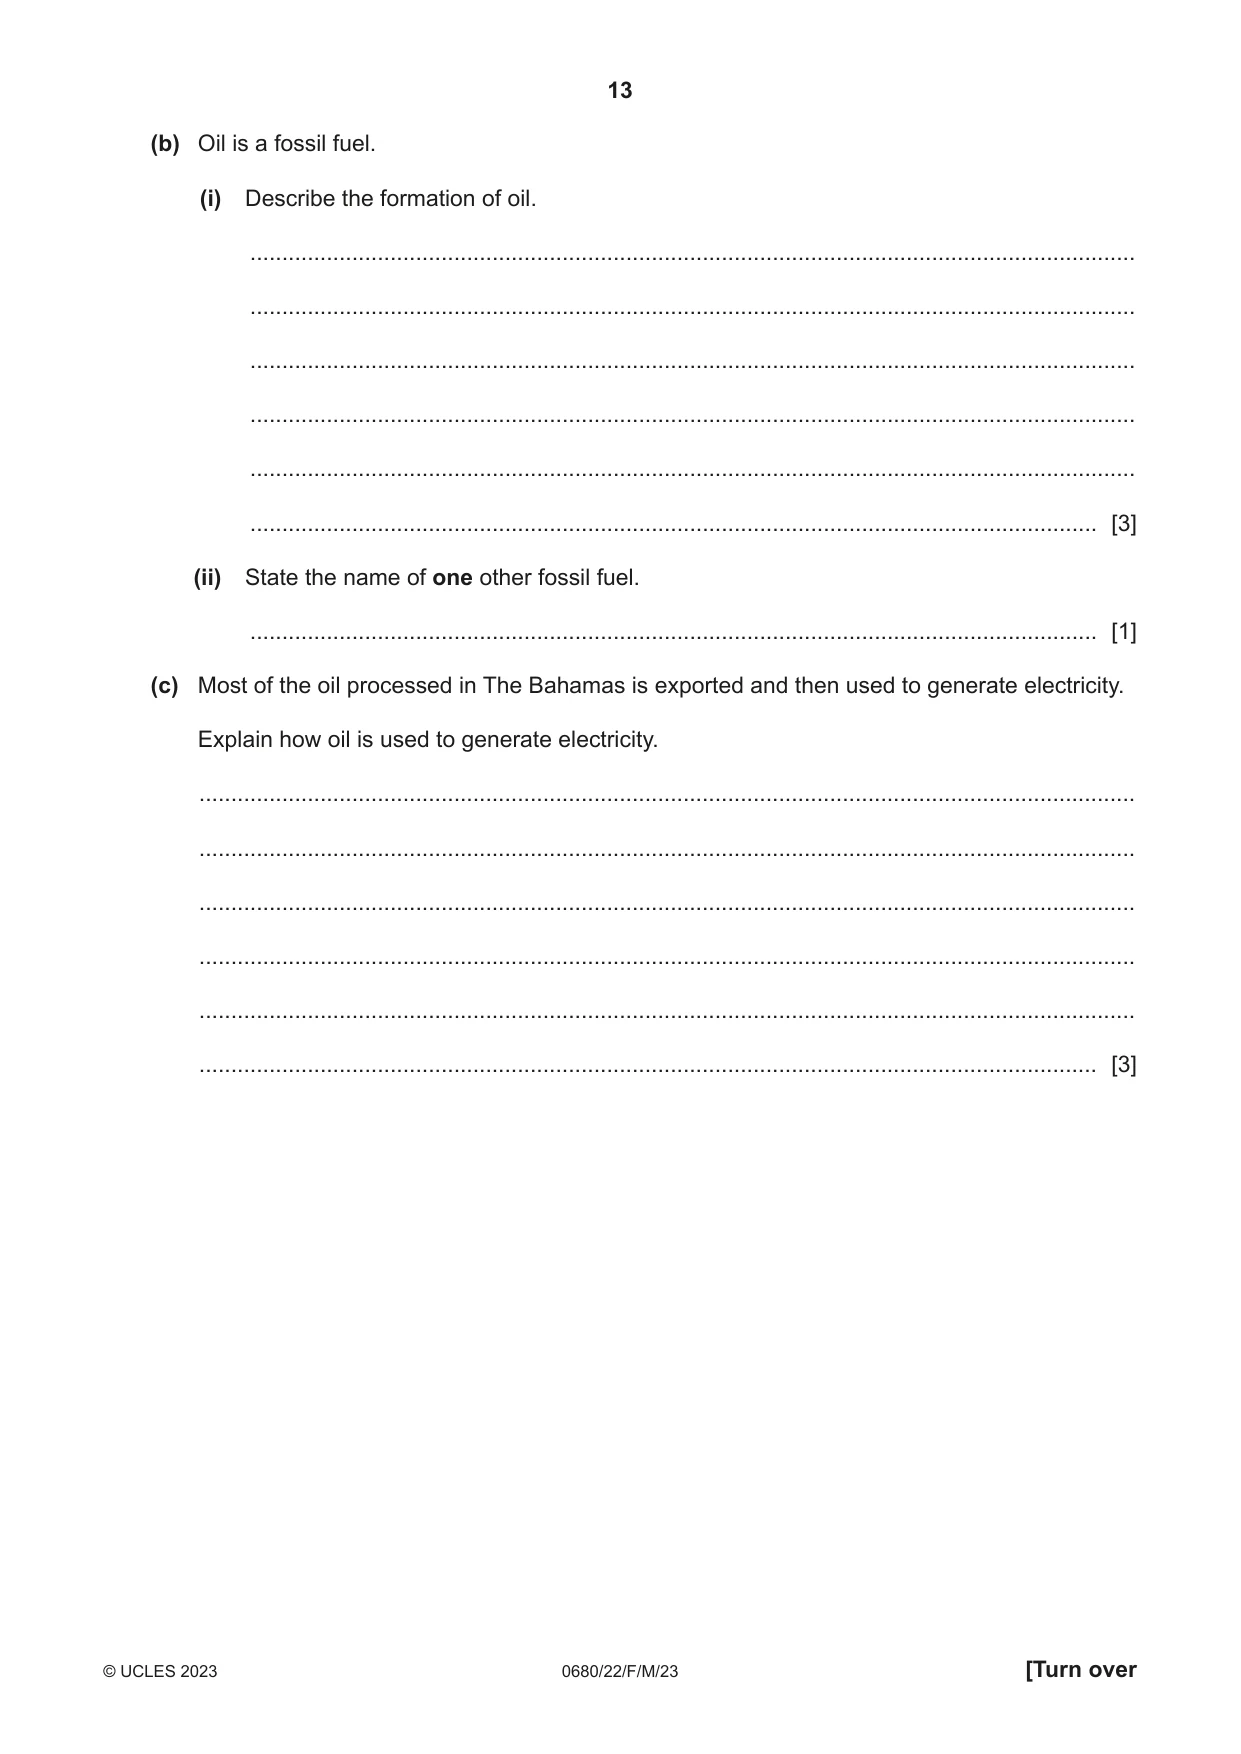
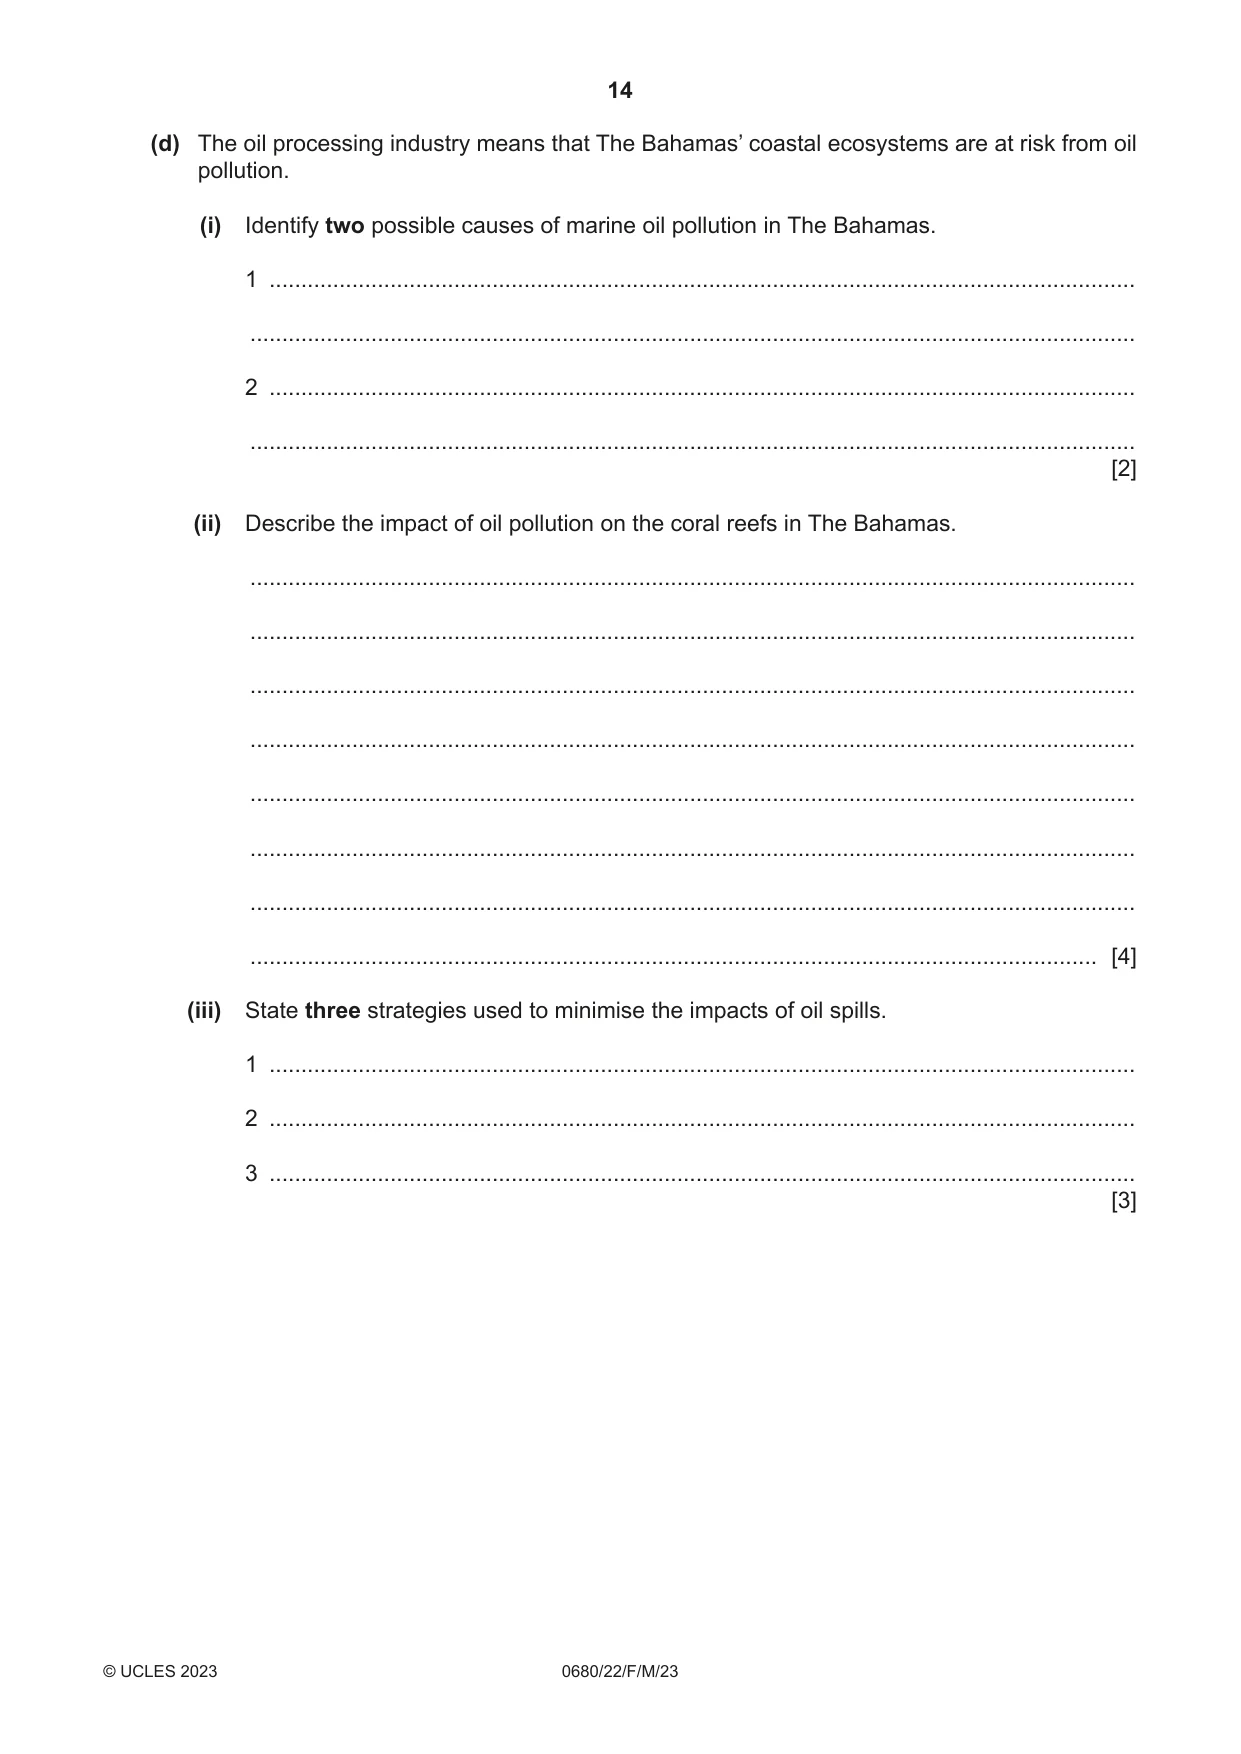
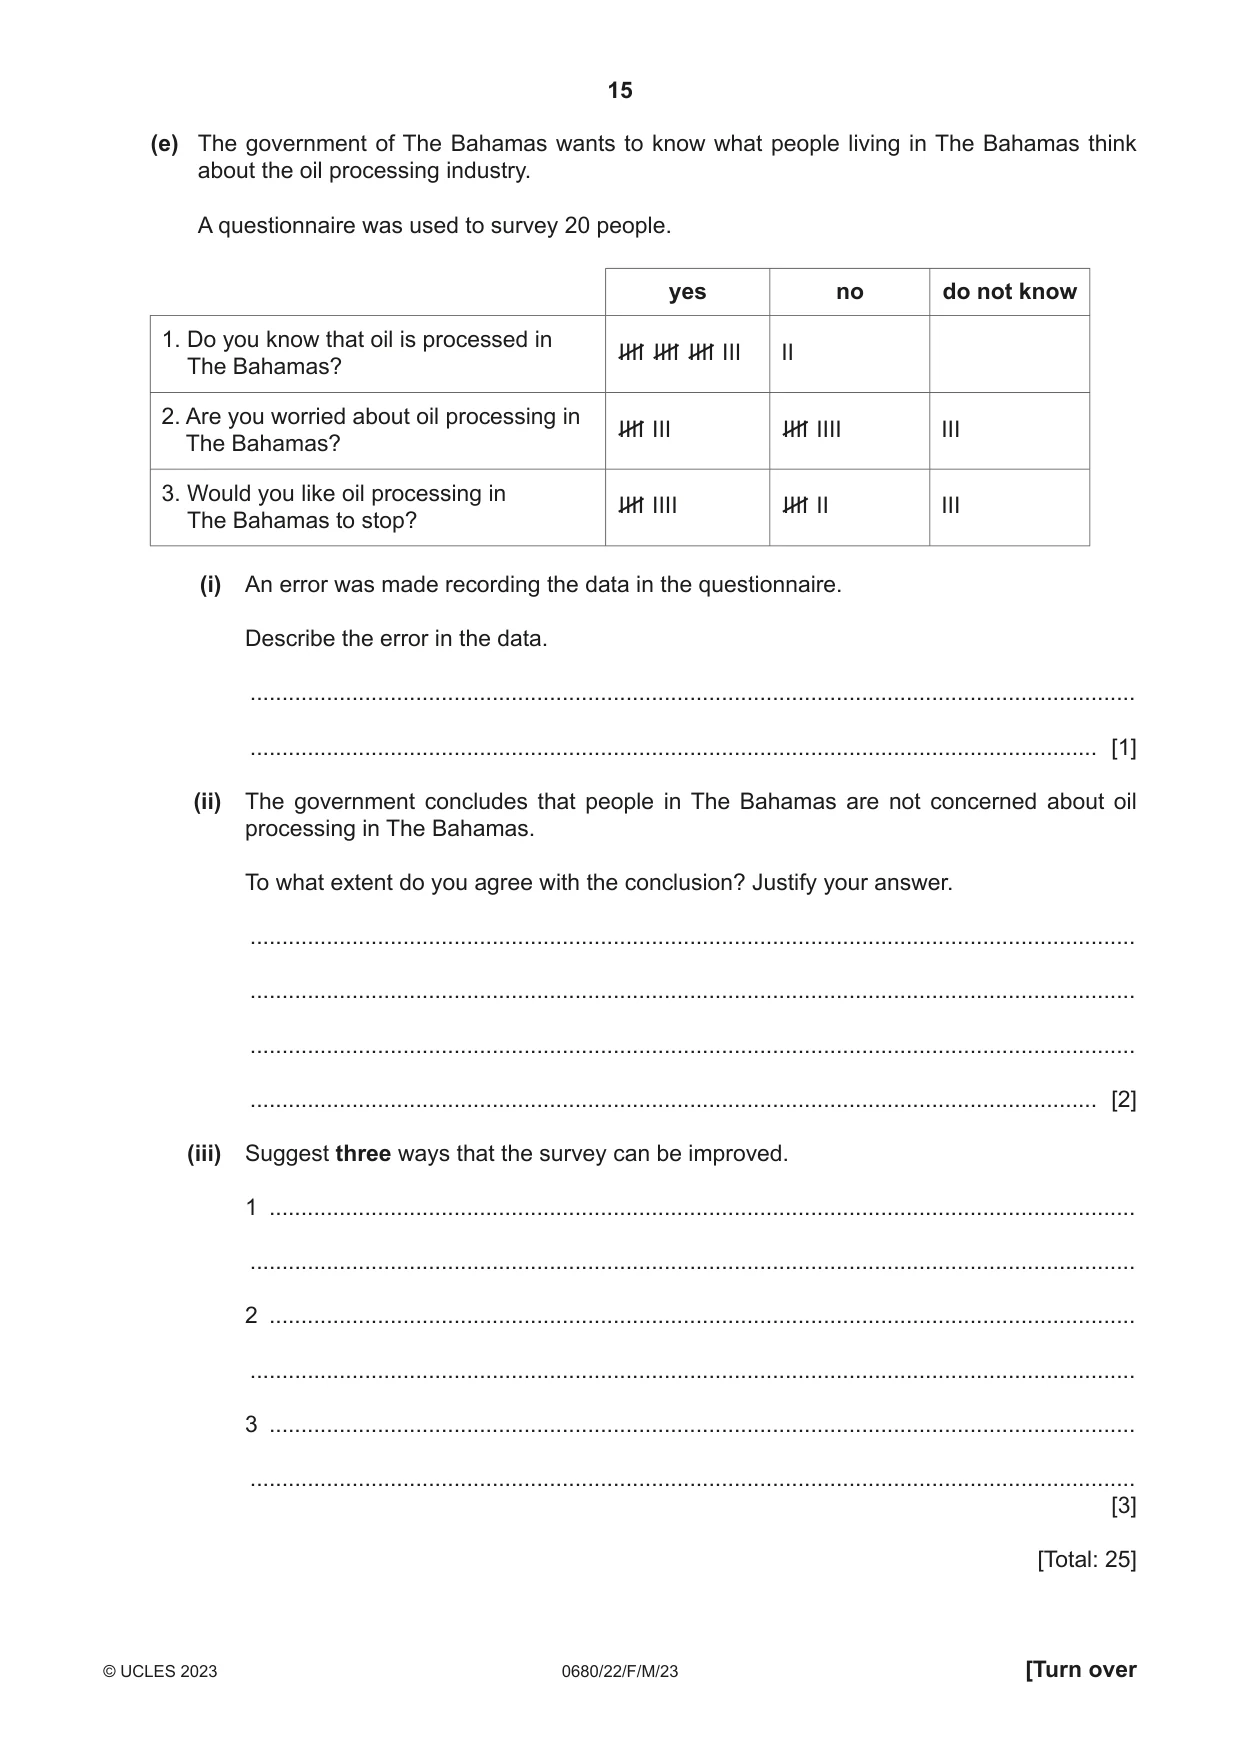
3 The Bahamas processes large amounts of oil. The oil is imported, processed and then exported by ship to countries around the world. The photograph shows oil storage tanks. (a) Some people think that oil processing in The Bahamas should not be allowed. One local person says: The oil processing industry is important, and it should be encouraged in The Bahamas. Suggest reasons why the person thinks that oil processing should be encouraged in The Bahamas. ................................................................................................................................................... ................................................................................................................................................... ................................................................................................................................................... ................................................................................................................................................... ................................................................................................................................................... ............................................................................................................................................. [3] (b) Oil is a fossil fuel. (i) Describe the formation of oil. ........................................................................................................................................... ........................................................................................................................................... ........................................................................................................................................... ........................................................................................................................................... ........................................................................................................................................... ..................................................................................................................................... [3] (ii) State the name of one other fossil fuel. ..................................................................................................................................... [1] (c) Most of the oil processed in The Bahamas is exported and then used to generate electricity. Explain how oil is used to generate electricity. ................................................................................................................................................... ................................................................................................................................................... ................................................................................................................................................... ................................................................................................................................................... ................................................................................................................................................... ............................................................................................................................................. [3] (d) The oil processing industry means that The Bahamas’ coastal ecosystems are at risk from oil pollution. (i) Identify two possible causes of marine oil pollution in The Bahamas. 1 ........................................................................................................................................ ........................................................................................................................................... 2 ........................................................................................................................................ ........................................................................................................................................... [2] (ii) Describe the impact of oil pollution on the coral reefs in The Bahamas. ........................................................................................................................................... ........................................................................................................................................... ........................................................................................................................................... ........................................................................................................................................... ........................................................................................................................................... ........................................................................................................................................... ........................................................................................................................................... ..................................................................................................................................... [4] (iii) State three strategies used to minimise the impacts of oil spills. 1 ........................................................................................................................................ 2 ........................................................................................................................................ 3 ........................................................................................................................................ [3] (e) The government of The Bahamas wants to know what people living in The Bahamas think about the oil processing industry. A questionnaire was used to survey 20 people. yes no do not know 1. Do you know that oil is processed in IIII IIII IIII III II The Bahamas? 2. Are you worried about oil processing in IIII III IIII IIII III The Bahamas? 3. Would you like oil processing in IIII IIII IIII II III The Bahamas to stop? (i) An error was made recording the data in the questionnaire. Describe the error in the data. ........................................................................................................................................... ..................................................................................................................................... [1] (ii) The government concludes that people in The Bahamas are not concerned about oil processing in The Bahamas. To what extent do you agree with the conclusion? Justify your answer. ........................................................................................................................................... ........................................................................................................................................... ........................................................................................................................................... ..................................................................................................................................... [2] (iii) Suggest three ways that the survey can be improved. 1 ........................................................................................................................................ ........................................................................................................................................... 2 ........................................................................................................................................ ........................................................................................................................................... 3 ........................................................................................................................................ ........................................................................................................................................... [3] [Total: 25]
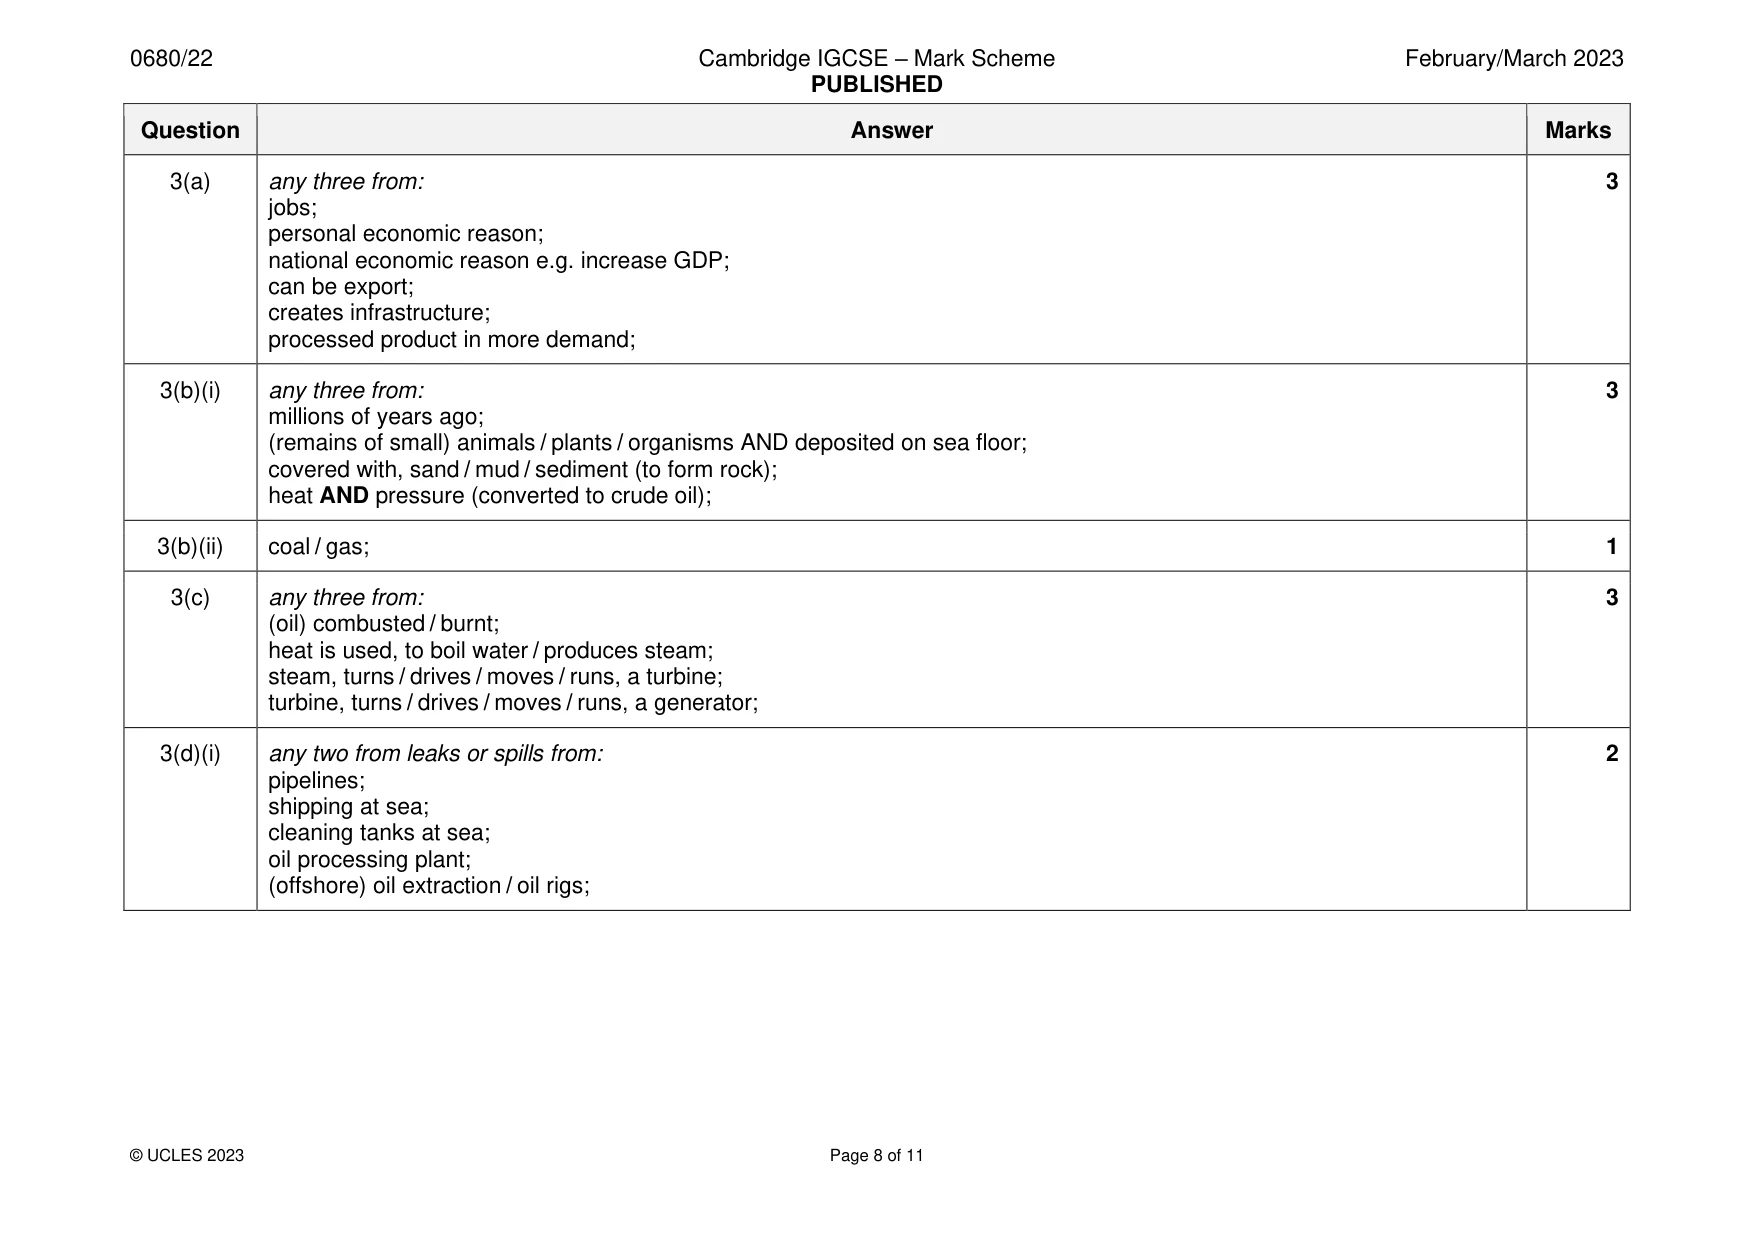
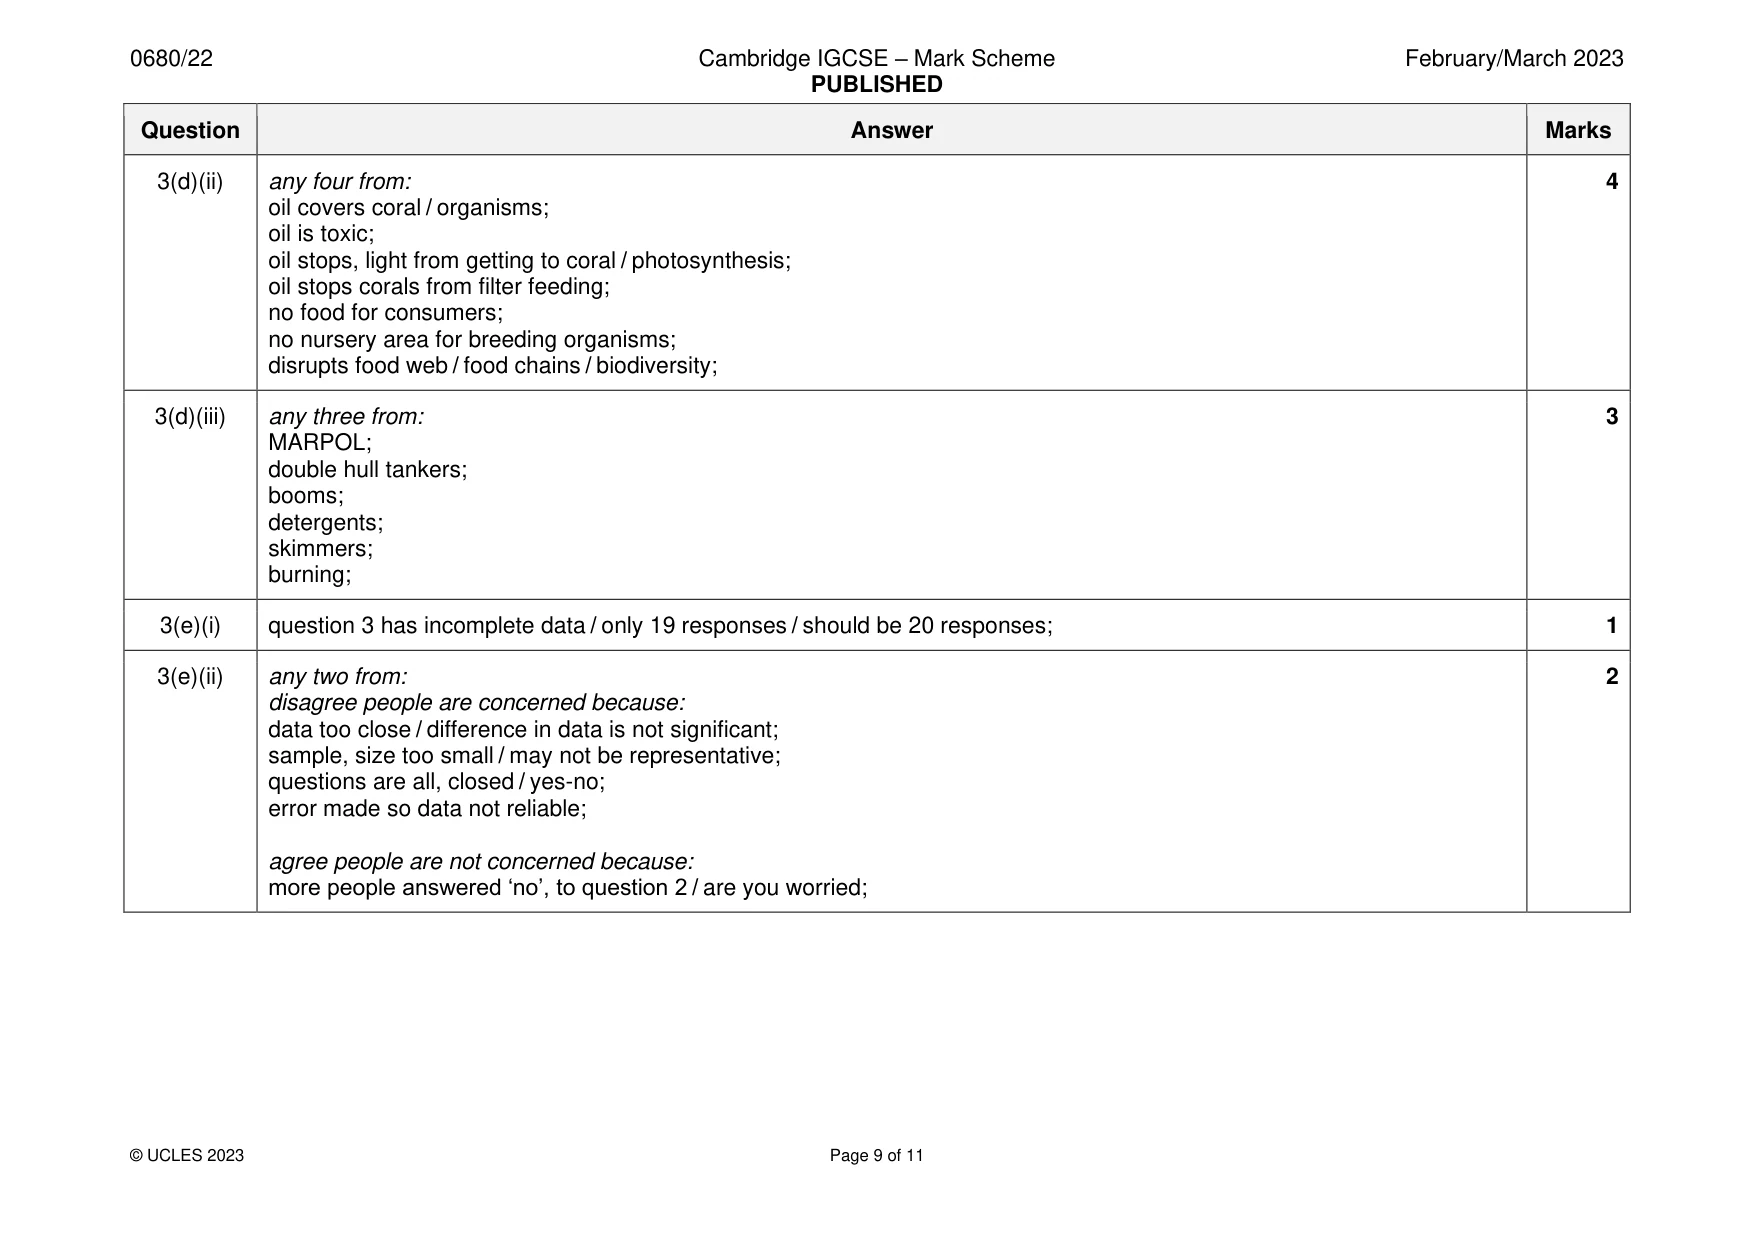
Mark scheme: 3(a) any three from: 3 jobs; personal economic reason; national economic reason e.g. increase GDP; can be export; creates infrastructure; processed product in more demand; 3(b)(i) any three from: 3 millions of years ago; (remains of small) animals / plants / organisms AND deposited on sea floor; covered with, sand / mud / sediment (to form rock); heat AND pressure (converted to crude oil); 3(b)(ii) coal / gas; 1 3(c) any three from: 3 (oil) combusted / burnt; heat is used, to boil water / produces steam; steam, turns / drives / moves / runs, a turbine; turbine, turns / drives / moves / runs, a generator; 3(d)(i) any two from leaks or spills from: 2 pipelines; shipping at sea; cleaning tanks at sea; oil processing plant; (offshore) oil extraction / oil rigs; 3(d)(ii) any four from: 4 oil covers coral / organisms; oil is toxic; oil stops, light from getting to coral / photosynthesis; oil stops corals from filter feeding; no food for consumers; no nursery area for breeding organisms; disrupts food web / food chains / biodiversity; 3(d)(iii) any three from: 3 MARPOL; double hull tankers; booms; detergents; skimmers; burning; 3(e)(i) question 3 has incomplete data / only 19 responses / should be 20 responses; 1 3(e)(ii) any two from: 2 disagree people are concerned because: data too close / difference in data is not significant; sample, size too small / may not be representative; questions are all, closed / yes-no; error made so data not reliable; agree people are not concerned because: more people answered ‘no’, to question 2 / are you worried; 3(e)(iii) any three from: 3 more questions; ask open questions; larger sample size / ask more people / make sample more representative; ensure participants are residents / make sure tourists are not surveyed; survey equal numbers of, different age groups / males and females; repeat on different days; repeat in different locations;
Q4 · The photograph shows a Caribbean spiny lobster
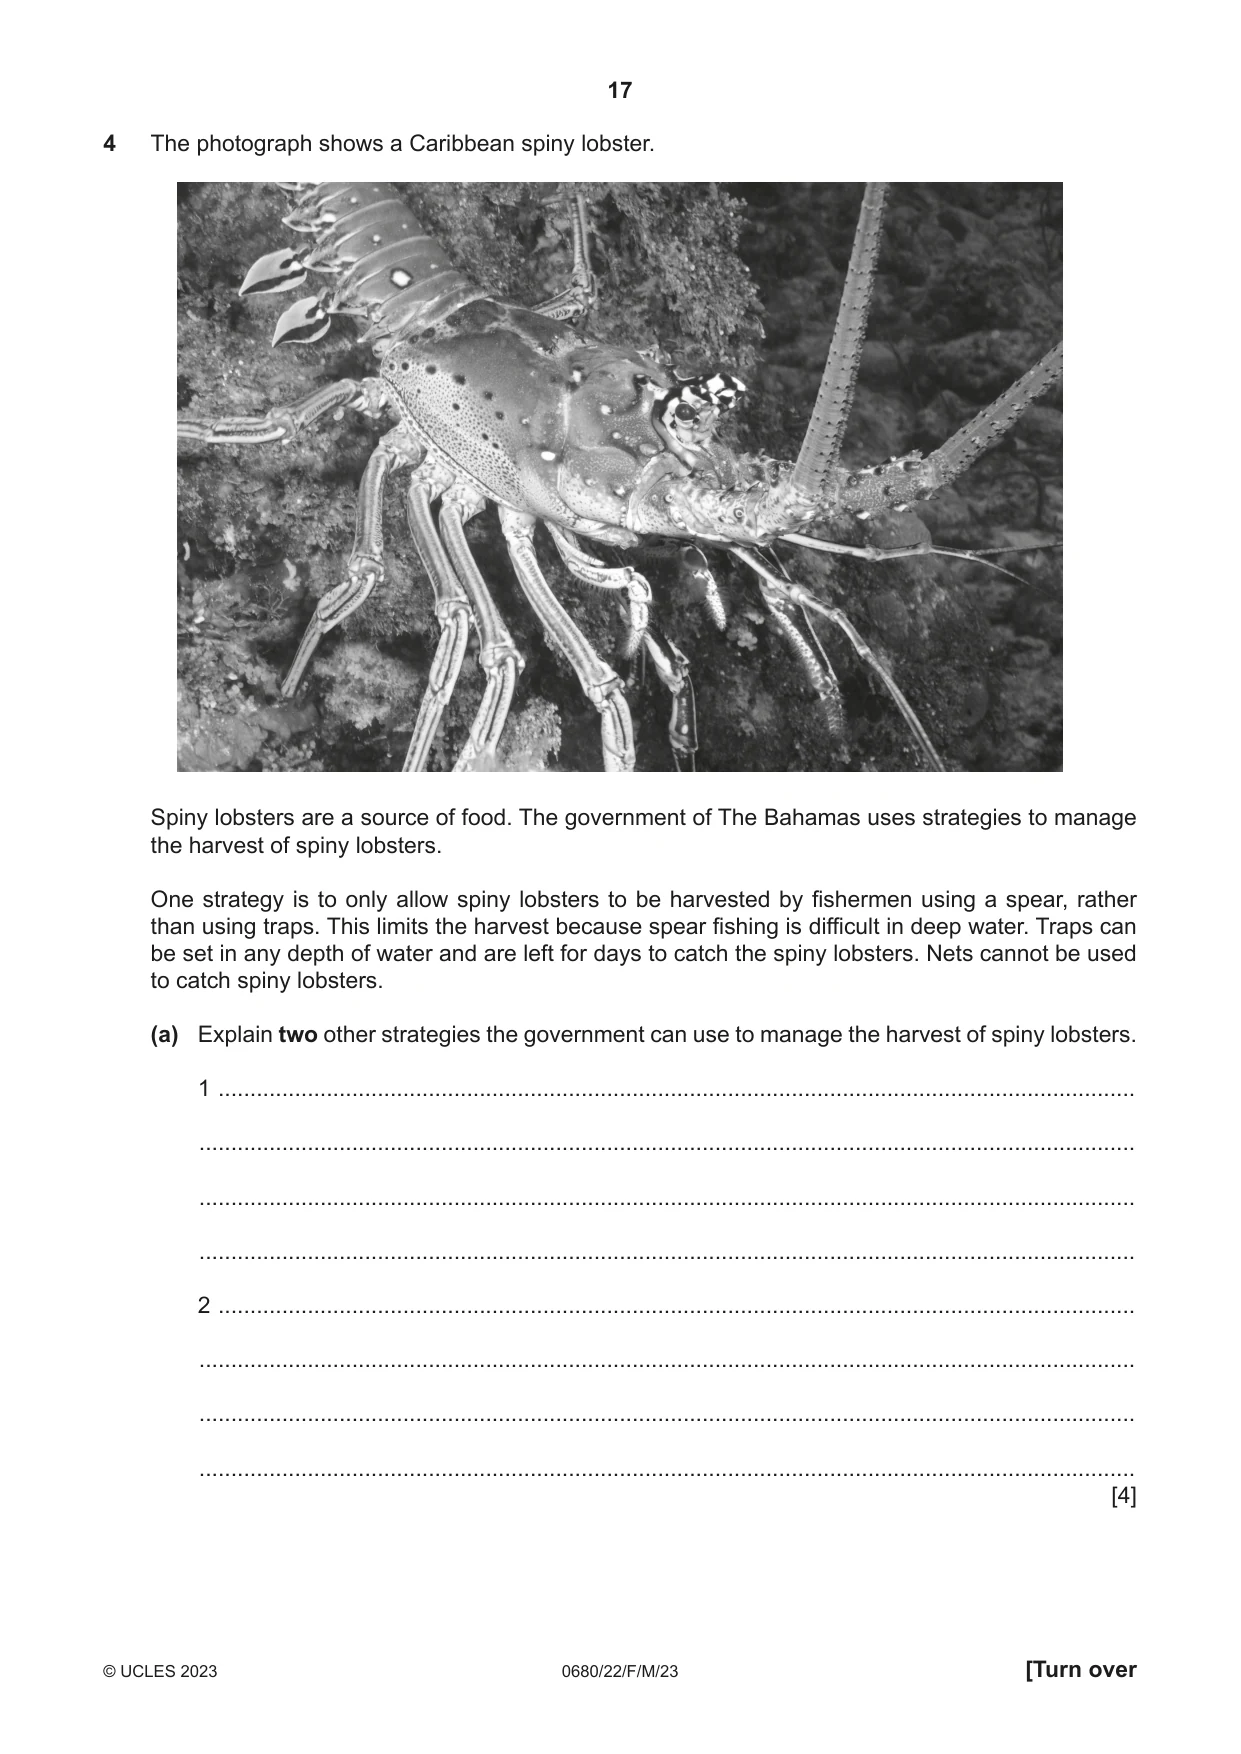
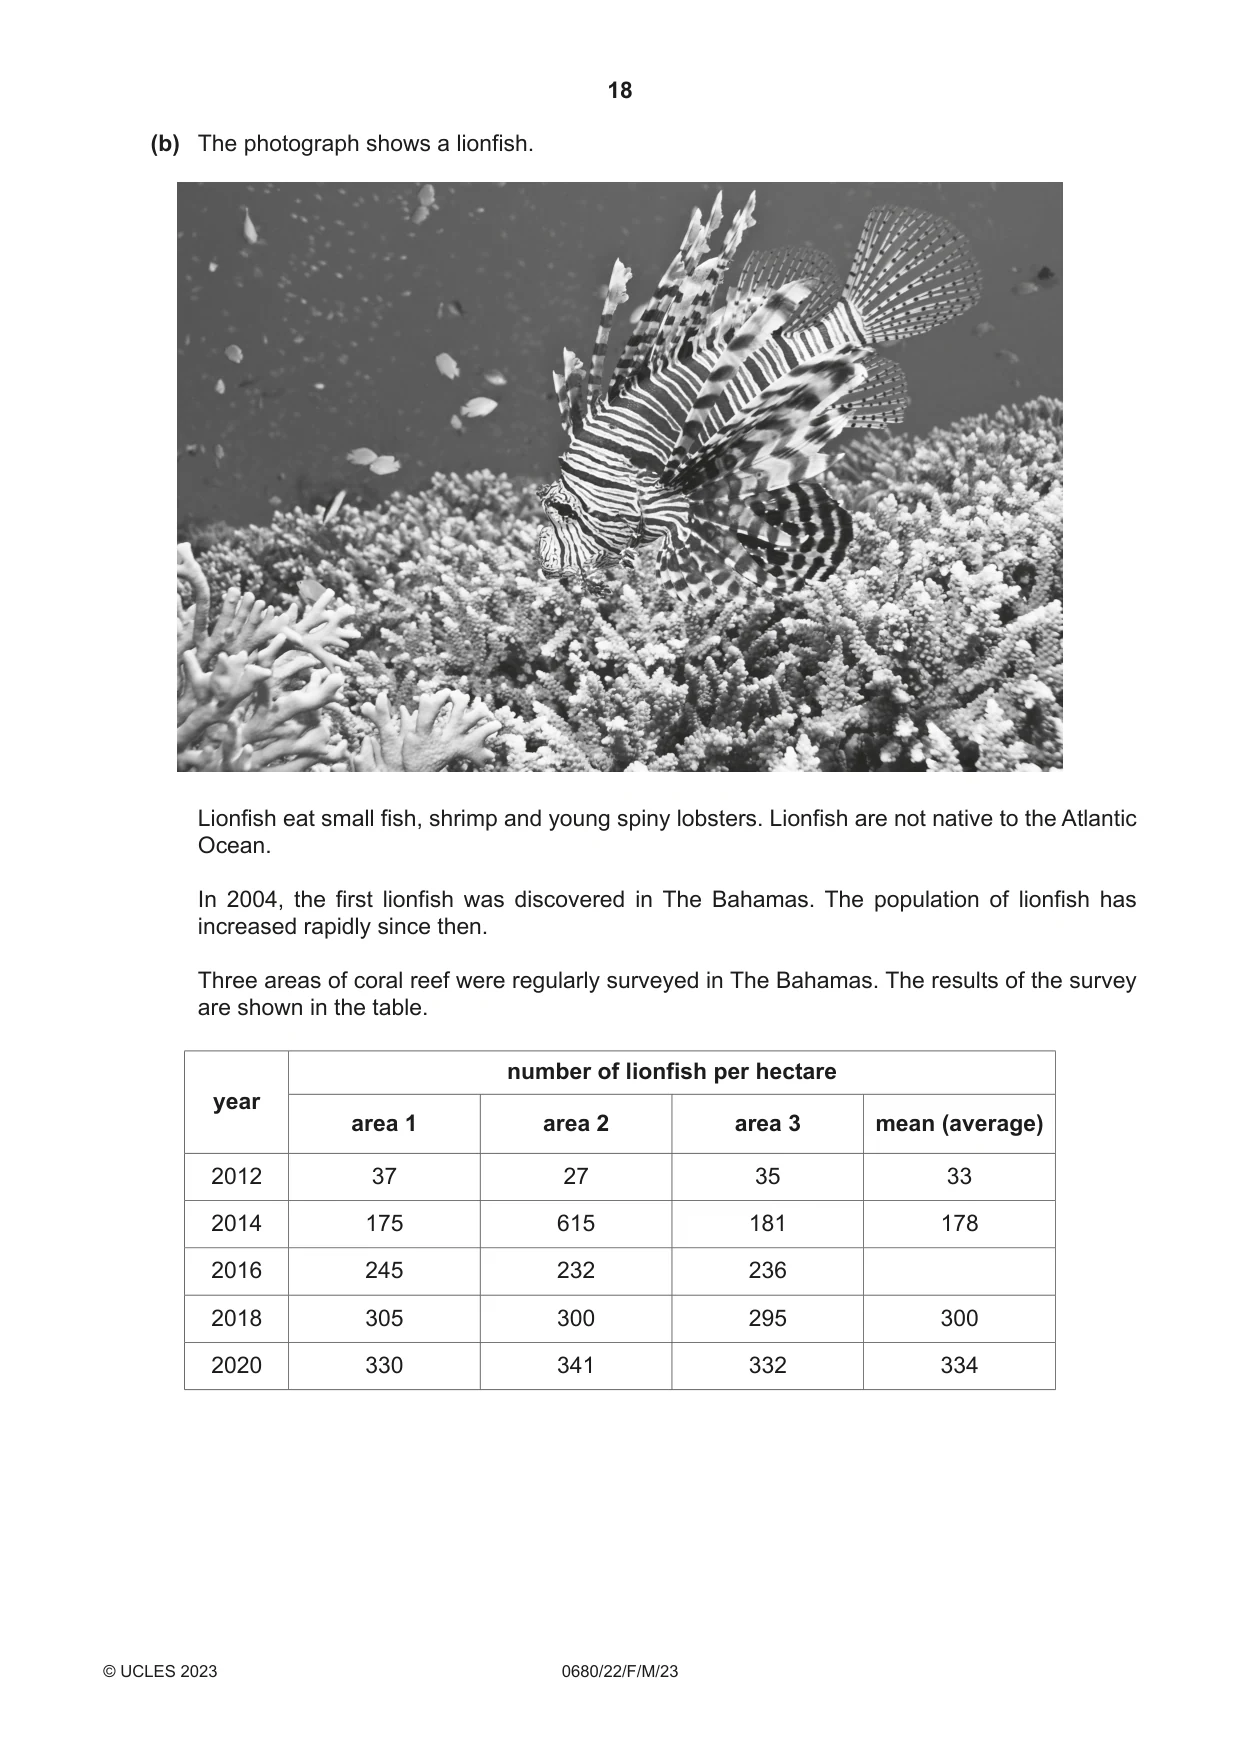
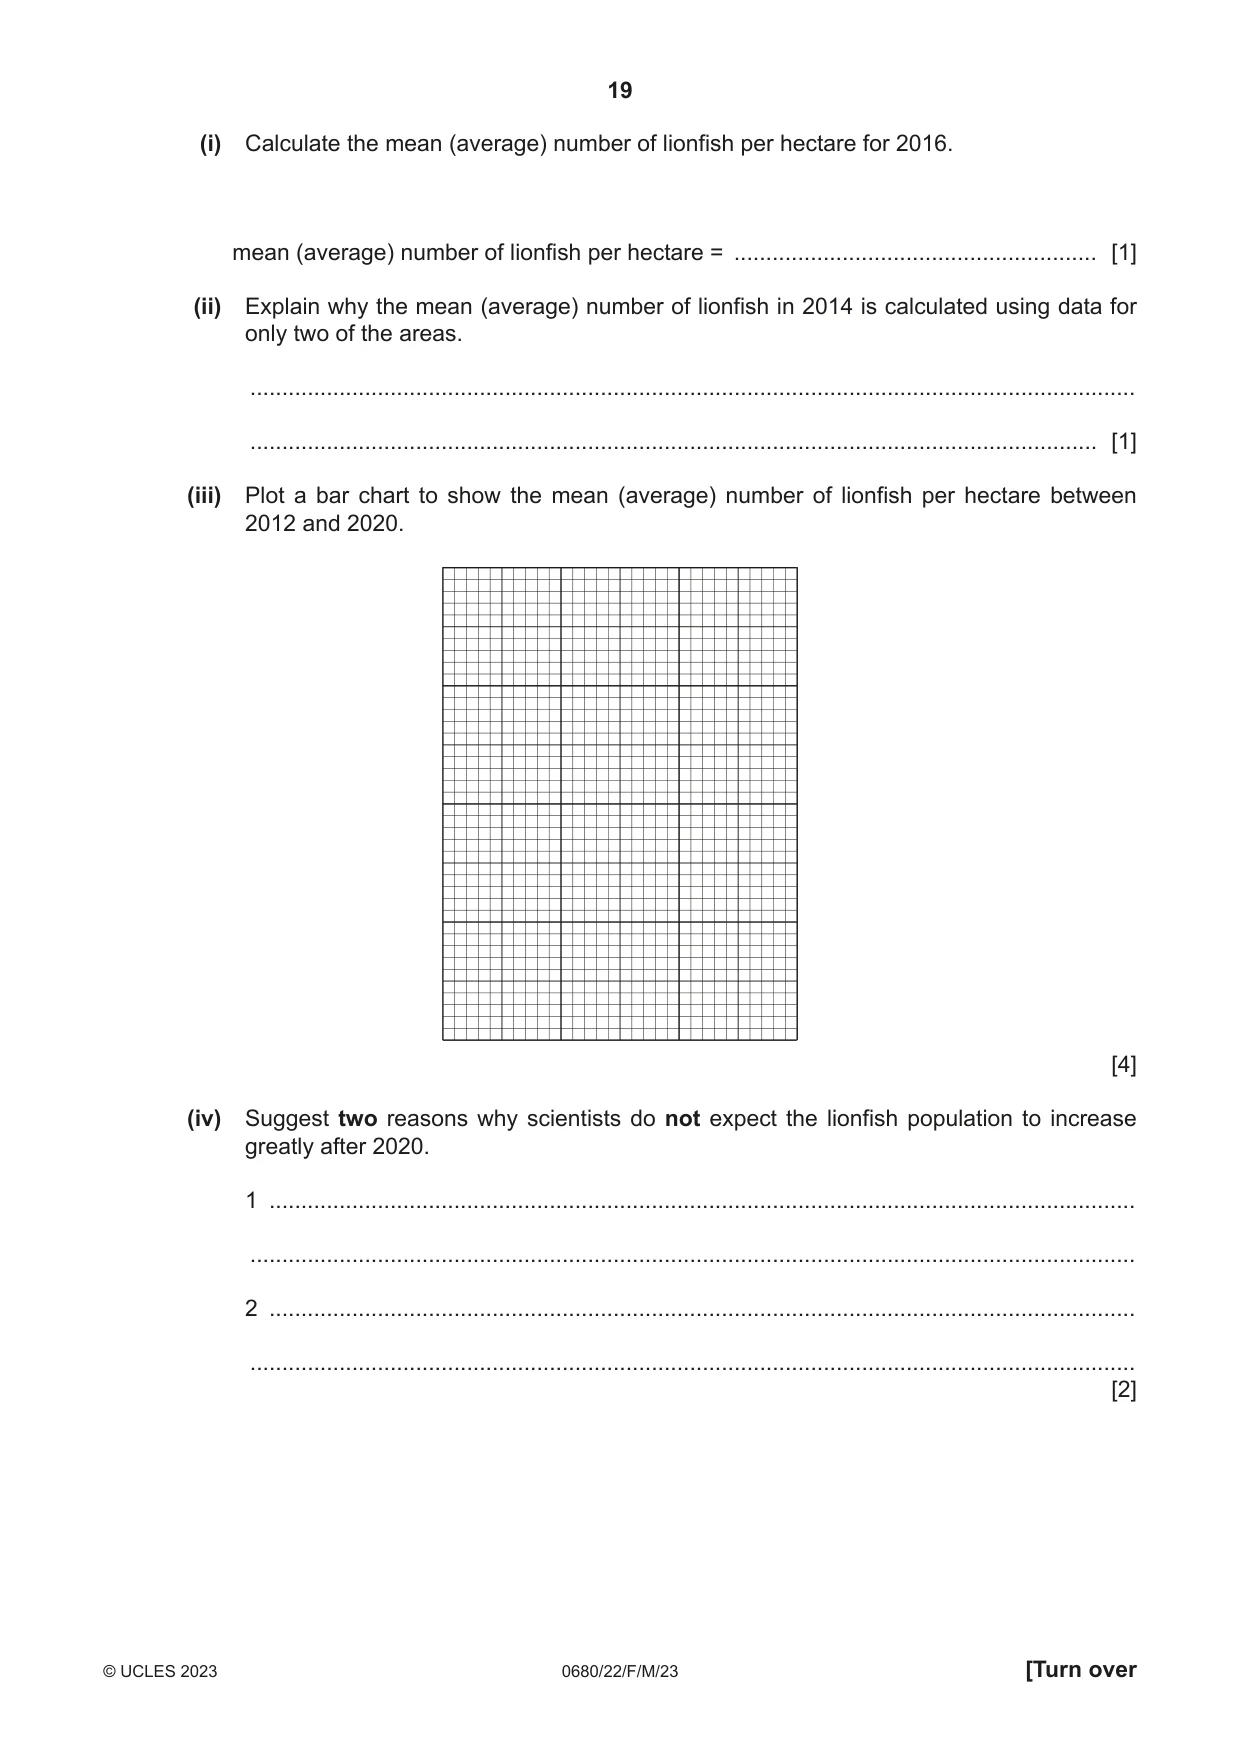
4 The photograph shows a Caribbean spiny lobster. Spiny lobsters are a source of food. The government of The Bahamas uses strategies to manage the harvest of spiny lobsters. One strategy is to only allow spiny lobsters to be harvested by fishermen using a spear, rather than using traps. This limits the harvest because spear fishing is difficult in deep water. Traps can be set in any depth of water and are left for days to catch the spiny lobsters. Nets cannot be used to catch spiny lobsters. (a) Explain two other strategies the government can use to manage the harvest of spiny lobsters. 1 ................................................................................................................................................ ................................................................................................................................................... ................................................................................................................................................... ................................................................................................................................................... 2 ................................................................................................................................................ ................................................................................................................................................... ................................................................................................................................................... ................................................................................................................................................... [4] (b) The photograph shows a lionfish. Lionfish eat small fish, shrimp and young spiny lobsters. Lionfish are not native to the Atlantic Ocean. In 2004, the first lionfish was discovered in The Bahamas. The population of lionfish has increased rapidly since then. Three areas of coral reef were regularly surveyed in The Bahamas. The results of the survey are shown in the table. number of lionfish per hectare year area 1 area 2 area 3 mean (average) 2012 37 27 35 33 2014 175 615 181 178 2016 245 232 236 2018 305 300 295 300 2020 330 341 332 334 (i) Calculate the mean (average) number of lionfish per hectare for 2016. mean (average) number of lionfish per hectare = ......................................................... [1] (ii) Explain why the mean (average) number of lionfish in 2014 is calculated using data for only two of the areas. ........................................................................................................................................... ..................................................................................................................................... [1] (iii) Plot a bar chart to show the mean (average) number of lionfish per hectare between 2012 and 2020. [4] (iv) Suggest two reasons why scientists do not expect the lionfish population to increase greatly after 2020. 1 ........................................................................................................................................ ........................................................................................................................................... 2 ........................................................................................................................................ ........................................................................................................................................... [2]
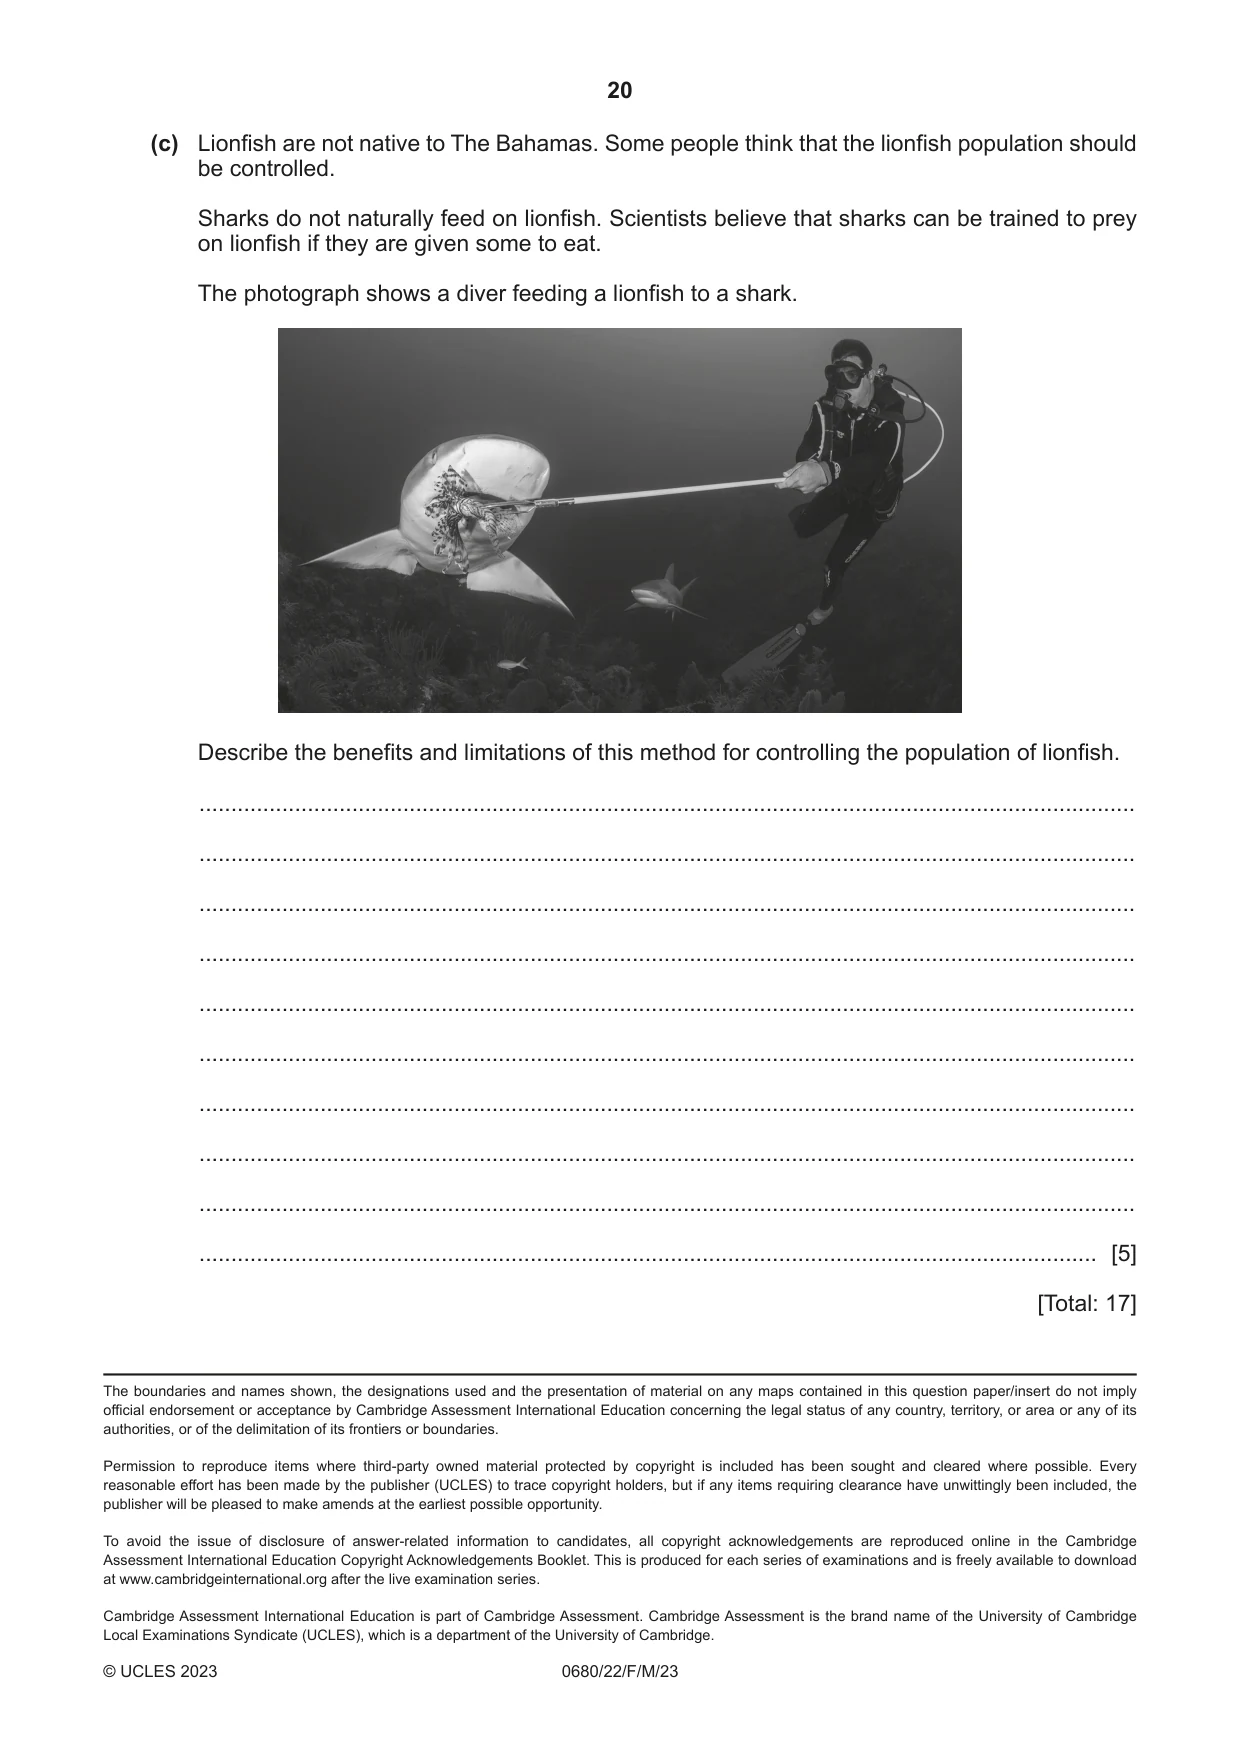
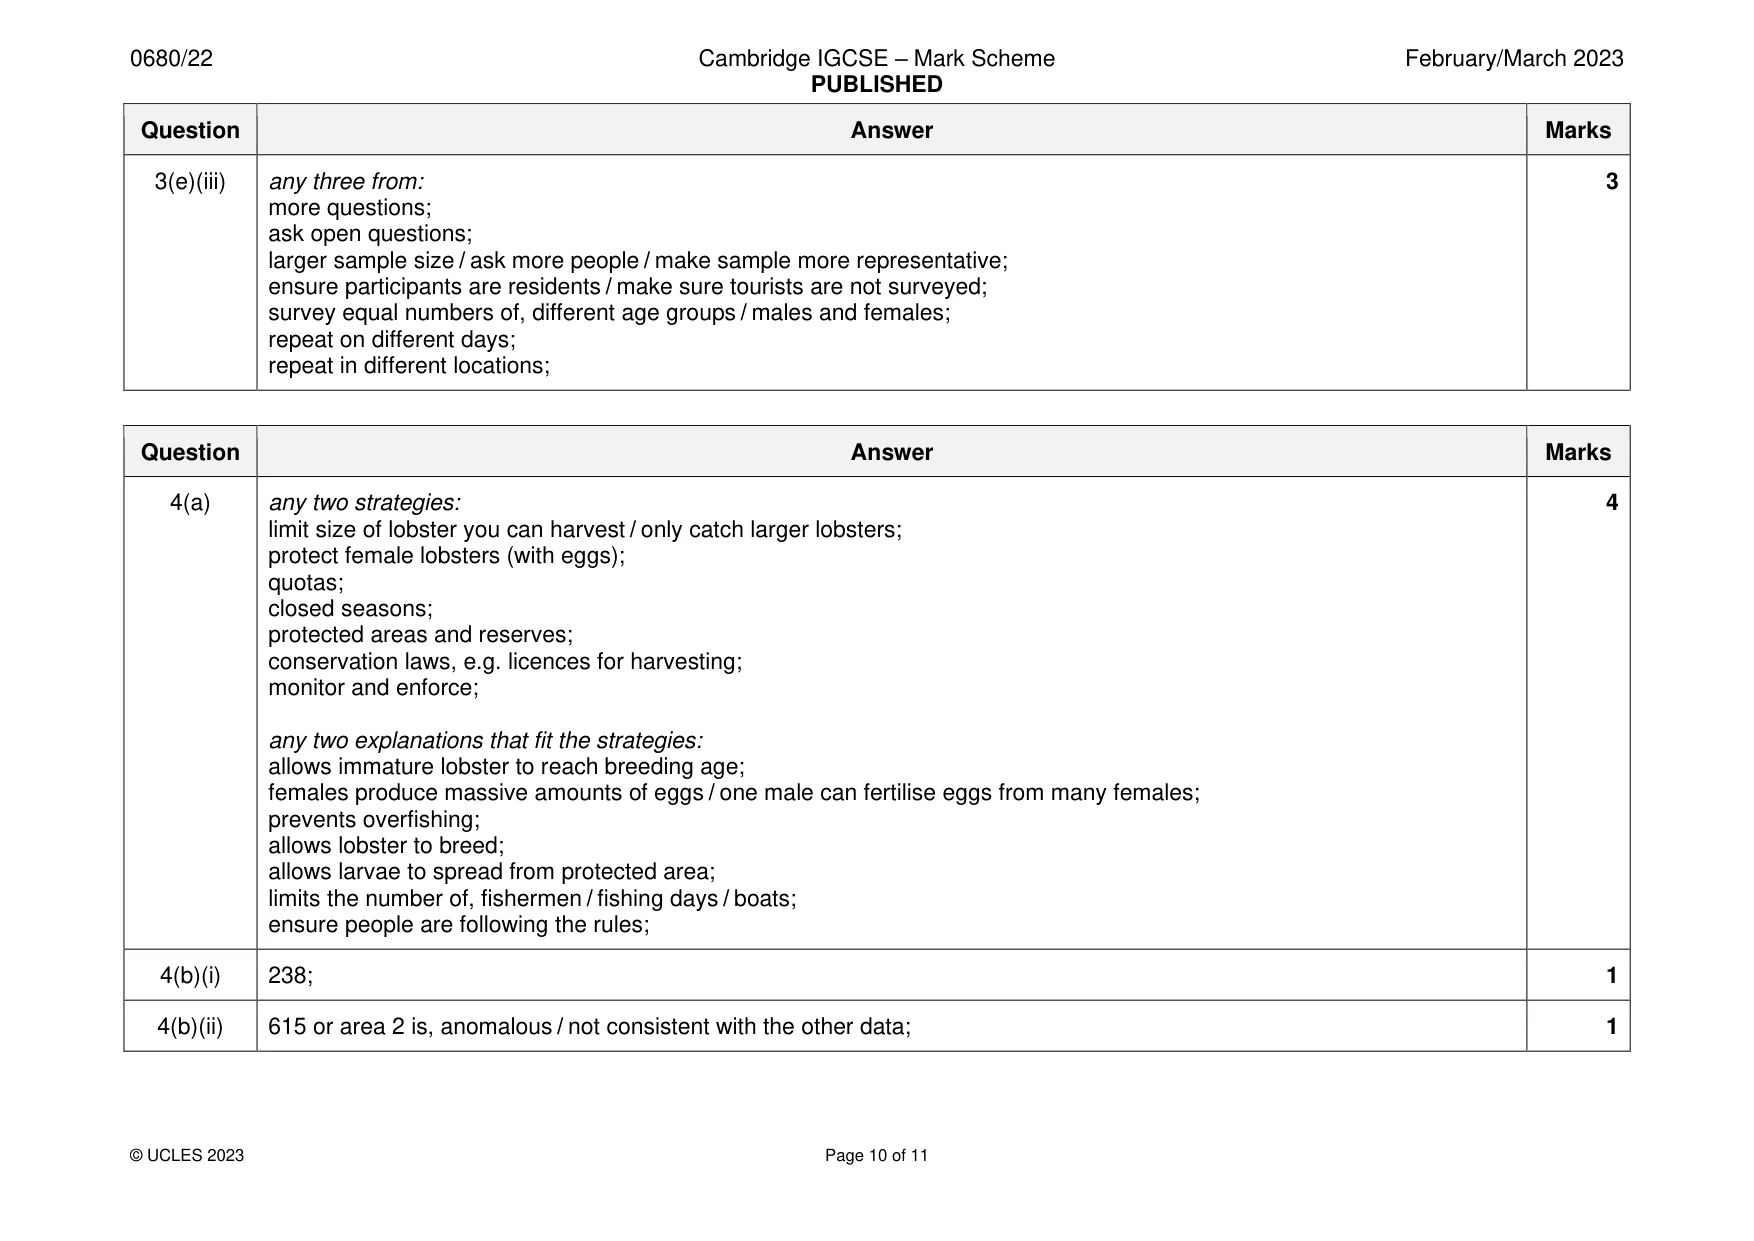
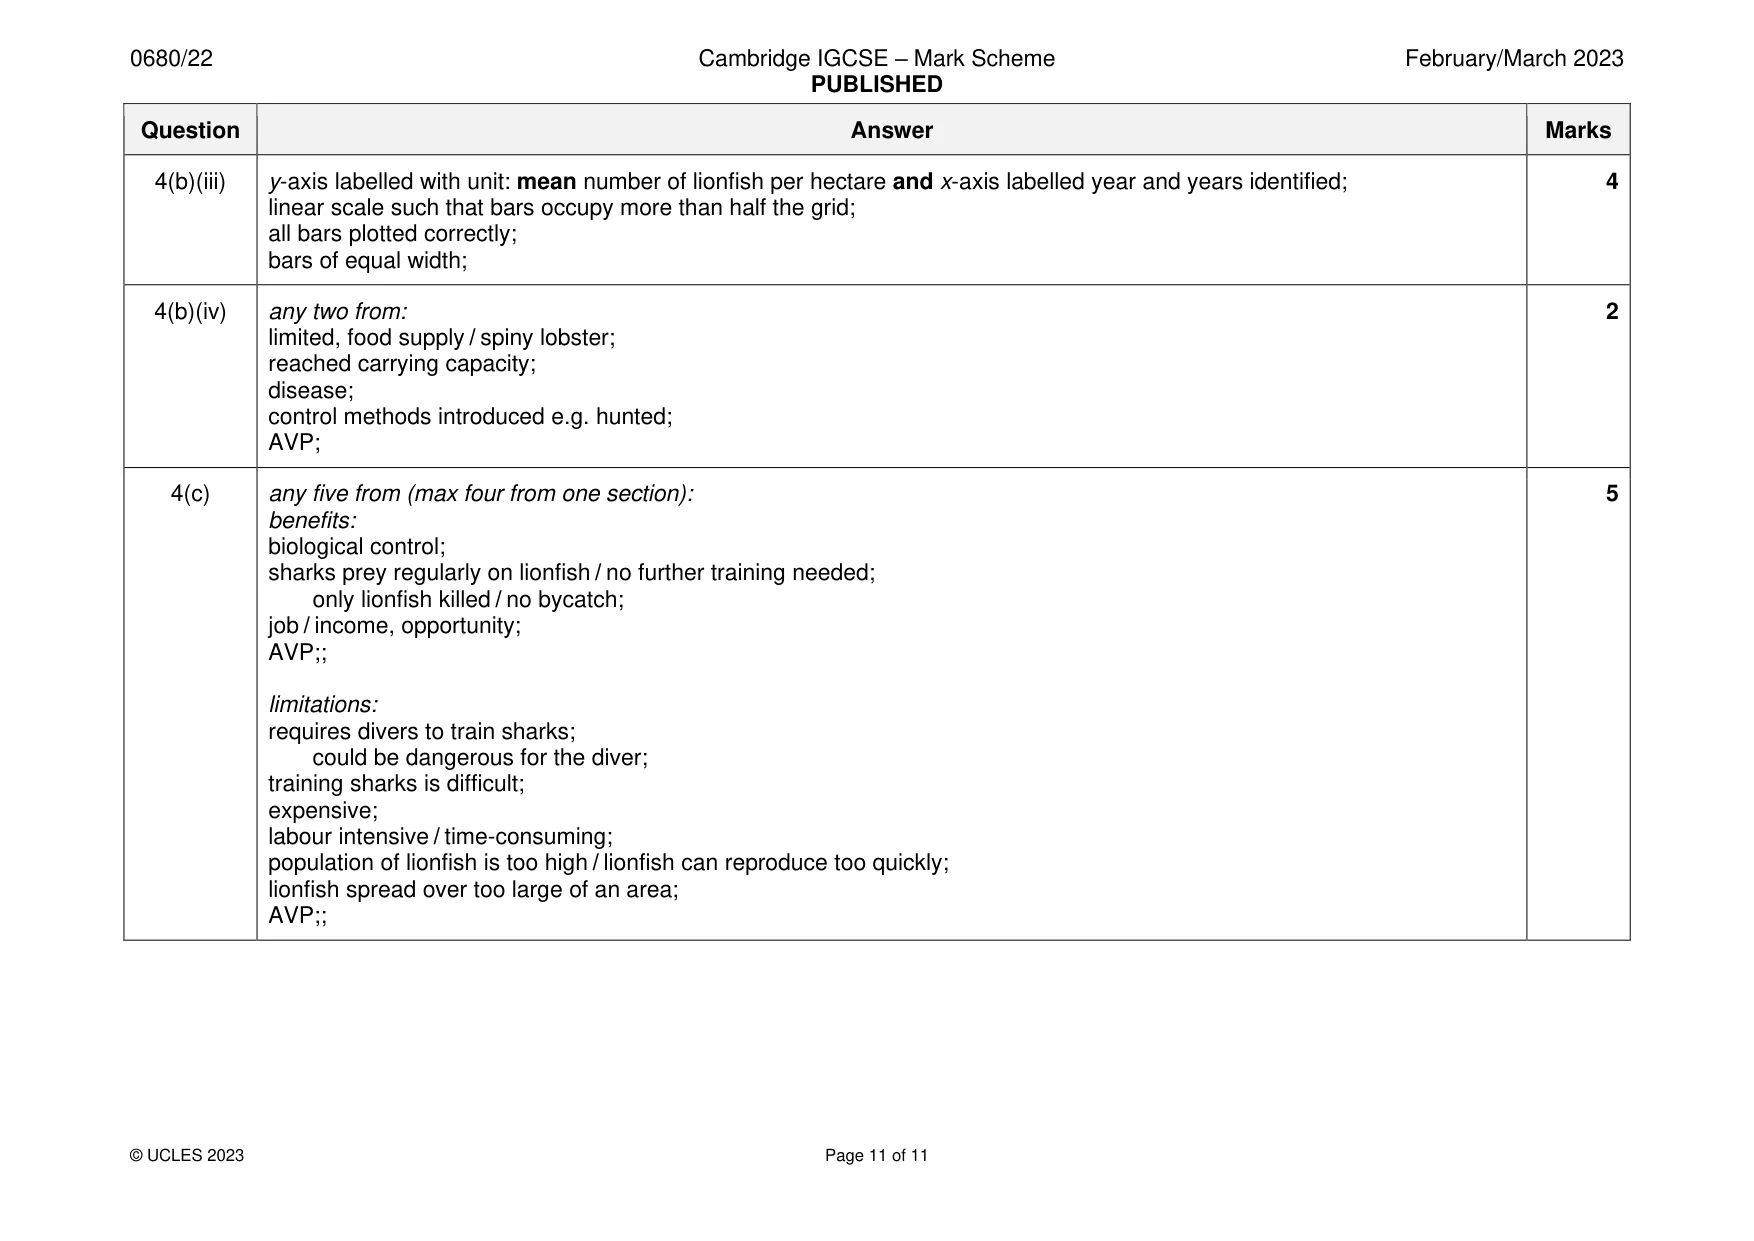
Mark scheme: 4(a) any two strategies: 4 limit size of lobster you can harvest / only catch larger lobsters; protect female lobsters (with eggs); quotas; closed seasons; protected areas and reserves; conservation laws, e.g. licences for harvesting; monitor and enforce; any two explanations that fit the strategies: allows immature lobster to reach breeding age; females produce massive amounts of eggs / one male can fertilise eggs from many females; prevents overfishing; allows lobster to breed; allows larvae to spread from protected area; limits the number of, fishermen / fishing days / boats; ensure people are following the rules; 4(b)(i) 238; 1 4(b)(ii) 615 or area 2 is, anomalous / not consistent with the other data; 1 4(b)(iii) y-axis labelled with unit: mean number of lionfish per hectare and x-axis labelled year and years identified; 4 linear scale such that bars occupy more than half the grid; all bars plotted correctly; bars of equal width; 4(b)(iv) any two from: 2 limited, food supply / spiny lobster; reached carrying capacity; disease; control methods introduced e.g. hunted; AVP; 4(c) any five from (max four from one section): 5 benefits: biological control; sharks prey regularly on lionfish / no further training needed; only lionfish killed / no bycatch; job / income, opportunity; AVP;; limitations: requires divers to train sharks; could be dangerous for the diver; training sharks is difficult; expensive; labour intensive / time-consuming; population of lionfish is too high / lionfish can reproduce too quickly; lionfish spread over too large of an area; AVP;;
What was in this paper
The subtopics covered by these 4 questions, and how many questions each got. Open one in a new tab to see every Cambridge question on it.
What you needed in this session
Cambridge’s own grade thresholds for 2023 Feb/March, Paper 2 · Variant 2. A higher threshold means an easier paper — the bar moves with how the cohort did.