Cambridge IGCSE Environmental Management 0680 — 2023 May/June Paper 2 · Variant 2
0680/22/M/J/23 · 3 questions · 80 marks · ≈90 min
The question paper and its mark scheme, free to read here and free to download. This is Cambridge’s own paper, exactly as it was sat.
Question paper20 pages



Mark scheme11 pages
Answers below. Sit the paper first if you are practising.
Questions as text
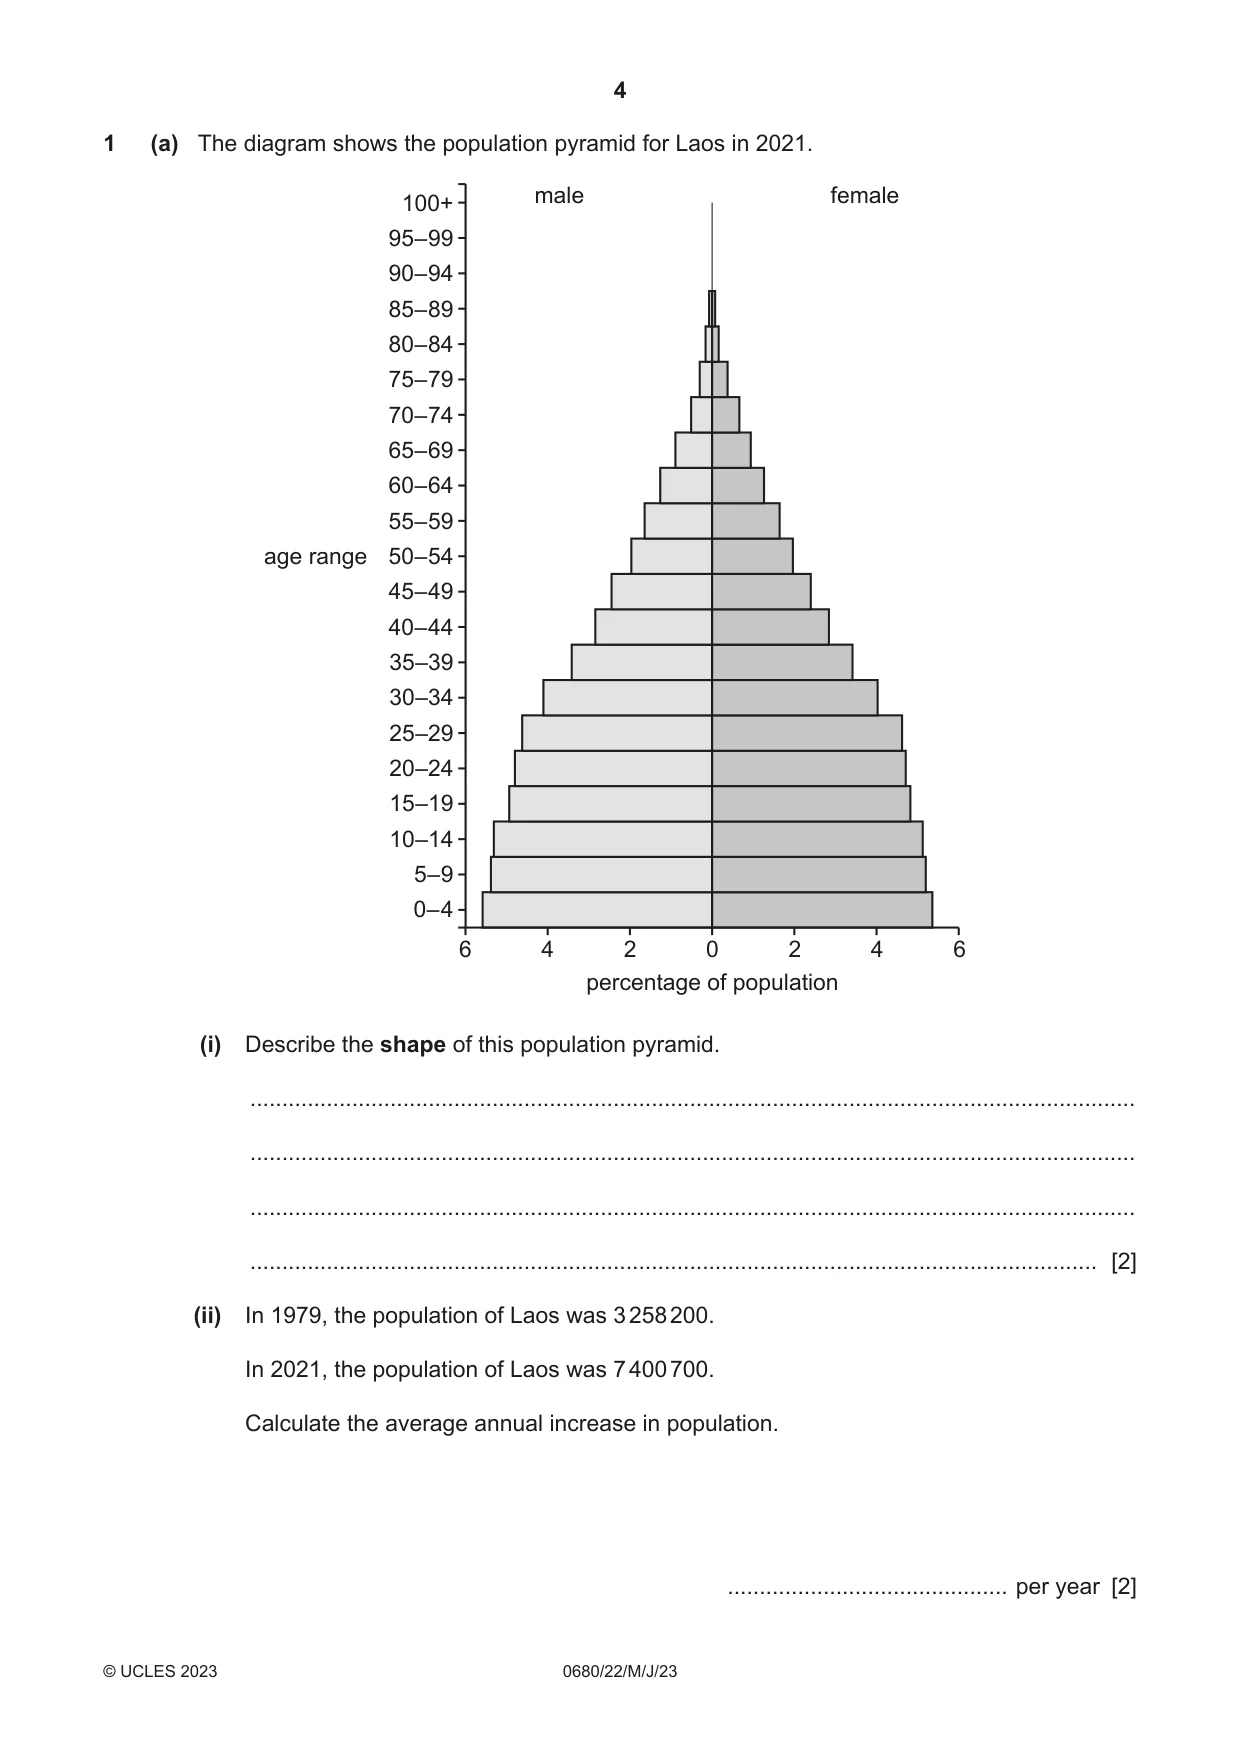
Q1 · The diagram shows the population pyramid for Laos in 2021
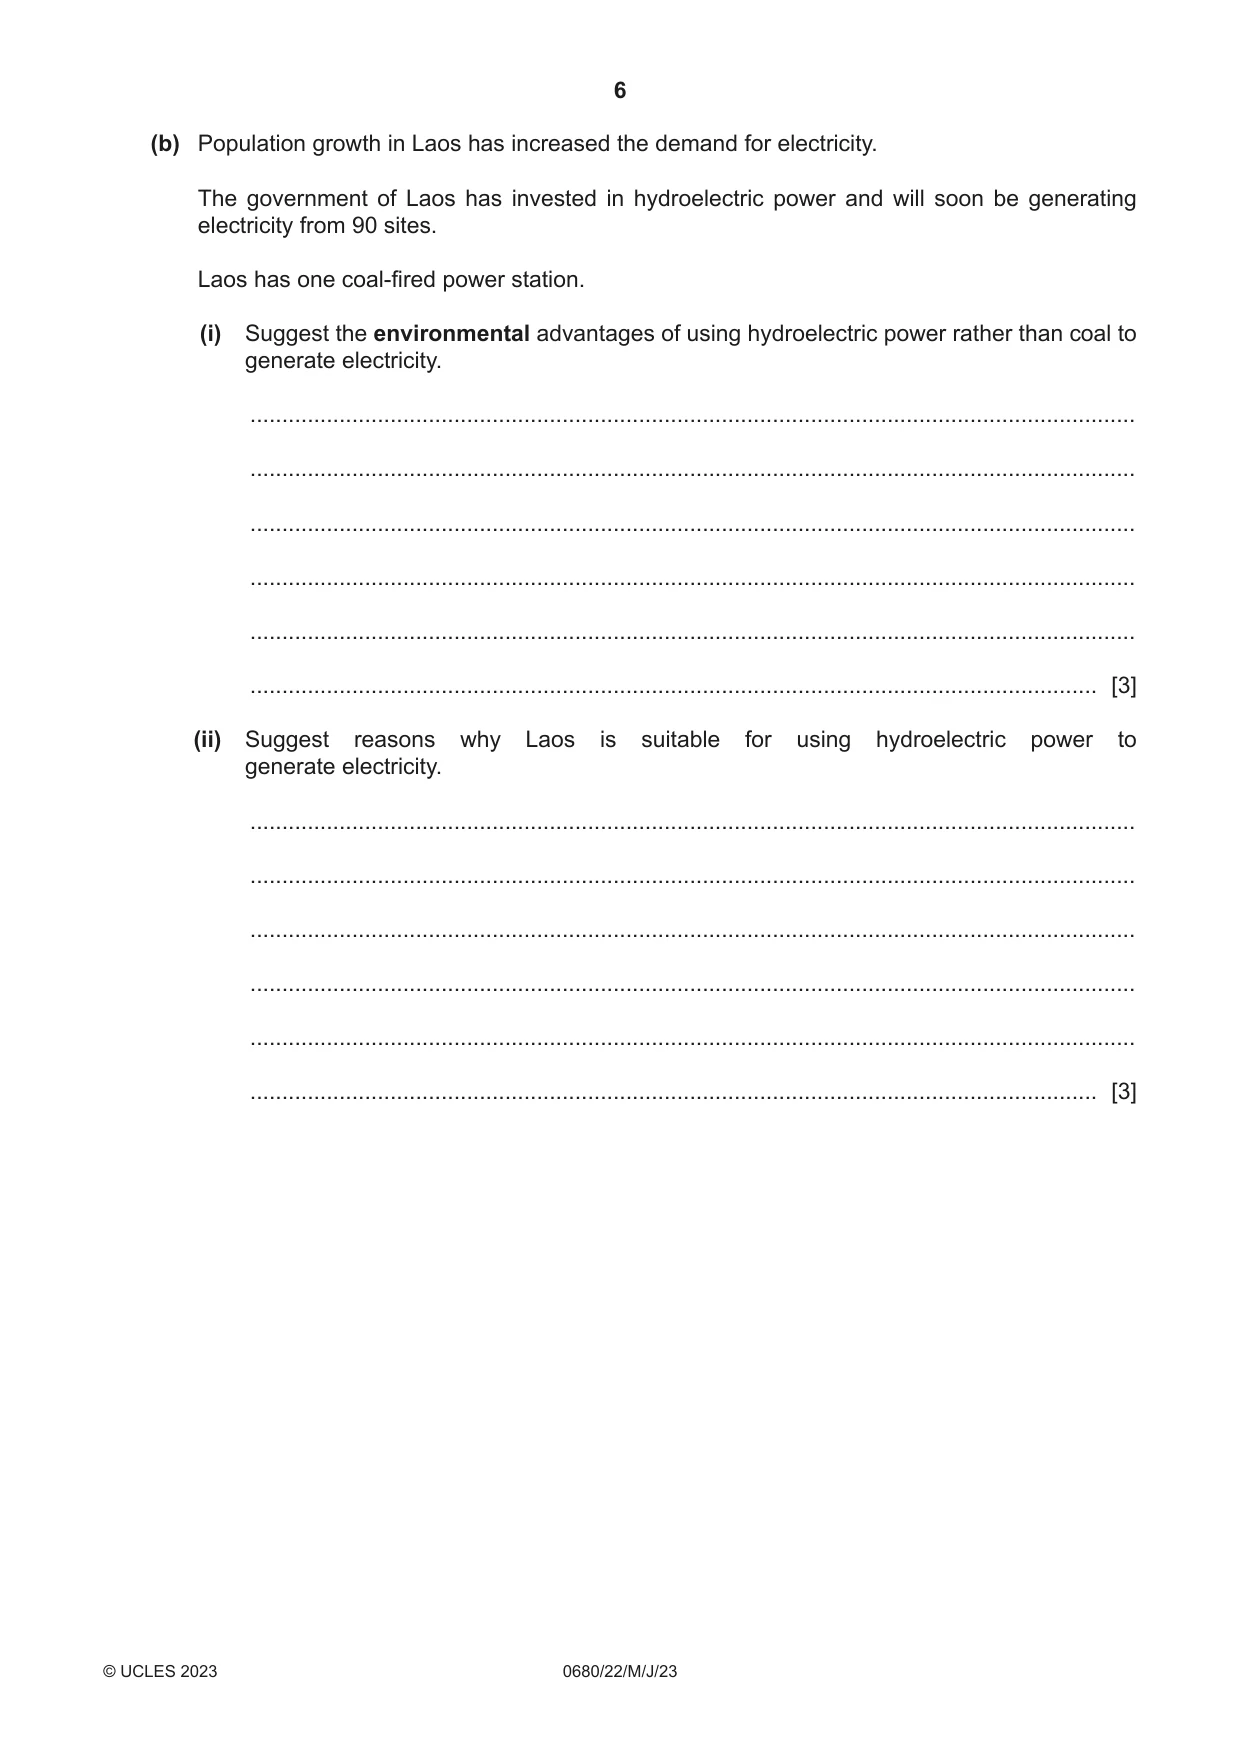
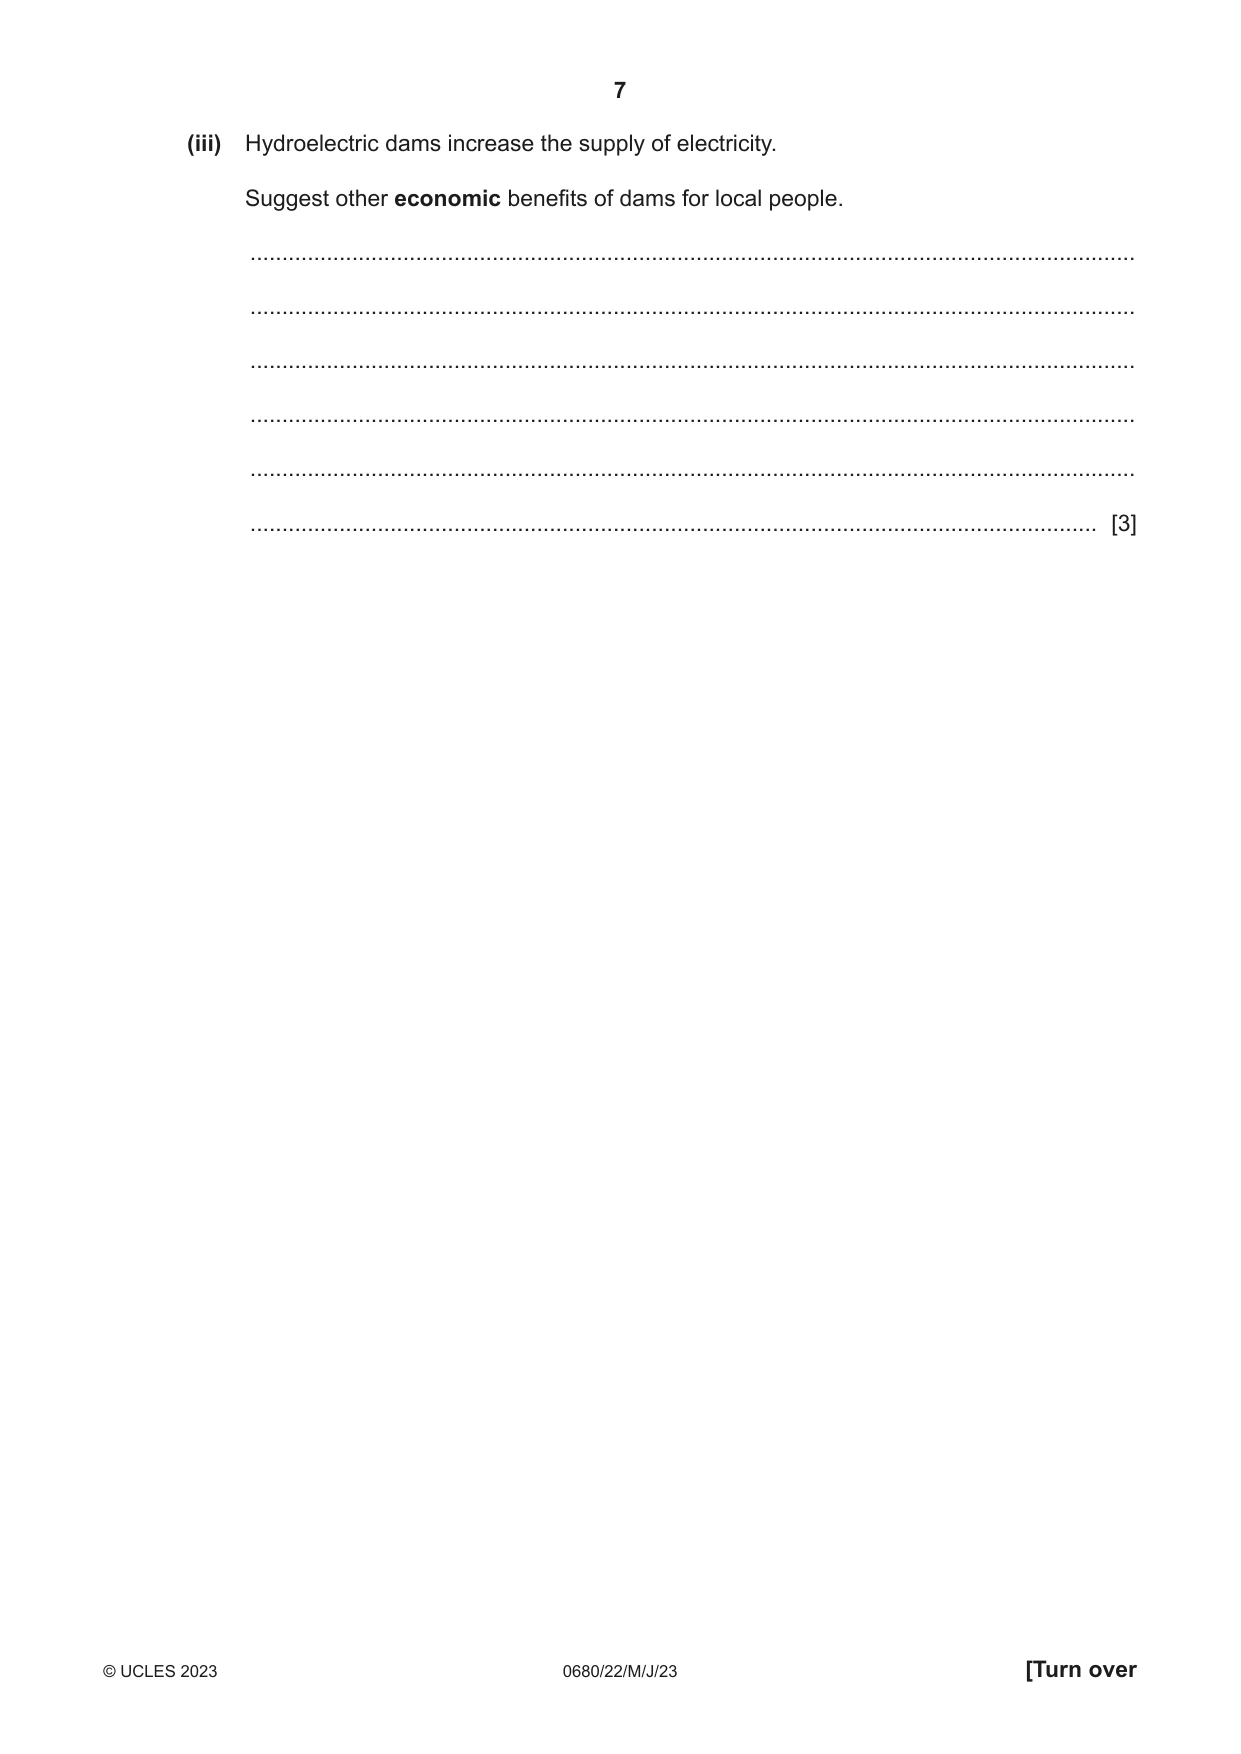
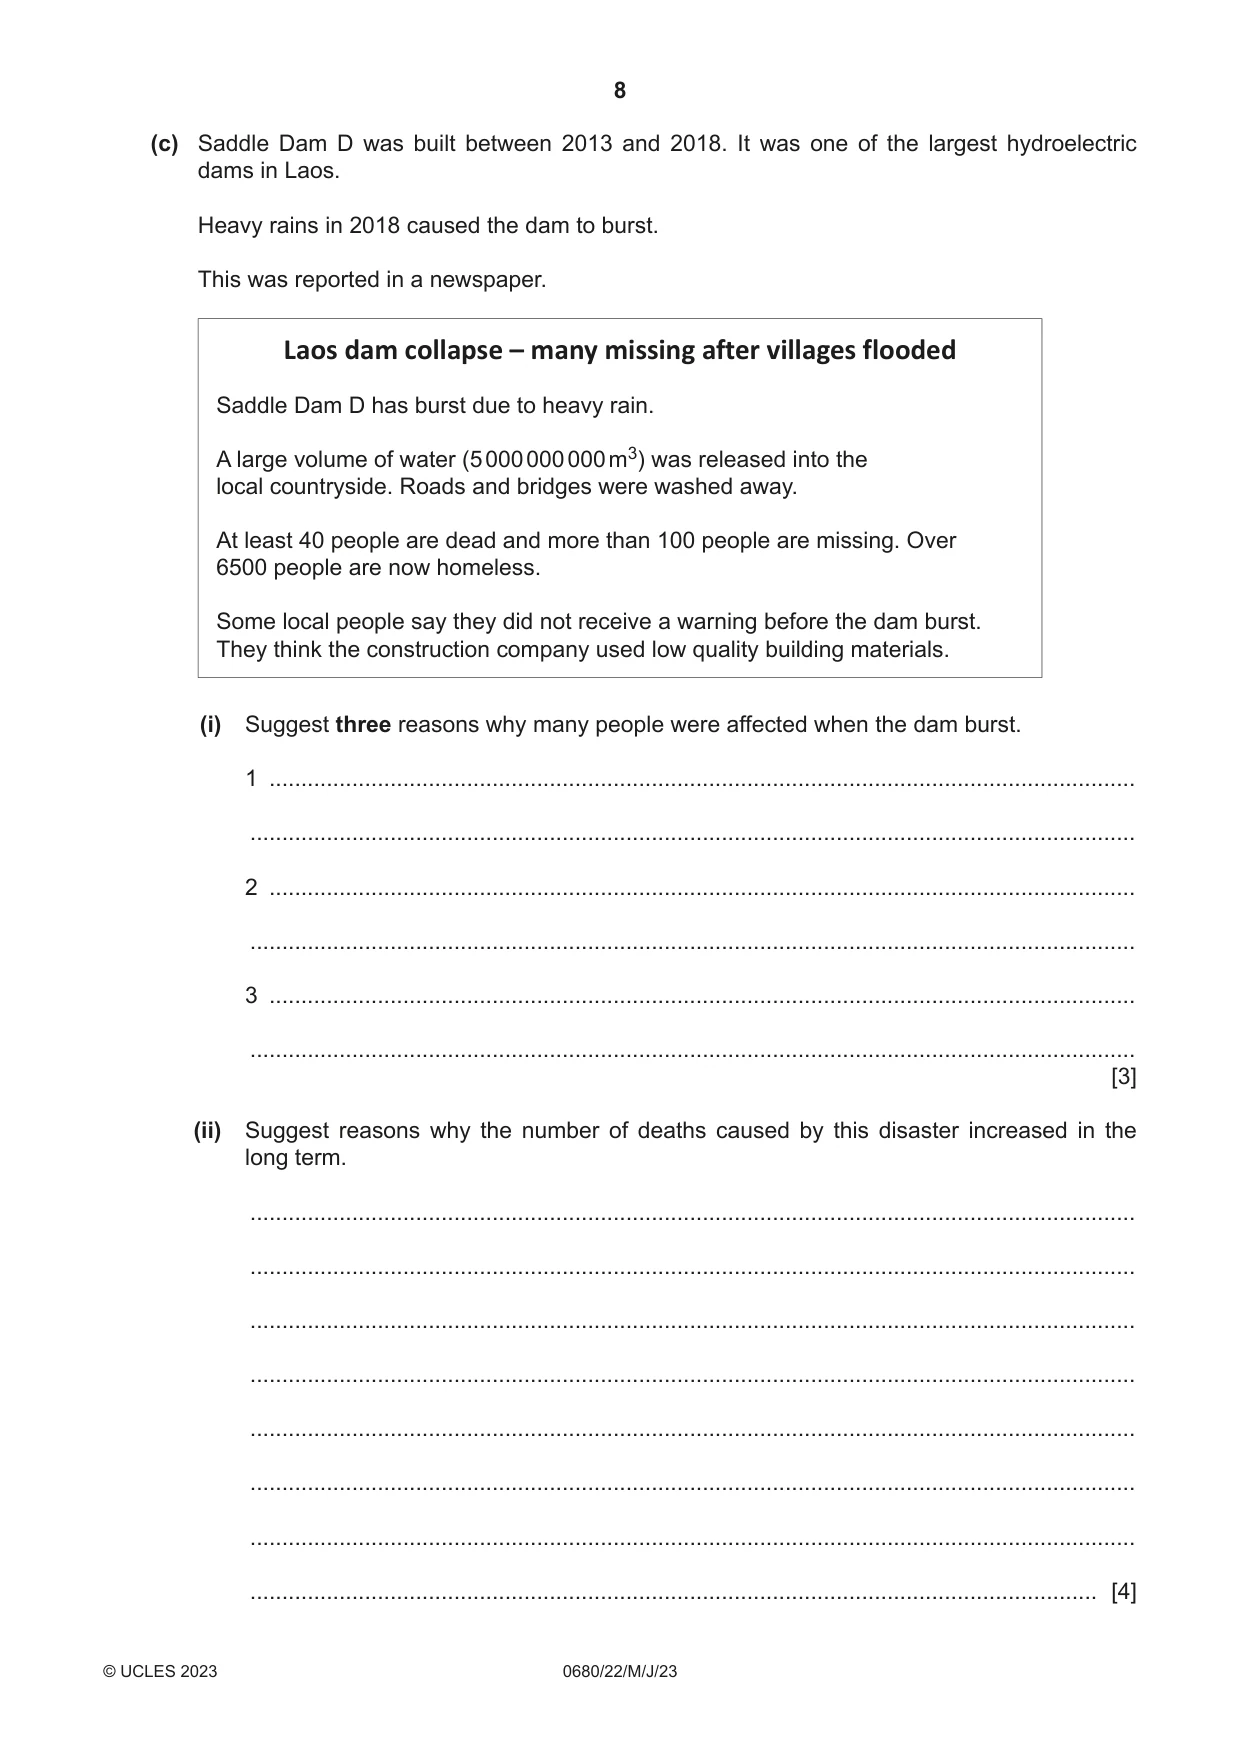
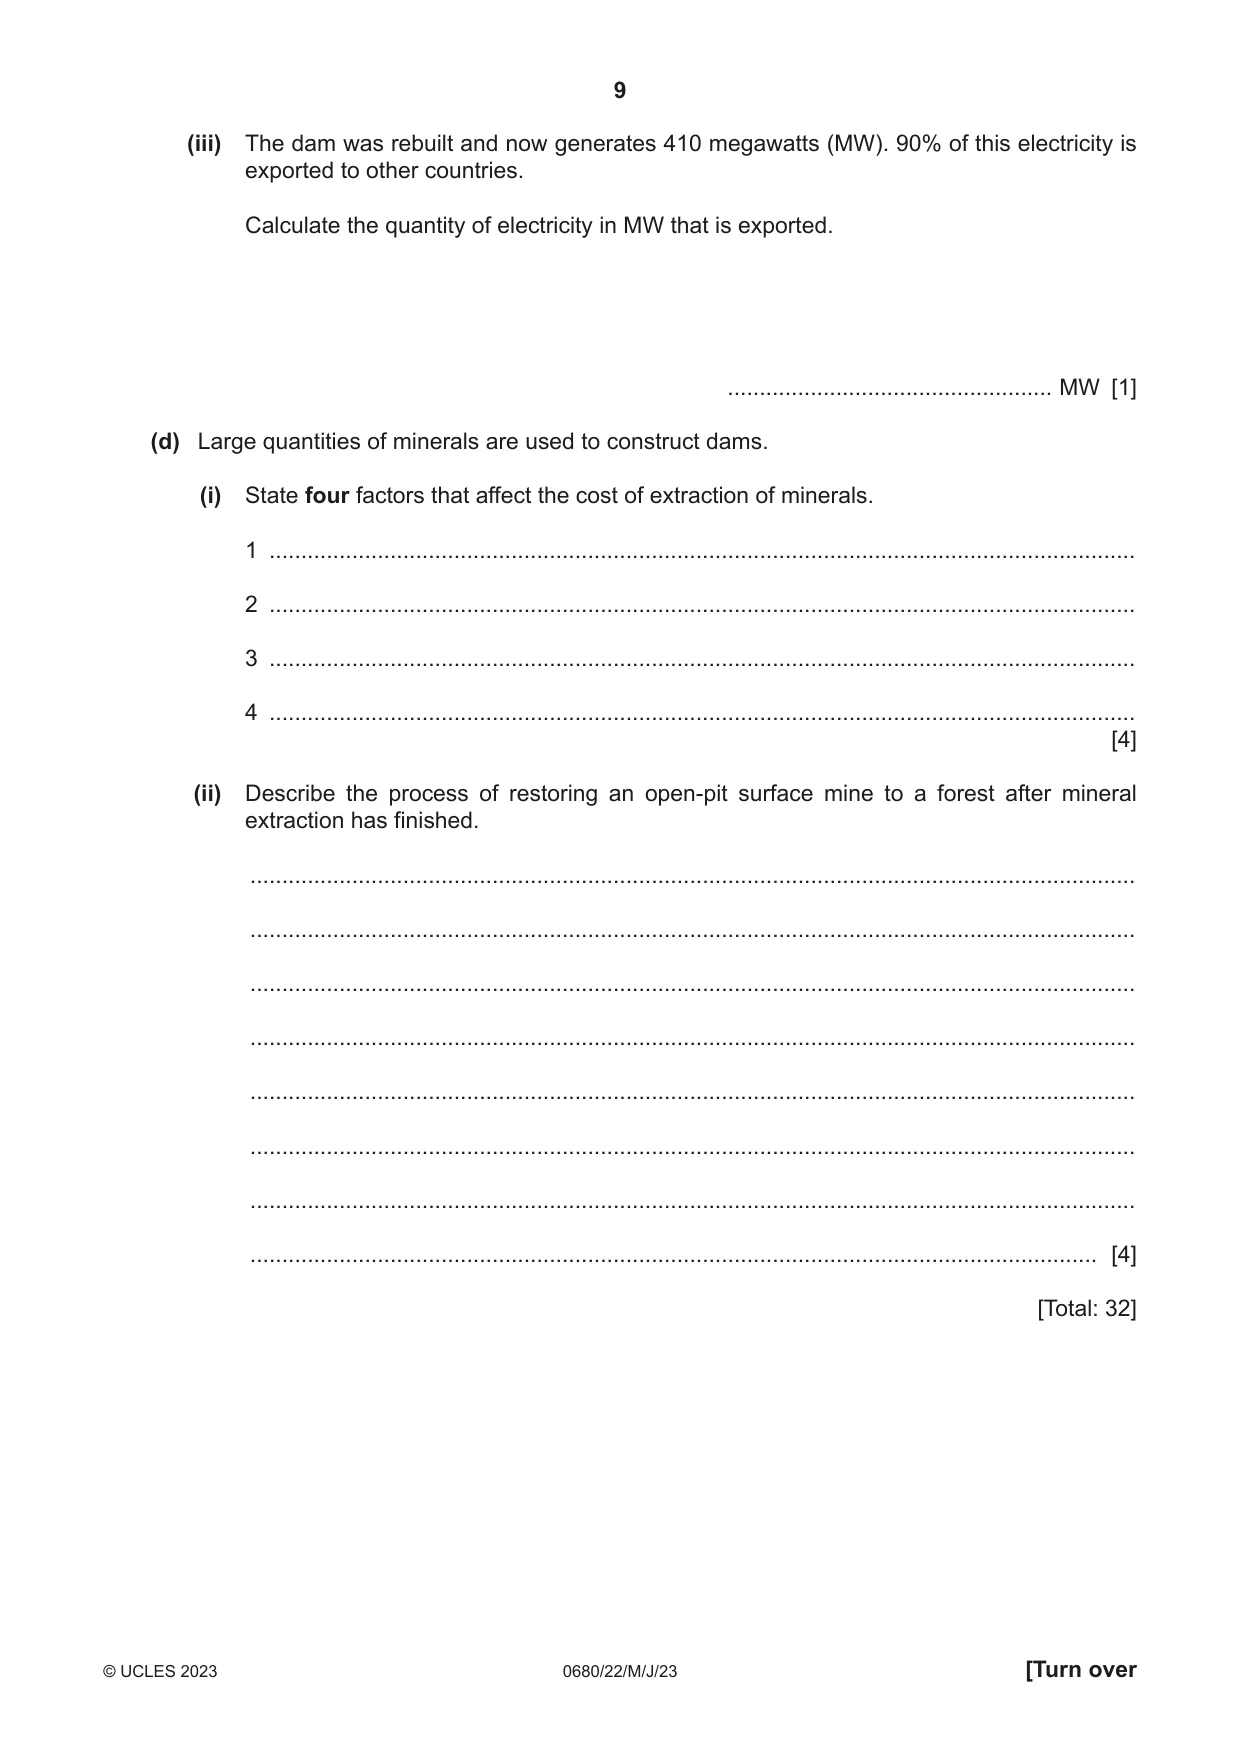
1 (a) The diagram shows the population pyramid for Laos in 2021. male female 100+ 95–99 90–94 85–89 80–84 75–79 70–74 65–69 60–64 55–59 age range 50–54 45–49 40–44 35–39 30–34 25–29 20–24 15–19 10–14 5–9 0–4 6 4 2 0 2 4 6 percentage of population (i) Describe the shape of this population pyramid. ........................................................................................................................................... ........................................................................................................................................... ........................................................................................................................................... ..................................................................................................................................... [2] (ii) In 1979, the population of Laos was 3 258 200. In 2021, the population of Laos was 7 400 700. Calculate the average annual increase in population. ............................................ per year [2] (iii) Suggest reasons why Laos has a rapidly increasing population. ........................................................................................................................................... ........................................................................................................................................... ........................................................................................................................................... ........................................................................................................................................... ........................................................................................................................................... ..................................................................................................................................... [3] (b) Population growth in Laos has increased the demand for electricity. The government of Laos has invested in hydroelectric power and will soon be generating electricity from 90 sites. Laos has one coal-fired power station. (i) Suggest the environmental advantages of using hydroelectric power rather than coal to generate electricity. ........................................................................................................................................... ........................................................................................................................................... ........................................................................................................................................... ........................................................................................................................................... ........................................................................................................................................... ..................................................................................................................................... [3] (ii) Suggest reasons why Laos is suitable for using hydroelectric power to generate electricity. ........................................................................................................................................... ........................................................................................................................................... ........................................................................................................................................... ........................................................................................................................................... ........................................................................................................................................... ..................................................................................................................................... [3] (iii) Hydroelectric dams increase the supply of electricity. Suggest other economic benefits of dams for local people. ........................................................................................................................................... ........................................................................................................................................... ........................................................................................................................................... ........................................................................................................................................... ........................................................................................................................................... ..................................................................................................................................... [3] (c) Saddle Dam D was built between 2013 and 2018. It was one of the largest hydroelectric dams in Laos. Heavy rains in 2018 caused the dam to burst. This was reported in a newspaper. Laos dam collapse – many missing after villages flooded Saddle Dam D has burst due to heavy rain. A large volume of water (5 000 000 000 m3) was released into the local countryside. Roads and bridges were washed away. At least 40 people are dead and more than 100 people are missing. Over 6500 people are now homeless. Some local people say they did not receive a warning before the dam burst. They think the construction company used low quality building materials. (i) Suggest three reasons why many people were affected when the dam burst. 1 ........................................................................................................................................ ........................................................................................................................................... 2 ........................................................................................................................................ ........................................................................................................................................... 3 ........................................................................................................................................ ........................................................................................................................................... [3] (ii) Suggest reasons why the number of deaths caused by this disaster increased in the long term. ........................................................................................................................................... ........................................................................................................................................... ........................................................................................................................................... ........................................................................................................................................... ........................................................................................................................................... ........................................................................................................................................... ........................................................................................................................................... ..................................................................................................................................... [4] (iii) The dam was rebuilt and now generates 410 megawatts (MW). 90% of this electricity is exported to other countries. Calculate the quantity of electricity in MW that is exported. ................................................... MW [1] (d) Large quantities of minerals are used to construct dams. (i) State four factors that affect the cost of extraction of minerals. 1 ........................................................................................................................................ 2 ........................................................................................................................................ 3 ........................................................................................................................................ 4 ........................................................................................................................................ [4] (ii) Describe the process of restoring an open-pit surface mine to a forest after mineral extraction has finished. ........................................................................................................................................... ........................................................................................................................................... ........................................................................................................................................... ........................................................................................................................................... ........................................................................................................................................... ........................................................................................................................................... ........................................................................................................................................... ..................................................................................................................................... [4] [Total: 32]
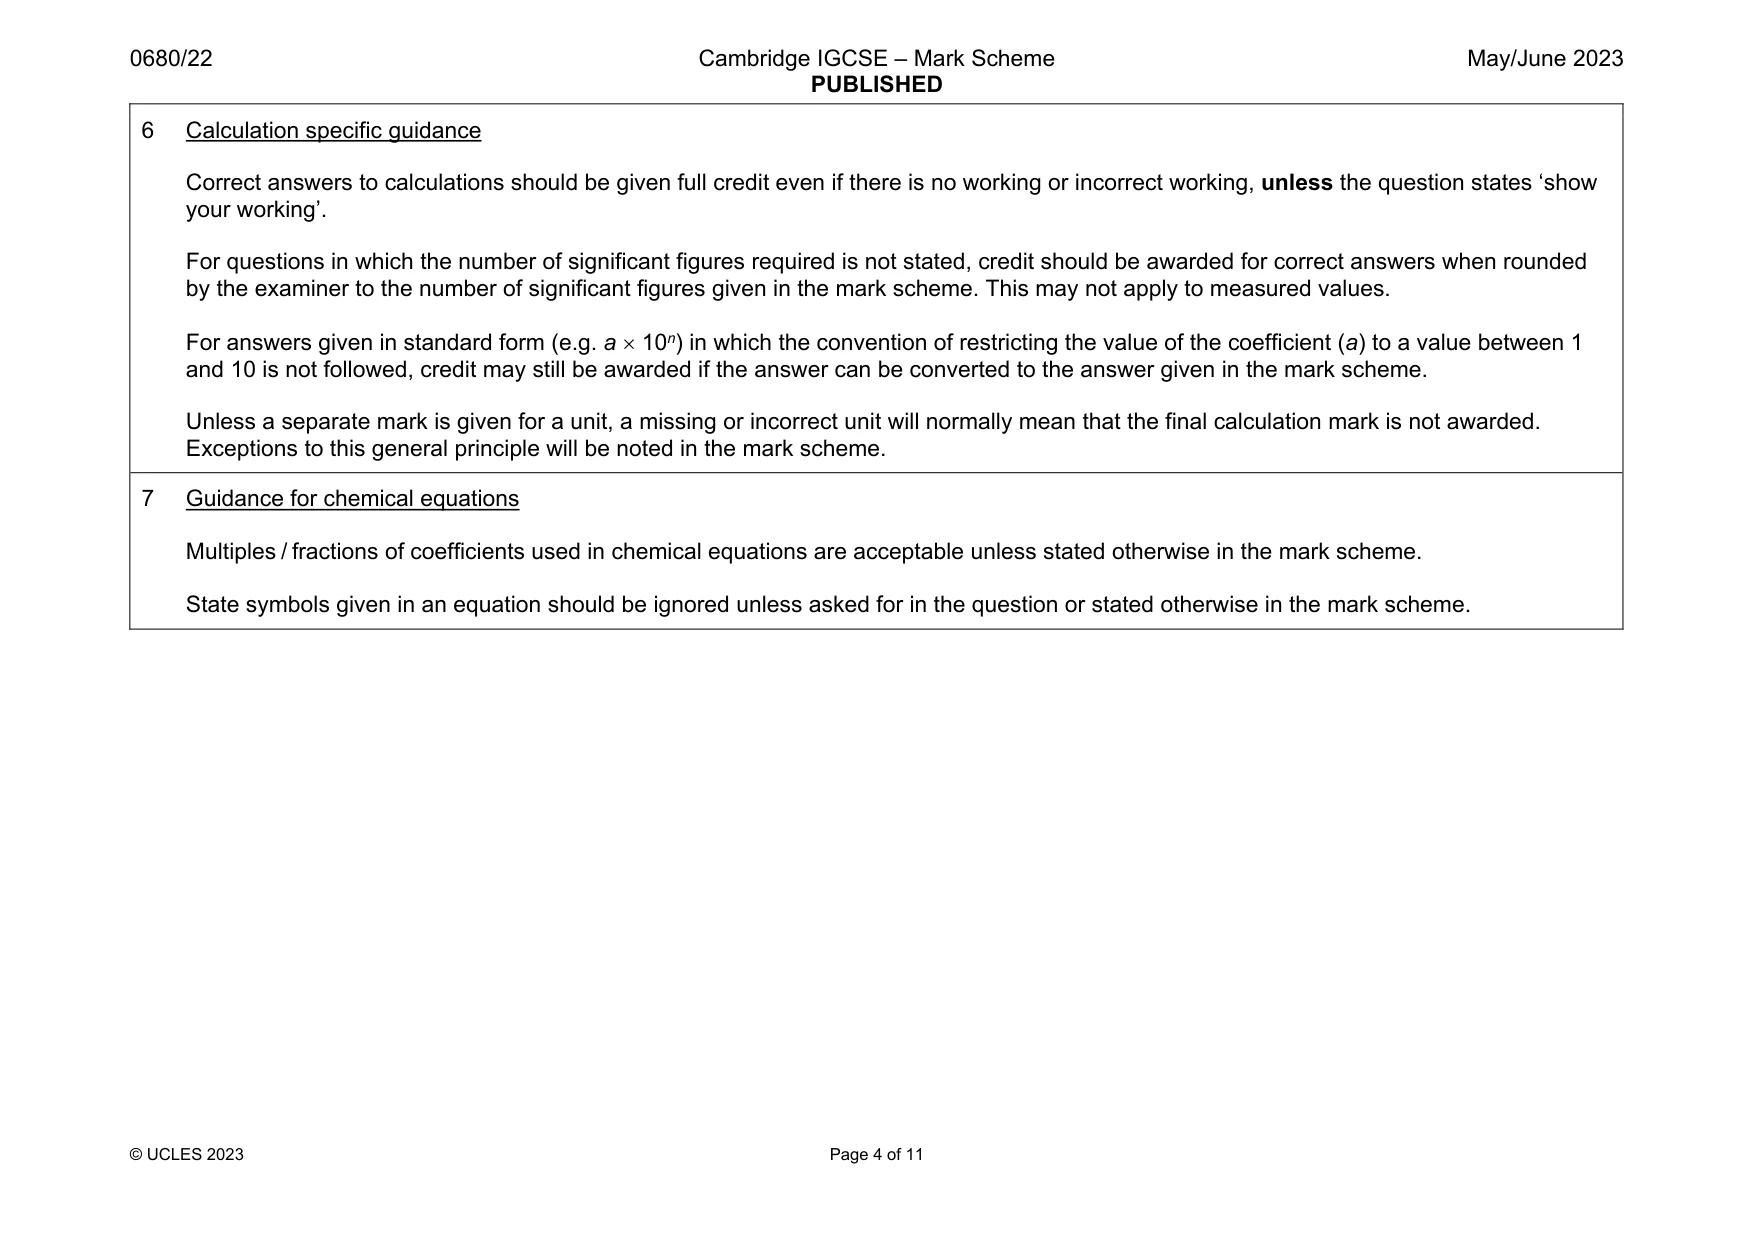
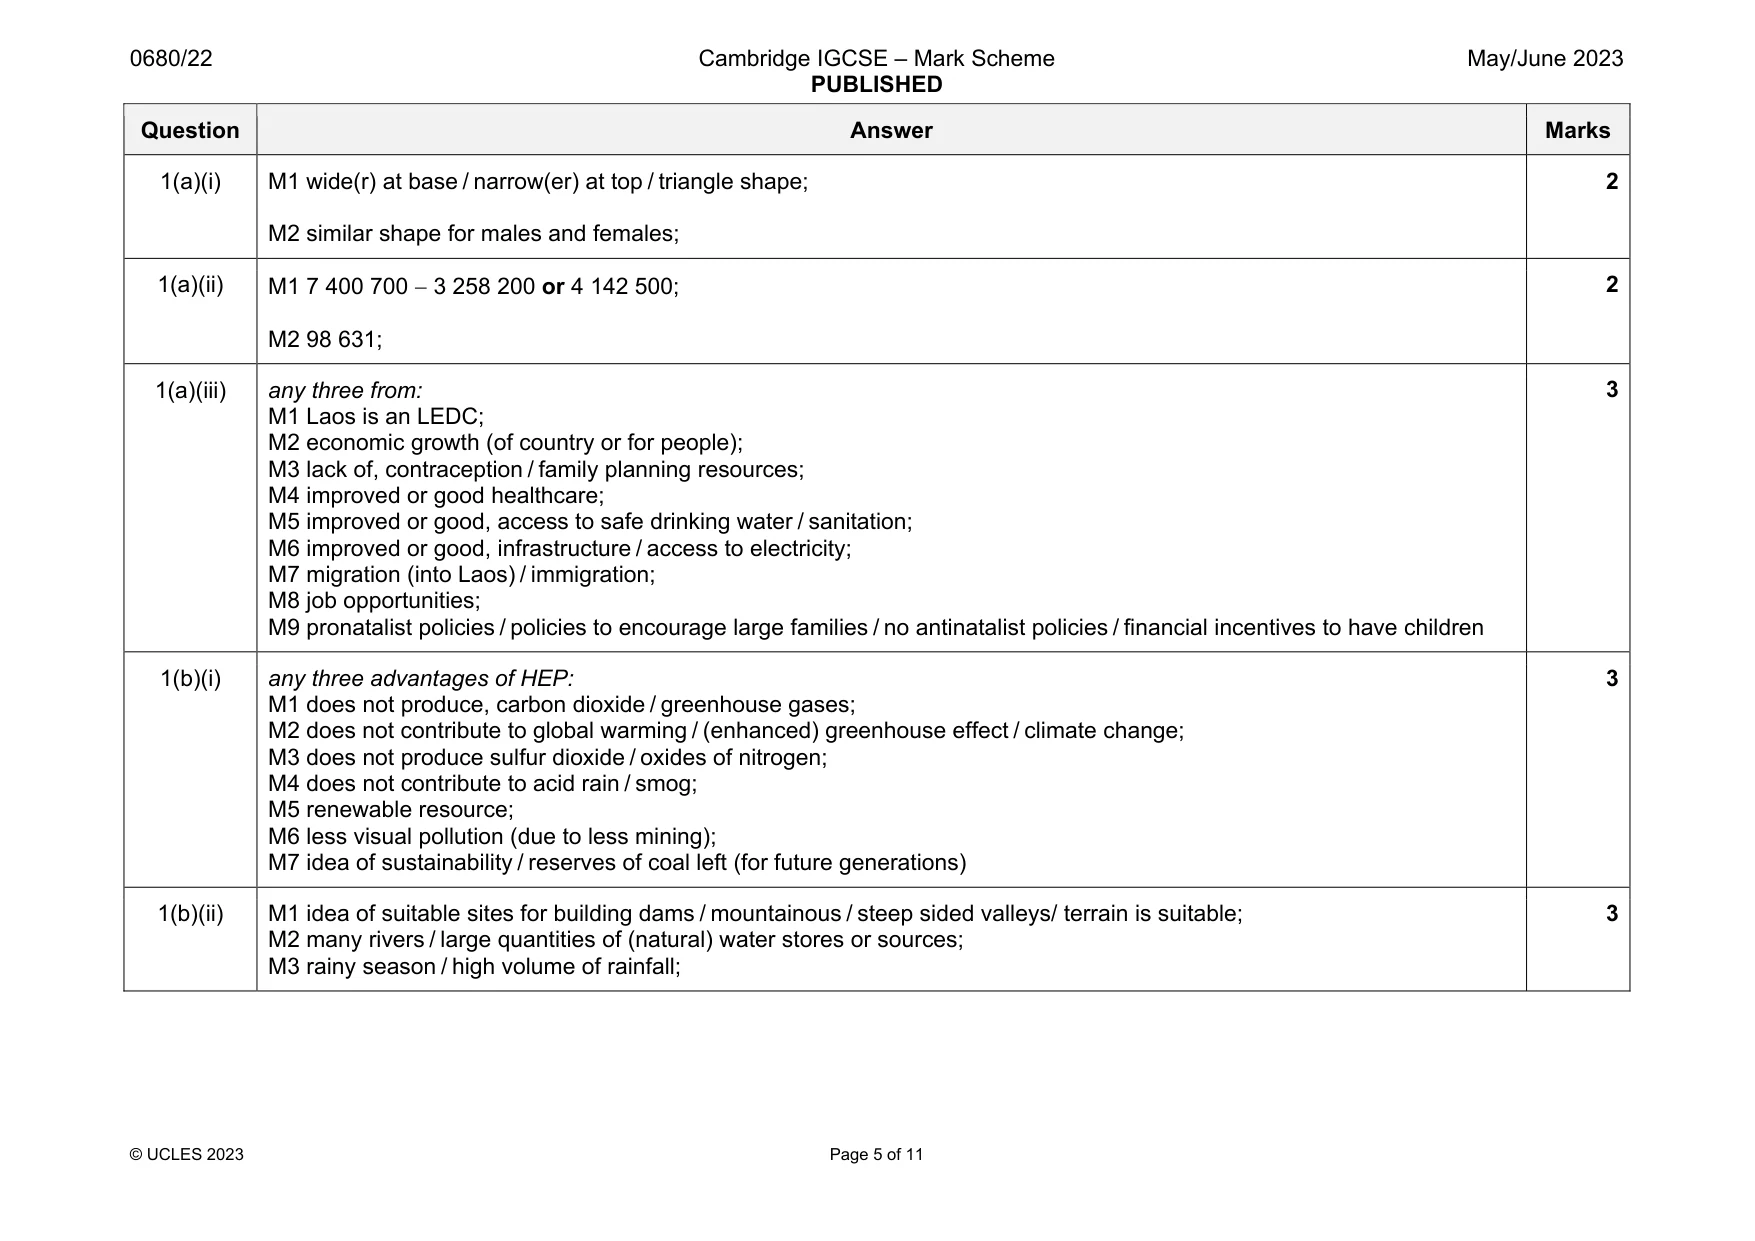
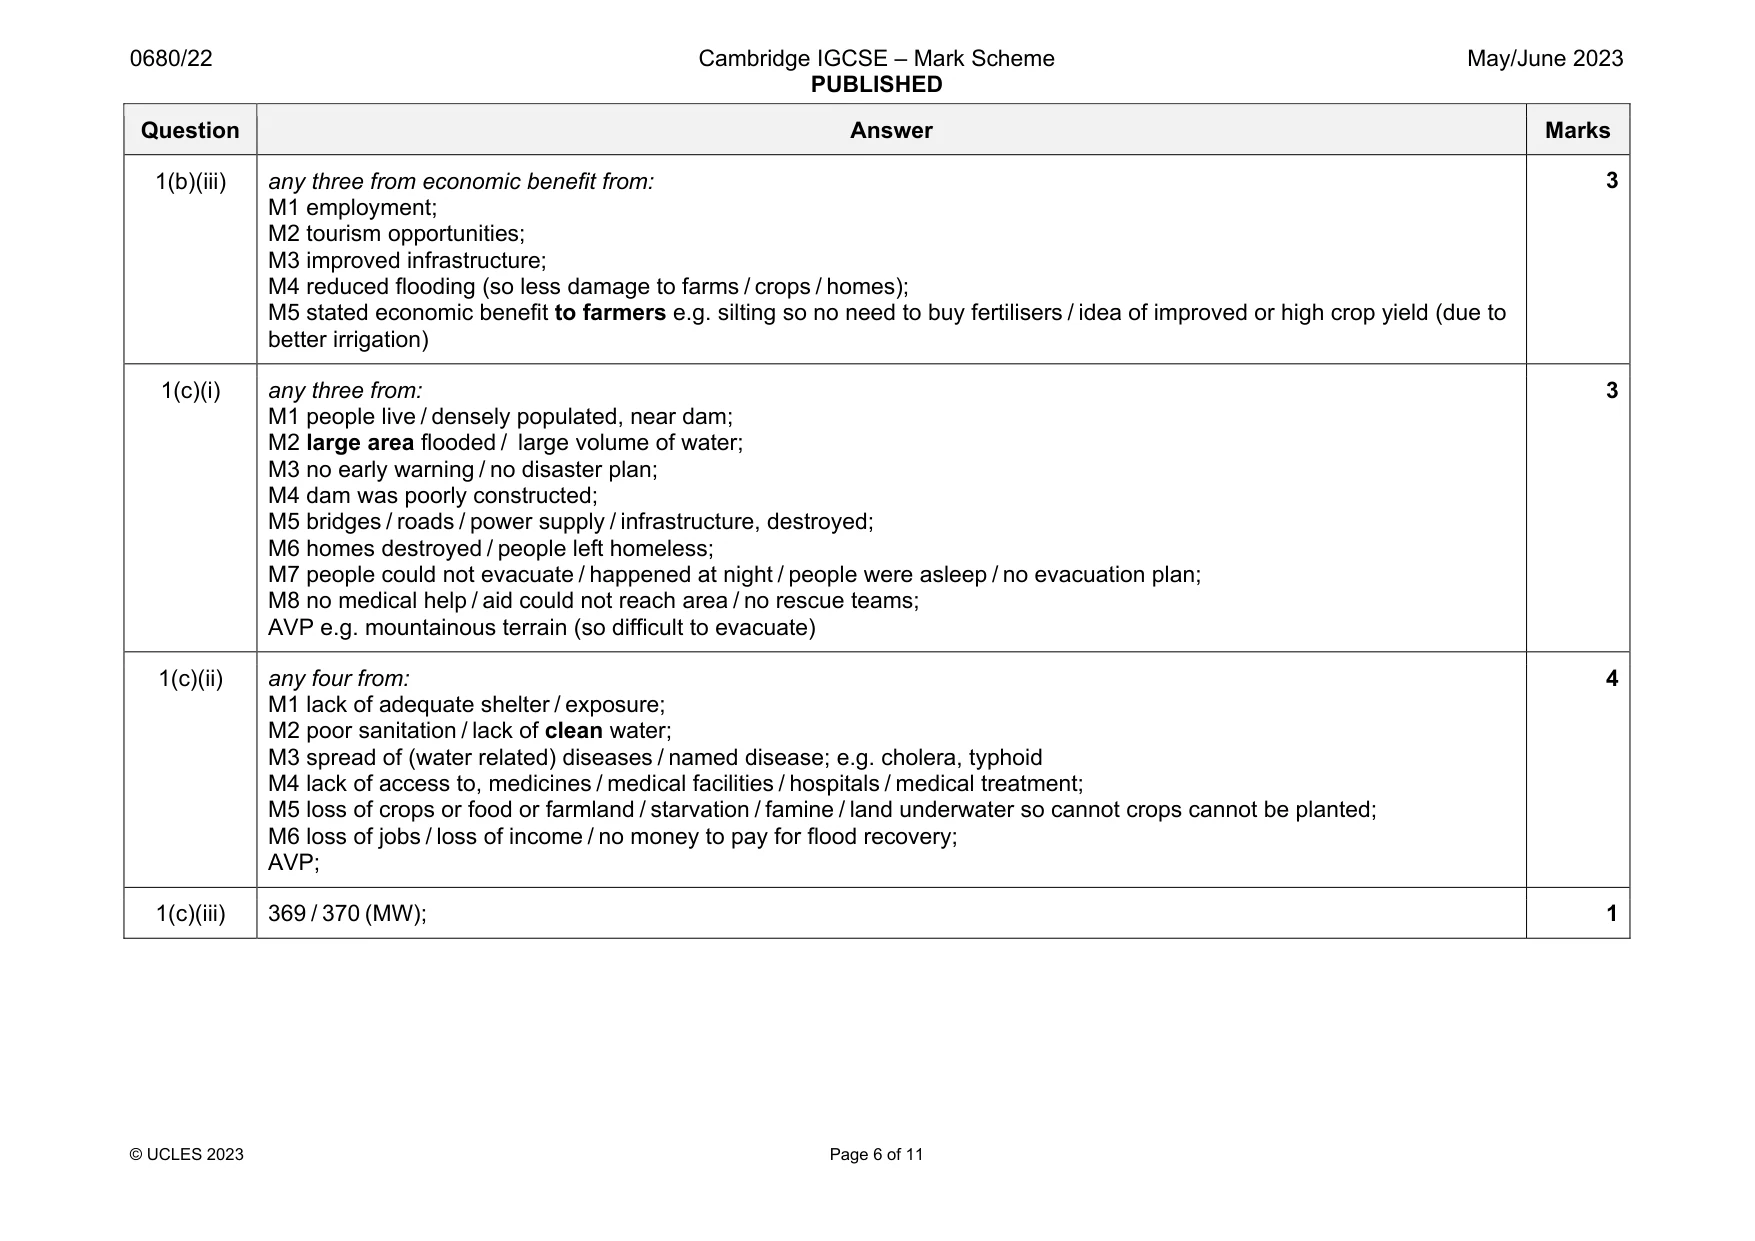
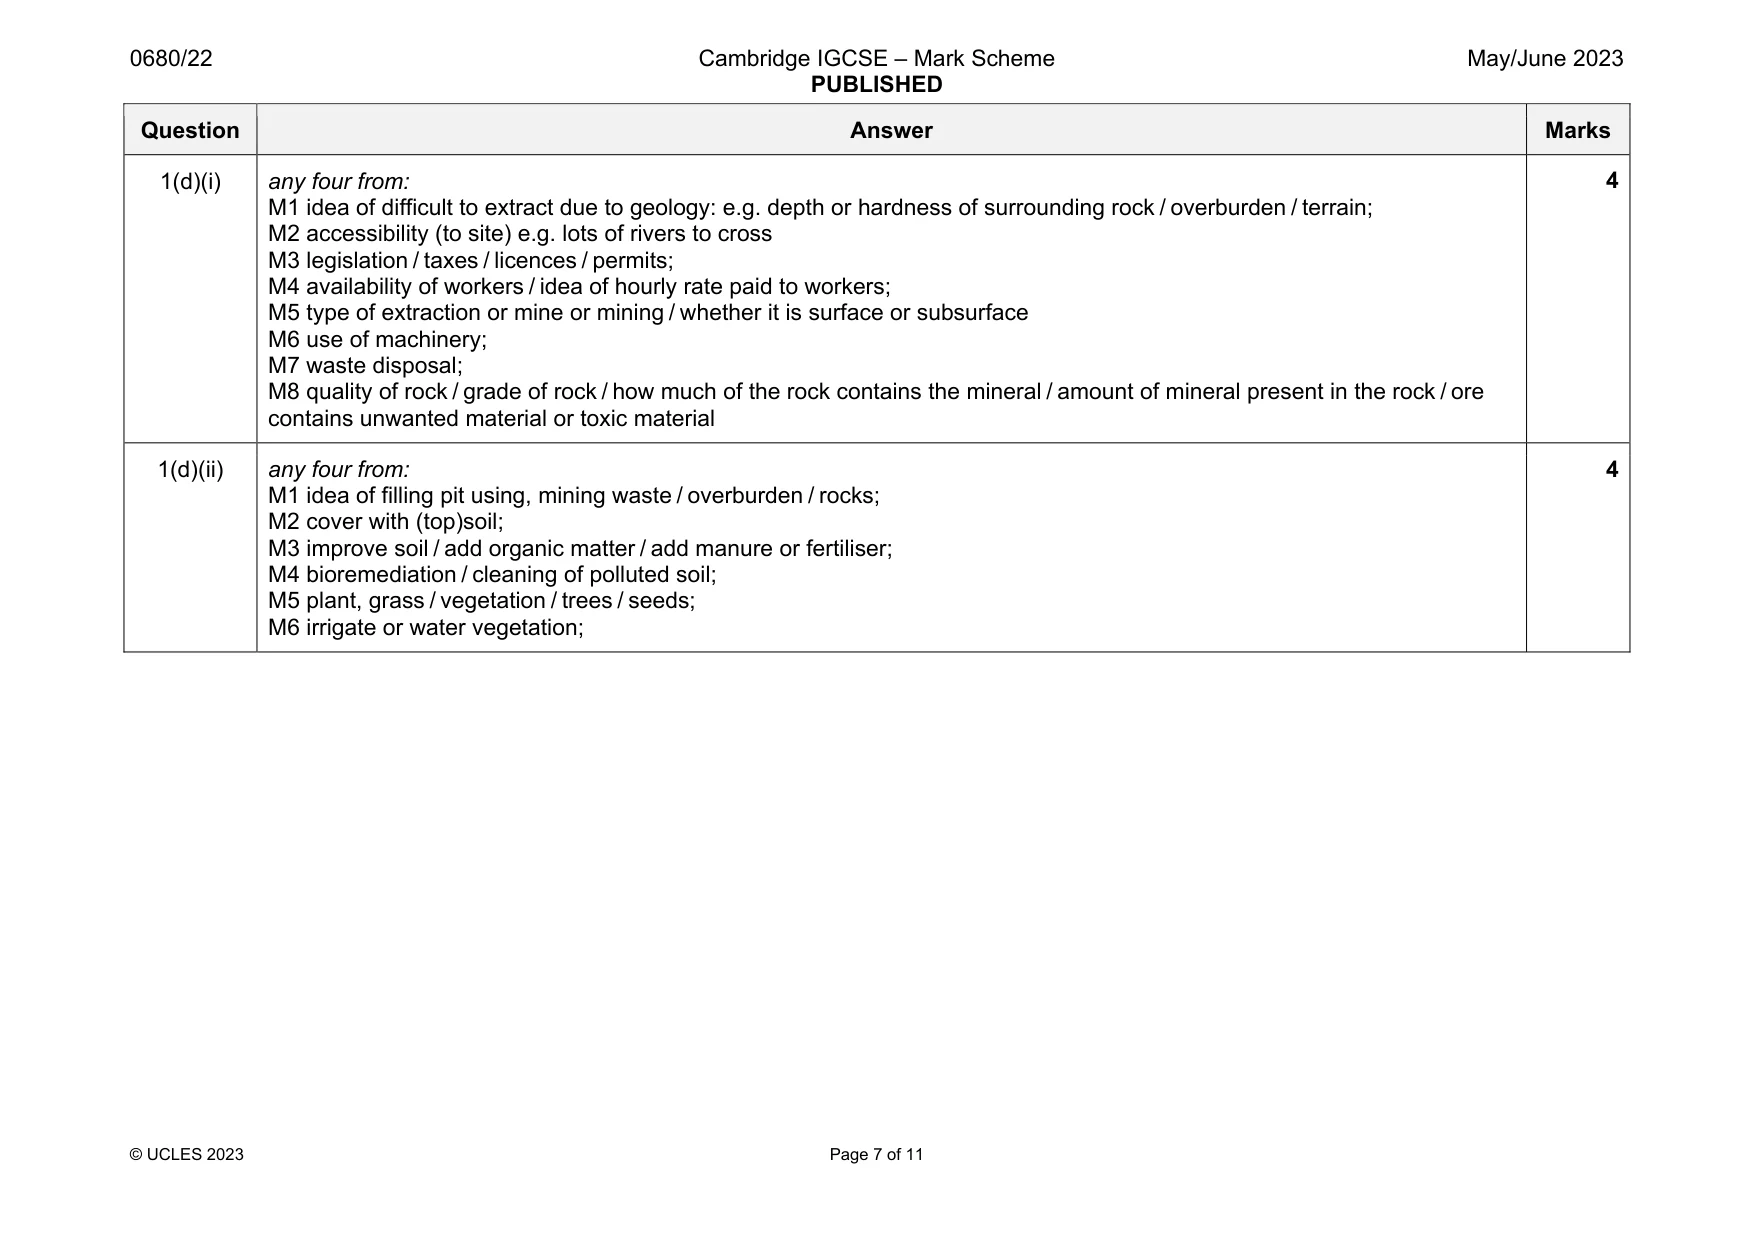
Mark scheme: 1(a)(i) M1 wide(r) at base / narrow(er) at top / triangle shape; M2 similar shape for males and females; 2 1(a)(ii) M1 7 400 700 3 258 200 or 4 142 500; M2 98 631; 2 1(a)(iii) any three from: M1 Laos is an LEDC; M2 economic growth (of country or for people); M3 lack of, contraception / family planning resources; M4 improved or good healthcare; M5 improved or good, access to safe drinking water / sanitation; M6 improved or good, infrastructure / access to electricity; M7 migration (into Laos) / immigration; M8 job opportunities; M9 pronatalist policies / policies to encourage large families / no antinatalist policies / financial incentives to have children 3 1(b)(i) any three advantages of HEP: M1 does not produce, carbon dioxide / greenhouse gases; M2 does not contribute to global warming / (enhanced) greenhouse effect / climate change; M3 does not produce sulfur dioxide / oxides of nitrogen; M4 does not contribute to acid rain / smog; M5 renewable resource; M6 less visual pollution (due to less mining); M7 idea of sustainability / reserves of coal left (for future generations) 3 1(b)(ii) M1 idea of suitable sites for building dams / mountainous / steep sided valleys/ terrain is suitable; M2 many rivers / large quantities of (natural) water stores or sources; M3 rainy season / high volume of rainfall; 3 Question Answer Marks 1(b)(iii) any three from economic benefit from: M1 employment; M2 tourism opportunities; M3 improved infrastructure; M4 reduced flooding (so less damage to farms / crops / homes); M5 stated economic benefit to farmers e.g. silting so no need to buy fertilisers / idea of improved or high crop yield (due to better irrigation) 3 1(c)(i) any three from: M1 people live / densely populated, near dam; M2 large area flooded / large volume of water; M3 no early warning / no disaster plan; M4 dam was poorly constructed; M5 bridges / roads / power supply / infrastructure, destroyed; M6 homes destroyed / people left homeless; M7 people could not evacuate / happened at night / people were asleep / no evacuation plan; M8 no medical help / aid could not reach area / no rescue teams; AVP e.g. mountainous terrain (so difficult to evacuate) 3 1(c)(ii) any four from: M1 lack of adequate shelter / exposure; M2 poor sanitation / lack of clean water; M3 spread of (water related) diseases / named disease; e.g. cholera, typhoid M4 lack of access to, medicines / medical facilities / hospitals / medical treatment; M5 loss of crops or food or farmland / starvation / famine / land underwater so cannot crops cannot be planted; M6 loss of jobs / loss of income / no money to pay for flood recovery; AVP; 4 1(c)(iii) 369 / 370 (MW); 1 Question Answer Marks 1(d)(i) any four from: M1 idea of difficult to extract due to geology: e.g. depth or hardness of surrounding rock / overburden / terrain; M2 accessibility (to site) e.g. lots of rivers to cross M3 legislation / taxes / licences / permits; M4 availability of workers / idea of hourly rate paid to workers; M5 type of extraction or mine or mining / whether it is surface or subsurface M6 use of machinery; M7 waste disposal; M8 quality of rock / grade of rock / how much of the rock contains the mineral / amount of mineral present in the rock / ore contains unwanted material or toxic material 4 1(d)(ii) any four from: M1 idea of filling pit using, mining waste / overburden / rocks; M2 cover with (top)soil; M3 improve soil / add organic matter / add manure or fertiliser; M4 bioremediation / cleaning of polluted soil; M5 plant, grass / vegetation / trees / seeds; M6 irrigate or water vegetation; 4
Q2 · Fish are an important part of the diet of people in Laos
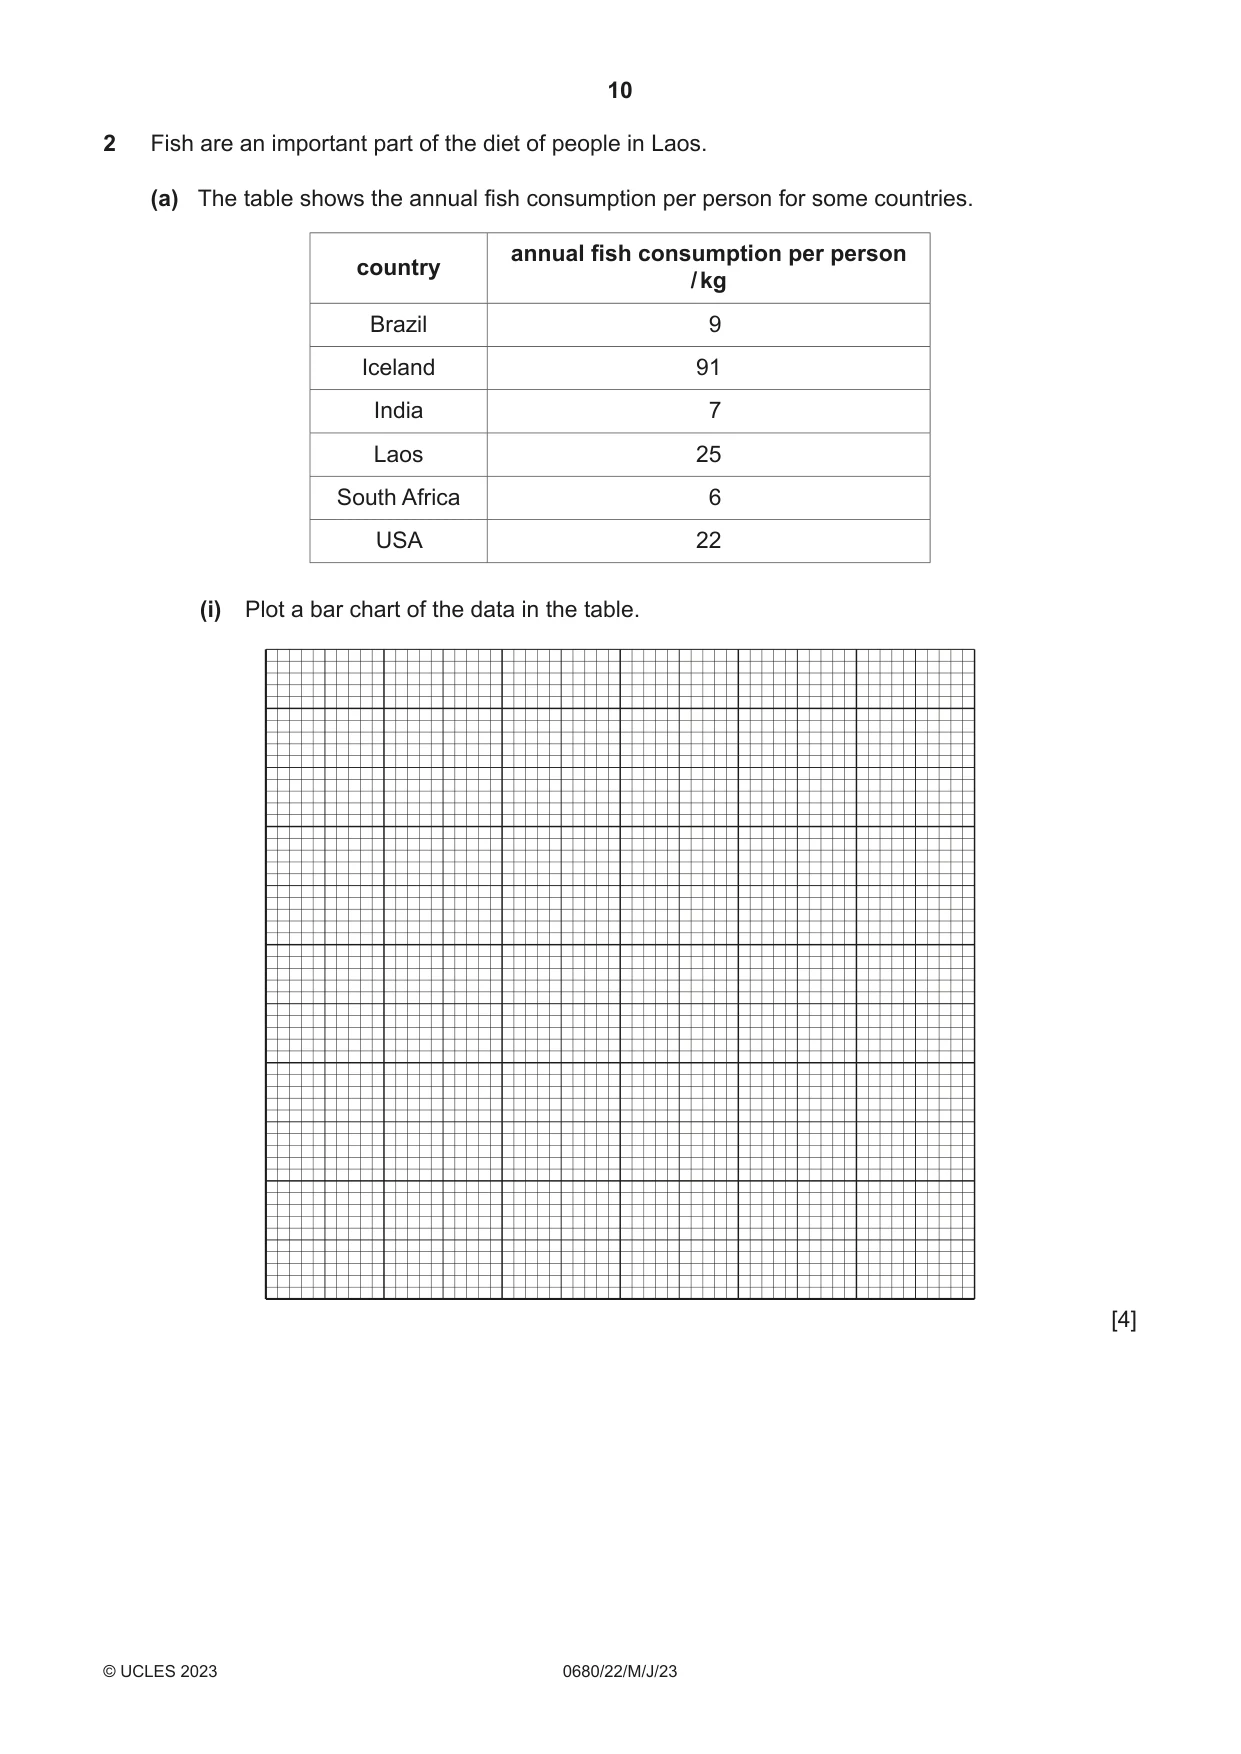
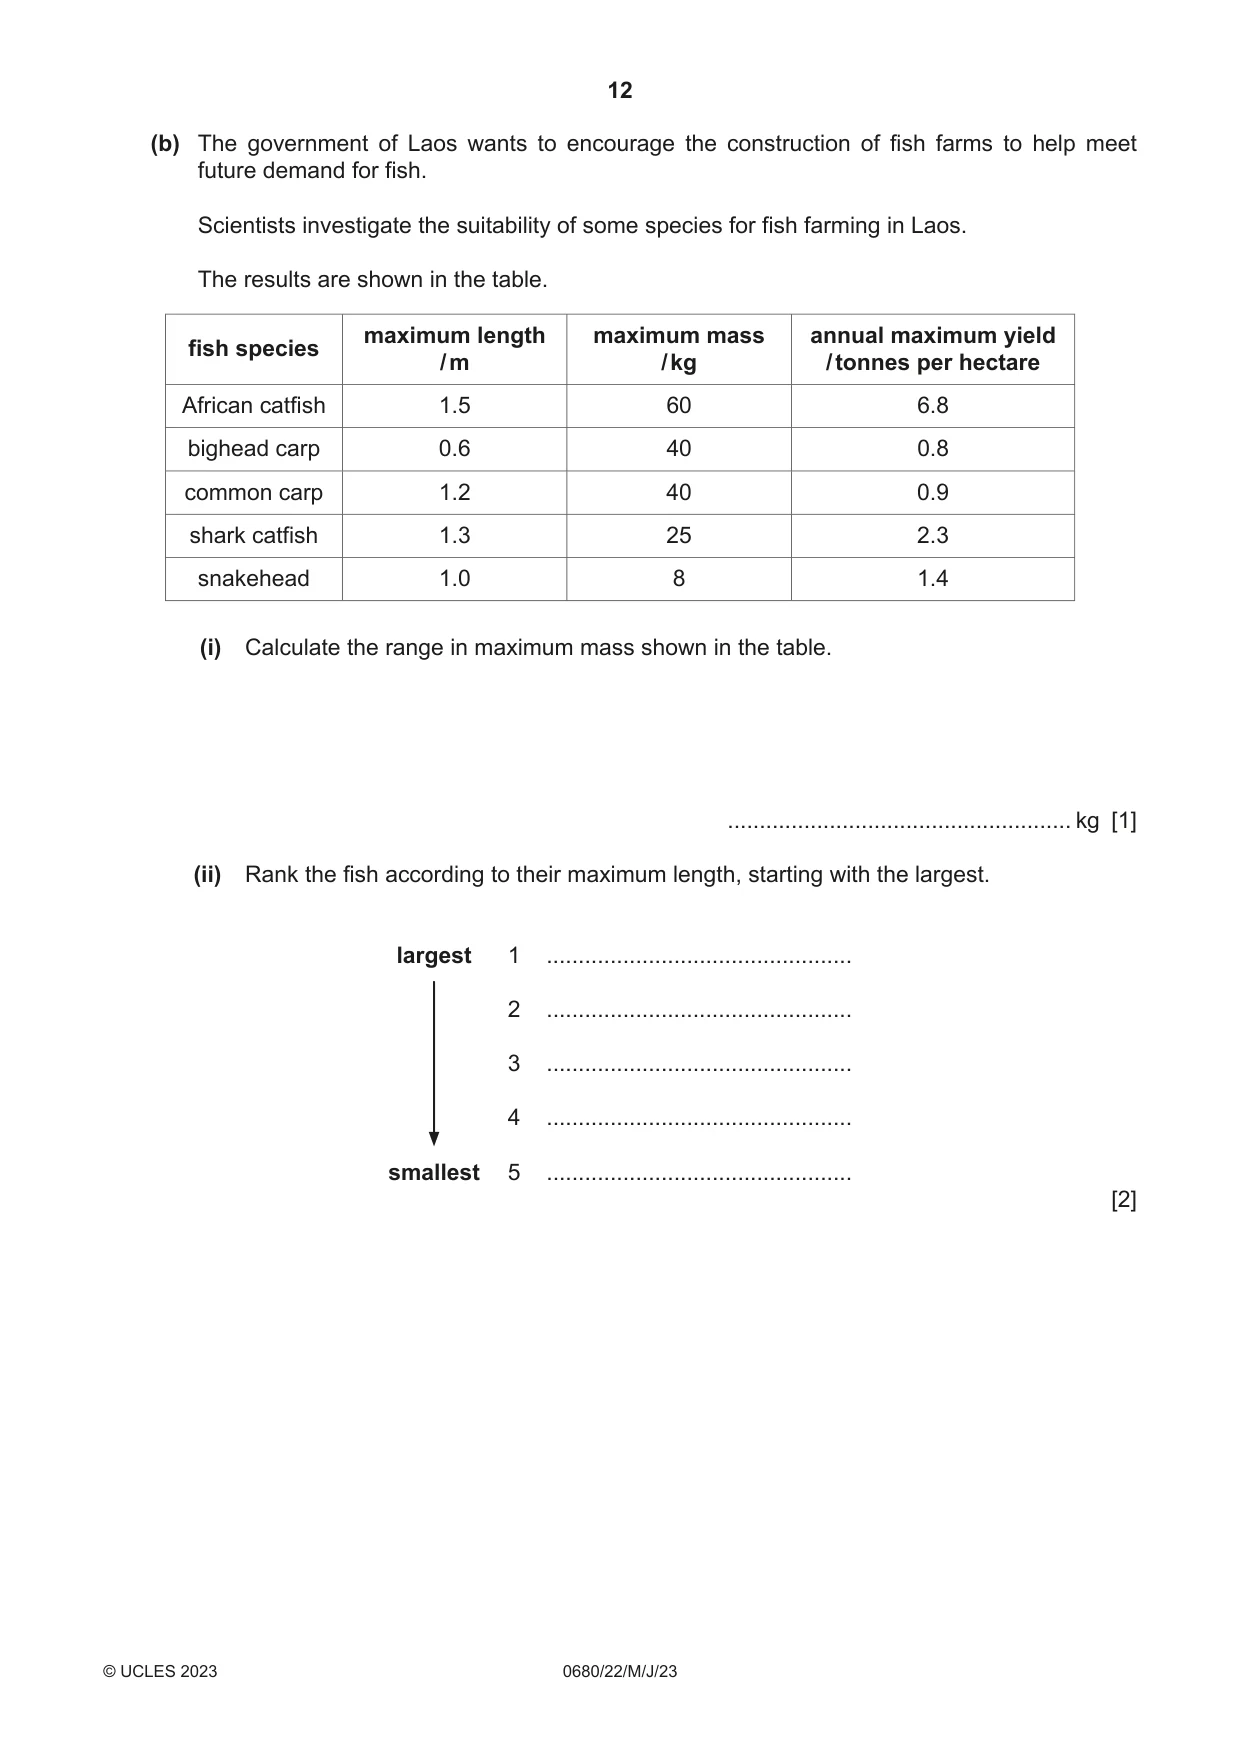
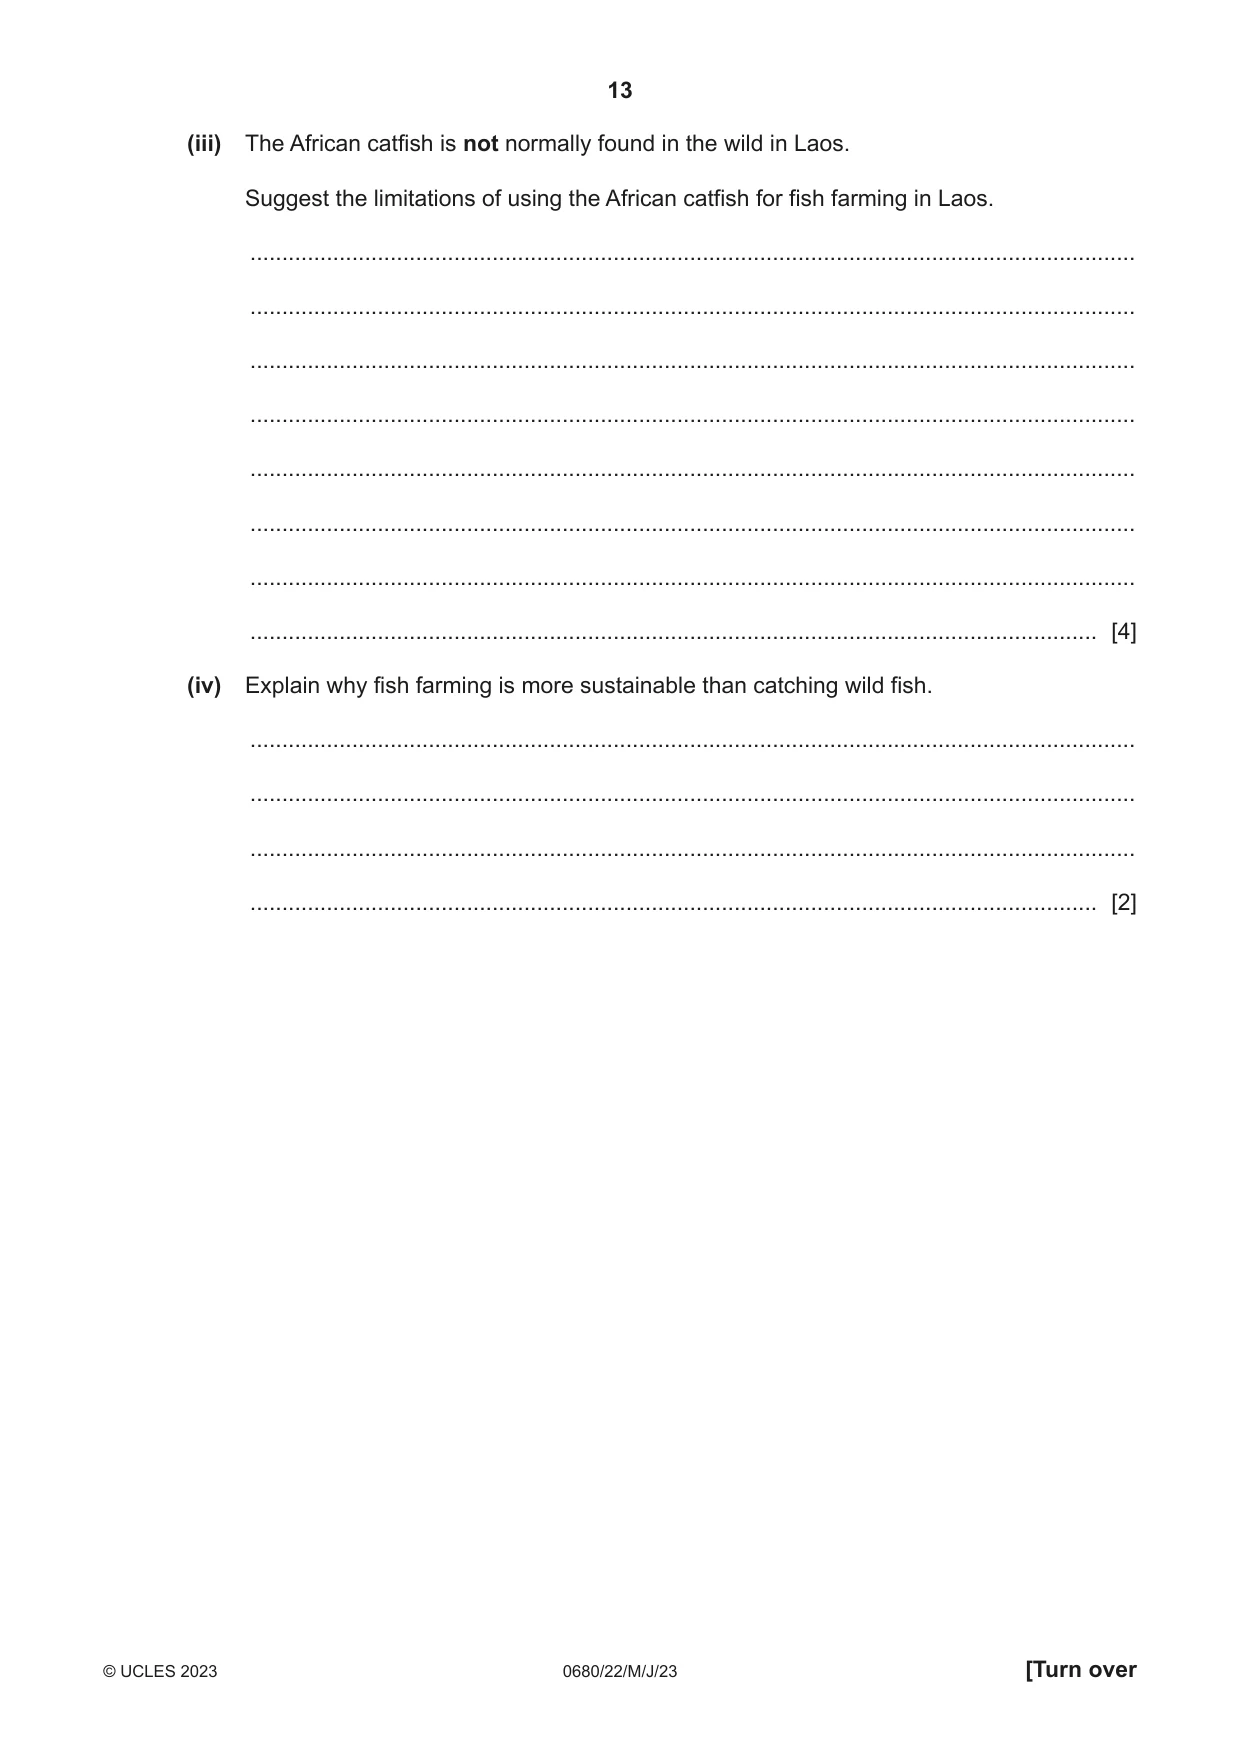
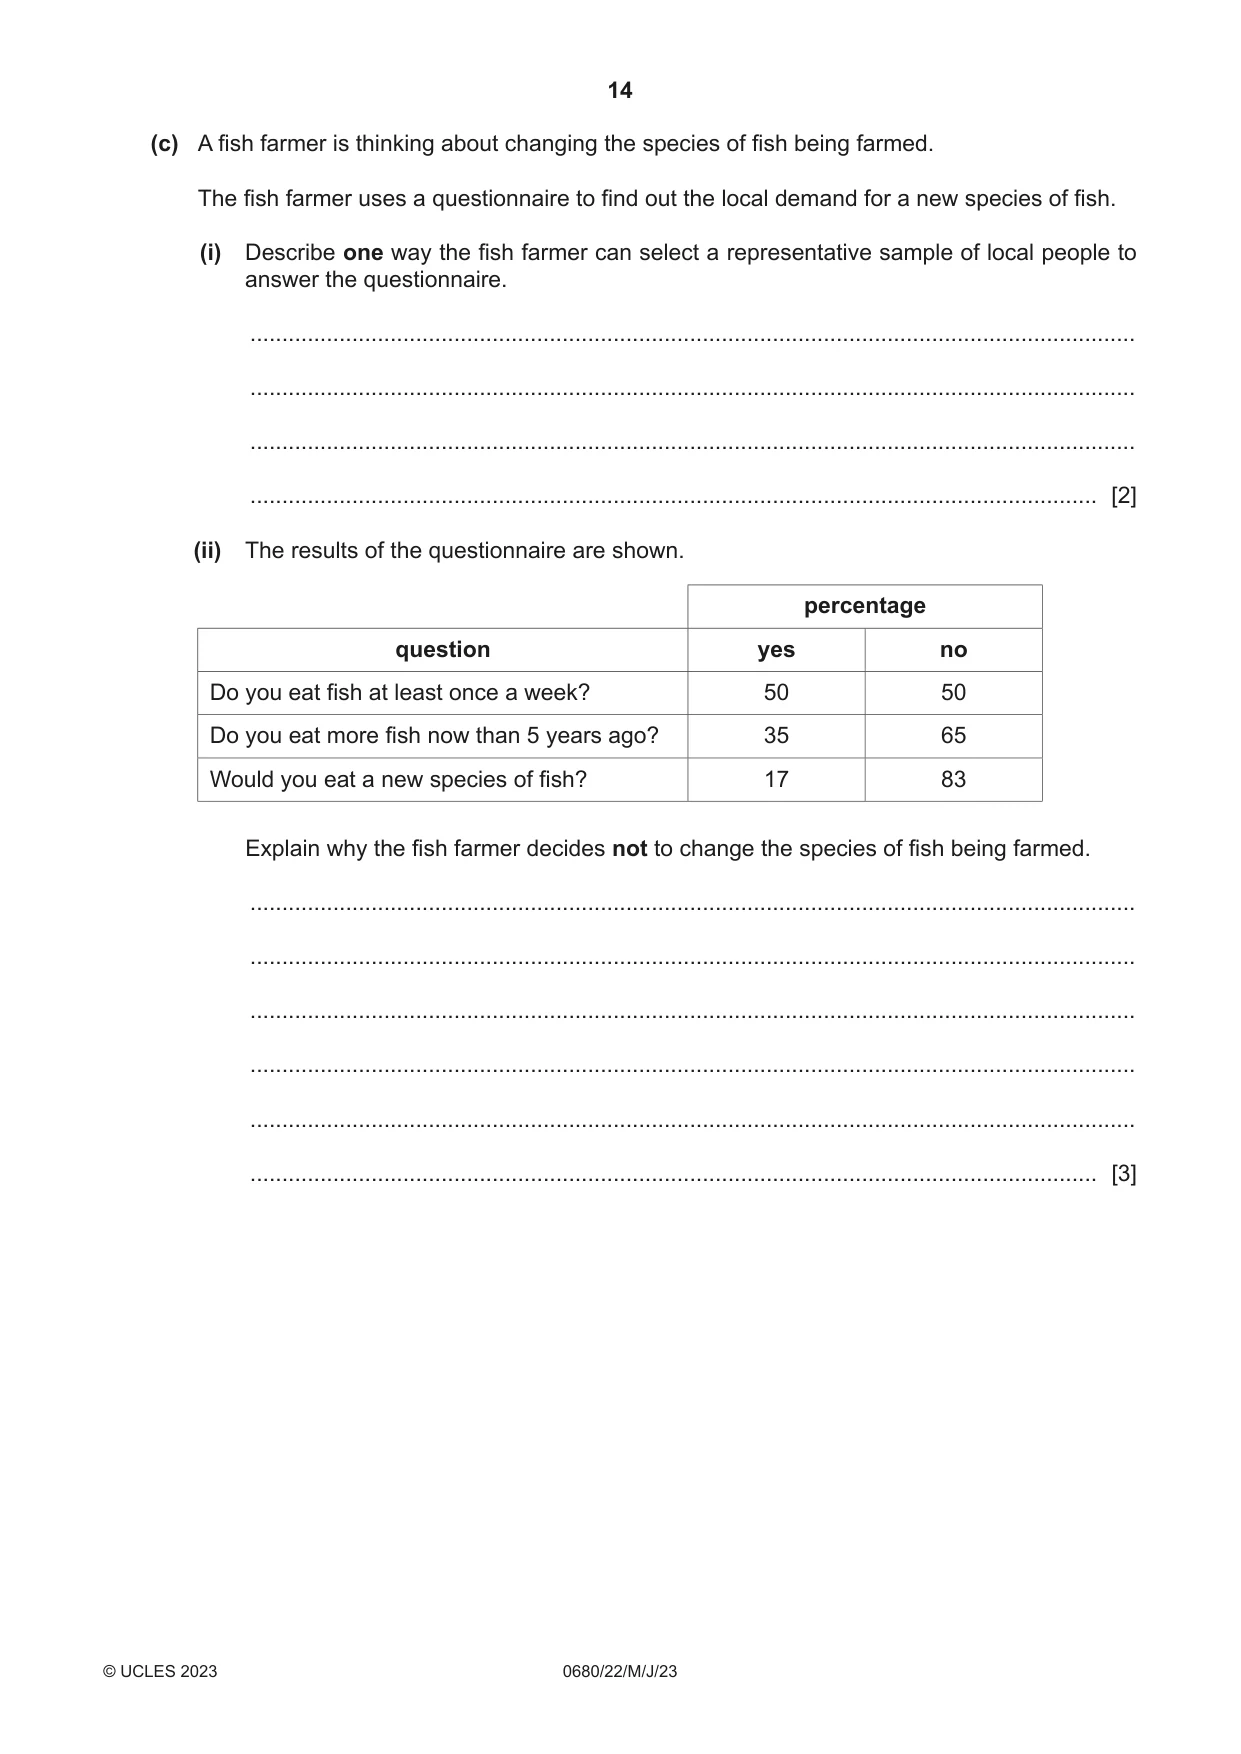
2 Fish are an important part of the diet of people in Laos. (a) The table shows the annual fish consumption per person for some countries. annual fish consumption per person country / kg Brazil 9 Iceland 91 India 7 Laos 25 South Africa 6 USA 22 (i) Plot a bar chart of the data in the table. [4] (ii) Suggest reasons why the annual fish consumption per person varies in different countries. ........................................................................................................................................... ........................................................................................................................................... ........................................................................................................................................... ........................................................................................................................................... ........................................................................................................................................... ..................................................................................................................................... [3] (b) The government of Laos wants to encourage the construction of fish farms to help meet future demand for fish. Scientists investigate the suitability of some species for fish farming in Laos. The results are shown in the table. maximum length maximum mass annual maximum yield fish species / m / kg / tonnes per hectare African catfish 1.5 60 6.8 bighead carp 0.6 40 0.8 common carp 1.2 40 0.9 shark catfish 1.3 25 2.3 snakehead 1.0 8 1.4 (i) Calculate the range in maximum mass shown in the table. ...................................................... kg [1] (ii) Rank the fish according to their maximum length, starting with the largest. largest 1 ................................................ 2 ................................................ 3 ................................................ 4 ................................................ smallest 5 ................................................ [2] (iii) The African catfish is not normally found in the wild in Laos. Suggest the limitations of using the African catfish for fish farming in Laos. ........................................................................................................................................... ........................................................................................................................................... ........................................................................................................................................... ........................................................................................................................................... ........................................................................................................................................... ........................................................................................................................................... ........................................................................................................................................... ..................................................................................................................................... [4] (iv) Explain why fish farming is more sustainable than catching wild fish. ........................................................................................................................................... ........................................................................................................................................... ........................................................................................................................................... ..................................................................................................................................... [2] (c) A fish farmer is thinking about changing the species of fish being farmed. The fish farmer uses a questionnaire to find out the local demand for a new species of fish. (i) Describe one way the fish farmer can select a representative sample of local people to answer the questionnaire. ........................................................................................................................................... ........................................................................................................................................... ........................................................................................................................................... ..................................................................................................................................... [2] (ii) The results of the questionnaire are shown. percentage question yes no Do you eat fish at least once a week? 50 50 Do you eat more fish now than 5 years ago? 35 65 Would you eat a new species of fish? 17 83 Explain why the fish farmer decides not to change the species of fish being farmed. ........................................................................................................................................... ........................................................................................................................................... ........................................................................................................................................... ........................................................................................................................................... ........................................................................................................................................... ..................................................................................................................................... [3] (iii) State three abiotic factors that affect the growth of farmed fish. 1 ........................................................................................................................................ 2 ........................................................................................................................................ 3 ........................................................................................................................................ [3] (iv) Some fish eat water plants and other fish eat mainly insects. Explain why the farming of plant-eating fish is more energy efficient than the farming of insect-eating fish. ........................................................................................................................................... ........................................................................................................................................... ........................................................................................................................................... ..................................................................................................................................... [2] [Total: 26]
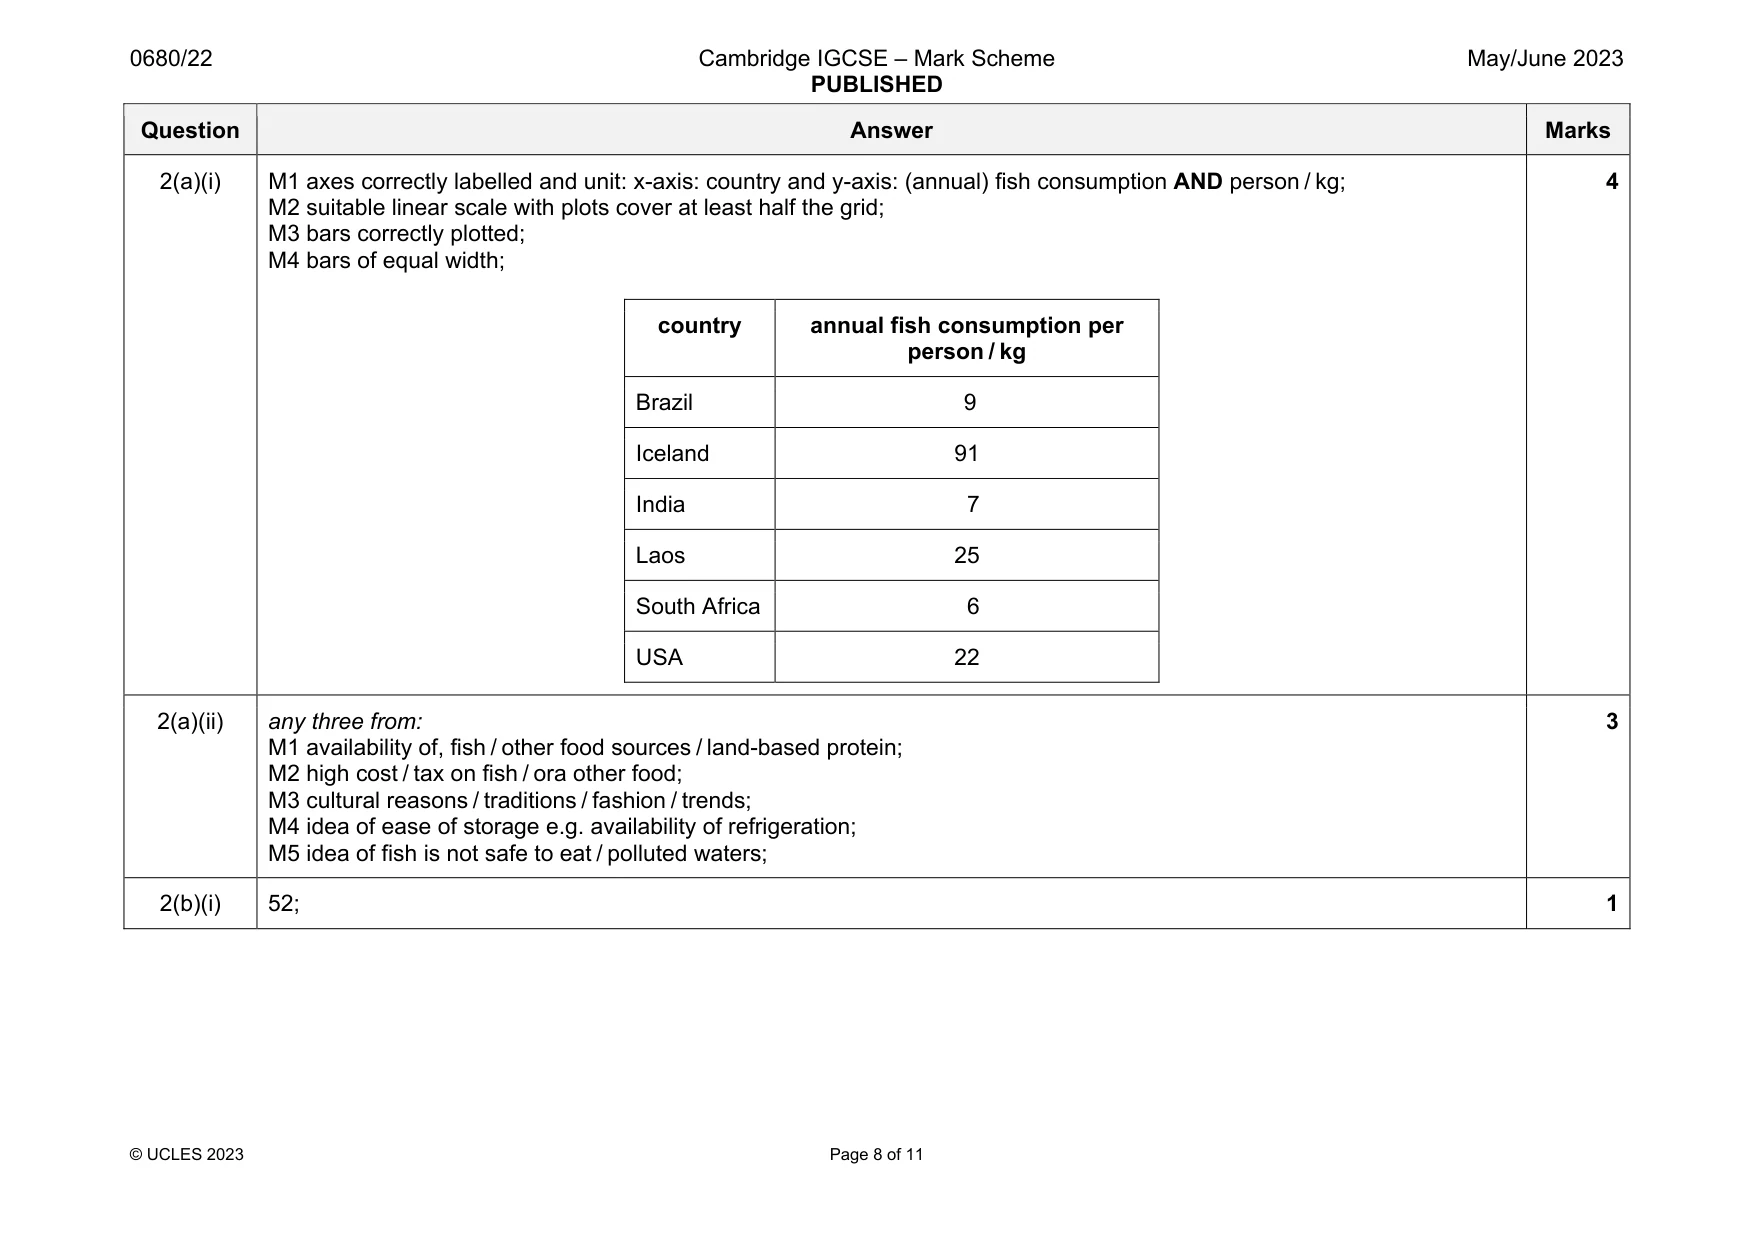
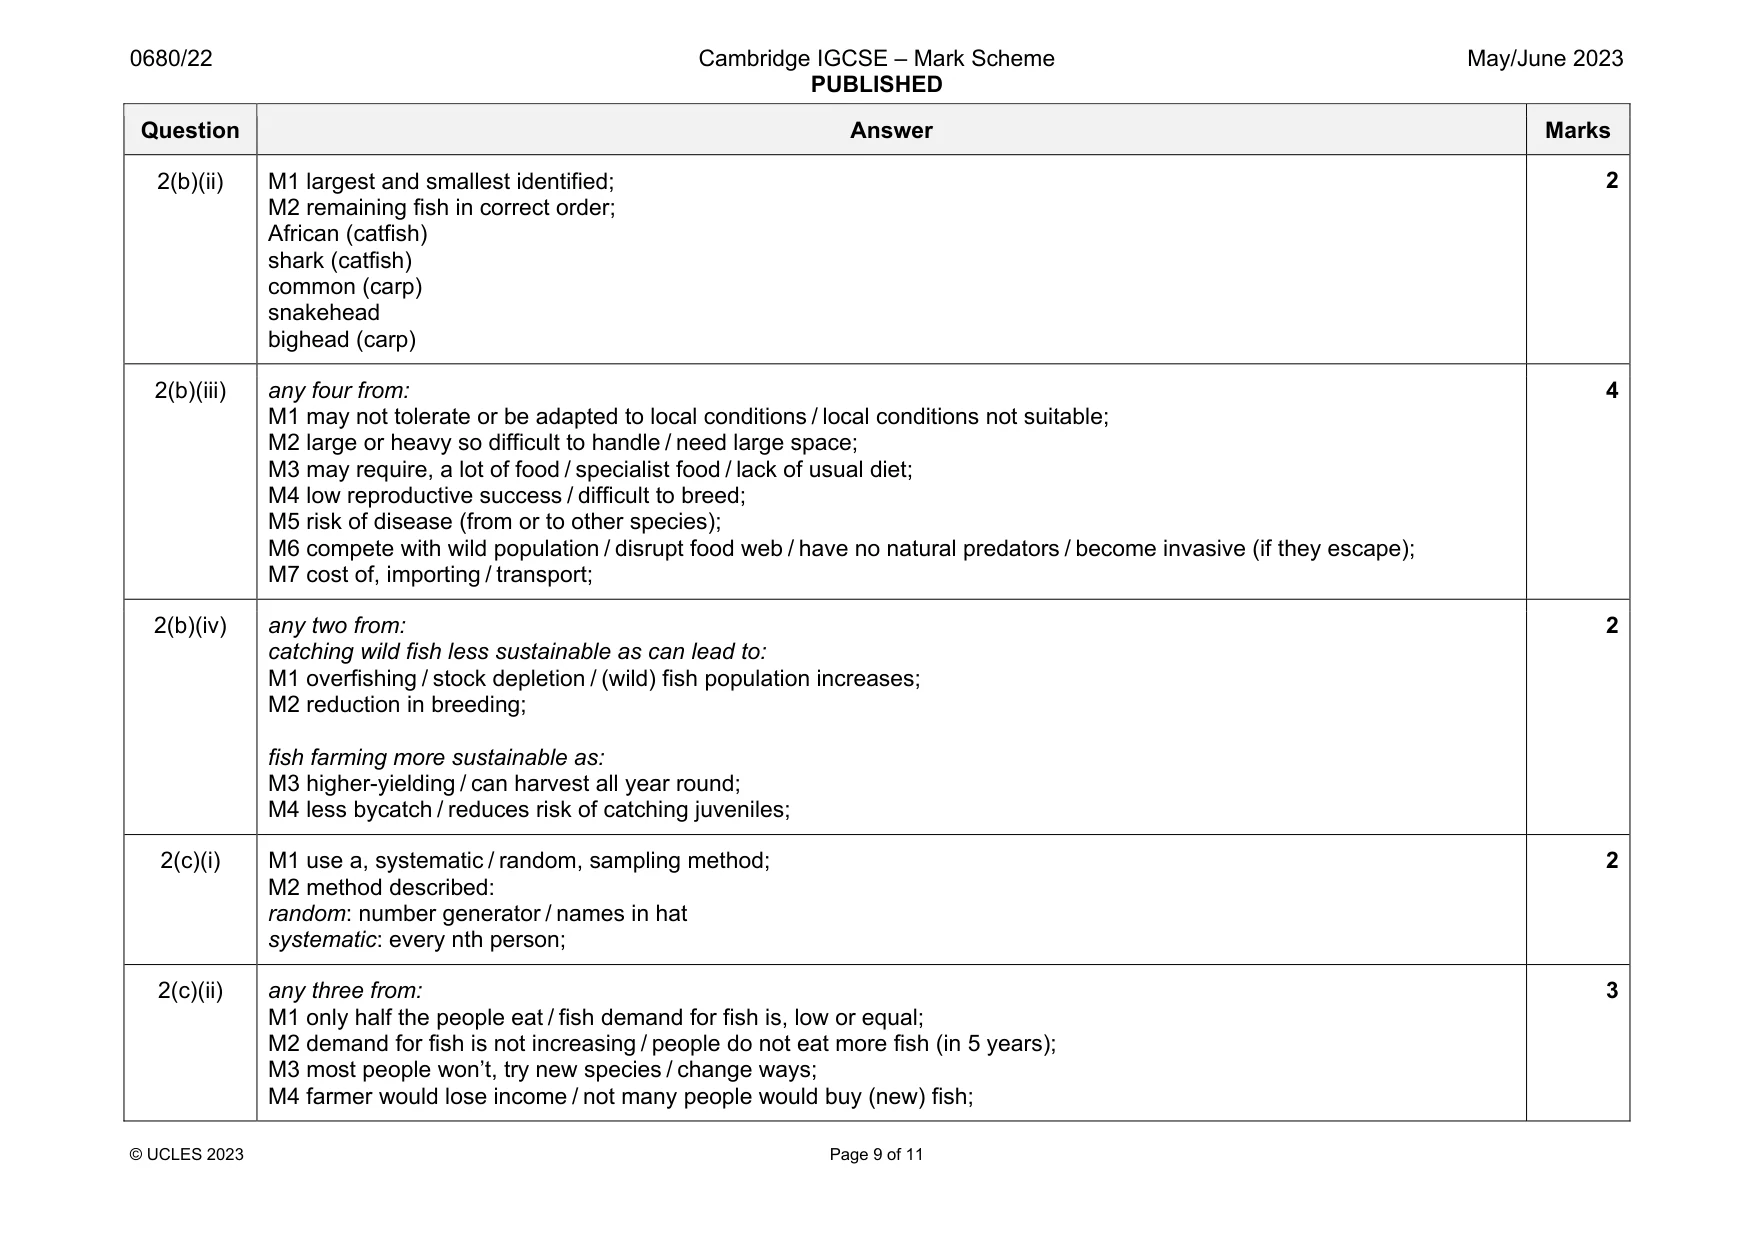
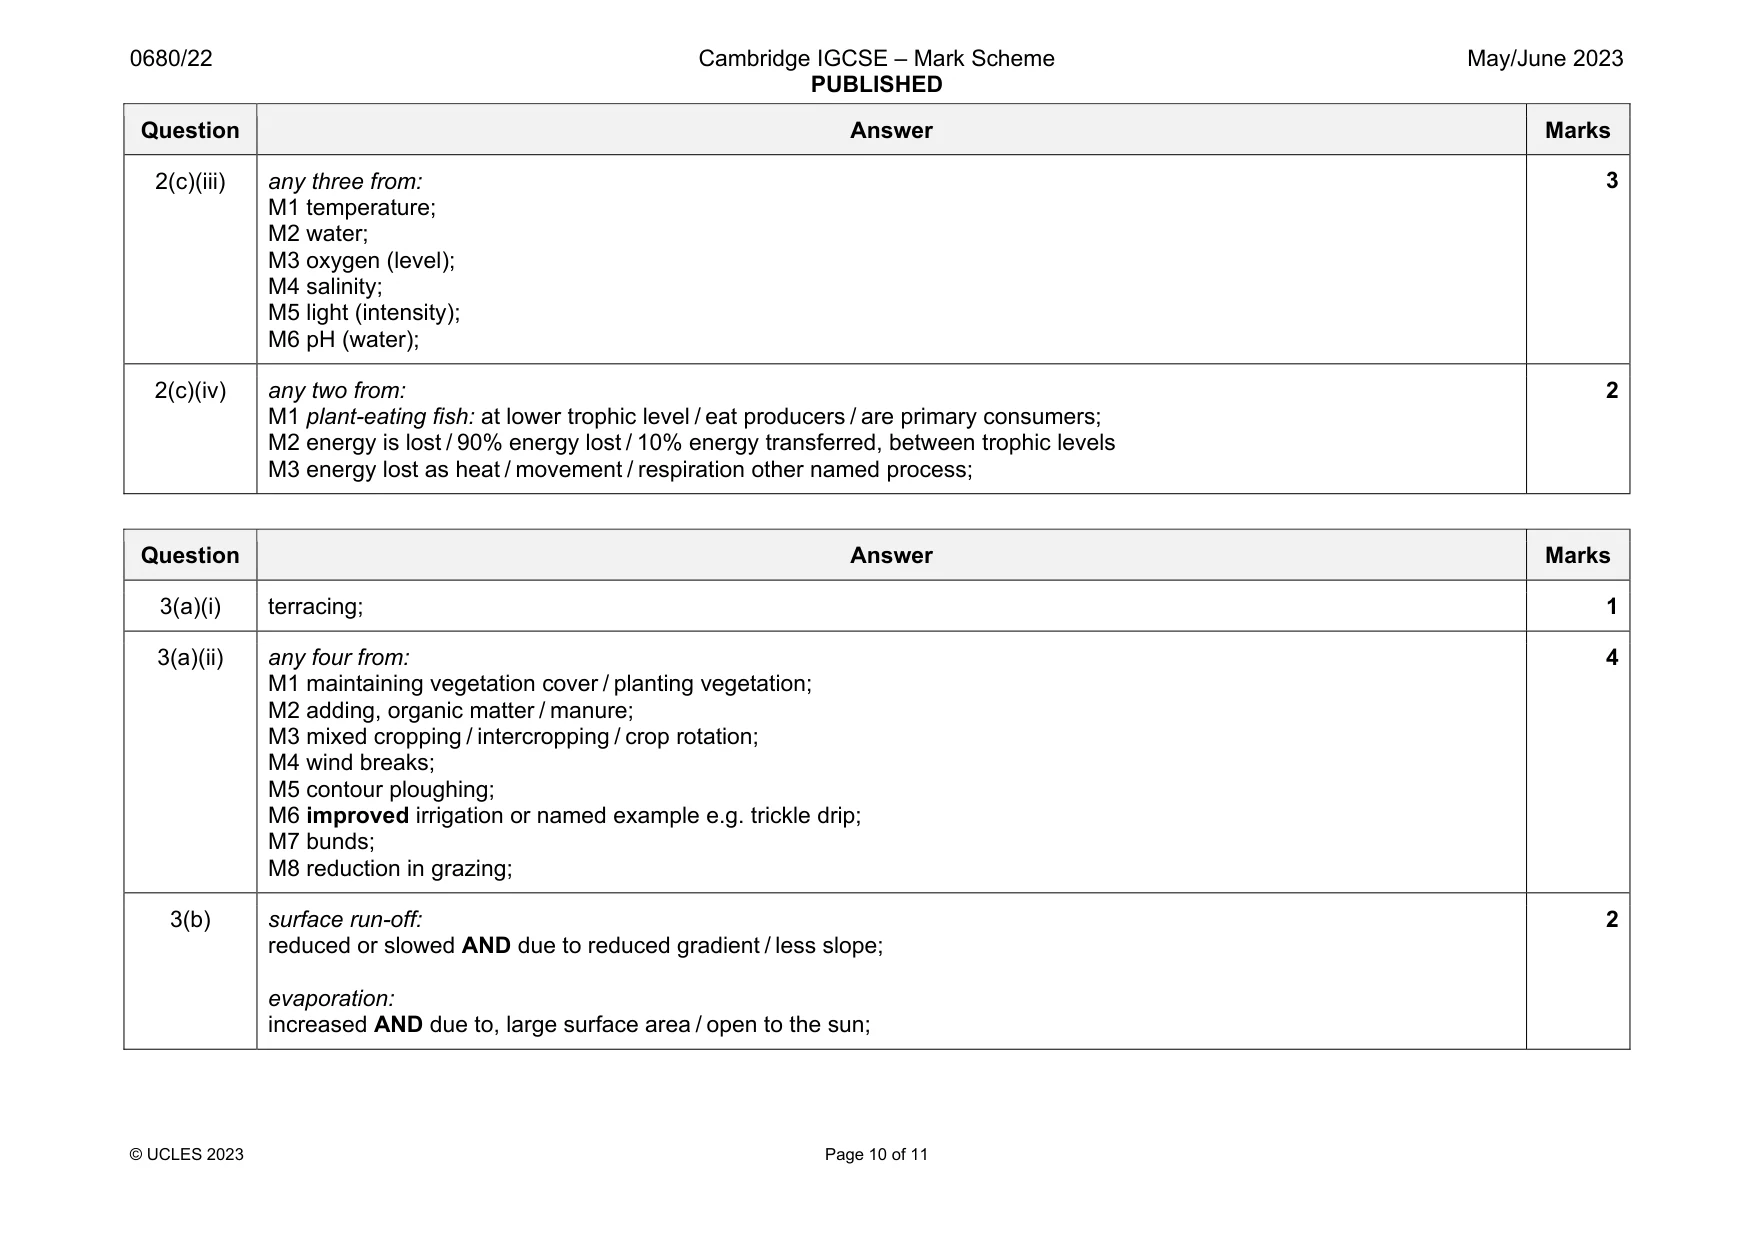
Mark scheme: 2(a)(i) M1 axes correctly labelled and unit: x-axis: country and y-axis: (annual) fish consumption AND person / kg; M2 suitable linear scale with plots cover at least half the grid; M3 bars correctly plotted; M4 bars of equal width; country annual fish consumption per person / kg Brazil 9 Iceland 91 India 7 Laos 25 South Africa 6 USA 22 4 2(a)(ii) any three from: M1 availability of, fish / other food sources / land-based protein; M2 high cost / tax on fish / ora other food; M3 cultural reasons / traditions / fashion / trends; M4 idea of ease of storage e.g. availability of refrigeration; M5 idea of fish is not safe to eat / polluted waters; 3 2(b)(i) 52; 1 Question Answer Marks 2(b)(ii) M1 largest and smallest identified; M2 remaining fish in correct order; African (catfish) shark (catfish) common (carp) snakehead bighead (carp) 2 2(b)(iii) any four from: M1 may not tolerate or be adapted to local conditions / local conditions not suitable; M2 large or heavy so difficult to handle / need large space; M3 may require, a lot of food / specialist food / lack of usual diet; M4 low reproductive success / difficult to breed; M5 risk of disease (from or to other species); M6 compete with wild population / disrupt food web / have no natural predators / become invasive (if they escape); M7 cost of, importing / transport; 4 2(b)(iv) any two from: catching wild fish less sustainable as can lead to: M1 overfishing / stock depletion / (wild) fish population increases; M2 reduction in breeding; fish farming more sustainable as: M3 higher-yielding / can harvest all year round; M4 less bycatch / reduces risk of catching juveniles; 2 2(c)(i) M1 use a, systematic / random, sampling method; M2 method described: random: number generator / names in hat systematic: every nth person; 2 2(c)(ii) any three from: M1 only half the people eat / fish demand for fish is, low or equal; M2 demand for fish is not increasing / people do not eat more fish (in 5 years); M3 most people won’t, try new species / change ways; M4 farmer would lose income / not many people would buy (new) fish; 3 Question Answer Marks 2(c)(iii) any three from: M1 temperature; M2 water; M3 oxygen (level); M4 salinity; M5 light (intensity); M6 pH (water); 3 2(c)(iv) any two from: M1 plant-eating fish: at lower trophic level / eat producers / are primary consumers; M2 energy is lost / 90% energy lost / 10% energy transferred, between trophic levels M3 energy lost as heat / movement / respiration other named process; 2
Q3 · The photograph shows a farmer preparing some fields for rice production
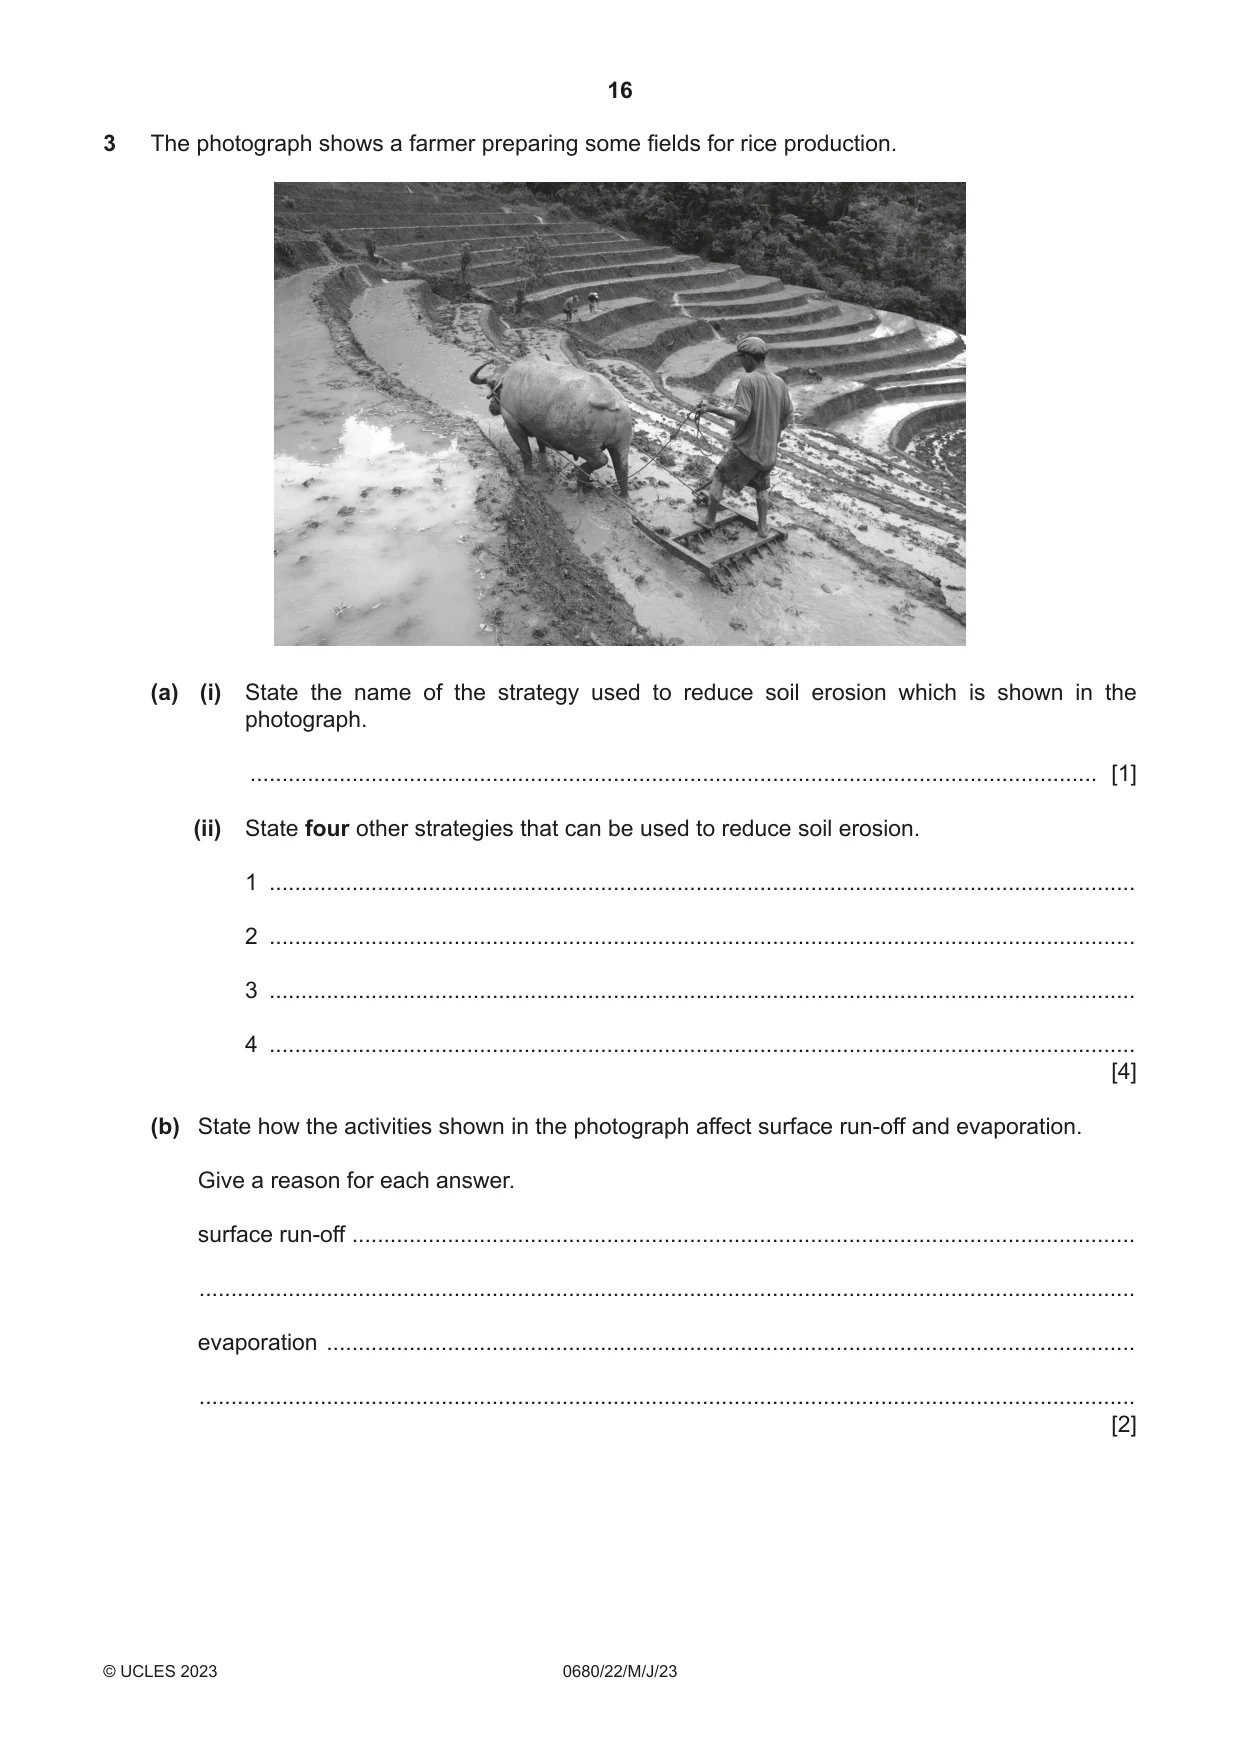
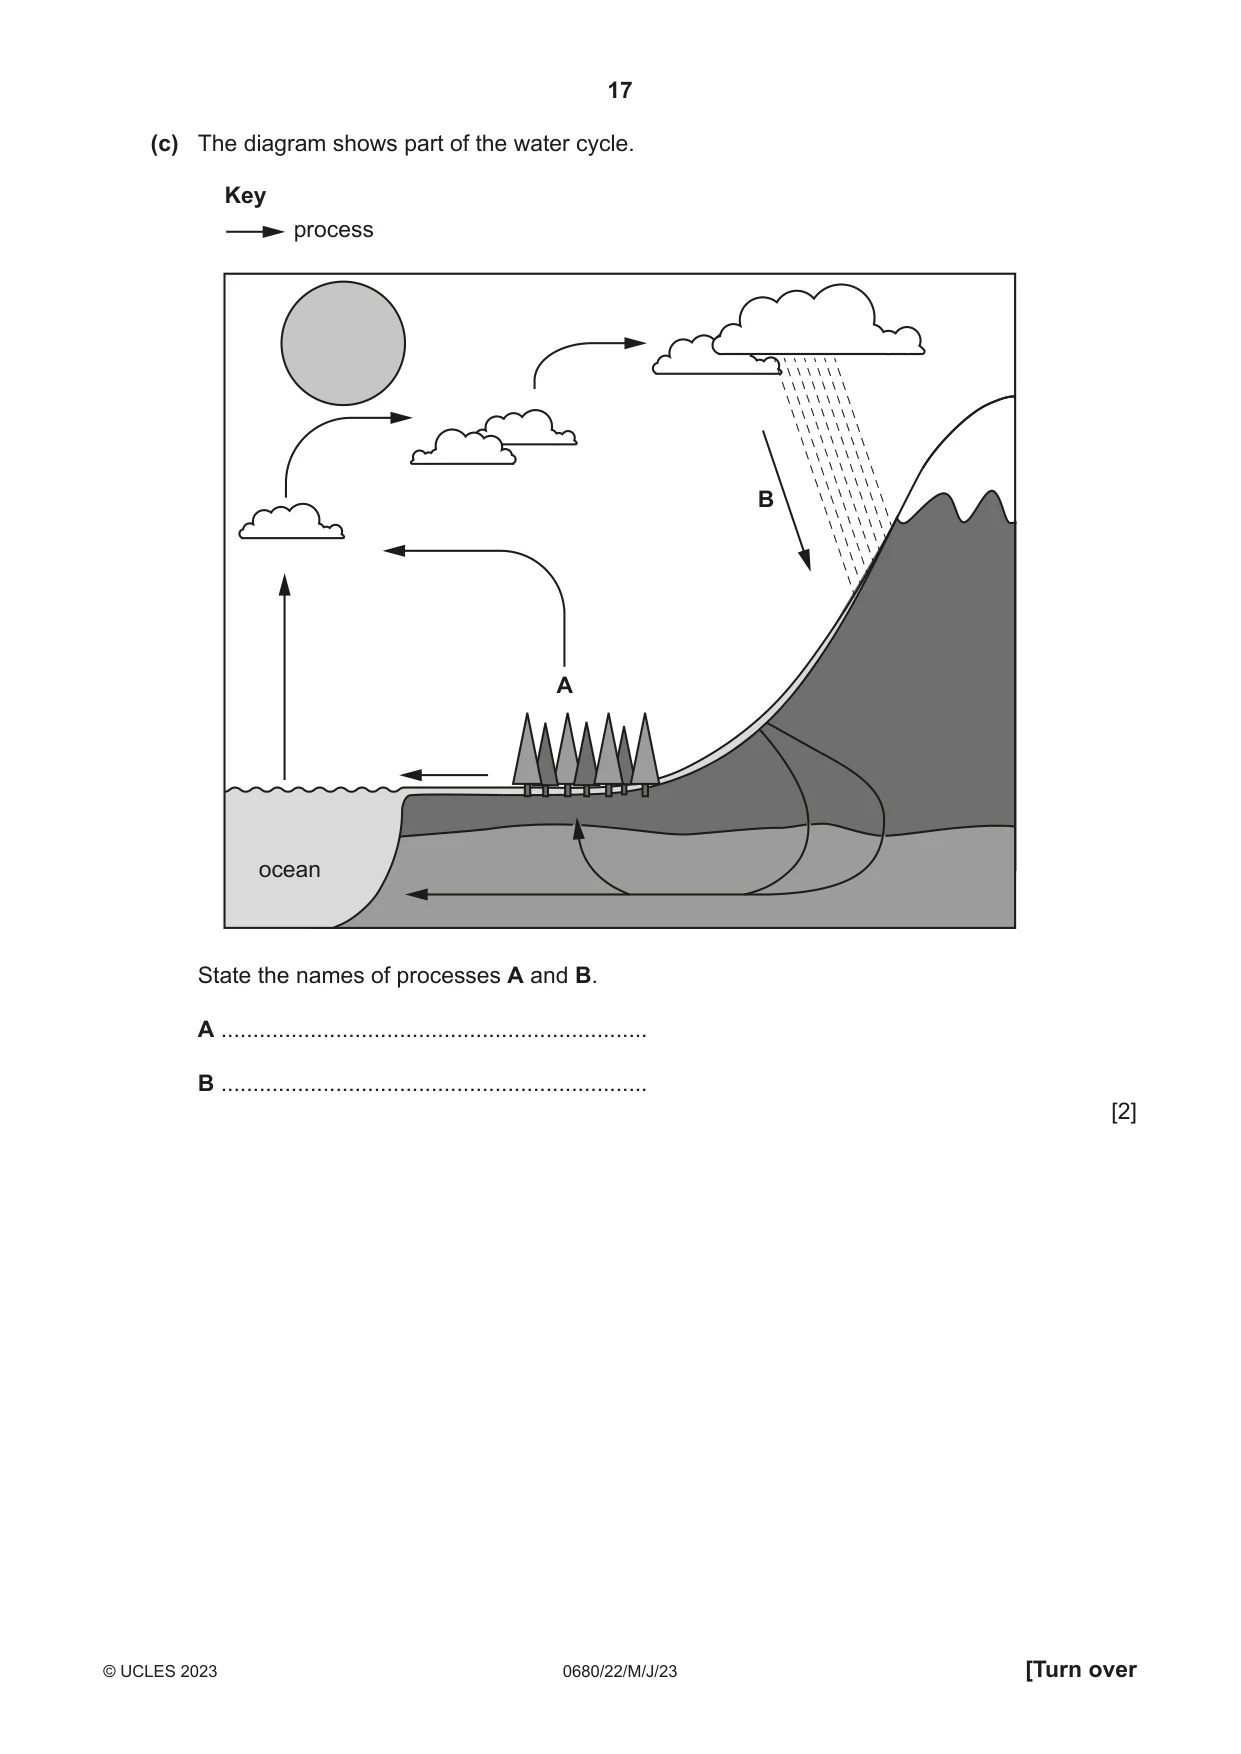
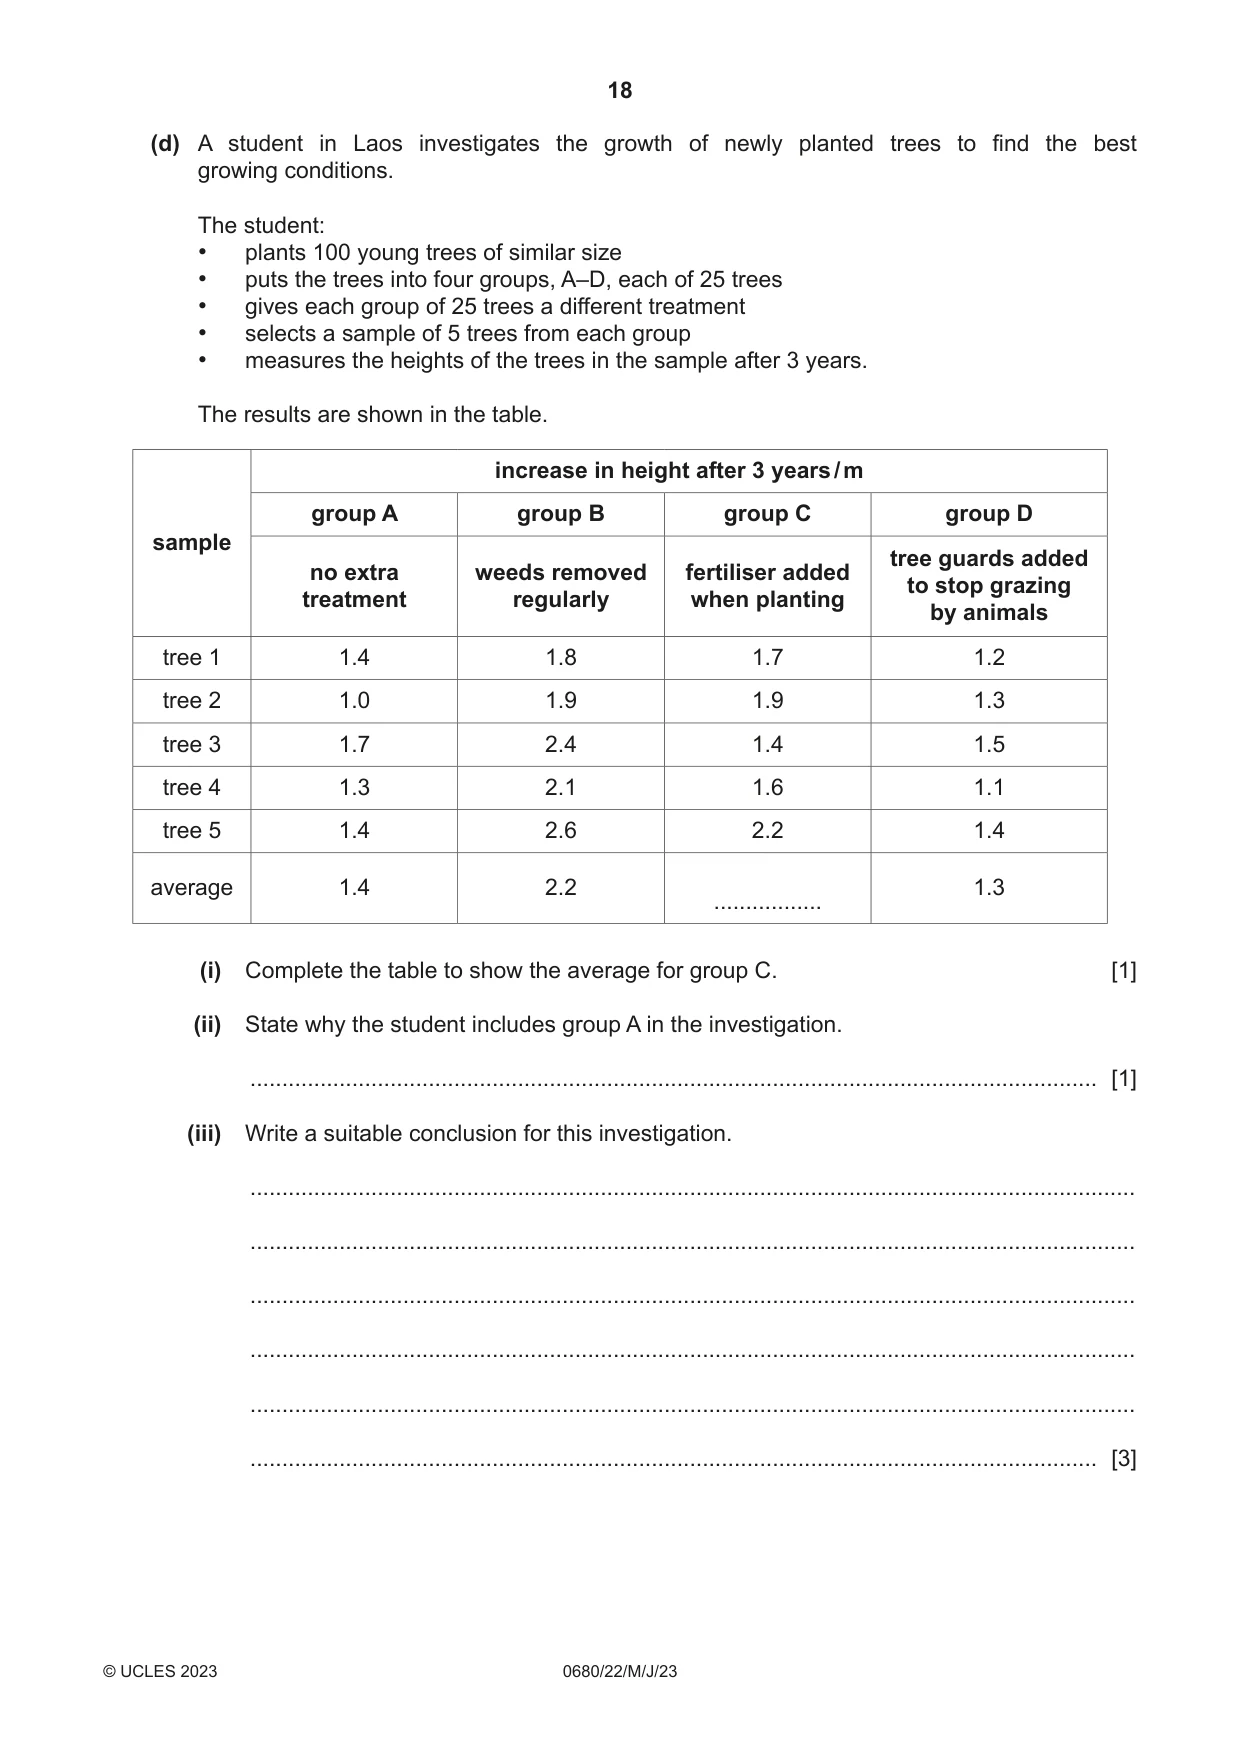
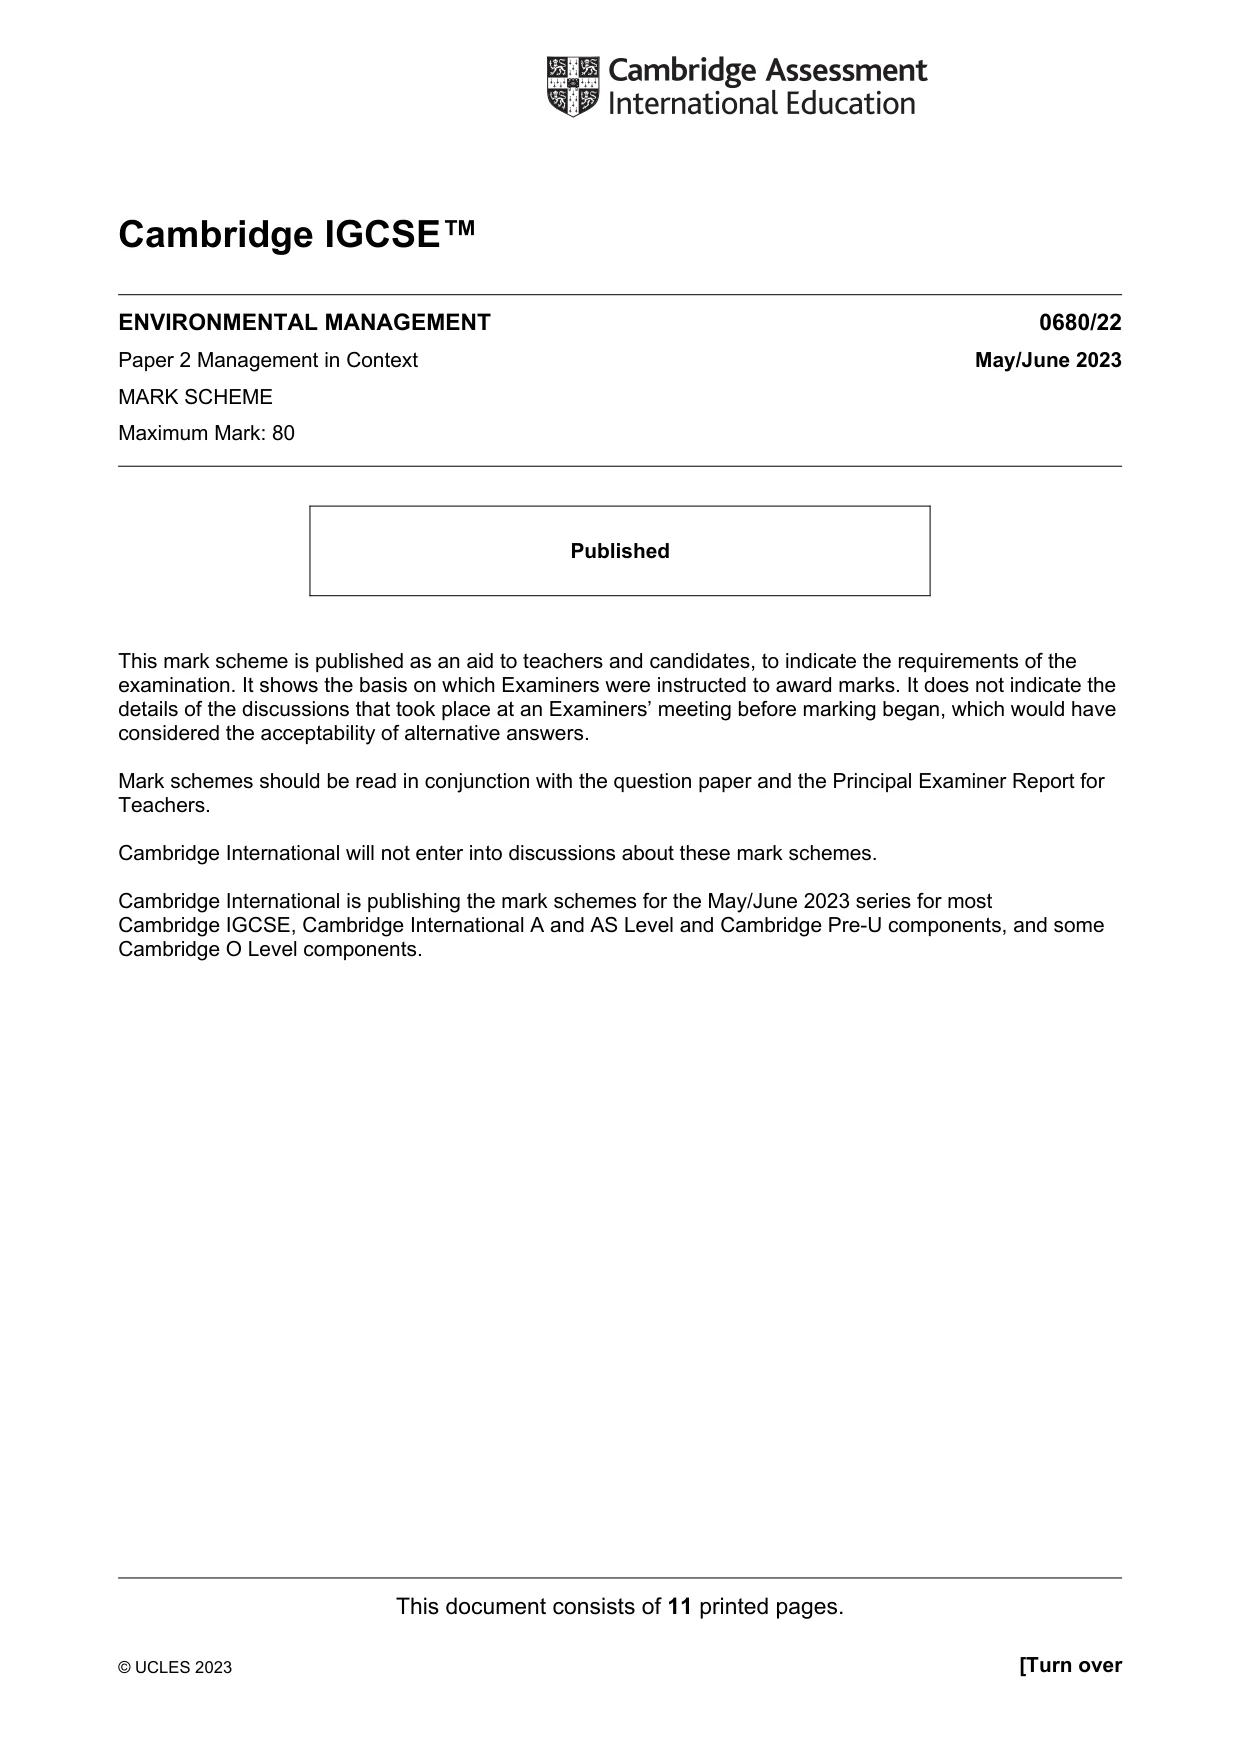
3 The photograph shows a farmer preparing some fields for rice production. (a) (i) State the name of the strategy used to reduce soil erosion which is shown in the photograph. ..................................................................................................................................... [1] (ii) State four other strategies that can be used to reduce soil erosion. 1 ........................................................................................................................................ 2 ........................................................................................................................................ 3 ........................................................................................................................................ 4 ........................................................................................................................................ [4] (b) State how the activities shown in the photograph affect surface run-off and evaporation. Give a reason for each answer. surface run-off ........................................................................................................................... ................................................................................................................................................... evaporation ............................................................................................................................... ................................................................................................................................................... [2] (c) The diagram shows part of the water cycle. Key process B A ocean State the names of processes A and B. A ................................................................... B ................................................................... [2] (d) A student in Laos investigates the growth of newly planted trees to find the best growing conditions. The student: • plants 100 young trees of similar size • puts the trees into four groups, A–D, each of 25 trees • gives each group of 25 trees a different treatment • selects a sample of 5 trees from each group • measures the heights of the trees in the sample after 3 years. The results are shown in the table. increase in height after 3 years / m group A group B group C group D sample tree guards added no extra weeds removed fertiliser added to stop grazing treatment regularly when planting by animals tree 1 1.4 1.8 1.7 1.2 tree 2 1.0 1.9 1.9 1.3 tree 3 1.7 2.4 1.4 1.5 tree 4 1.3 2.1 1.6 1.1 tree 5 1.4 2.6 2.2 1.4 average 1.4 2.2 1.3 ................. (i) Complete the table to show the average for group C. [1] (ii) State why the student includes group A in the investigation. ..................................................................................................................................... [1] (iii) Write a suitable conclusion for this investigation. ........................................................................................................................................... ........................................................................................................................................... ........................................................................................................................................... ........................................................................................................................................... ........................................................................................................................................... ..................................................................................................................................... [3]
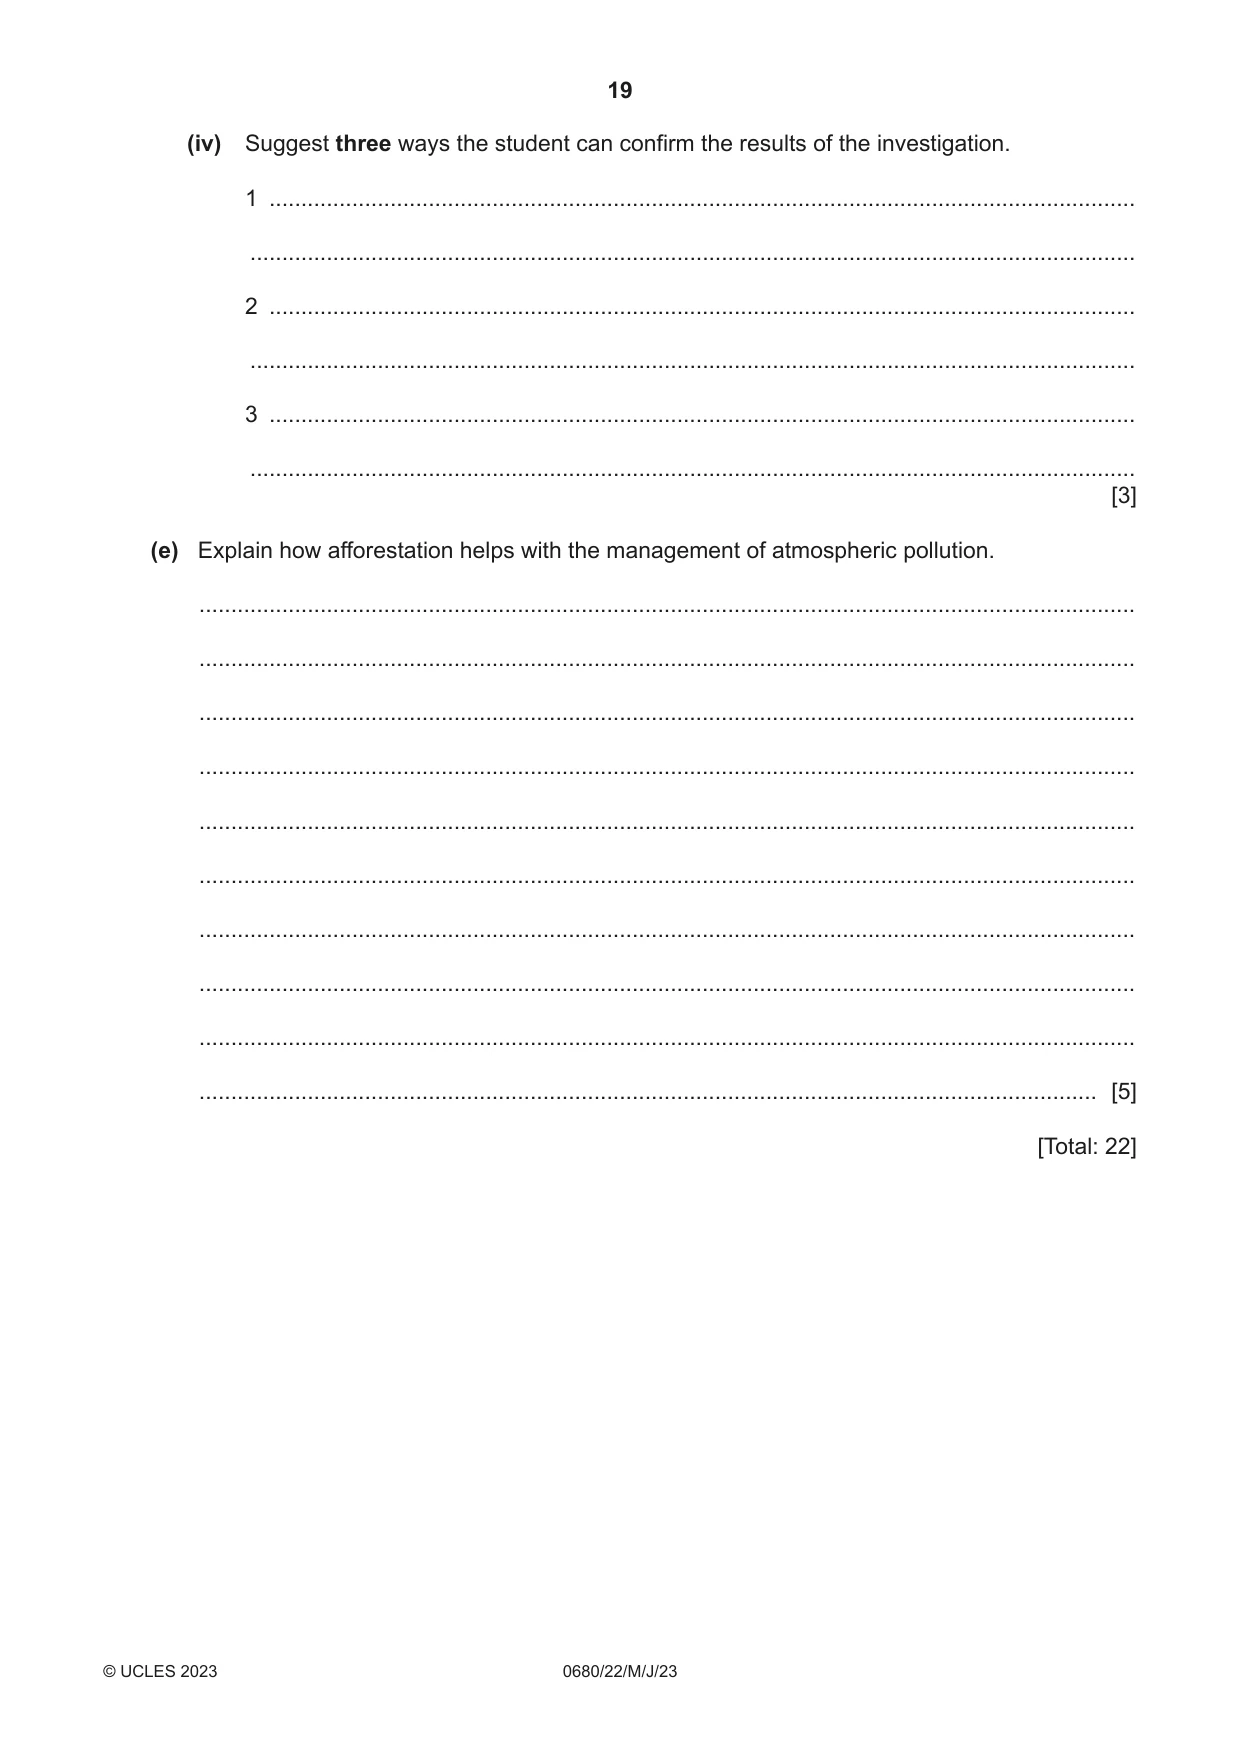
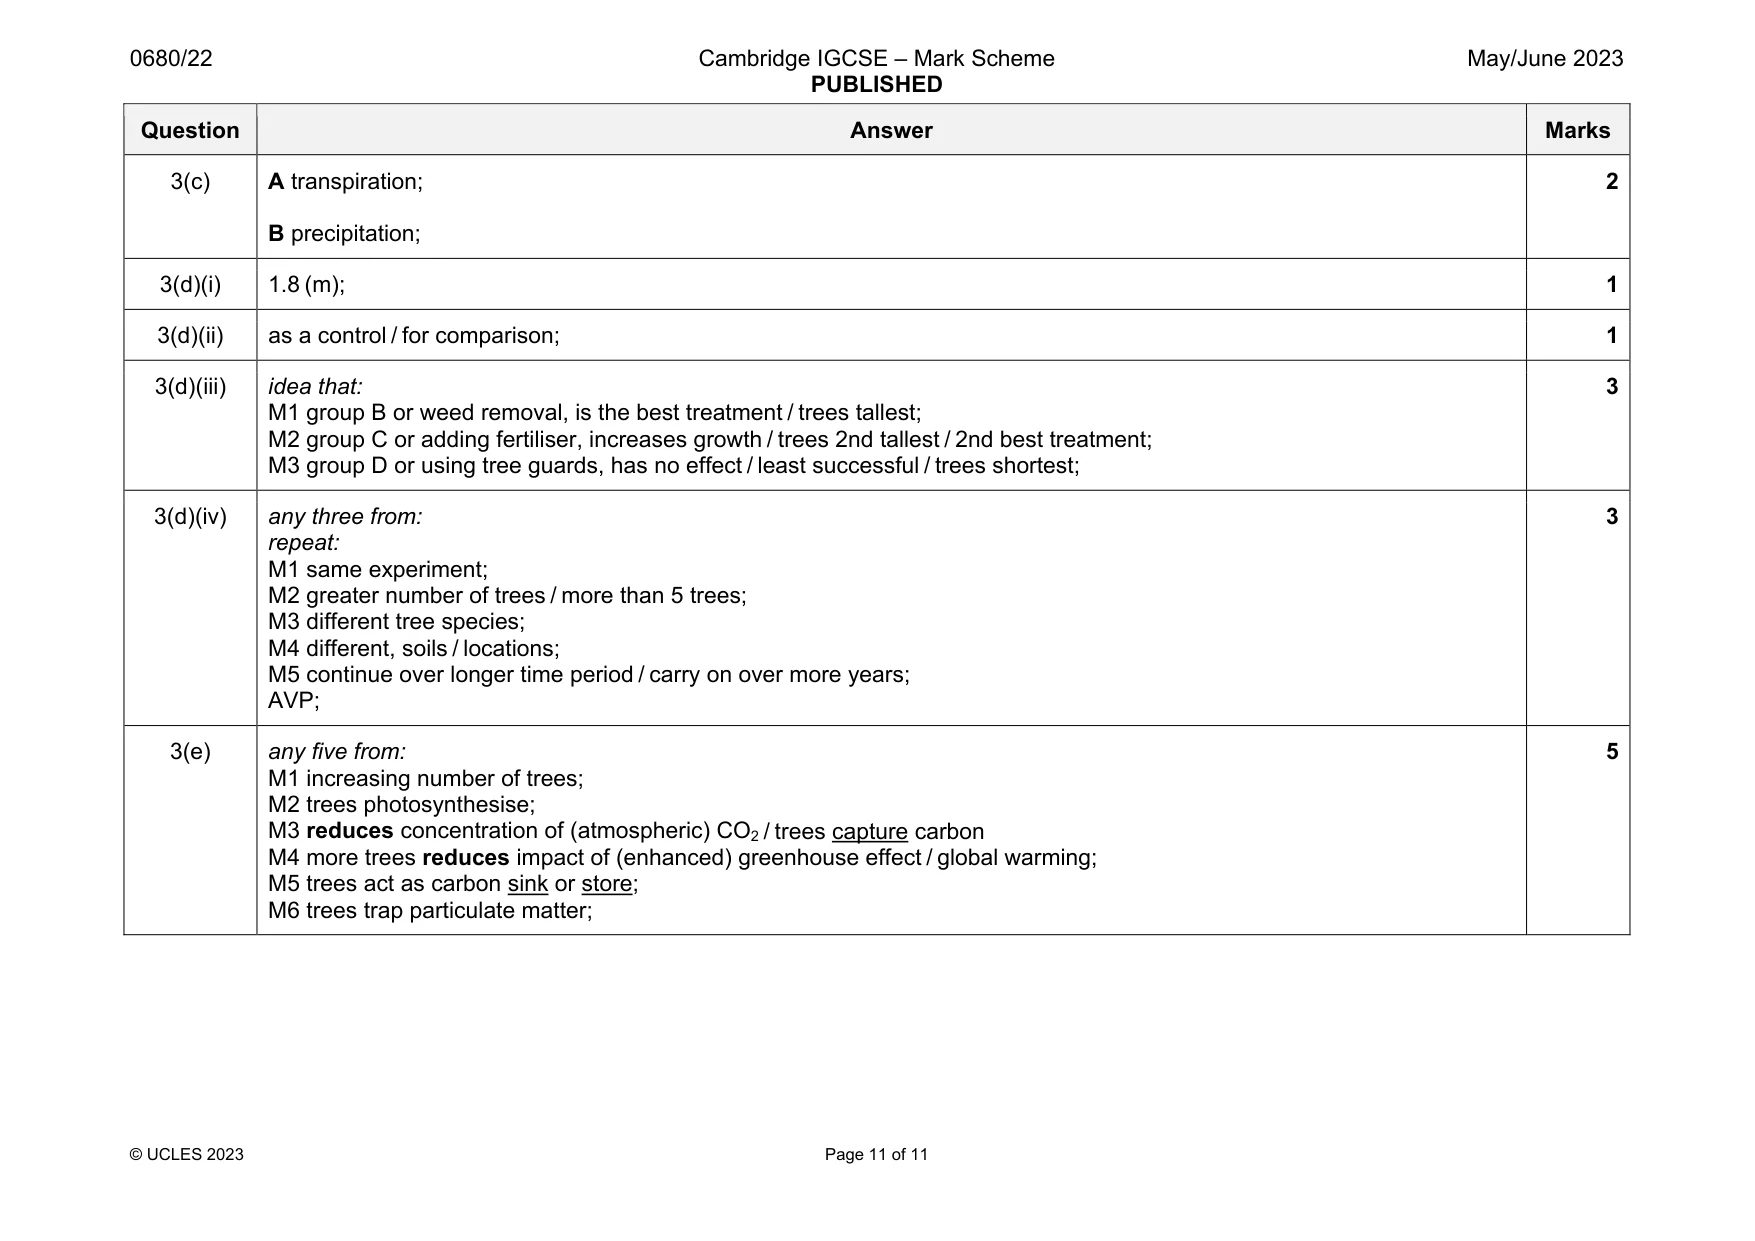
Mark scheme: 3(a)(i) terracing; 1 3(a)(ii) any four from: M1 maintaining vegetation cover / planting vegetation; M2 adding, organic matter / manure; M3 mixed cropping / intercropping / crop rotation; M4 wind breaks; M5 contour ploughing; M6 improved irrigation or named example e.g. trickle drip; M7 bunds; M8 reduction in grazing; 4 3(b) surface run-off: reduced or slowed AND due to reduced gradient / less slope; evaporation: increased AND due to, large surface area / open to the sun; 2 Question Answer Marks 3(c) A transpiration; B precipitation; 2 3(d)(i) 1.8 (m); 1 3(d)(ii) as a control / for comparison; 1 3(d)(iii) idea that: M1 group B or weed removal, is the best treatment / trees tallest; M2 group C or adding fertiliser, increases growth / trees 2nd tallest / 2nd best treatment; M3 group D or using tree guards, has no effect / least successful / trees shortest; 3 3(d)(iv) any three from: repeat: M1 same experiment; M2 greater number of trees / more than 5 trees; M3 different tree species; M4 different, soils / locations; M5 continue over longer time period / carry on over more years; AVP; 3 3(e) any five from: M1 increasing number of trees; M2 trees photosynthesise; M3 reduces concentration of (atmospheric) CO2 / trees capture carbon M4 more trees reduces impact of (enhanced) greenhouse effect / global warming; M5 trees act as carbon sink or store; M6 trees trap particulate matter; 5
What was in this paper
The subtopics covered by these 3 questions, and how many questions each got. Open one in a new tab to see every Cambridge question on it.
What you needed in this session
Cambridge’s own grade thresholds for 2023 May/June, Paper 2 · Variant 2. A higher threshold means an easier paper — the bar moves with how the cohort did.