Cambridge IGCSE Environmental Management 0680 — 2023 May/June Paper 2 · Variant 1
0680/21/M/J/23 · 4 questions · 80 marks · ≈90 min
The question paper and its mark scheme, free to read here and free to download. This is Cambridge’s own paper, exactly as it was sat.
Question paper20 pages

Mark scheme12 pages
Answers below. Sit the paper first if you are practising.
Questions as text
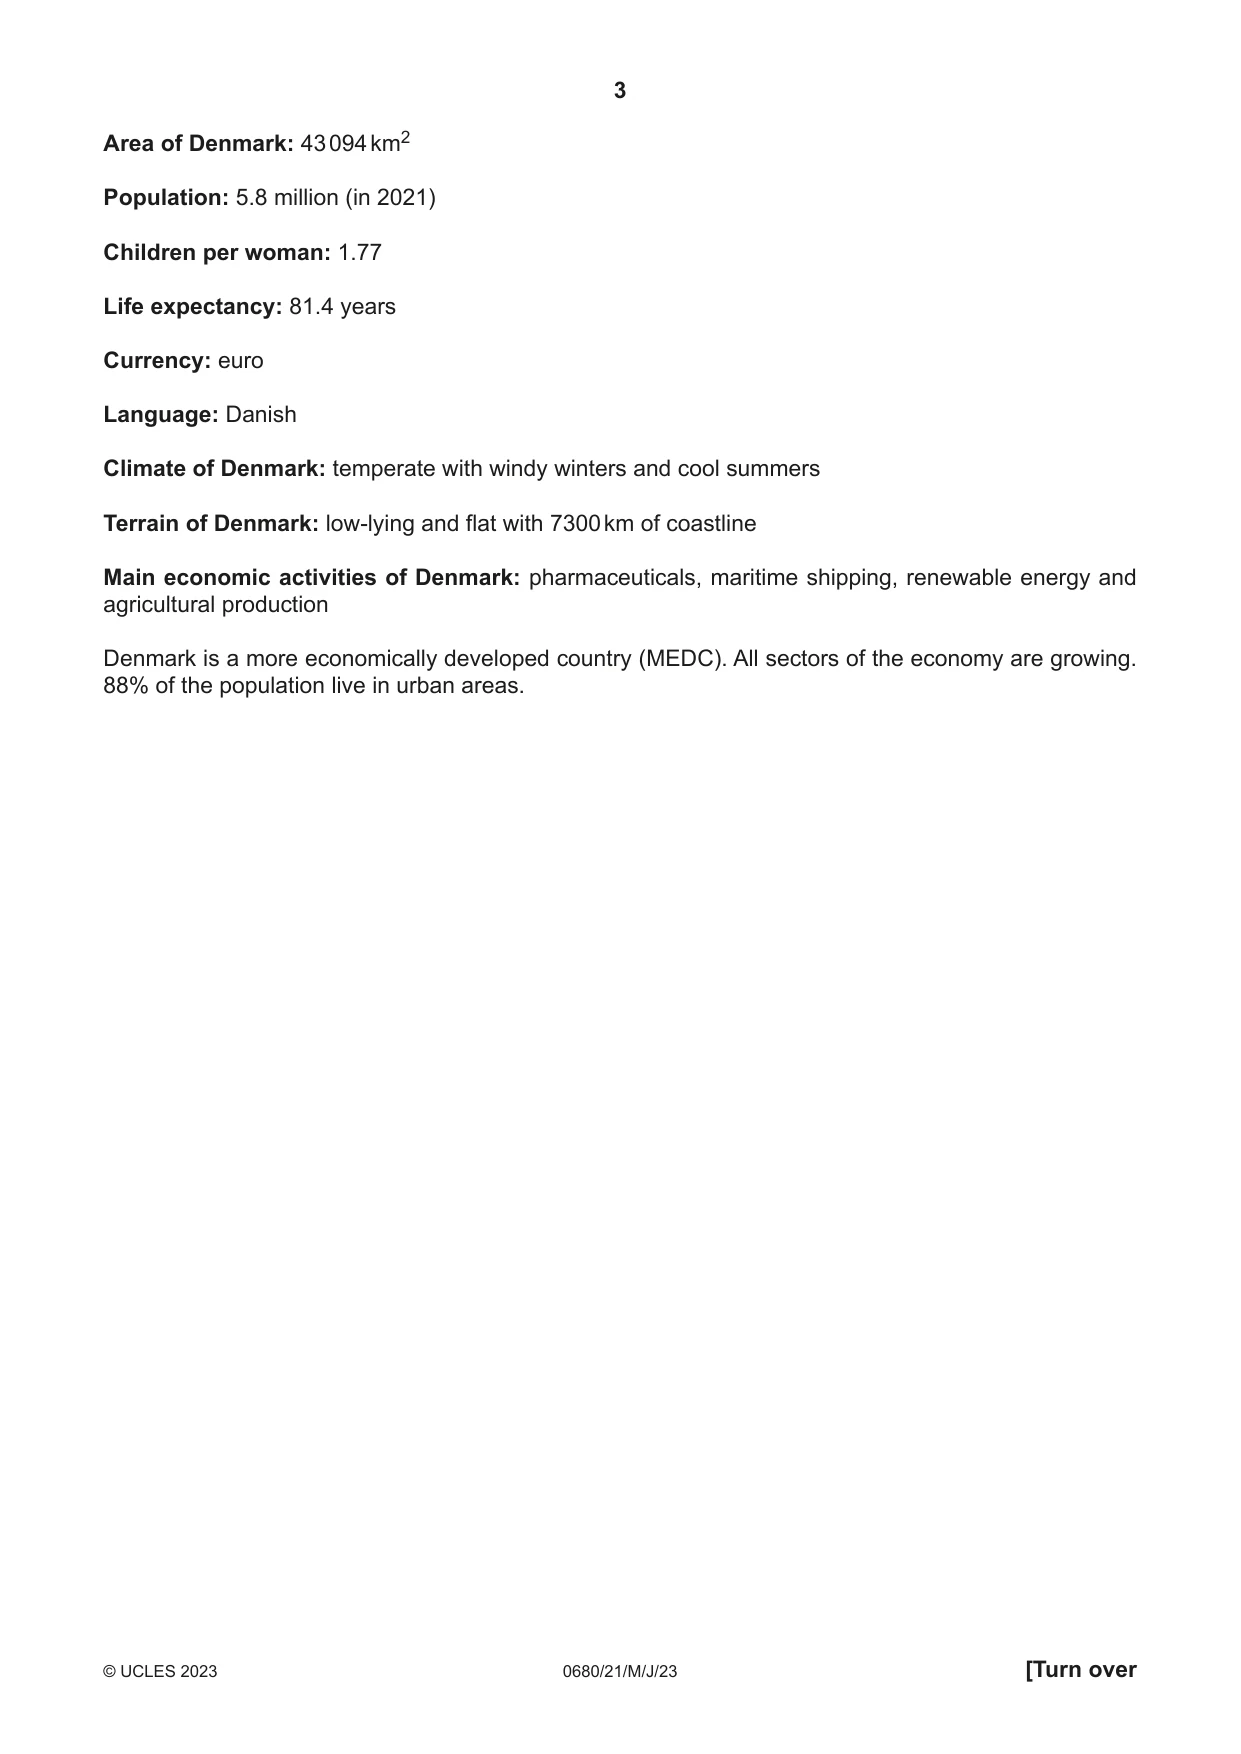
Q1 · Calculate the number of people living in rural areas in 2021
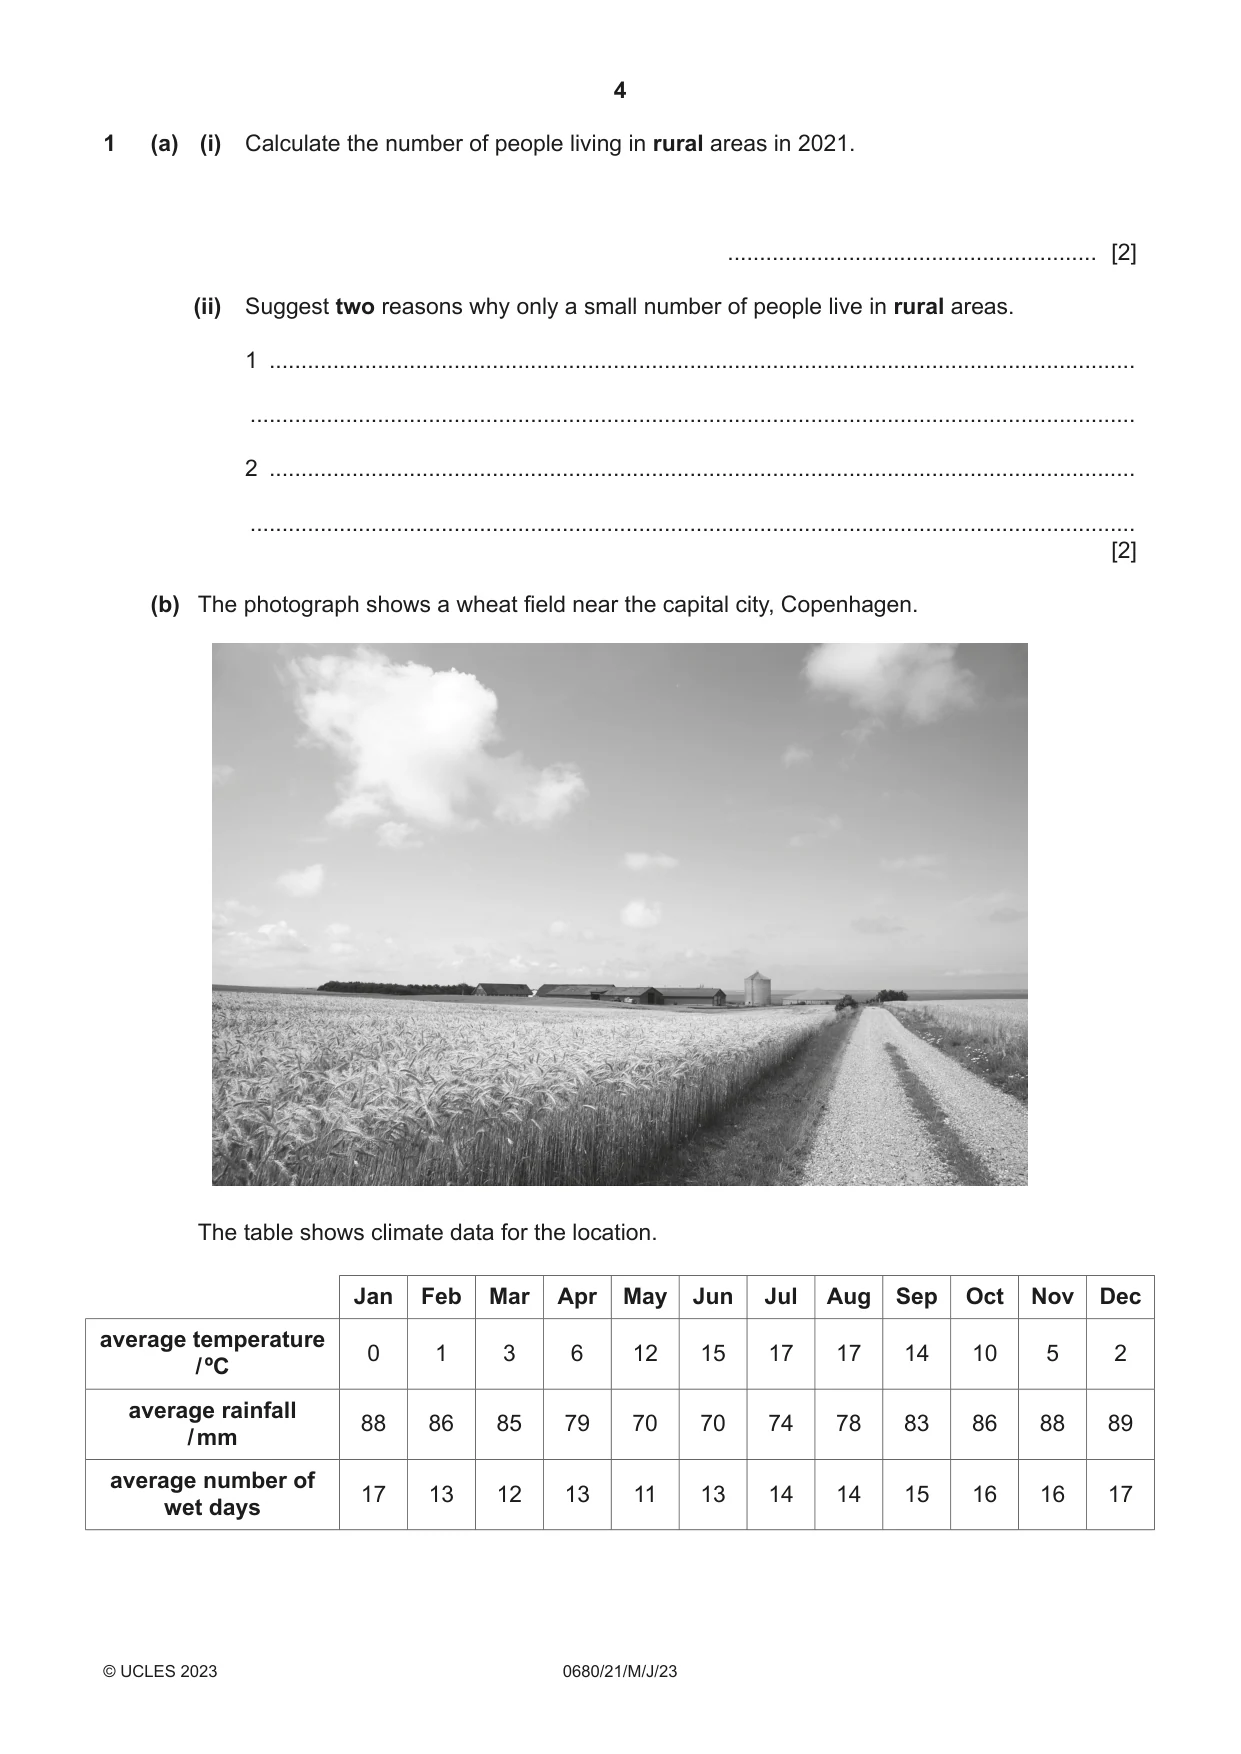
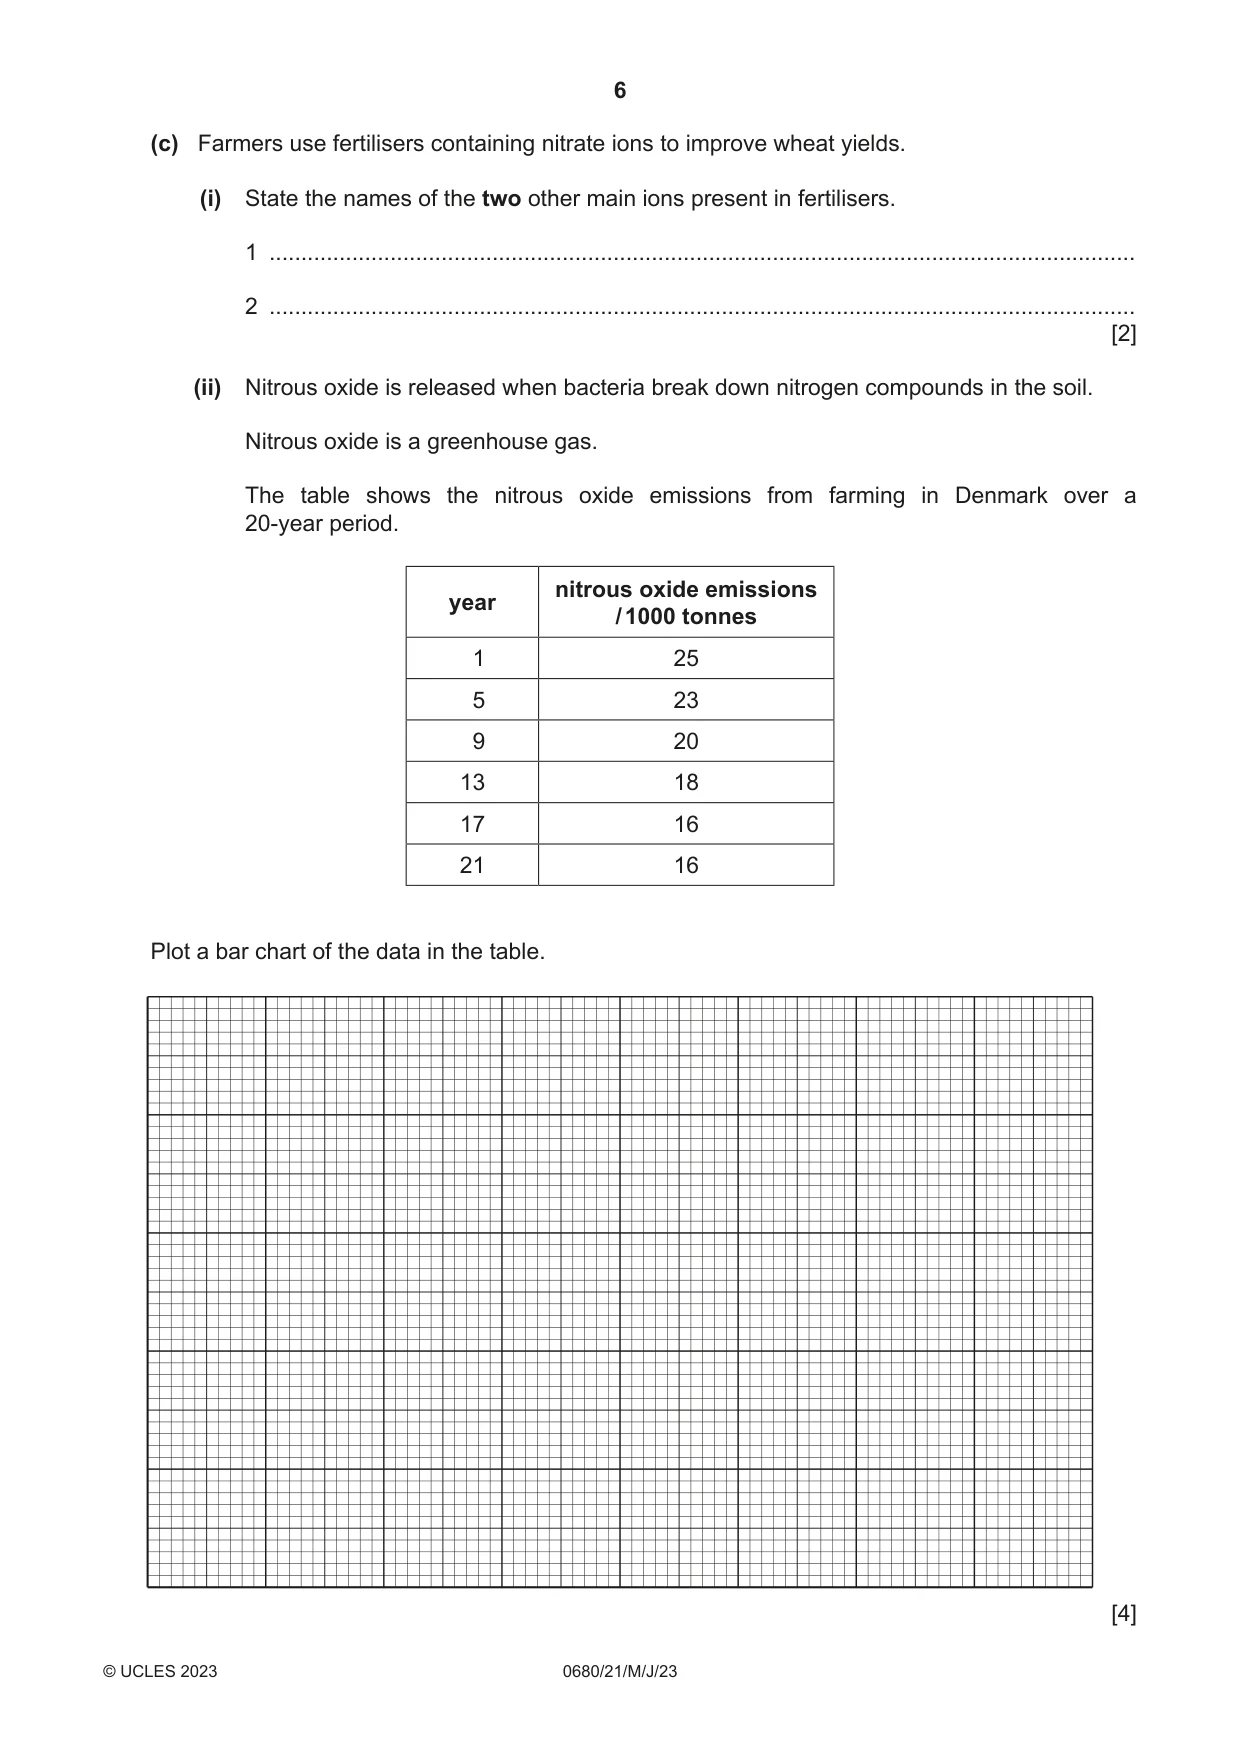
1 (a) (i) Calculate the number of people living in rural areas in 2021. .......................................................... [2] (ii) Suggest two reasons why only a small number of people live in rural areas. 1 ........................................................................................................................................ ........................................................................................................................................... 2 ........................................................................................................................................ ........................................................................................................................................... [2] (b) The photograph shows a wheat field near the capital city, Copenhagen. The table shows climate data for the location. Jan Feb Mar Apr May Jun Jul Aug Sep Oct Nov Dec average temperature 0 1 3 6 12 15 17 17 14 10 5 2 / ºC average rainfall 88 86 85 79 70 70 74 78 83 86 88 89 / mm average number of 17 13 12 13 11 13 14 14 15 16 16 17 wet days (i) State the type of farming shown in the photograph. ..................................................................................................................................... [1] (ii) The wheat in the photograph is planted in April. It is harvested in August. Wheat needs a minimum average temperature of 12 °C to grow. State the number of months wheat grows in this field. .......................................................... [1] (iii) Give two reasons why most farmers near Copenhagen do not use irrigation methods to grow crops. Use information from the table in your answer. ........................................................................................................................................... ........................................................................................................................................... ........................................................................................................................................... ..................................................................................................................................... [2] (iv) Describe the environmental impacts of mismanagement of irrigation. ........................................................................................................................................... ........................................................................................................................................... ........................................................................................................................................... ........................................................................................................................................... ........................................................................................................................................... ..................................................................................................................................... [3] (c) Farmers use fertilisers containing nitrate ions to improve wheat yields. (i) State the names of the two other main ions present in fertilisers. 1 ........................................................................................................................................ 2 ........................................................................................................................................ [2] (ii) Nitrous oxide is released when bacteria break down nitrogen compounds in the soil. Nitrous oxide is a greenhouse gas. The table shows the nitrous oxide emissions from farming in Denmark over a 20-year period. nitrous oxide emissions year / 1000 tonnes 1 25 5 23 9 20 13 18 17 16 21 16 Plot a bar chart of the data in the table. [4] (iii) Describe the trend shown by the data. ........................................................................................................................................... ........................................................................................................................................... ........................................................................................................................................... ..................................................................................................................................... [2] (iv) Suggest two reasons why nitrous oxide emissions from farming in Denmark will not reach zero tonnes in the future. 1 ........................................................................................................................................ ........................................................................................................................................... 2 ........................................................................................................................................ ........................................................................................................................................... [2] (d) Greenhouse gas emissions contribute to climate change. Suggest reasons why the population of Denmark may be impacted by climate change. ................................................................................................................................................... ................................................................................................................................................... ................................................................................................................................................... ................................................................................................................................................... ................................................................................................................................................... ................................................................................................................................................... ................................................................................................................................................... ............................................................................................................................................. [4] [Total: 25]
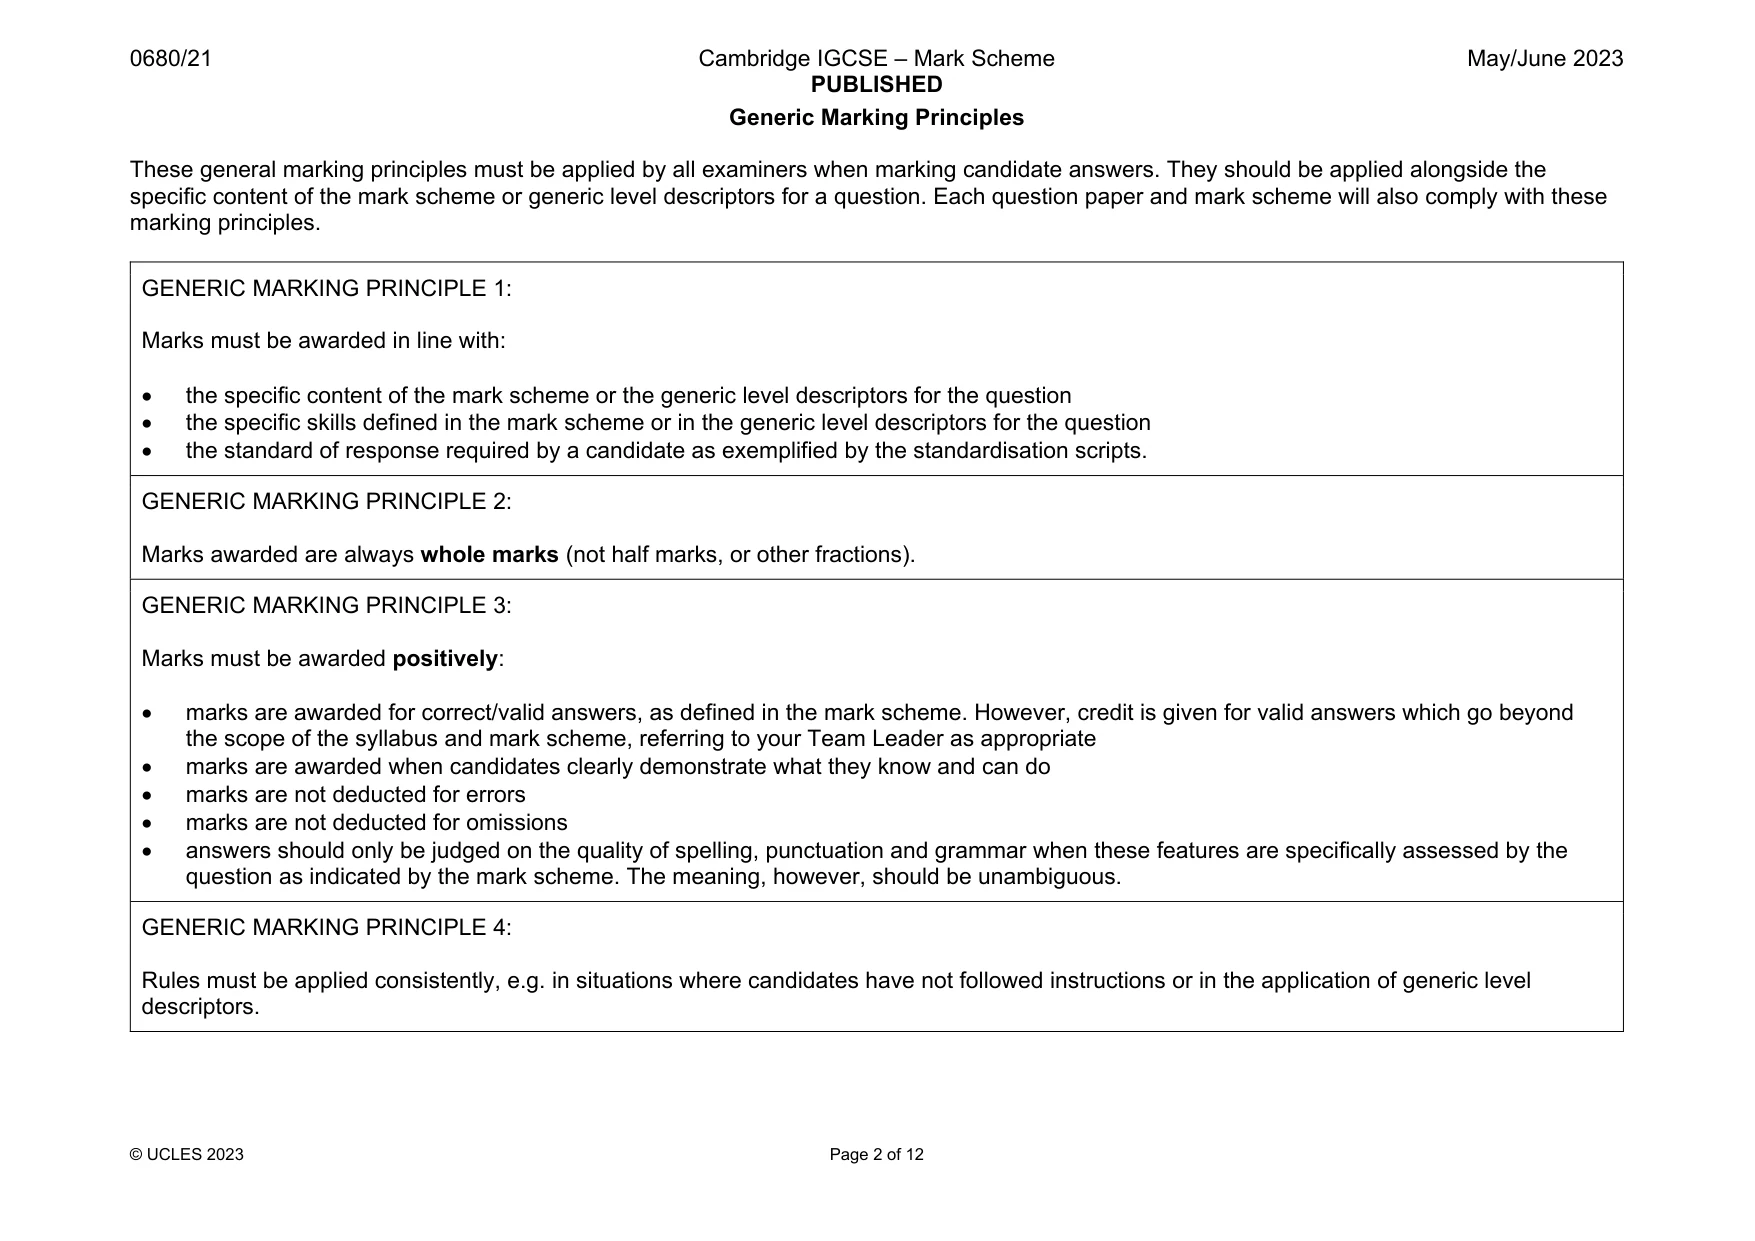
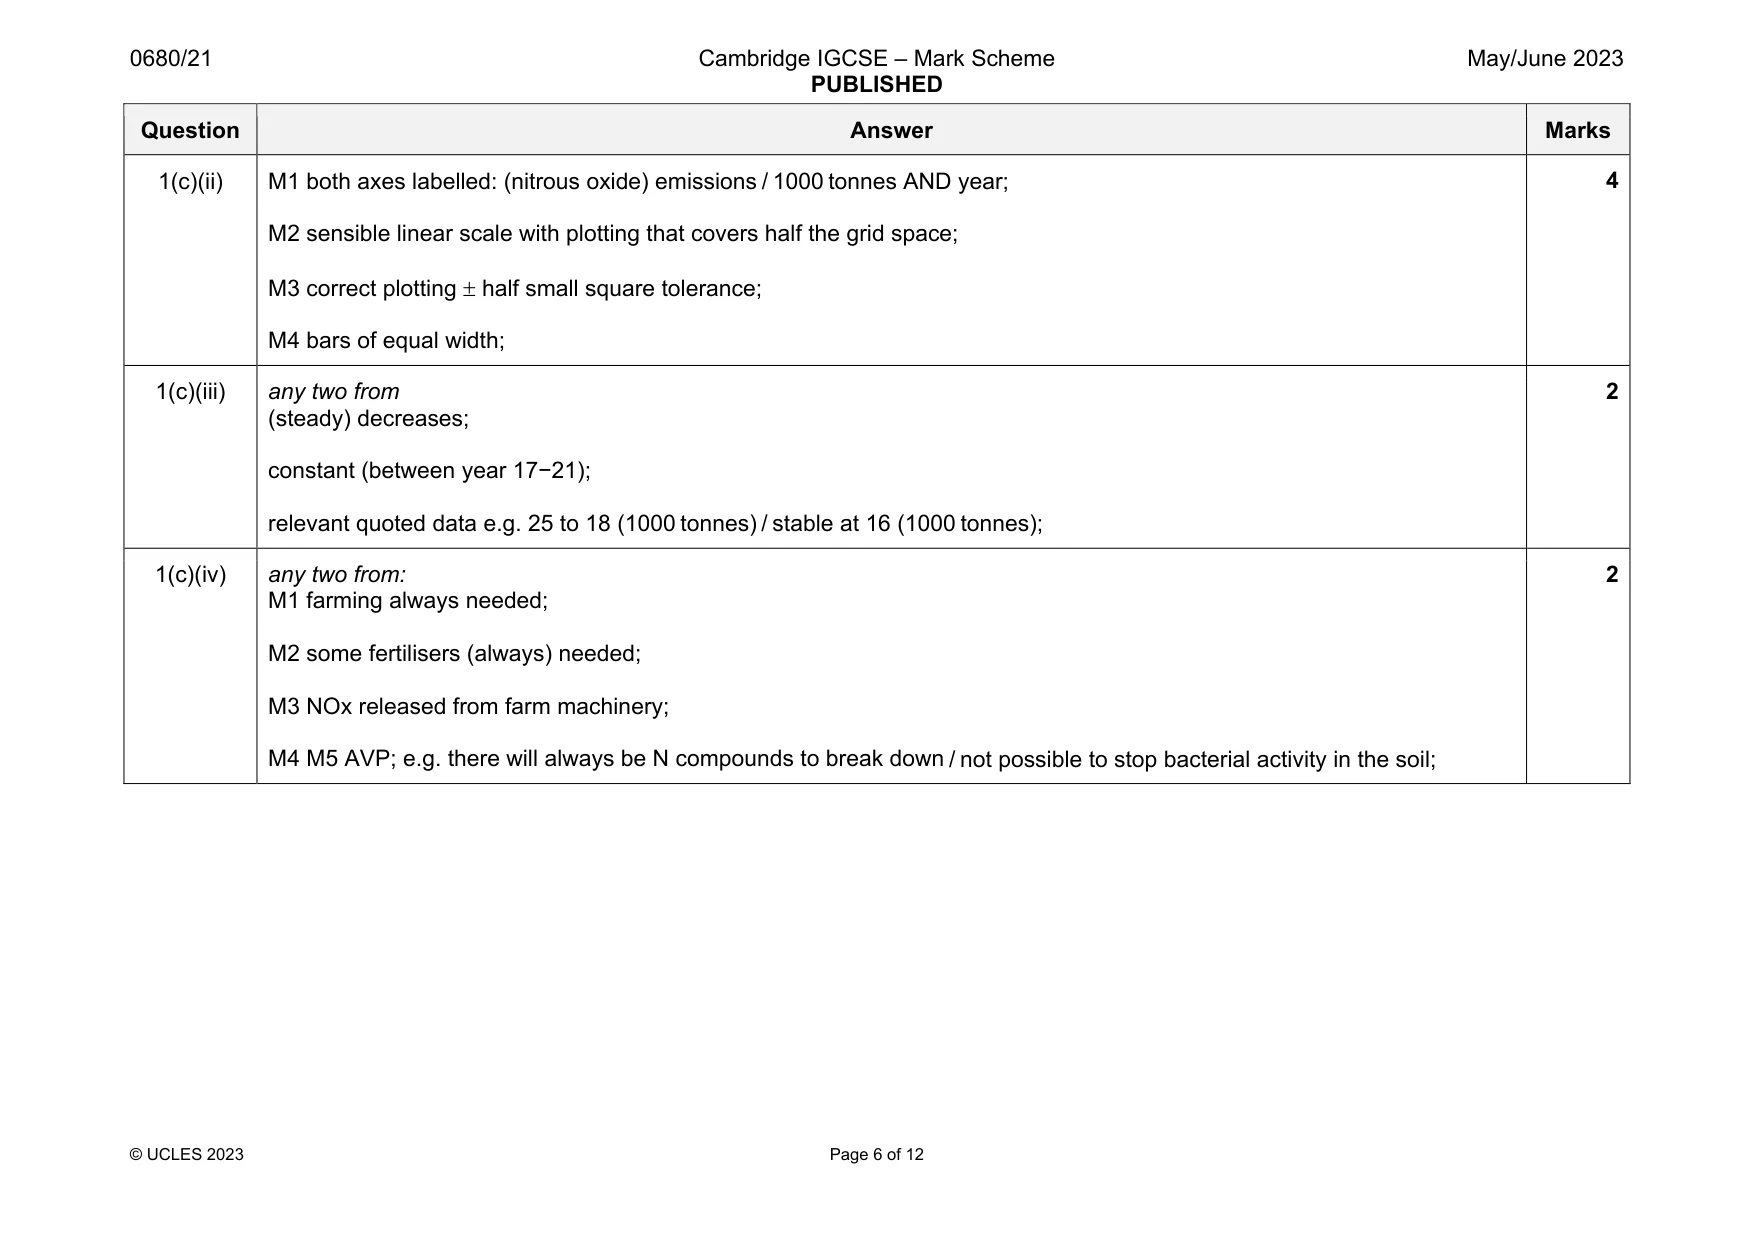
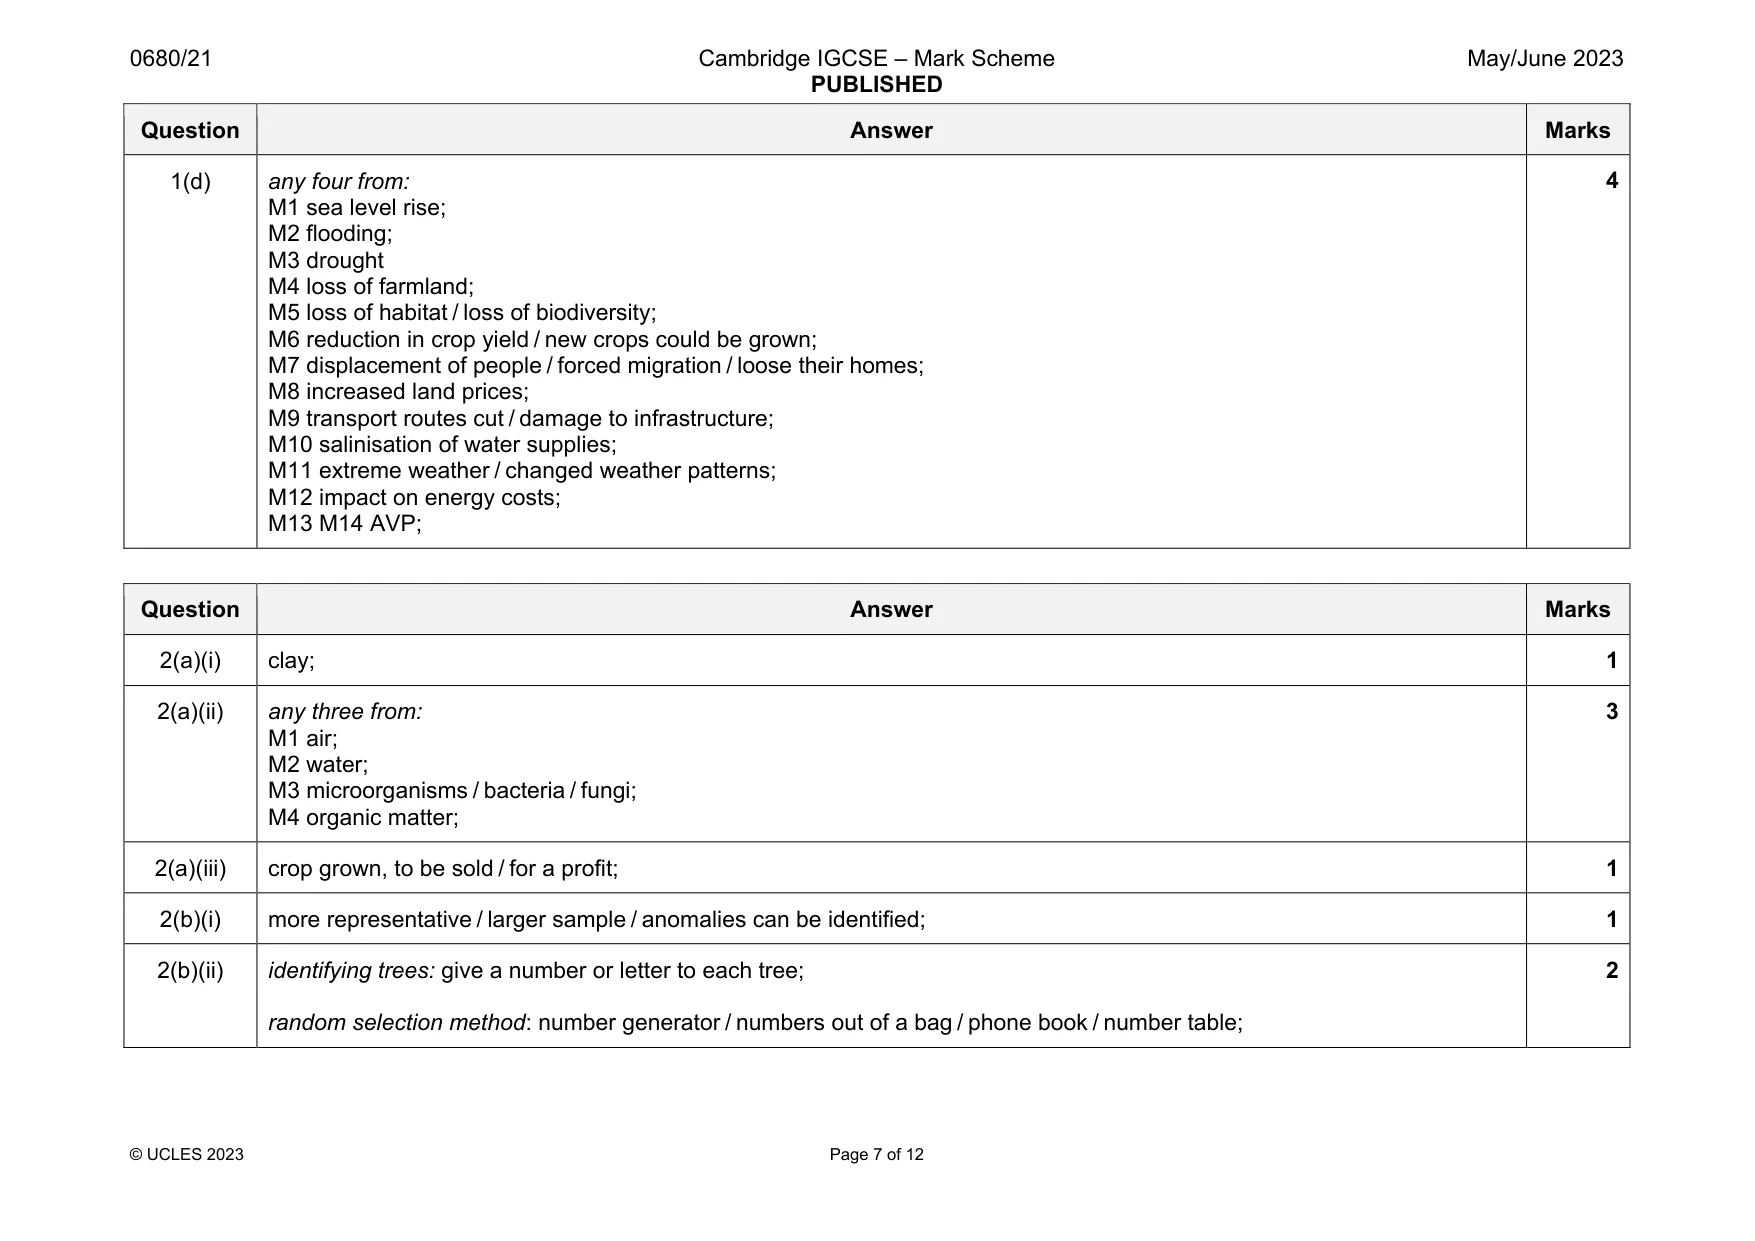
Mark scheme: 1(a)(i) 696 000; 2 1(a)(ii) any two from in rural areas: M1 not many jobs / risk of being unemployed; M2 only agriculture as available work / mechanisation of agricultural; M3 migration; M4 lack of services or infrastructure / fewer stated services e.g. medical care / education / communications; 2 1(b)(i) commercial / arable / crops; 1 1(b)(ii) 4; 1 1(b)(iii) any two from: M1 many wet days; M2 similar rainfall every month; M3 no dry season / rains all year; M4 suitable data quoted e.g. 70 mm every month, every month has between 7−89 mm, minimum of 11 wet days each month 2 1(b)(iv) any three from: M1 waterlogging / flooding; M2 low oxygen or air in soil; M3 reduced crop yield; M4 salinisation; M5 loss of, fertility / fertiliser; M6 leaching (of nutrients); M7 leading to eutrophication; AVP; e.g. soil erosion / increased surface run-off 3 1(c)(i) potassium phosphate; 2 Question Answer Marks 1(c)(ii) M1 both axes labelled: (nitrous oxide) emissions / 1000 tonnes AND year; M2 sensible linear scale with plotting that covers half the grid space; M3 correct plotting half small square tolerance; M4 bars of equal width; 4 1(c)(iii) any two from (steady) decreases; constant (between year 17−21); relevant quoted data e.g. 25 to 18 (1000 tonnes) / stable at 16 (1000 tonnes); 2 1(c)(iv) any two from: M1 farming always needed; M2 some fertilisers (always) needed; M3 NOx released from farm machinery; M4 M5 AVP; e.g. there will always be N compounds to break down / not possible to stop bacterial activity in the soil; 2 Question Answer Marks 1(d) any four from: M1 sea level rise; M2 flooding; M3 drought M4 loss of farmland; M5 loss of habitat / loss of biodiversity; M6 reduction in crop yield / new crops could be grown; M7 displacement of people / forced migration / loose their homes; M8 increased land prices; M9 transport routes cut / damage to infrastructure; M10 salinisation of water supplies; M11 extreme weather / changed weather patterns; M12 impact on energy costs; M13 M14 AVP; 4
Q2 · The photograph shows a field in Denmark planted with apple trees
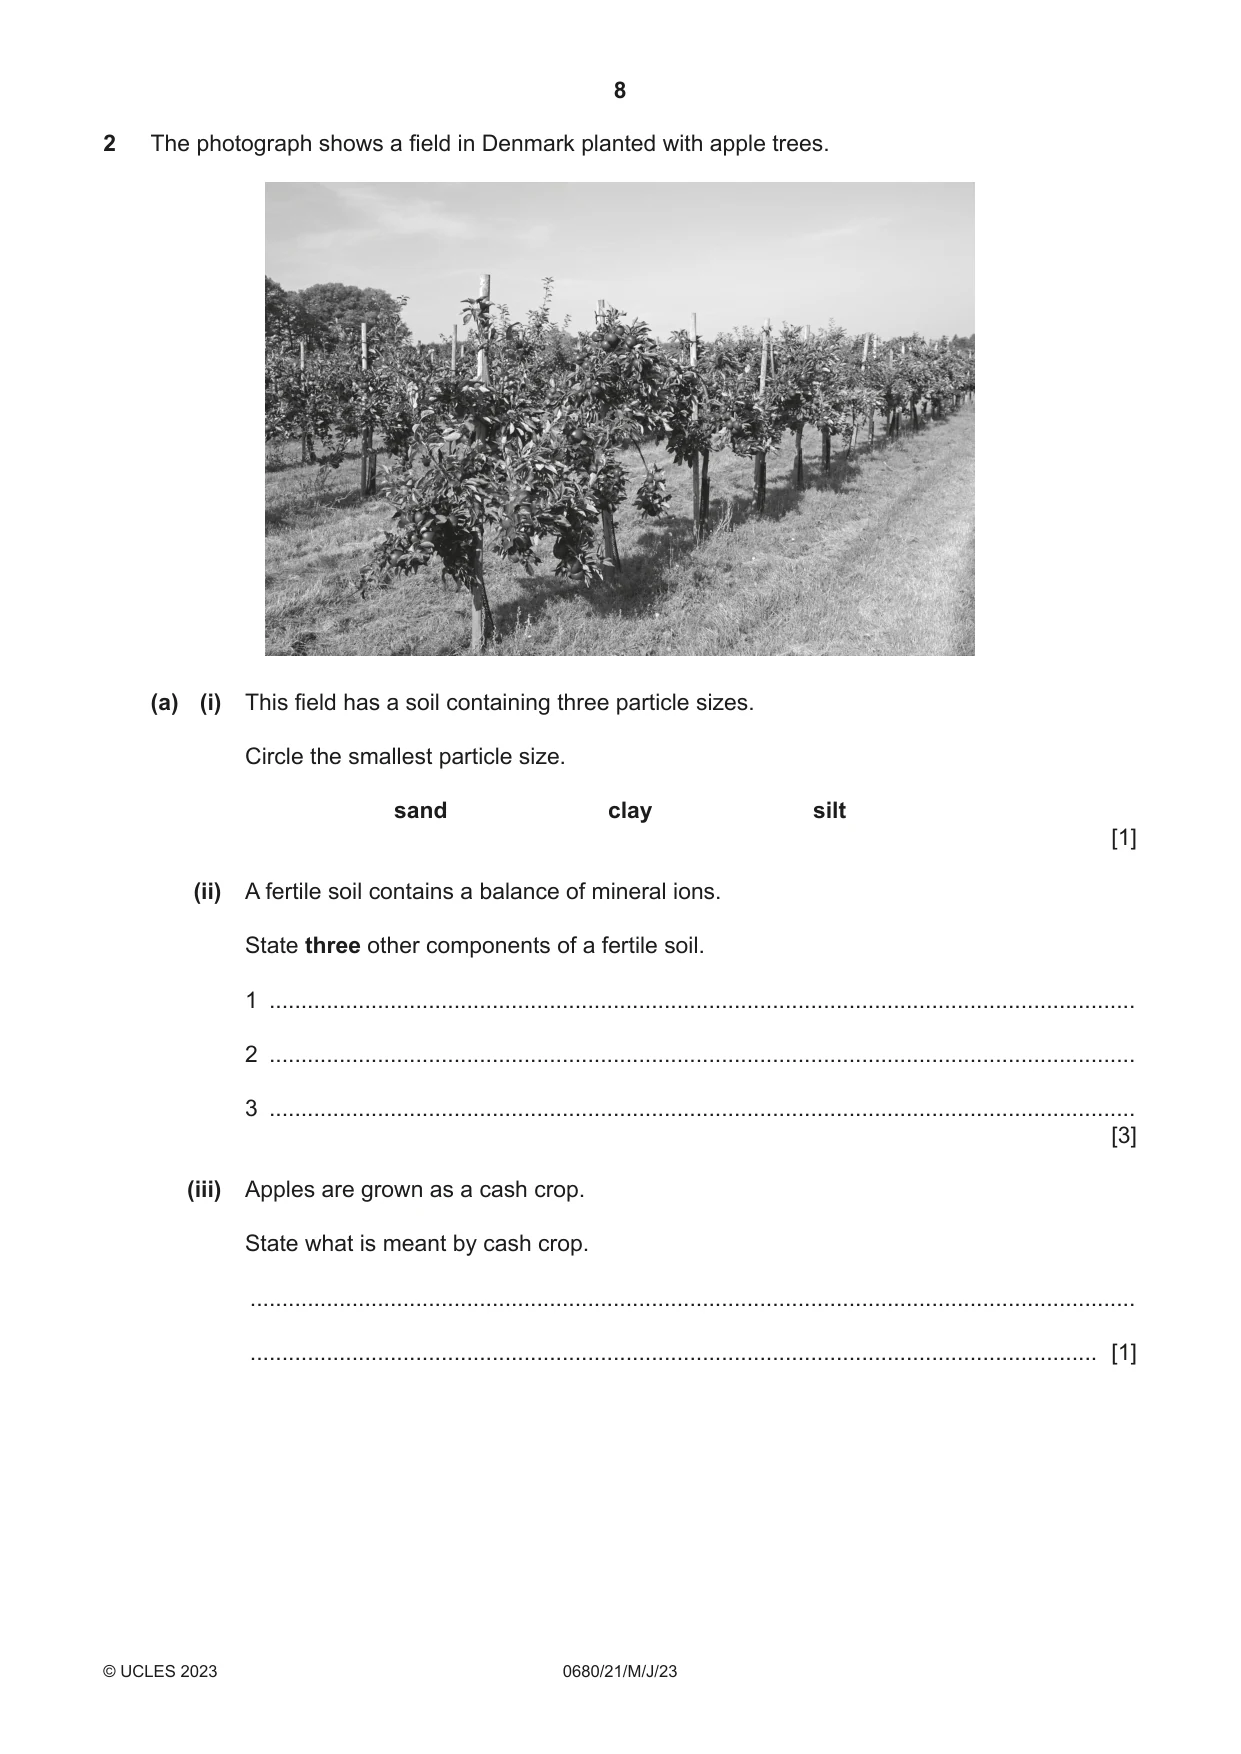
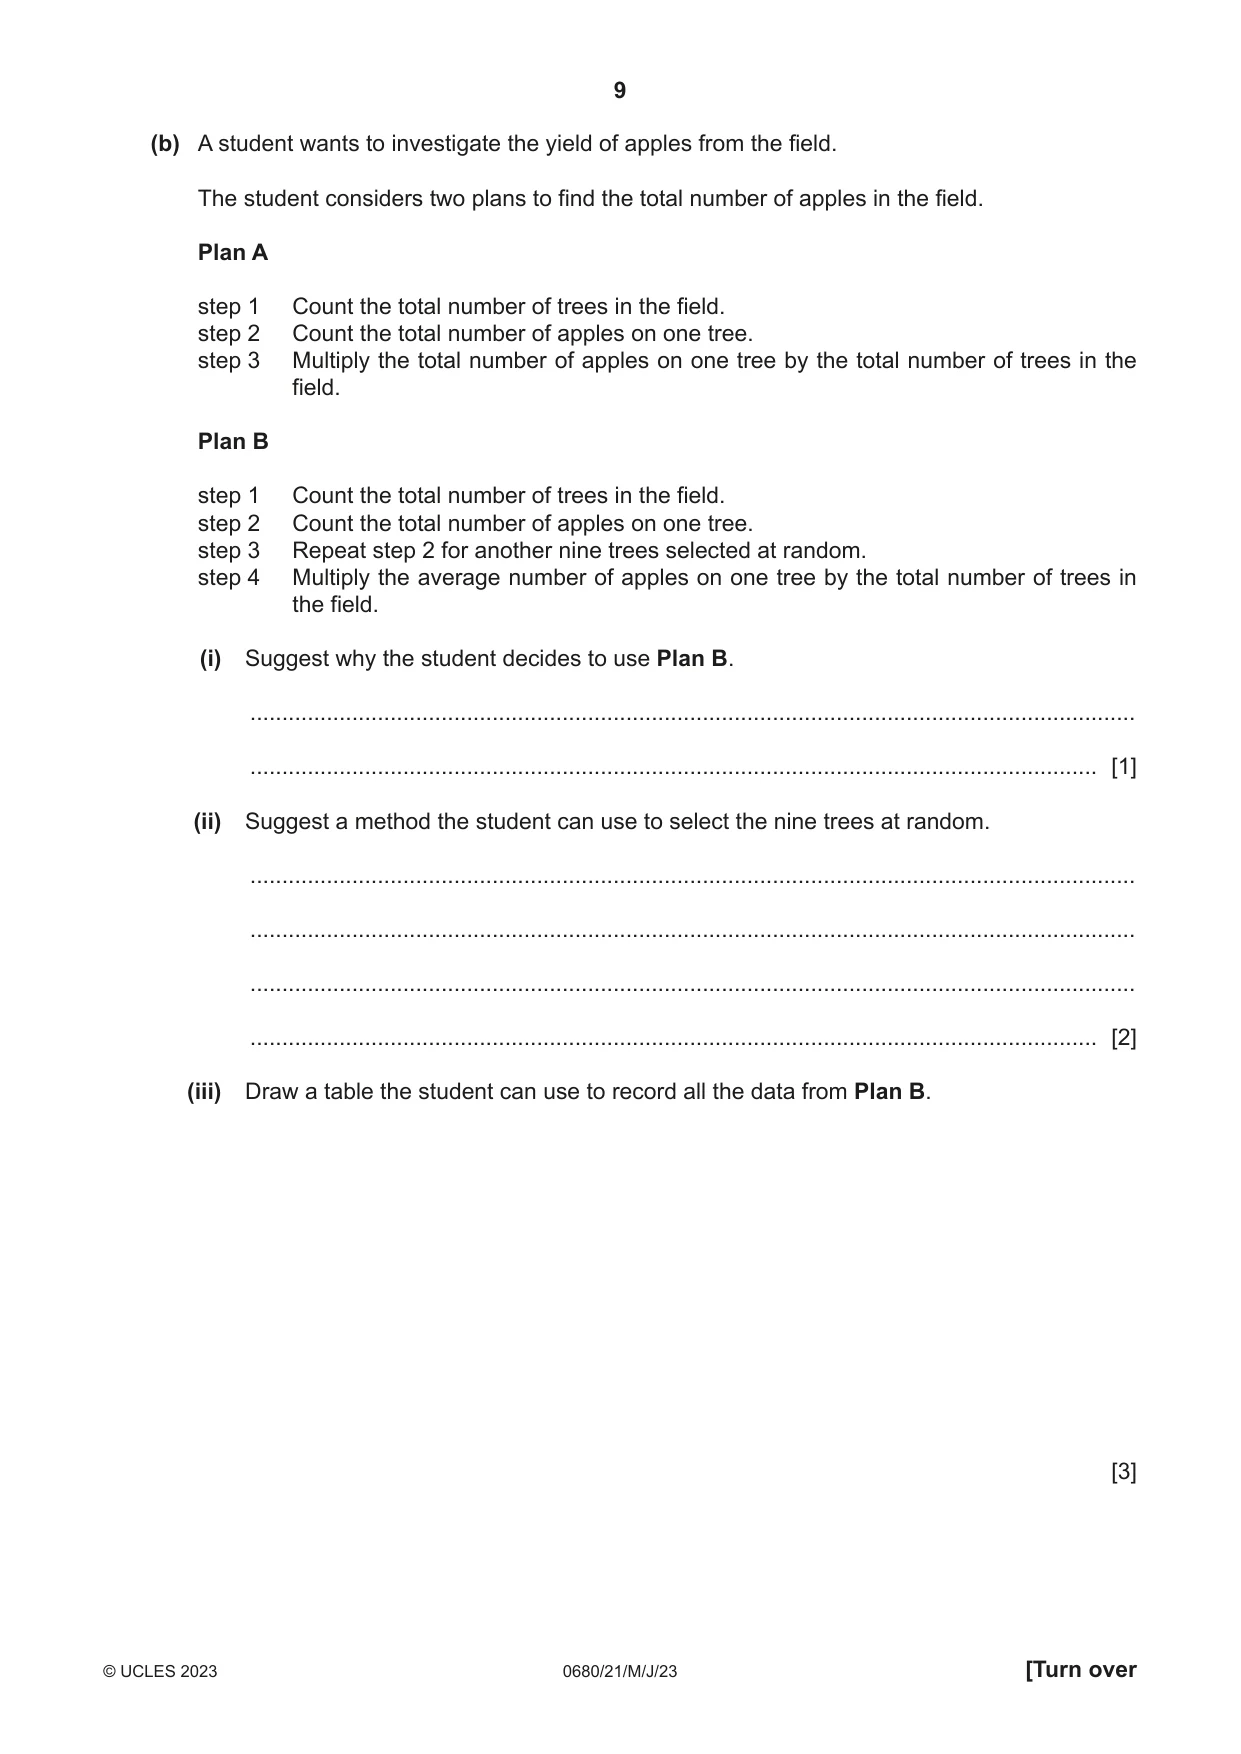
2 The photograph shows a field in Denmark planted with apple trees. (a) (i) This field has a soil containing three particle sizes. Circle the smallest particle size. sand clay silt [1] (ii) A fertile soil contains a balance of mineral ions. State three other components of a fertile soil. 1 ........................................................................................................................................ 2 ........................................................................................................................................ 3 ........................................................................................................................................ [3] (iii) Apples are grown as a cash crop. State what is meant by cash crop. ........................................................................................................................................... ..................................................................................................................................... [1] (b) A student wants to investigate the yield of apples from the field. The student considers two plans to find the total number of apples in the field. Plan A step 1 Count the total number of trees in the field. step 2 Count the total number of apples on one tree. step 3 Multiply the total number of apples on one tree by the total number of trees in the field. Plan B step 1 Count the total number of trees in the field. step 2 Count the total number of apples on one tree. step 3 Repeat step 2 for another nine trees selected at random. step 4 Multiply the average number of apples on one tree by the total number of trees in the field. (i) Suggest why the student decides to use Plan B. ........................................................................................................................................... ..................................................................................................................................... [1] (ii) Suggest a method the student can use to select the nine trees at random. ........................................................................................................................................... ........................................................................................................................................... ........................................................................................................................................... ..................................................................................................................................... [2] (iii) Draw a table the student can use to record all the data from Plan B. [3] (iv) Scientists are breeding new varieties of apple trees to increase future yields. Describe one method the scientists can use to produce new varieties of apple trees. ........................................................................................................................................... ........................................................................................................................................... ........................................................................................................................................... ........................................................................................................................................... ........................................................................................................................................... ..................................................................................................................................... [3] [Total: 14]
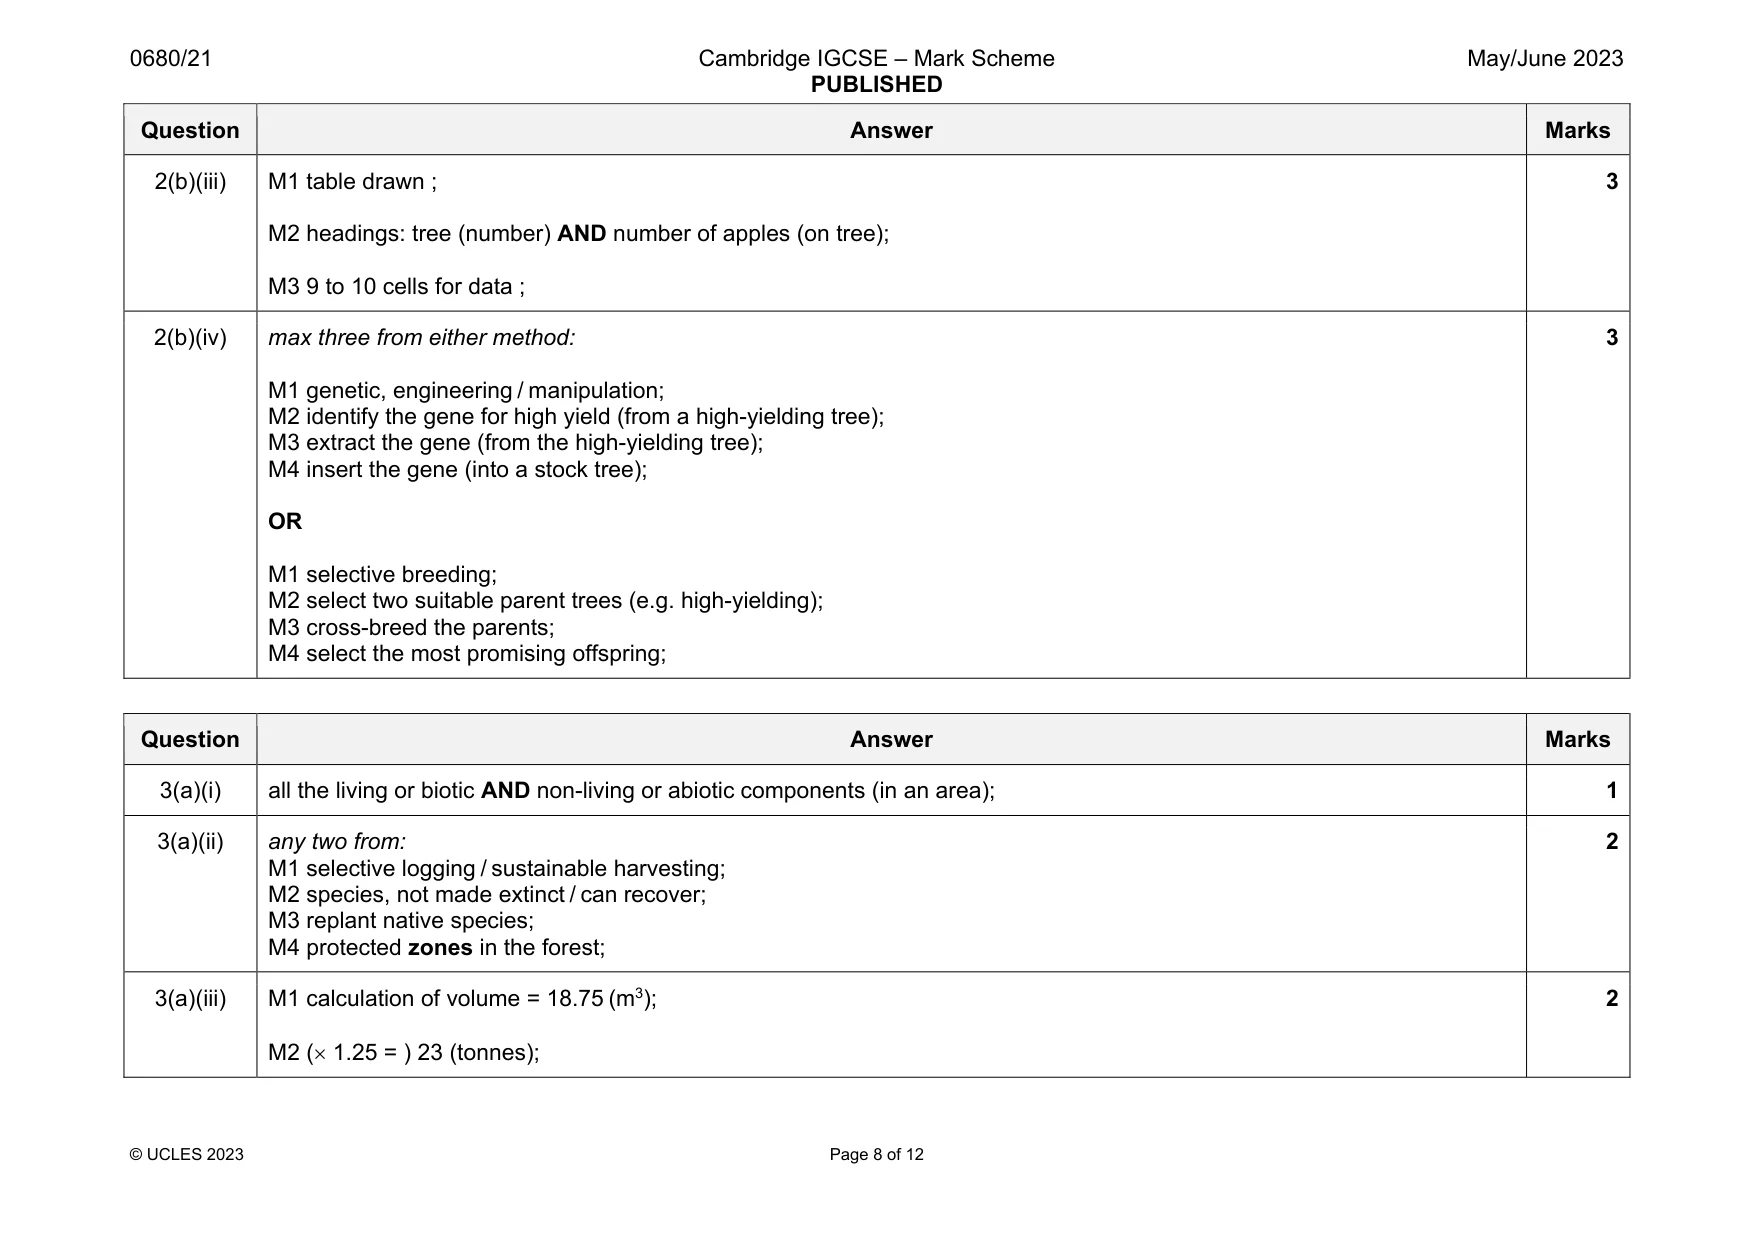
Mark scheme: 2(a)(i) clay; 1 2(a)(ii) any three from: M1 air; M2 water; M3 microorganisms / bacteria / fungi; M4 organic matter; 3 2(a)(iii) crop grown, to be sold / for a profit; 1 2(b)(i) more representative / larger sample / anomalies can be identified; 1 2(b)(ii) identifying trees: give a number or letter to each tree; random selection method: number generator / numbers out of a bag / phone book / number table; 2 Question Answer Marks 2(b)(iii) M1 table drawn ; M2 headings: tree (number) AND number of apples (on tree); M3 9 to 10 cells for data ; 3 2(b)(iv) max three from either method: M1 genetic, engineering / manipulation; M2 identify the gene for high yield (from a high-yielding tree); M3 extract the gene (from the high-yielding tree); M4 insert the gene (into a stock tree); OR M1 selective breeding; M2 select two suitable parent trees (e.g. high-yielding); M3 cross-breed the parents; M4 select the most promising offspring; 3
Q3 · The photograph shows part of a forest in Denmark being harvested
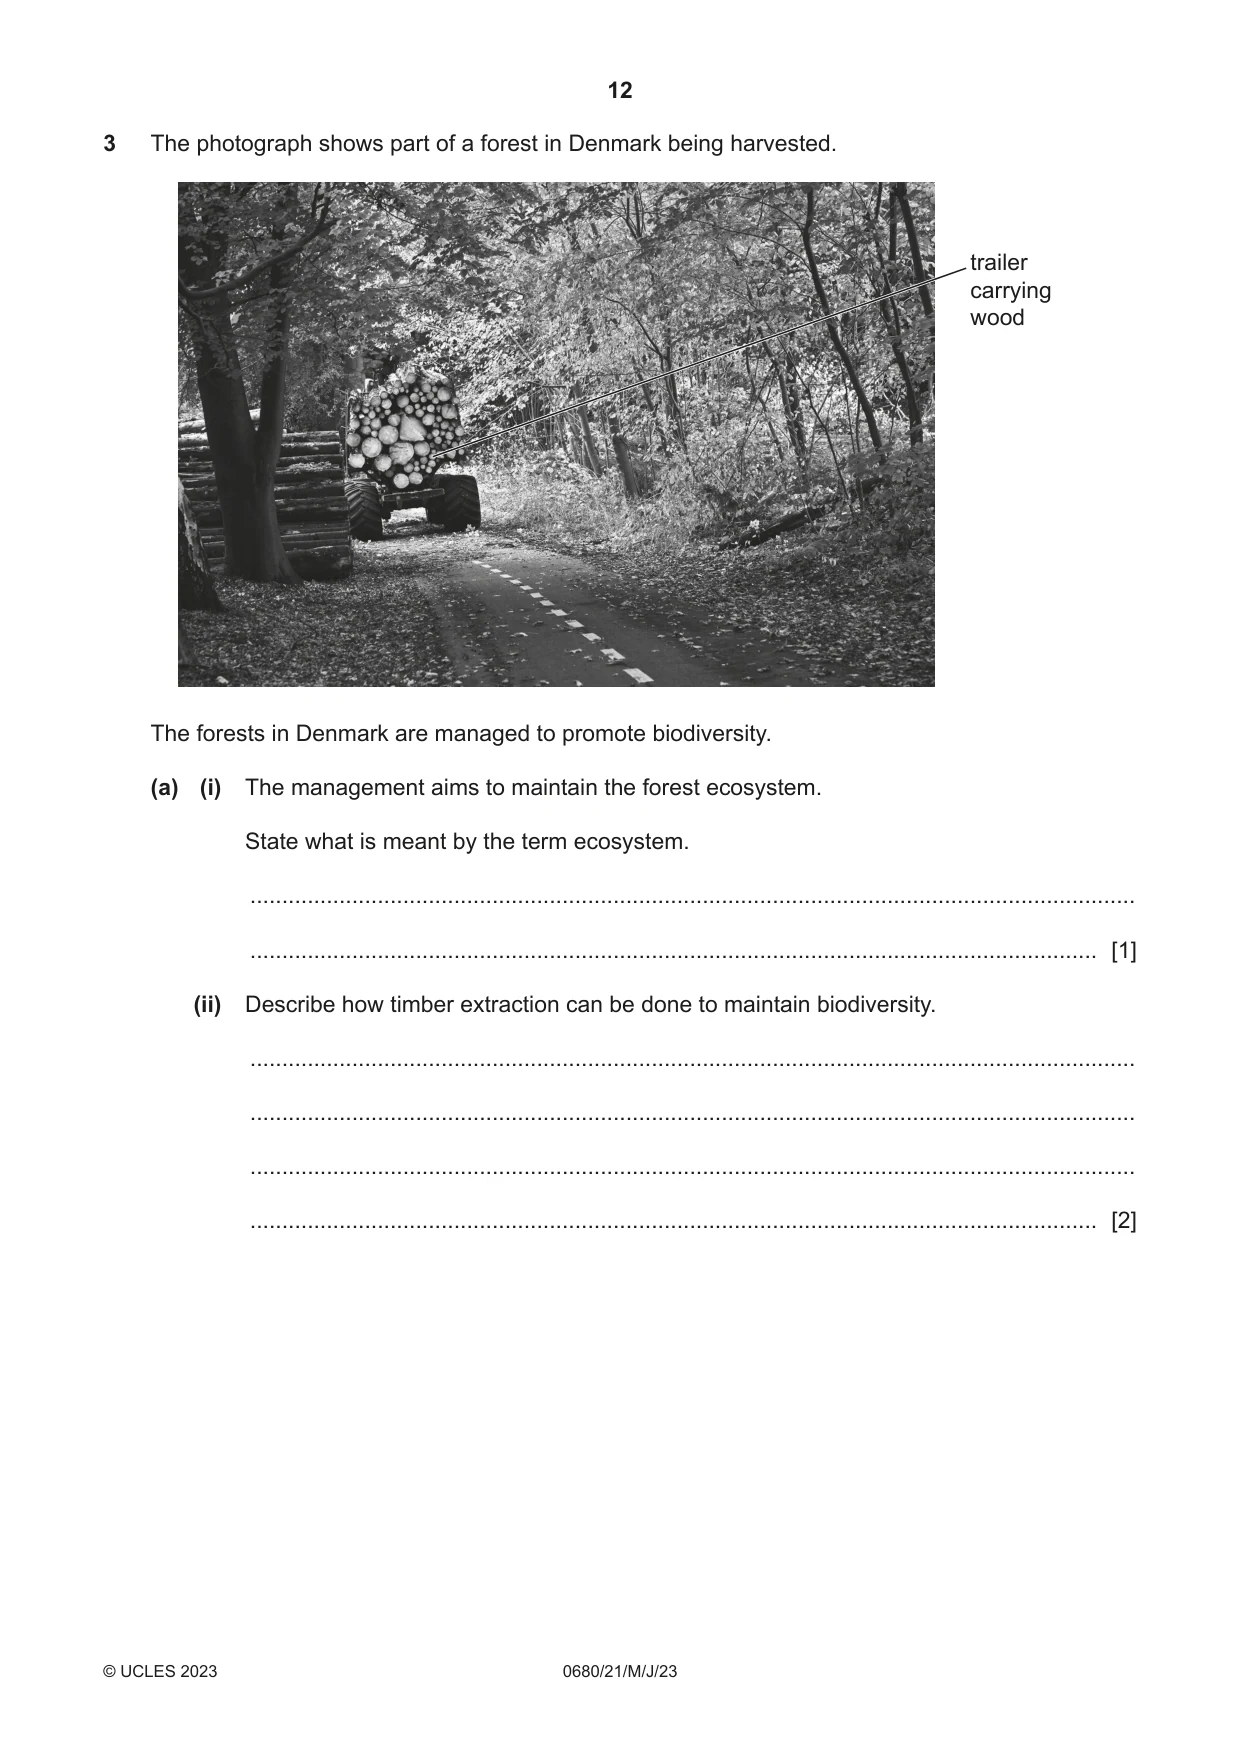
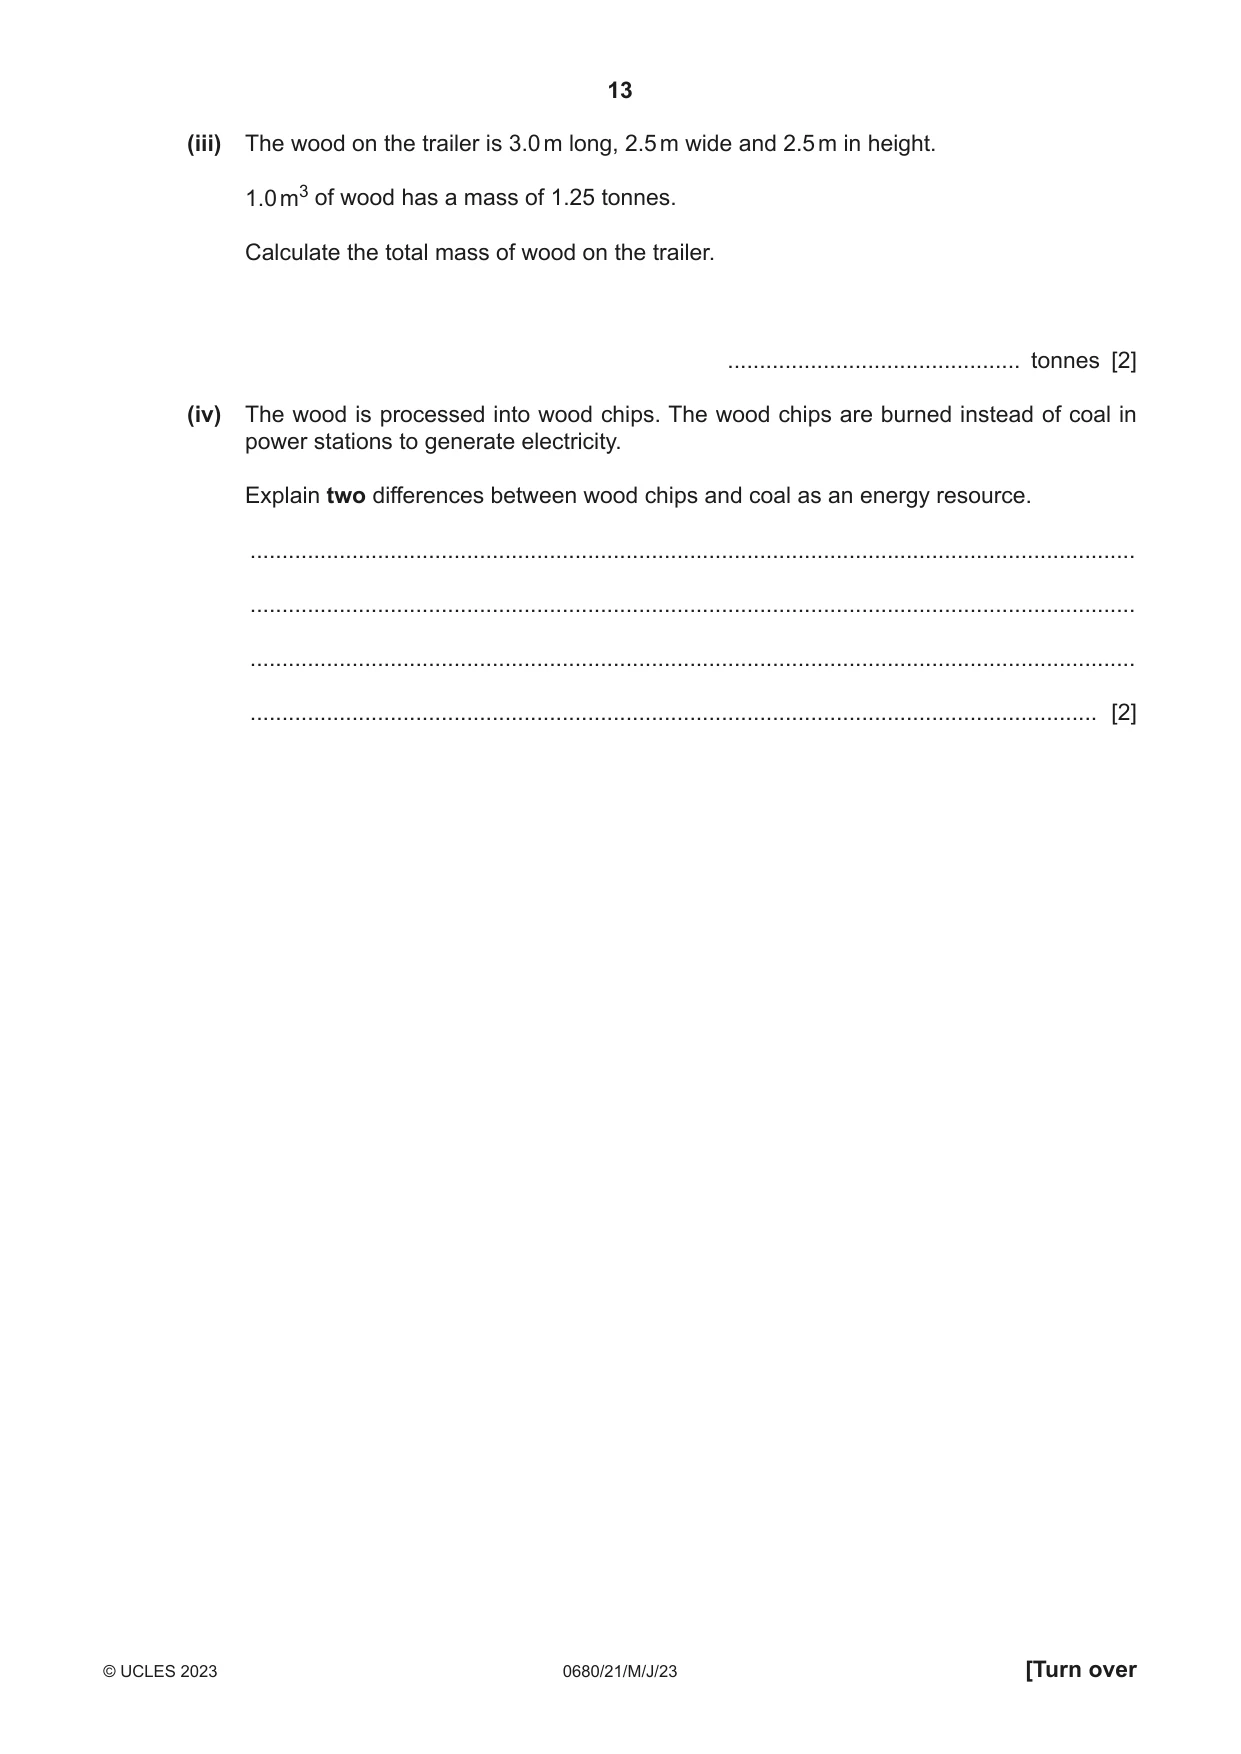
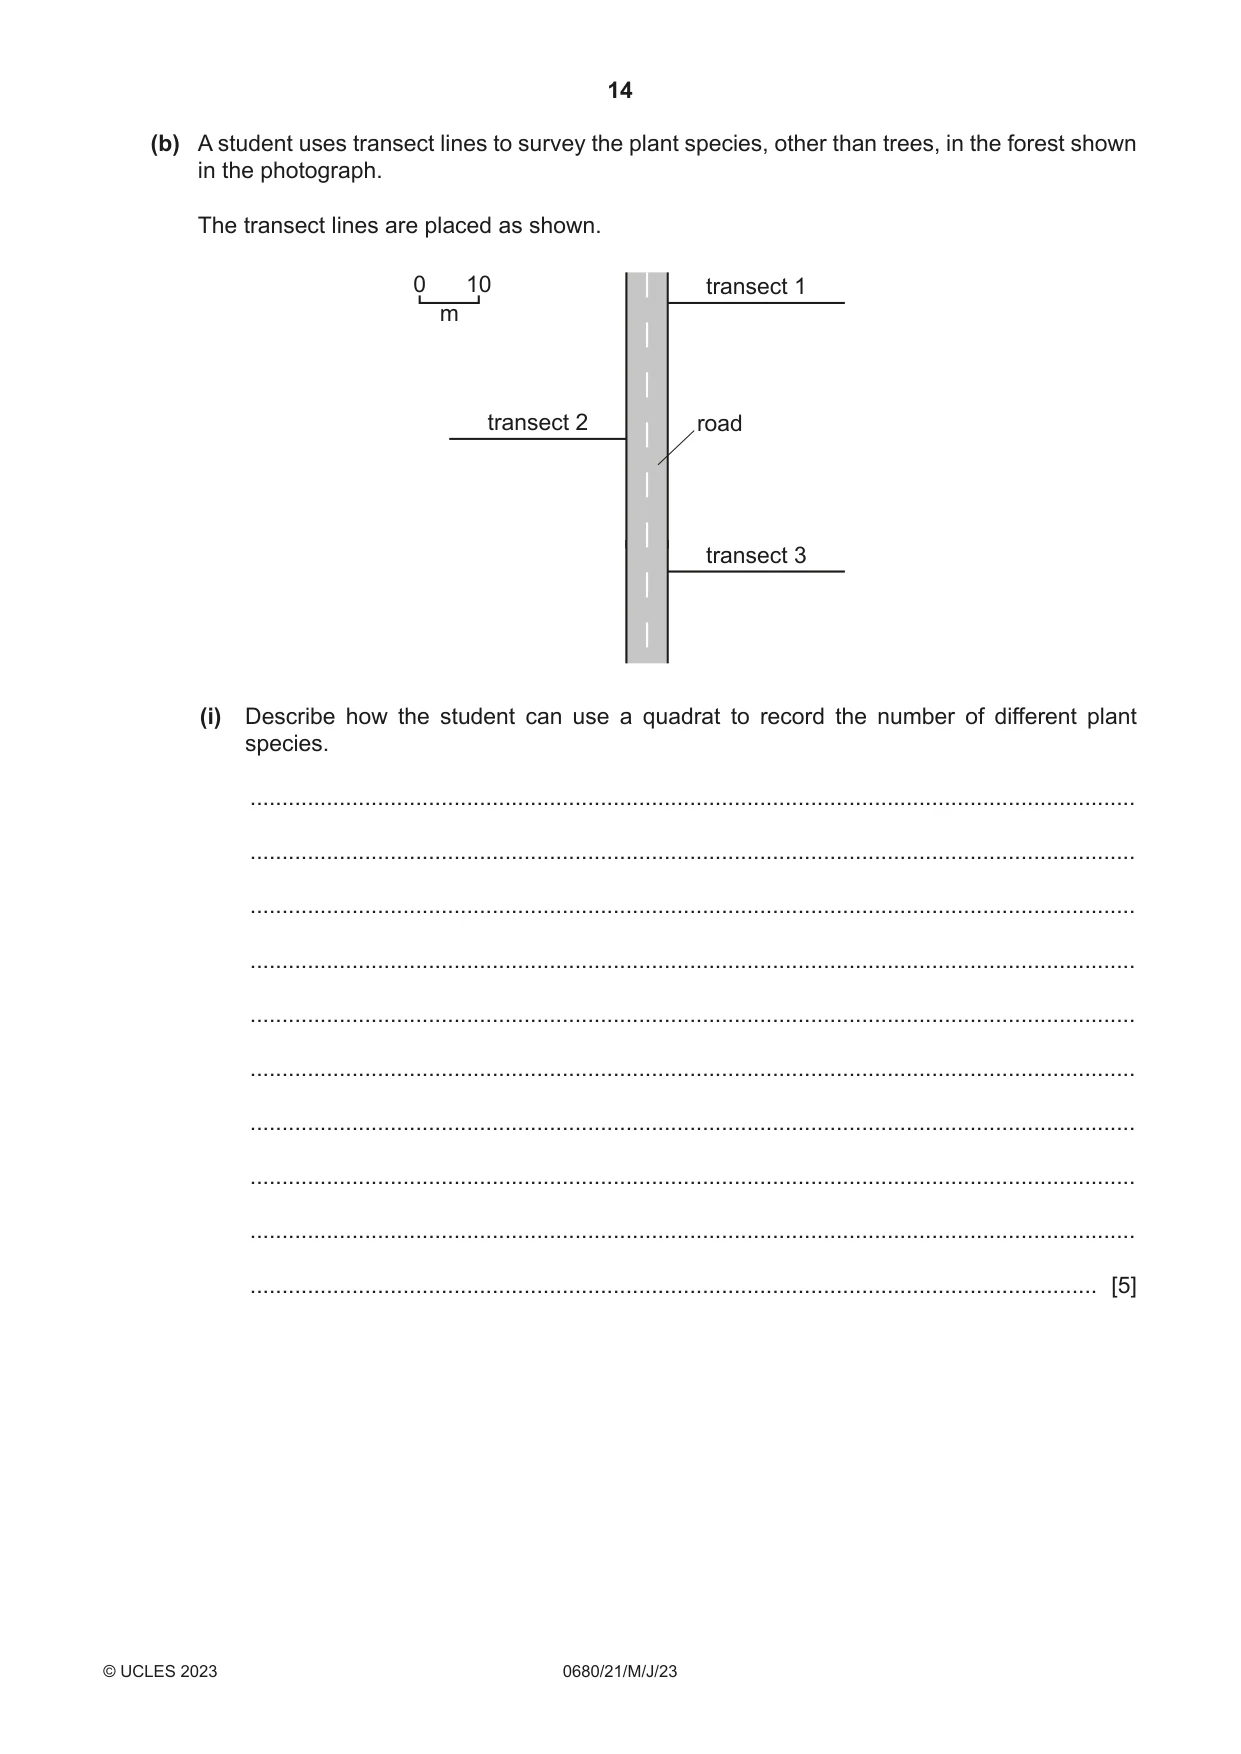
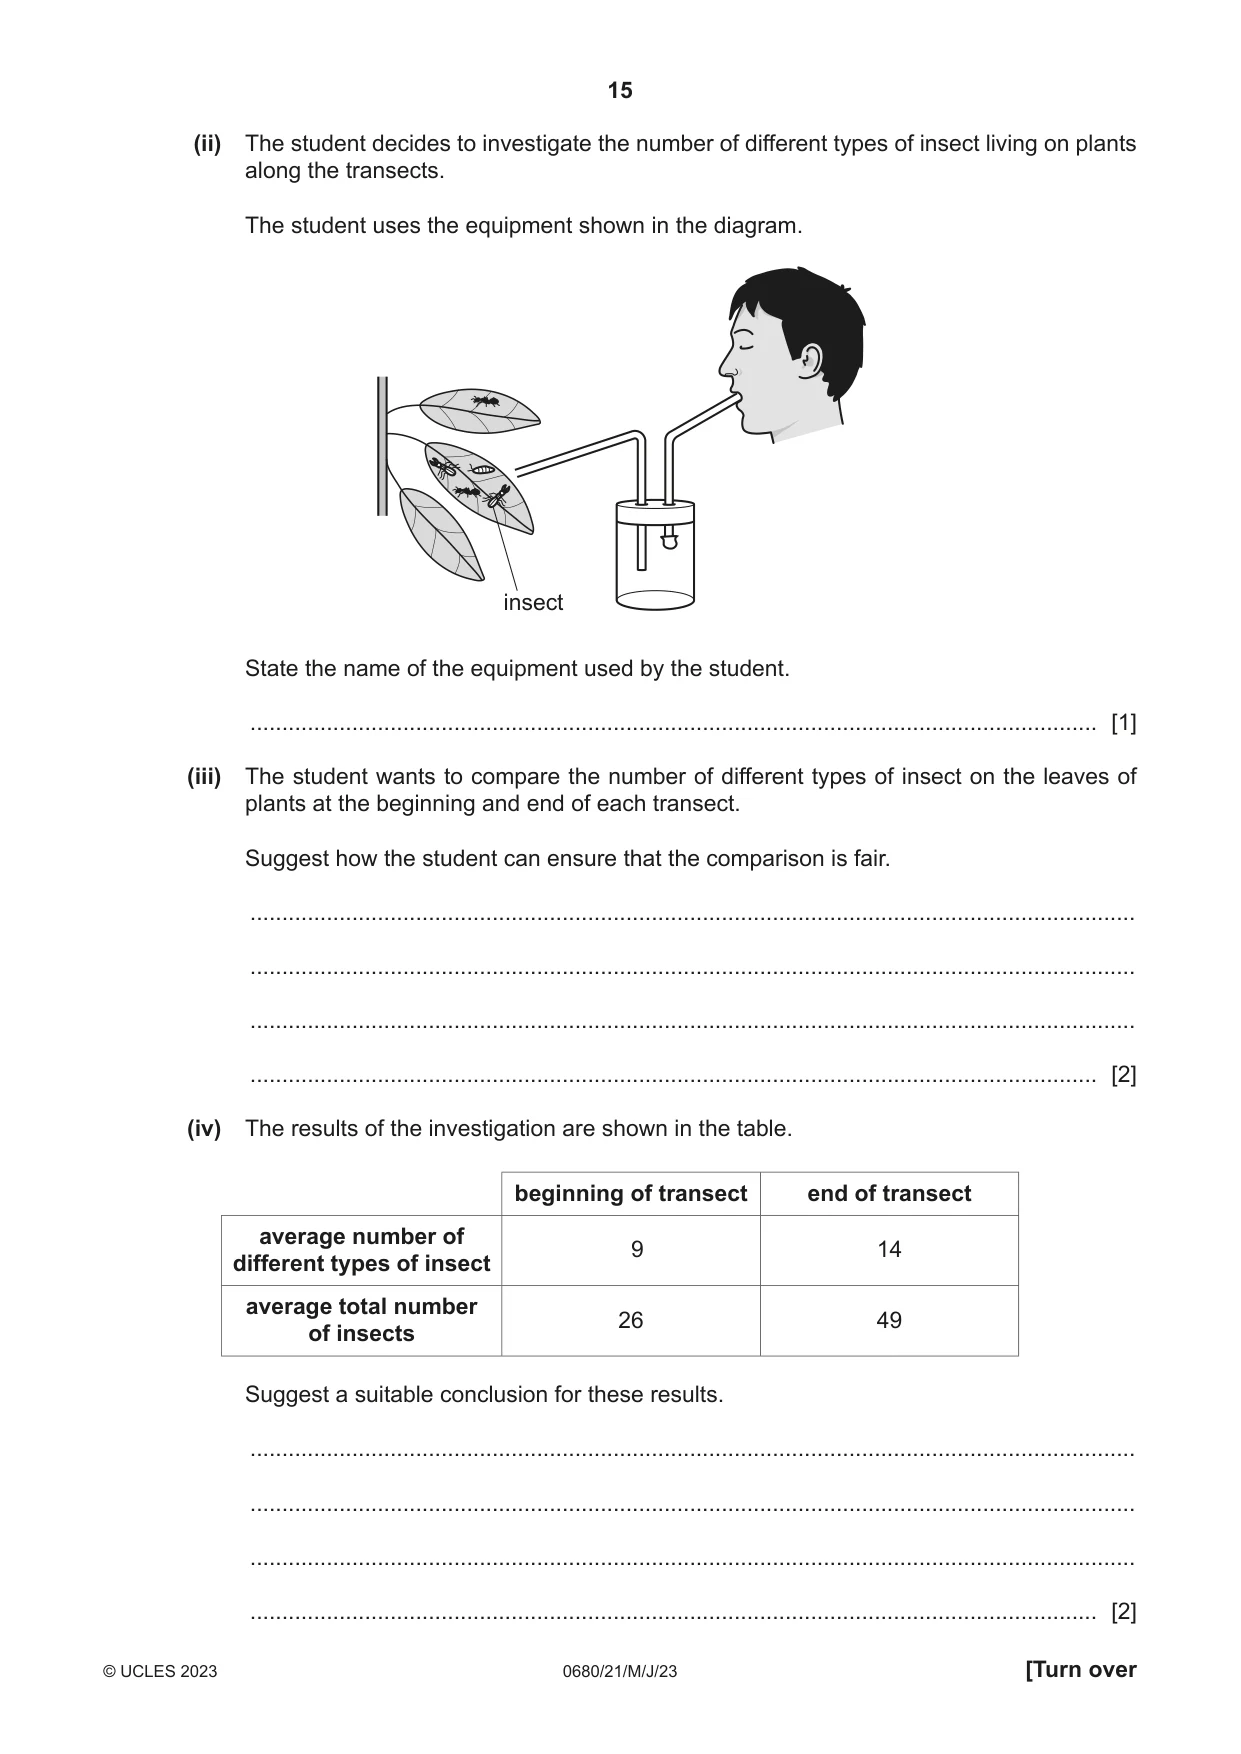
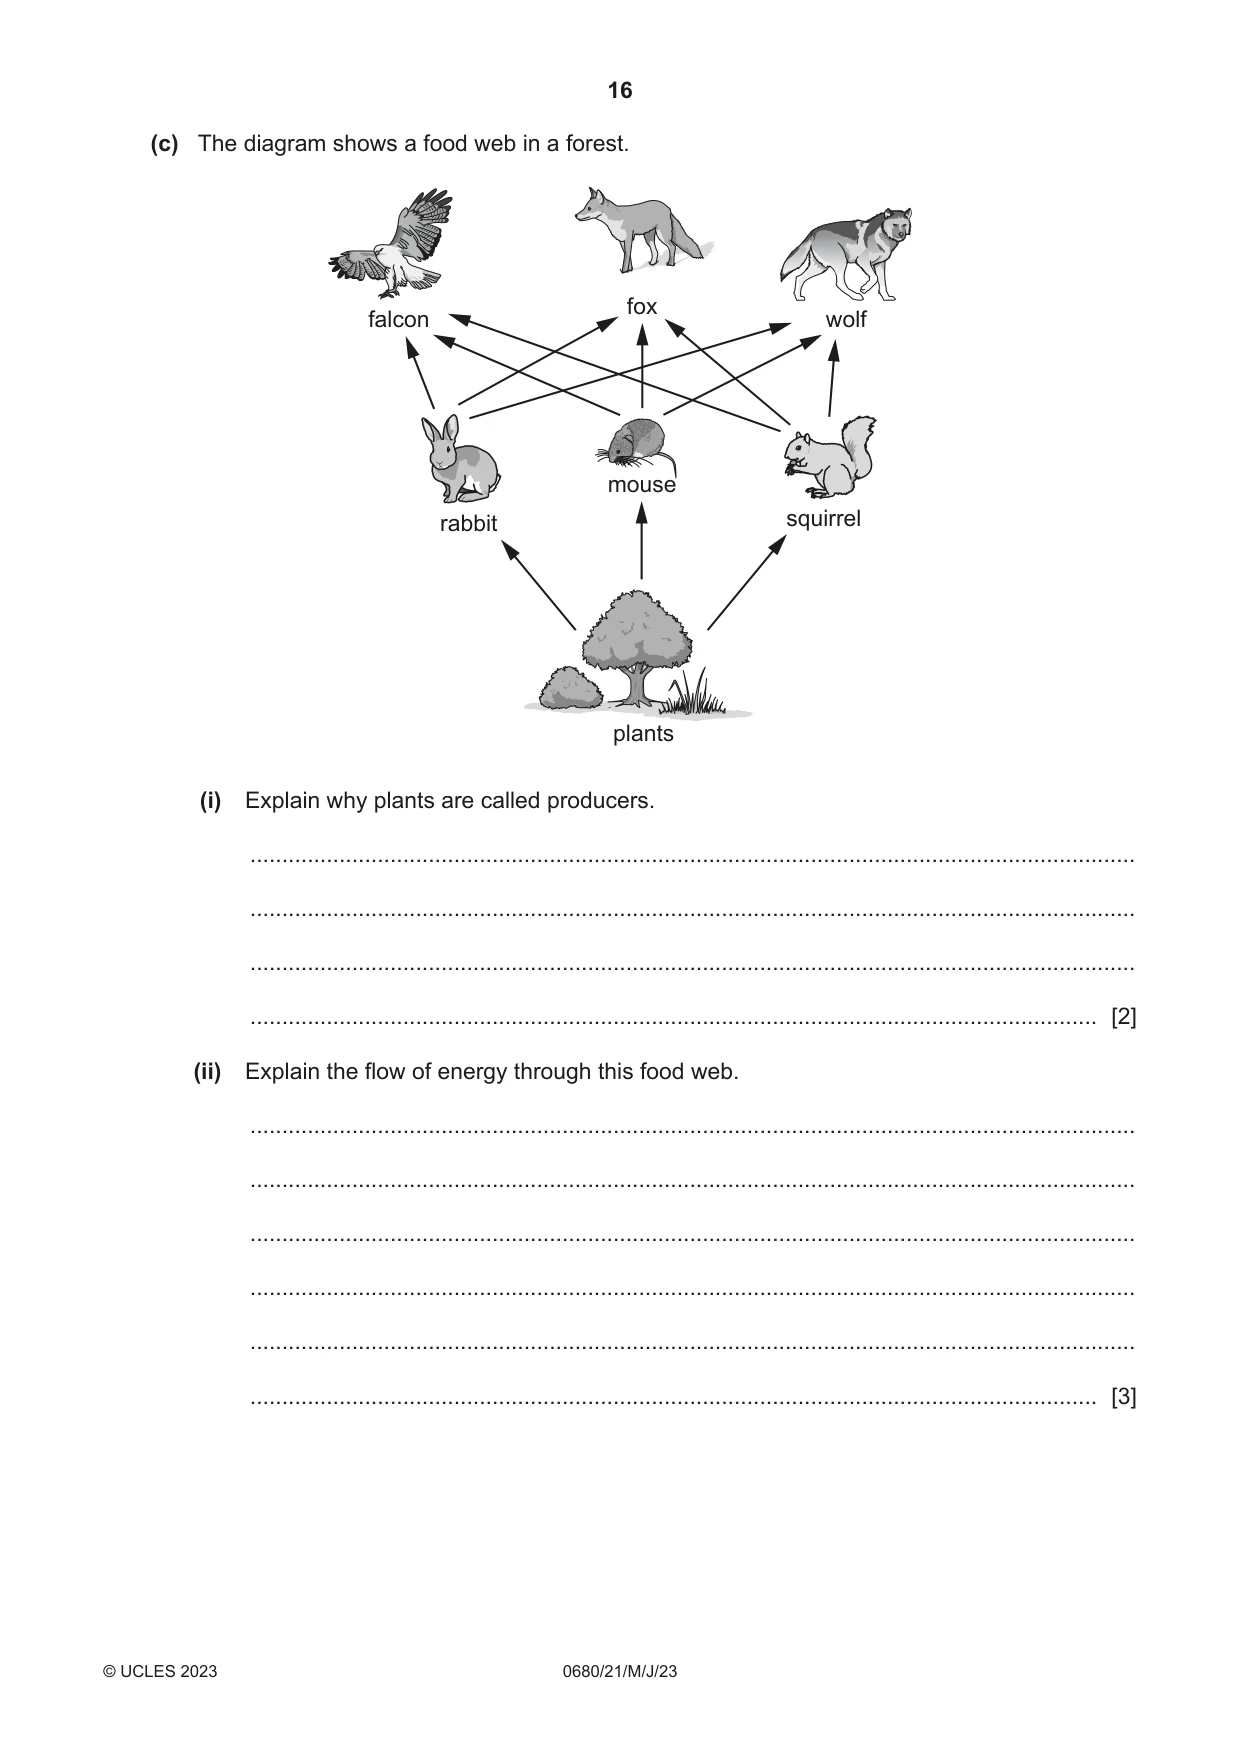
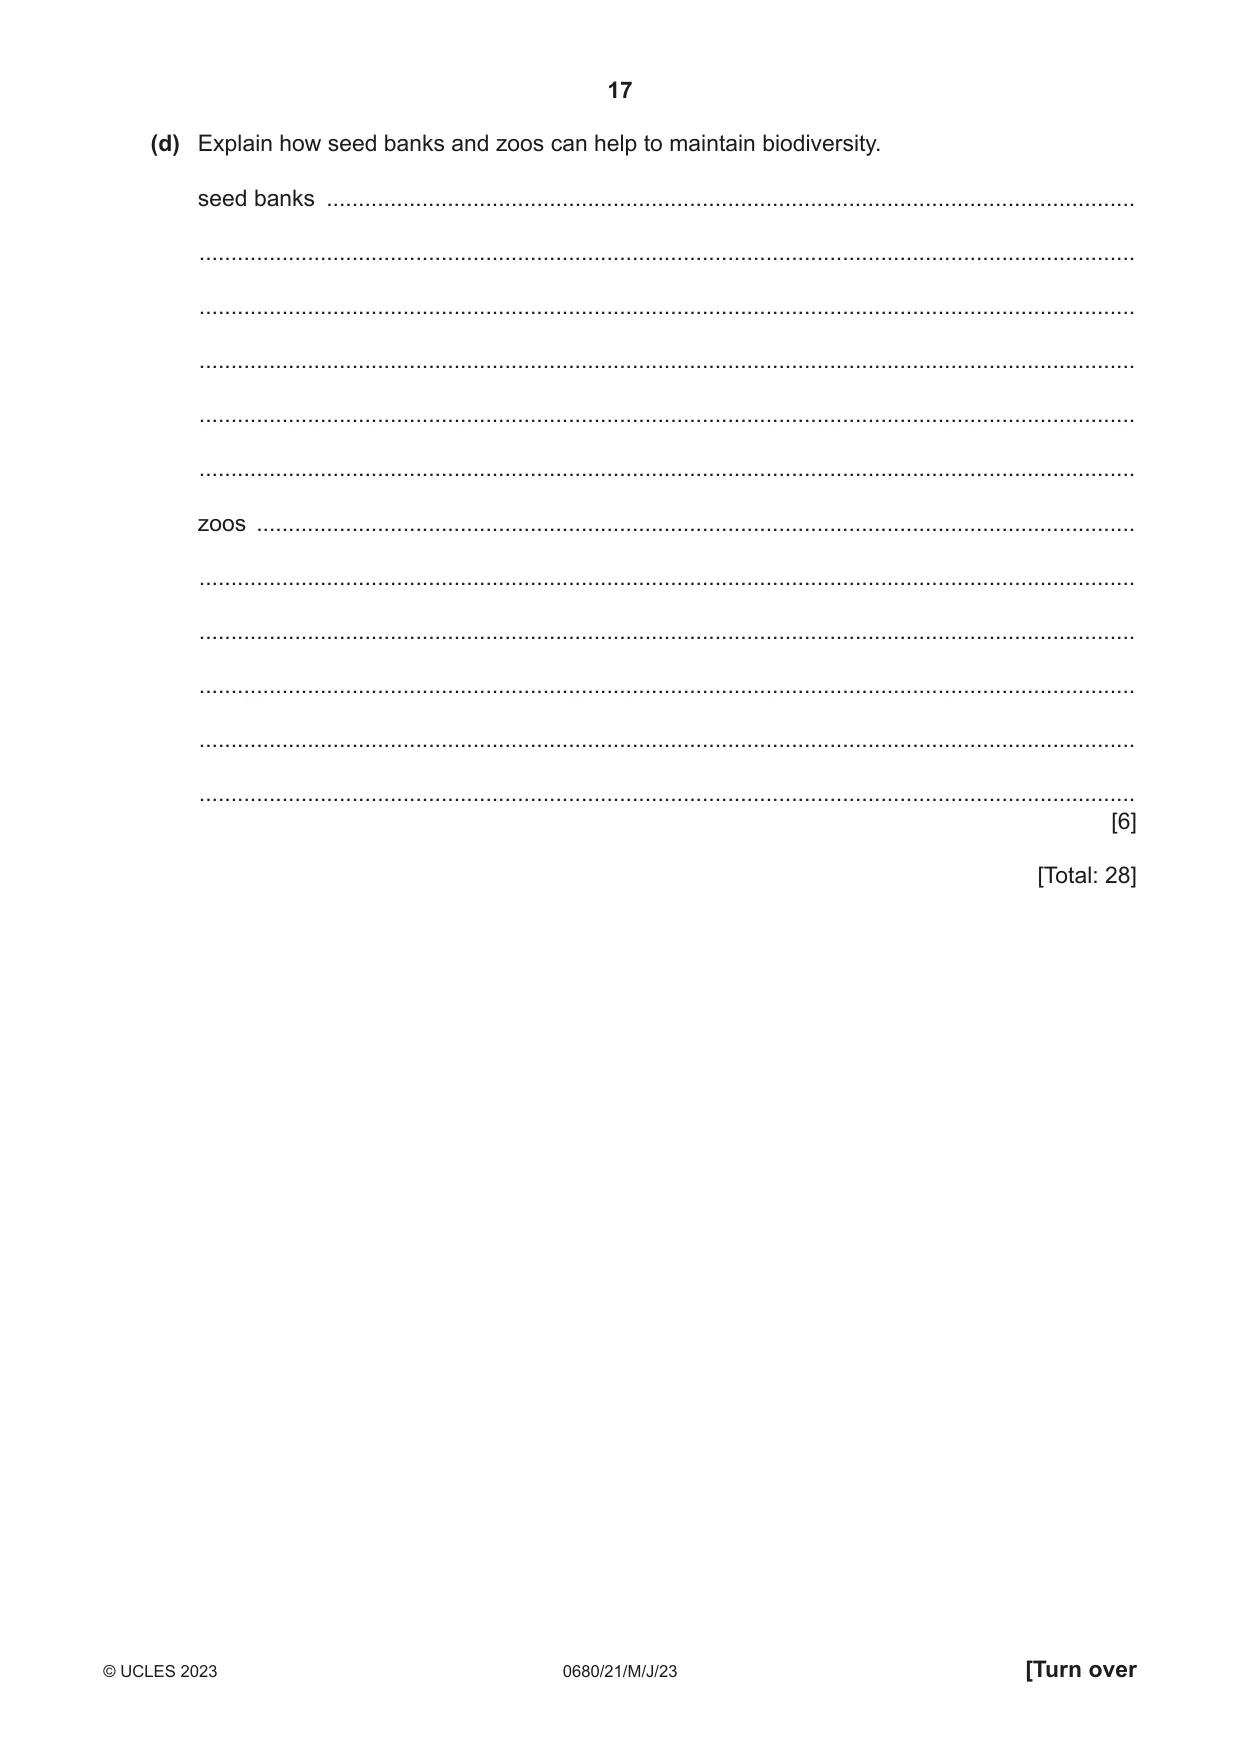
3 The photograph shows part of a forest in Denmark being harvested. trailer carrying wood The forests in Denmark are managed to promote biodiversity. (a) (i) The management aims to maintain the forest ecosystem. State what is meant by the term ecosystem. ........................................................................................................................................... ..................................................................................................................................... [1] (ii) Describe how timber extraction can be done to maintain biodiversity. ........................................................................................................................................... ........................................................................................................................................... ........................................................................................................................................... ..................................................................................................................................... [2] (iii) The wood on the trailer is 3.0 m long, 2.5 m wide and 2.5 m in height. 1.0 m3 of wood has a mass of 1.25 tonnes. Calculate the total mass of wood on the trailer. .............................................. tonnes [2] (iv) The wood is processed into wood chips. The wood chips are burned instead of coal in power stations to generate electricity. Explain two differences between wood chips and coal as an energy resource. ........................................................................................................................................... ........................................................................................................................................... ........................................................................................................................................... ..................................................................................................................................... [2] (b) A student uses transect lines to survey the plant species, other than trees, in the forest shown in the photograph. The transect lines are placed as shown. 0 10 transect 1 m transect 2 road transect 3 (i) Describe how the student can use a quadrat to record the number of different plant species. ........................................................................................................................................... ........................................................................................................................................... ........................................................................................................................................... ........................................................................................................................................... ........................................................................................................................................... ........................................................................................................................................... ........................................................................................................................................... ........................................................................................................................................... ........................................................................................................................................... ..................................................................................................................................... [5] (ii) The student decides to investigate the number of different types of insect living on plants along the transects. The student uses the equipment shown in the diagram. insect State the name of the equipment used by the student. ..................................................................................................................................... [1] (iii) The student wants to compare the number of different types of insect on the leaves of plants at the beginning and end of each transect. Suggest how the student can ensure that the comparison is fair. ........................................................................................................................................... ........................................................................................................................................... ........................................................................................................................................... ..................................................................................................................................... [2] (iv) The results of the investigation are shown in the table. beginning of transect end of transect average number of 9 14 different types of insect average total number 26 49 of insects Suggest a suitable conclusion for these results. ........................................................................................................................................... ........................................................................................................................................... ........................................................................................................................................... ..................................................................................................................................... [2] (c) The diagram shows a food web in a forest. fox falcon wolf mouse rabbit squirrel plants (i) Explain why plants are called producers. ........................................................................................................................................... ........................................................................................................................................... ........................................................................................................................................... ..................................................................................................................................... [2] (ii) Explain the flow of energy through this food web. ........................................................................................................................................... ........................................................................................................................................... ........................................................................................................................................... ........................................................................................................................................... ........................................................................................................................................... ..................................................................................................................................... [3] (d) Explain how seed banks and zoos can help to maintain biodiversity. seed banks ............................................................................................................................... ................................................................................................................................................... ................................................................................................................................................... ................................................................................................................................................... ................................................................................................................................................... ................................................................................................................................................... zoos .......................................................................................................................................... ................................................................................................................................................... ................................................................................................................................................... ................................................................................................................................................... ................................................................................................................................................... ................................................................................................................................................... [6] [Total: 28]
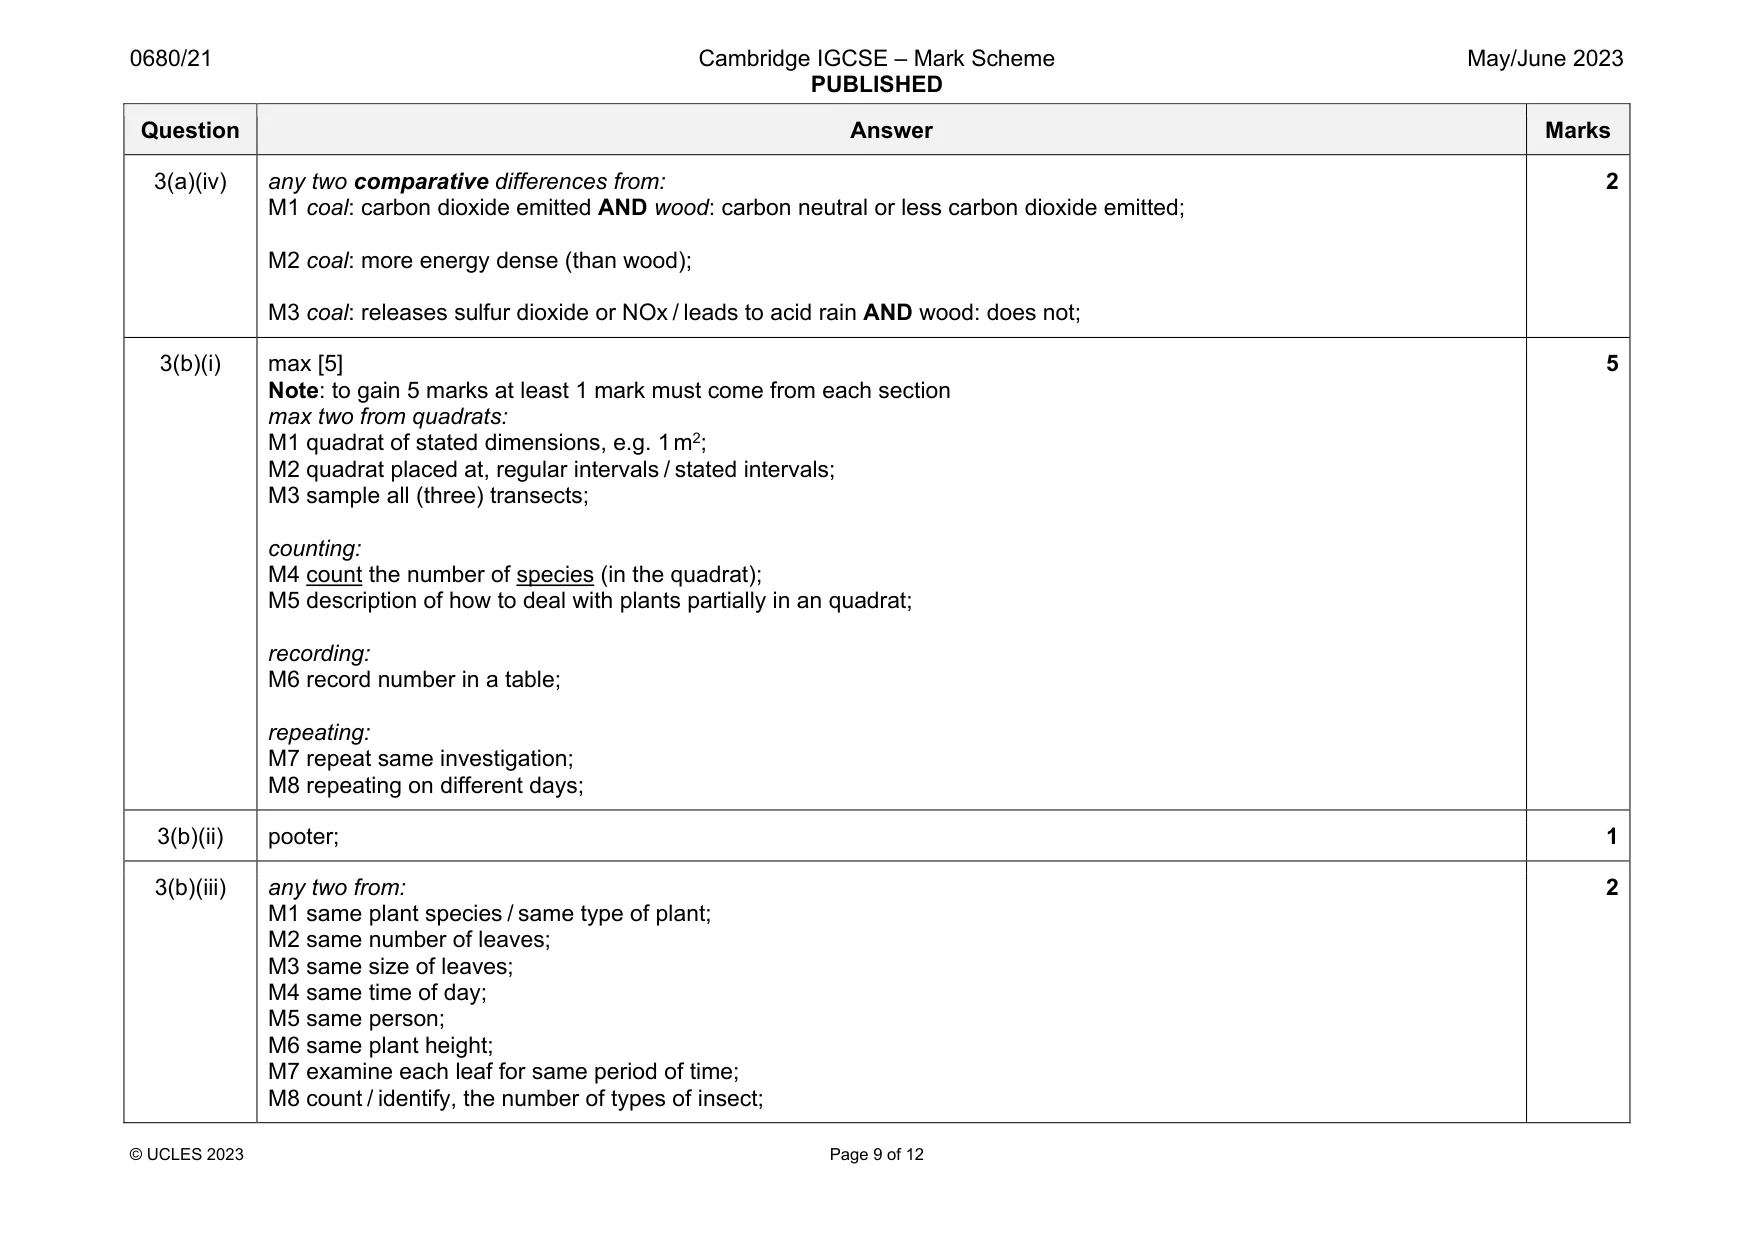
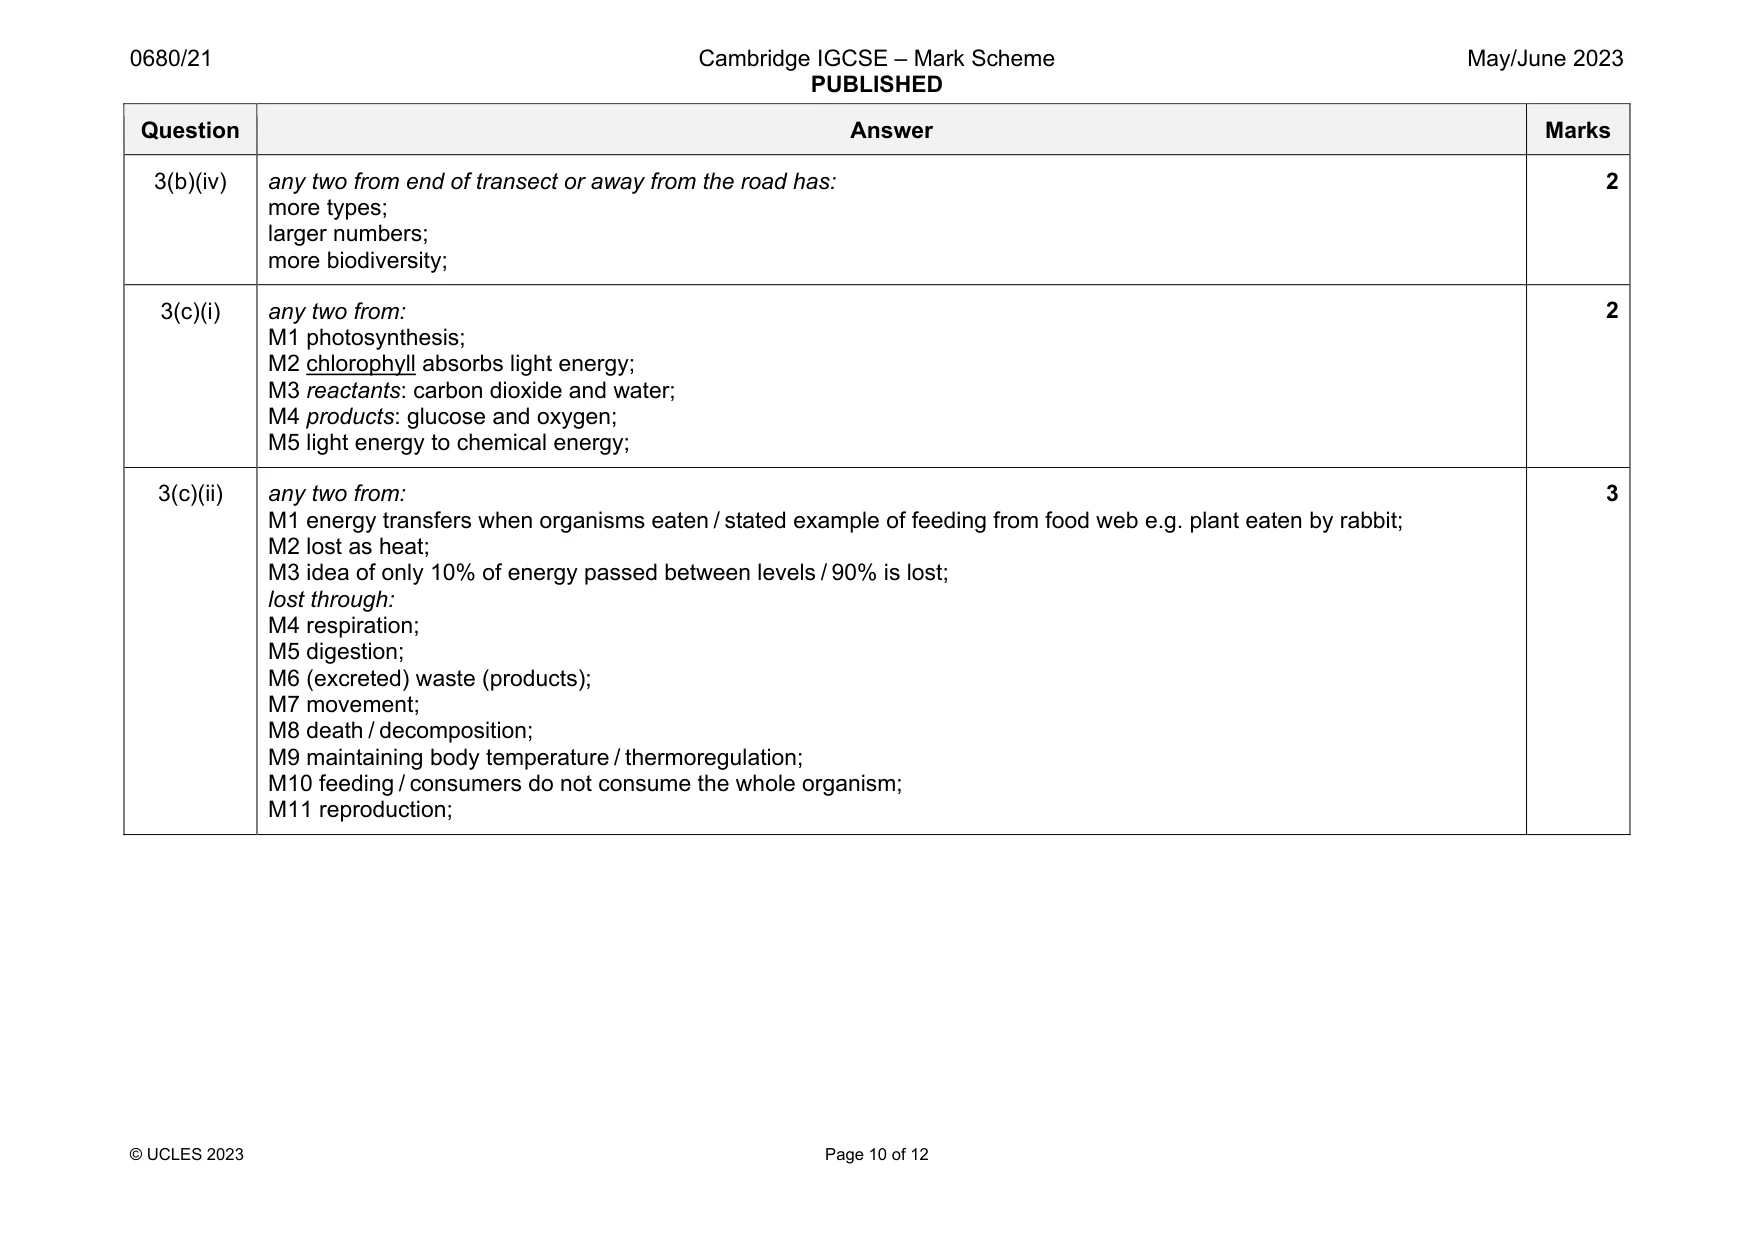
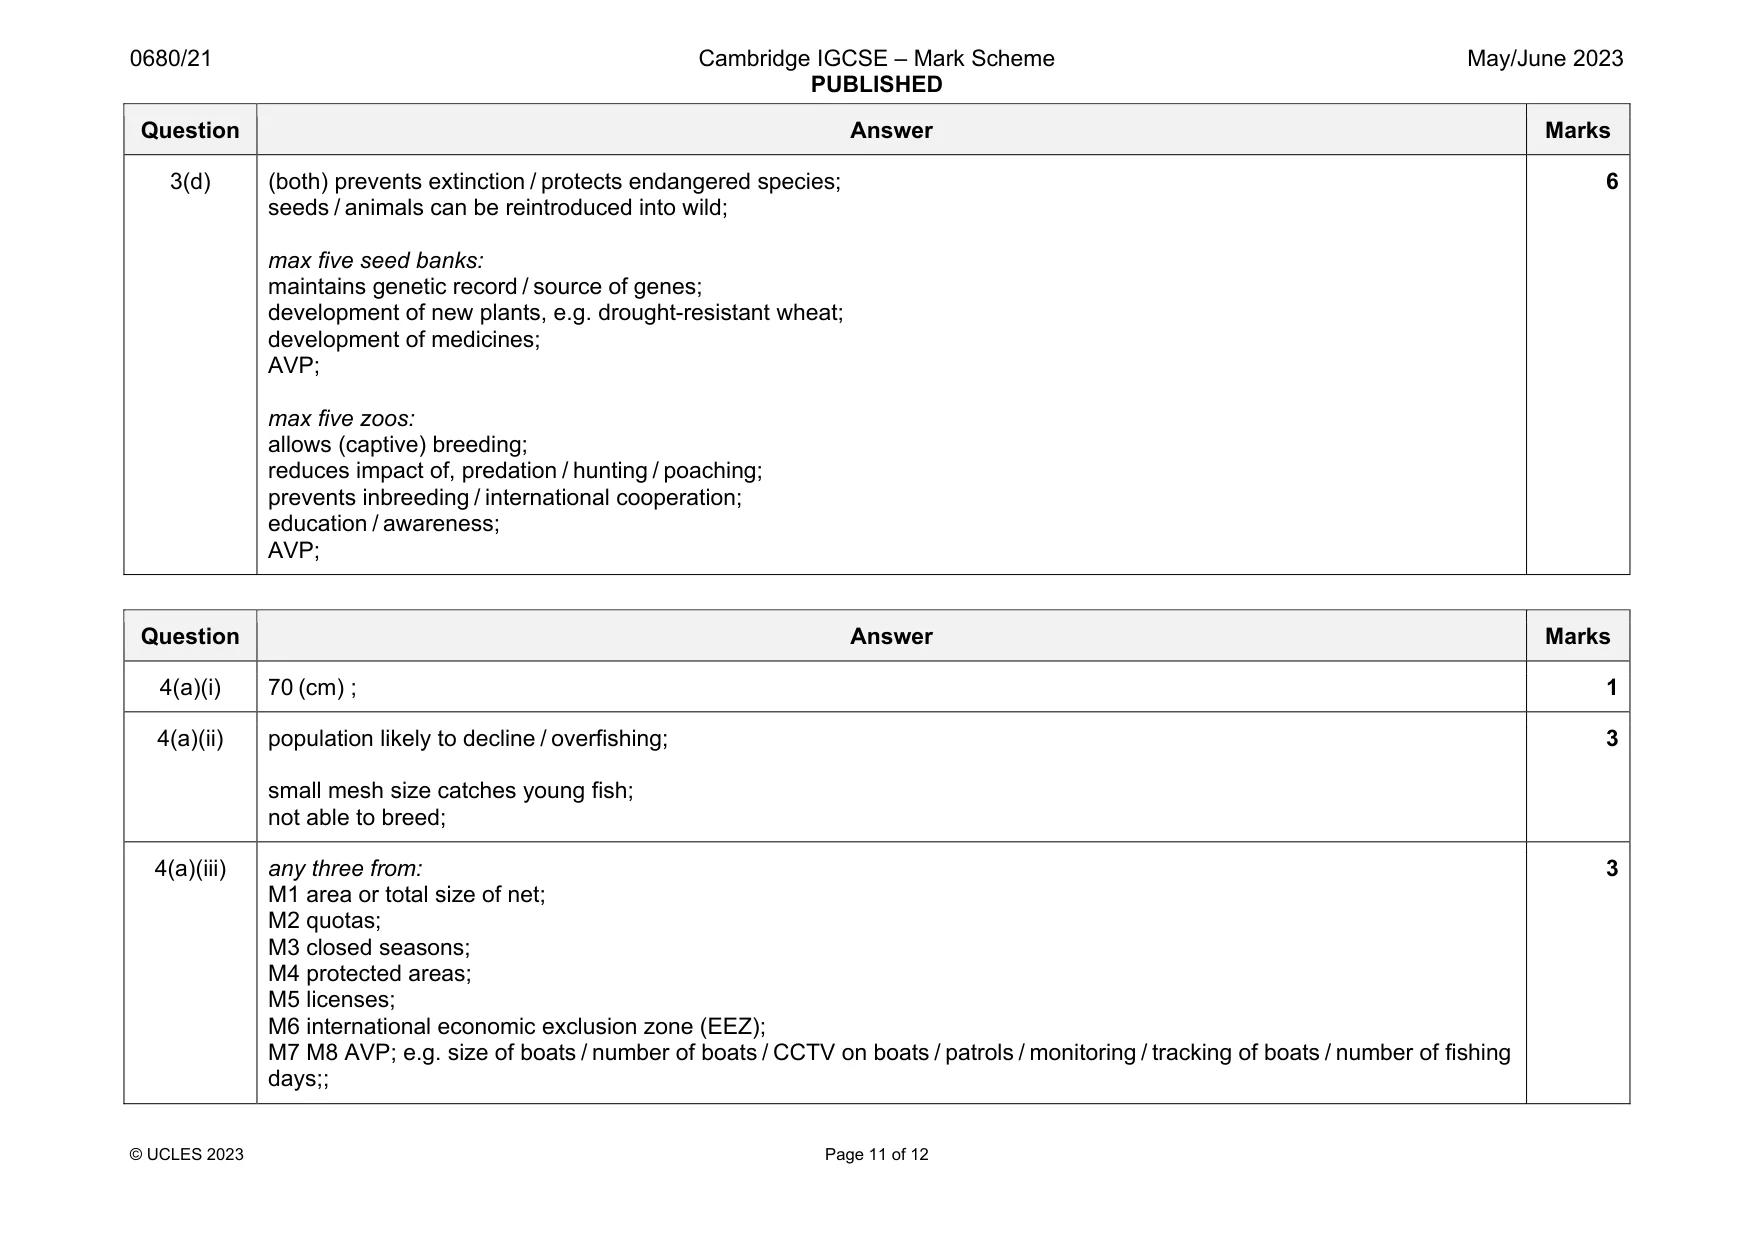
Mark scheme: 3(a)(i) all the living or biotic AND non-living or abiotic components (in an area); 1 3(a)(ii) any two from: M1 selective logging / sustainable harvesting; M2 species, not made extinct / can recover; M3 replant native species; M4 protected zones in the forest; 2 3(a)(iii) M1 calculation of volume = 18.75 (m3); M2 ( 1.25 = ) 23 (tonnes); 2 Question Answer Marks 3(a)(iv) any two comparative differences from: M1 coal: carbon dioxide emitted AND wood: carbon neutral or less carbon dioxide emitted; M2 coal: more energy dense (than wood); M3 coal: releases sulfur dioxide or NOx / leads to acid rain AND wood: does not; 2 3(b)(i) max [5] Note: to gain 5 marks at least 1 mark must come from each section max two from quadrats: M1 quadrat of stated dimensions, e.g. 1 m2; M2 quadrat placed at, regular intervals / stated intervals; M3 sample all (three) transects; counting: M4 count the number of species (in the quadrat); M5 description of how to deal with plants partially in an quadrat; recording: M6 record number in a table; repeating: M7 repeat same investigation; M8 repeating on different days; 5 3(b)(ii) pooter; 1 3(b)(iii) any two from: M1 same plant species / same type of plant; M2 same number of leaves; M3 same size of leaves; M4 same time of day; M5 same person; M6 same plant height; M7 examine each leaf for same period of time; M8 count / identify, the number of types of insect; 2 Question Answer Marks 3(b)(iv) any two from end of transect or away from the road has: more types; larger numbers; more biodiversity; 2 3(c)(i) any two from: M1 photosynthesis; M2 chlorophyll absorbs light energy; M3 reactants: carbon dioxide and water; M4 products: glucose and oxygen; M5 light energy to chemical energy; 2 3(c)(ii) any two from: M1 energy transfers when organisms eaten / stated example of feeding from food web e.g. plant eaten by rabbit; M2 lost as heat; M3 idea of only 10% of energy passed between levels / 90% is lost; lost through: M4 respiration; M5 digestion; M6 (excreted) waste (products); M7 movement; M8 death / decomposition; M9 maintaining body temperature / thermoregulation; M10 feeding / consumers do not consume the whole organism; M11 reproduction; 3 Question Answer Marks 3(d) (both) prevents extinction / protects endangered species; seeds / animals can be reintroduced into wild; max five seed banks: maintains genetic record / source of genes; development of new plants, e.g. drought-resistant wheat; development of medicines; AVP; max five zoos: allows (captive) breeding; reduces impact of, predation / hunting / poaching; prevents inbreeding / international cooperation; education / awareness; AVP; 6
Q4 · Many small fishing boats in Denmark use a gill net to catch fish
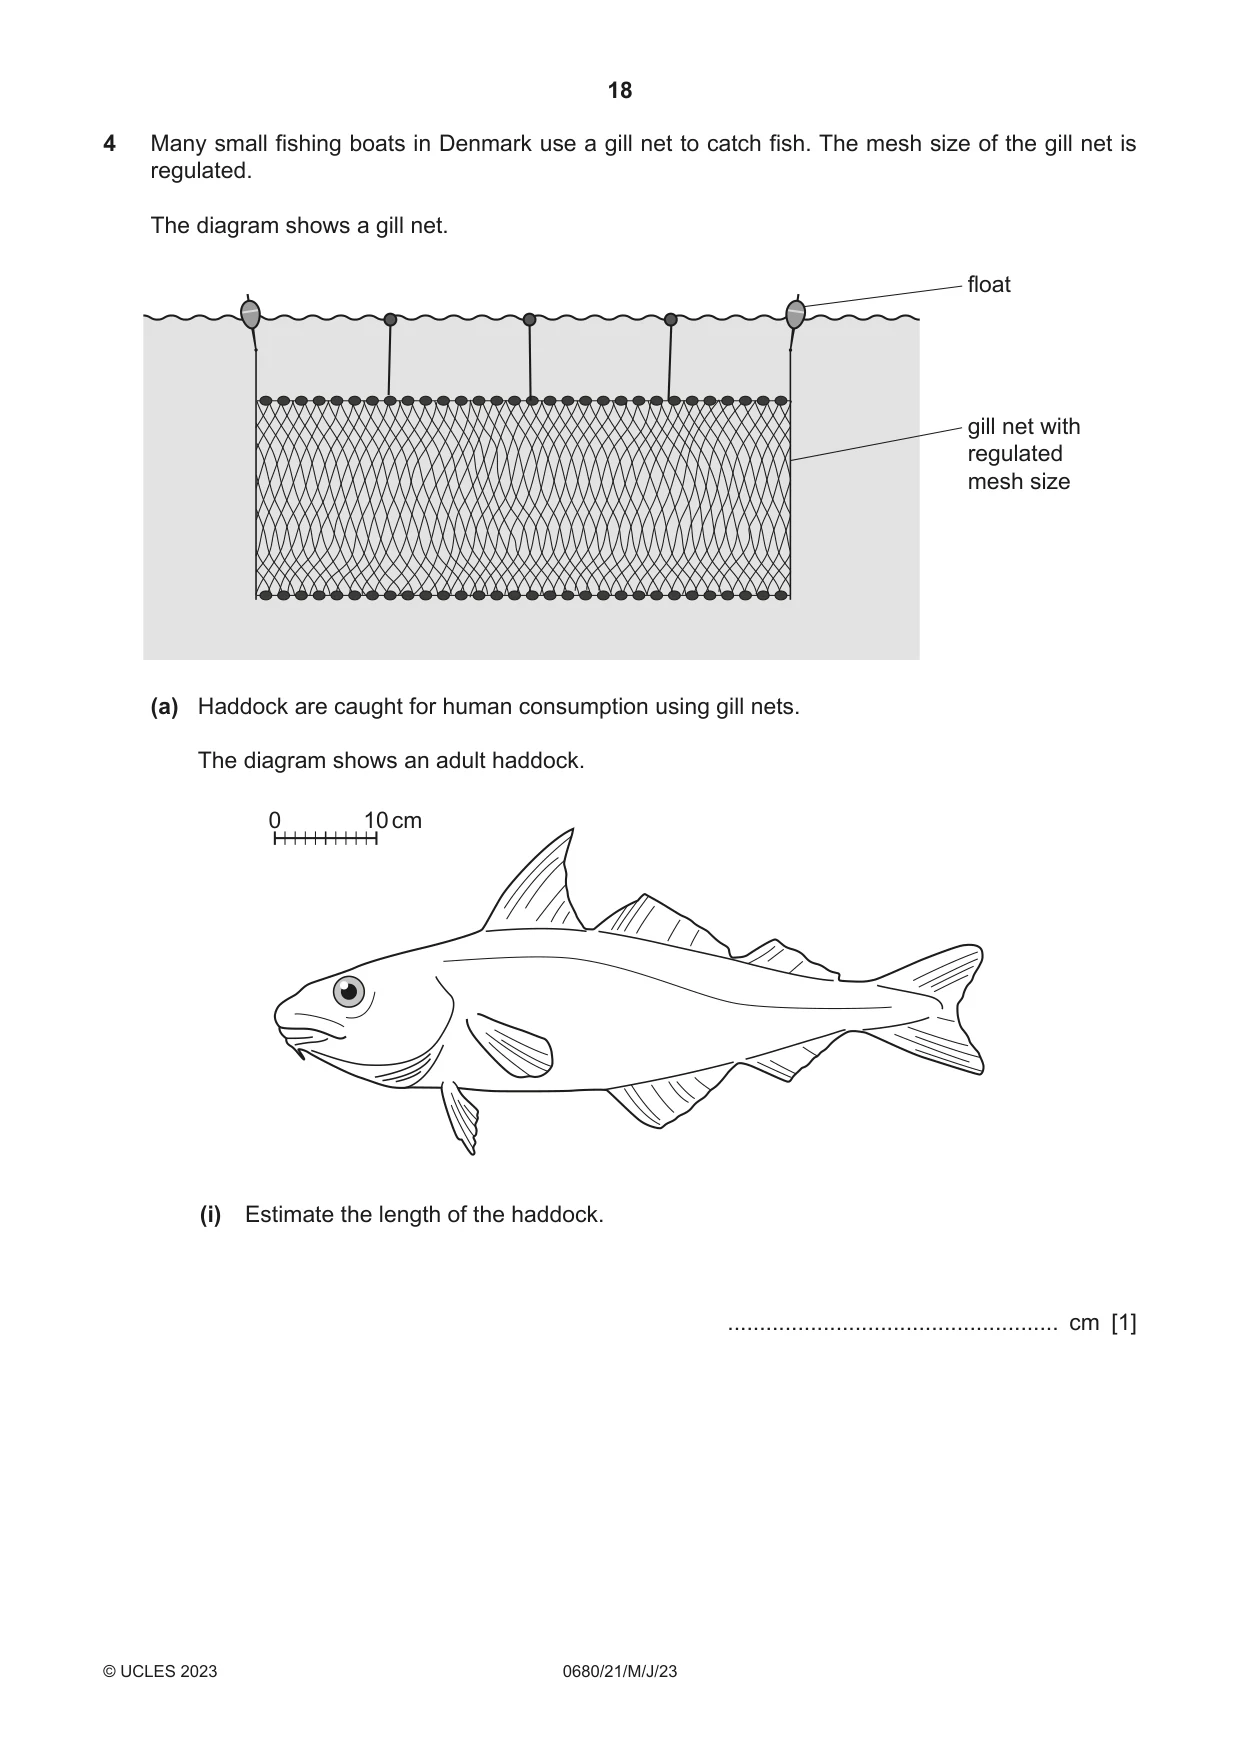
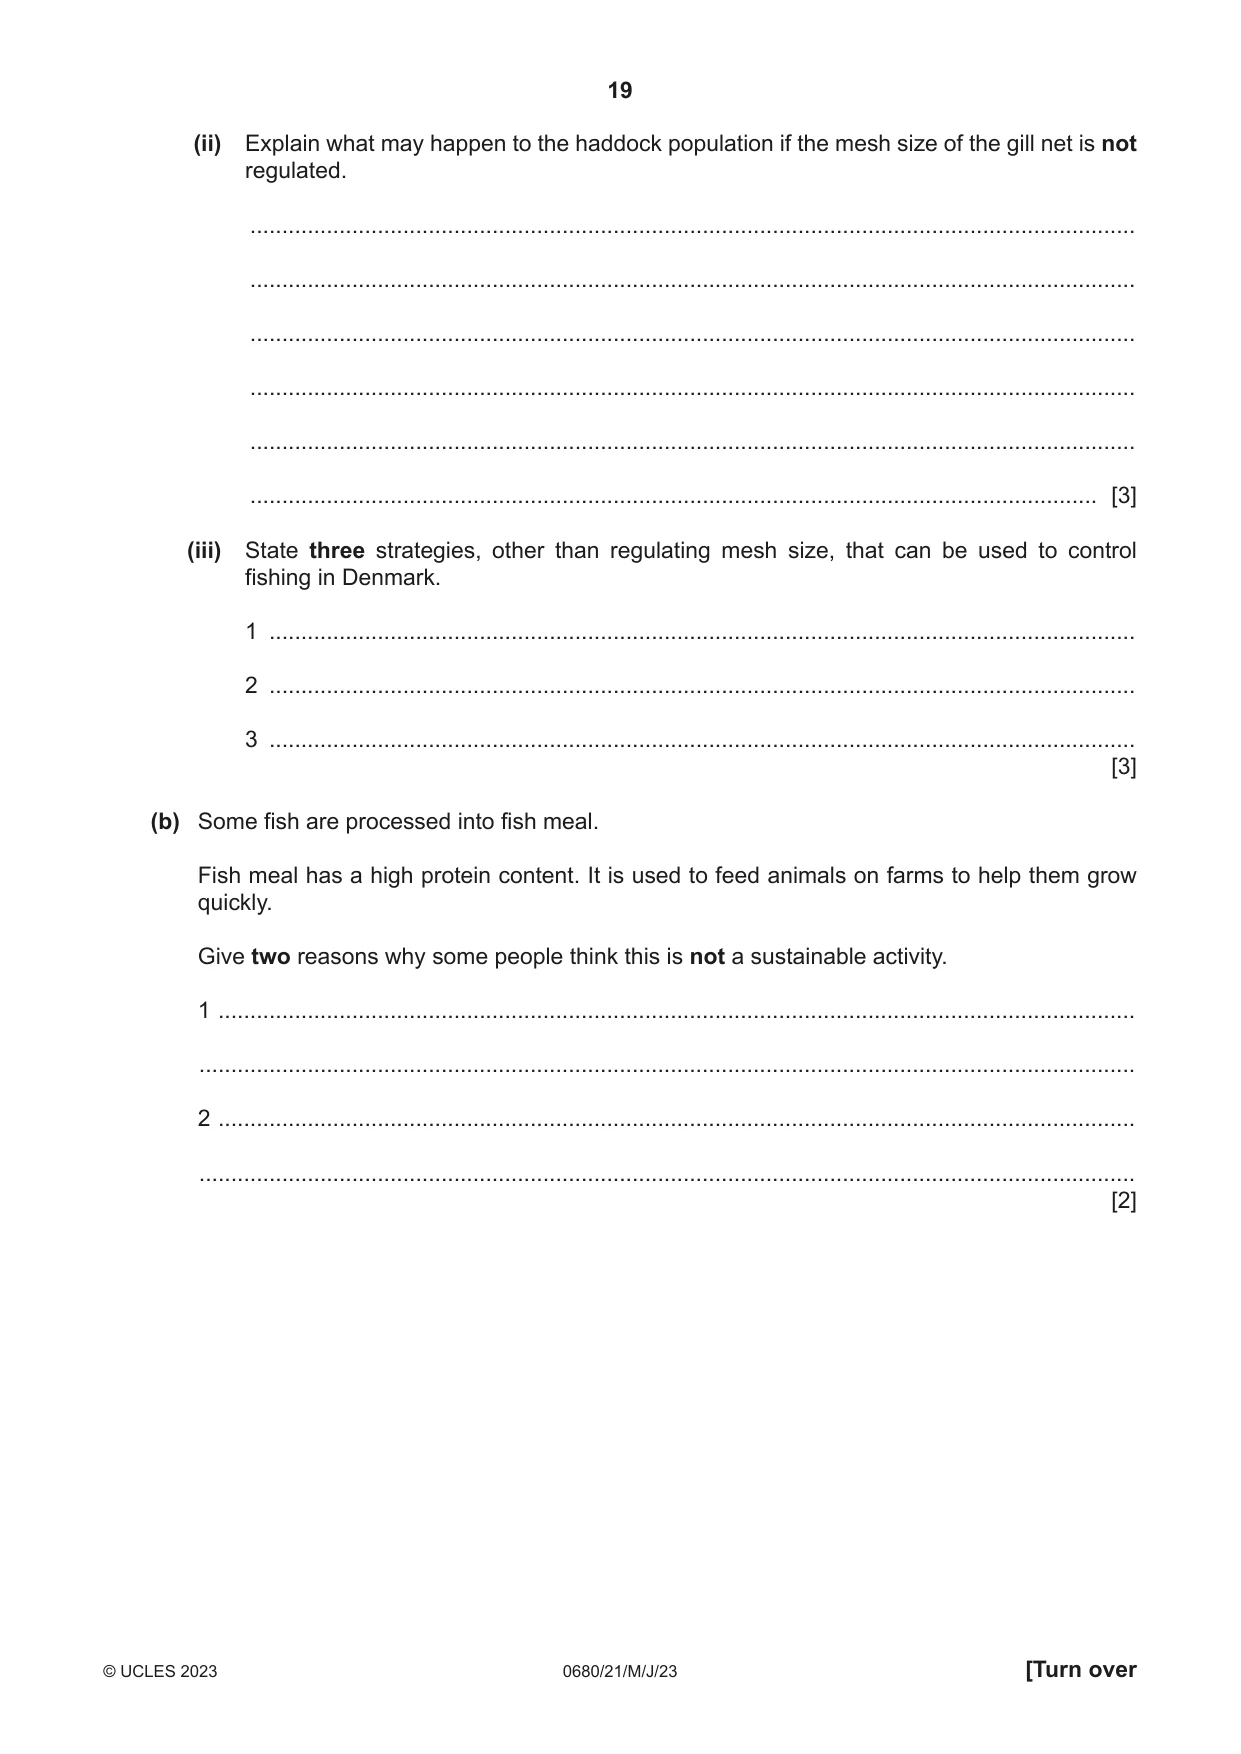
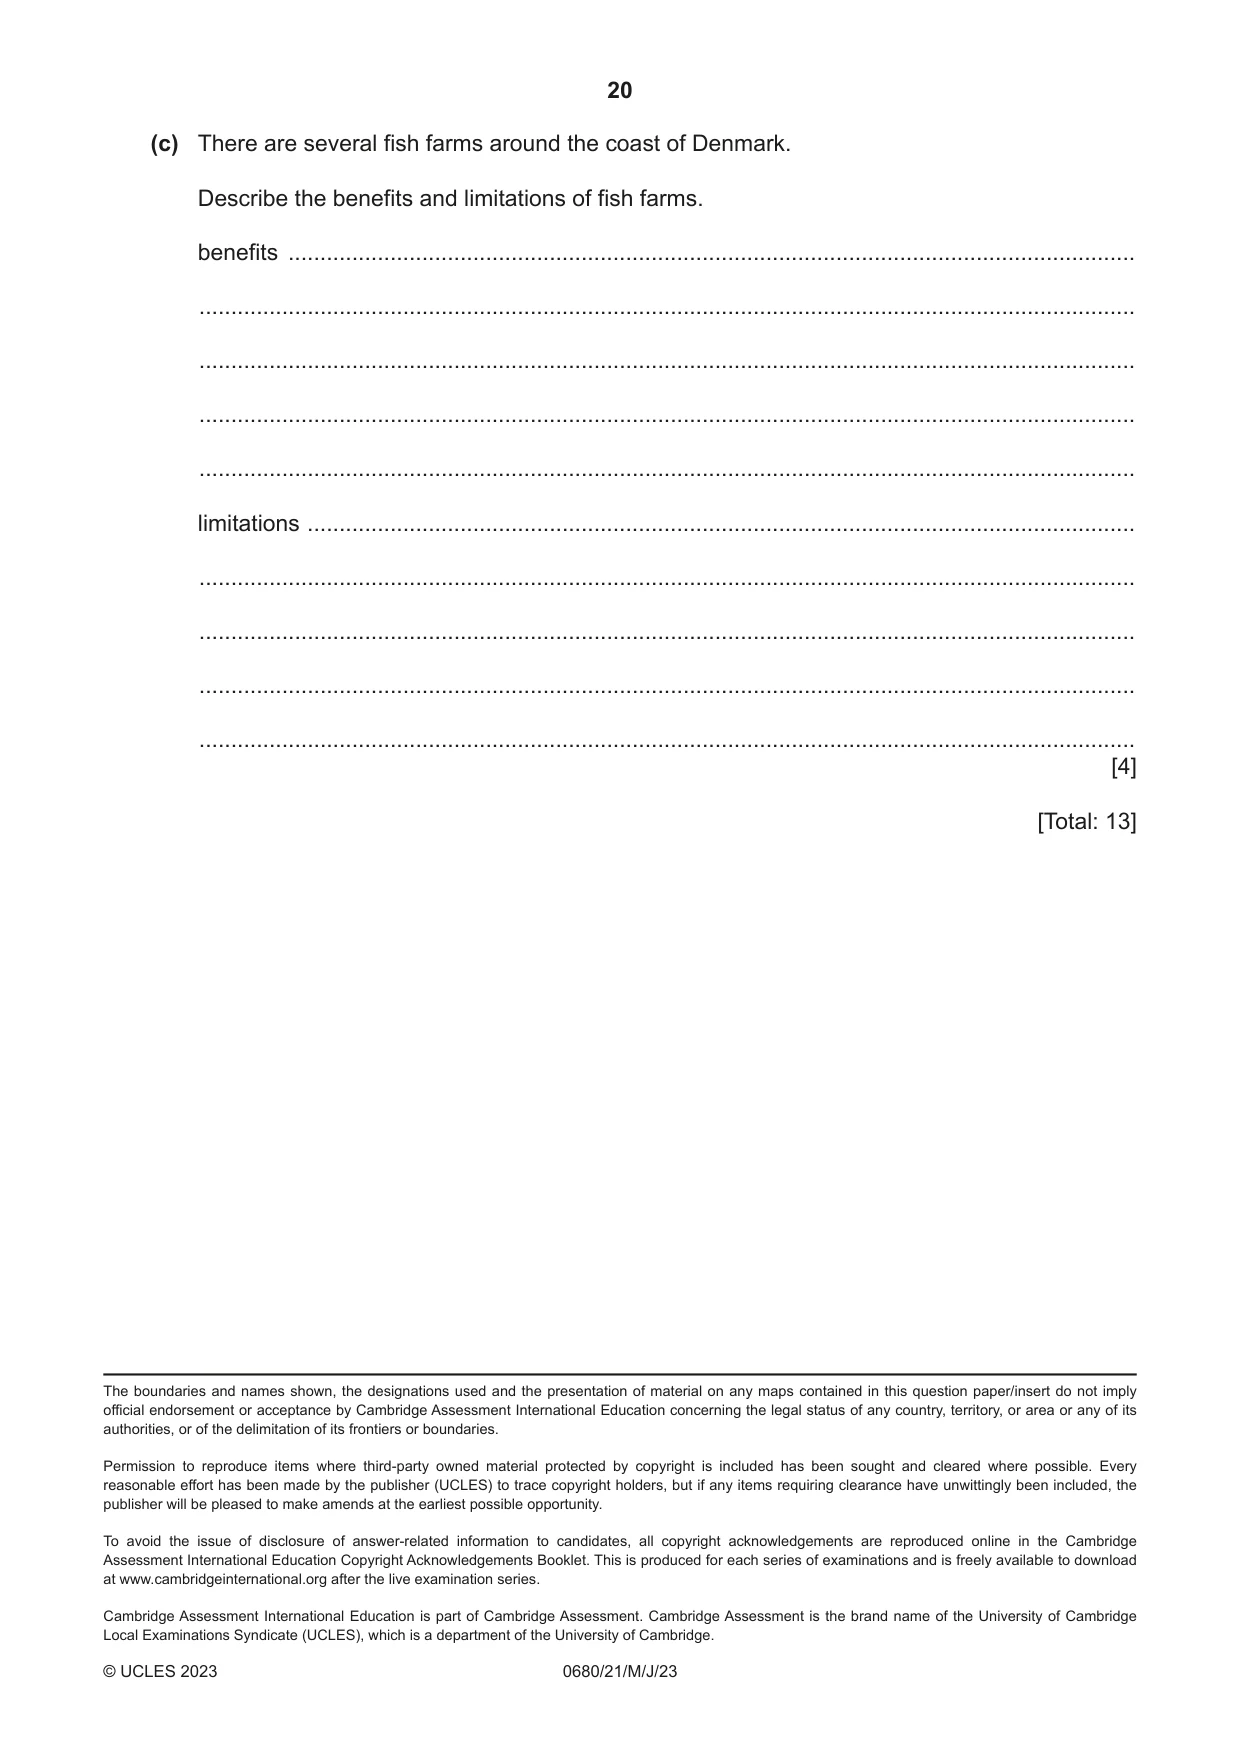
4 Many small fishing boats in Denmark use a gill net to catch fish. The mesh size of the gill net is regulated. The diagram shows a gill net. float gill net with regulated mesh size (a) Haddock are caught for human consumption using gill nets. The diagram shows an adult haddock. 0 10 cm (i) Estimate the length of the haddock. .................................................... cm [1] (ii) Explain what may happen to the haddock population if the mesh size of the gill net is not regulated. ........................................................................................................................................... ........................................................................................................................................... ........................................................................................................................................... ........................................................................................................................................... ........................................................................................................................................... ..................................................................................................................................... [3] (iii) State three strategies, other than regulating mesh size, that can be used to control fishing in Denmark. 1 ........................................................................................................................................ 2 ........................................................................................................................................ 3 ........................................................................................................................................ [3] (b) Some fish are processed into fish meal. Fish meal has a high protein content. It is used to feed animals on farms to help them grow quickly. Give two reasons why some people think this is not a sustainable activity. 1 ................................................................................................................................................ ................................................................................................................................................... 2 ................................................................................................................................................ ................................................................................................................................................... [2] (c) There are several fish farms around the coast of Denmark. Describe the benefits and limitations of fish farms. benefits ..................................................................................................................................... ................................................................................................................................................... ................................................................................................................................................... ................................................................................................................................................... ................................................................................................................................................... limitations .................................................................................................................................. ................................................................................................................................................... ................................................................................................................................................... ................................................................................................................................................... ................................................................................................................................................... [4] [Total: 13] The boundaries and names shown, the designations used and the presentation of material on any maps contained in this question paper/insert do not imply official endorsement or acceptance by Cambridge Assessment International Education concerning the legal status of any country, territory, or area or any of its authorities, or of the delimitation of its frontiers or boundaries.
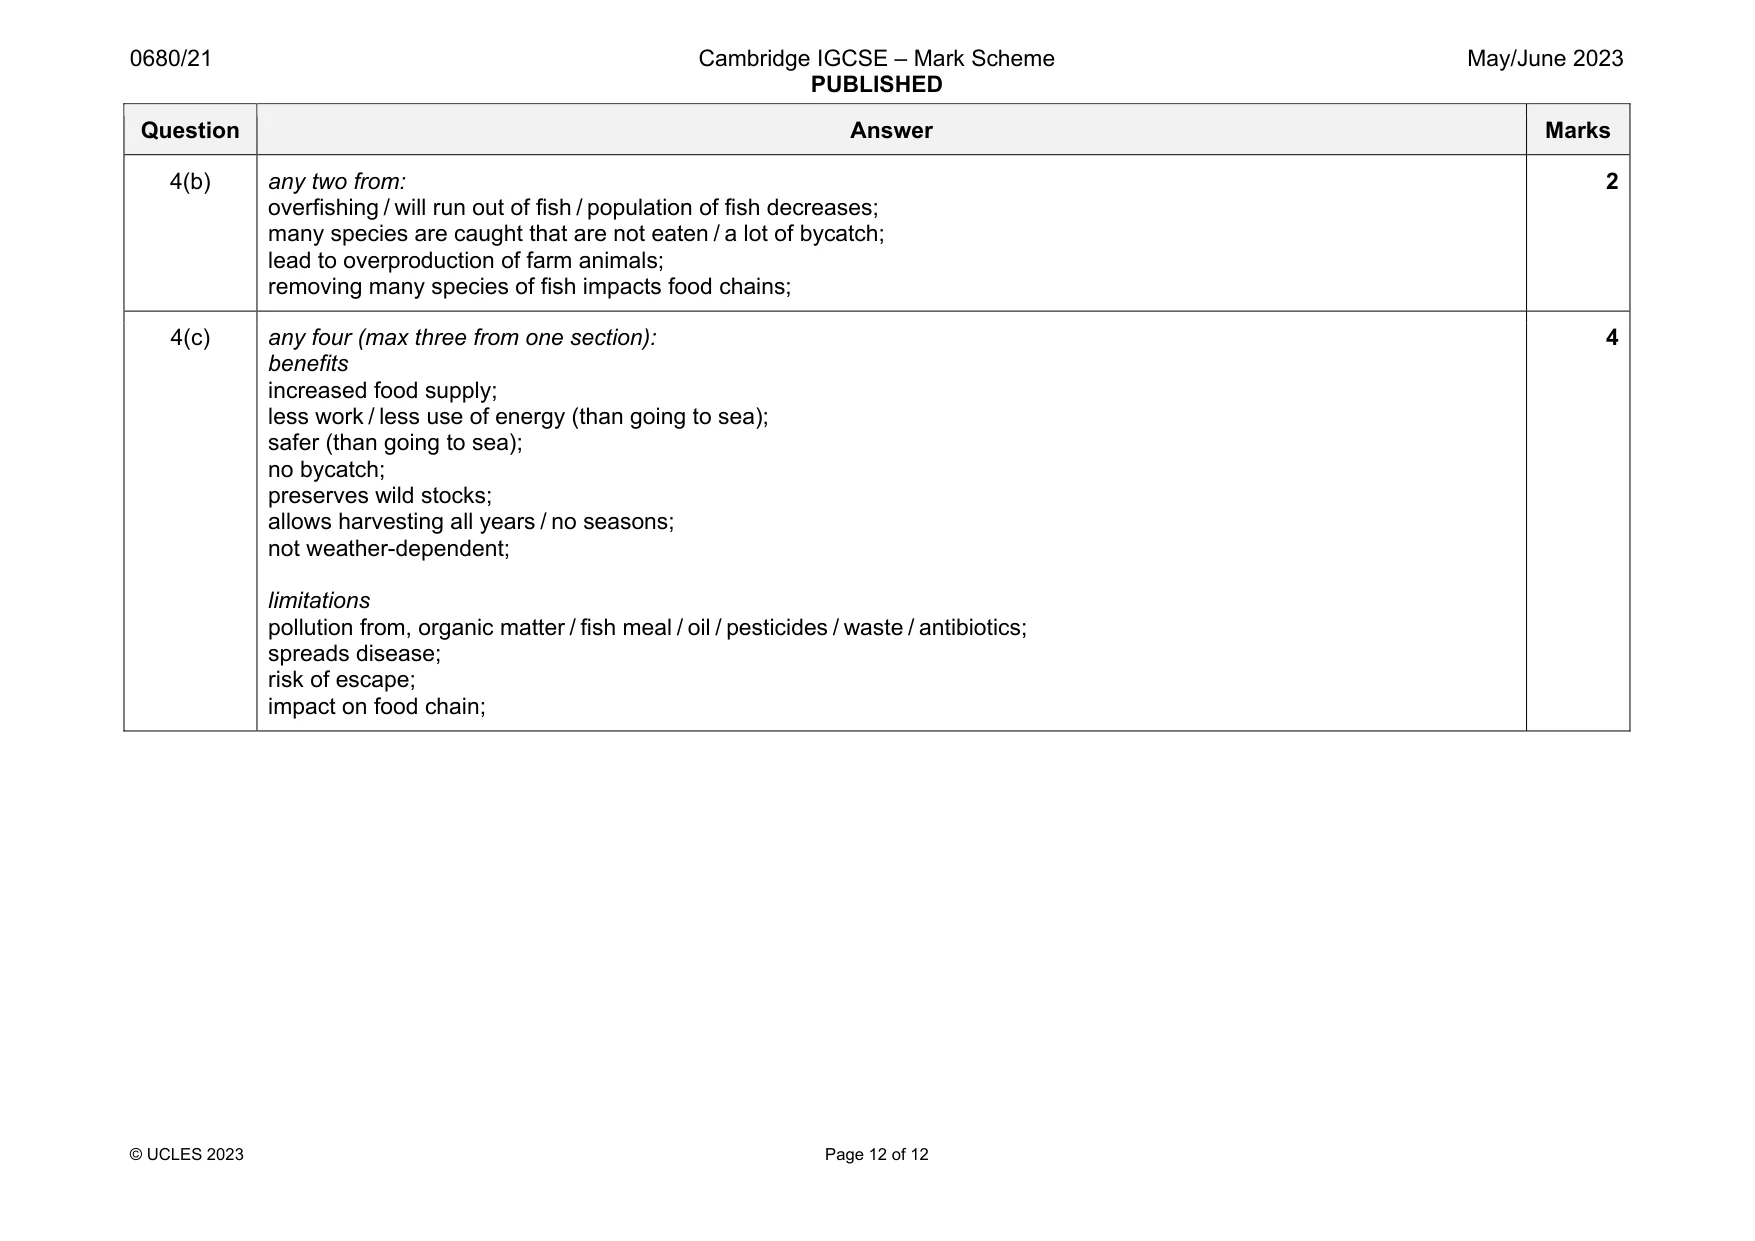
Mark scheme: 4(a)(i) 70 (cm) ; 1 4(a)(ii) population likely to decline / overfishing; small mesh size catches young fish; not able to breed; 3 4(a)(iii) any three from: M1 area or total size of net; M2 quotas; M3 closed seasons; M4 protected areas; M5 licenses; M6 international economic exclusion zone (EEZ); M7 M8 AVP; e.g. size of boats / number of boats / CCTV on boats / patrols / monitoring / tracking of boats / number of fishing days;; 3 Question Answer Marks 4(b) any two from: overfishing / will run out of fish / population of fish decreases; many species are caught that are not eaten / a lot of bycatch; lead to overproduction of farm animals; removing many species of fish impacts food chains; 2 4(c) any four (max three from one section): benefits increased food supply; less work / less use of energy (than going to sea); safer (than going to sea); no bycatch; preserves wild stocks; allows harvesting all years / no seasons; not weather-dependent; limitations pollution from, organic matter / fish meal / oil / pesticides / waste / antibiotics; spreads disease; risk of escape; impact on food chain; 4
What was in this paper
The subtopics covered by these 4 questions, and how many questions each got. Open one in a new tab to see every Cambridge question on it.
What you needed in this session
Cambridge’s own grade thresholds for 2023 May/June, Paper 2 · Variant 1. A higher threshold means an easier paper — the bar moves with how the cohort did.