Cambridge IGCSE Environmental Management 0680 — 2020 Oct/Nov Paper 2 · Variant 3
0680/23/O/N/20 · 3 questions · 80 marks · ≈90 min
The question paper and its mark scheme, free to read here and free to download. This is Cambridge’s own paper, exactly as it was sat.
Question paper24 pages
Mark scheme12 pages
Answers below. Sit the paper first if you are practising.
Questions as text
Q1 · The population of Florida in 2016 was 18.8 million people
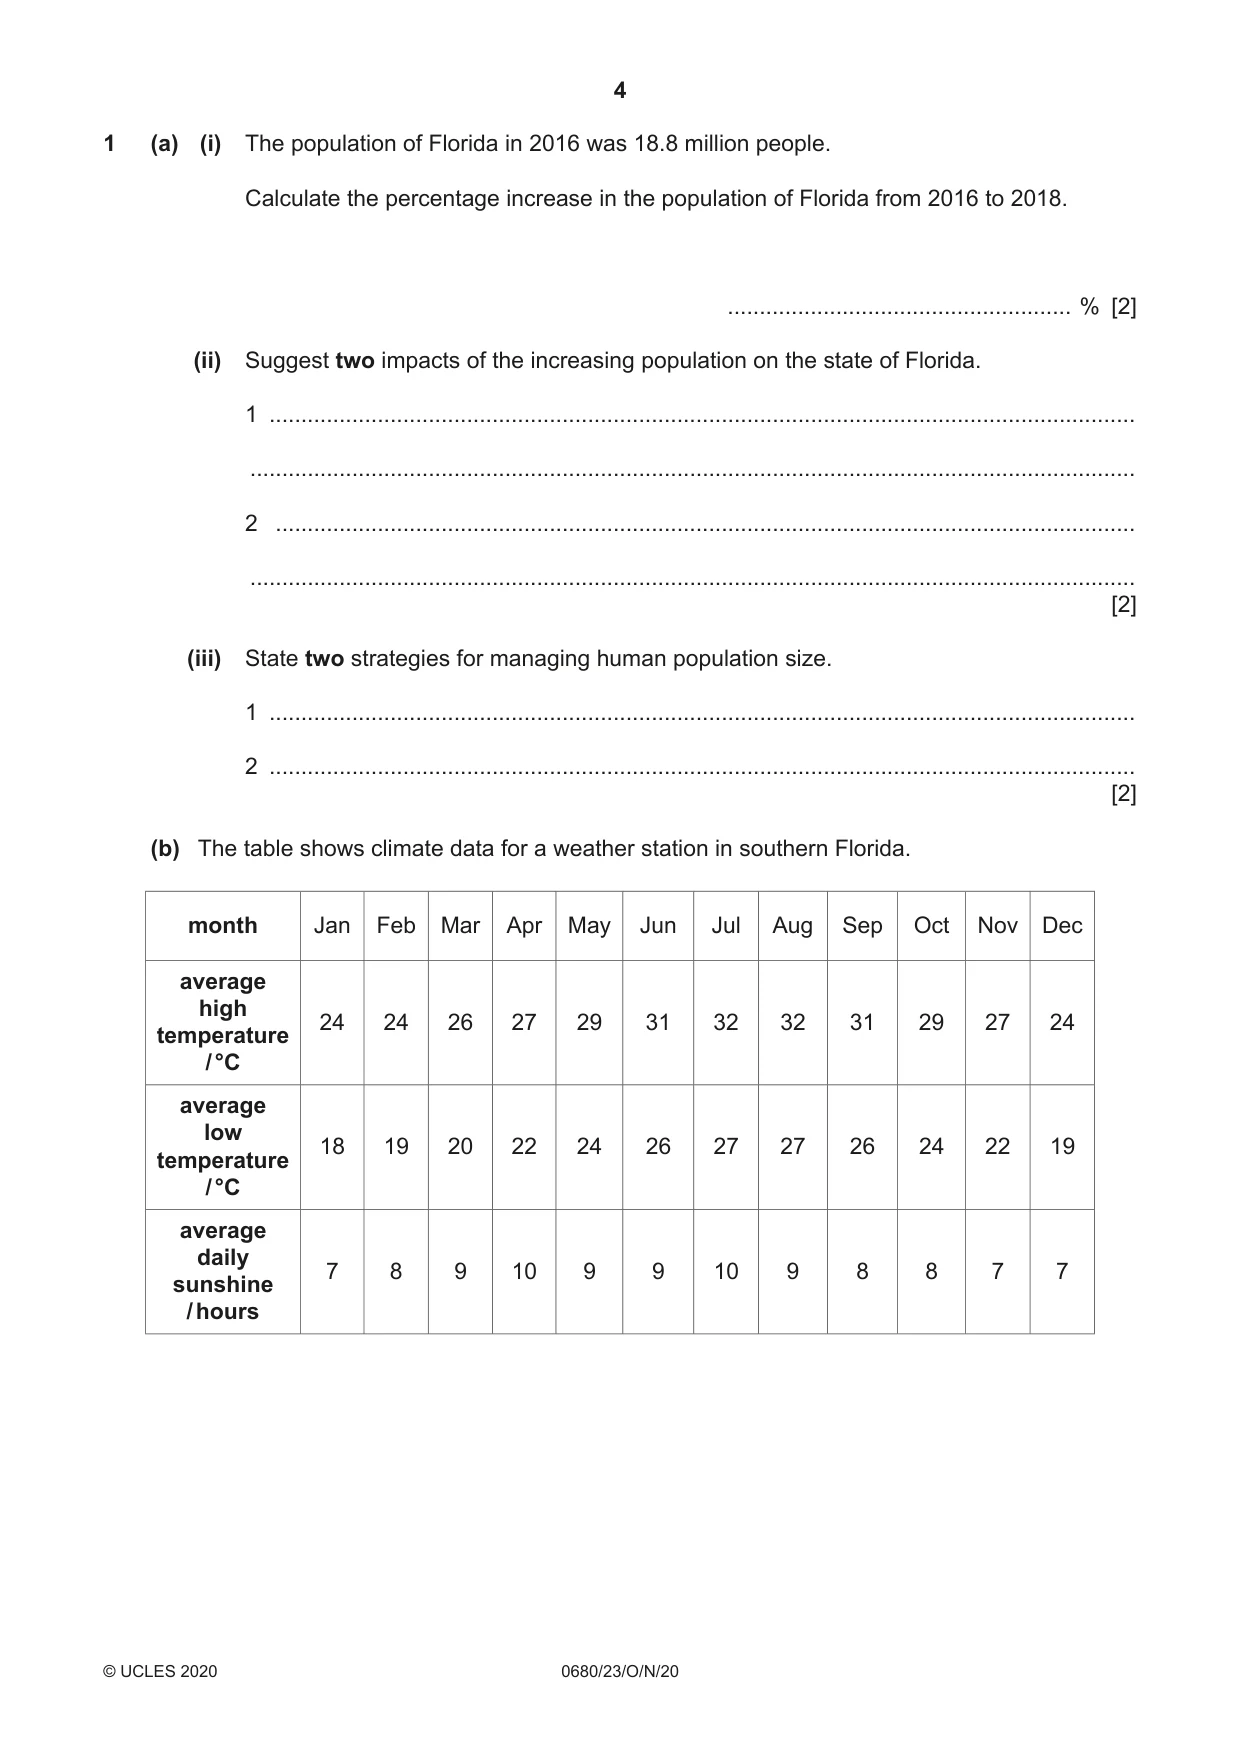
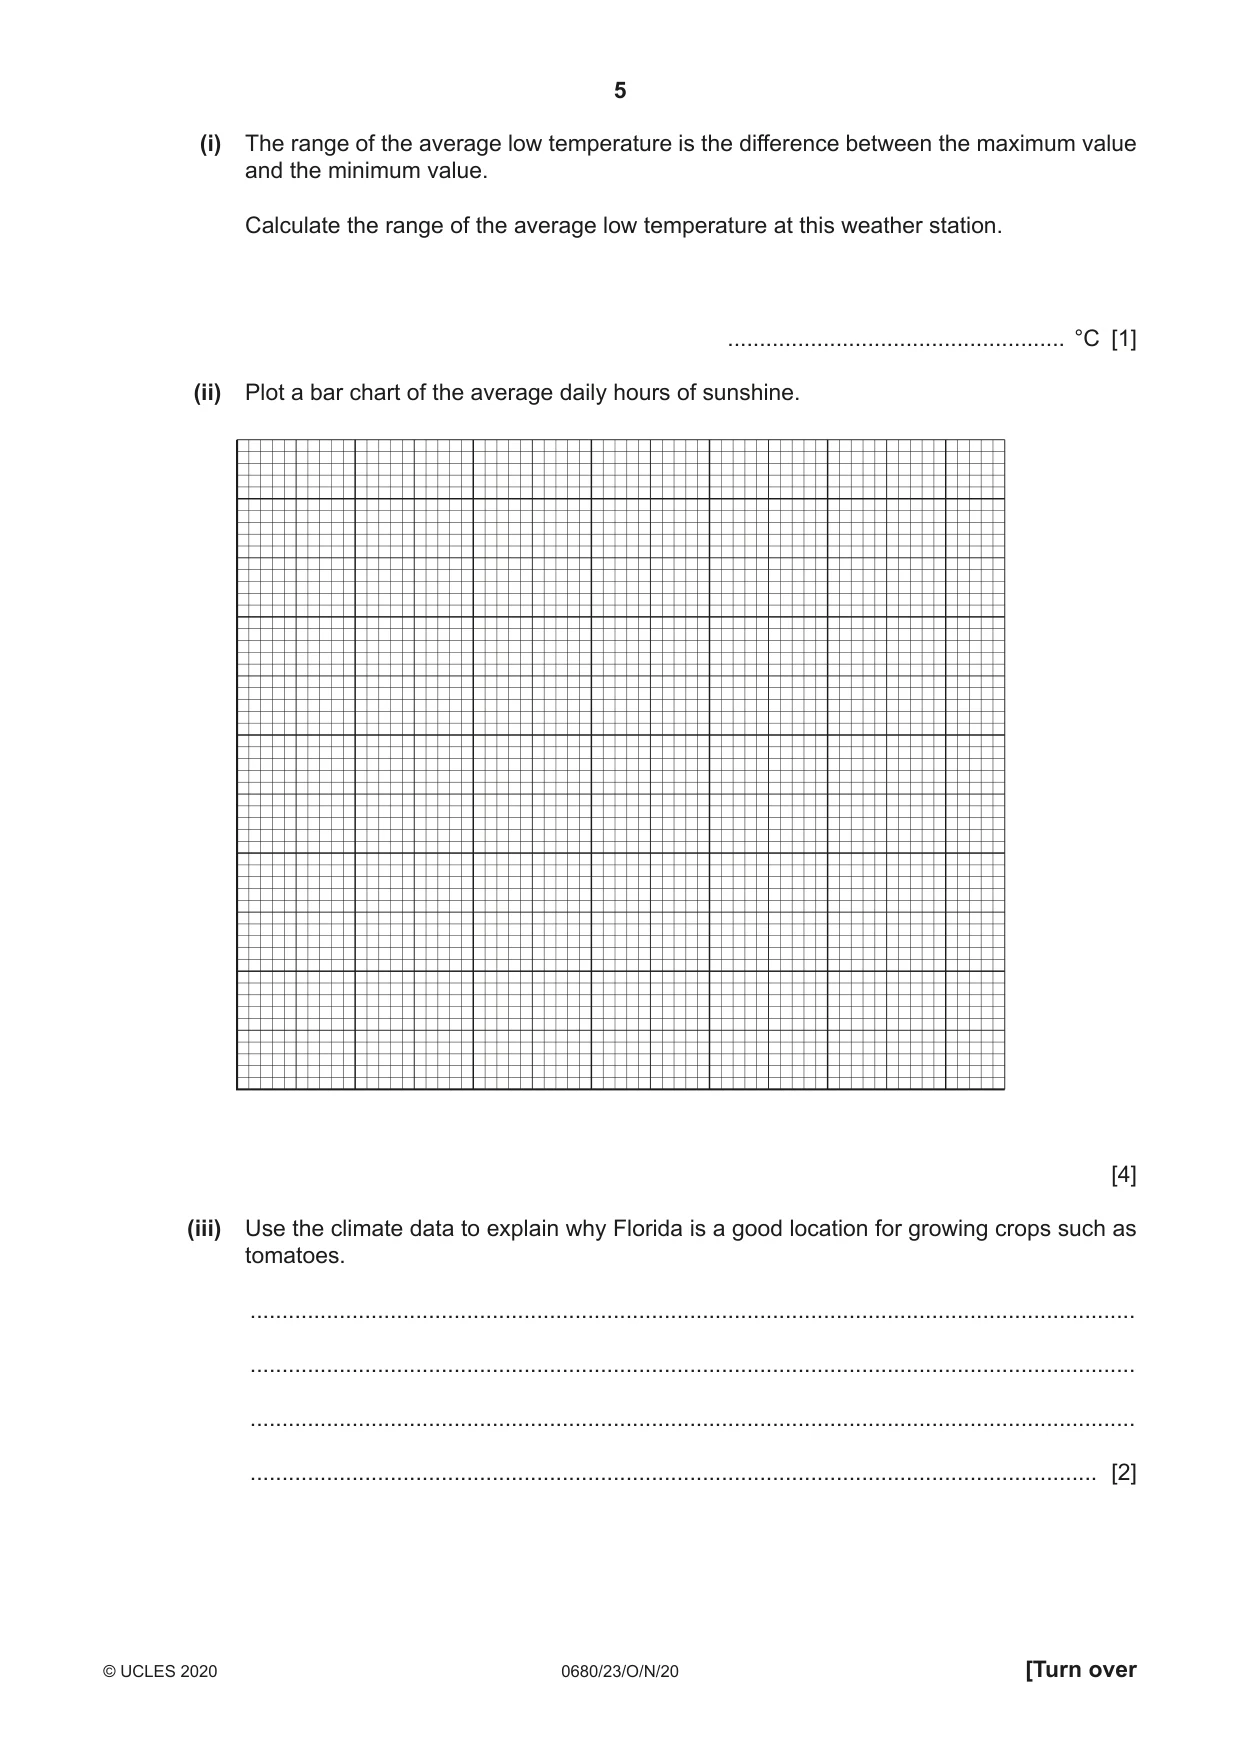
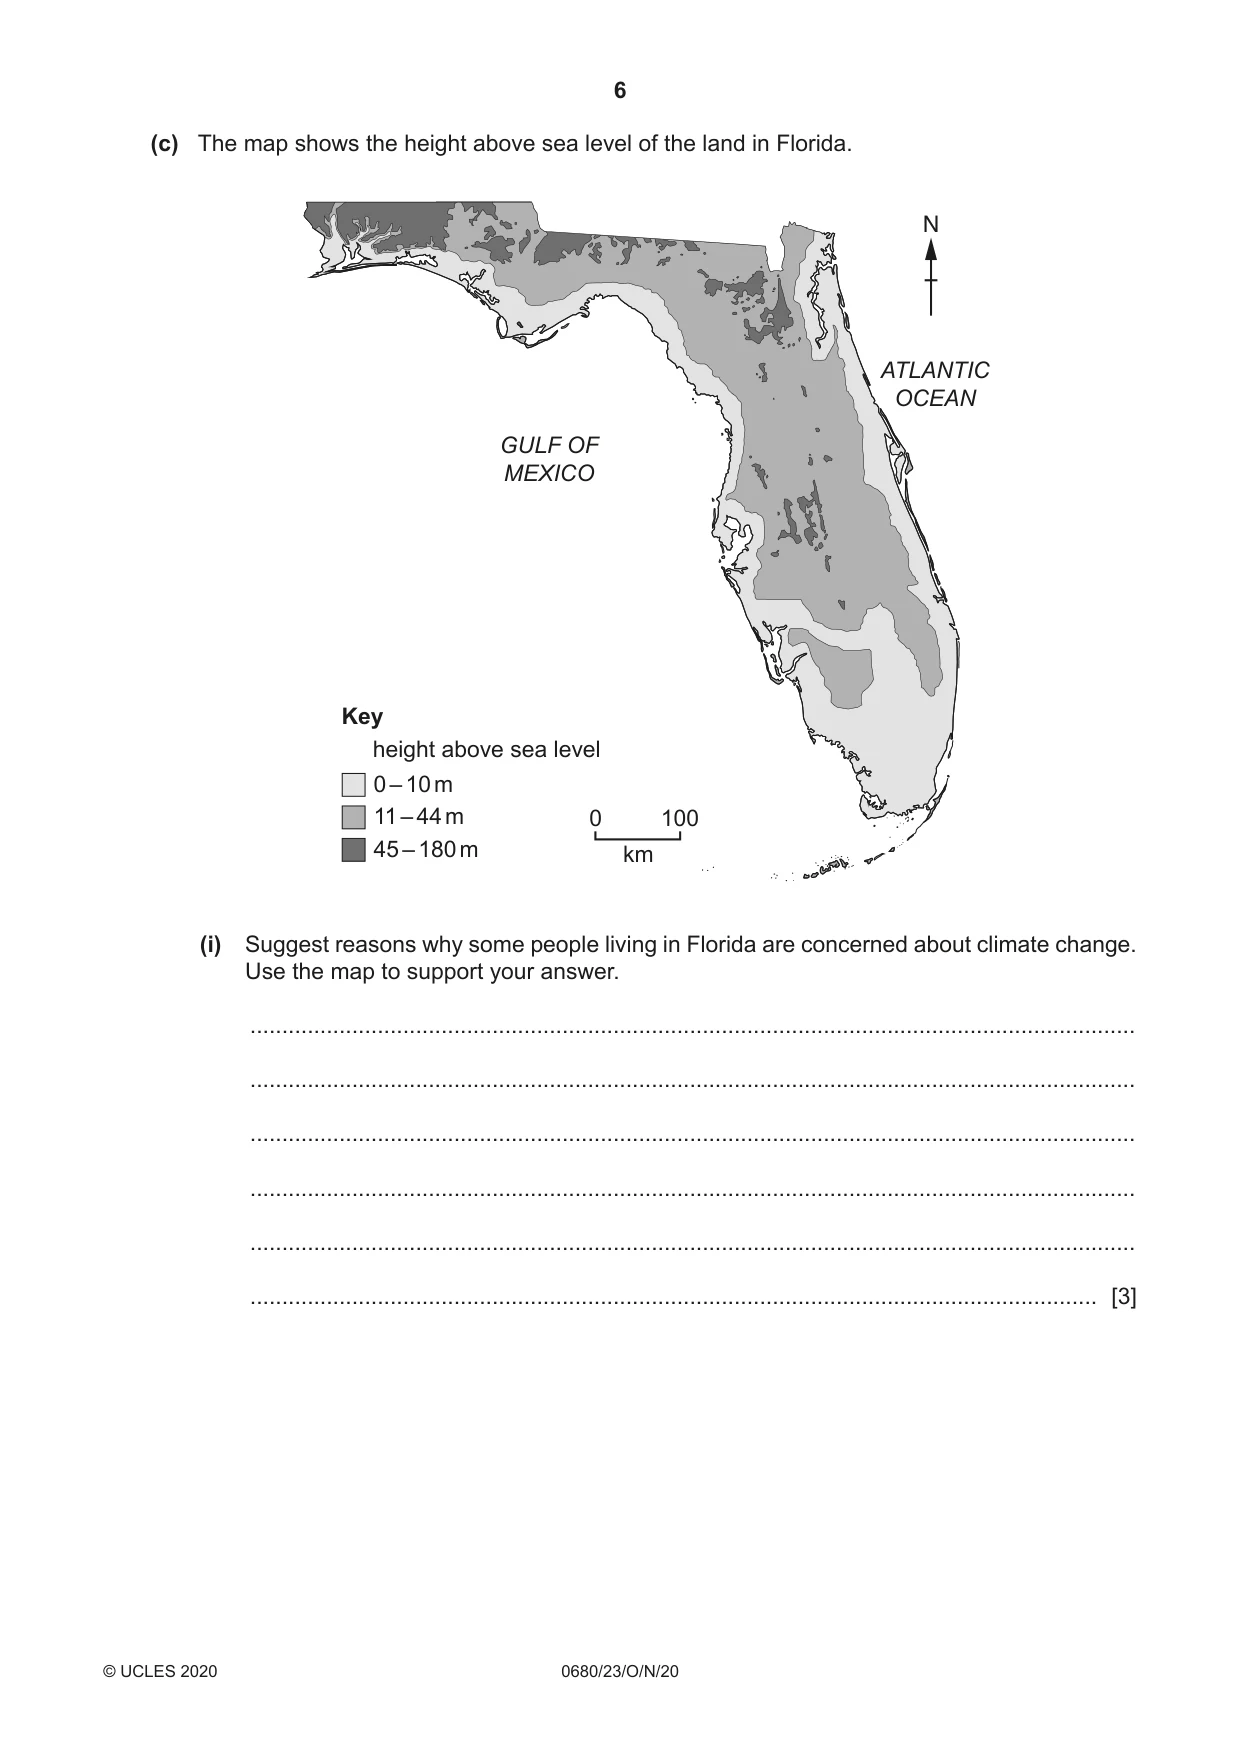
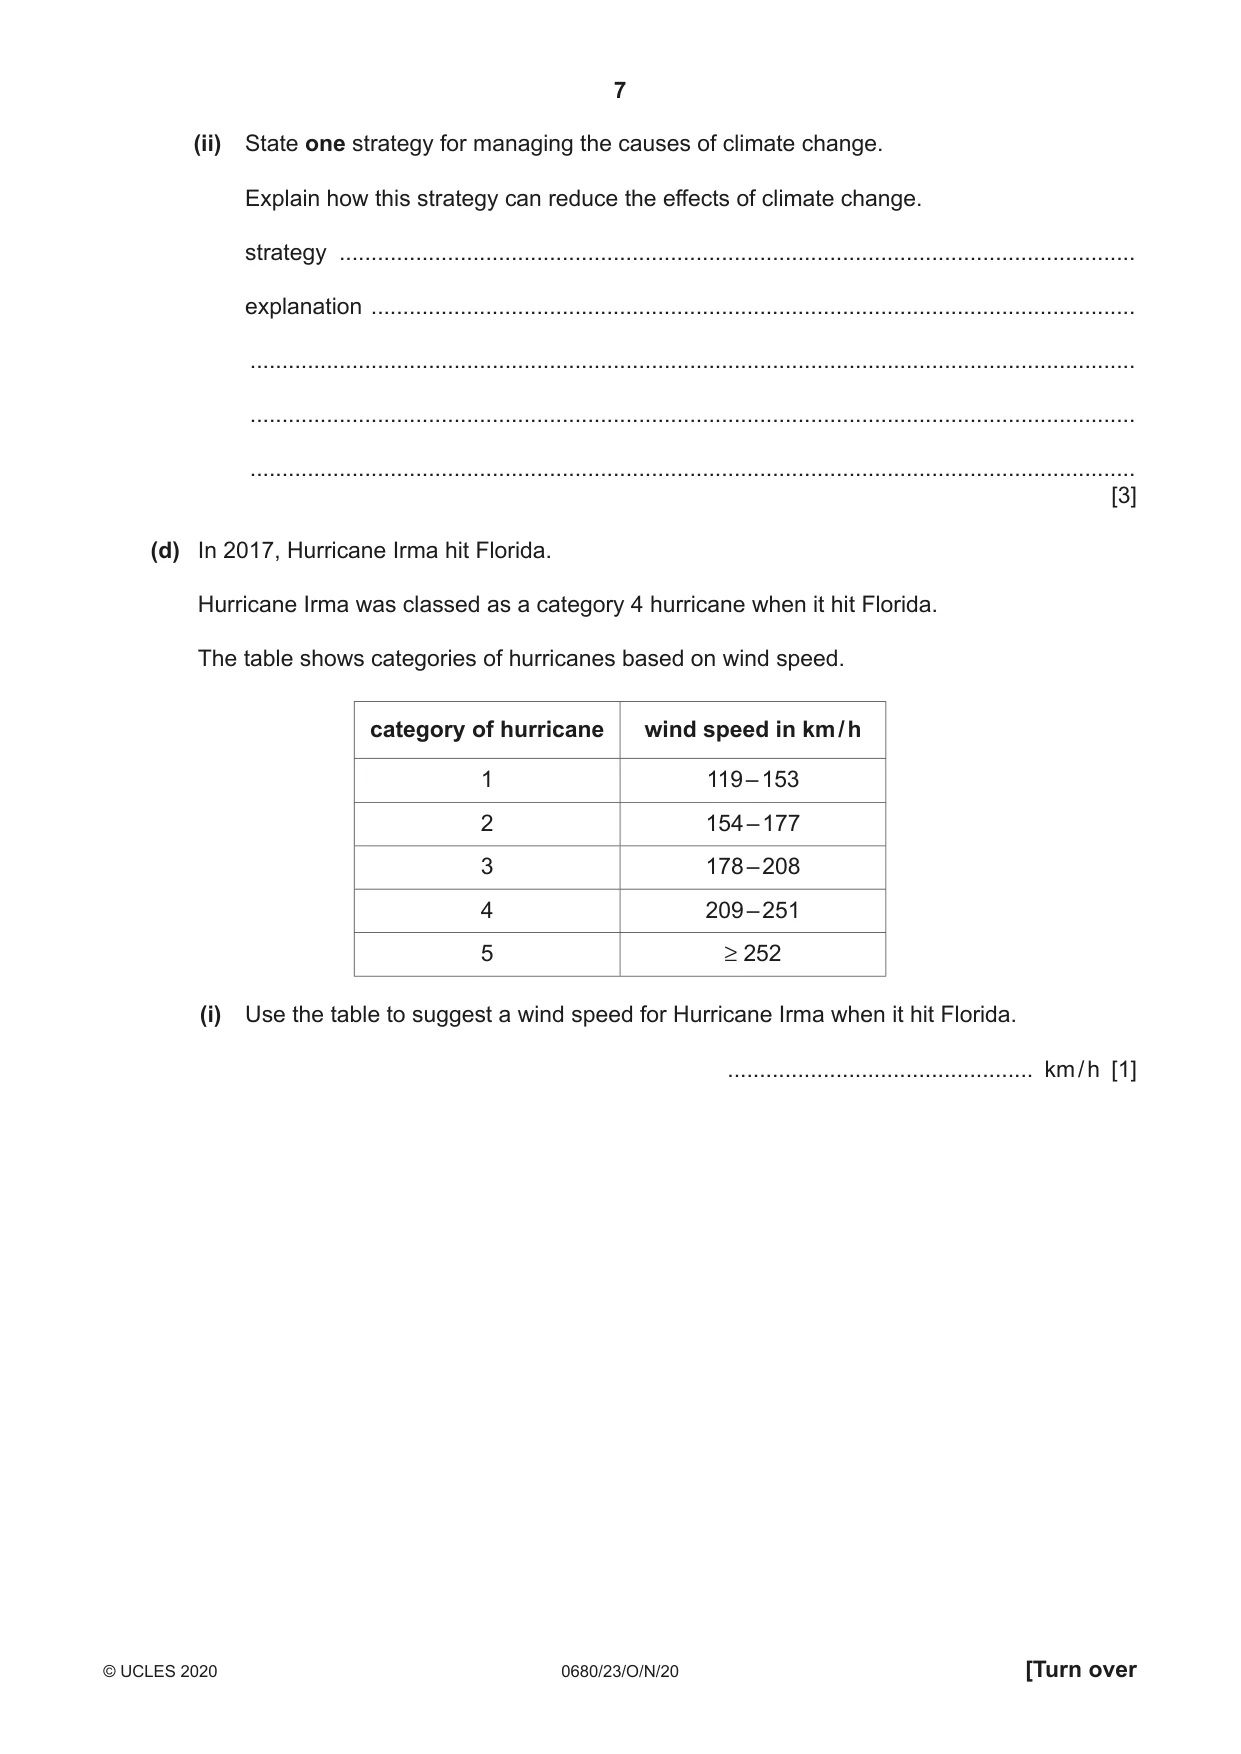
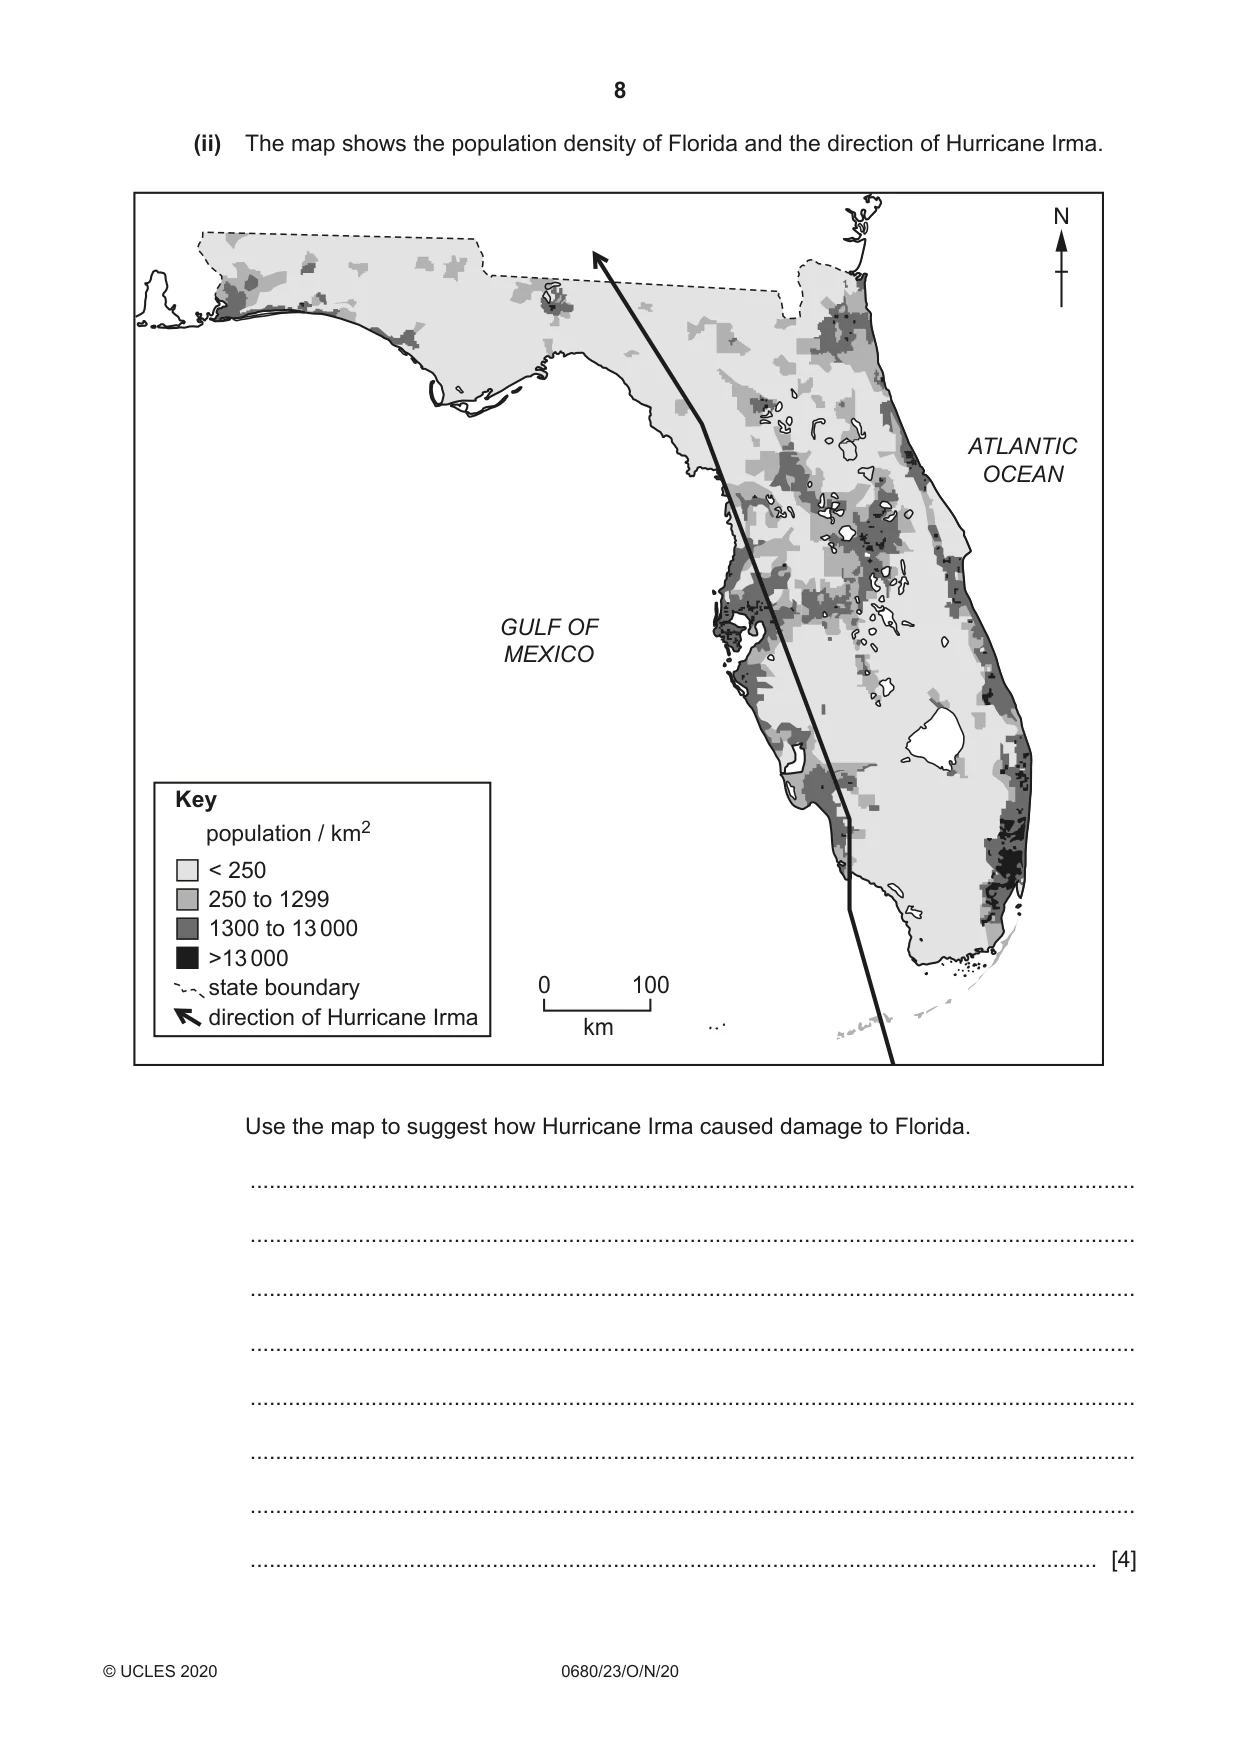
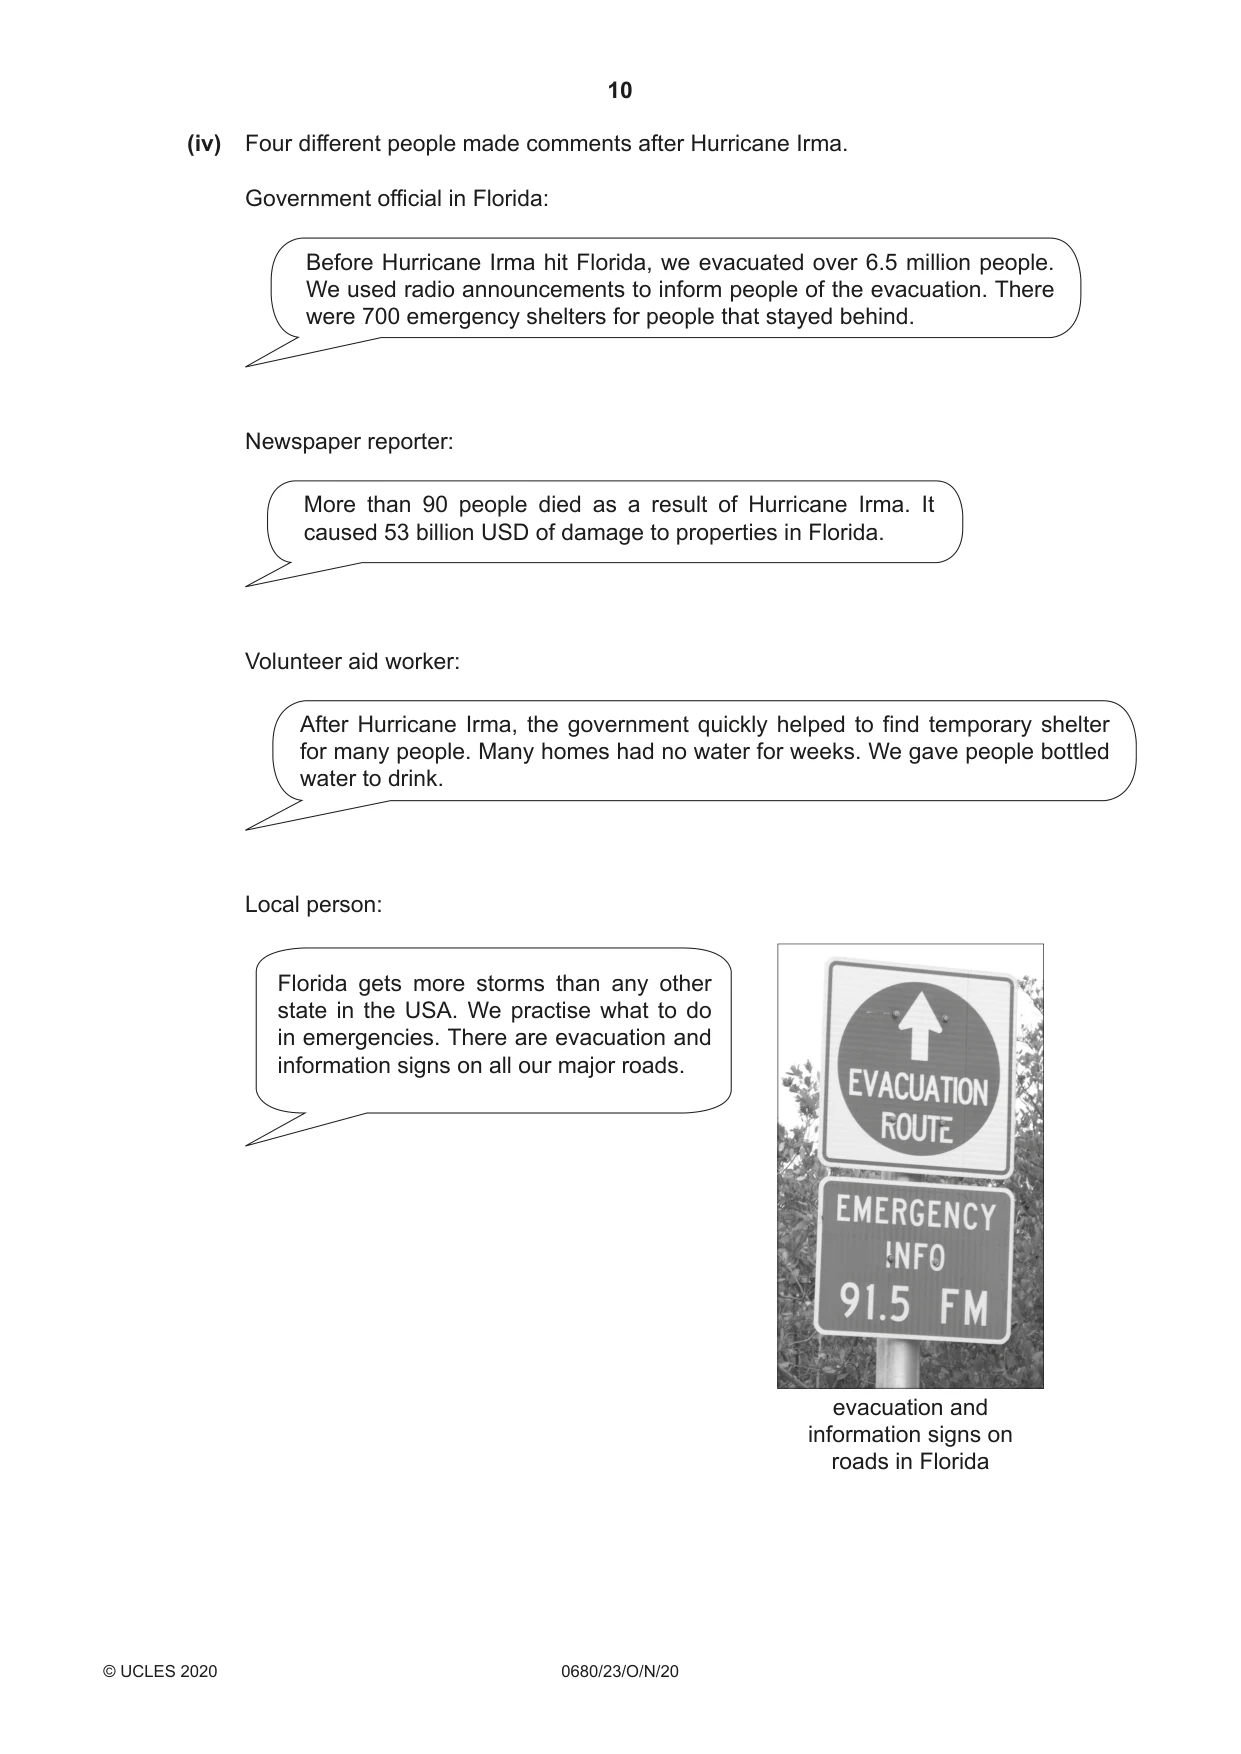
1 (a) (i) The population of Florida in 2016 was 18.8 million people. Calculate the percentage increase in the population of Florida from 2016 to 2018. ...................................................... % [2] (ii) Suggest two impacts of the increasing population on the state of Florida. 1 ........................................................................................................................................ ........................................................................................................................................... 2 ....................................................................................................................................... ........................................................................................................................................... [2] (iii) State two strategies for managing human population size. 1 ........................................................................................................................................ 2 ........................................................................................................................................ [2] (b) The table shows climate data for a weather station in southern Florida. month Jan Feb Mar Apr May Jun Jul Aug Sep Oct Nov Dec average high 24 24 26 27 29 31 32 32 31 29 27 24 temperature / °C average low 18 19 20 22 24 26 27 27 26 24 22 19 temperature / °C average daily 7 8 9 10 9 9 10 9 8 8 7 7 sunshine / hours (i) The range of the average low temperature is the difference between the maximum value and the minimum value. Calculate the range of the average low temperature at this weather station. ..................................................... °C [1] (ii) Plot a bar chart of the average daily hours of sunshine. [4] (iii) Use the climate data to explain why Florida is a good location for growing crops such as tomatoes. ........................................................................................................................................... ........................................................................................................................................... ........................................................................................................................................... ..................................................................................................................................... [2] (c) The map shows the height above sea level of the land in Florida. N ATLANTIC OCEAN GULF OF MEXICO Key height above sea level 0 – 10 m 11 – 44 m 0 100 45 – 180 m km (i) Suggest reasons why some people living in Florida are concerned about climate change. Use the map to support your answer. ........................................................................................................................................... ........................................................................................................................................... ........................................................................................................................................... ........................................................................................................................................... ........................................................................................................................................... ..................................................................................................................................... [3] (ii) State one strategy for managing the causes of climate change. Explain how this strategy can reduce the effects of climate change. strategy ............................................................................................................................. explanation ........................................................................................................................ ........................................................................................................................................... ........................................................................................................................................... ........................................................................................................................................... [3] (d) In 2017, Hurricane Irma hit Florida. Hurricane Irma was classed as a category 4 hurricane when it hit Florida. The table shows categories of hurricanes based on wind speed. category of hurricane wind speed in km / h 1 119 – 153 2 154 – 177 3 178 – 208 4 209 – 251 5 ≥ 252 (i) Use the table to suggest a wind speed for Hurricane Irma when it hit Florida. ................................................ km / h [1] (ii) The map shows the population density of Florida and the direction of Hurricane Irma. N ATLANTIC OCEAN GULF OF MEXICO Key population / km2 < 250 250 to 1299 1300 to 13 000 >13 000 state boundary 0 100 direction of Hurricane Irma km Use the map to suggest how Hurricane Irma caused damage to Florida. ........................................................................................................................................... ........................................................................................................................................... ........................................................................................................................................... ........................................................................................................................................... ........................................................................................................................................... ........................................................................................................................................... ........................................................................................................................................... ..................................................................................................................................... [4] (iii) Suggest ways Hurricane Irma affected Florida’s farming industry. ........................................................................................................................................... ........................................................................................................................................... ........................................................................................................................................... ........................................................................................................................................... ........................................................................................................................................... ........................................................................................................................................... ........................................................................................................................................... ..................................................................................................................................... [4] (iv) Four different people made comments after Hurricane Irma. Government official in Florida: Before Hurricane Irma hit Florida, we evacuated over 6.5 million people. We used radio announcements to inform people of the evacuation. There were 700 emergency shelters for people that stayed behind. Newspaper reporter: More than 90 people died as a result of Hurricane Irma. It caused 53 billion USD of damage to properties in Florida. Volunteer aid worker: After Hurricane Irma, the government quickly helped to find temporary shelter for many people. Many homes had no water for weeks. We gave people bottled water to drink. Local person: Florida gets more storms than any other state in the USA. We practise what to do in emergencies. There are evacuation and information signs on all our major roads. evacuation and information signs on roads in Florida Do you think the strategies for managing the impacts of Hurricane Irma were effective? Use information from the people’s comments to support your view. ........................................................................................................................................... ........................................................................................................................................... ........................................................................................................................................... ........................................................................................................................................... ........................................................................................................................................... ........................................................................................................................................... ........................................................................................................................................... ........................................................................................................................................... ........................................................................................................................................... ........................................................................................................................................... ........................................................................................................................................... ..................................................................................................................................... [6] [Total: 34]
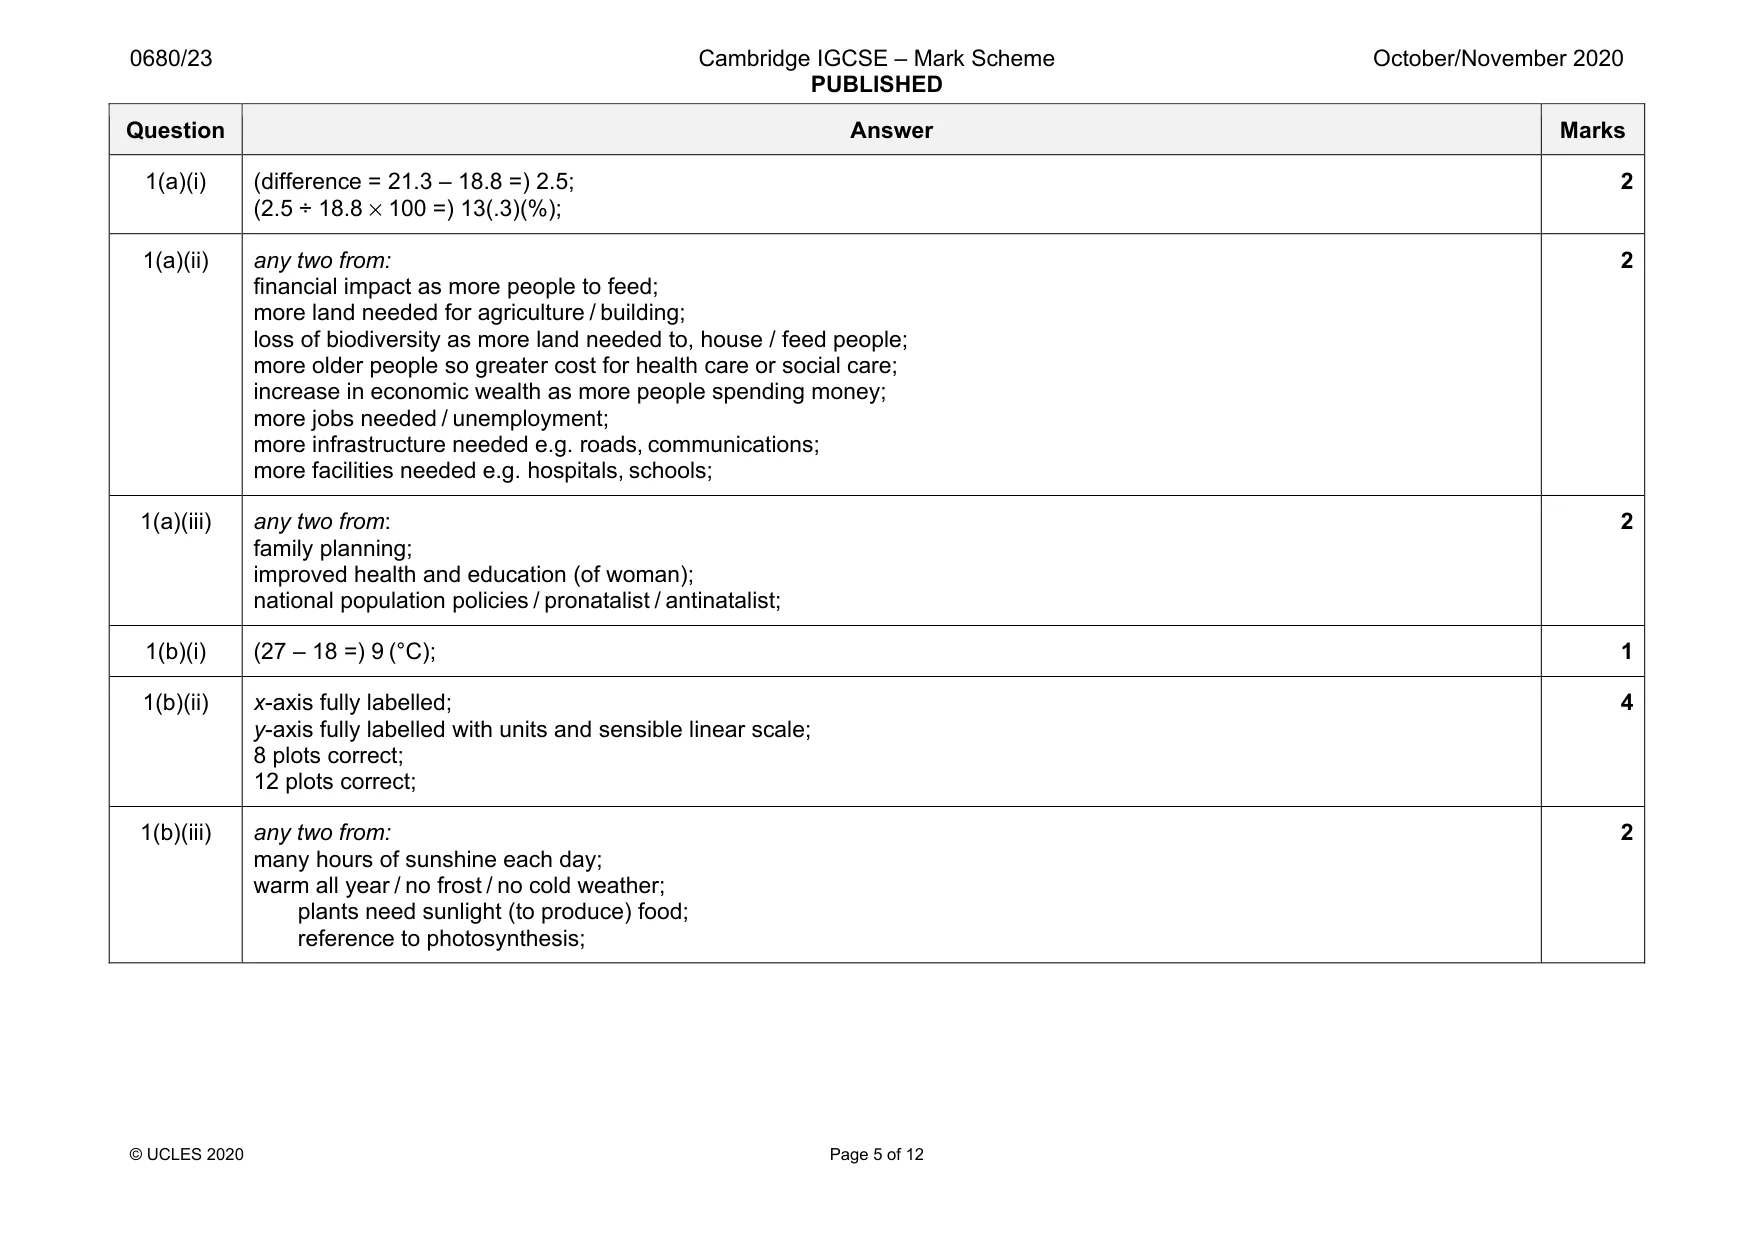
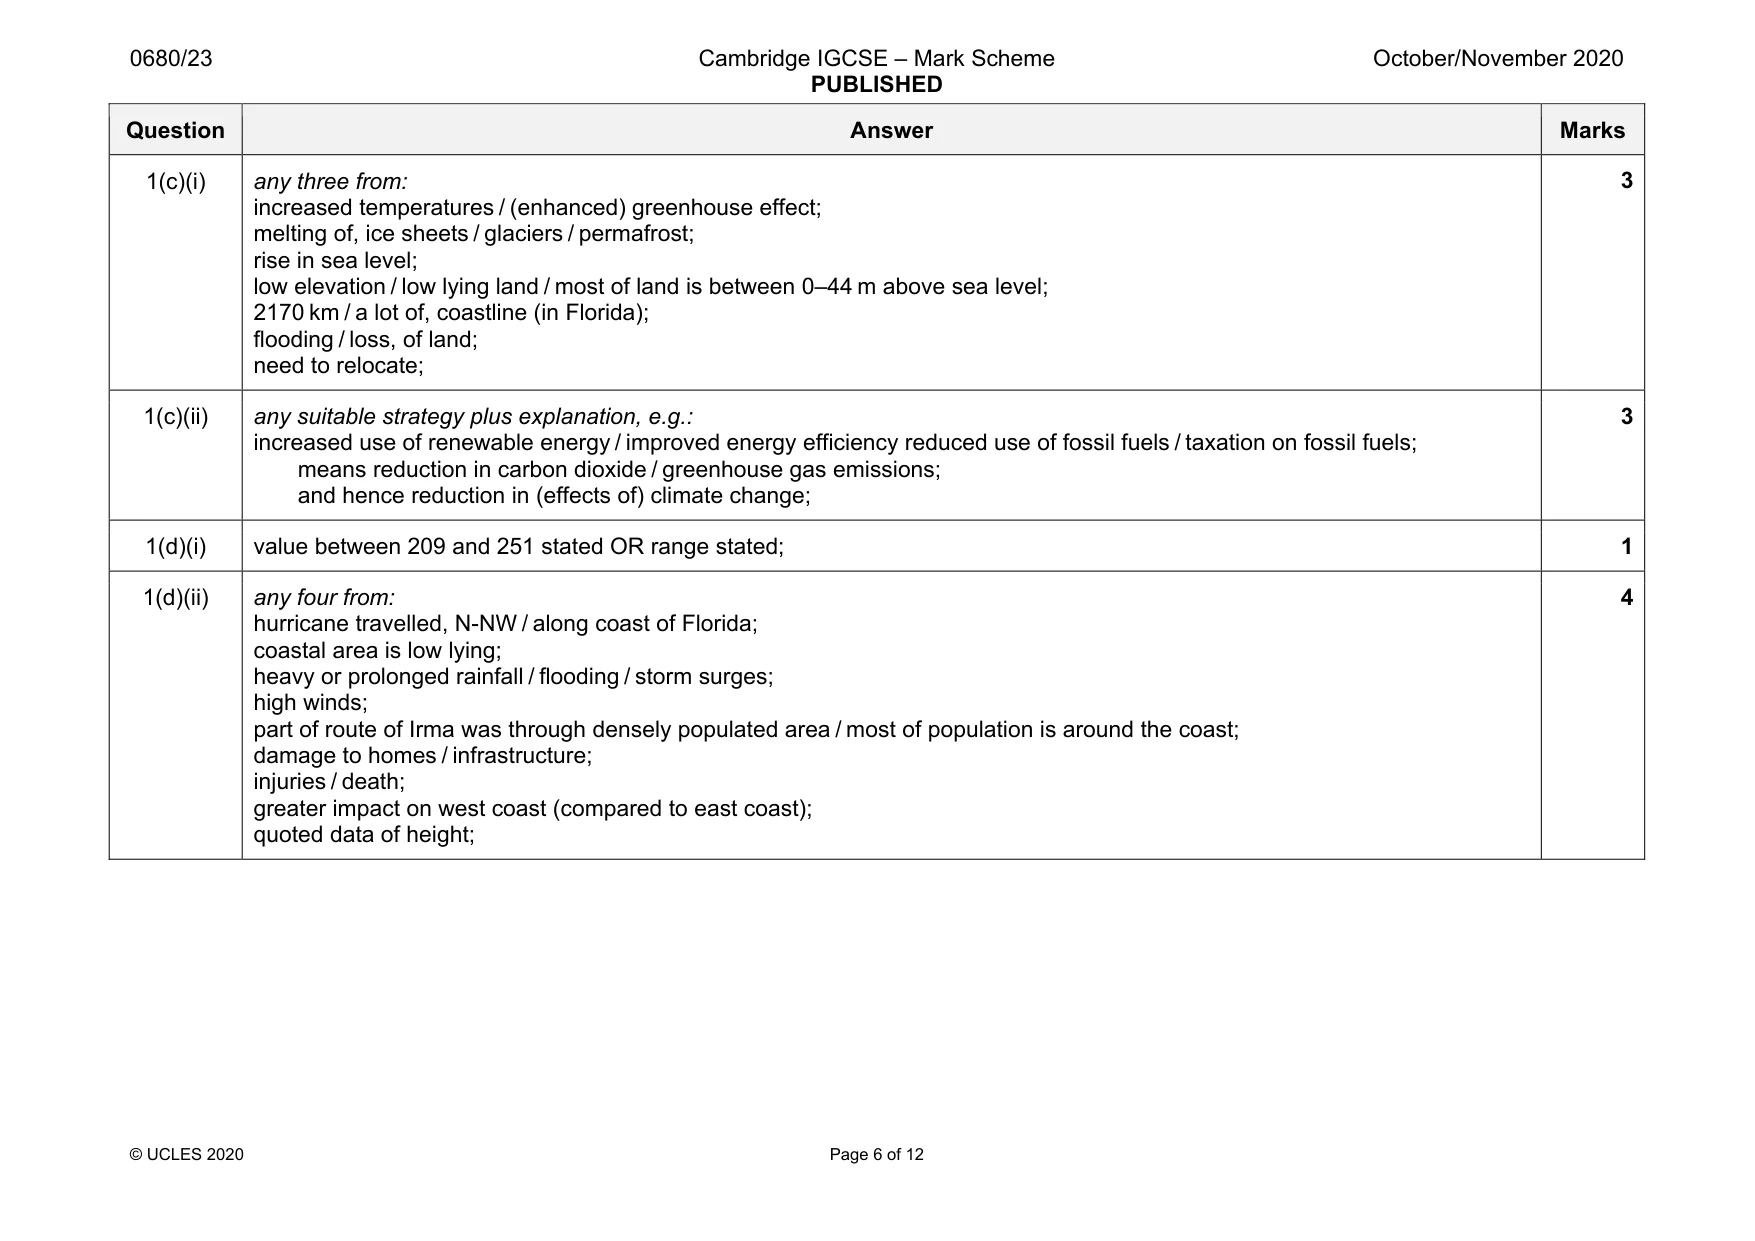
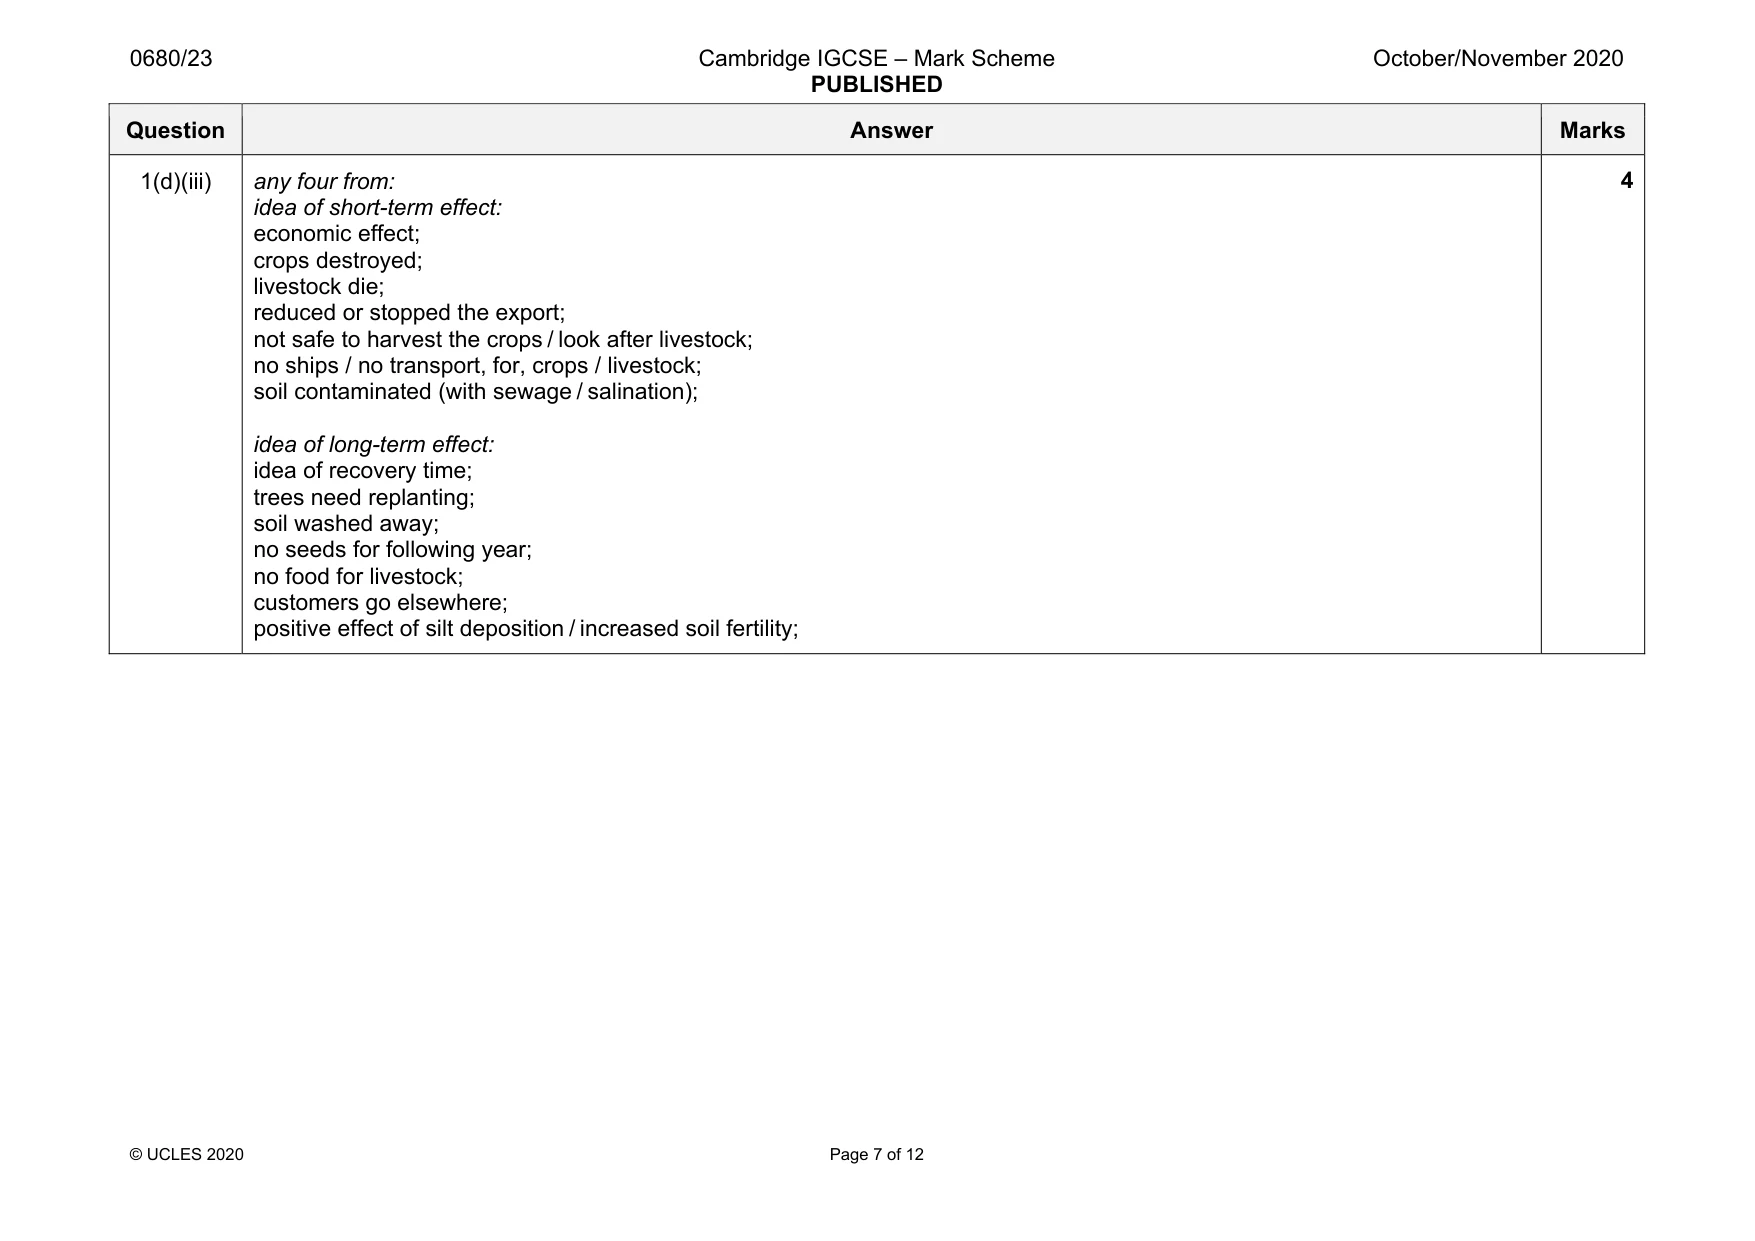
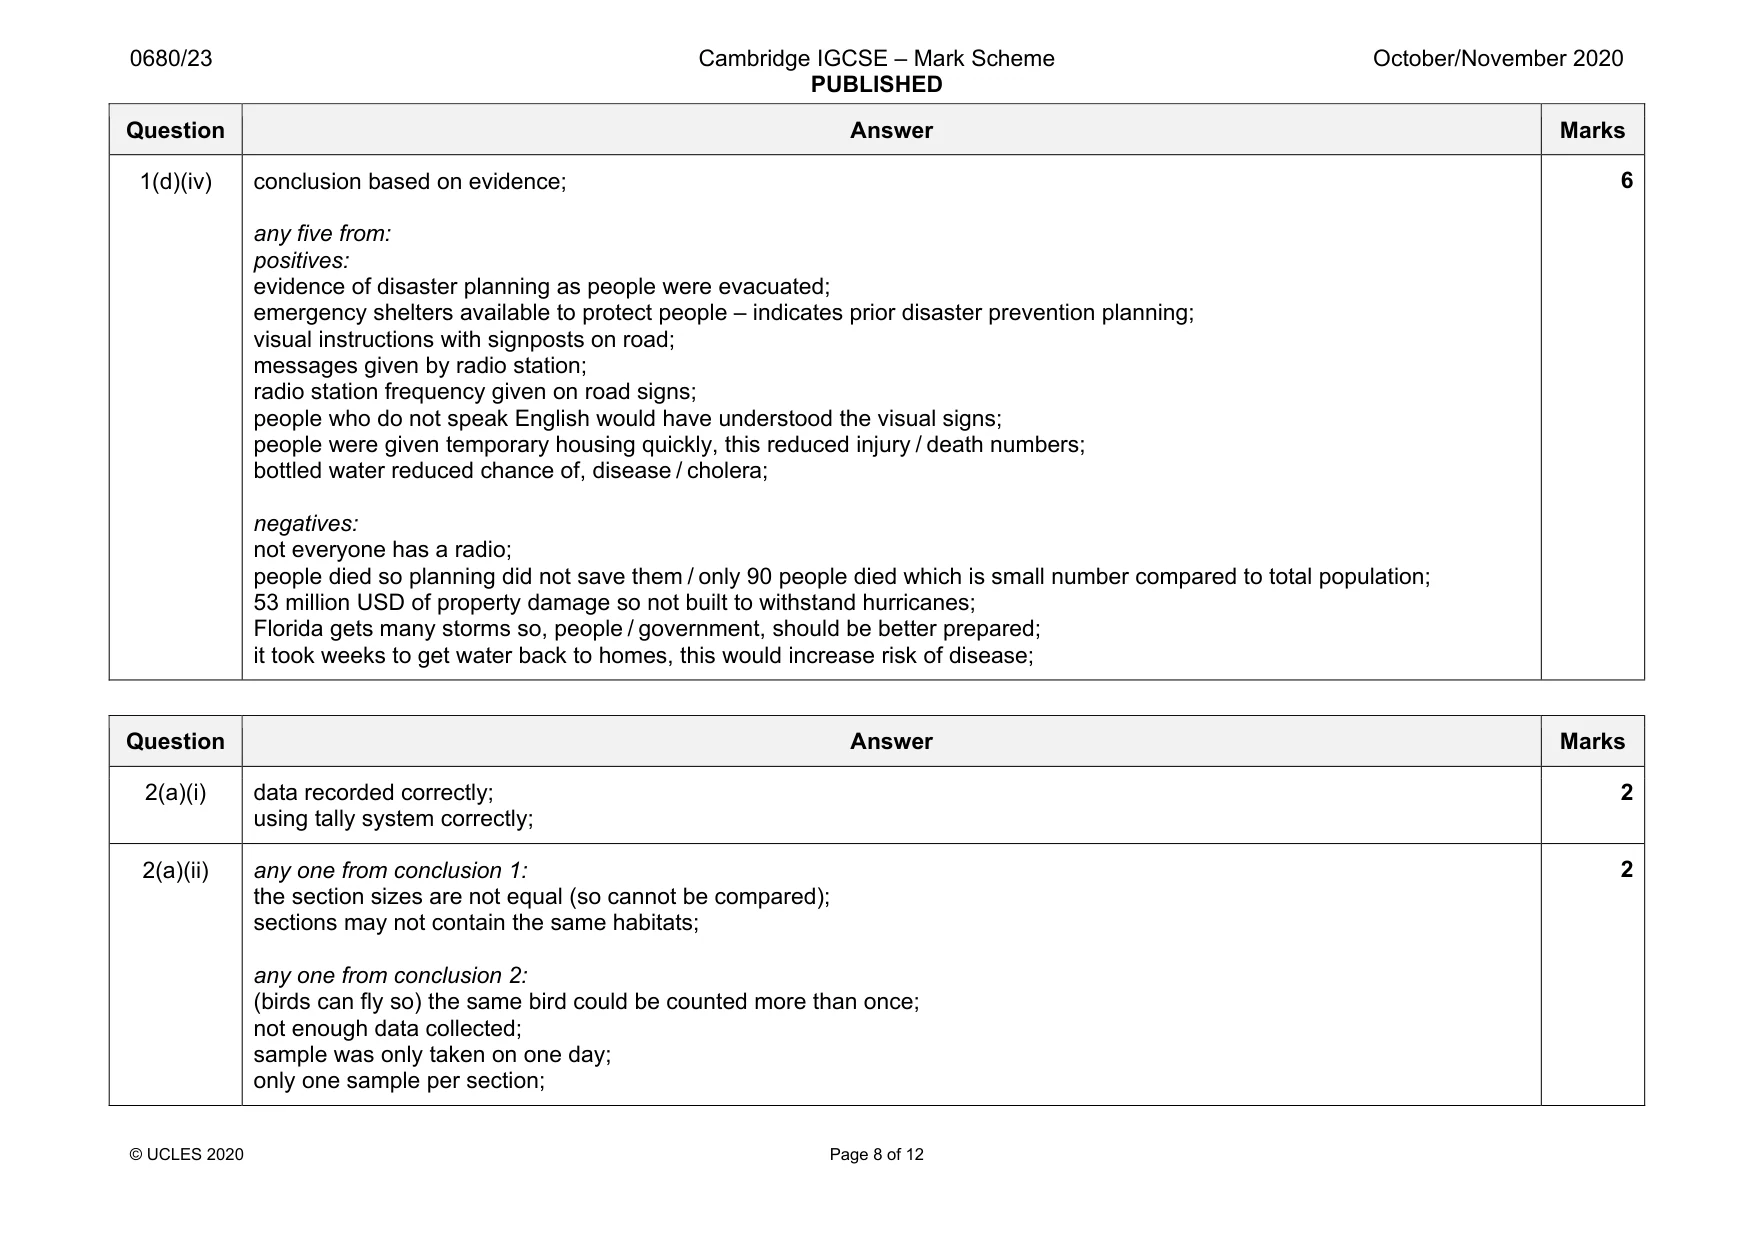
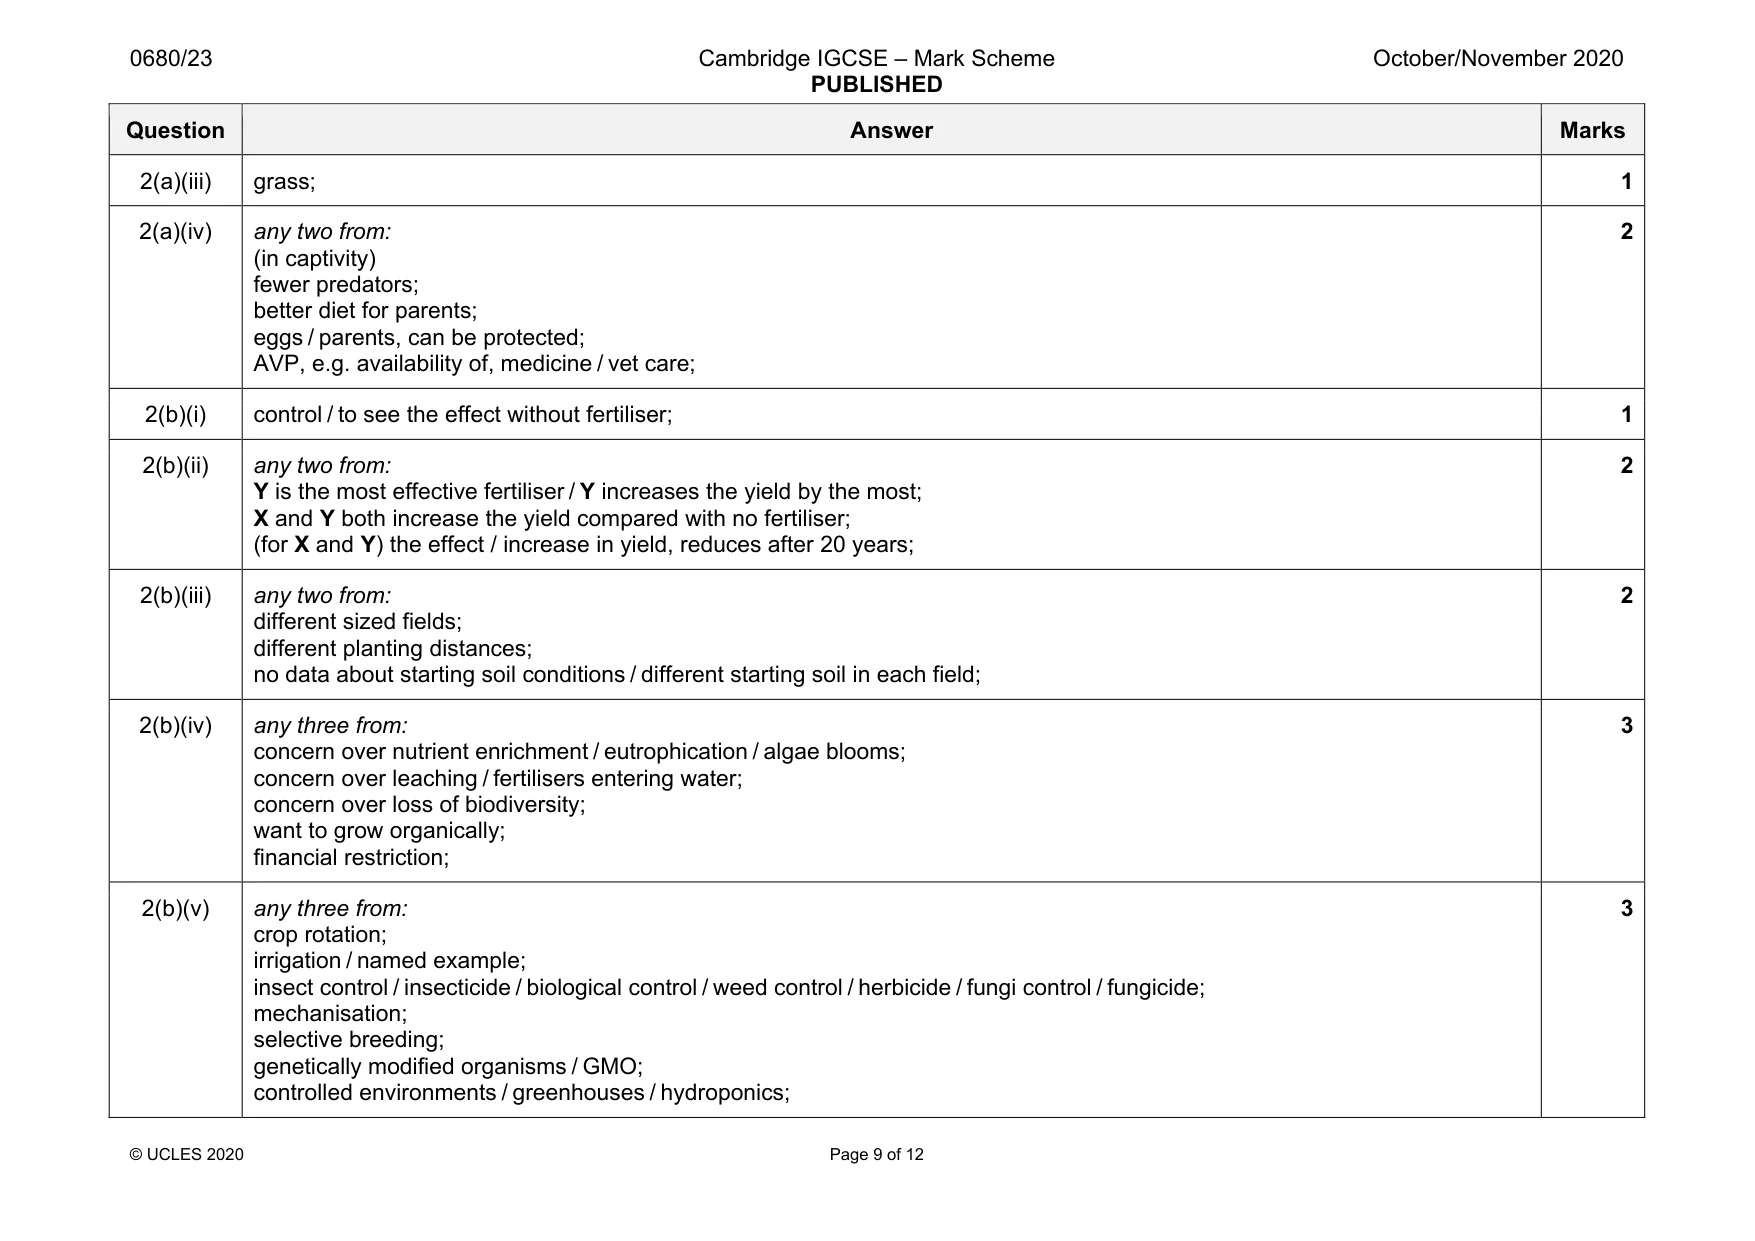
Mark scheme: 1(a)(i) (difference = 21.3 – 18.8 =) 2.5; (2.5 ÷ 18.8 × 100 =) 13(.3)(%); 2 1(a)(ii) any two from: financial impact as more people to feed; more land needed for agriculture / building; loss of biodiversity as more land needed to, house / feed people; more older people so greater cost for health care or social care; increase in economic wealth as more people spending money; more jobs needed / unemployment; more infrastructure needed e.g. roads, communications; more facilities needed e.g. hospitals, schools; 2 1(a)(iii) any two from: family planning; improved health and education (of woman); national population policies / pronatalist / antinatalist; 2 1(b)(i) (27 – 18 =) 9 (°C); 1 1(b)(ii) x-axis fully labelled; y-axis fully labelled with units and sensible linear scale; 8 plots correct; 12 plots correct; 4 1(b)(iii) any two from: many hours of sunshine each day; warm all year / no frost / no cold weather; plants need sunlight (to produce) food; reference to photosynthesis; 2 Question Answer Marks 1(c)(i) any three from: increased temperatures / (enhanced) greenhouse effect; melting of, ice sheets / glaciers / permafrost; rise in sea level; low elevation / low lying land / most of land is between 0–44 m above sea level; 2170 km / a lot of, coastline (in Florida); flooding / loss, of land; need to relocate; 3 1(c)(ii) any suitable strategy plus explanation, e.g.: increased use of renewable energy / improved energy efficiency reduced use of fossil fuels / taxation on fossil fuels; means reduction in carbon dioxide / greenhouse gas emissions; and hence reduction in (effects of) climate change; 3 1(d)(i) value between 209 and 251 stated OR range stated; 1 1(d)(ii) any four from: hurricane travelled, N-NW / along coast of Florida; coastal area is low lying; heavy or prolonged rainfall / flooding / storm surges; high winds; part of route of Irma was through densely populated area / most of population is around the coast; damage to homes / infrastructure; injuries / death; greater impact on west coast (compared to east coast); quoted data of height; 4 Question Answer Marks 1(d)(iii) any four from: idea of short-term effect: economic effect; crops destroyed; livestock die; reduced or stopped the export; not safe to harvest the crops / look after livestock; no ships / no transport, for, crops / livestock; soil contaminated (with sewage / salination); idea of long-term effect: idea of recovery time; trees need replanting; soil washed away; no seeds for following year; no food for livestock; customers go elsewhere; positive effect of silt deposition / increased soil fertility; 4 Question Answer Marks 1(d)(iv) conclusion based on evidence; any five from: positives: evidence of disaster planning as people were evacuated; emergency shelters available to protect people – indicates prior disaster prevention planning; visual instructions with signposts on road; messages given by radio station; radio station frequency given on road signs; people who do not speak English would have understood the visual signs; people were given temporary housing quickly, this reduced injury / death numbers; bottled water reduced chance of, disease / cholera; negatives: not everyone has a radio; people died so planning did not save them / only 90 people died which is small number compared to total population; 53 million USD of property damage so not built to withstand hurricanes; Florida gets many storms so, people / government, should be better prepared; it took weeks to get water back to homes, this would increase risk of disease; 6
Q2 · The ‘sandhill crane’ is a threatened species of bird in Florida
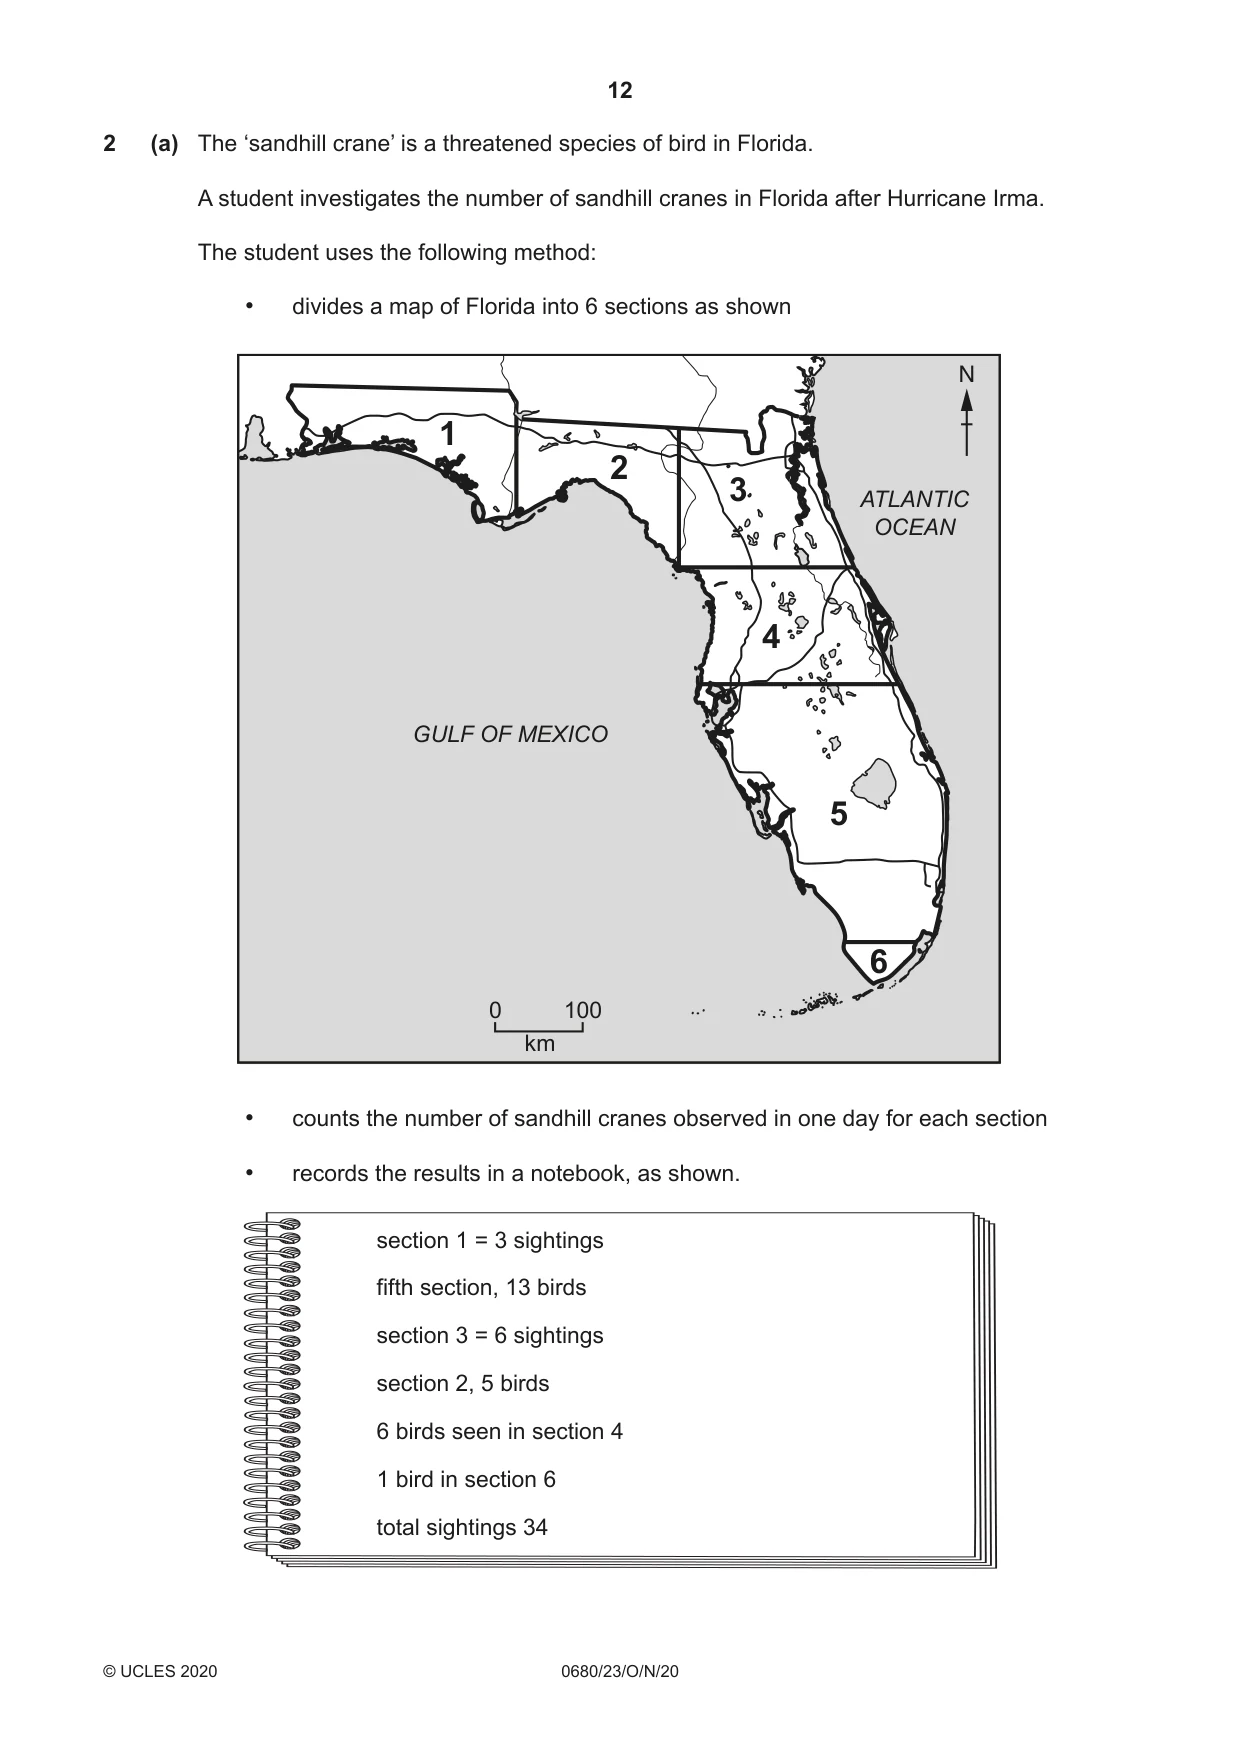
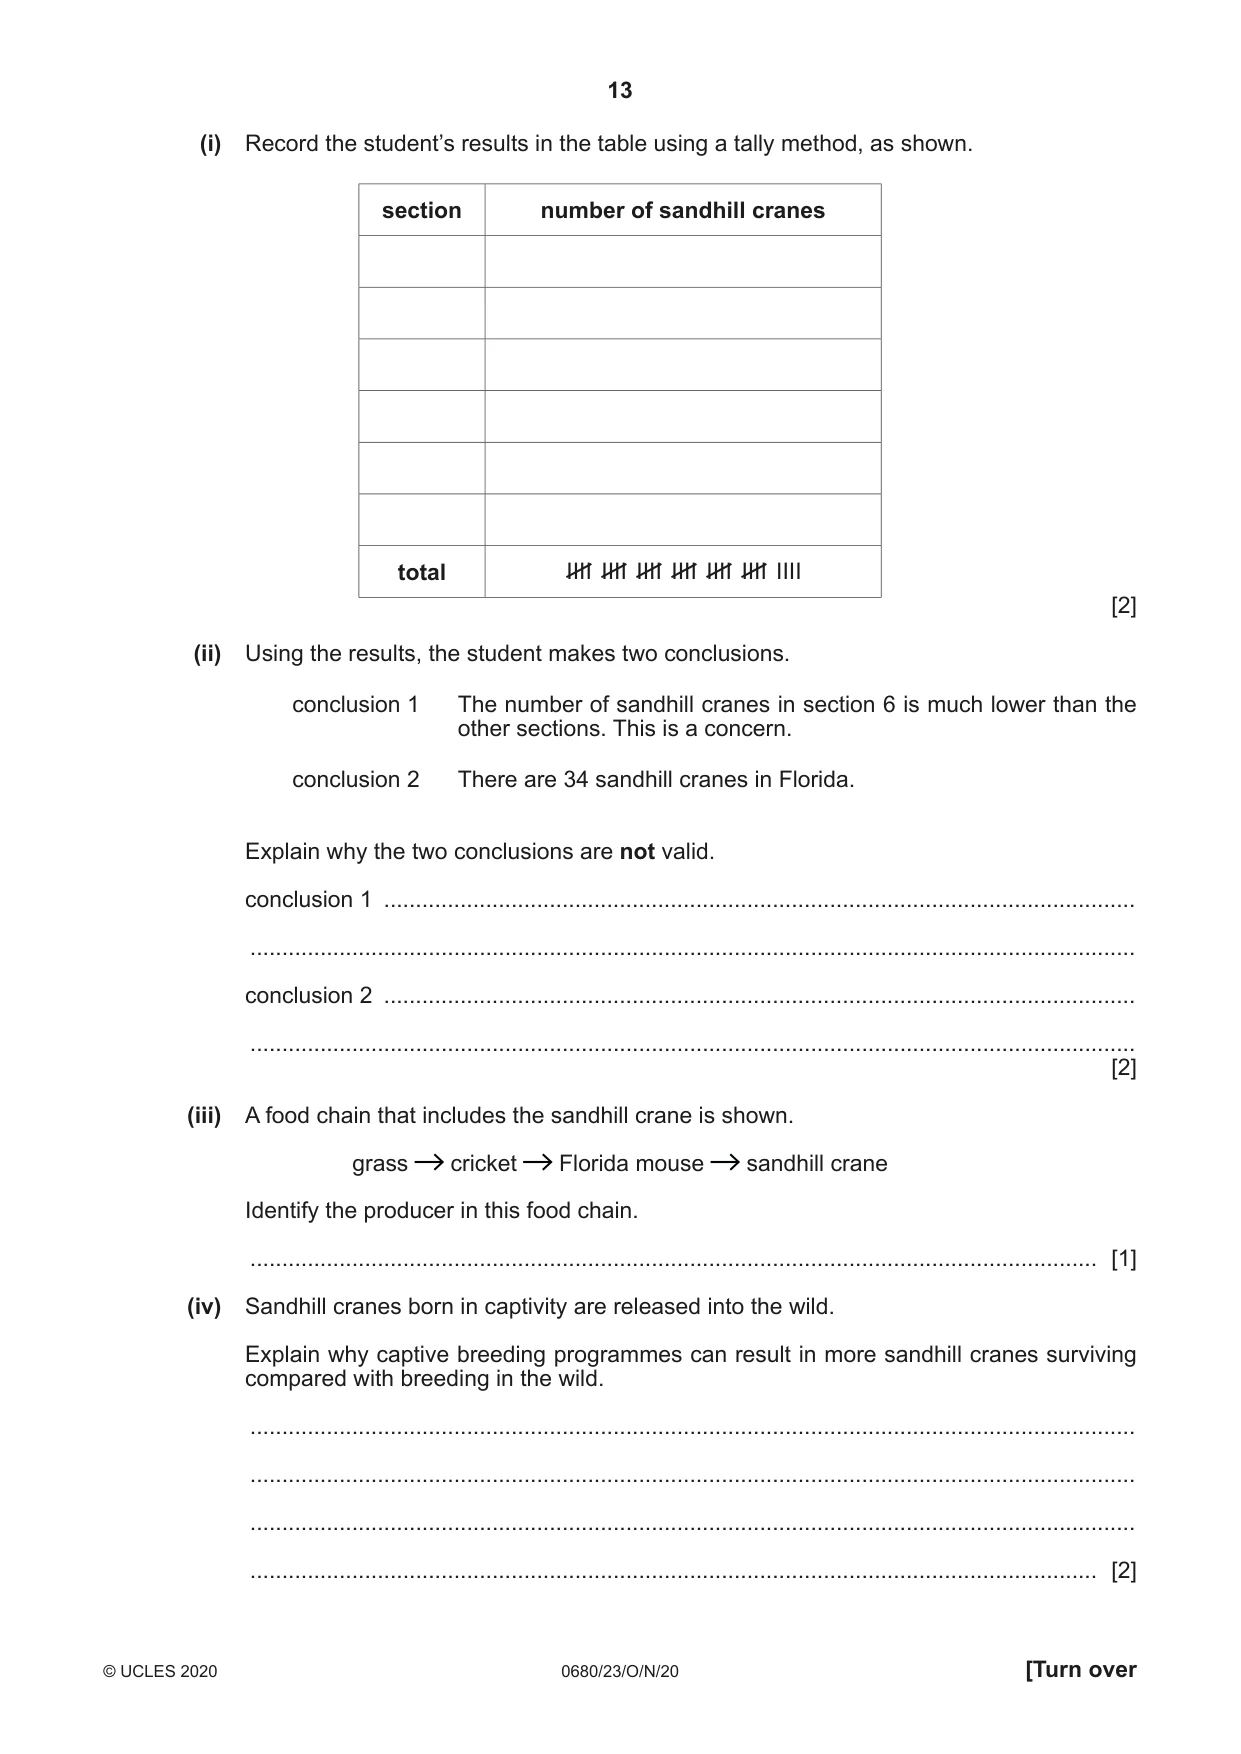
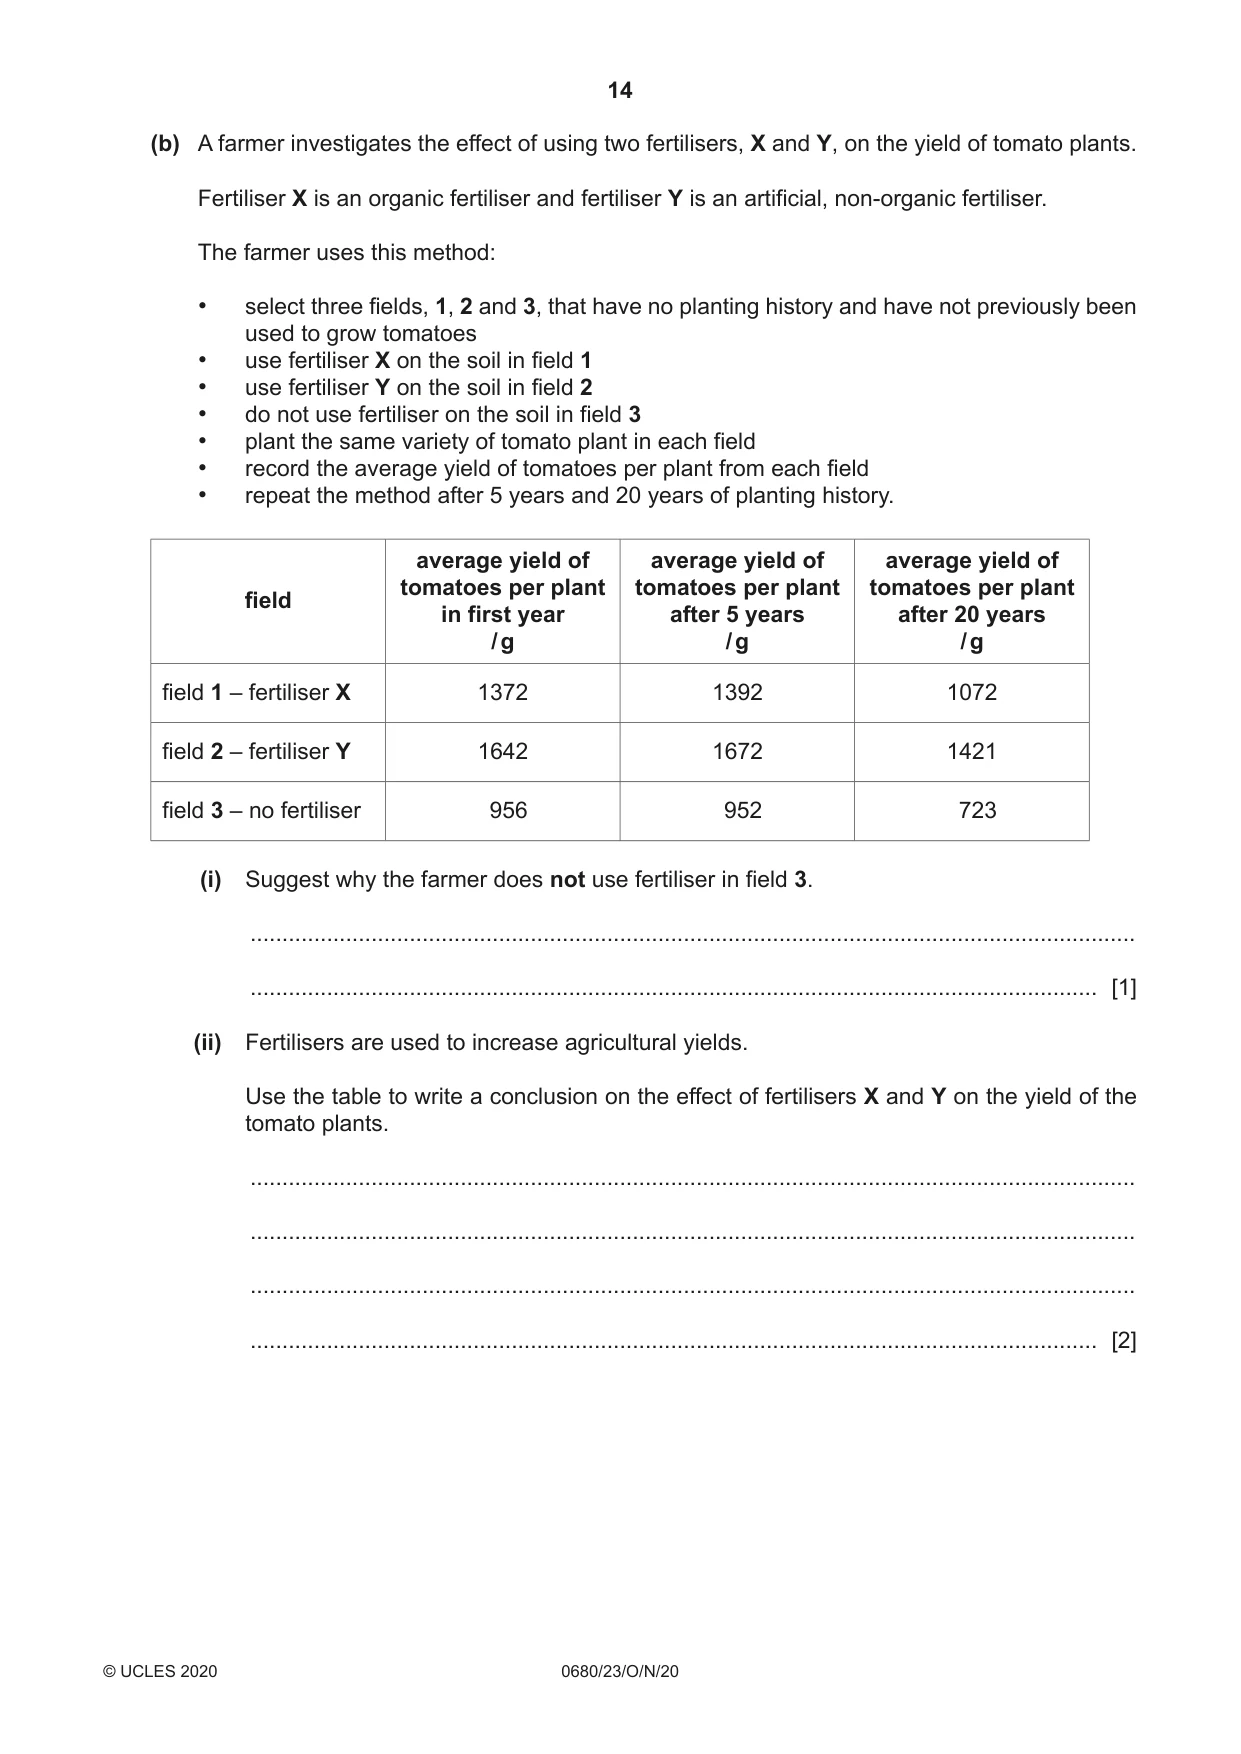
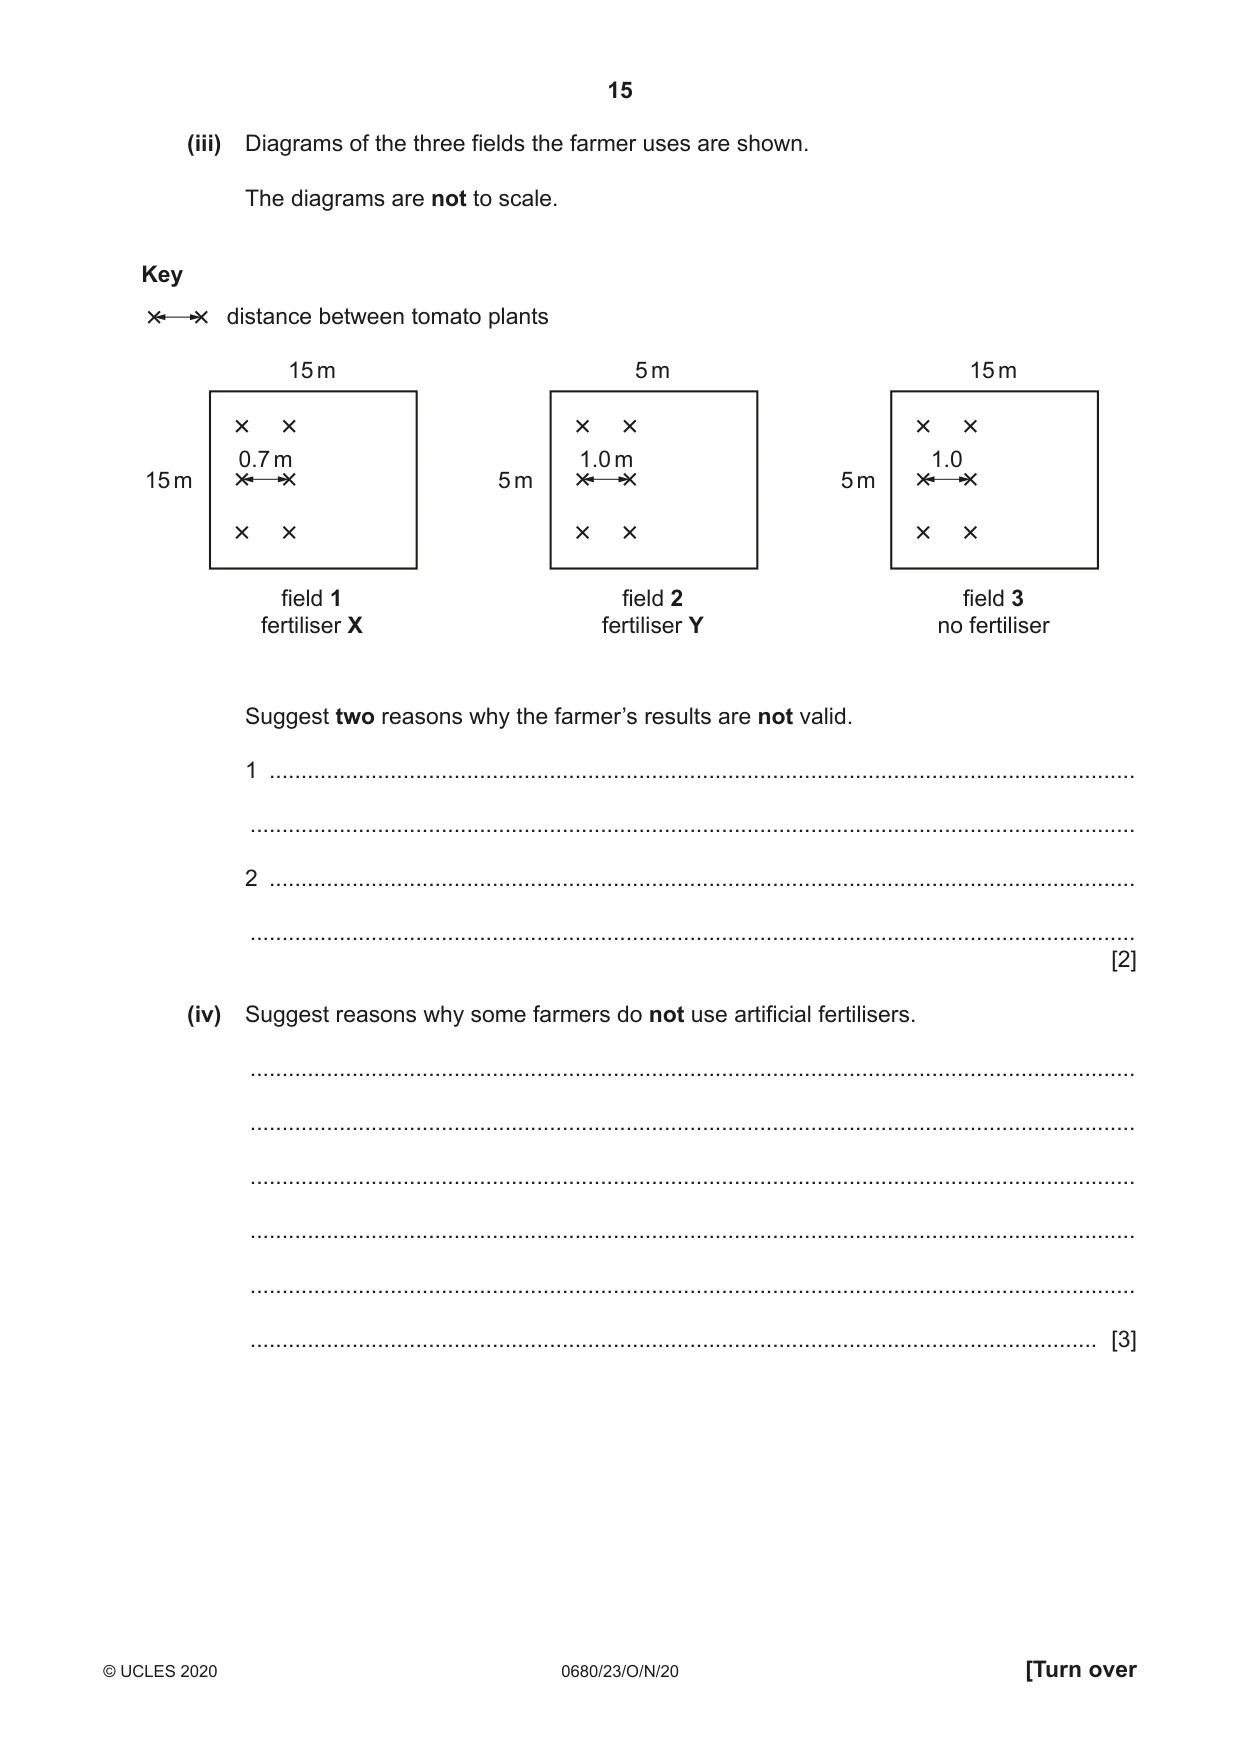
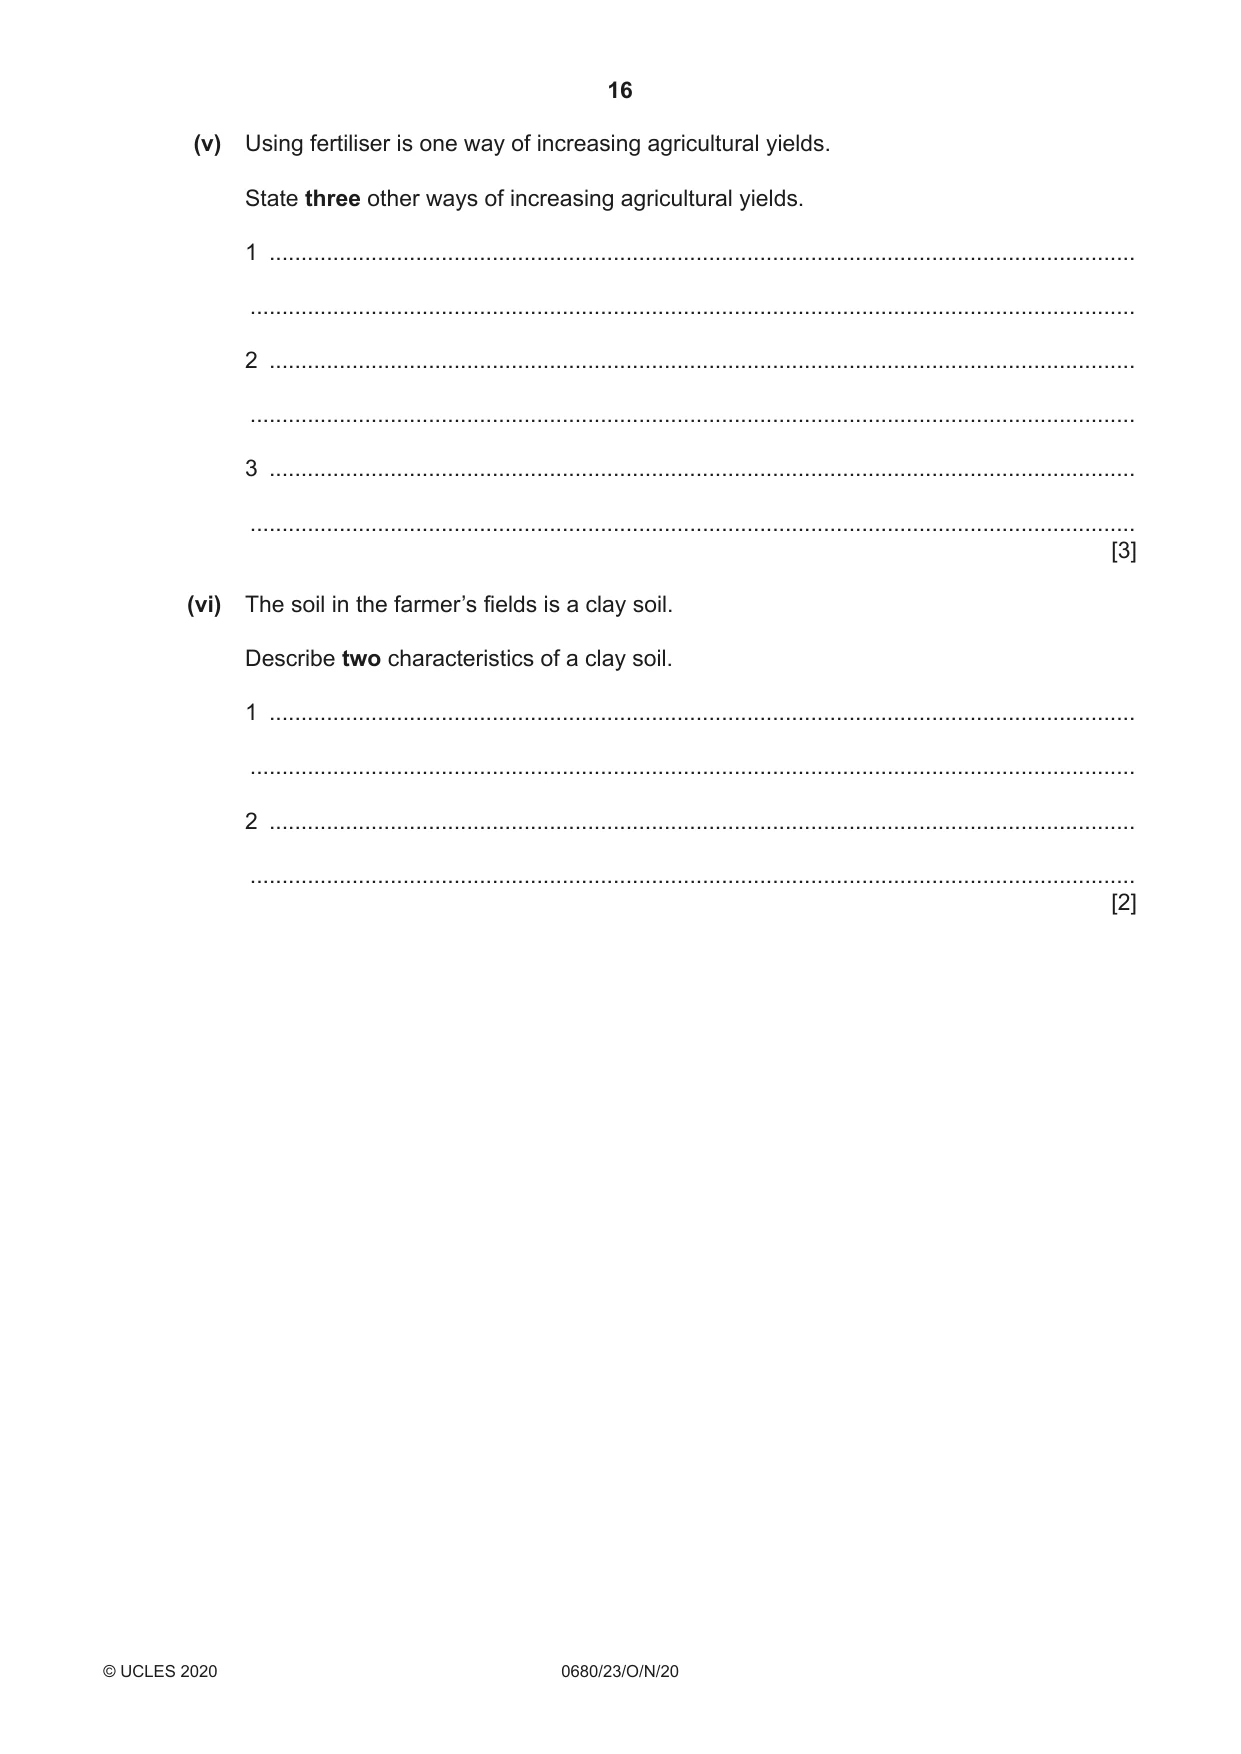
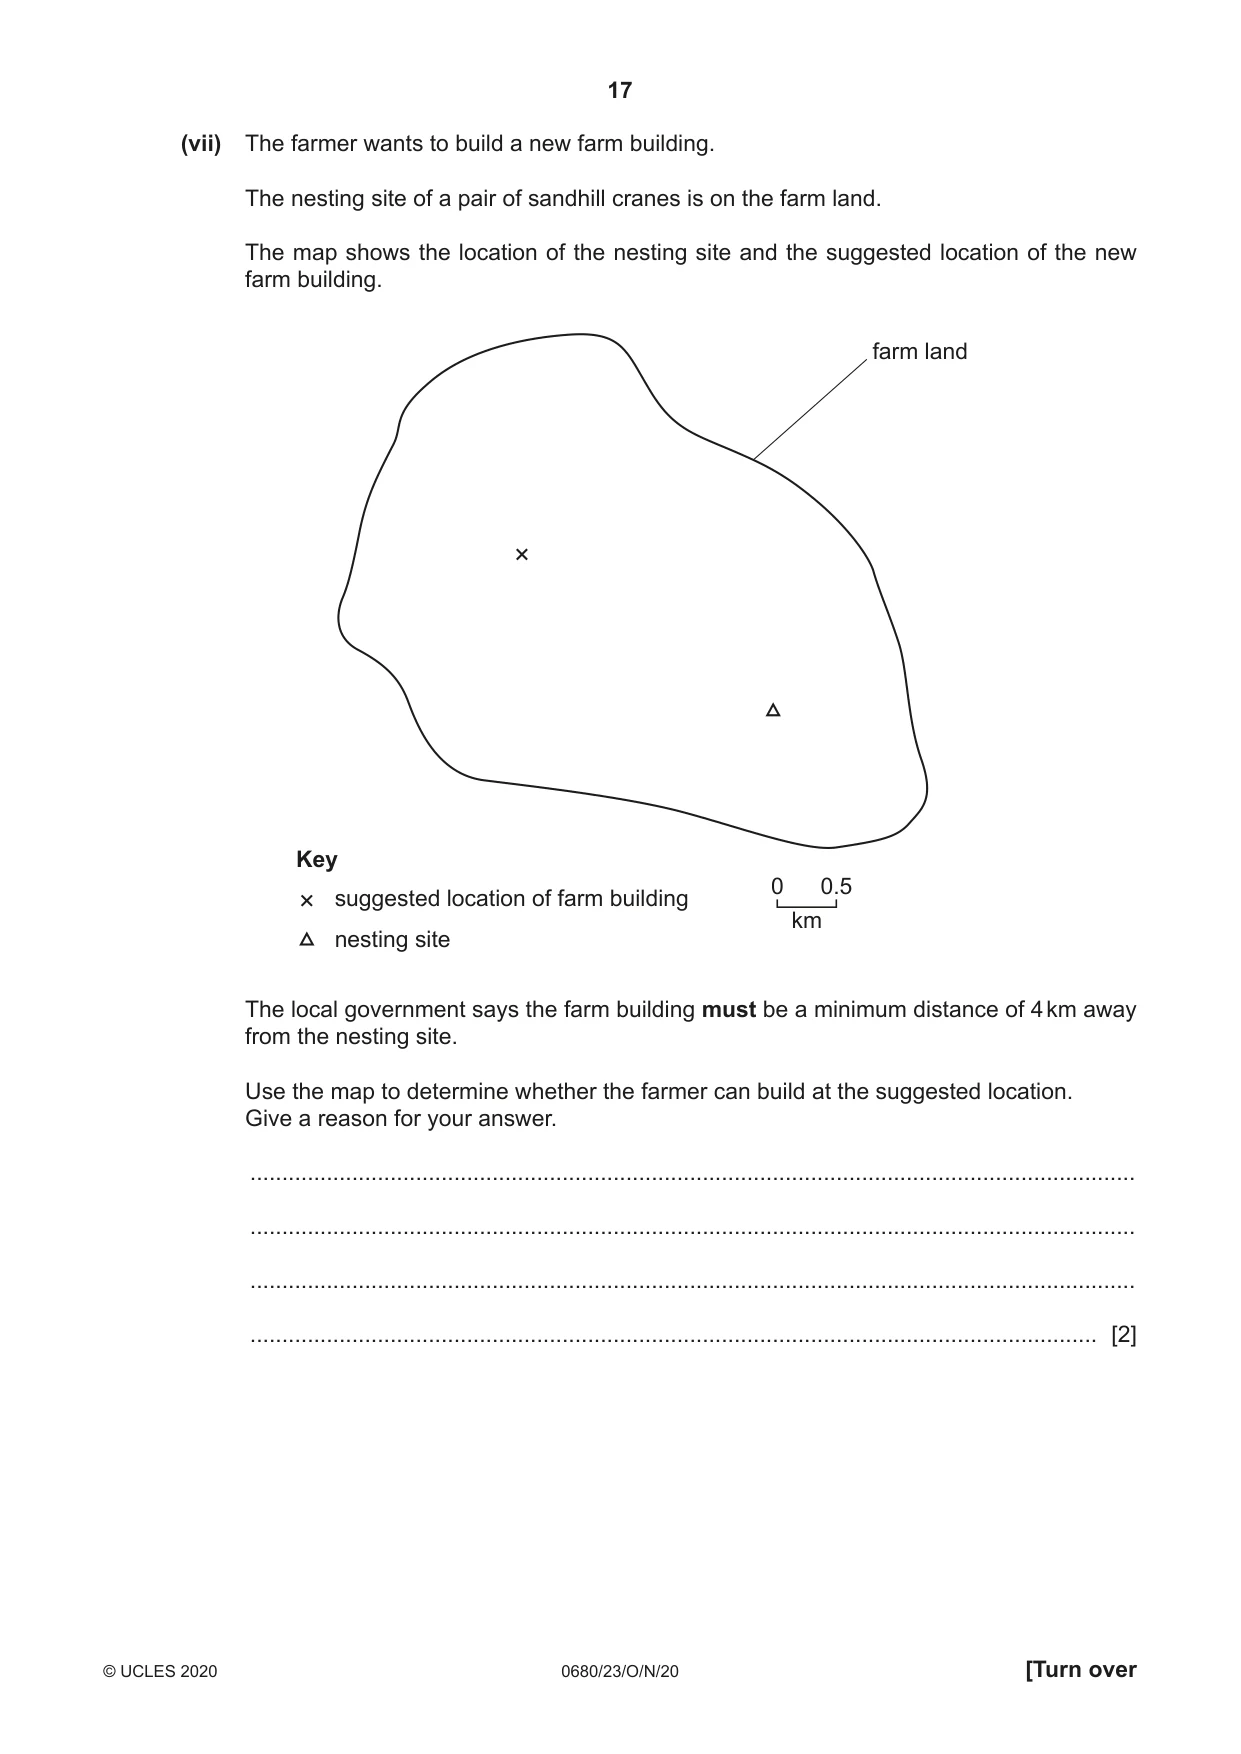
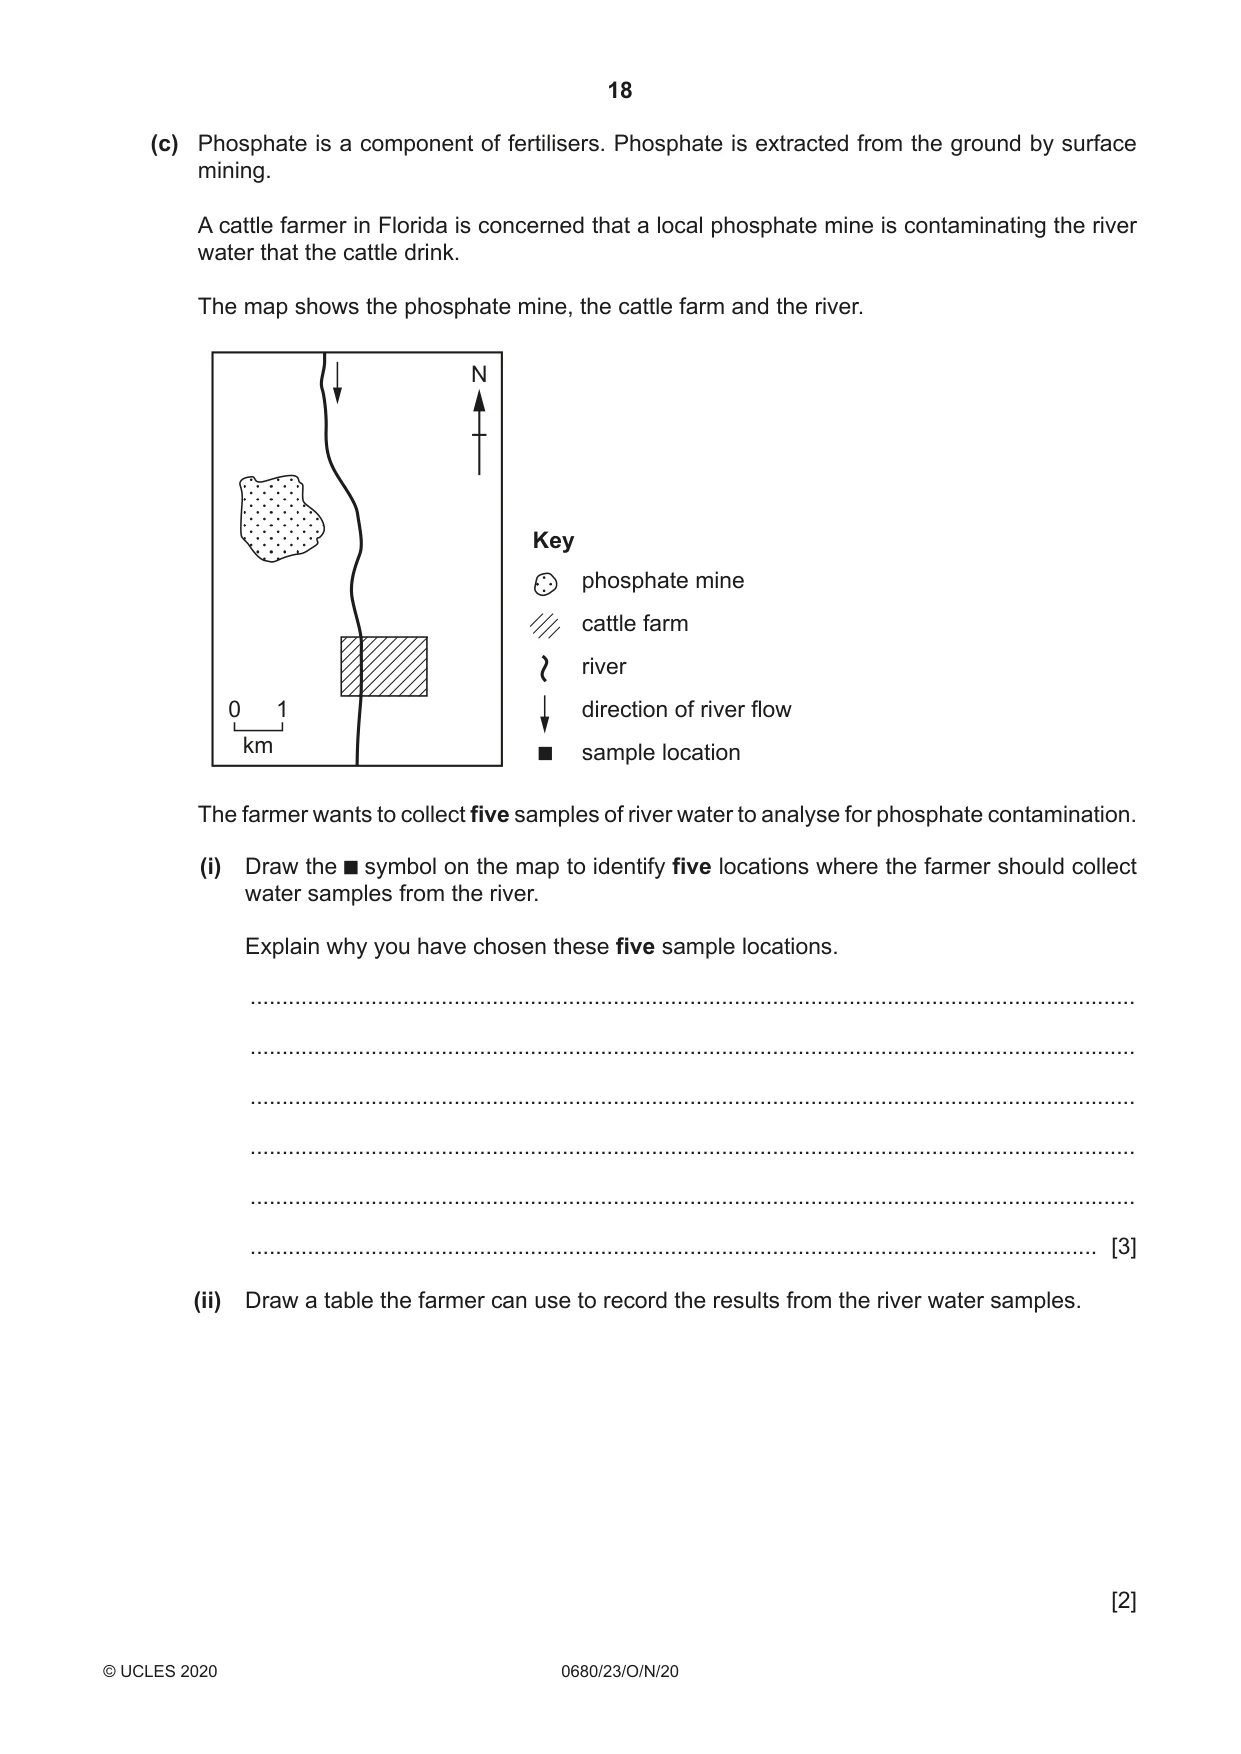
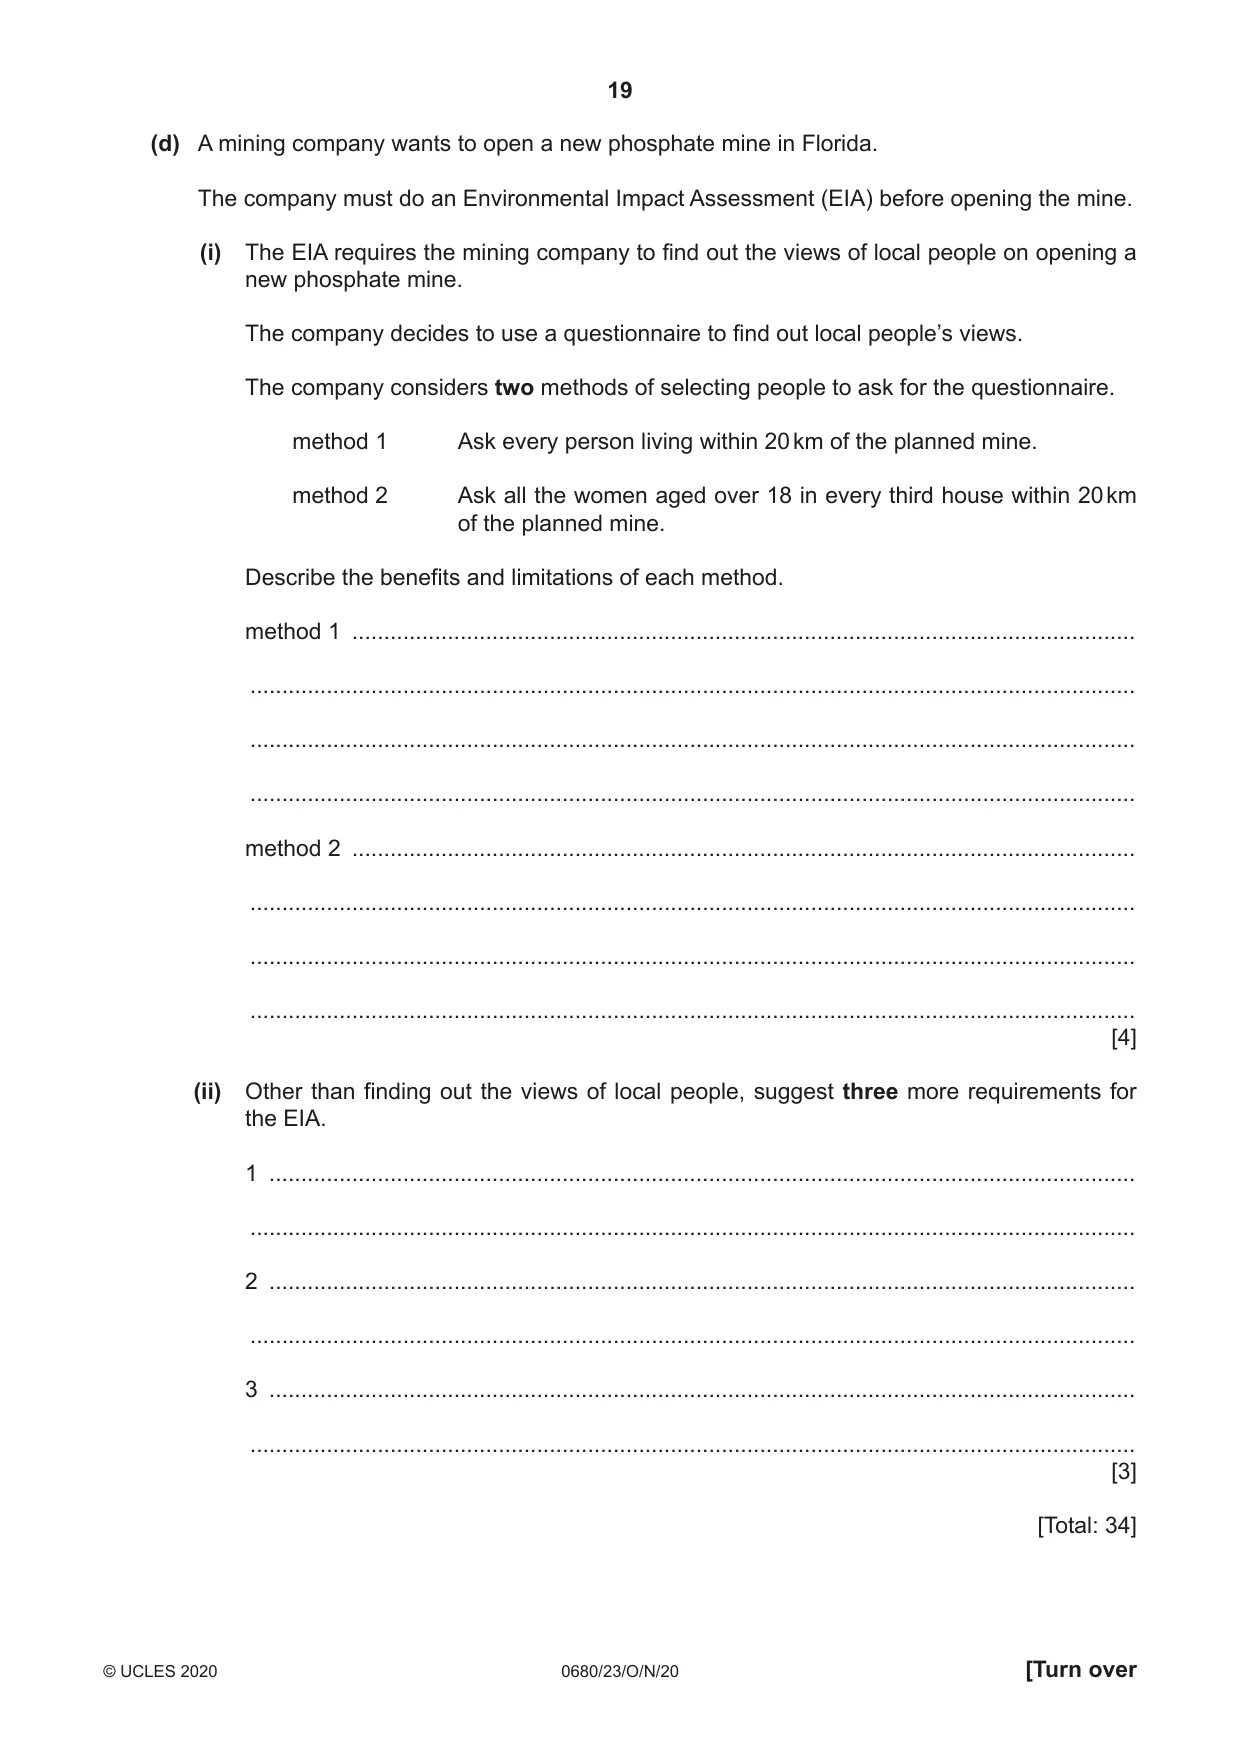
2 (a) The ‘sandhill crane’ is a threatened species of bird in Florida. A student investigates the number of sandhill cranes in Florida after Hurricane Irma. The student uses the following method: • divides a map of Florida into 6 sections as shown N 1 2 3 ATLANTIC OCEAN 4 GULF OF MEXICO 5 6 0 100 km • counts the number of sandhill cranes observed in one day for each section • records the results in a notebook, as shown. section 1 = 3 sightings fifth section, 13 birds section 3 = 6 sightings section 2, 5 birds 6 birds seen in section 4 1 bird in section 6 total sightings 34 (i) Record the student’s results in the table using a tally method, as shown. section number of sandhill cranes total IIII IIII IIII IIII IIII IIII IIII [2] (ii) Using the results, the student makes two conclusions. conclusion 1 The number of sandhill cranes in section 6 is much lower than the other sections. This is a concern. conclusion 2 There are 34 sandhill cranes in Florida. Explain why the two conclusions are not valid. conclusion 1 ...................................................................................................................... ........................................................................................................................................... conclusion 2 ...................................................................................................................... ........................................................................................................................................... [2] (iii) A food chain that includes the sandhill crane is shown. grass cricket Florida mouse sandhill crane Identify the producer in this food chain. ..................................................................................................................................... [1] (iv) Sandhill cranes born in captivity are released into the wild. Explain why captive breeding programmes can result in more sandhill cranes surviving compared with breeding in the wild. ........................................................................................................................................... ........................................................................................................................................... ........................................................................................................................................... ..................................................................................................................................... [2] (b) A farmer investigates the effect of using two fertilisers, X and Y, on the yield of tomato plants. Fertiliser X is an organic fertiliser and fertiliser Y is an artificial, non-organic fertiliser. The farmer uses this method: • select three fields, 1, 2 and 3, that have no planting history and have not previously been used to grow tomatoes • use fertiliser X on the soil in field 1 • use fertiliser Y on the soil in field 2 • do not use fertiliser on the soil in field 3 • plant the same variety of tomato plant in each field • record the average yield of tomatoes per plant from each field • repeat the method after 5 years and 20 years of planting history. average yield of average yield of average yield of tomatoes per plant tomatoes per plant tomatoes per plant field in first year after 5 years after 20 years / g / g / g field 1 – fertiliser X 1372 1392 1072 field 2 – fertiliser Y 1642 1672 1421 field 3 – no fertiliser 956 952 723 (i) Suggest why the farmer does not use fertiliser in field 3. ........................................................................................................................................... ..................................................................................................................................... [1] (ii) Fertilisers are used to increase agricultural yields. Use the table to write a conclusion on the effect of fertilisers X and Y on the yield of the tomato plants. ........................................................................................................................................... ........................................................................................................................................... ........................................................................................................................................... ..................................................................................................................................... [2] (iii) Diagrams of the three fields the farmer uses are shown. The diagrams are not to scale. Key distance between tomato plants 15 m 5 m 15 m 0.7 m 1.0 m 1.0 15 m 5 m 5 m field 1 field 2 field 3 fertiliser X fertiliser Y no fertiliser Suggest two reasons why the farmer’s results are not valid. 1 ........................................................................................................................................ ........................................................................................................................................... 2 ........................................................................................................................................ ........................................................................................................................................... [2] (iv) Suggest reasons why some farmers do not use artificial fertilisers. ........................................................................................................................................... ........................................................................................................................................... ........................................................................................................................................... ........................................................................................................................................... ........................................................................................................................................... ..................................................................................................................................... [3] (v) Using fertiliser is one way of increasing agricultural yields. State three other ways of increasing agricultural yields. 1 ........................................................................................................................................ ........................................................................................................................................... 2 ........................................................................................................................................ ........................................................................................................................................... 3 ........................................................................................................................................ ........................................................................................................................................... [3] (vi) The soil in the farmer’s fields is a clay soil. Describe two characteristics of a clay soil. 1 ........................................................................................................................................ ........................................................................................................................................... 2 ........................................................................................................................................ ........................................................................................................................................... [2] (vii) The farmer wants to build a new farm building. The nesting site of a pair of sandhill cranes is on the farm land. The map shows the location of the nesting site and the suggested location of the new farm building. farm land Key 0 0.5 suggested location of farm building km nesting site The local government says the farm building must be a minimum distance of 4 km away from the nesting site. Use the map to determine whether the farmer can build at the suggested location. Give a reason for your answer. ........................................................................................................................................... ........................................................................................................................................... ........................................................................................................................................... ..................................................................................................................................... [2] (c) Phosphate is a component of fertilisers. Phosphate is extracted from the ground by surface mining. A cattle farmer in Florida is concerned that a local phosphate mine is contaminating the river water that the cattle drink. The map shows the phosphate mine, the cattle farm and the river. N Key phosphate mine cattle farm river 0 1 direction of river flow km sample location The farmer wants to collect five samples of river water to analyse for phosphate contamination. (i) Draw the symbol on the map to identify five locations where the farmer should collect water samples from the river. Explain why you have chosen these five sample locations. ........................................................................................................................................... ........................................................................................................................................... ........................................................................................................................................... ........................................................................................................................................... ........................................................................................................................................... ..................................................................................................................................... [3] (ii) Draw a table the farmer can use to record the results from the river water samples. [2] (d) A mining company wants to open a new phosphate mine in Florida. The company must do an Environmental Impact Assessment (EIA) before opening the mine. (i) The EIA requires the mining company to find out the views of local people on opening a new phosphate mine. The company decides to use a questionnaire to find out local people’s views. The company considers two methods of selecting people to ask for the questionnaire. method 1 Ask every person living within 20 km of the planned mine. method 2 Ask all the women aged over 18 in every third house within 20 km of the planned mine. Describe the benefits and limitations of each method. method 1 ........................................................................................................................... ........................................................................................................................................... ........................................................................................................................................... ........................................................................................................................................... method 2 ........................................................................................................................... ........................................................................................................................................... ........................................................................................................................................... ........................................................................................................................................... [4] (ii) Other than finding out the views of local people, suggest three more requirements for the EIA. 1 ........................................................................................................................................ ........................................................................................................................................... 2 ........................................................................................................................................ ........................................................................................................................................... 3 ........................................................................................................................................ ........................................................................................................................................... [3] [Total: 34]
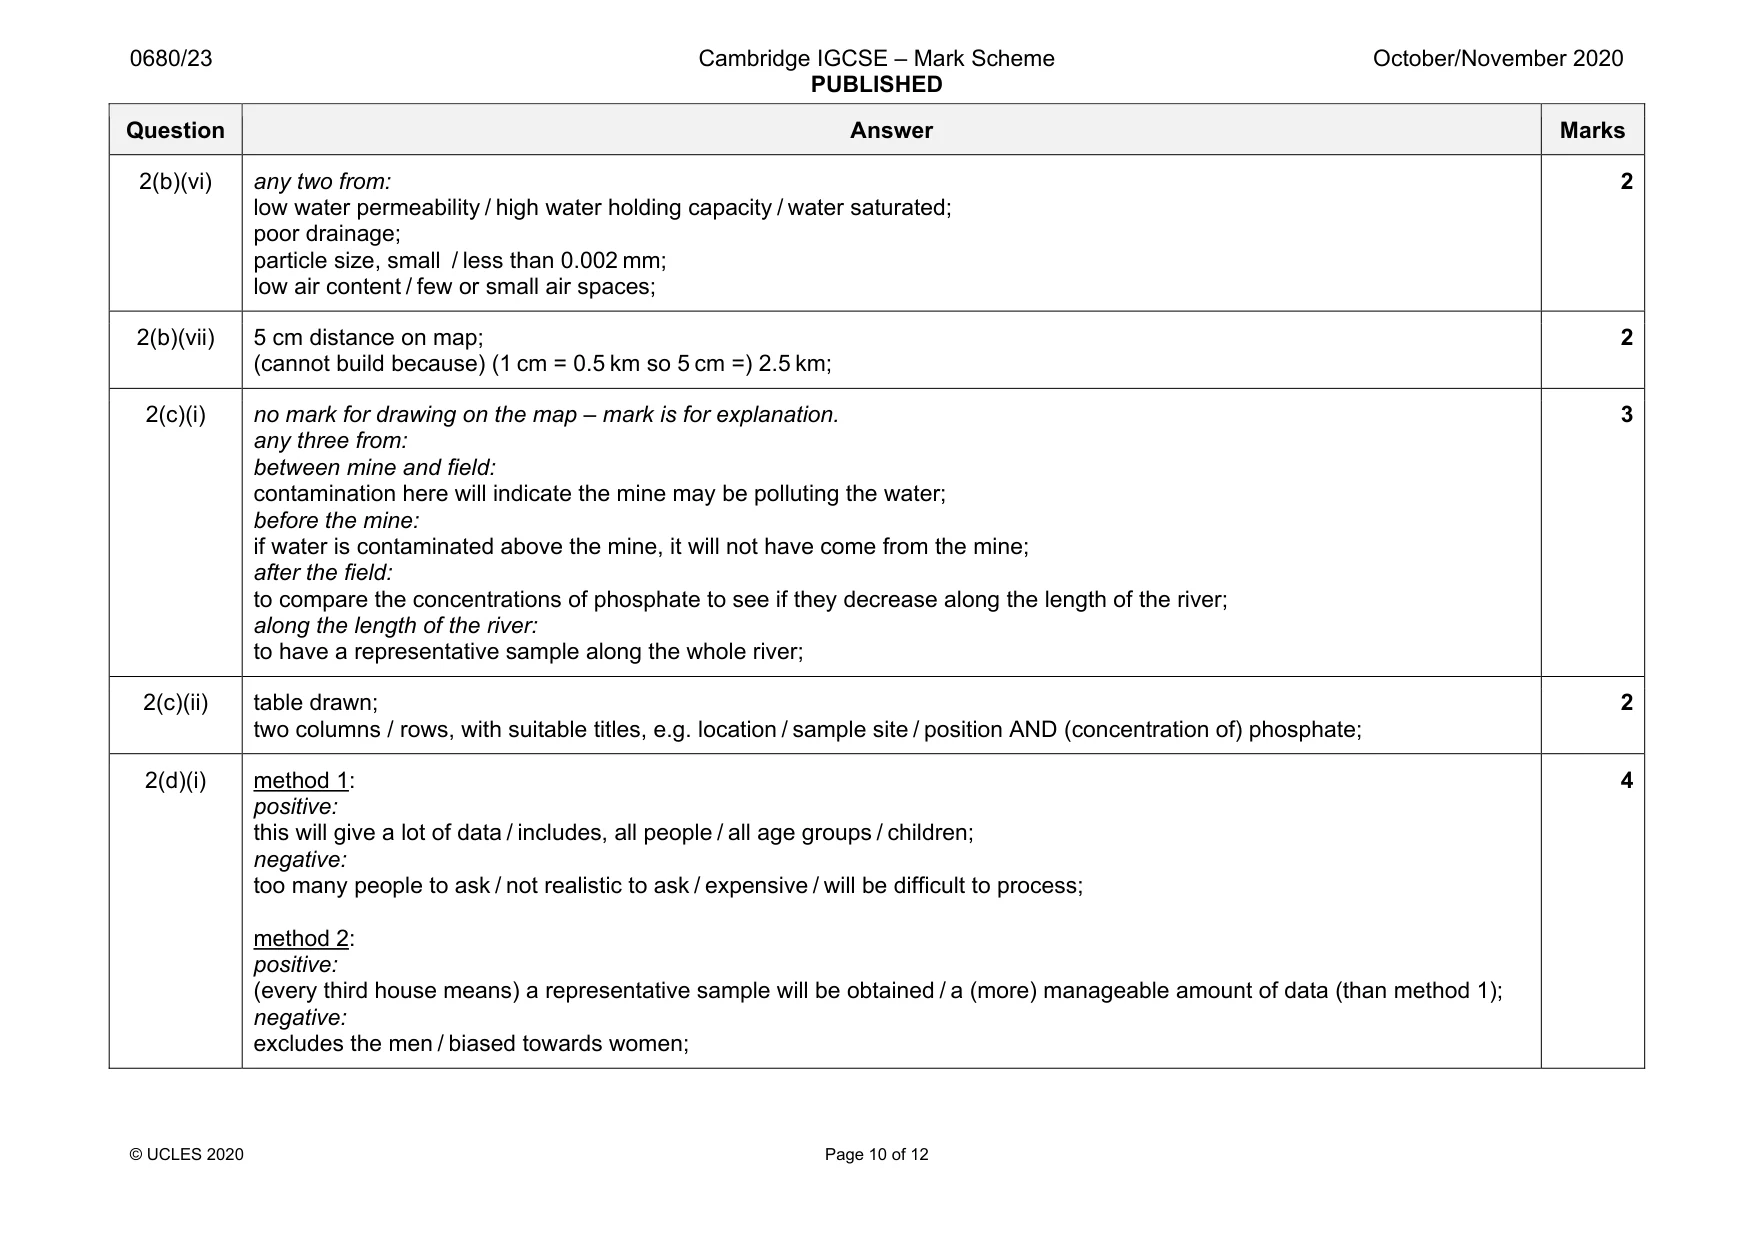
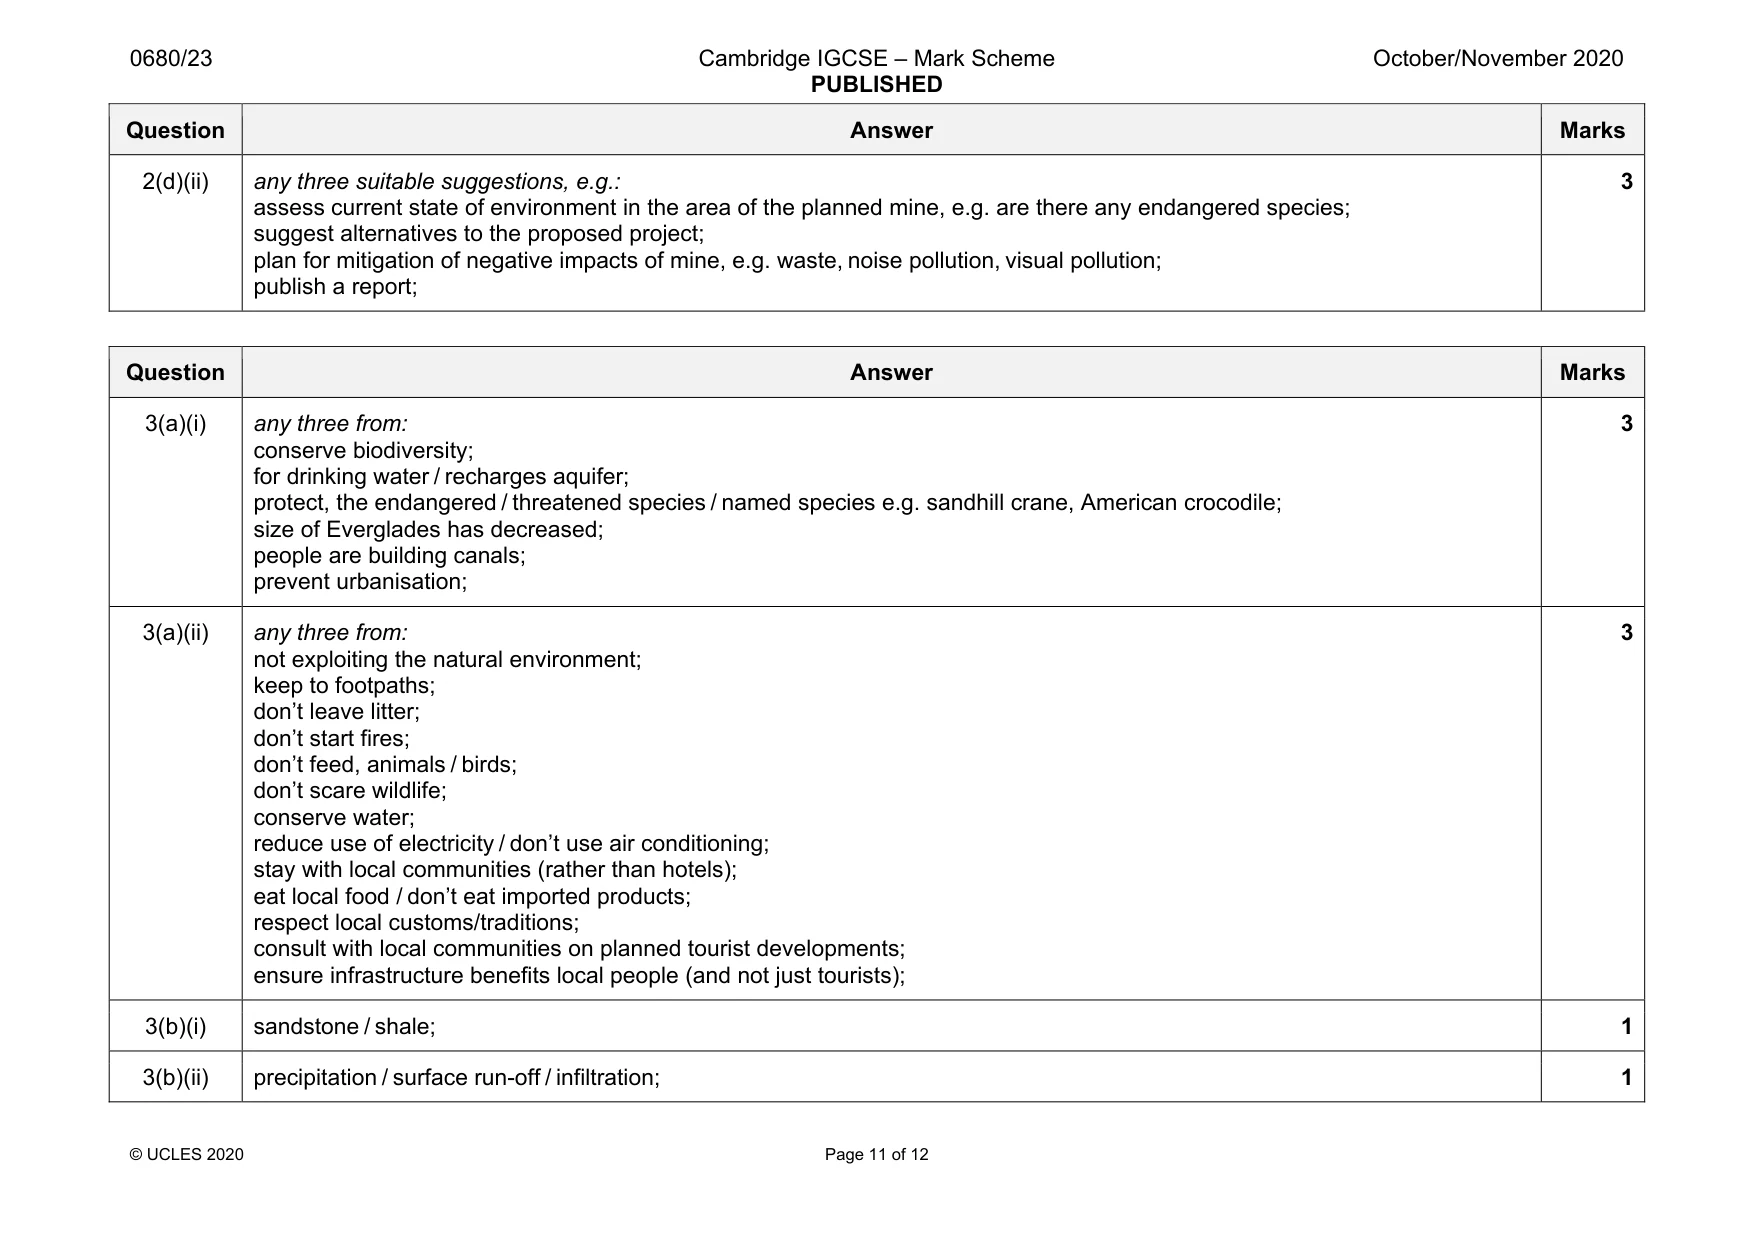
Mark scheme: 2(a)(i) data recorded correctly; using tally system correctly; 2 2(a)(ii) any one from conclusion 1: the section sizes are not equal (so cannot be compared); sections may not contain the same habitats; any one from conclusion 2: (birds can fly so) the same bird could be counted more than once; not enough data collected; sample was only taken on one day; only one sample per section; 2 Question Answer Marks 2(a)(iii) grass; 1 2(a)(iv) any two from: (in captivity) fewer predators; better diet for parents; eggs / parents, can be protected; AVP, e.g. availability of, medicine / vet care; 2 2(b)(i) control / to see the effect without fertiliser; 1 2(b)(ii) any two from: Y is the most effective fertiliser / Y increases the yield by the most; X and Y both increase the yield compared with no fertiliser; (for X and Y) the effect / increase in yield, reduces after 20 years; 2 2(b)(iii) any two from: different sized fields; different planting distances; no data about starting soil conditions / different starting soil in each field; 2 2(b)(iv) any three from: concern over nutrient enrichment / eutrophication / algae blooms; concern over leaching / fertilisers entering water; concern over loss of biodiversity; want to grow organically; financial restriction; 3 2(b)(v) any three from: crop rotation; irrigation / named example; insect control / insecticide / biological control / weed control / herbicide / fungi control / fungicide; mechanisation; selective breeding; genetically modified organisms / GMO; controlled environments / greenhouses / hydroponics; 3 Question Answer Marks 2(b)(vi) any two from: low water permeability / high water holding capacity / water saturated; poor drainage; particle size, small / less than 0.002 mm; low air content / few or small air spaces; 2 2(b)(vii) 5 cm distance on map; (cannot build because) (1 cm = 0.5 km so 5 cm =) 2.5 km; 2 2(c)(i) no mark for drawing on the map – mark is for explanation. any three from: between mine and field: contamination here will indicate the mine may be polluting the water; before the mine: if water is contaminated above the mine, it will not have come from the mine; after the field: to compare the concentrations of phosphate to see if they decrease along the length of the river; along the length of the river: to have a representative sample along the whole river; 3 2(c)(ii) table drawn; two columns / rows, with suitable titles, e.g. location / sample site / position AND (concentration of) phosphate; 2 2(d)(i) method 1: positive: this will give a lot of data / includes, all people / all age groups / children; negative: too many people to ask / not realistic to ask / expensive / will be difficult to process; method 2: positive: (every third house means) a representative sample will be obtained / a (more) manageable amount of data (than method 1); negative: excludes the men / biased towards women; 4 Question Answer Marks 2(d)(ii) any three suitable suggestions, e.g.: assess current state of environment in the area of the planned mine, e.g. are there any endangered species; suggest alternatives to the proposed project; plan for mitigation of negative impacts of mine, e.g. waste, noise pollution, visual pollution; publish a report; 3
Q3 · The fact sheet shows information about the Everglades
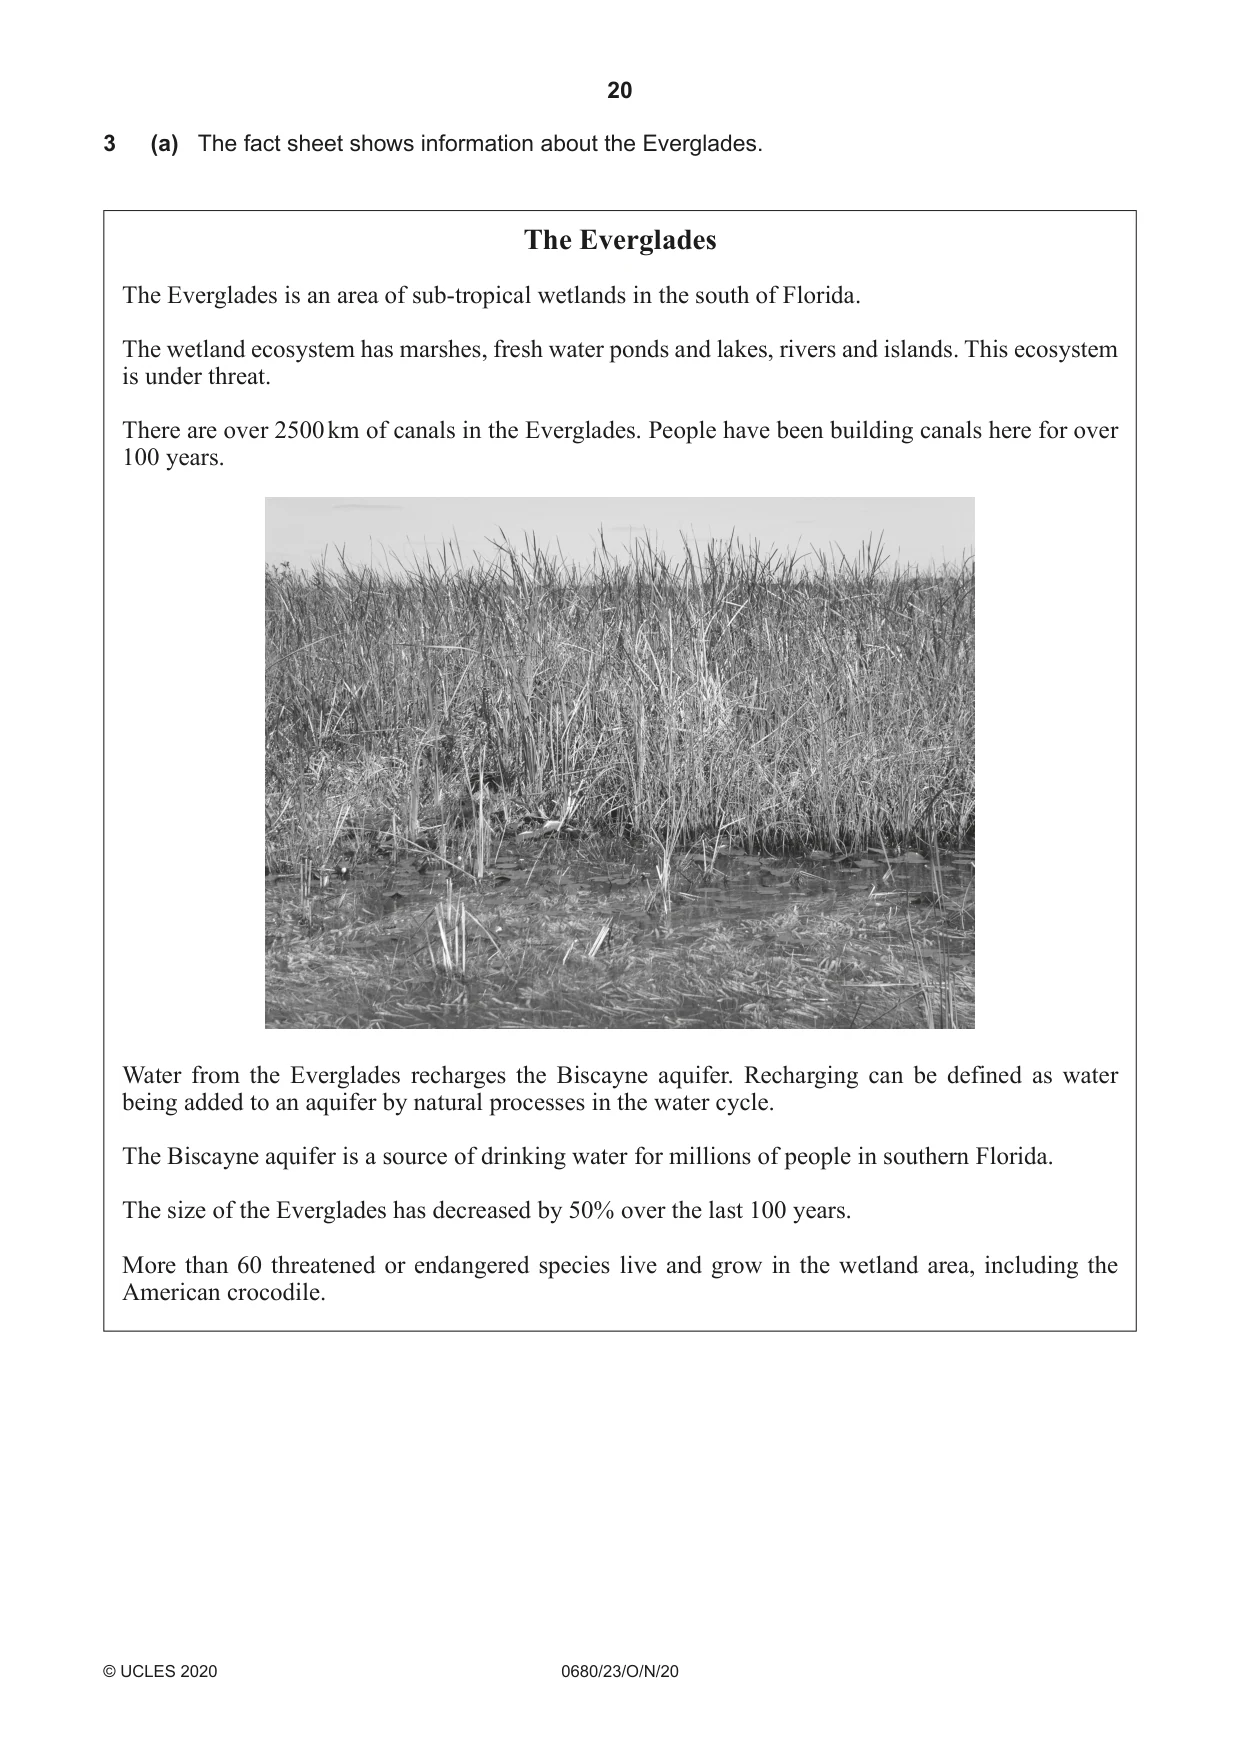
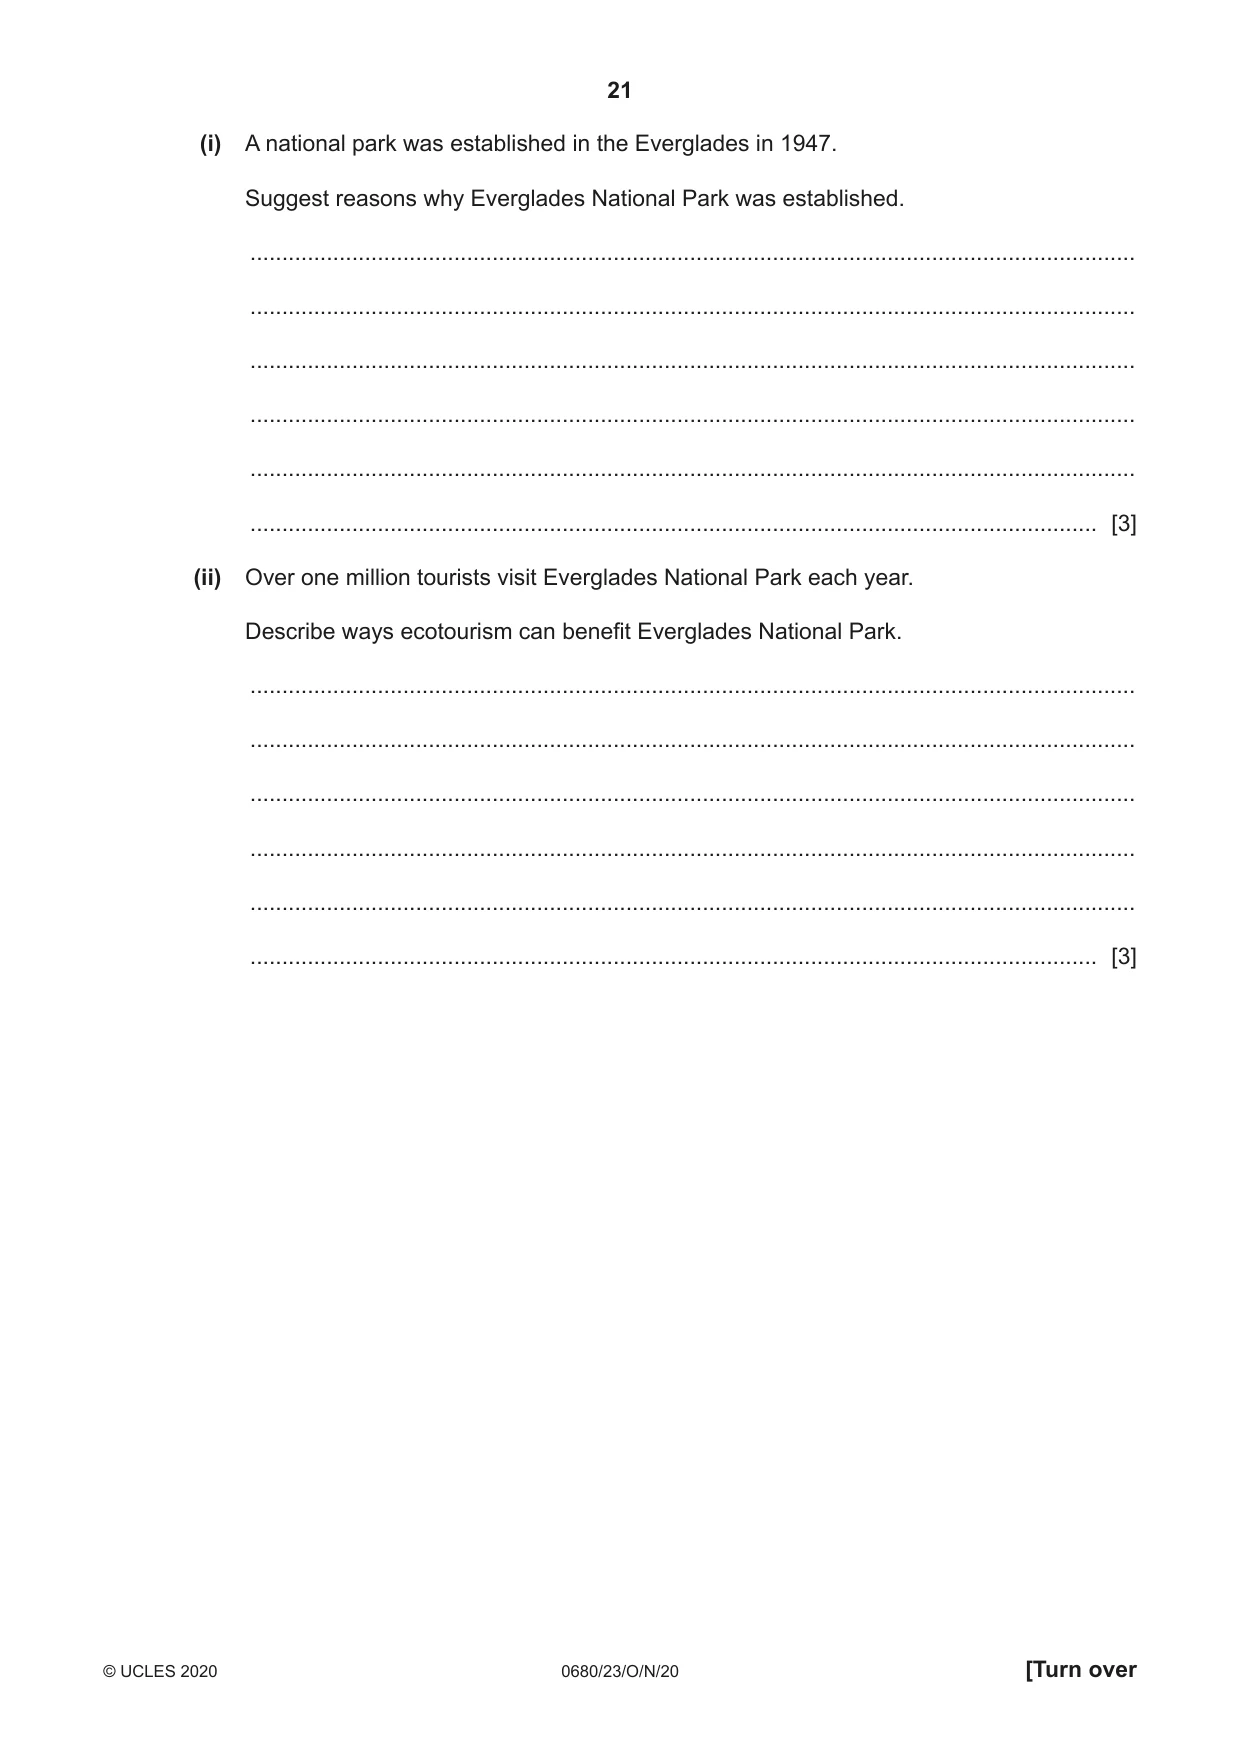
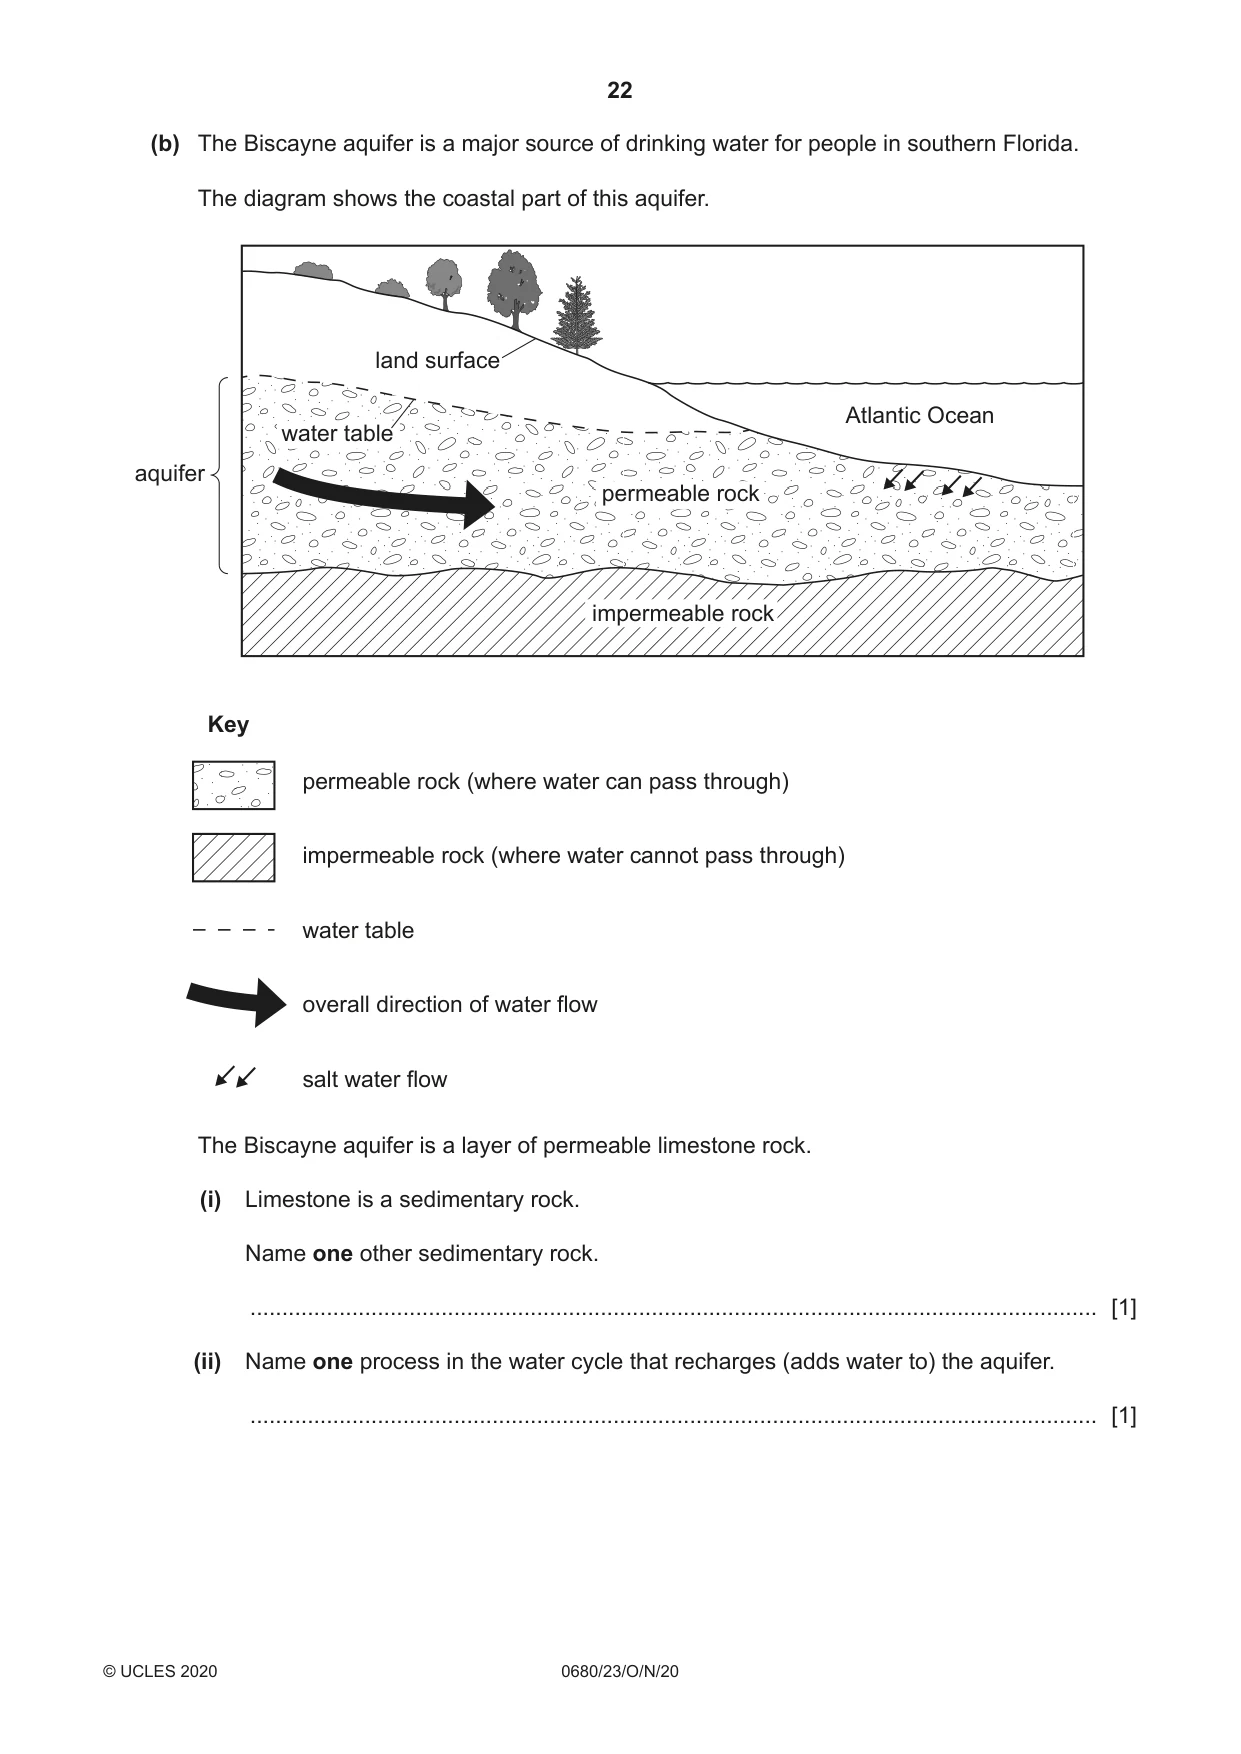
3 (a) The fact sheet shows information about the Everglades. The Everglades The Everglades is an area of sub-tropical wetlands in the south of Florida. The wetland ecosystem has marshes, fresh water ponds and lakes, rivers and islands. This ecosystem is under threat. There are over 2500 km of canals in the Everglades. People have been building canals here for over 100 years. Water from the Everglades recharges the Biscayne aquifer. Recharging can be defined as water being added to an aquifer by natural processes in the water cycle. The Biscayne aquifer is a source of drinking water for millions of people in southern Florida. The size of the Everglades has decreased by 50% over the last 100 years. More than 60 threatened or endangered species live and grow in the wetland area, including the American crocodile. (i) A national park was established in the Everglades in 1947. Suggest reasons why Everglades National Park was established. ........................................................................................................................................... ........................................................................................................................................... ........................................................................................................................................... ........................................................................................................................................... ........................................................................................................................................... ..................................................................................................................................... [3] (ii) Over one million tourists visit Everglades National Park each year. Describe ways ecotourism can benefit Everglades National Park. ........................................................................................................................................... ........................................................................................................................................... ........................................................................................................................................... ........................................................................................................................................... ........................................................................................................................................... ..................................................................................................................................... [3] (b) The Biscayne aquifer is a major source of drinking water for people in southern Florida. The diagram shows the coastal part of this aquifer. land surface Atlantic Ocean water table aquifer permeable rock impermeable rock Key permeable rock (where water can pass through) impermeable rock (where water cannot pass through) water table overall direction of water flow salt water flow The Biscayne aquifer is a layer of permeable limestone rock. (i) Limestone is a sedimentary rock. Name one other sedimentary rock. ..................................................................................................................................... [1] (ii) Name one process in the water cycle that recharges (adds water to) the aquifer. ..................................................................................................................................... [1]
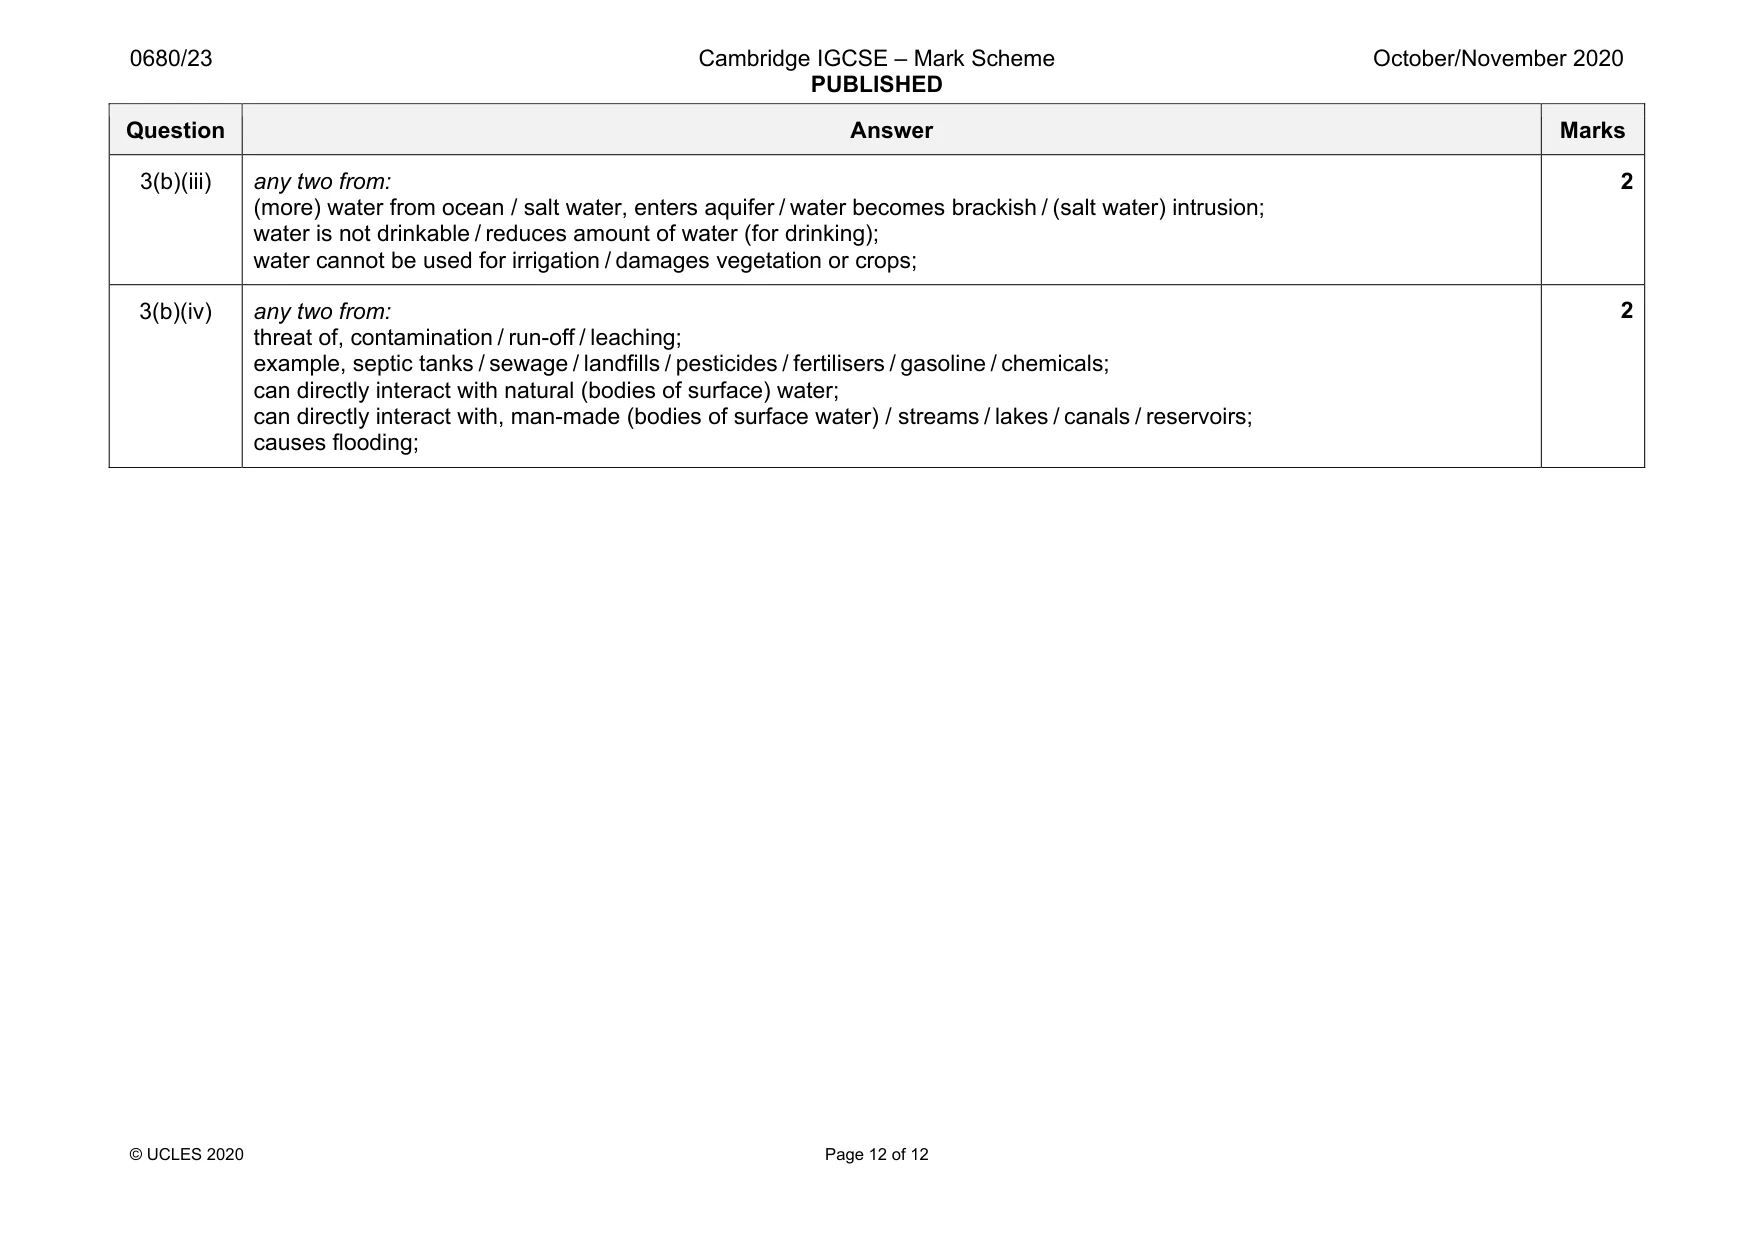
Mark scheme: 3(a)(i) any three from: conserve biodiversity; for drinking water / recharges aquifer; protect, the endangered / threatened species / named species e.g. sandhill crane, American crocodile; size of Everglades has decreased; people are building canals; prevent urbanisation; 3(a)(ii) any three from: not exploiting the natural environment; keep to footpaths; don’t leave litter; don’t start fires; don’t feed, animals / birds; don’t scare wildlife; conserve water; reduce use of electricity / don’t use air conditioning; stay with local communities (rather than hotels); eat local food / don’t eat imported products; respect local customs/traditions; consult with local communities on planned tourist developments; ensure infrastructure benefits local people (and not just tourists); 3 3(b)(i) sandstone / shale; 1 3(b)(ii) precipitation / surface run-off / infiltration; 1 Question Answer Marks 3(b)(iii) any two from: (more) water from ocean / salt water, enters aquifer / water becomes brackish / (salt water) intrusion; water is not drinkable / reduces amount of water (for drinking); water cannot be used for irrigation / damages vegetation or crops; 2 3(b)(iv) any two from: threat of, contamination / run-off / leaching; example, septic tanks / sewage / landfills / pesticides / fertilisers / gasoline / chemicals; can directly interact with natural (bodies of surface) water; can directly interact with, man-made (bodies of surface water) / streams / lakes / canals / reservoirs; causes flooding; 2
What was in this paper
The subtopics covered by these 3 questions, and how many questions each got. Open one in a new tab to see every Cambridge question on it.
What you needed in this session
Cambridge’s own grade thresholds for 2020 Oct/Nov, Paper 2 · Variant 3. A higher threshold means an easier paper — the bar moves with how the cohort did.