Cambridge IGCSE Environmental Management 0680 — 2019 May/June Paper 2 · Variant 3
0680/23/M/J/19 · 3 questions · 80 marks · ≈90 min
The question paper and its mark scheme, free to read here and free to download. This is Cambridge’s own paper, exactly as it was sat.
Question paper24 pages



Mark scheme10 pages
Answers below. Sit the paper first if you are practising.
Questions as text
Q1 · The map shows how some of the land in Iceland is used
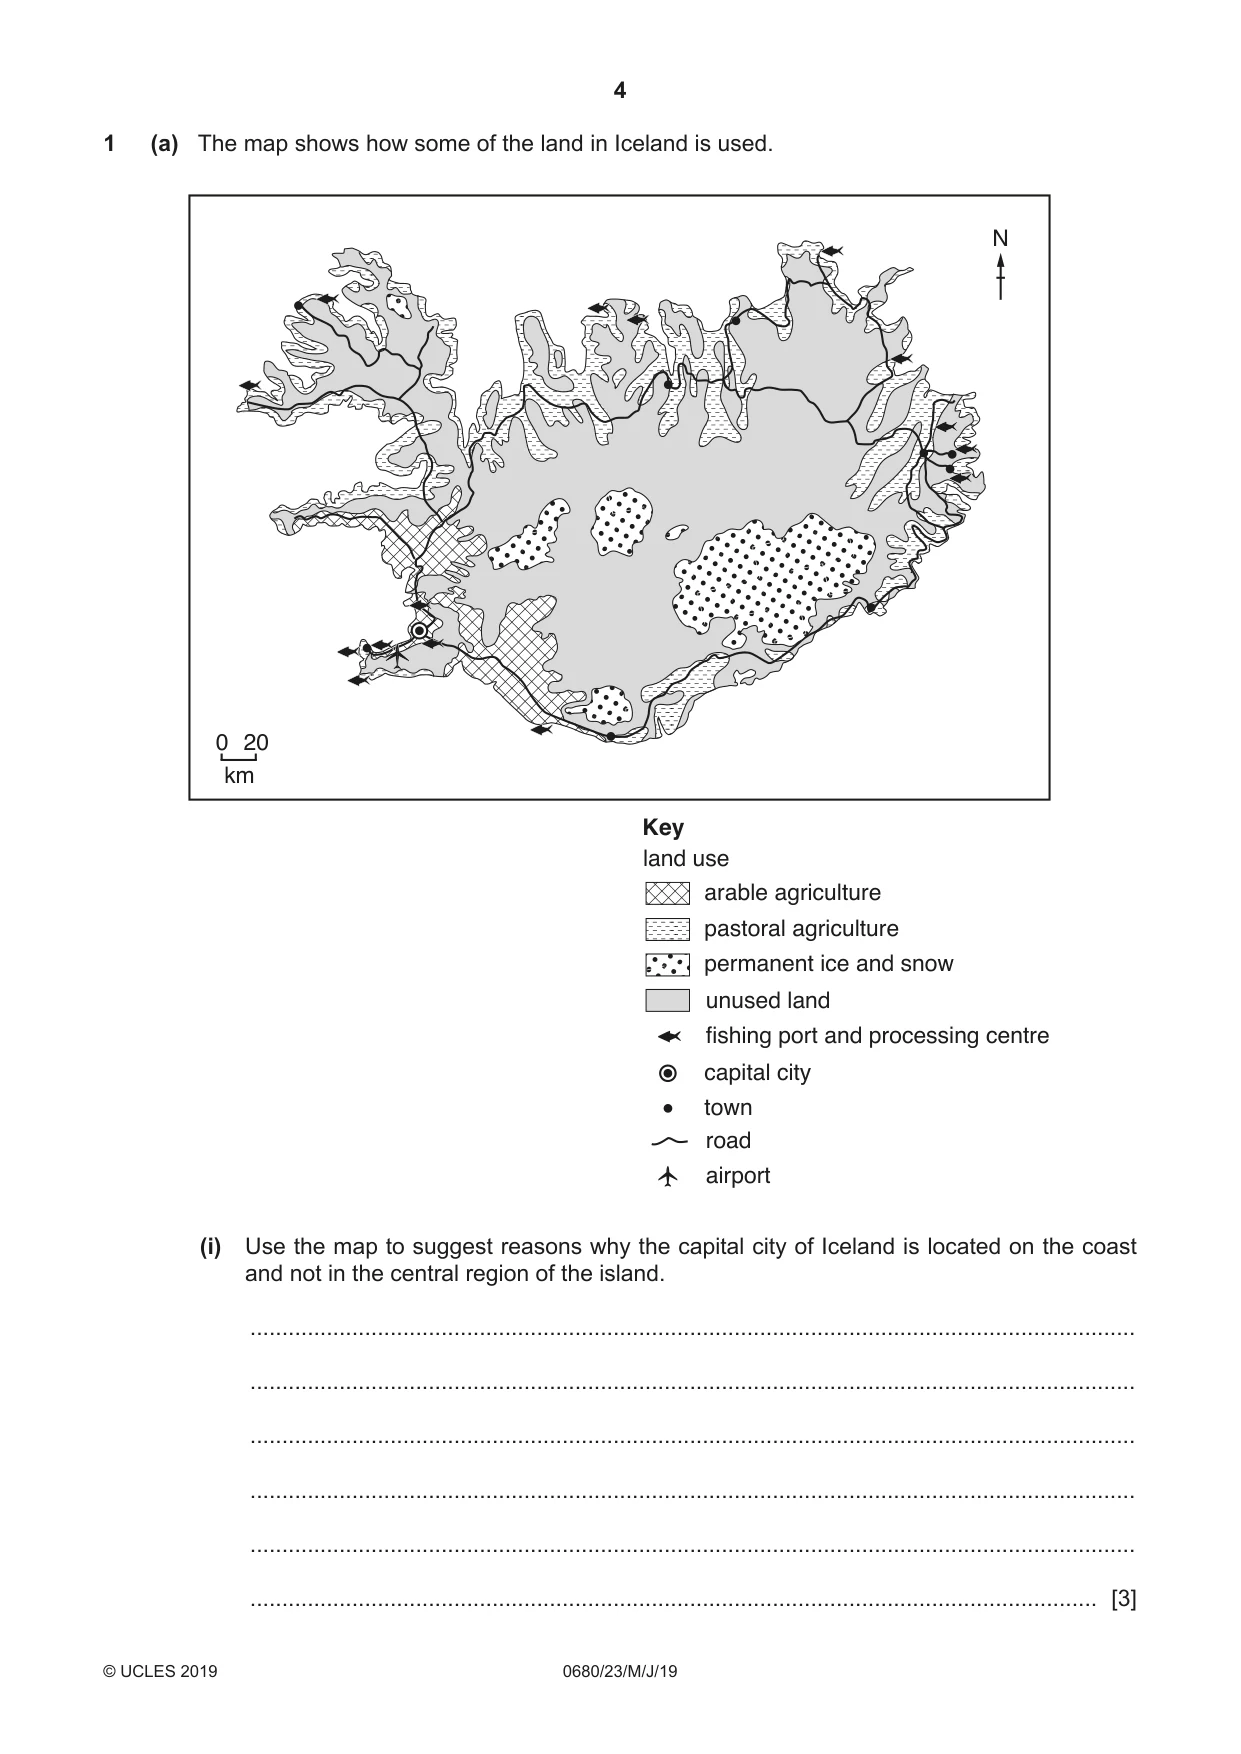
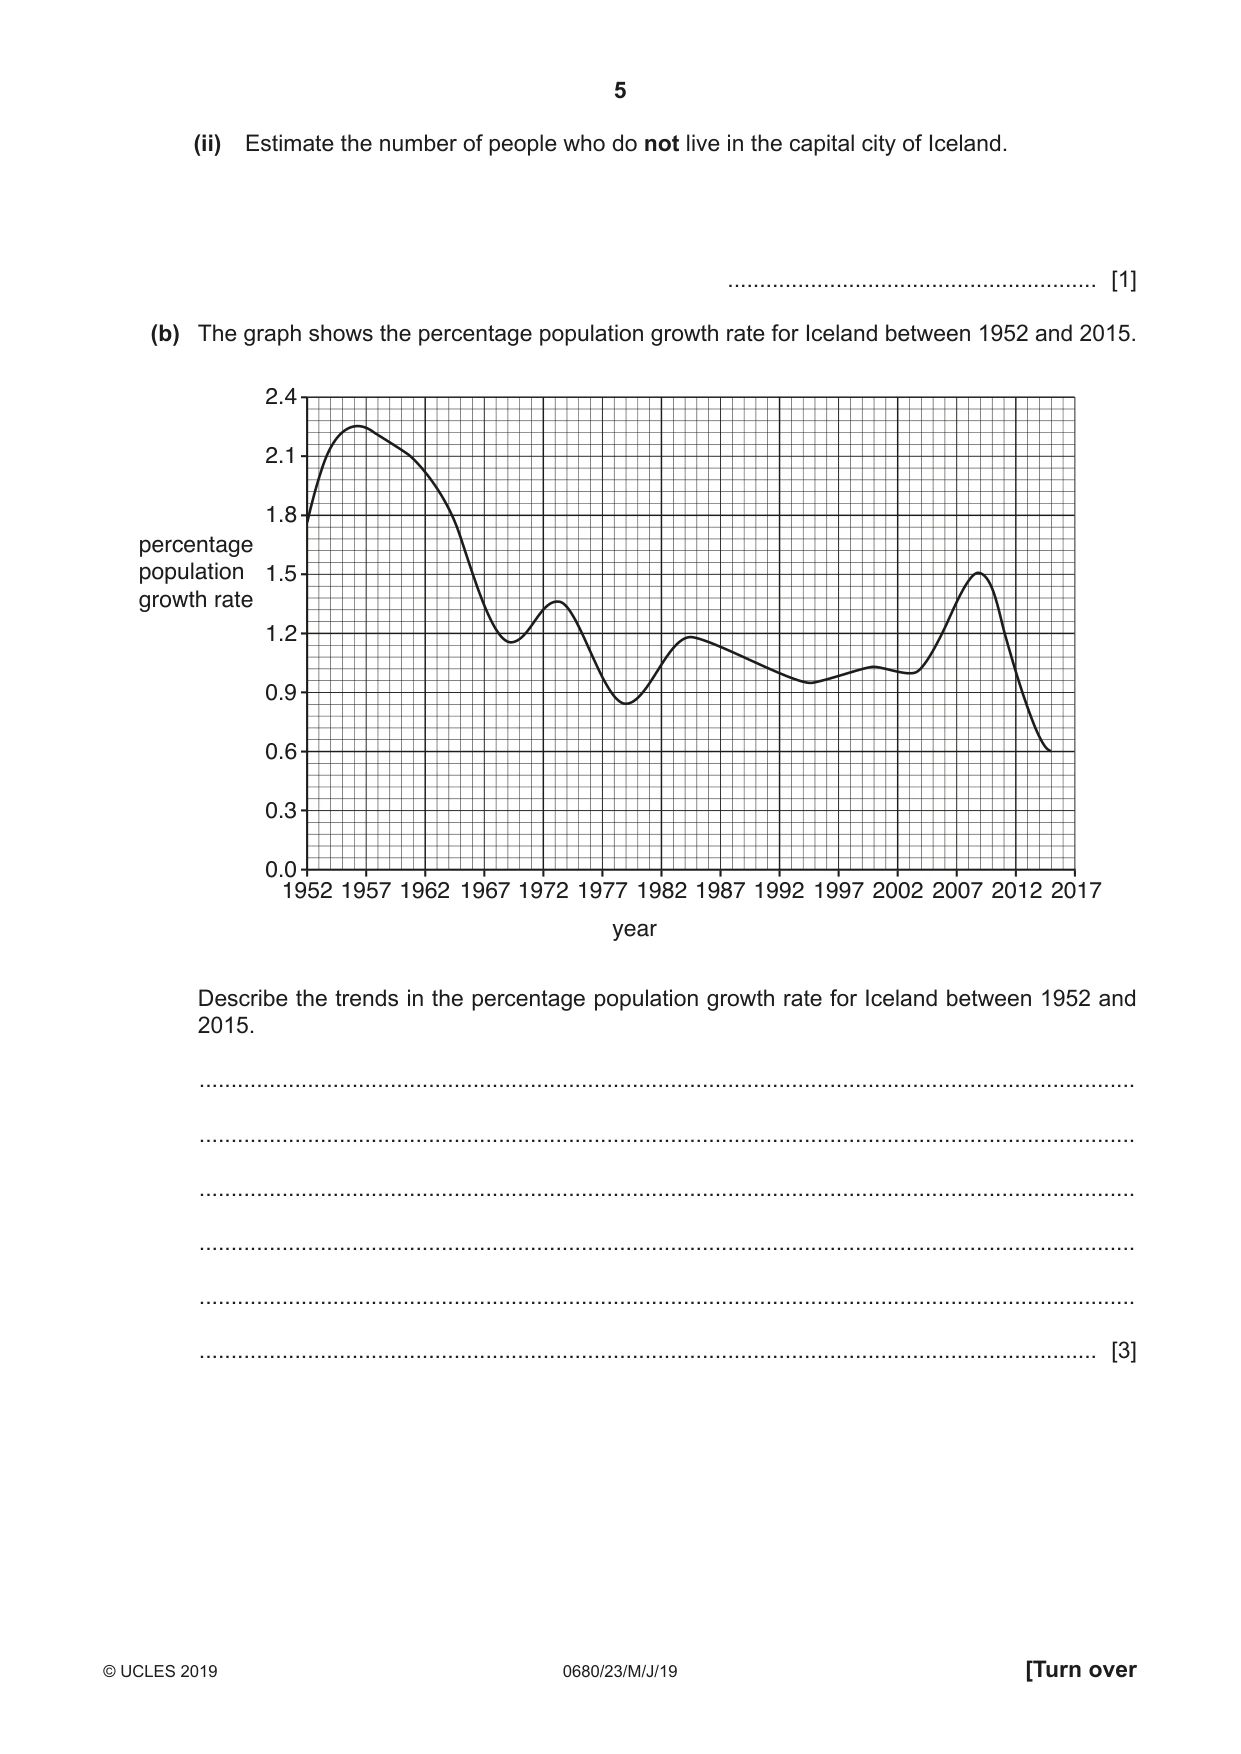
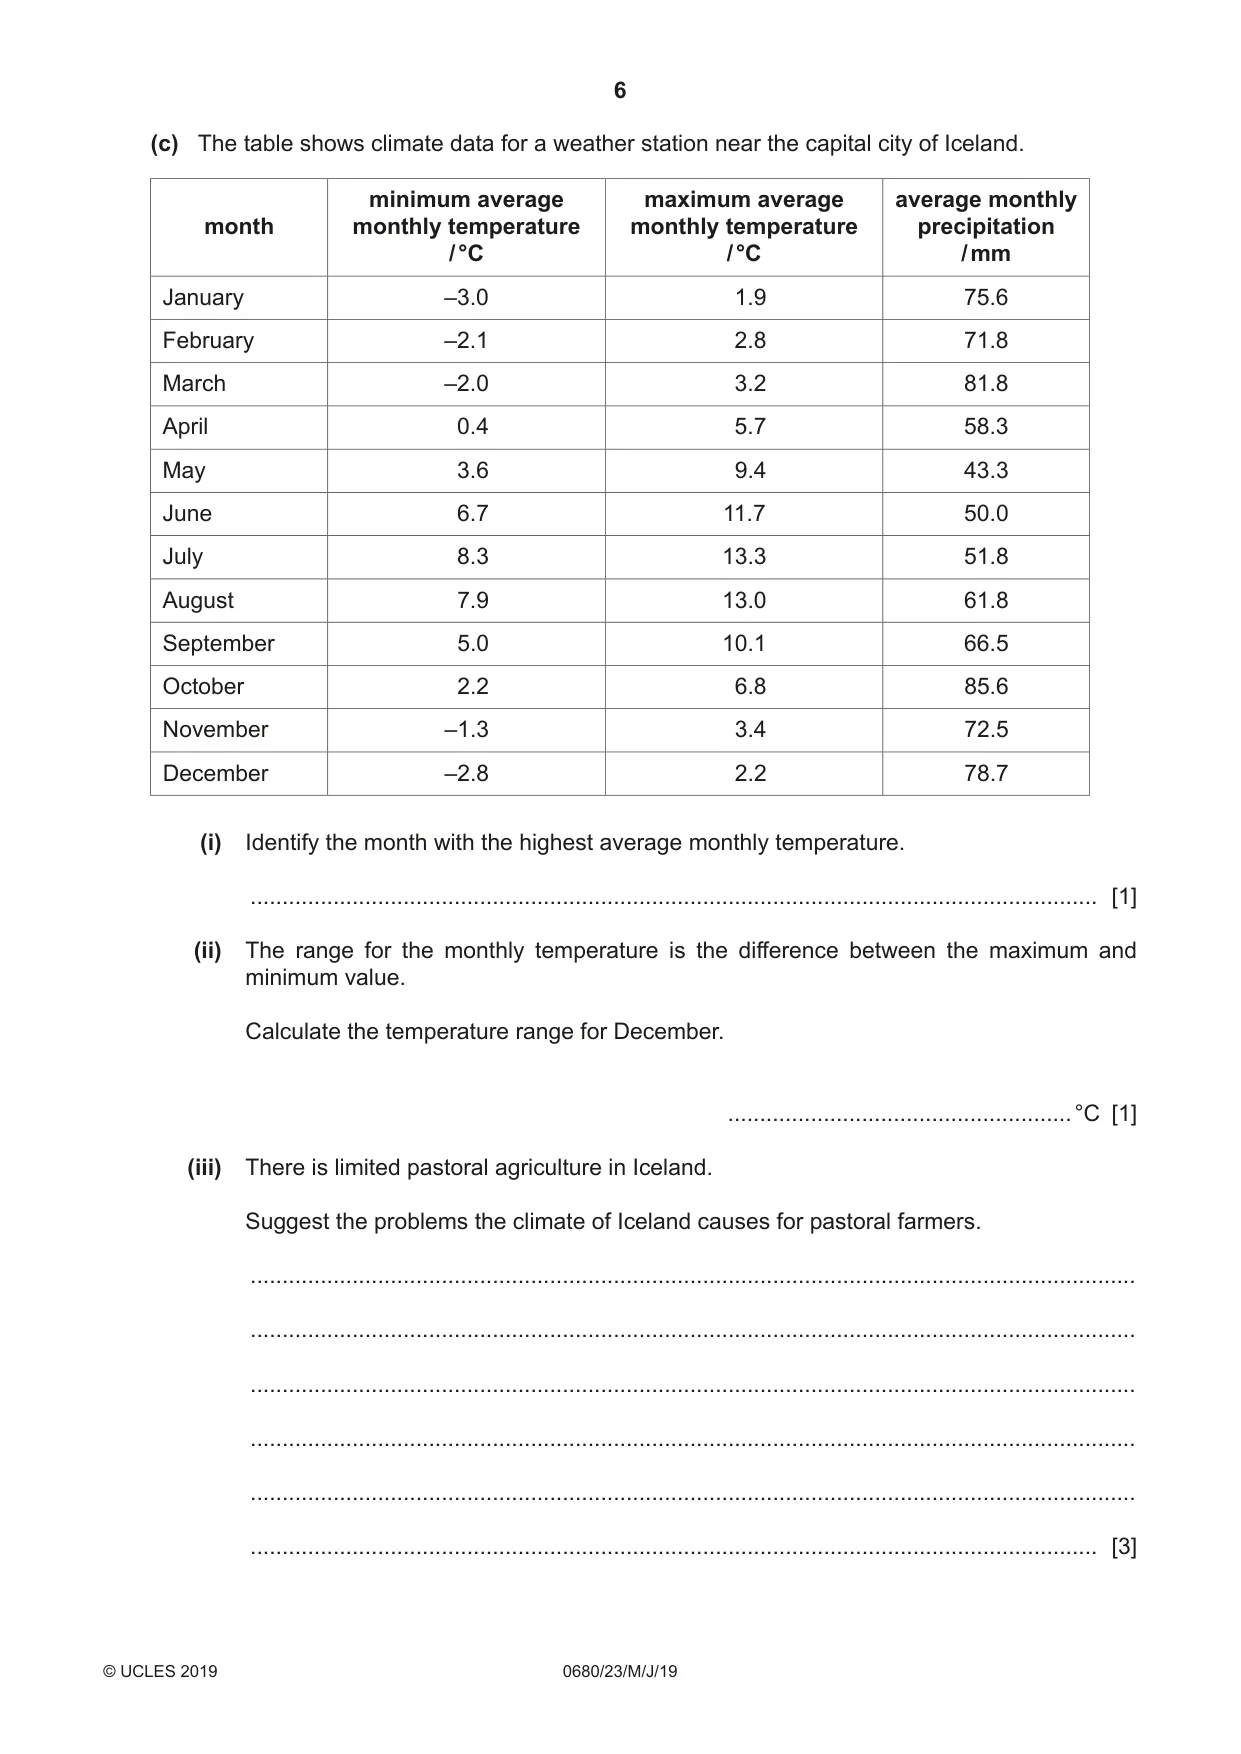
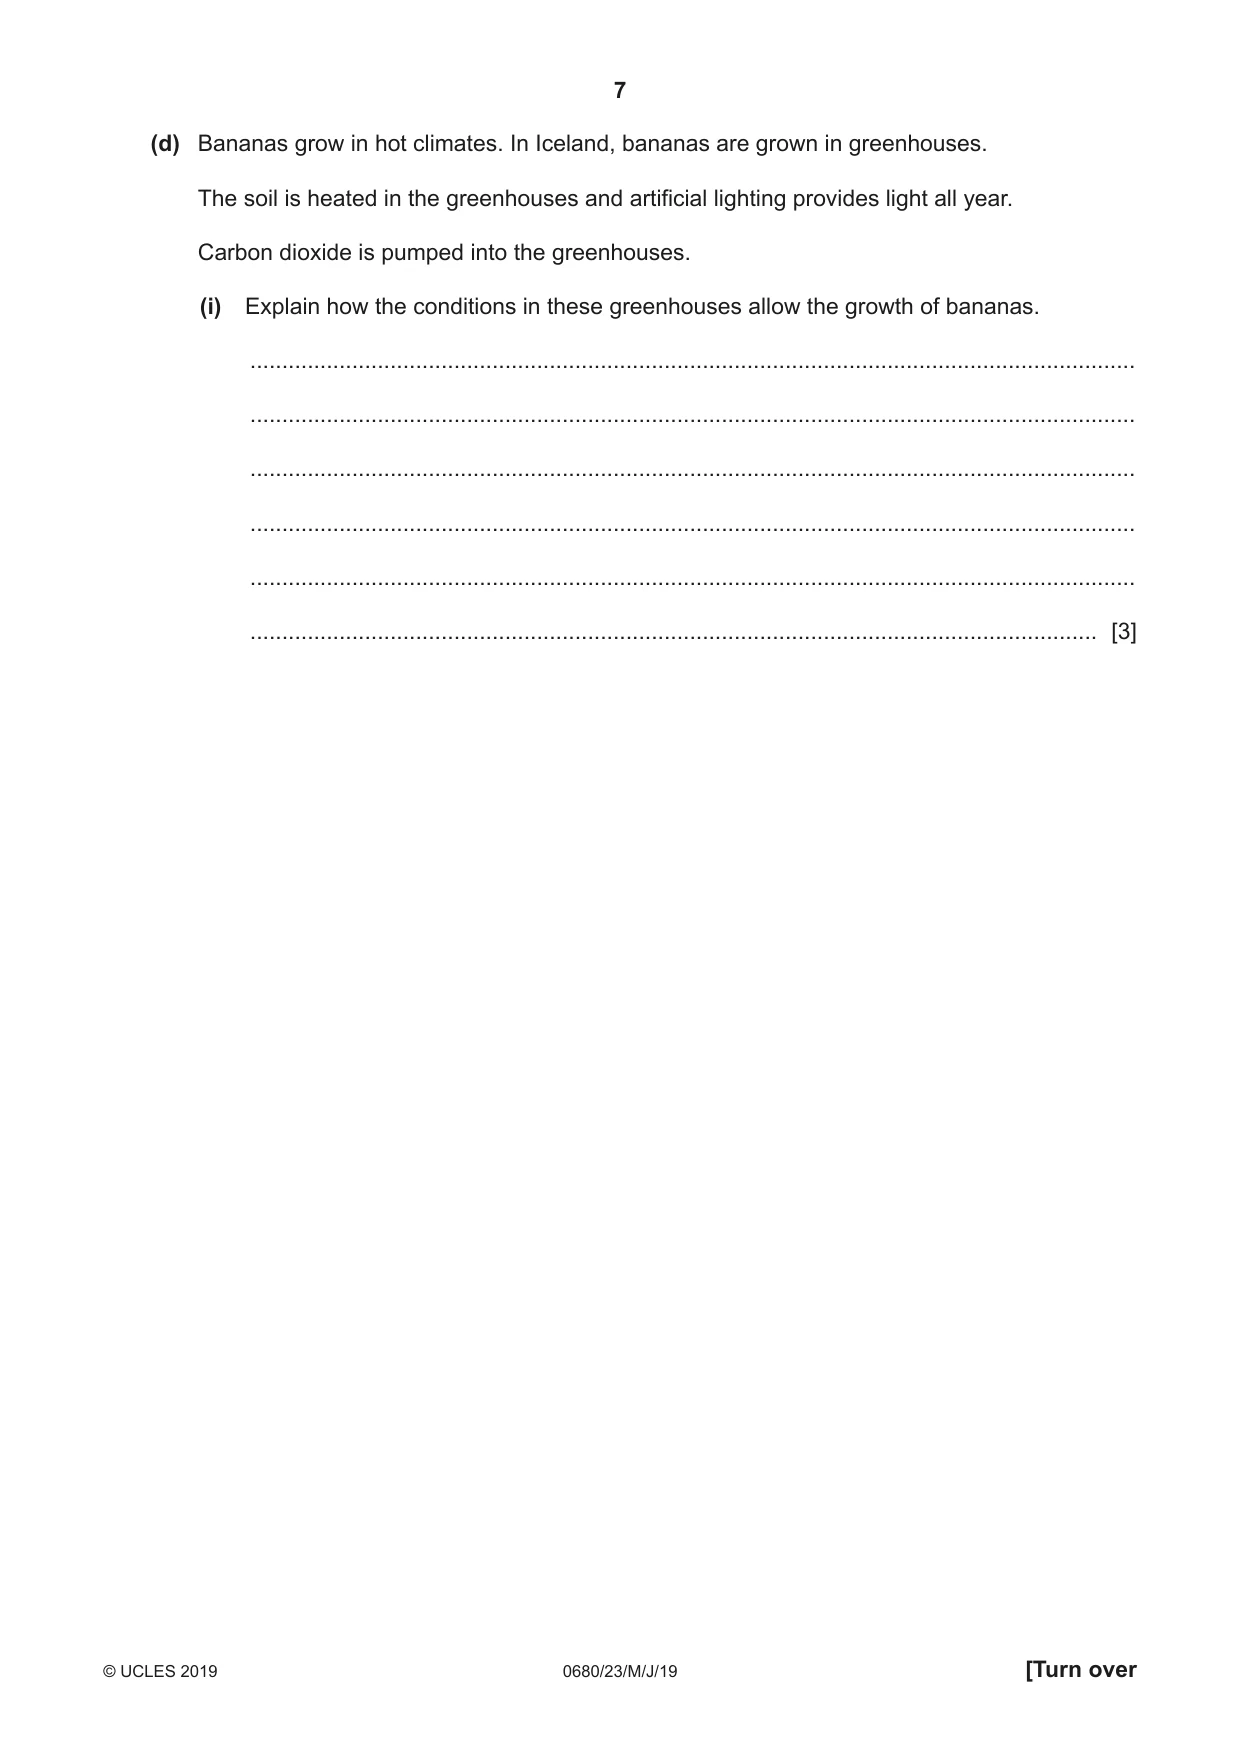
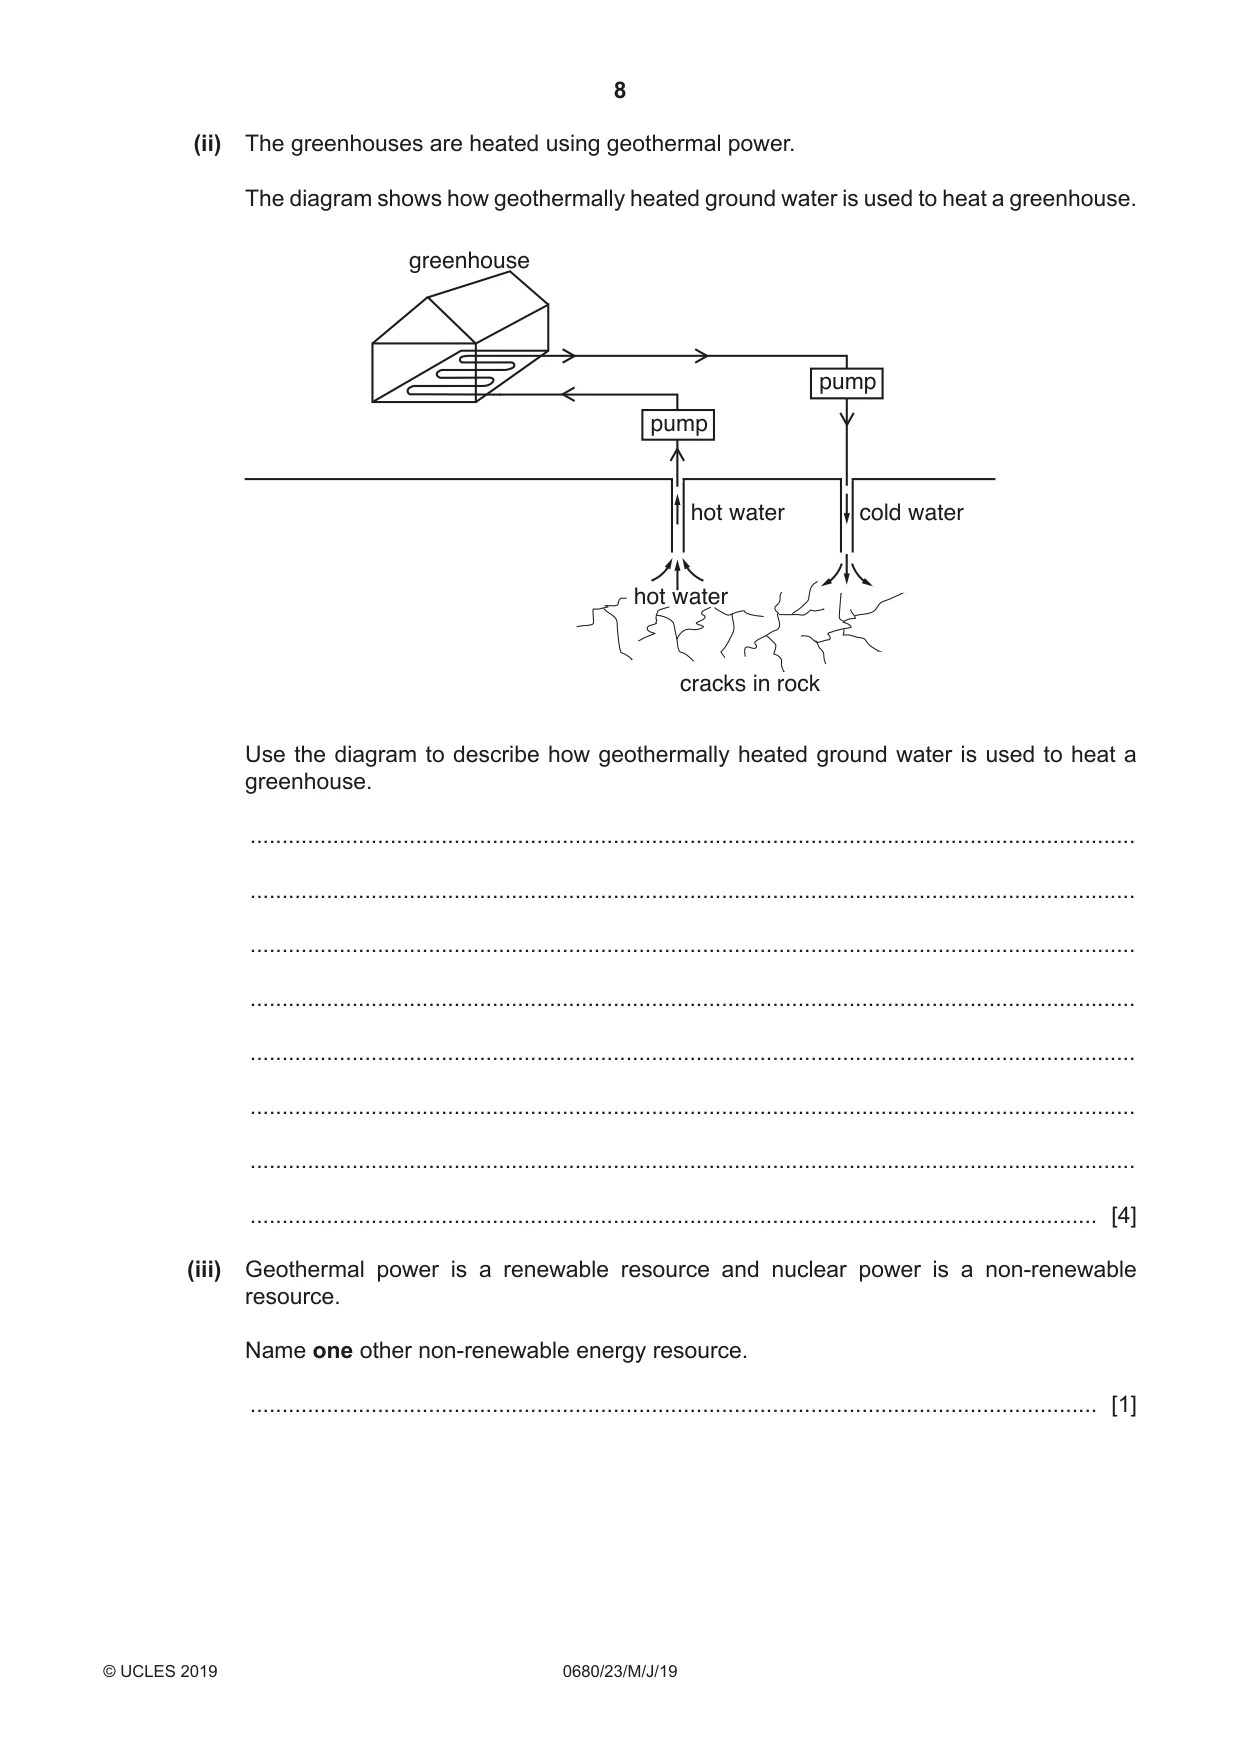
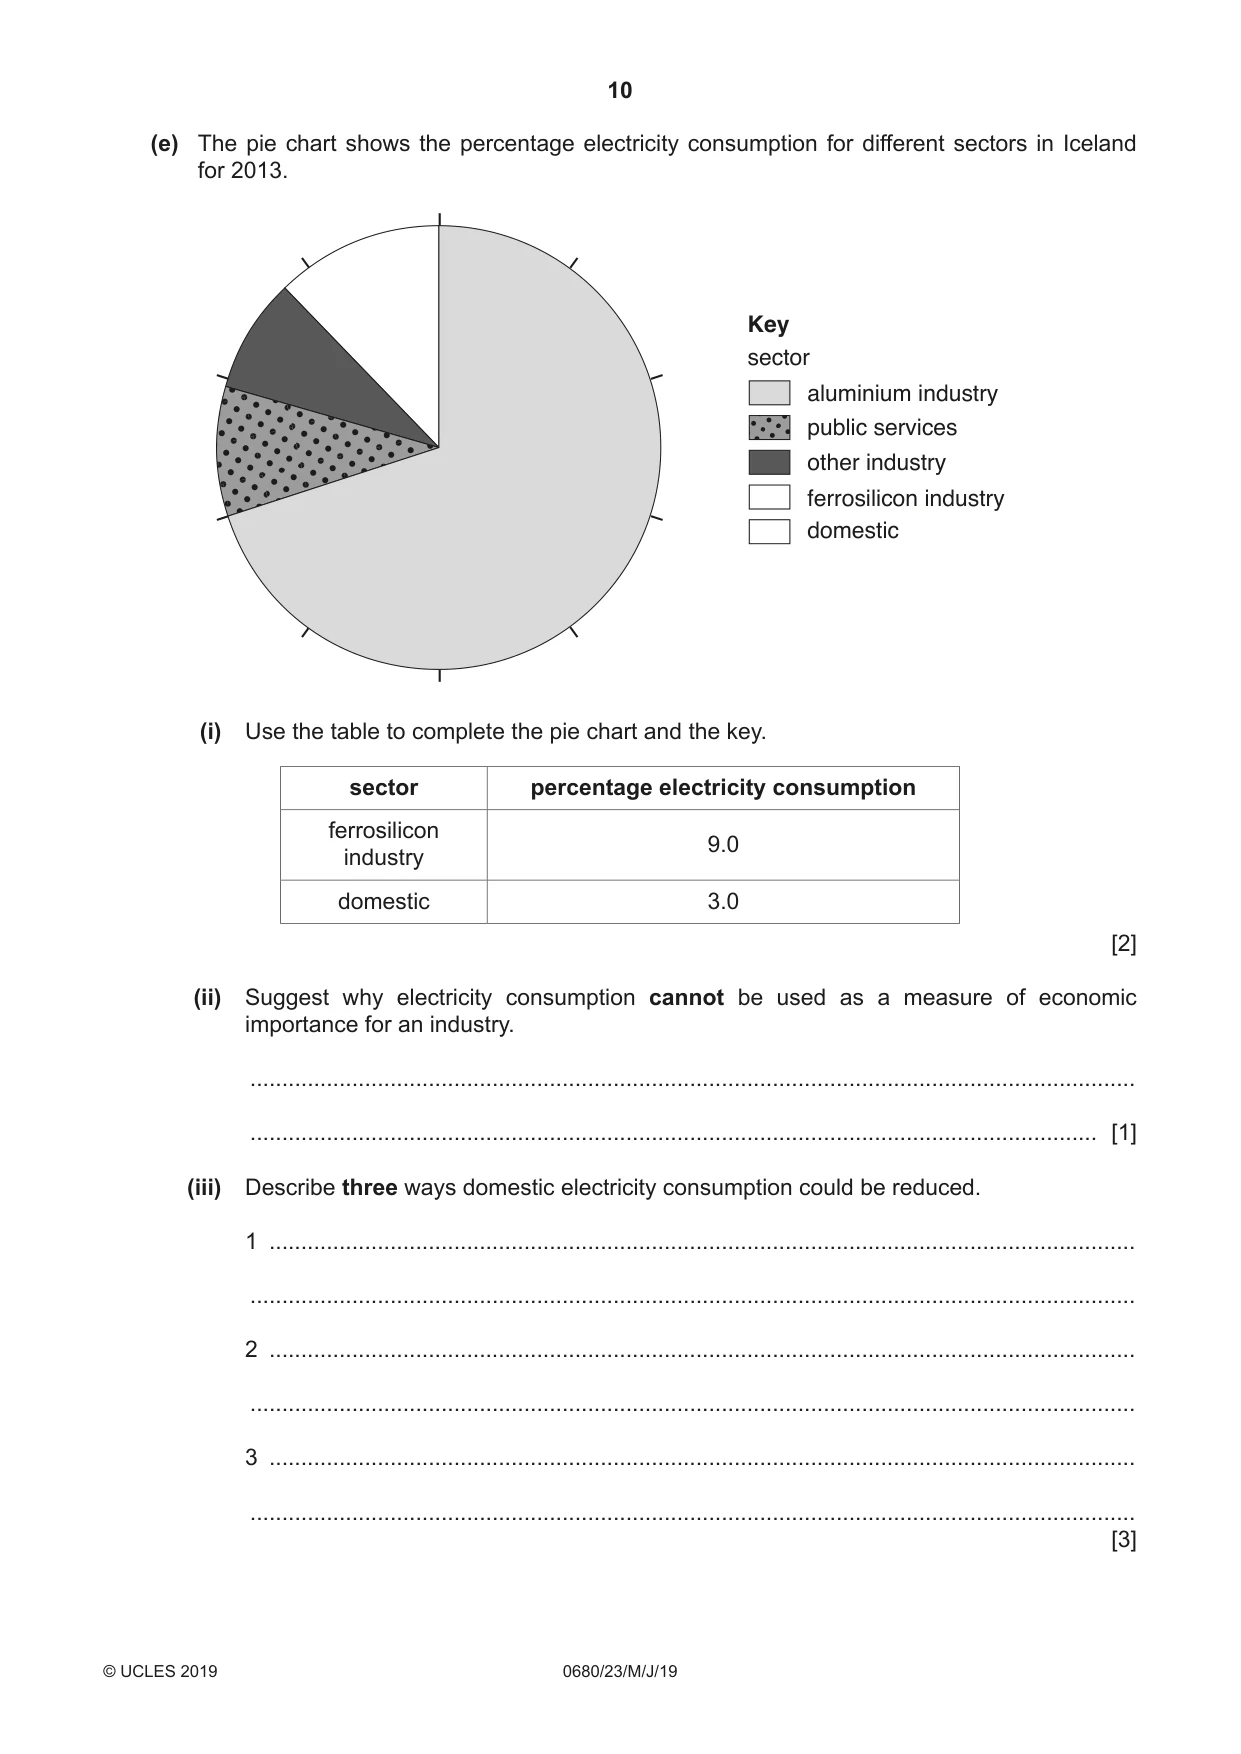
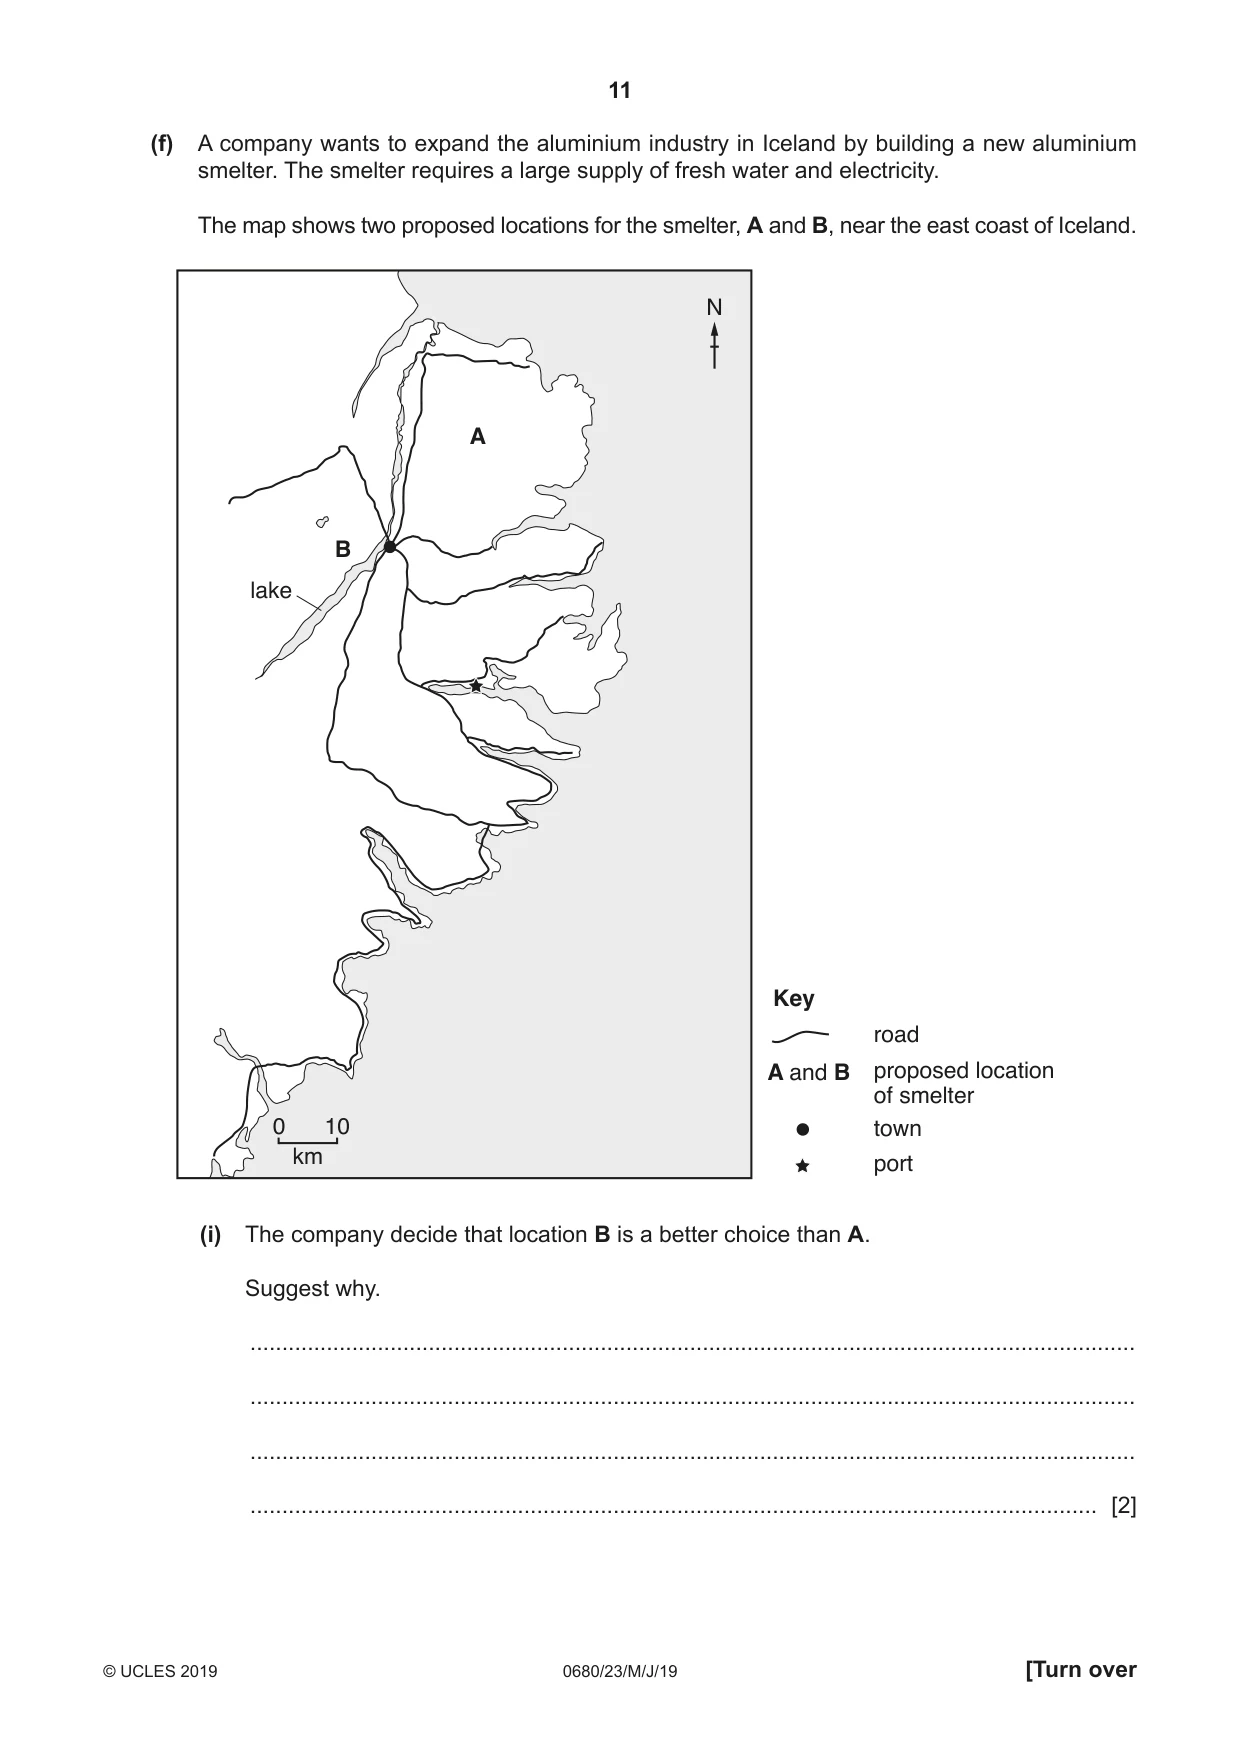
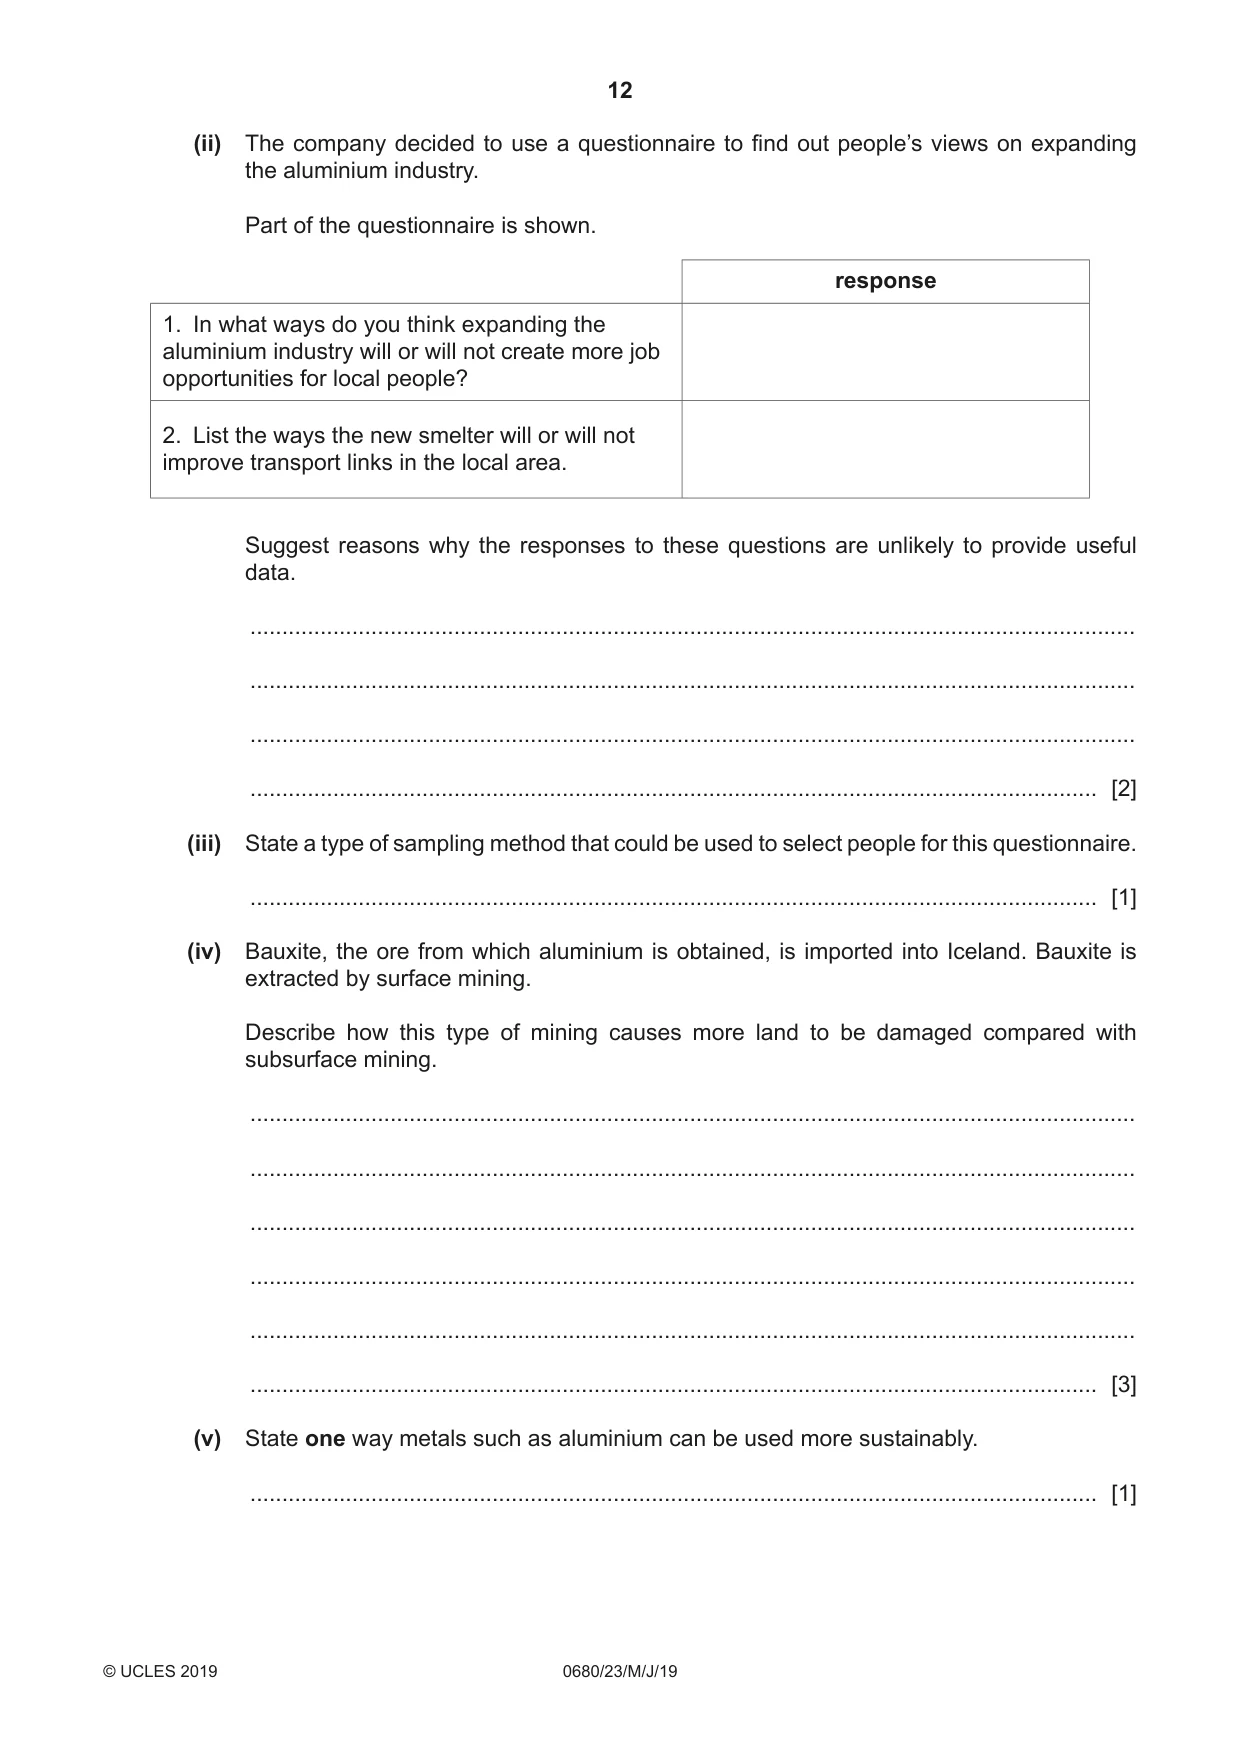
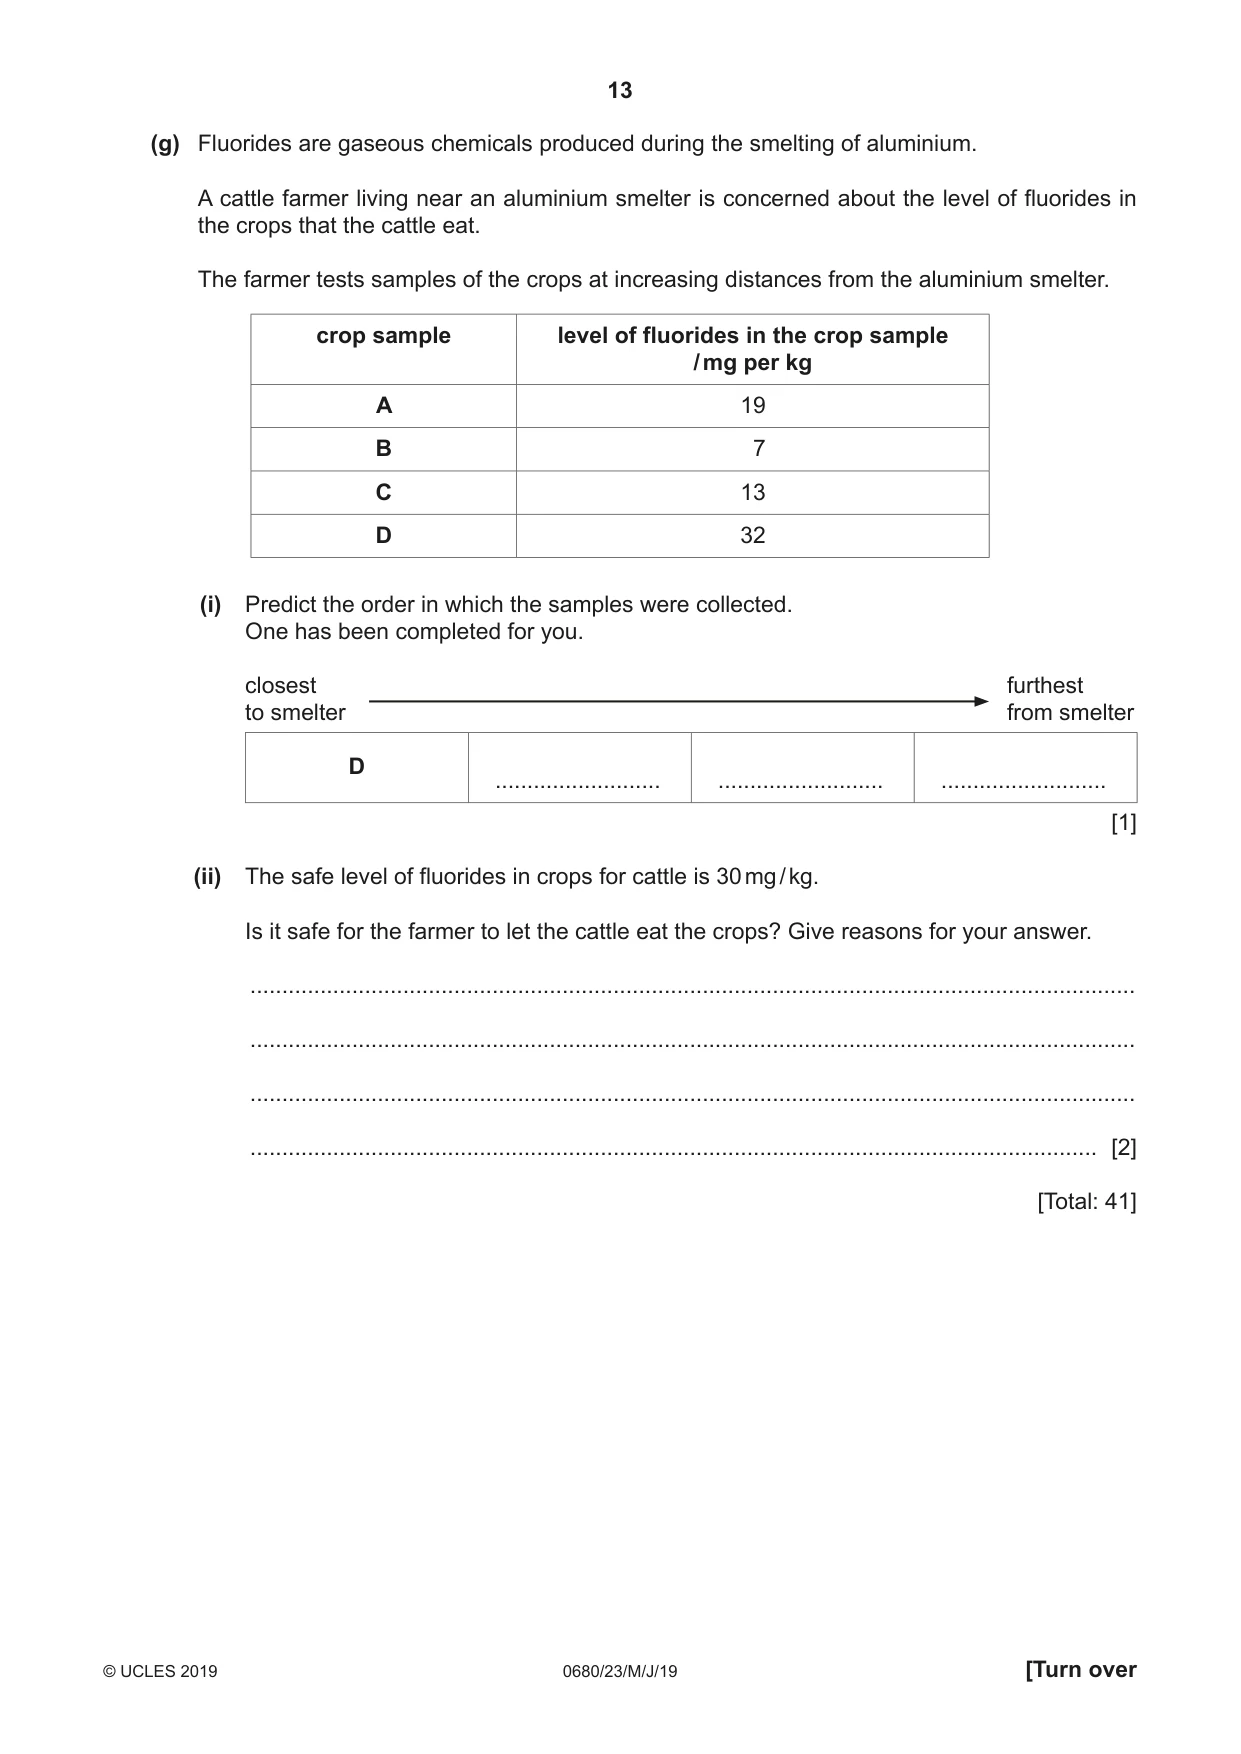
1 (a) The map shows how some of the land in Iceland is used. N 0 20 km Key land use arable agriculture pastoral agriculture permanent ice and snow unused land fishing port and processing centre capital city town road airport (i) Use the map to suggest reasons why the capital city of Iceland is located on the coast and not in the central region of the island. ........................................................................................................................................... ........................................................................................................................................... ........................................................................................................................................... ........................................................................................................................................... ........................................................................................................................................... ..................................................................................................................................... [3] (ii) Estimate the number of people who do not live in the capital city of Iceland. .......................................................... [1] (b) The graph shows the percentage population growth rate for Iceland between 1952 and 2015. 2.4 2.1 1.8 percentage population 1.5 growth rate 1.2 0.9 0.6 0.3 0.0 1952 1957 1962 1967 1972 1977 1982 1987 1992 1997 2002 2007 2012 2017 year Describe the trends in the percentage population growth rate for Iceland between 1952 and 2015. ................................................................................................................................................... ................................................................................................................................................... ................................................................................................................................................... ................................................................................................................................................... ................................................................................................................................................... ............................................................................................................................................. [3] (c) The table shows climate data for a weather station near the capital city of Iceland. minimum average maximum average average monthly month monthly temperature monthly temperature precipitation / °C / °C / mm January –3.0 1.9 75.6 February –2.1 2.8 71.8 March –2.0 3.2 81.8 April 0.4 5.7 58.3 May 3.6 9.4 43.3 June 6.7 11.7 50.0 July 8.3 13.3 51.8 August 7.9 13.0 61.8 September 5.0 10.1 66.5 October 2.2 6.8 85.6 November –1.3 3.4 72.5 December –2.8 2.2 78.7 (i) Identify the month with the highest average monthly temperature. ..................................................................................................................................... [1] (ii) The range for the monthly temperature is the difference between the maximum and minimum value. Calculate the temperature range for December. ......................................................°C [1] (iii) There is limited pastoral agriculture in Iceland. Suggest the problems the climate of Iceland causes for pastoral farmers. ........................................................................................................................................... ........................................................................................................................................... ........................................................................................................................................... ........................................................................................................................................... ........................................................................................................................................... ..................................................................................................................................... [3] (d) Bananas grow in hot climates. In Iceland, bananas are grown in greenhouses. The soil is heated in the greenhouses and artificial lighting provides light all year. Carbon dioxide is pumped into the greenhouses. (i) Explain how the conditions in these greenhouses allow the growth of bananas. ........................................................................................................................................... ........................................................................................................................................... ........................................................................................................................................... ........................................................................................................................................... ........................................................................................................................................... ..................................................................................................................................... [3] (ii) The greenhouses are heated using geothermal power. The diagram shows how geothermally heated ground water is used to heat a greenhouse. greenhouse pump pump hot water cold water hot water cracks in rock Use the diagram to describe how geothermally heated ground water is used to heat a greenhouse. ........................................................................................................................................... ........................................................................................................................................... ........................................................................................................................................... ........................................................................................................................................... ........................................................................................................................................... ........................................................................................................................................... ........................................................................................................................................... ..................................................................................................................................... [4] (iii) Geothermal power is a renewable resource and nuclear power is a non-renewable resource. Name one other non-renewable energy resource. ..................................................................................................................................... [1] (iv) Suggest reasons why some people do not want to live near nuclear power stations. ........................................................................................................................................... ........................................................................................................................................... ........................................................................................................................................... ........................................................................................................................................... ........................................................................................................................................... ..................................................................................................................................... [3] (e) The pie chart shows the percentage electricity consumption for different sectors in Iceland for 2013. Key sector aluminium industry public services other industry ferrosilicon industry domestic (i) Use the table to complete the pie chart and the key. sector percentage electricity consumption ferrosilicon 9.0 industry domestic 3.0 [2] (ii) Suggest why electricity consumption cannot be used as a measure of economic importance for an industry. ........................................................................................................................................... ..................................................................................................................................... [1] (iii) Describe three ways domestic electricity consumption could be reduced. 1 ........................................................................................................................................ ........................................................................................................................................... 2 ........................................................................................................................................ ........................................................................................................................................... 3 ........................................................................................................................................ ........................................................................................................................................... [3] (f) A company wants to expand the aluminium industry in Iceland by building a new aluminium smelter. The smelter requires a large supply of fresh water and electricity. The map shows two proposed locations for the smelter, A and B, near the east coast of Iceland. N A B lake Key road A and B proposed location of smelter 0 10 town km port (i) The company decide that location B is a better choice than A. Suggest why. ........................................................................................................................................... ........................................................................................................................................... ........................................................................................................................................... ..................................................................................................................................... [2] (ii) The company decided to use a questionnaire to find out people’s views on expanding the aluminium industry. Part of the questionnaire is shown. response 1. In what ways do you think expanding the aluminium industry will or will not create more job opportunities for local people? 2. List the ways the new smelter will or will not improve transport links in the local area. Suggest reasons why the responses to these questions are unlikely to provide useful data. ........................................................................................................................................... ........................................................................................................................................... ........................................................................................................................................... ..................................................................................................................................... [2] (iii) State a type of sampling method that could be used to select people for this questionnaire. ..................................................................................................................................... [1] (iv) Bauxite, the ore from which aluminium is obtained, is imported into Iceland. Bauxite is extracted by surface mining. Describe how this type of mining causes more land to be damaged compared with subsurface mining. ........................................................................................................................................... ........................................................................................................................................... ........................................................................................................................................... ........................................................................................................................................... ........................................................................................................................................... ..................................................................................................................................... [3] (v) State one way metals such as aluminium can be used more sustainably. ..................................................................................................................................... [1] (g) Fluorides are gaseous chemicals produced during the smelting of aluminium. A cattle farmer living near an aluminium smelter is concerned about the level of fluorides in the crops that the cattle eat. The farmer tests samples of the crops at increasing distances from the aluminium smelter. crop sample level of fluorides in the crop sample / mg per kg A 19 B 7 C 13 D 32 (i) Predict the order in which the samples were collected. One has been completed for you. closest furthest to smelter from smelter D .......................... .......................... .......................... [1] (ii) The safe level of fluorides in crops for cattle is 30 mg / kg. Is it safe for the farmer to let the cattle eat the crops? Give reasons for your answer. ........................................................................................................................................... ........................................................................................................................................... ........................................................................................................................................... ..................................................................................................................................... [2] [Total: 41]
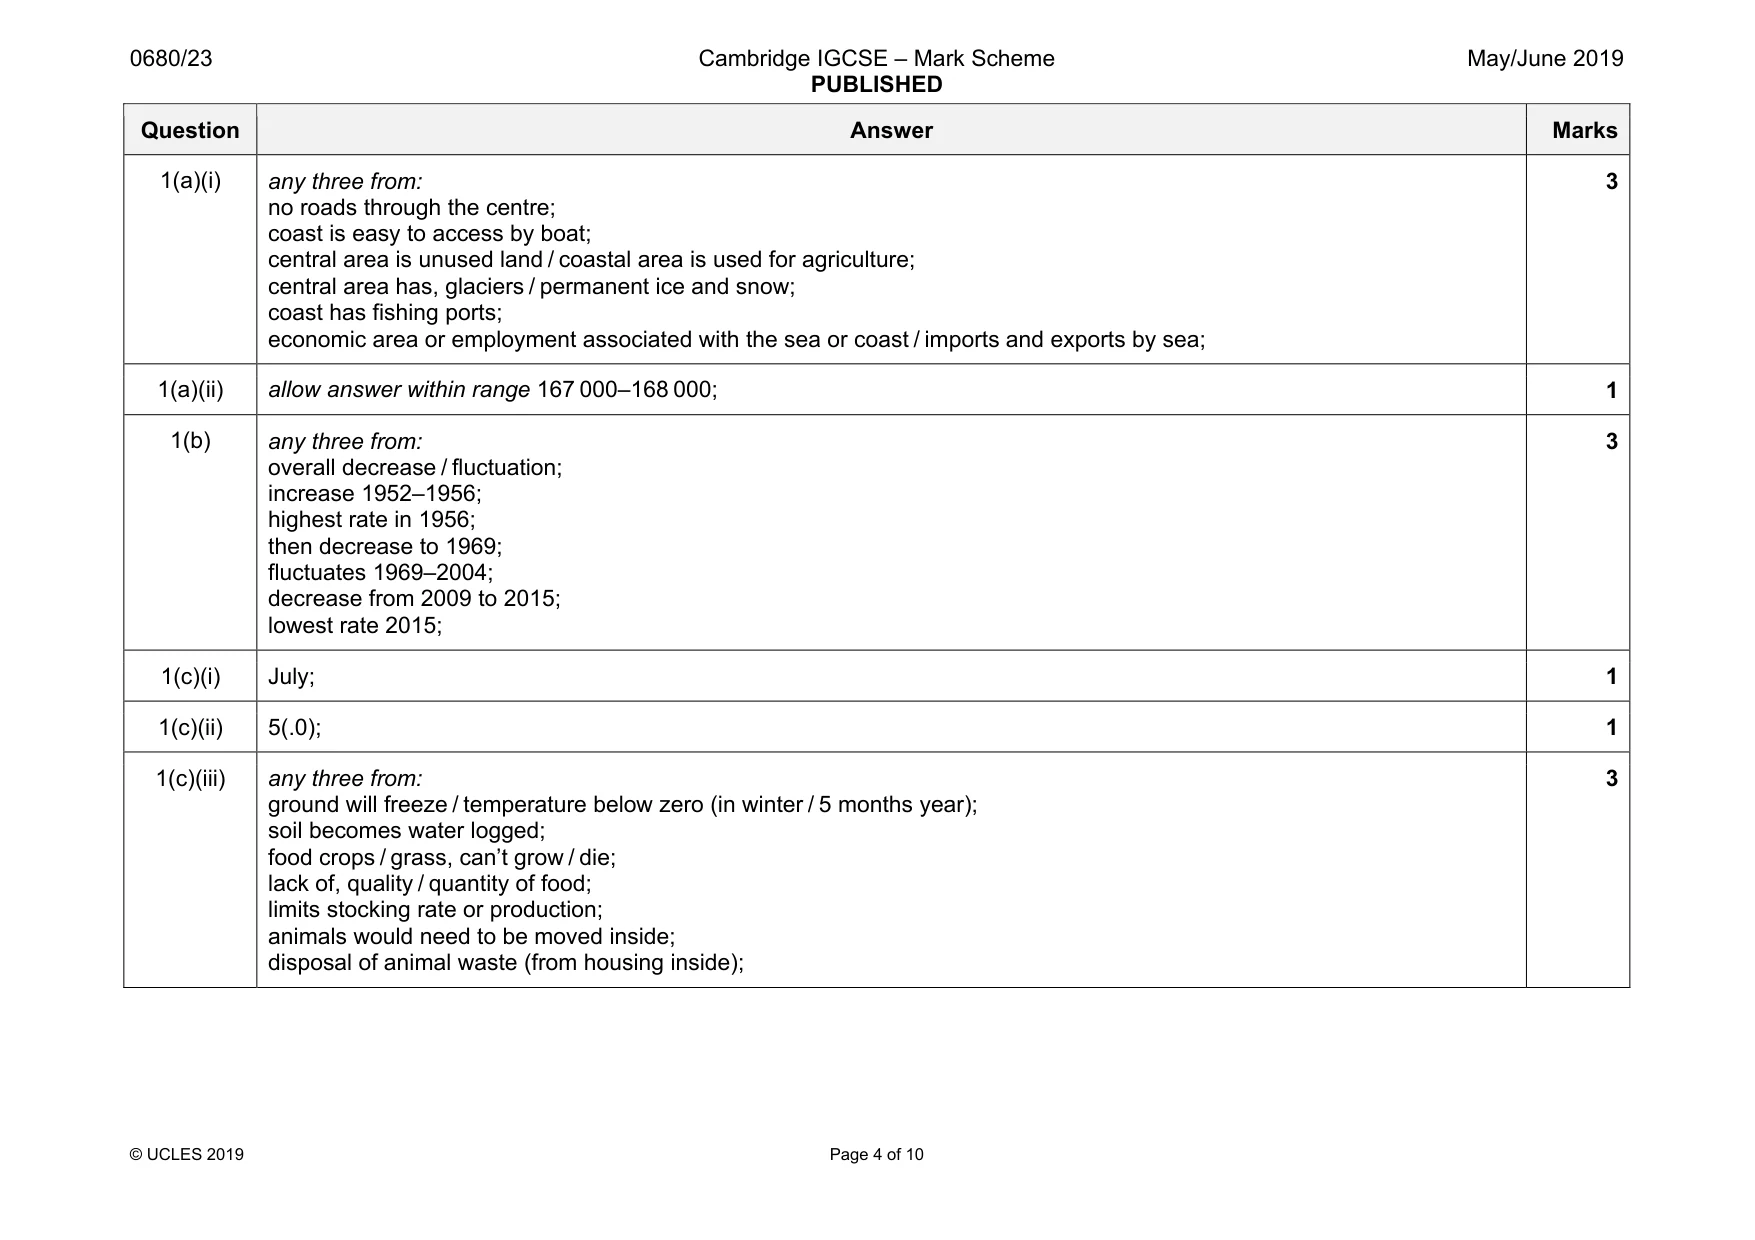
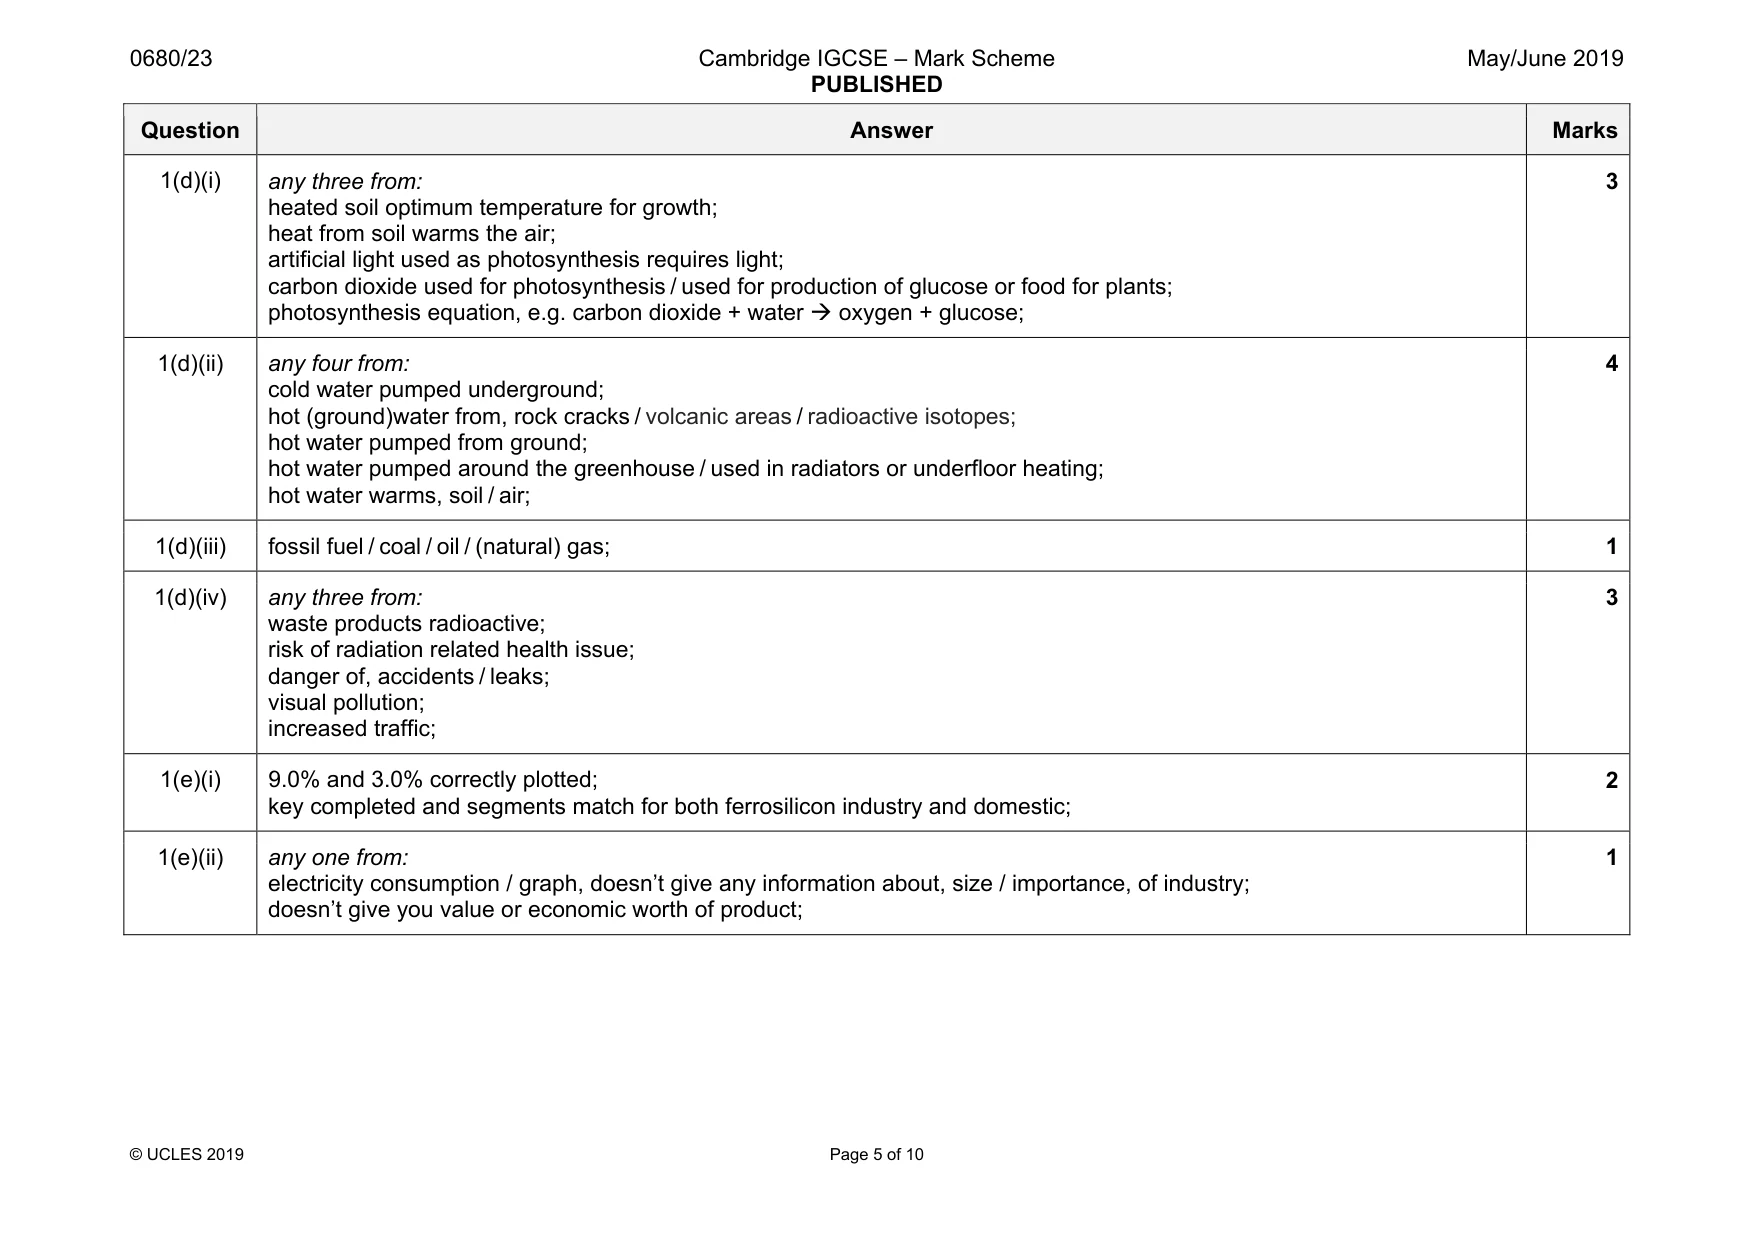
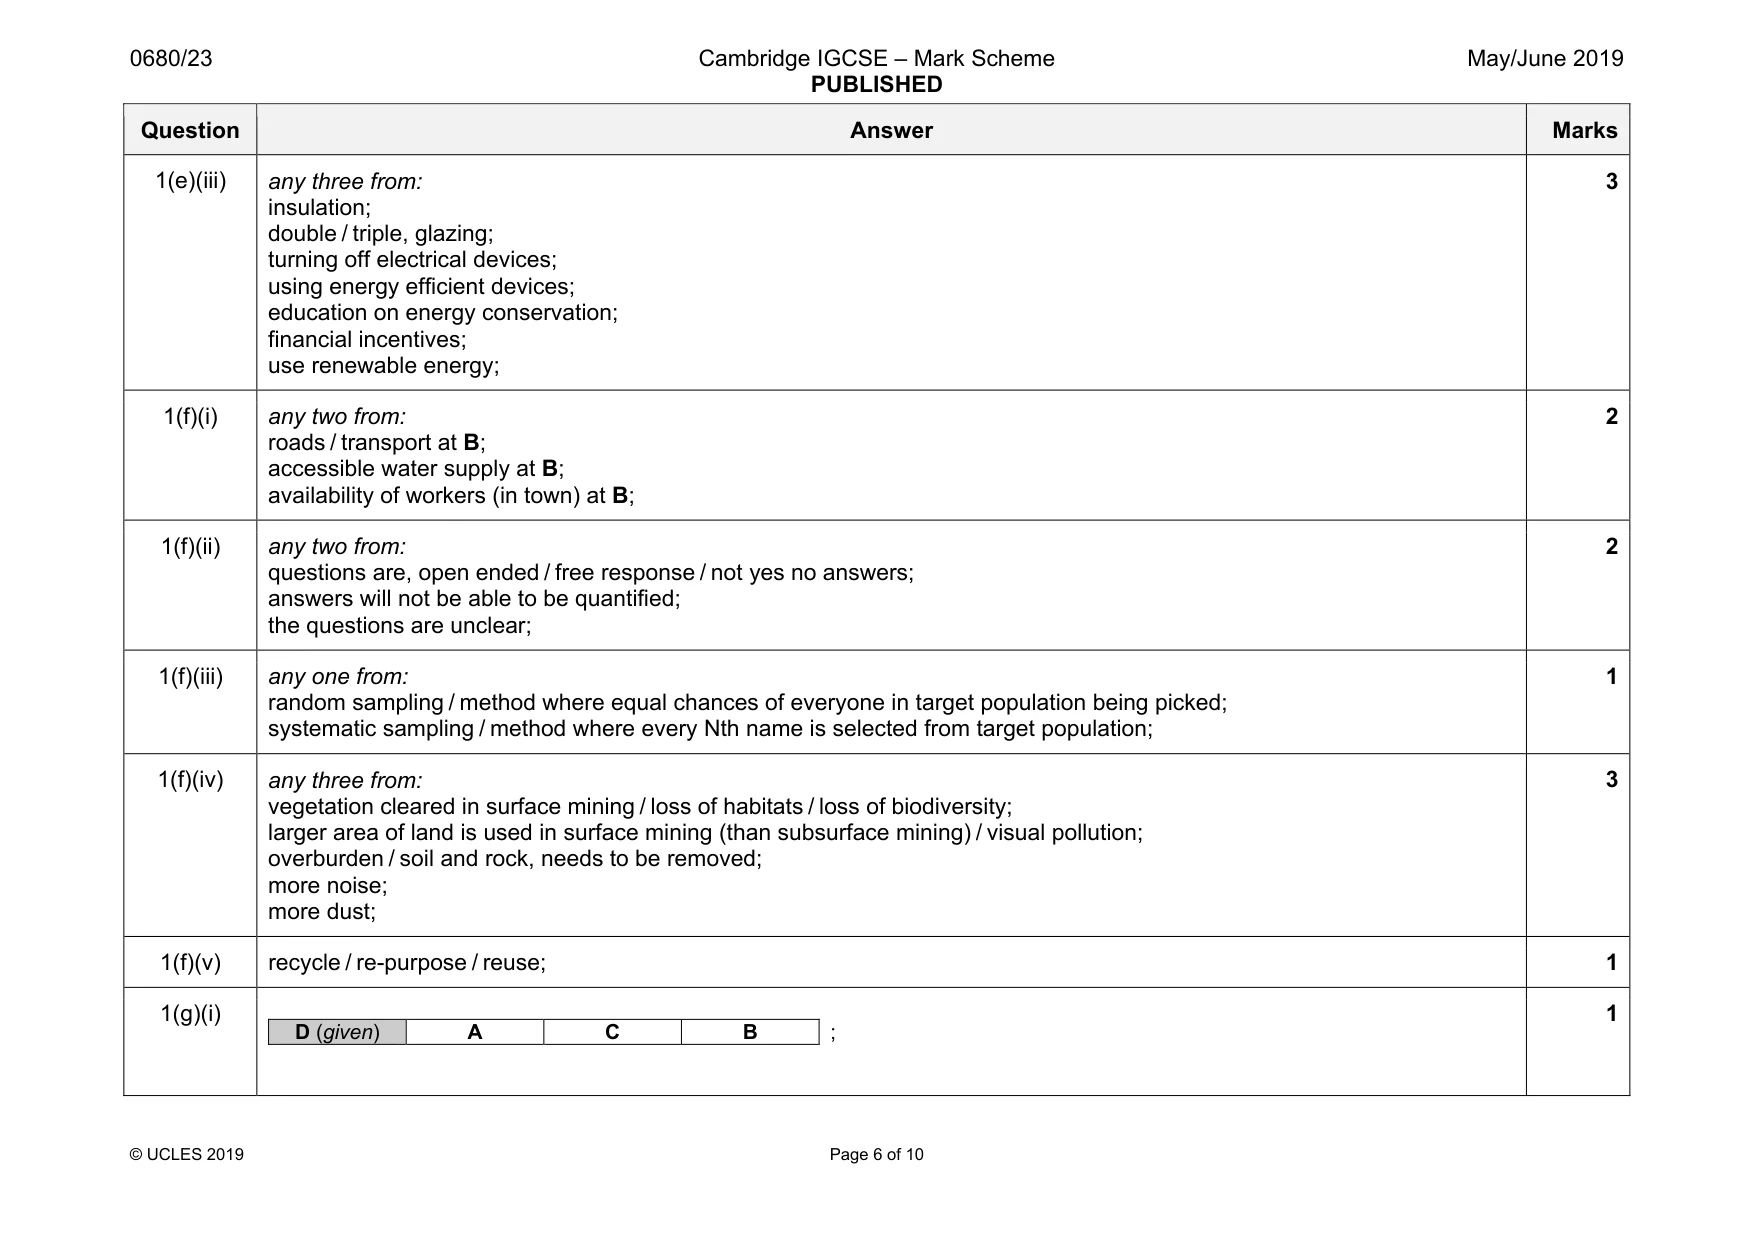
Mark scheme: 1(a)(i) any three from: no roads through the centre; coast is easy to access by boat; central area is unused land / coastal area is used for agriculture; central area has, glaciers / permanent ice and snow; coast has fishing ports; economic area or employment associated with the sea or coast / imports and exports by sea; 3 1(a)(ii) allow answer within range 167 000–168 000; 1 1(b) any three from: overall decrease / fluctuation; increase 1952–1956; highest rate in 1956; then decrease to 1969; fluctuates 1969–2004; decrease from 2009 to 2015; lowest rate 2015; 3 1(c)(i) July; 1 1(c)(ii) 5(.0); 1 1(c)(iii) any three from: ground will freeze / temperature below zero (in winter / 5 months year); soil becomes water logged; food crops / grass, can’t grow / die; lack of, quality / quantity of food; limits stocking rate or production; animals would need to be moved inside; disposal of animal waste (from housing inside); 3 Question Answer Marks 1(d)(i) any three from: heated soil optimum temperature for growth; heat from soil warms the air; artificial light used as photosynthesis requires light; carbon dioxide used for photosynthesis / used for production of glucose or food for plants; photosynthesis equation, e.g. carbon dioxide + water Æ oxygen + glucose; 3 1(d)(ii) any four from: cold water pumped underground; hot (ground)water from, rock cracks / volcanic areas / radioactive isotopes; hot water pumped from ground; hot water pumped around the greenhouse / used in radiators or underfloor heating; hot water warms, soil / air; 4 1(d)(iii) fossil fuel / coal / oil / (natural) gas; 1 1(d)(iv) any three from: waste products radioactive; risk of radiation related health issue; danger of, accidents / leaks; visual pollution; increased traffic; 3 1(e)(i) 9.0% and 3.0% correctly plotted; key completed and segments match for both ferrosilicon industry and domestic; 2 1(e)(ii) any one from: electricity consumption / graph, doesn’t give any information about, size / importance, of industry; doesn’t give you value or economic worth of product; 1 Question Answer Marks 1(e)(iii) any three from: insulation; double / triple, glazing; turning off electrical devices; using energy efficient devices; education on energy conservation; financial incentives; use renewable energy; 3 1(f)(i) any two from: roads / transport at B; accessible water supply at B; availability of workers (in town) at B; 2 1(f)(ii) any two from: questions are, open ended / free response / not yes no answers; answers will not be able to be quantified; the questions are unclear; 2 1(f)(iii) any one from: random sampling / method where equal chances of everyone in target population being picked; systematic sampling / method where every Nth name is selected from target population; 1 1(f)(iv) any three from: vegetation cleared in surface mining / loss of habitats / loss of biodiversity; larger area of land is used in surface mining (than subsurface mining) / visual pollution; overburden / soil and rock, needs to be removed; more noise; more dust; 3 1(f)(v) recycle / re-purpose / reuse; 1 1(g)(i) D (given) A C B ; 1 Question Answer Marks 1(g)(ii) no because safe level for cattle is 30 mg per kg which is below the crop level at D or below 32 mg per kg; safe at A B C as level here is lower than 30 mg per kg; 2
Q2 · Iceland is situated on the Mid-Atlantic Ridge plate boundary
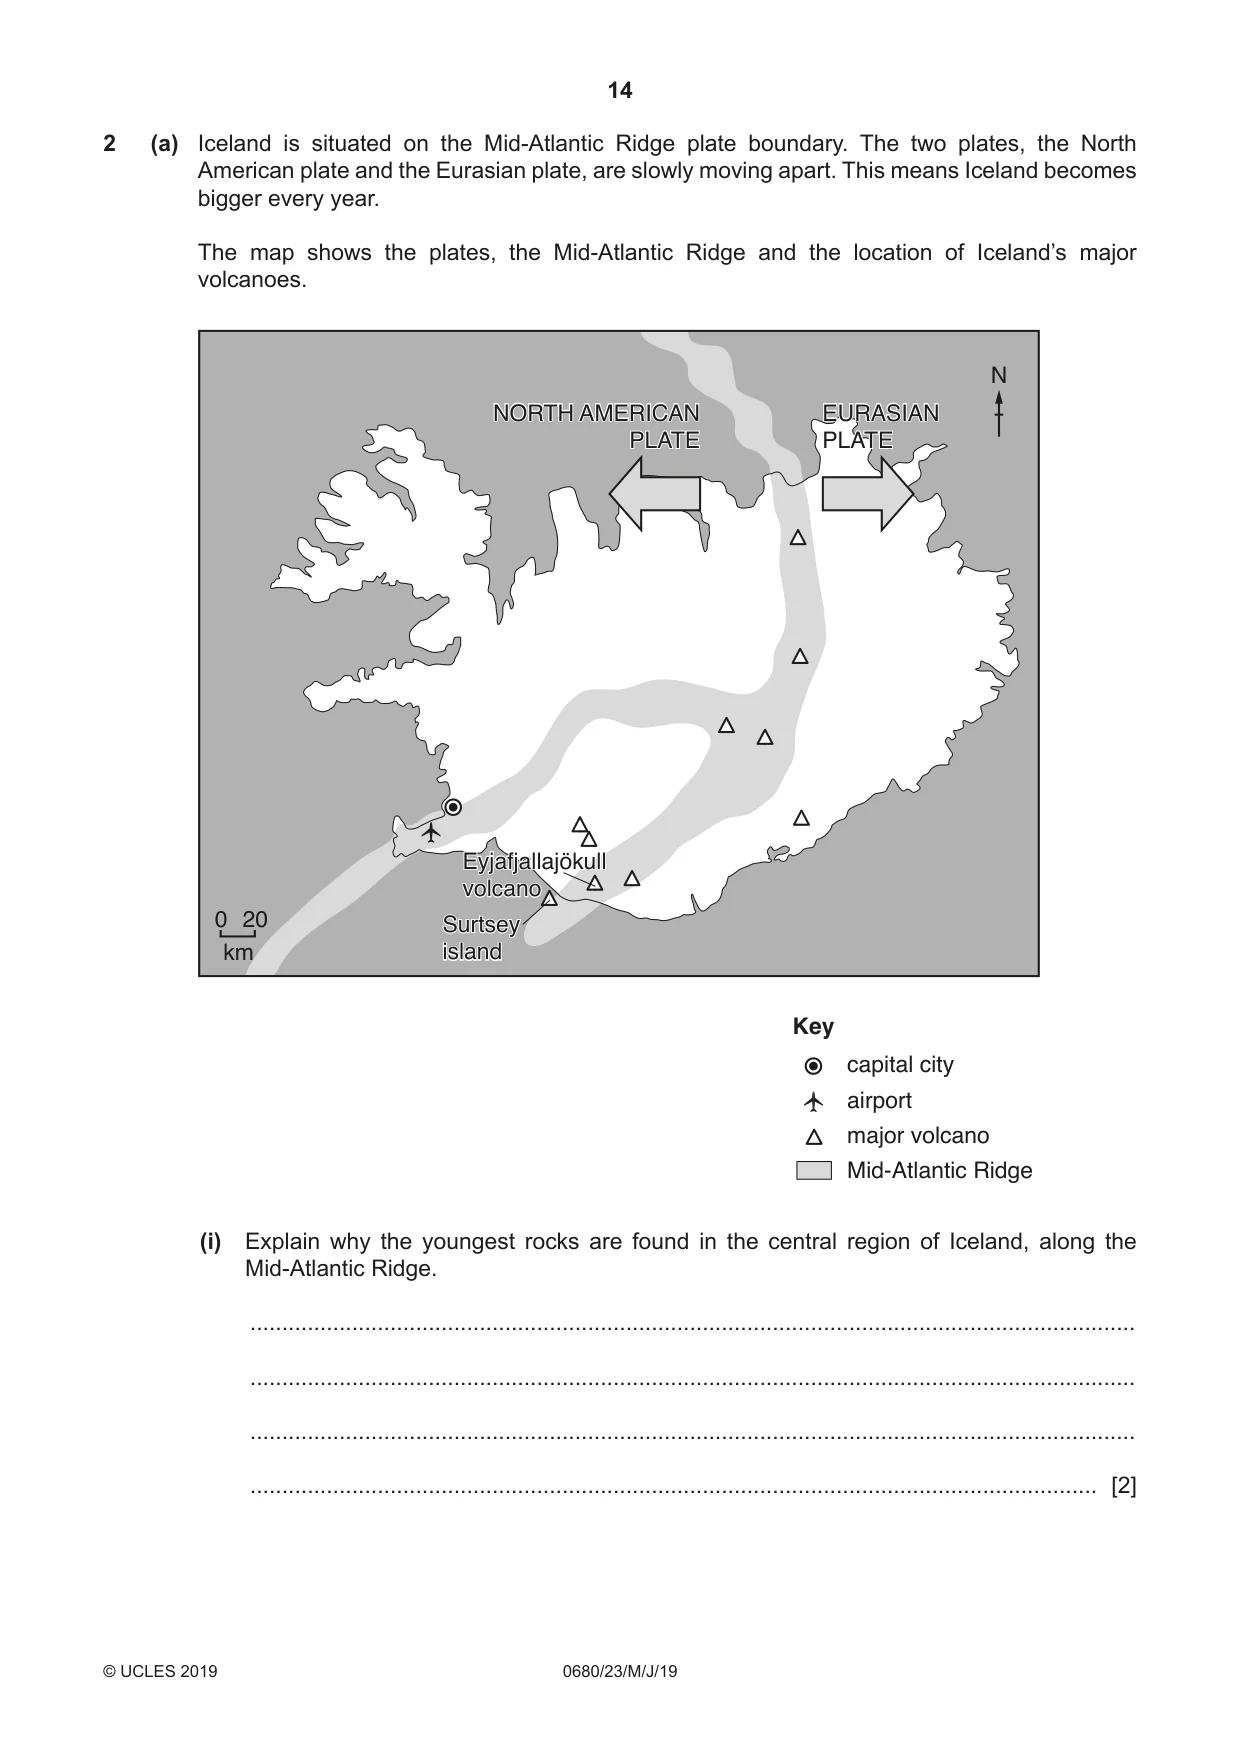
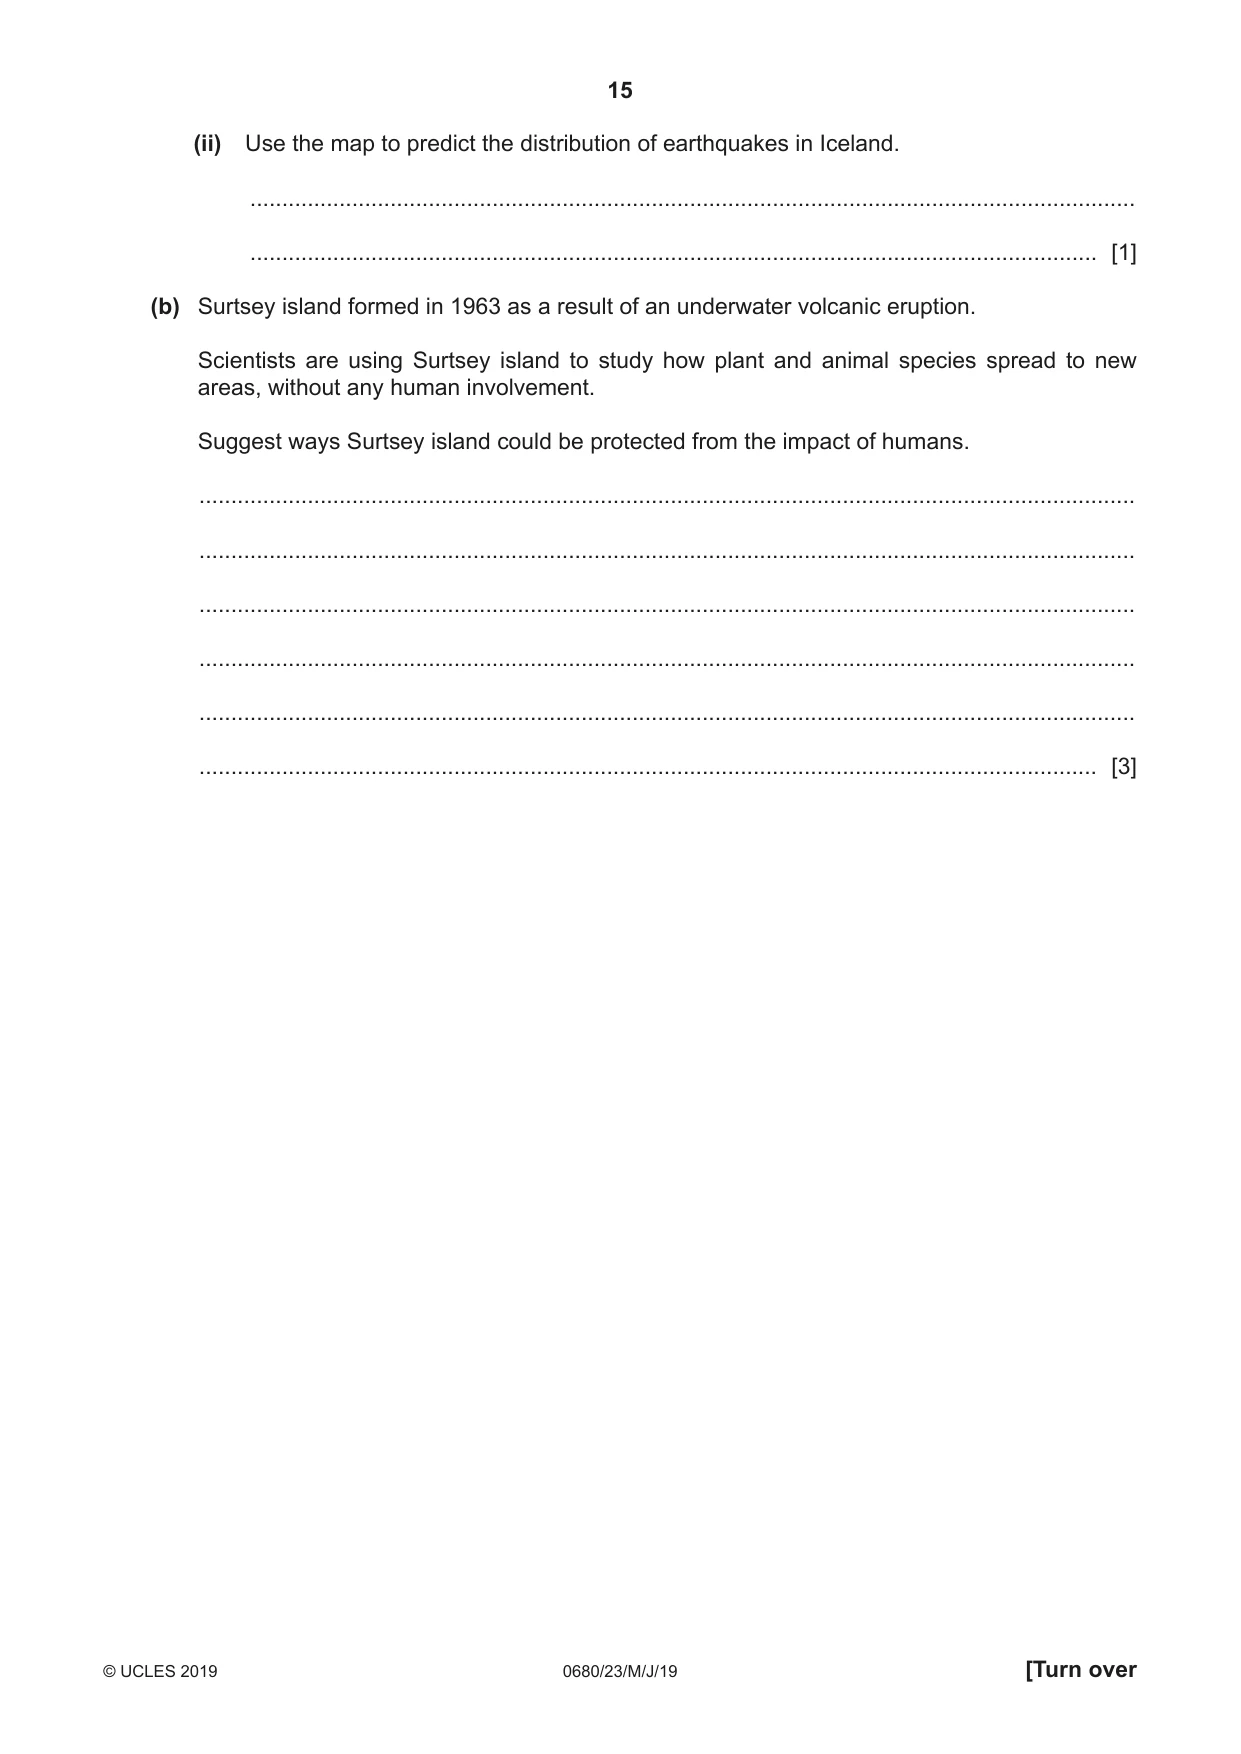
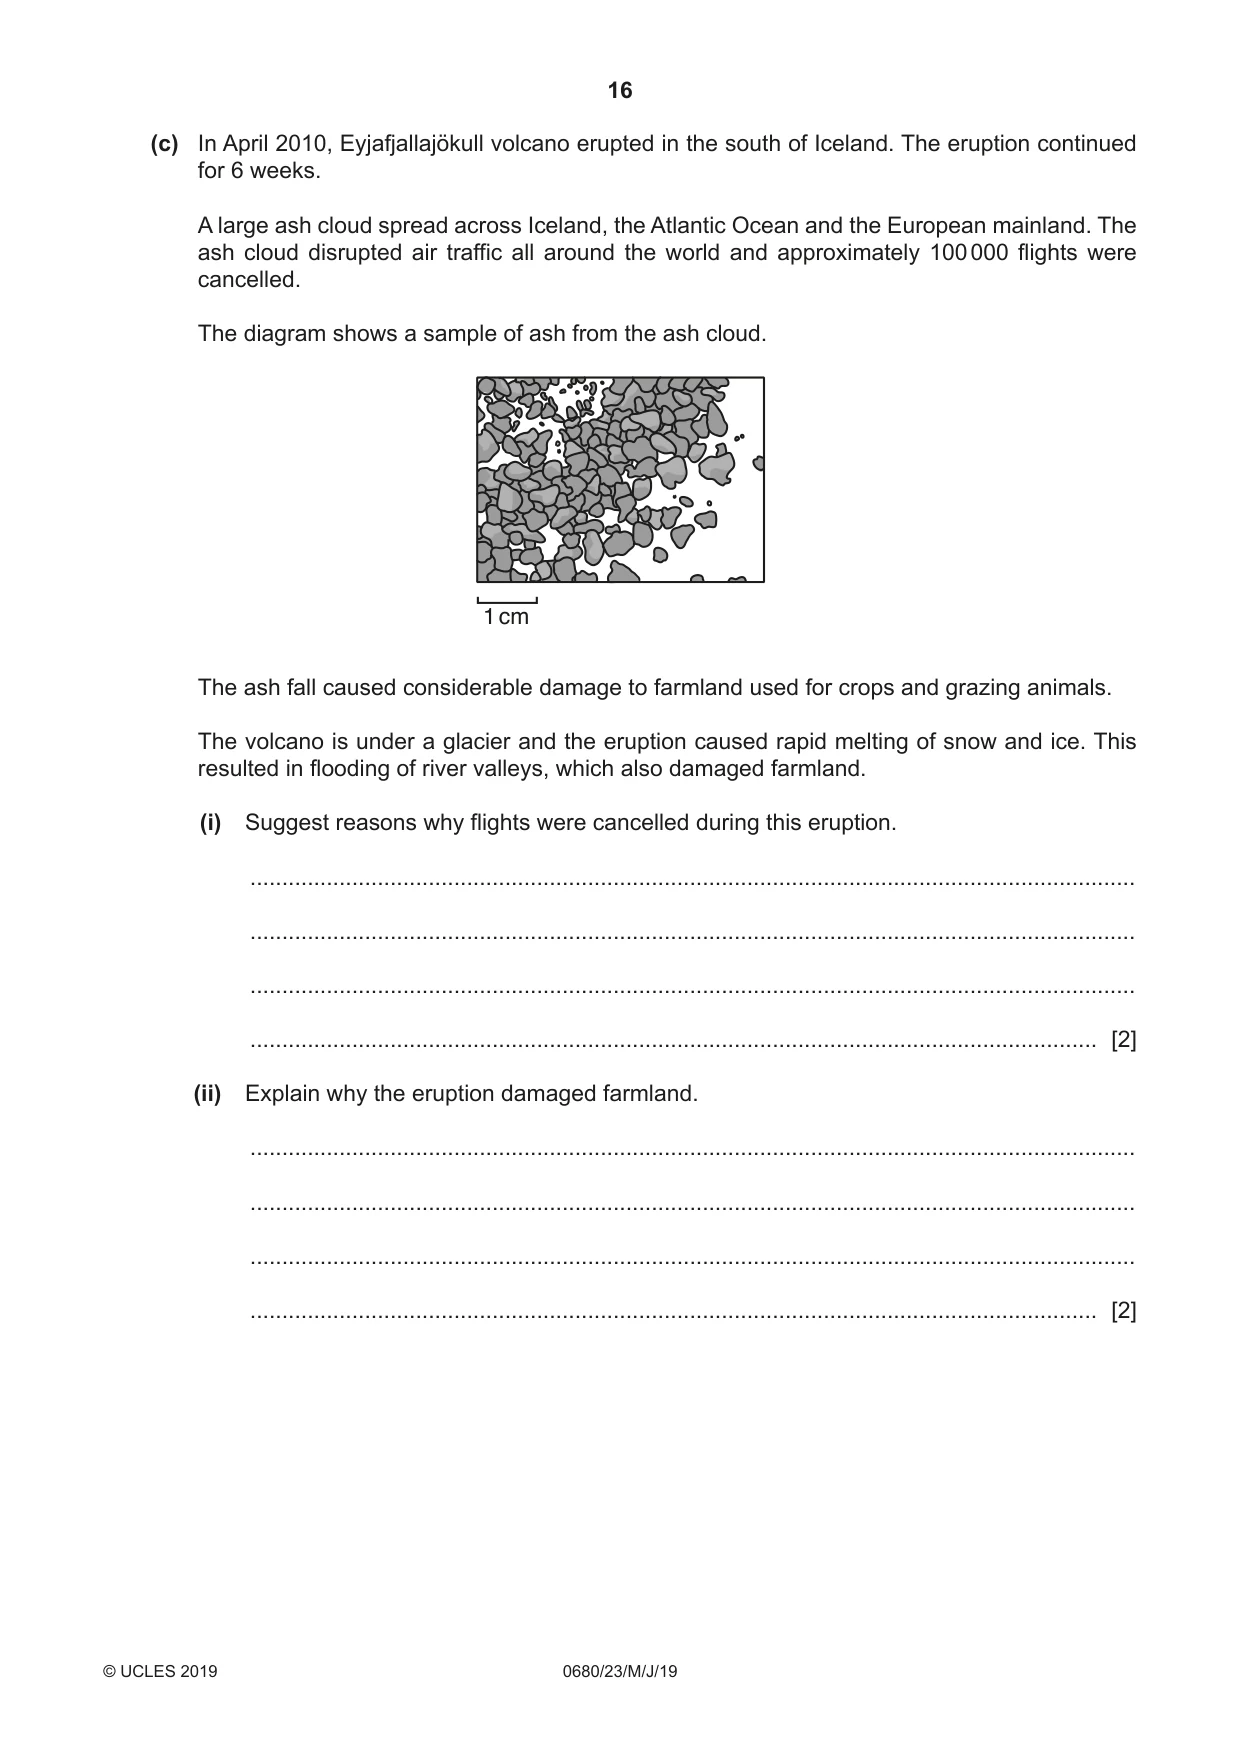
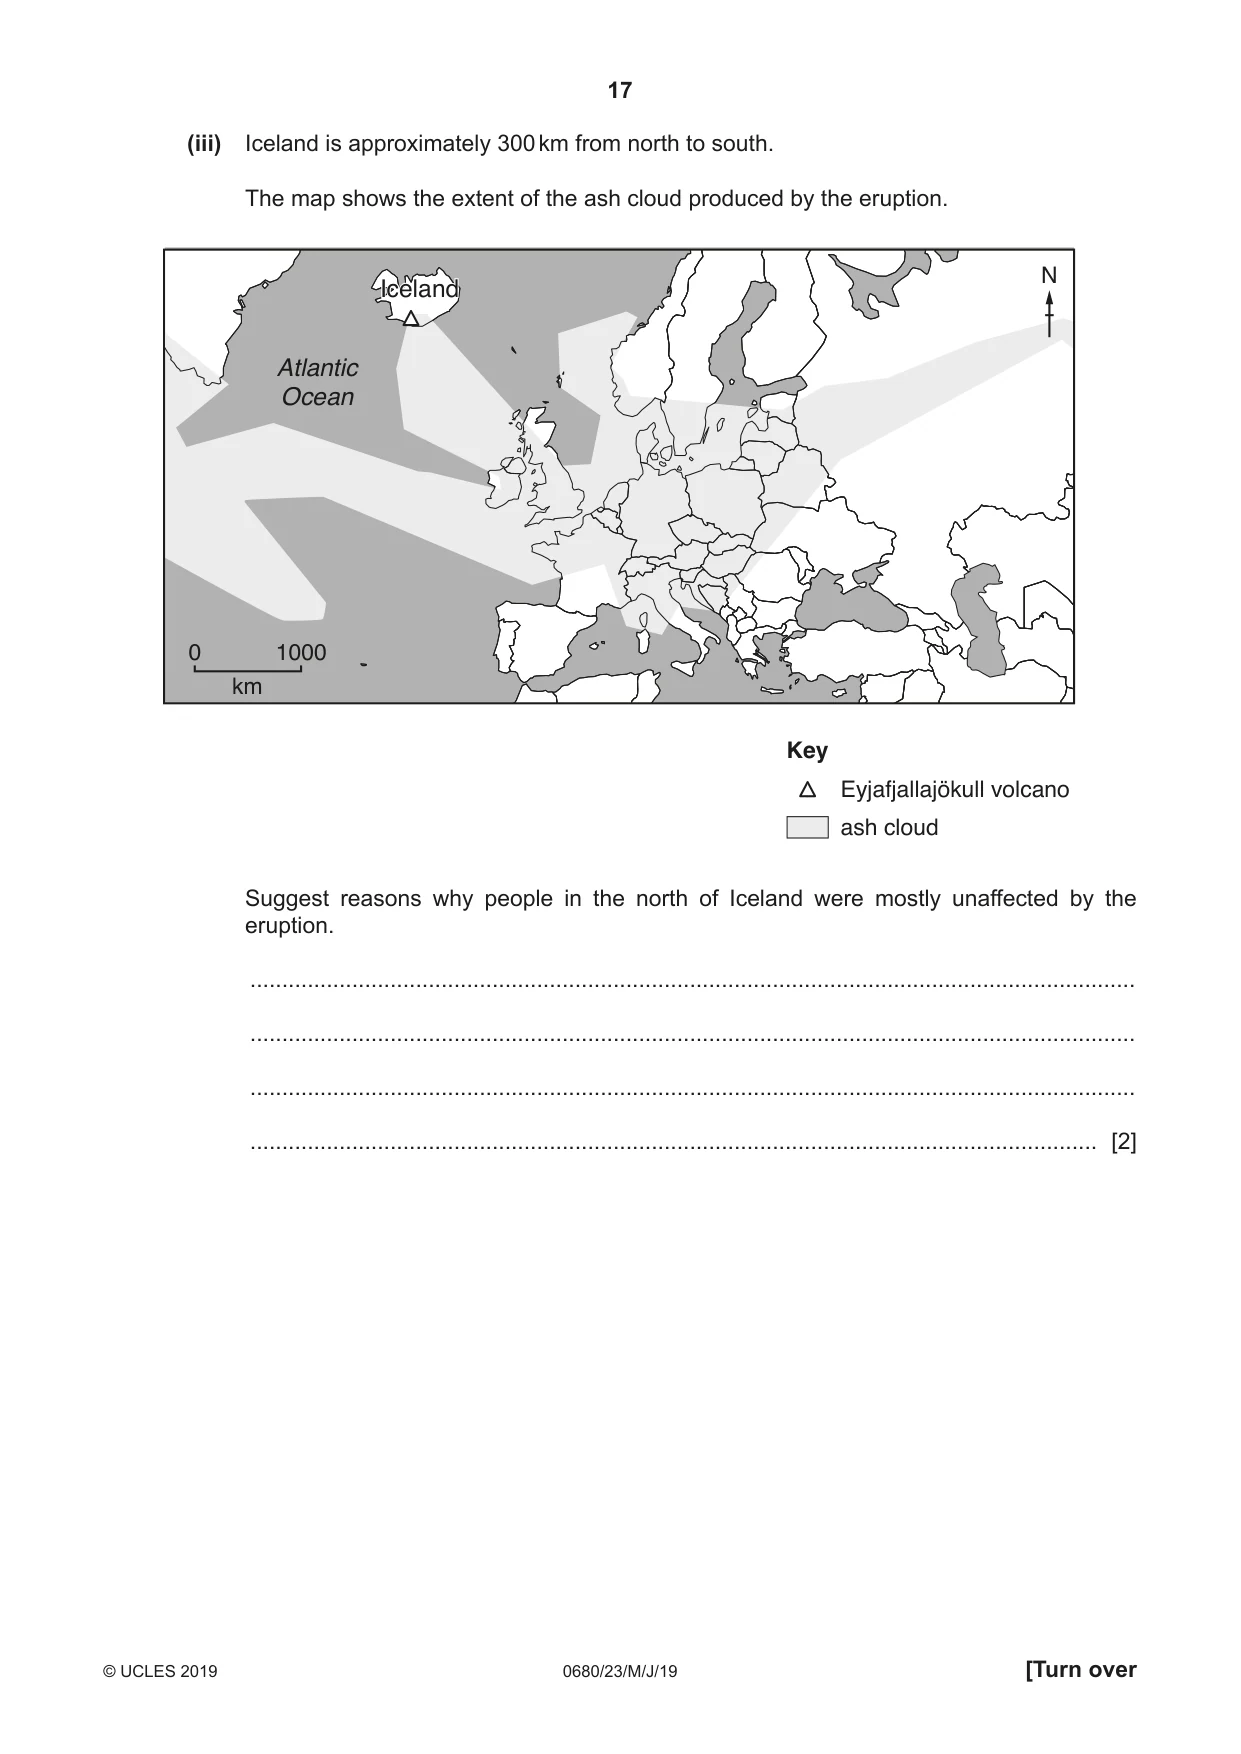
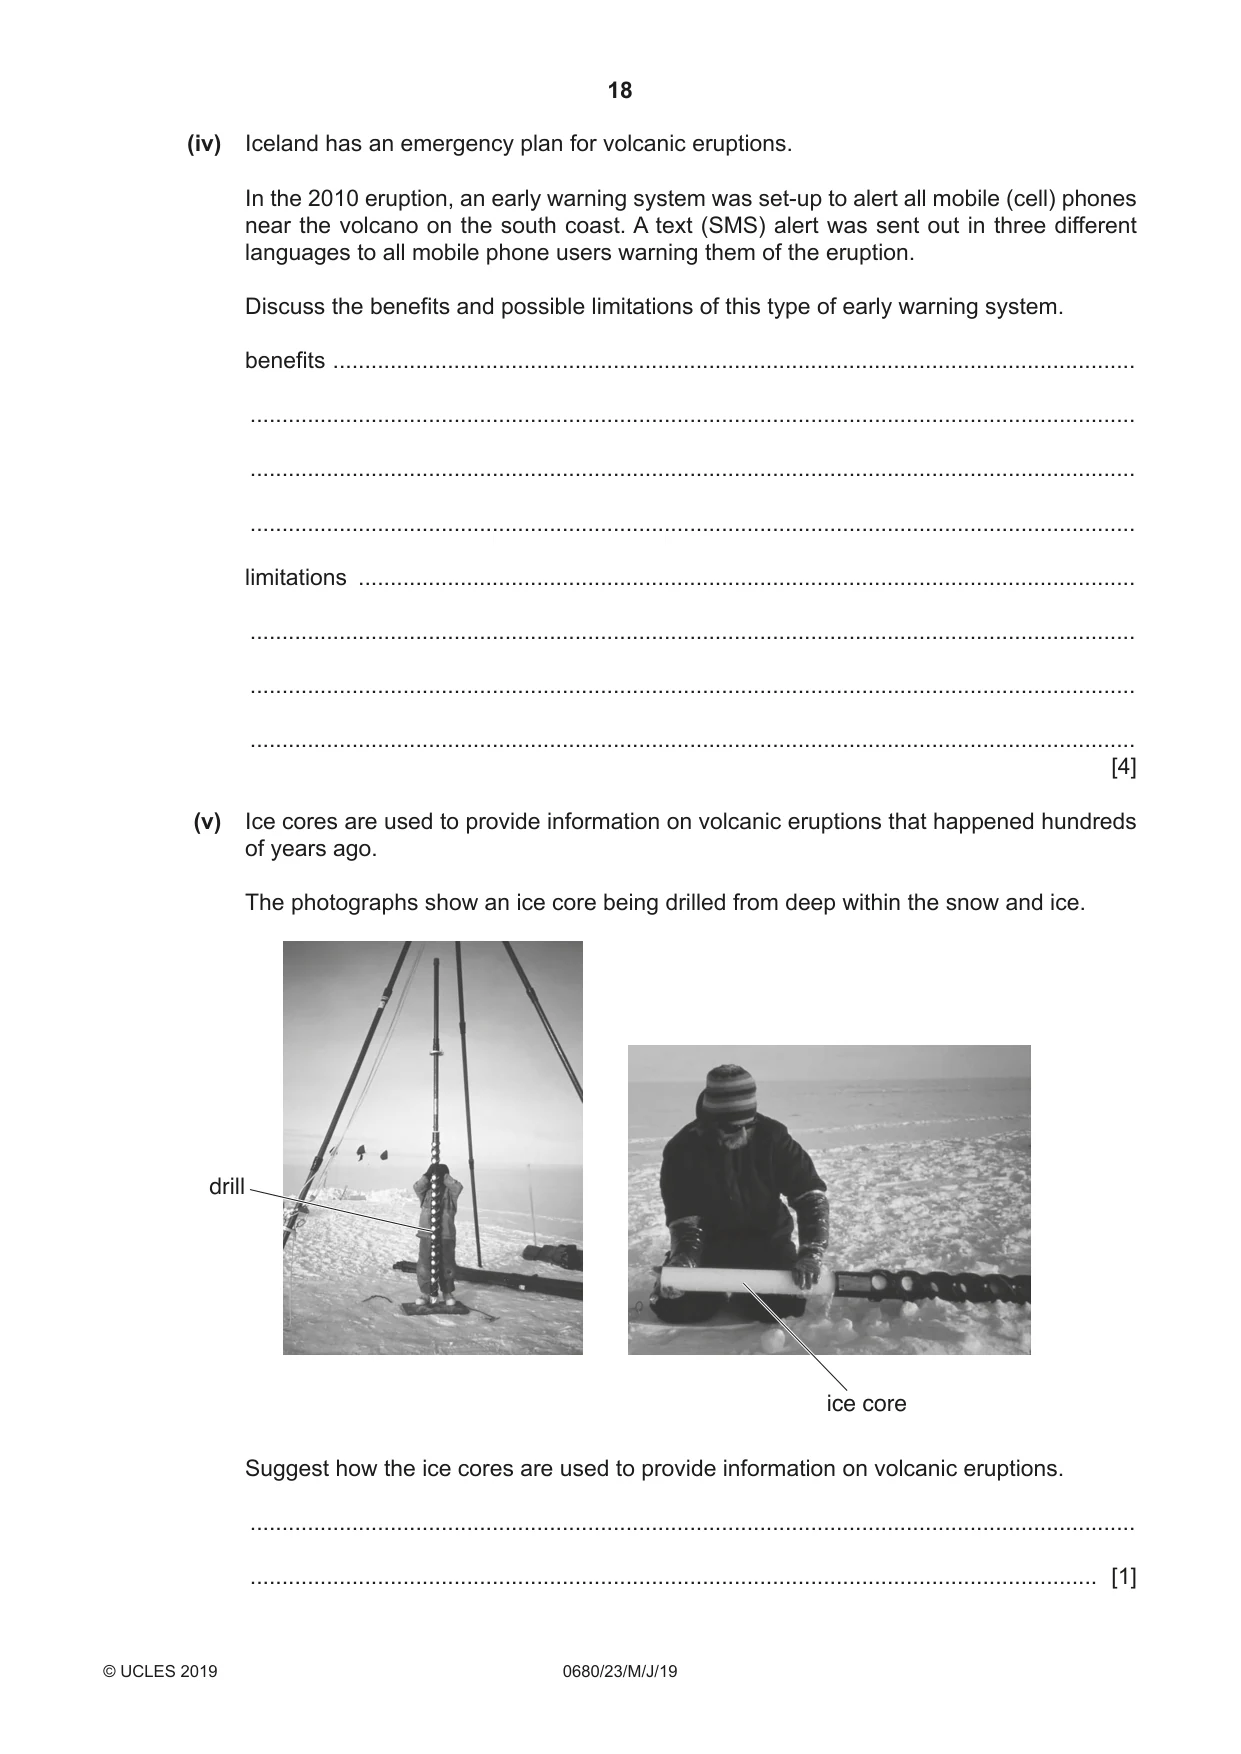
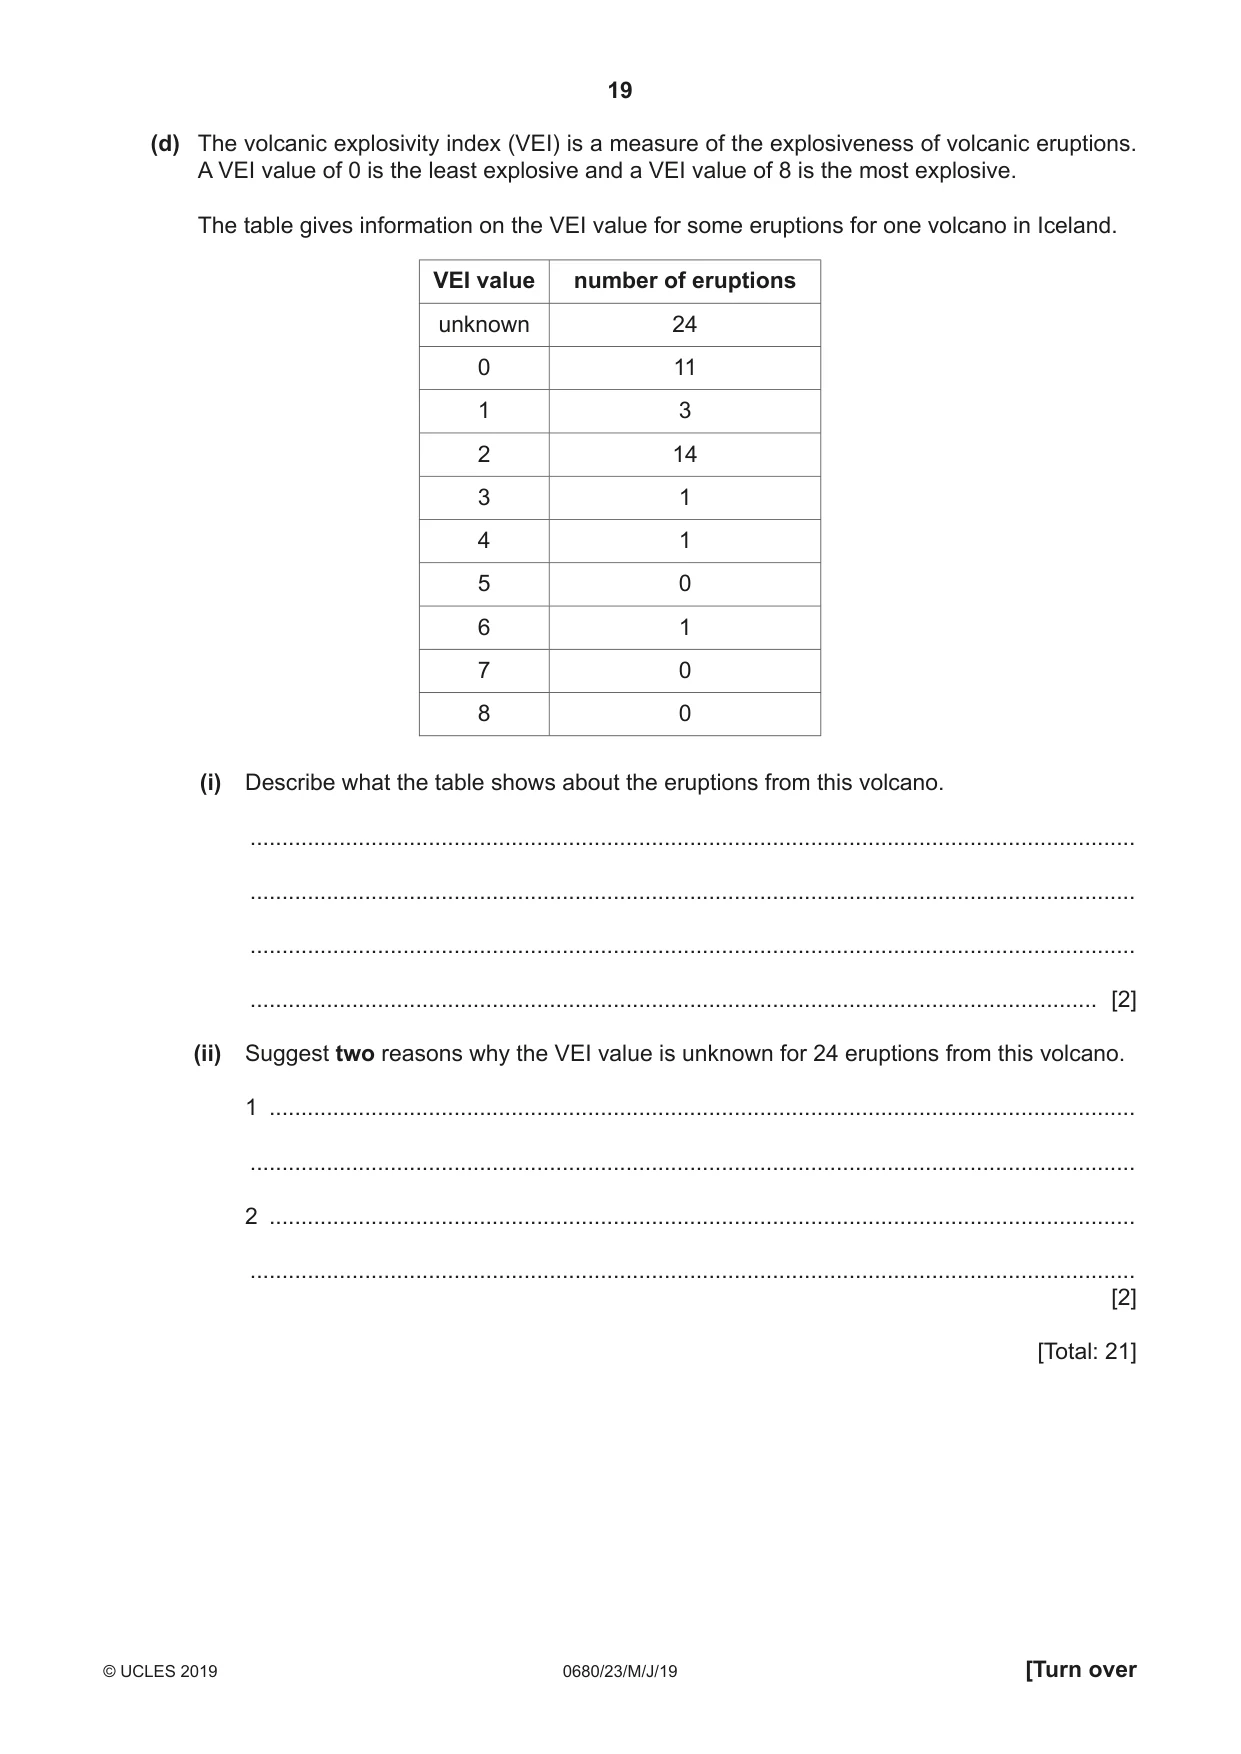
2 (a) Iceland is situated on the Mid-Atlantic Ridge plate boundary. The two plates, the North American plate and the Eurasian plate, are slowly moving apart. This means Iceland becomes bigger every year. The map shows the plates, the Mid-Atlantic Ridge and the location of Iceland’s major volcanoes. N NORTHNORTH AMERICANAMERICAN EURASIANEURASIAN PLATEPLATE PLATEPLATE EyjafjallajökullEyjafjallajökull volcanovolcano 0 20 SurtseySurtsey km islandisland Key capital city airport major volcano Mid-Atlantic Ridge (i) Explain why the youngest rocks are found in the central region of Iceland, along the Mid-Atlantic Ridge. ........................................................................................................................................... ........................................................................................................................................... ........................................................................................................................................... ..................................................................................................................................... [2] (ii) Use the map to predict the distribution of earthquakes in Iceland. ........................................................................................................................................... ..................................................................................................................................... [1] (b) Surtsey island formed in 1963 as a result of an underwater volcanic eruption. Scientists are using Surtsey island to study how plant and animal species spread to new areas, without any human involvement. Suggest ways Surtsey island could be protected from the impact of humans. ................................................................................................................................................... ................................................................................................................................................... ................................................................................................................................................... ................................................................................................................................................... ................................................................................................................................................... ............................................................................................................................................. [3] (c) In April 2010, Eyjafjallajökull volcano erupted in the south of Iceland. The eruption continued for 6 weeks. A large ash cloud spread across Iceland, the Atlantic Ocean and the European mainland. The ash cloud disrupted air traffic all around the world and approximately 100 000 flights were cancelled. The diagram shows a sample of ash from the ash cloud. 1 cm The ash fall caused considerable damage to farmland used for crops and grazing animals. The volcano is under a glacier and the eruption caused rapid melting of snow and ice. This resulted in flooding of river valleys, which also damaged farmland. (i) Suggest reasons why flights were cancelled during this eruption. ........................................................................................................................................... ........................................................................................................................................... ........................................................................................................................................... ..................................................................................................................................... [2] (ii) Explain why the eruption damaged farmland. ........................................................................................................................................... ........................................................................................................................................... ........................................................................................................................................... ..................................................................................................................................... [2] (iii) Iceland is approximately 300 km from north to south. The map shows the extent of the ash cloud produced by the eruption. N IcelandIceland Atlantic Ocean 0 1000 km Key Eyjafjallajökull volcano ash cloud Suggest reasons why people in the north of Iceland were mostly unaffected by the eruption. ........................................................................................................................................... ........................................................................................................................................... ........................................................................................................................................... ..................................................................................................................................... [2] (iv) Iceland has an emergency plan for volcanic eruptions. In the 2010 eruption, an early warning system was set-up to alert all mobile (cell) phones near the volcano on the south coast. A text (SMS) alert was sent out in three different languages to all mobile phone users warning them of the eruption. Discuss the benefits and possible limitations of this type of early warning system. benefits .............................................................................................................................. ........................................................................................................................................... ........................................................................................................................................... ........................................................................................................................................... limitations .......................................................................................................................... ........................................................................................................................................... ........................................................................................................................................... ........................................................................................................................................... [4] (v) Ice cores are used to provide information on volcanic eruptions that happened hundreds of years ago. The photographs show an ice core being drilled from deep within the snow and ice. drill ice core Suggest how the ice cores are used to provide information on volcanic eruptions. ........................................................................................................................................... ..................................................................................................................................... [1] (d) The volcanic explosivity index (VEI) is a measure of the explosiveness of volcanic eruptions. A VEI value of 0 is the least explosive and a VEI value of 8 is the most explosive. The table gives information on the VEI value for some eruptions for one volcano in Iceland. VEI value number of eruptions unknown 24 0 11 1 3 2 14 3 1 4 1 5 0 6 1 7 0 8 0 (i) Describe what the table shows about the eruptions from this volcano. ........................................................................................................................................... ........................................................................................................................................... ........................................................................................................................................... ..................................................................................................................................... [2] (ii) Suggest two reasons why the VEI value is unknown for 24 eruptions from this volcano. 1 ........................................................................................................................................ ........................................................................................................................................... 2 ........................................................................................................................................ ........................................................................................................................................... [2] [Total: 21]
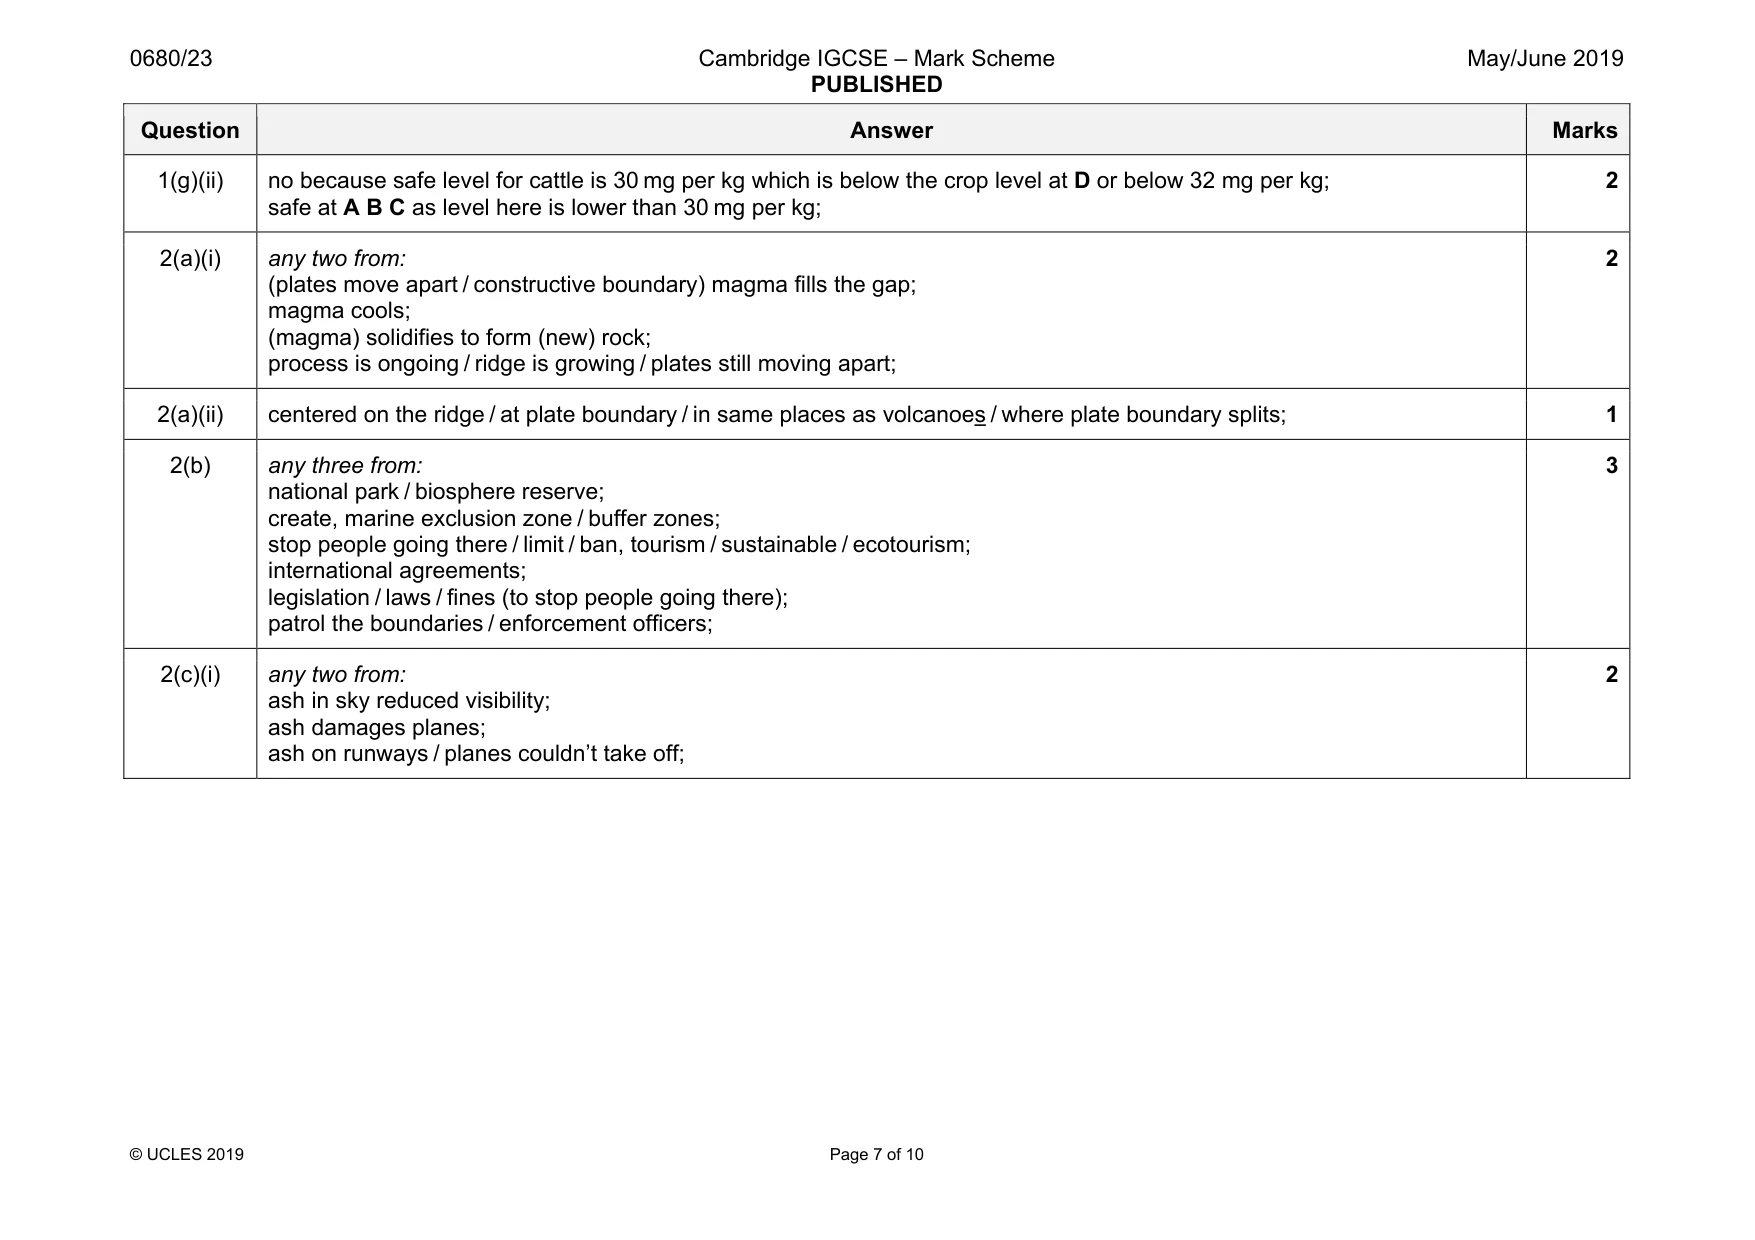
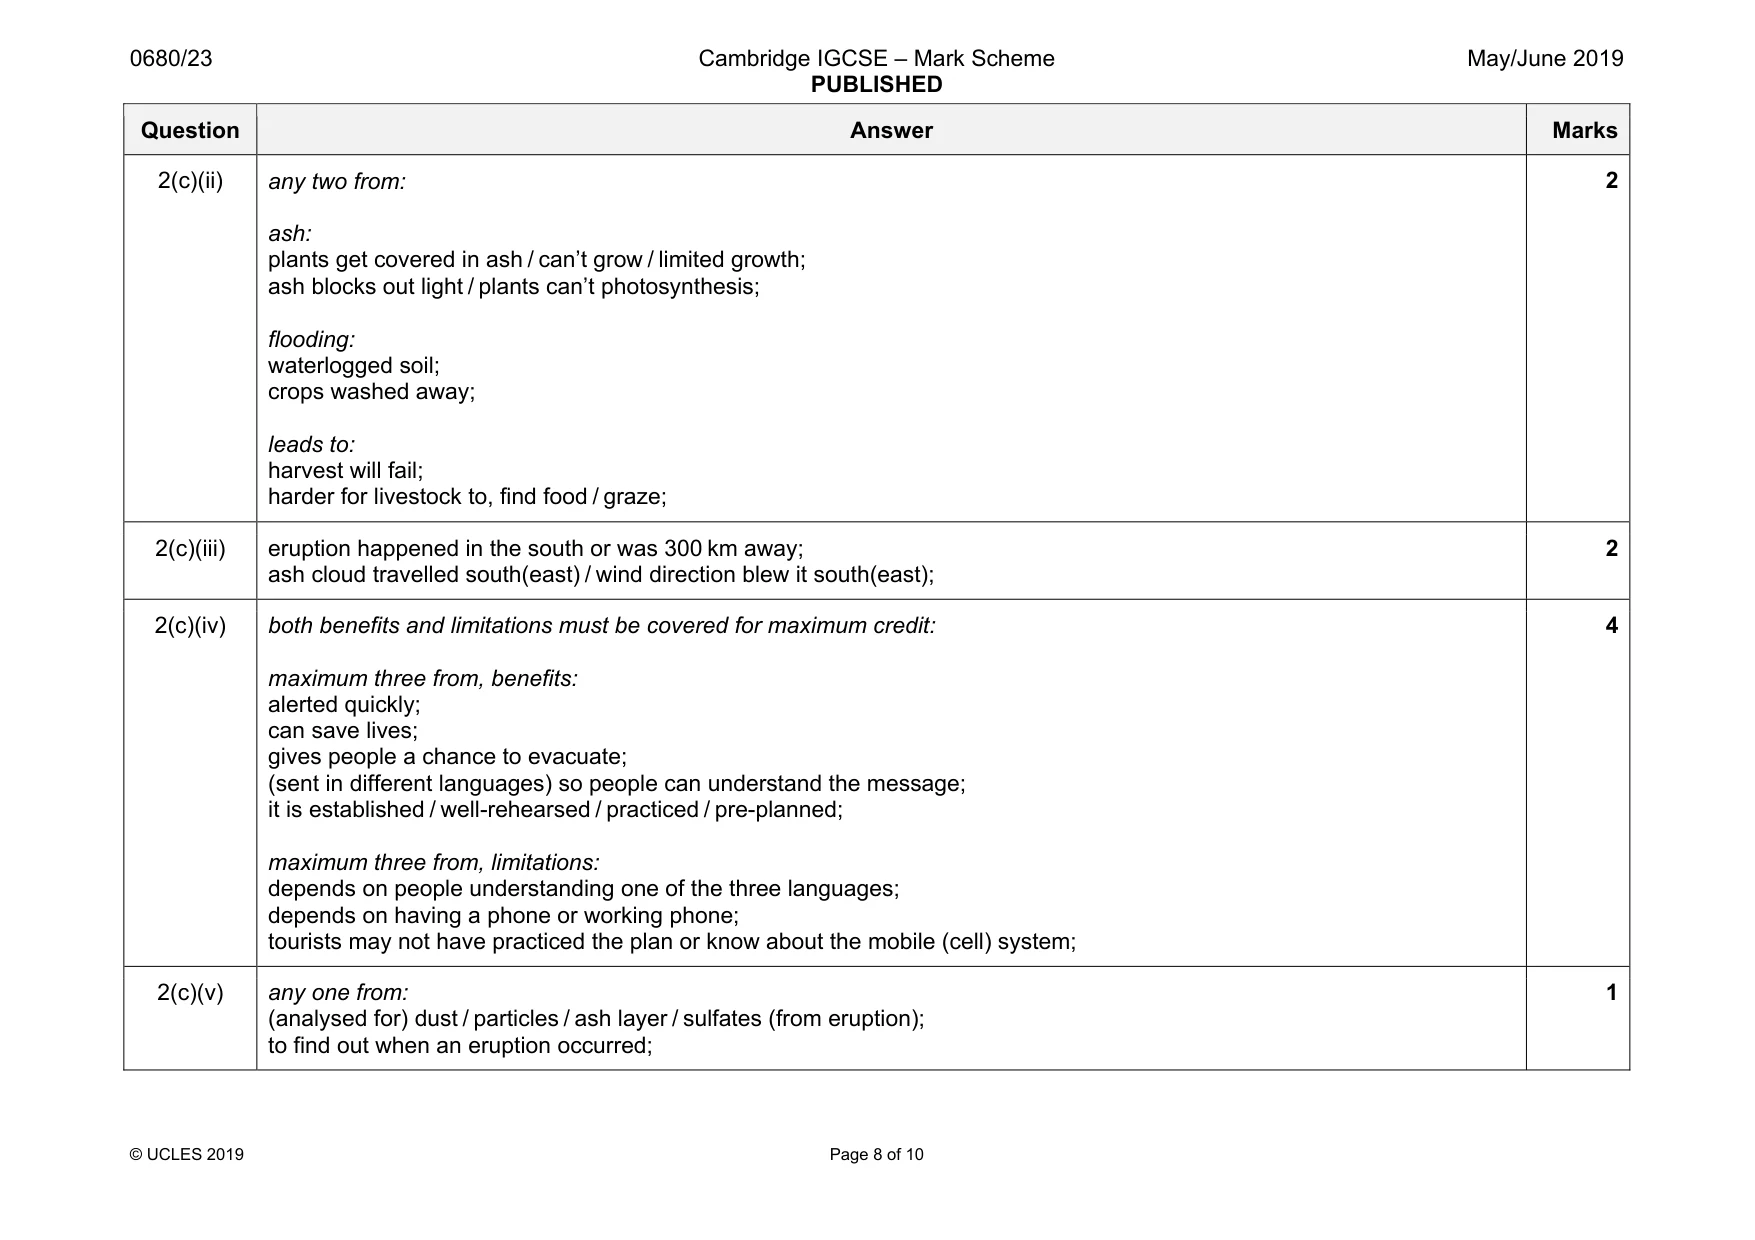
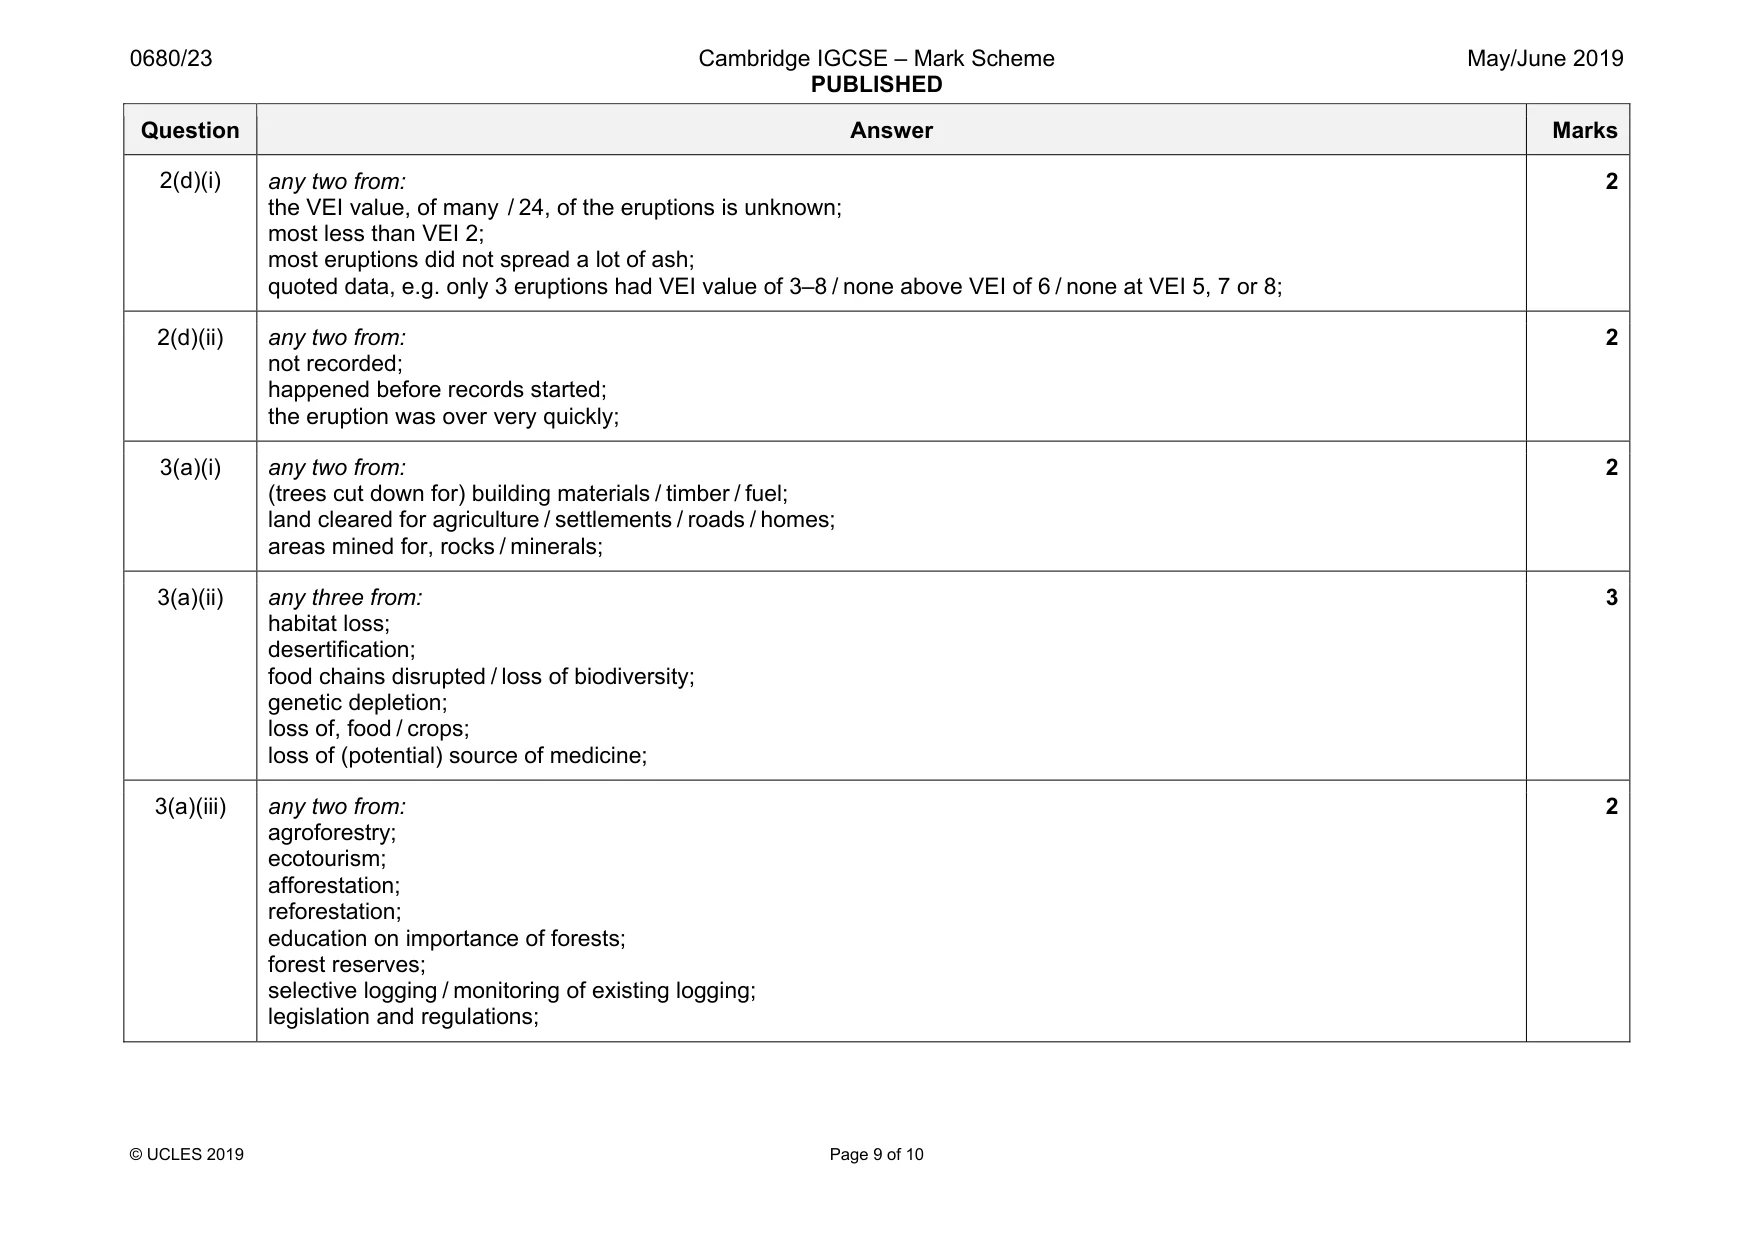
Mark scheme: 2(a)(i) any two from: (plates move apart / constructive boundary) magma fills the gap; magma cools; (magma) solidifies to form (new) rock; process is ongoing / ridge is growing / plates still moving apart; 2 2(a)(ii) centered on the ridge / at plate boundary / in same places as volcanoes / where plate boundary splits; 1 2(b) any three from: national park / biosphere reserve; create, marine exclusion zone / buffer zones; stop people going there / limit / ban, tourism / sustainable / ecotourism; international agreements; legislation / laws / fines (to stop people going there); patrol the boundaries / enforcement officers; 3 2(c)(i) any two from: ash in sky reduced visibility; ash damages planes; ash on runways / planes couldn’t take off; 2 Question Answer Marks 2(c)(ii) any two from: ash: plants get covered in ash / can’t grow / limited growth; ash blocks out light / plants can’t photosynthesis; flooding: waterlogged soil; crops washed away; leads to: harvest will fail; harder for livestock to, find food / graze; 2 2(c)(iii) eruption happened in the south or was 300 km away; ash cloud travelled south(east) / wind direction blew it south(east); 2 2(c)(iv) both benefits and limitations must be covered for maximum credit: maximum three from, benefits: alerted quickly; can save lives; gives people a chance to evacuate; (sent in different languages) so people can understand the message; it is established / well-rehearsed / practiced / pre-planned; maximum three from, limitations: depends on people understanding one of the three languages; depends on having a phone or working phone; tourists may not have practiced the plan or know about the mobile (cell) system; 4 2(c)(v) any one from: (analysed for) dust / particles / ash layer / sulfates (from eruption); to find out when an eruption occurred; 1 Question Answer Marks 2(d)(i) any two from: the VEI value, of many / 24, of the eruptions is unknown; most less than VEI 2; most eruptions did not spread a lot of ash; quoted data, e.g. only 3 eruptions had VEI value of 3–8 / none above VEI of 6 / none at VEI 5, 7 or 8; 2 2(d)(ii) any two from: not recorded; happened before records started; the eruption was over very quickly; 2
Q3 · The percentage of land covered by trees in Iceland has decreased since humans settled on…
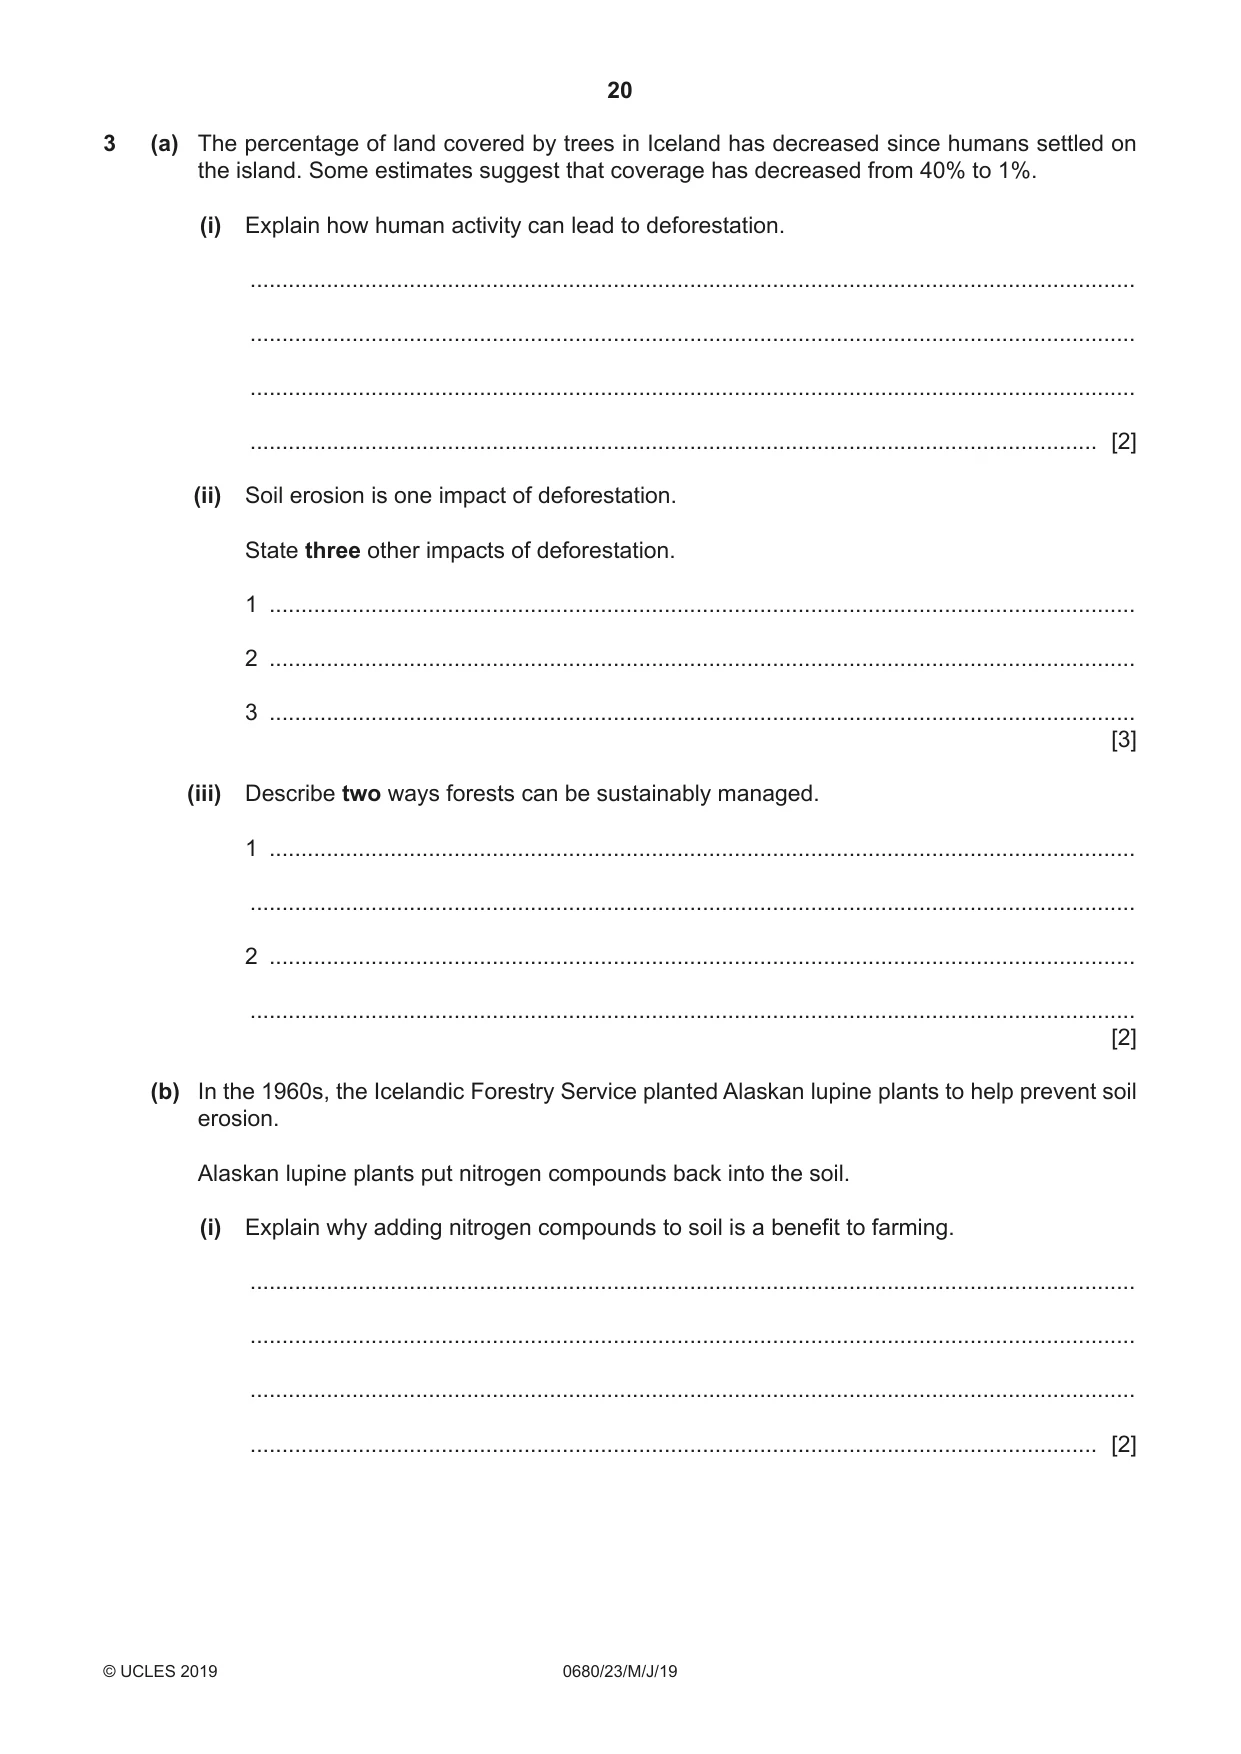
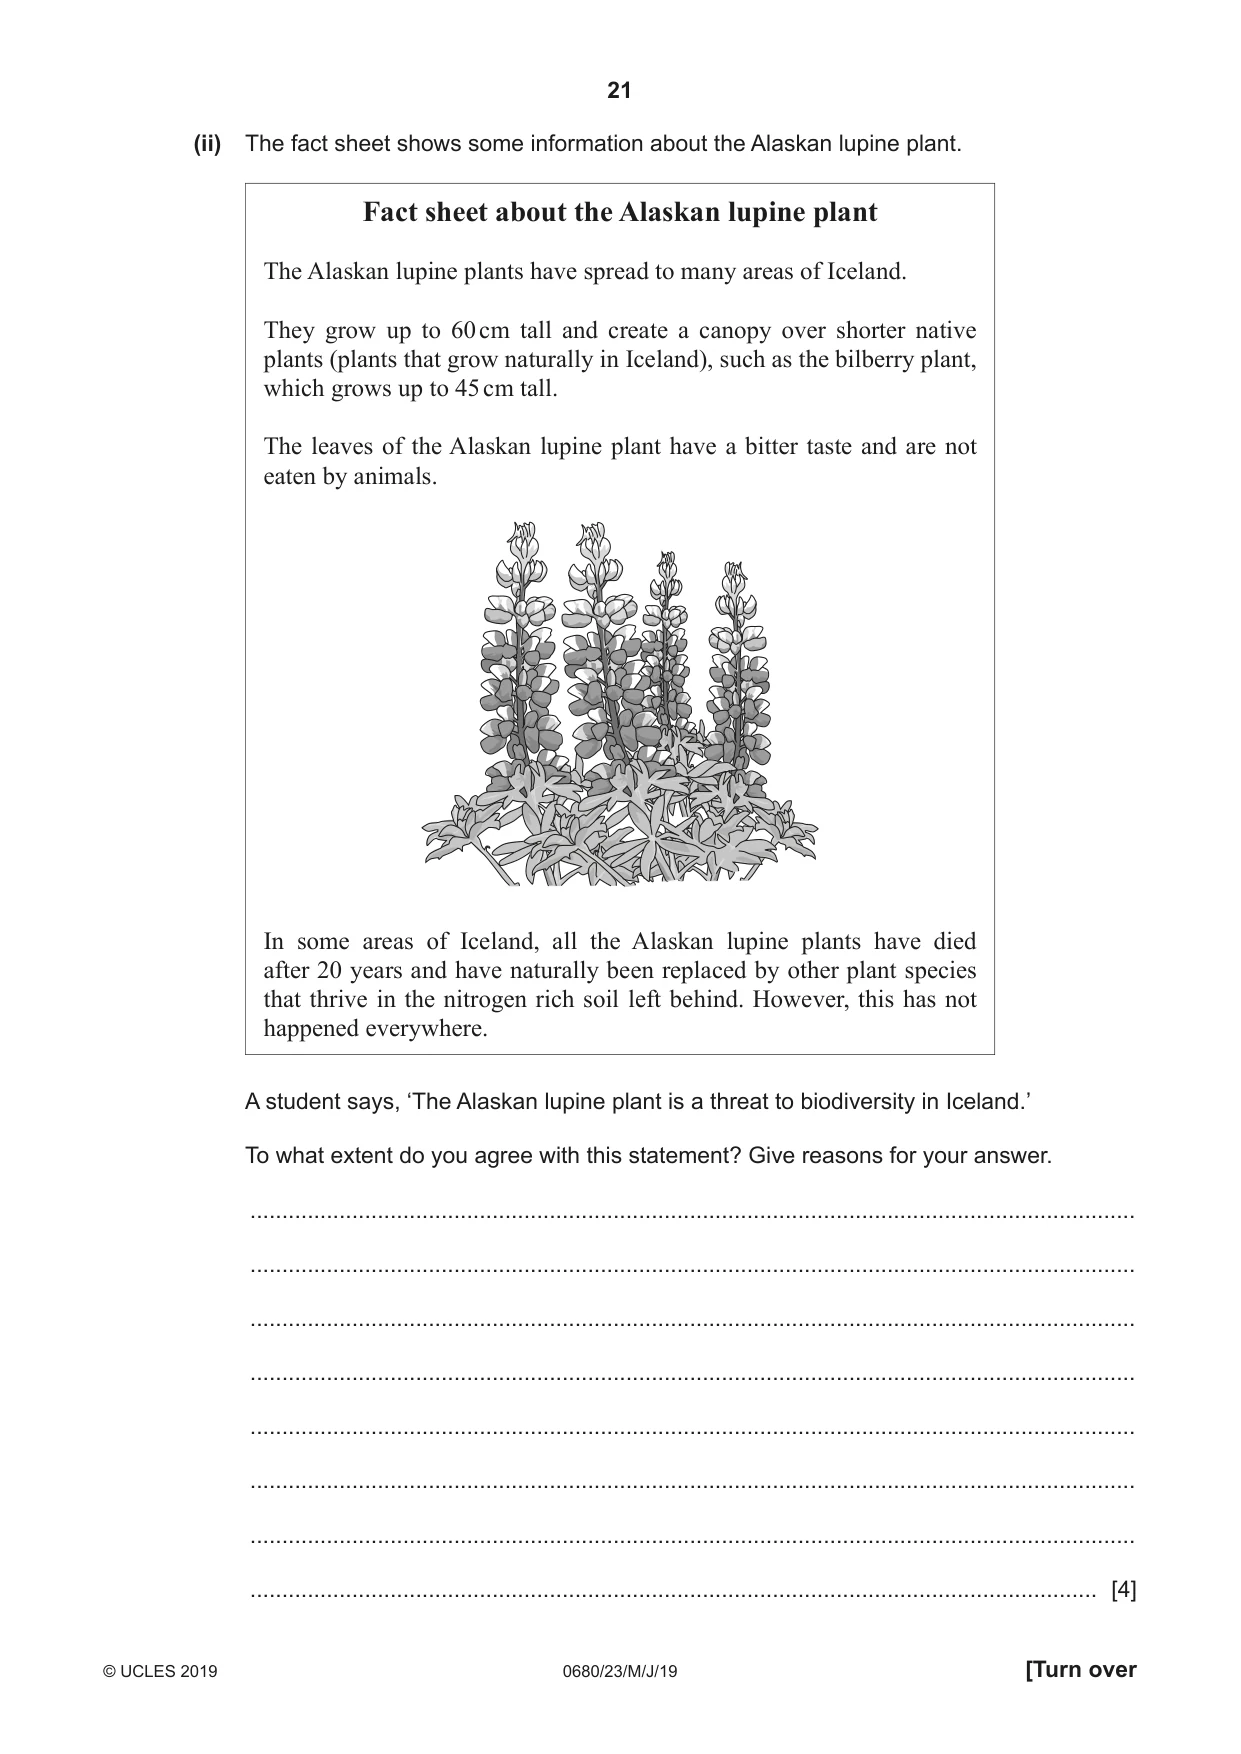
3 (a) The percentage of land covered by trees in Iceland has decreased since humans settled on the island. Some estimates suggest that coverage has decreased from 40% to 1%. (i) Explain how human activity can lead to deforestation. ........................................................................................................................................... ........................................................................................................................................... ........................................................................................................................................... ..................................................................................................................................... [2] (ii) Soil erosion is one impact of deforestation. State three other impacts of deforestation. 1 ........................................................................................................................................ 2 ........................................................................................................................................ 3 ........................................................................................................................................ [3] (iii) Describe two ways forests can be sustainably managed. 1 ........................................................................................................................................ ........................................................................................................................................... 2 ........................................................................................................................................ ........................................................................................................................................... [2] (b) In the 1960s, the Icelandic Forestry Service planted Alaskan lupine plants to help prevent soil erosion. Alaskan lupine plants put nitrogen compounds back into the soil. (i) Explain why adding nitrogen compounds to soil is a benefit to farming. ........................................................................................................................................... ........................................................................................................................................... ........................................................................................................................................... ..................................................................................................................................... [2] (ii) The fact sheet shows some information about the Alaskan lupine plant. Fact sheet about the Alaskan lupine plant The Alaskan lupine plants have spread to many areas of Iceland. They grow up to 60 cm tall and create a canopy over shorter native plants (plants that grow naturally in Iceland), such as the bilberry plant, which grows up to 45 cm tall. The leaves of the Alaskan lupine plant have a bitter taste and are not eaten by animals. In some areas of Iceland, all the Alaskan lupine plants have died after 20 years and have naturally been replaced by other plant species that thrive in the nitrogen rich soil left behind. However, this has not happened everywhere. A student says, ‘The Alaskan lupine plant is a threat to biodiversity in Iceland.’ To what extent do you agree with this statement? Give reasons for your answer. ........................................................................................................................................... ........................................................................................................................................... ........................................................................................................................................... ........................................................................................................................................... ........................................................................................................................................... ........................................................................................................................................... ........................................................................................................................................... ..................................................................................................................................... [4] (iii) The student wanted to estimate the population of Alaskan lupine plants in a field, using a quadrat. Describe how the student could use a quadrat to estimate the population of Alaskan lupine plants in the field. Include any other equipment the student needs and how they should process the results. ........................................................................................................................................... ........................................................................................................................................... ........................................................................................................................................... ........................................................................................................................................... ........................................................................................................................................... ........................................................................................................................................... ........................................................................................................................................... ........................................................................................................................................... ........................................................................................................................................... ..................................................................................................................................... [5] [Total: 18]
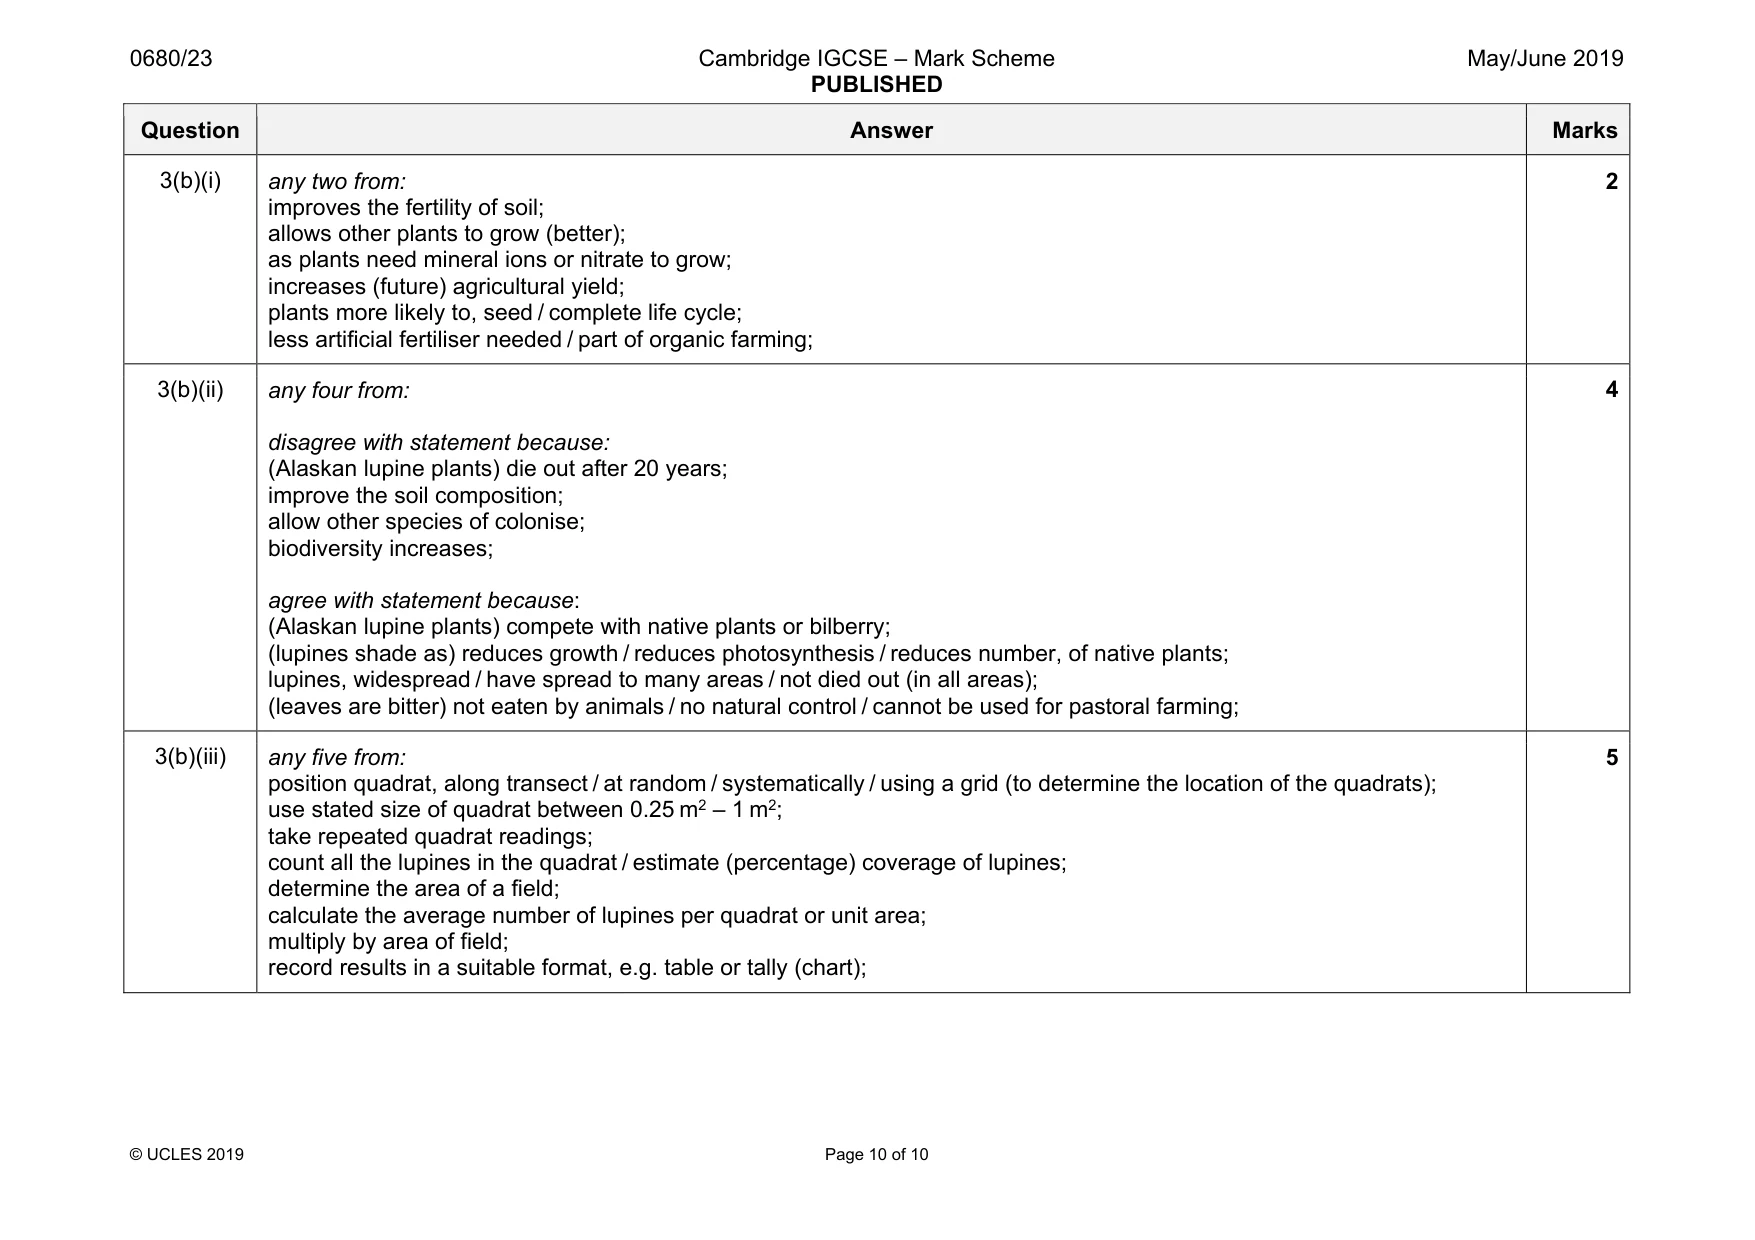
Mark scheme: 3(a)(i) any two from: (trees cut down for) building materials / timber / fuel; land cleared for agriculture / settlements / roads / homes; areas mined for, rocks / minerals; 2 3(a)(ii) any three from: habitat loss; desertification; food chains disrupted / loss of biodiversity; genetic depletion; loss of, food / crops; loss of (potential) source of medicine; 3 3(a)(iii) any two from: agroforestry; ecotourism; afforestation; reforestation; education on importance of forests; forest reserves; selective logging / monitoring of existing logging; legislation and regulations; 2 Question Answer Marks 3(b)(i) any two from: improves the fertility of soil; allows other plants to grow (better); as plants need mineral ions or nitrate to grow; increases (future) agricultural yield; plants more likely to, seed / complete life cycle; less artificial fertiliser needed / part of organic farming; 2 3(b)(ii) any four from: disagree with statement because: (Alaskan lupine plants) die out after 20 years; improve the soil composition; allow other species of colonise; biodiversity increases; agree with statement because: (Alaskan lupine plants) compete with native plants or bilberry; (lupines shade as) reduces growth / reduces photosynthesis / reduces number, of native plants; lupines, widespread / have spread to many areas / not died out (in all areas); (leaves are bitter) not eaten by animals / no natural control / cannot be used for pastoral farming; 4 3(b)(iii) any five from: position quadrat, along transect / at random / systematically / using a grid (to determine the location of the quadrats); use stated size of quadrat between 0.25 m2 – 1 m2; take repeated quadrat readings; count all the lupines in the quadrat / estimate (percentage) coverage of lupines; determine the area of a field; calculate the average number of lupines per quadrat or unit area; multiply by area of field; record results in a suitable format, e.g. table or tally (chart); 5
What was in this paper
The subtopics covered by these 3 questions, and how many questions each got. Open one in a new tab to see every Cambridge question on it.
What you needed in this session
Cambridge’s own grade thresholds for 2019 May/June, Paper 2 · Variant 3. A higher threshold means an easier paper — the bar moves with how the cohort did.