Cambridge IGCSE Environmental Management 0680 — 2018 May/June Paper 4 · Variant 3
0680/43/M/J/18 · 2 questions · 60 marks · ≈68 min
The question paper and its mark scheme, free to read here and free to download. This is Cambridge’s own paper, exactly as it was sat.
Question paper16 pages



Mark scheme8 pages
Answers below. Sit the paper first if you are practising.
Questions as text
Q1 · The economy of Zimbabwe depends on mining and agriculture
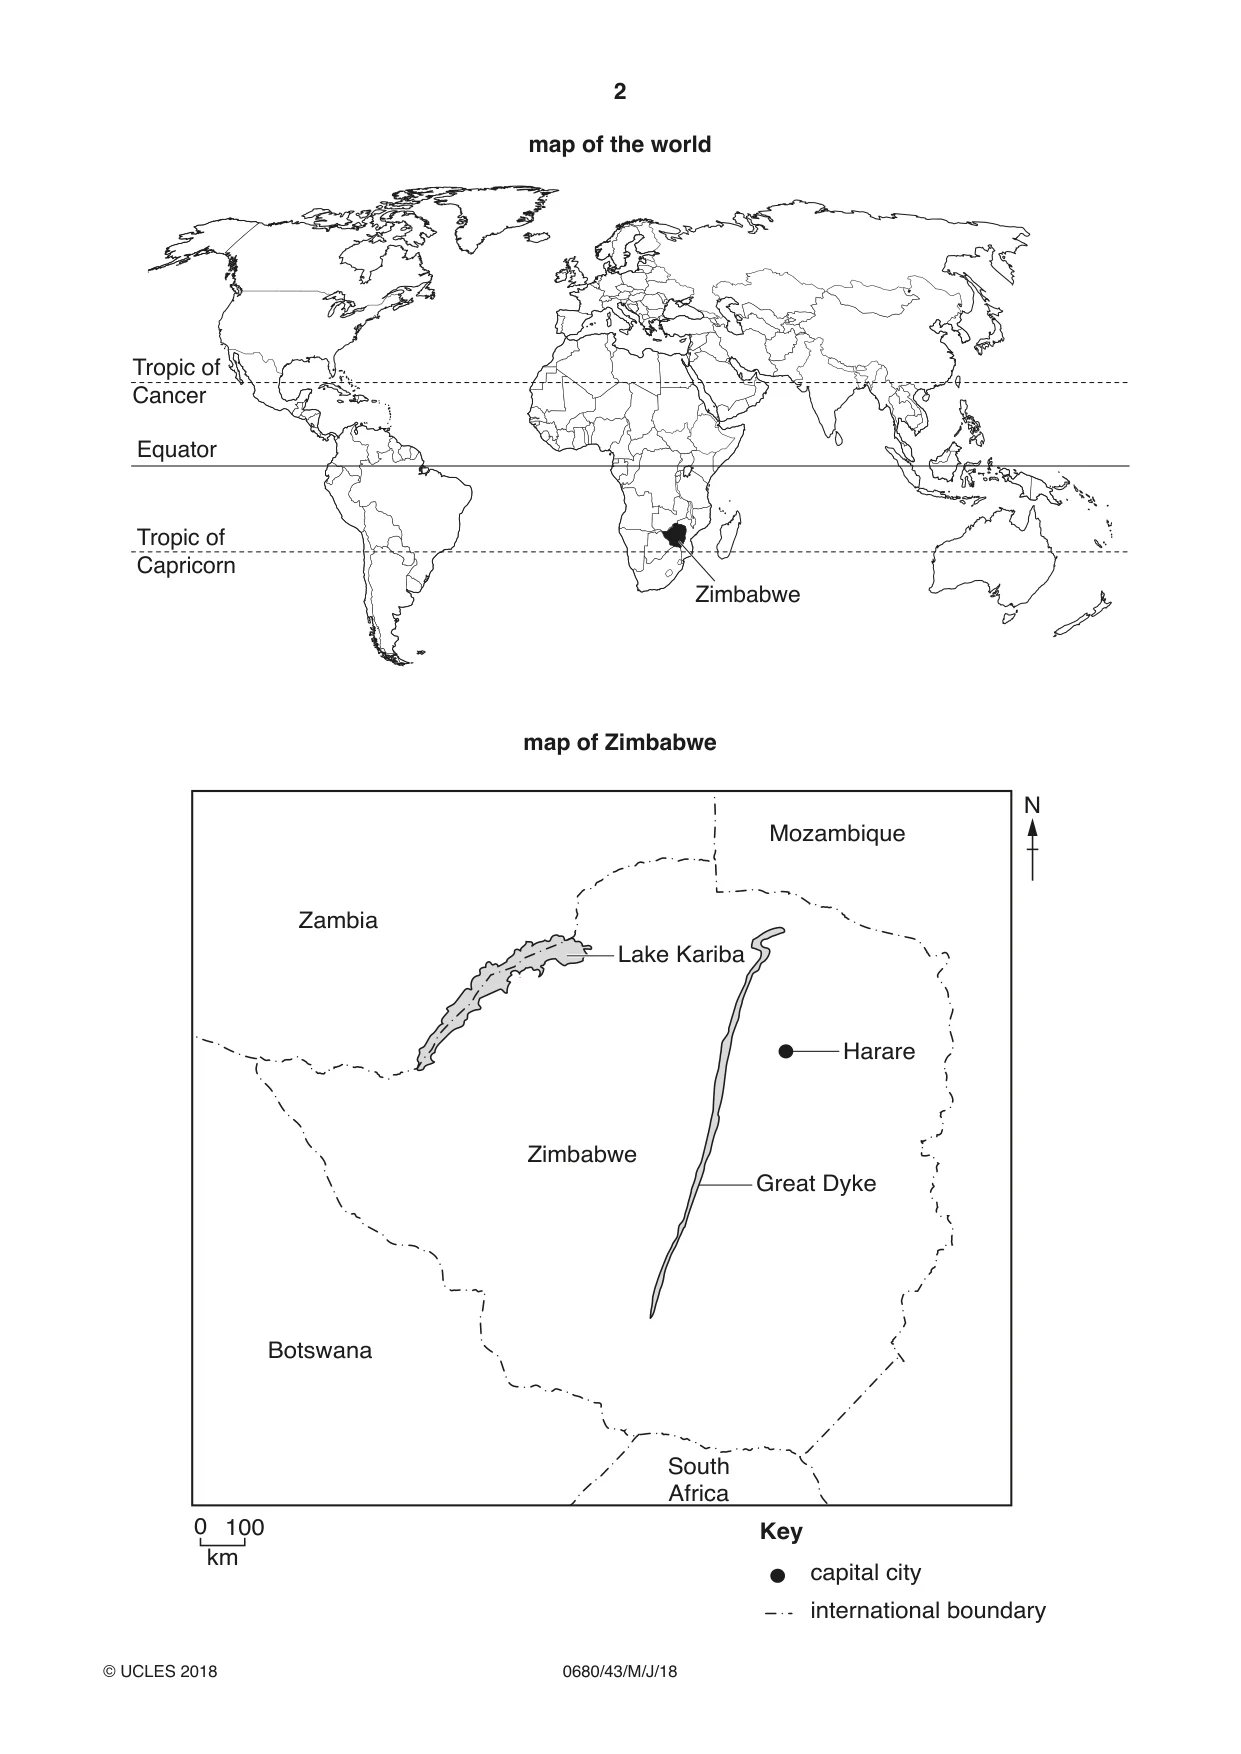
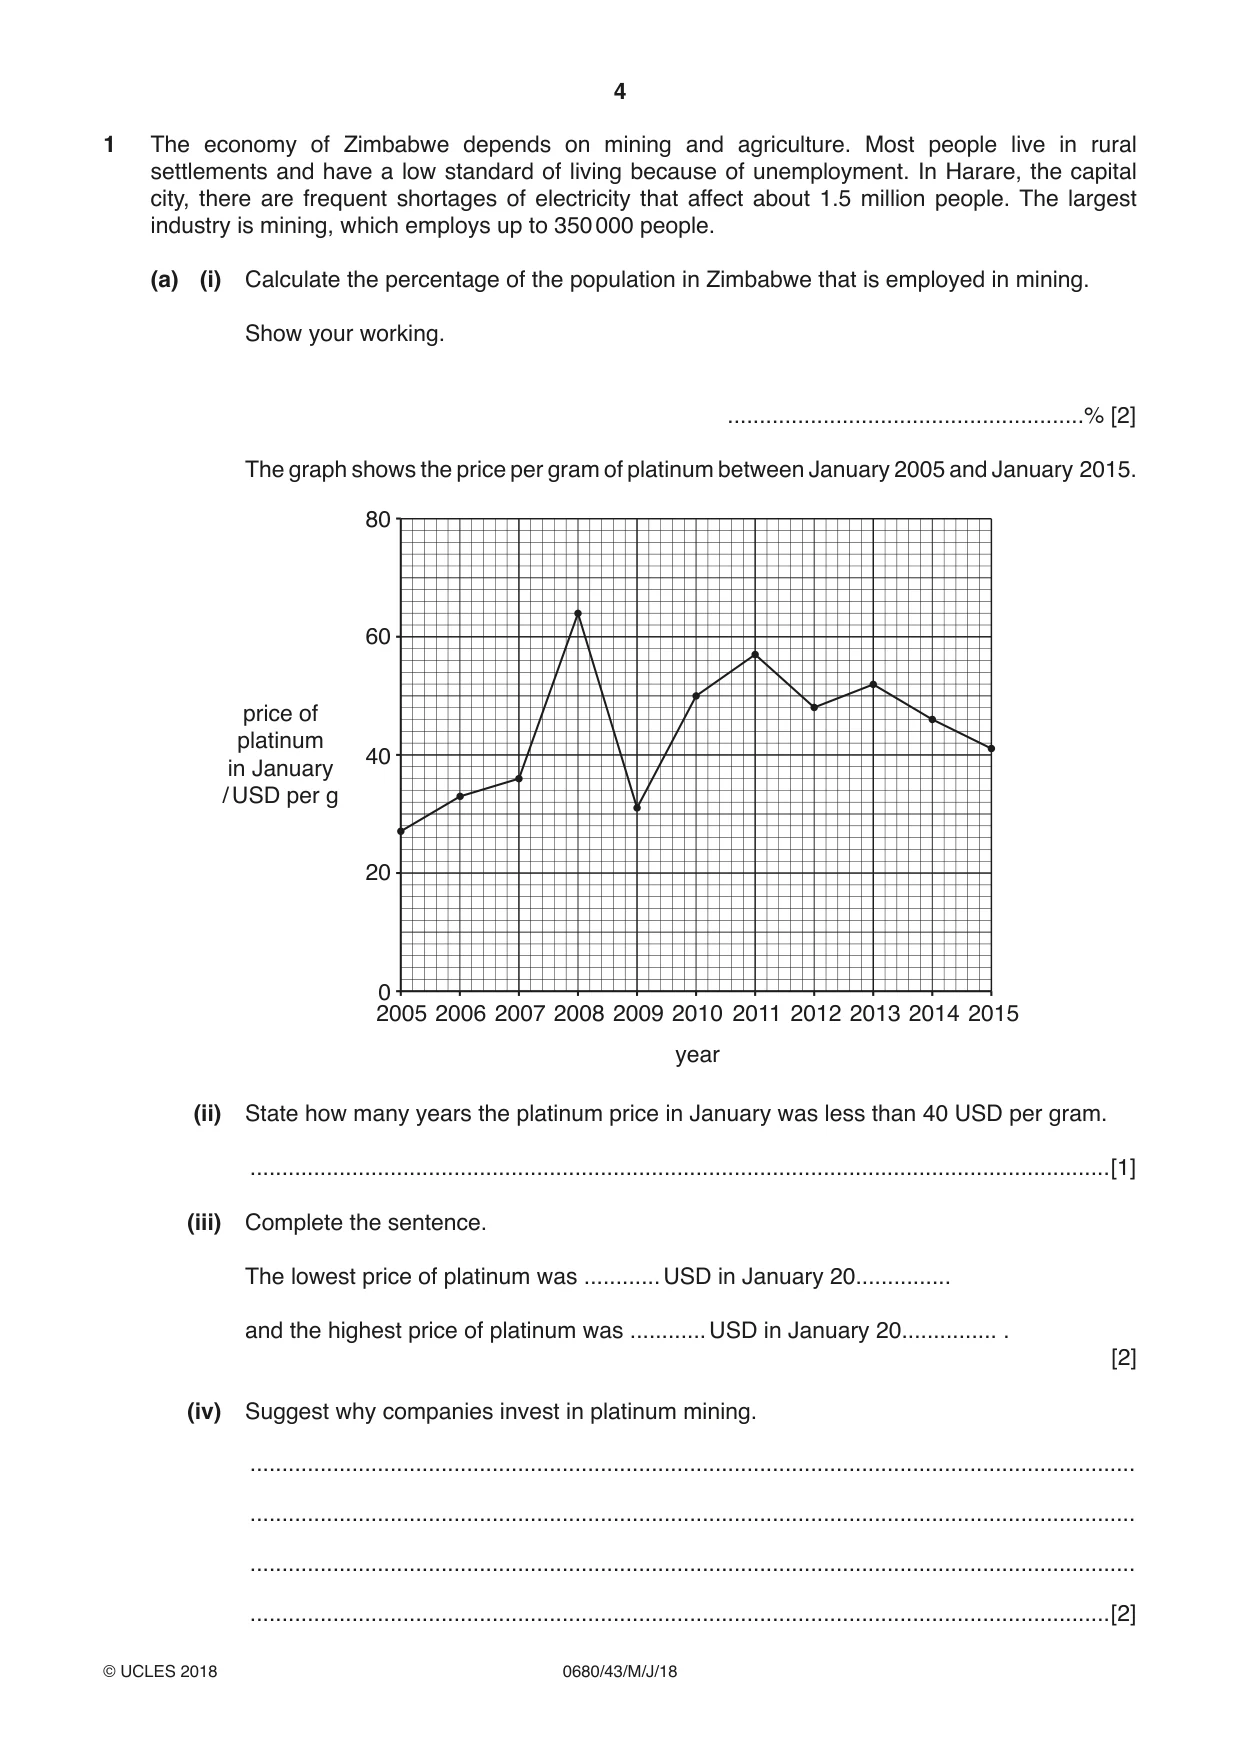
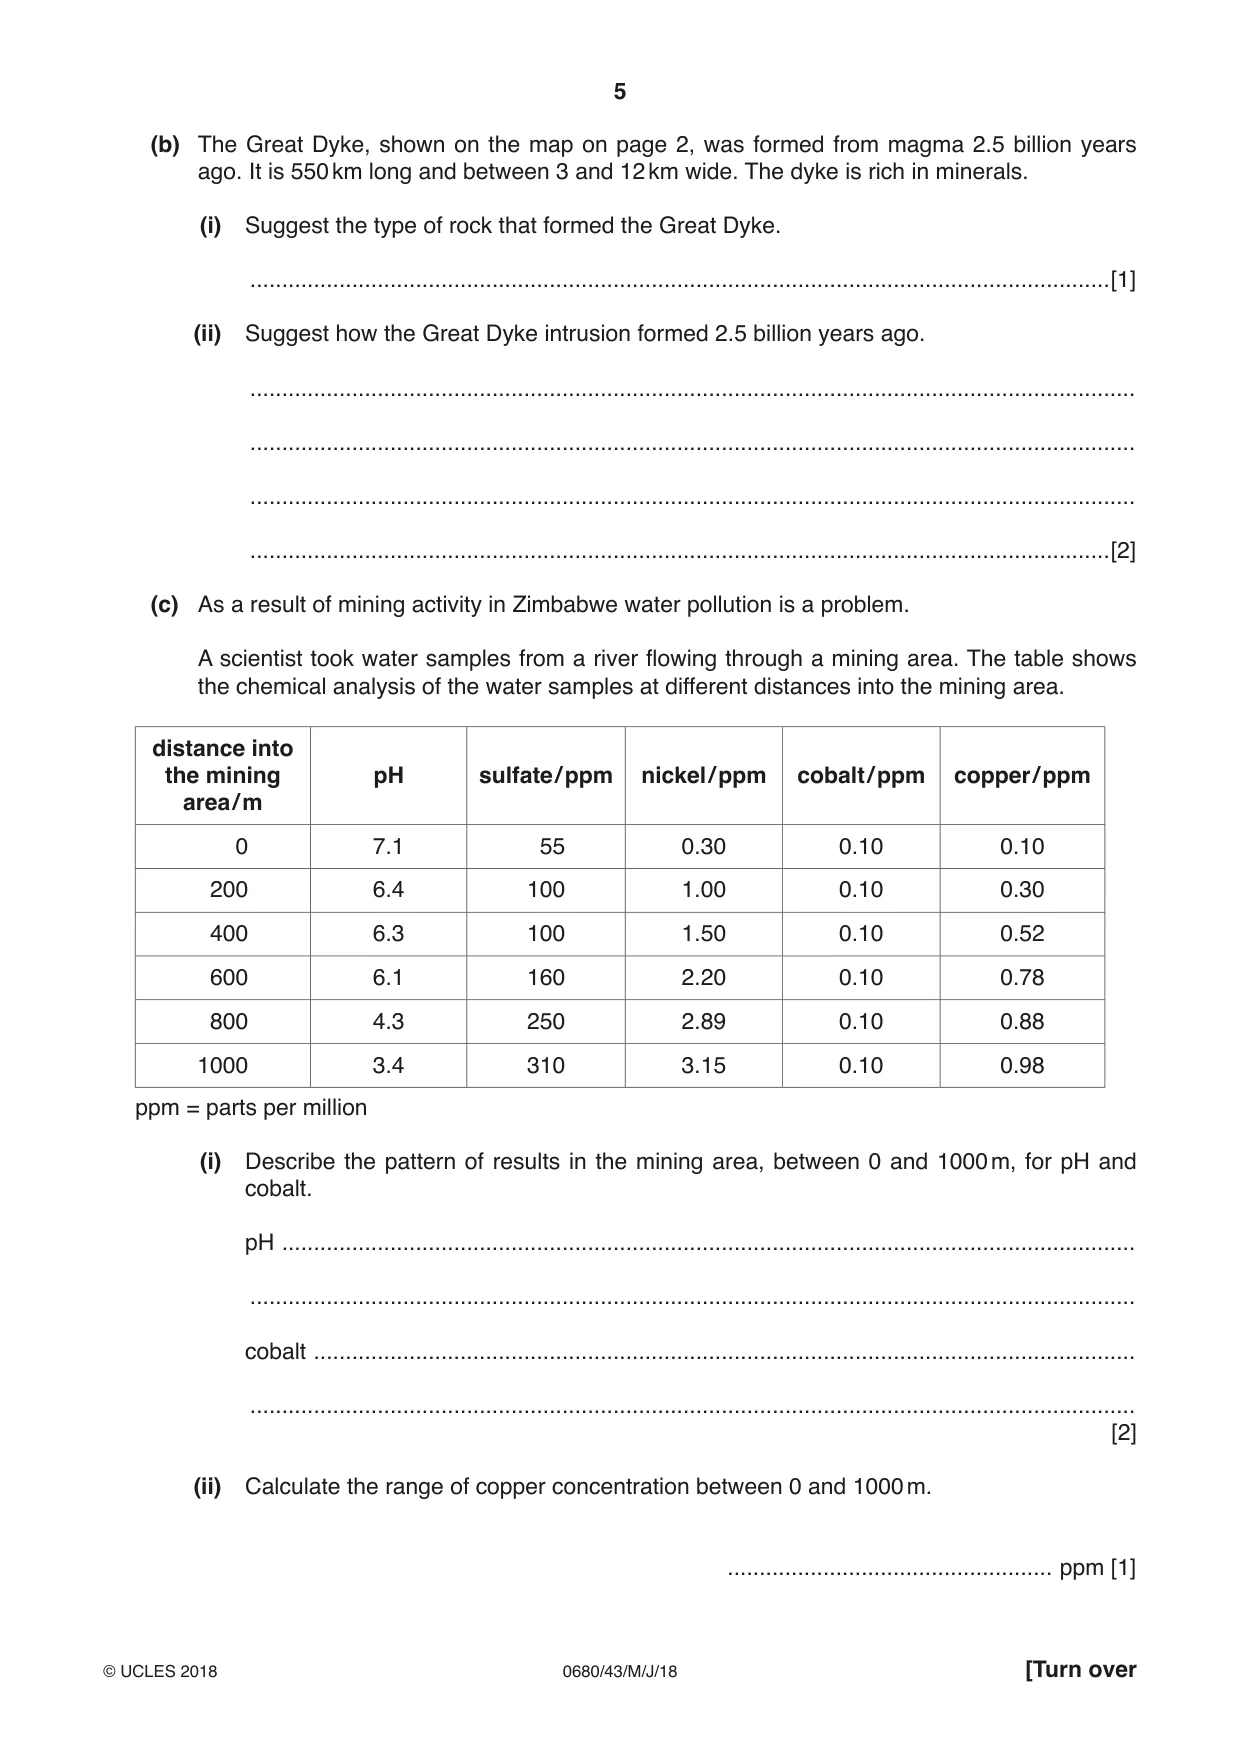
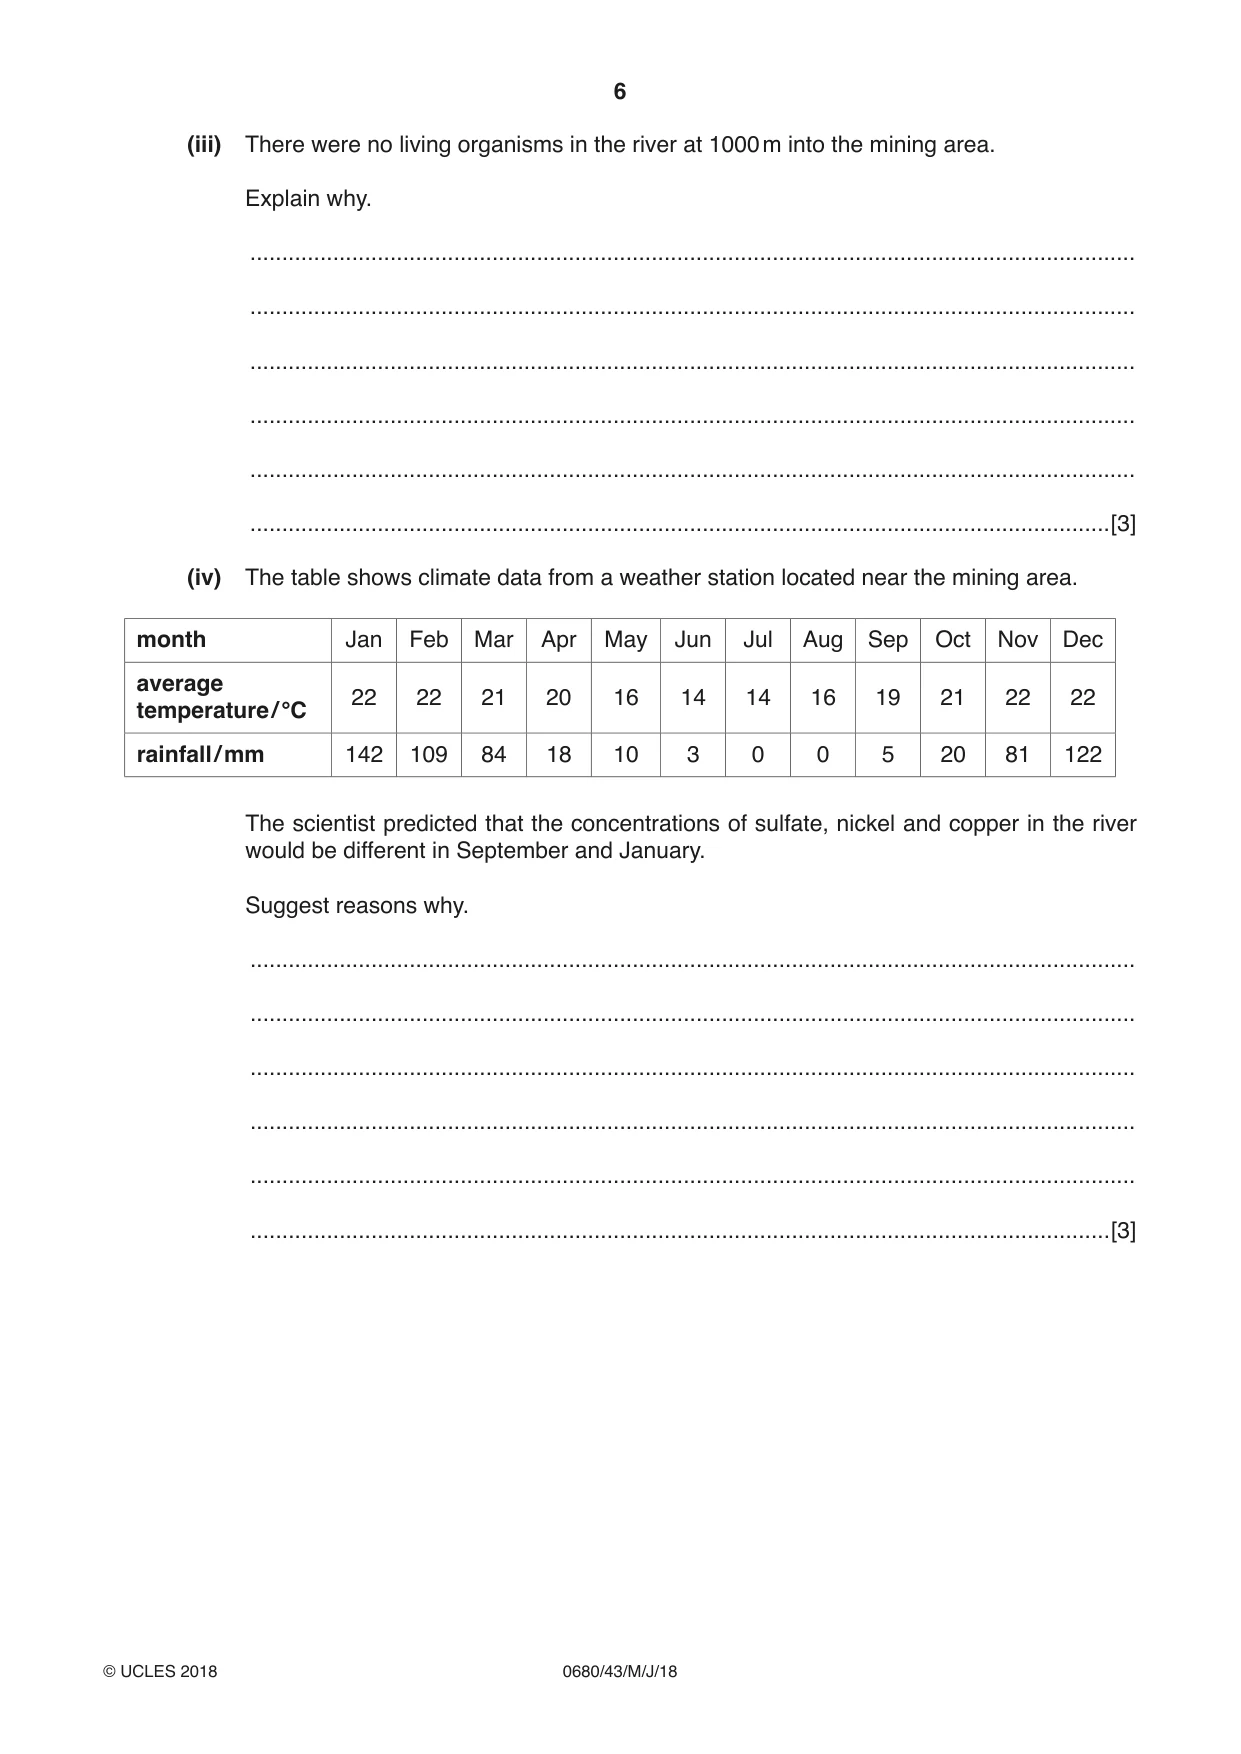
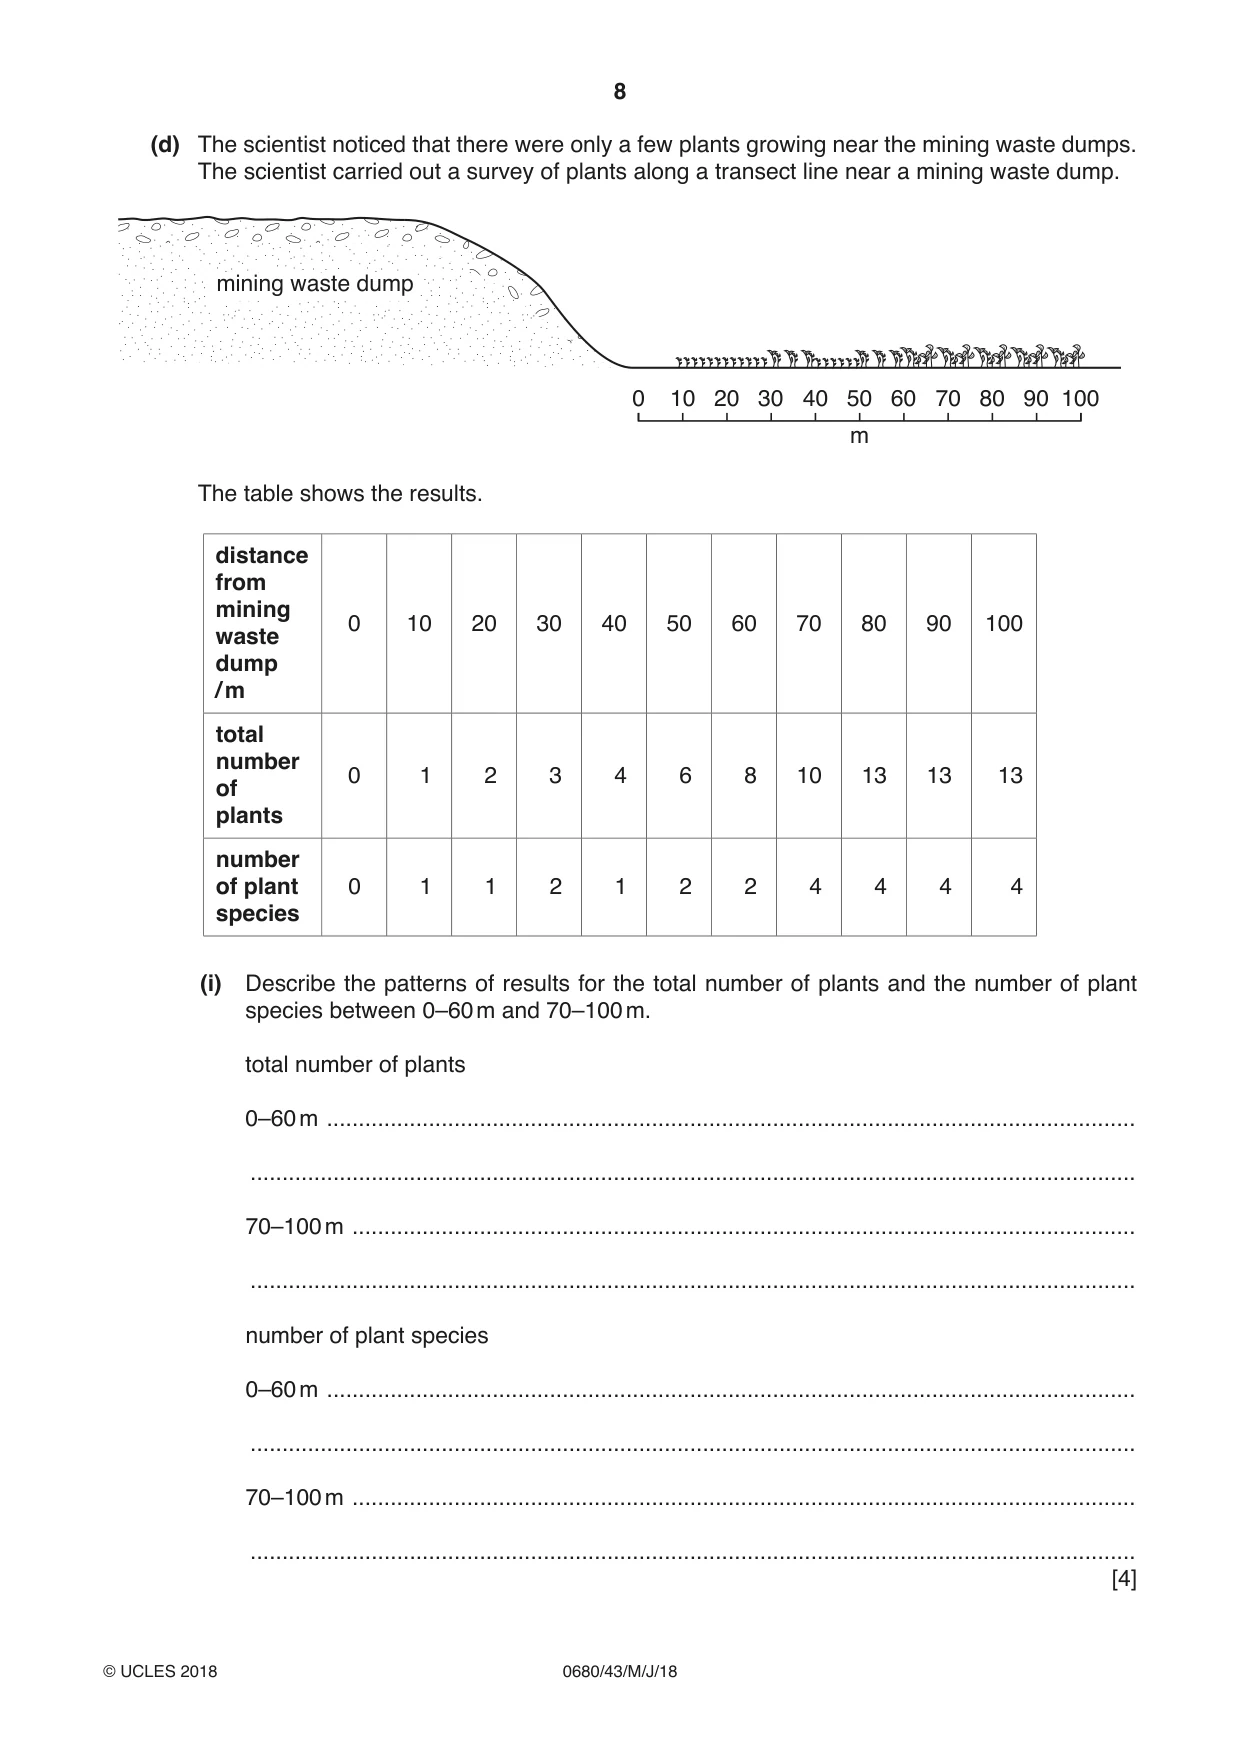
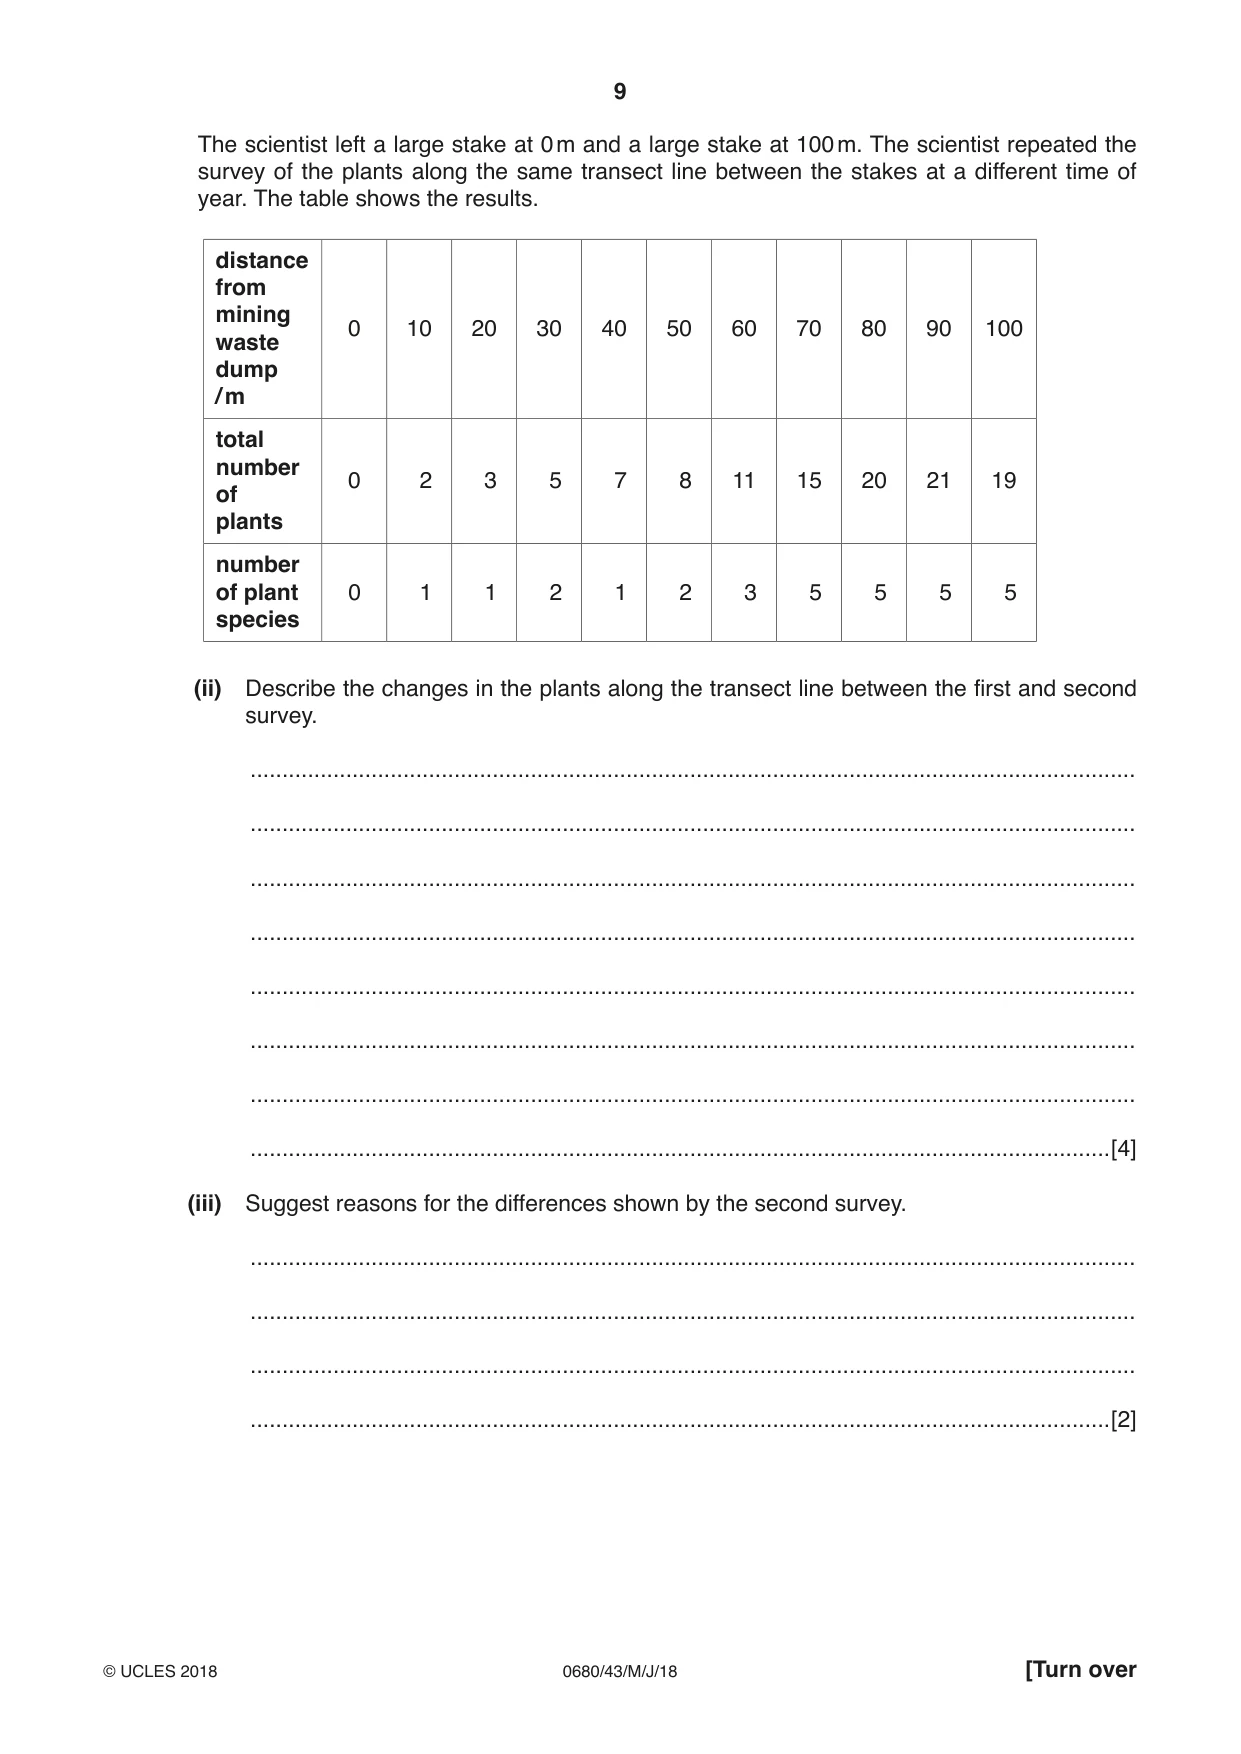
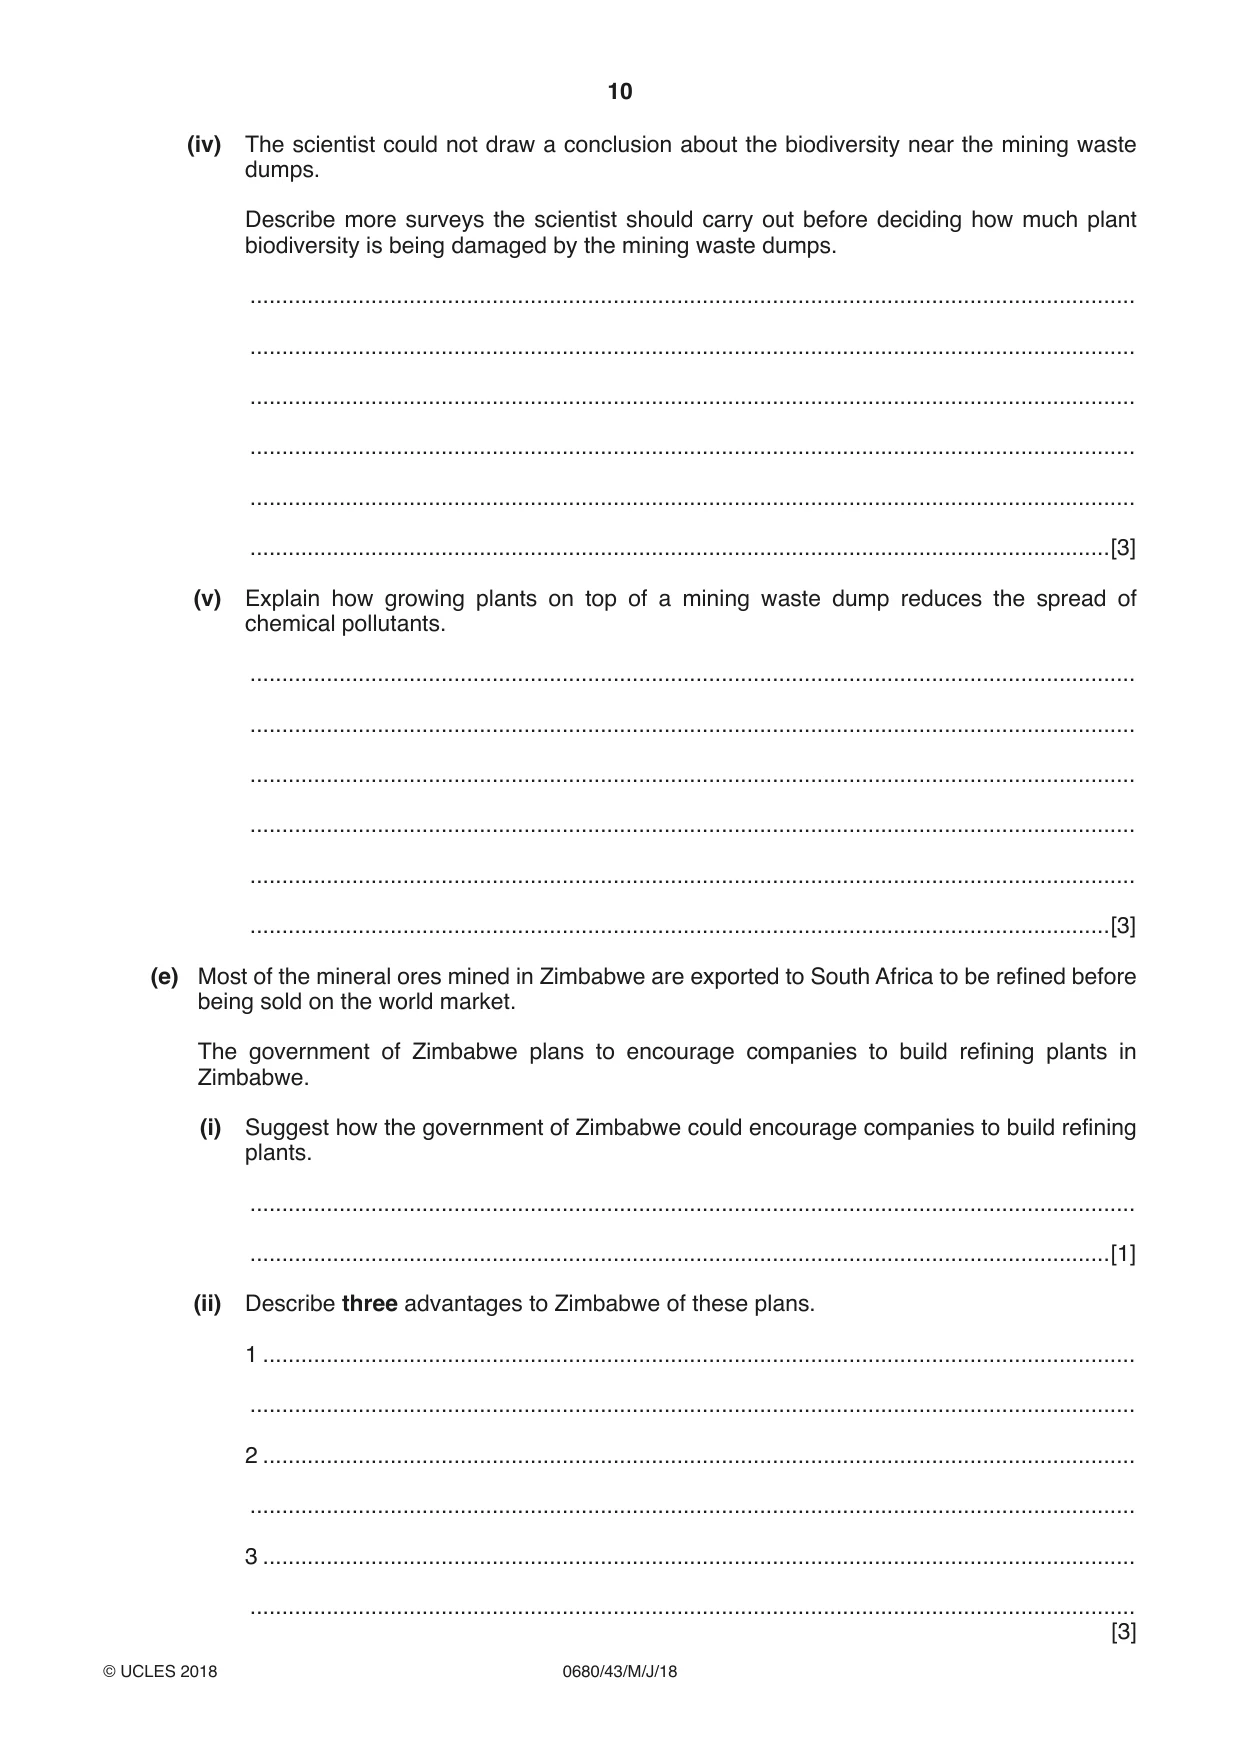
1 The economy of Zimbabwe depends on mining and agriculture. Most people live in rural settlements and have a low standard of living because of unemployment. In Harare, the capital city, there are frequent shortages of electricity that affect about 1.5 million people. The largest industry is mining, which employs up to 350 000 people. (a) (i) Calculate the percentage of the population in Zimbabwe that is employed in mining. Show your working. ........................................................% [2] The graph shows the price per gram of platinum between January 2005 and January 2015. 80 60 price of platinum 40 in January / USD per g 20 0 2005 2006 2007 2008 2009 2010 2011 2012 2013 2014 2015 year (ii) State how many years the platinum price in January was less than 40 USD per gram. .......................................................................................................................................[1] (iii) Complete the sentence. The lowest price of platinum was ............ USD in January 20............... and the highest price of platinum was ............ USD in January 20............... . [2] (iv) Suggest why companies invest in platinum mining. ........................................................................................................................................... ........................................................................................................................................... ........................................................................................................................................... .......................................................................................................................................[2] (b) The Great Dyke, shown on the map on page 2, was formed from magma 2.5 billion years ago. It is 550 km long and between 3 and 12 km wide. The dyke is rich in minerals. (i) Suggest the type of rock that formed the Great Dyke. .......................................................................................................................................[1] (ii) Suggest how the Great Dyke intrusion formed 2.5 billion years ago. ........................................................................................................................................... ........................................................................................................................................... ........................................................................................................................................... .......................................................................................................................................[2] (c) As a result of mining activity in Zimbabwe water pollution is a problem. A scientist took water samples from a river flowing through a mining area. The table shows the chemical analysis of the water samples at different distances into the mining area. distance into the mining pH sulfate / ppm nickel / ppm cobalt / ppm copper / ppm area / m 0 7.1 55 0.30 0.10 0.10 200 6.4 100 1.00 0.10 0.30 400 6.3 100 1.50 0.10 0.52 600 6.1 160 2.20 0.10 0.78 800 4.3 250 2.89 0.10 0.88 1000 3.4 310 3.15 0.10 0.98 ppm = parts per million (i) Describe the pattern of results in the mining area, between 0 and 1000 m, for pH and cobalt. pH ...................................................................................................................................... ........................................................................................................................................... cobalt ................................................................................................................................. ........................................................................................................................................... [2] (ii) Calculate the range of copper concentration between 0 and 1000 m. ................................................... ppm [1] (iii) There were no living organisms in the river at 1000 m into the mining area. Explain why. ........................................................................................................................................... ........................................................................................................................................... ........................................................................................................................................... ........................................................................................................................................... ........................................................................................................................................... .......................................................................................................................................[3] (iv) The table shows climate data from a weather station located near the mining area. month Jan Feb Mar Apr May Jun Jul Aug Sep Oct Nov Dec average 22 22 21 20 16 14 14 16 19 21 22 22temperature / °C rainfall / mm 142 109 84 18 10 3 0 0 5 20 81 122 The scientist predicted that the concentrations of sulfate, nickel and copper in the river would be different in September and January. Suggest reasons why. ........................................................................................................................................... ........................................................................................................................................... ........................................................................................................................................... ........................................................................................................................................... ........................................................................................................................................... .......................................................................................................................................[3] (d) The scientist noticed that there were only a few plants growing near the mining waste dumps. The scientist carried out a survey of plants along a transect line near a mining waste dump. mining waste dump 0 10 20 30 40 50 60 70 80 90 100 m The table shows the results. distance from mining 0 10 20 30 40 50 60 70 80 90 100 waste dump / m total number 0 1 2 3 4 6 8 10 13 13 13 of plants number of plant 0 1 1 2 1 2 2 4 4 4 4 species (i) Describe the patterns of results for the total number of plants and the number of plant species between 0–60 m and 70–100 m. total number of plants 0–60 m ............................................................................................................................... ........................................................................................................................................... 70–100 m ........................................................................................................................... ........................................................................................................................................... number of plant species 0–60 m ............................................................................................................................... ........................................................................................................................................... 70–100 m ........................................................................................................................... ........................................................................................................................................... [4] The scientist left a large stake at 0 m and a large stake at 100 m. The scientist repeated the survey of the plants along the same transect line between the stakes at a different time of year. The table shows the results. distance from mining 0 10 20 30 40 50 60 70 80 90 100 waste dump / m total number 0 2 3 5 7 8 11 15 20 21 19 of plants number of plant 0 1 1 2 1 2 3 5 5 5 5 species (ii) Describe the changes in the plants along the transect line between the first and second survey. ........................................................................................................................................... ........................................................................................................................................... ........................................................................................................................................... ........................................................................................................................................... ........................................................................................................................................... ........................................................................................................................................... ........................................................................................................................................... .......................................................................................................................................[4] (iii) Suggest reasons for the differences shown by the second survey. ........................................................................................................................................... ........................................................................................................................................... ........................................................................................................................................... .......................................................................................................................................[2] (iv) The scientist could not draw a conclusion about the biodiversity near the mining waste dumps. Describe more surveys the scientist should carry out before deciding how much plant biodiversity is being damaged by the mining waste dumps. ........................................................................................................................................... ........................................................................................................................................... ........................................................................................................................................... ........................................................................................................................................... ........................................................................................................................................... .......................................................................................................................................[3] (v) Explain how growing plants on top of a mining waste dump reduces the spread of chemical pollutants. ........................................................................................................................................... ........................................................................................................................................... ........................................................................................................................................... ........................................................................................................................................... ........................................................................................................................................... .......................................................................................................................................[3] (e) Most of the mineral ores mined in Zimbabwe are exported to South Africa to be refined before being sold on the world market. The government of Zimbabwe plans to encourage companies to build refining plants in Zimbabwe. (i) Suggest how the government of Zimbabwe could encourage companies to build refining plants. ........................................................................................................................................... .......................................................................................................................................[1] (ii) Describe three advantages to Zimbabwe of these plans. 1 ......................................................................................................................................... ........................................................................................................................................... 2 ......................................................................................................................................... ........................................................................................................................................... 3 ......................................................................................................................................... ........................................................................................................................................... [3]
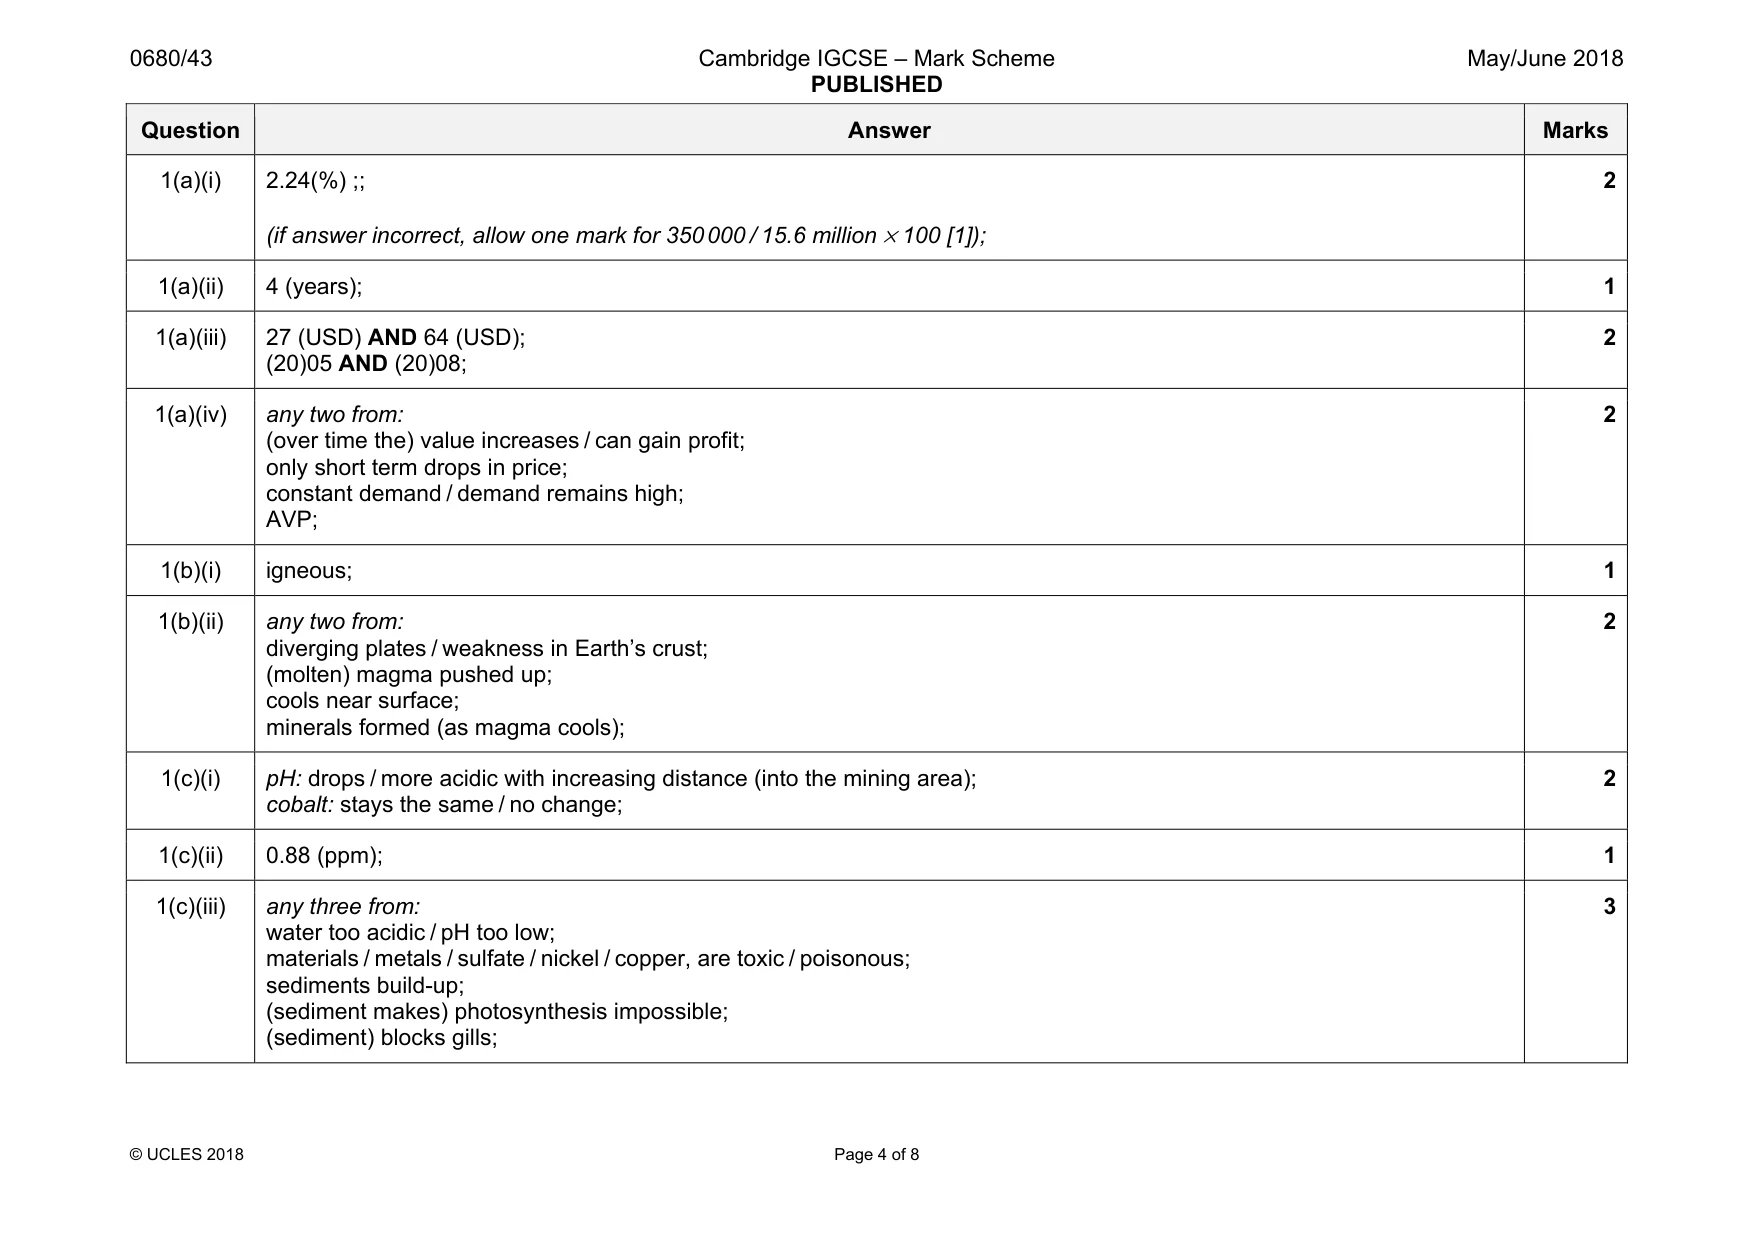
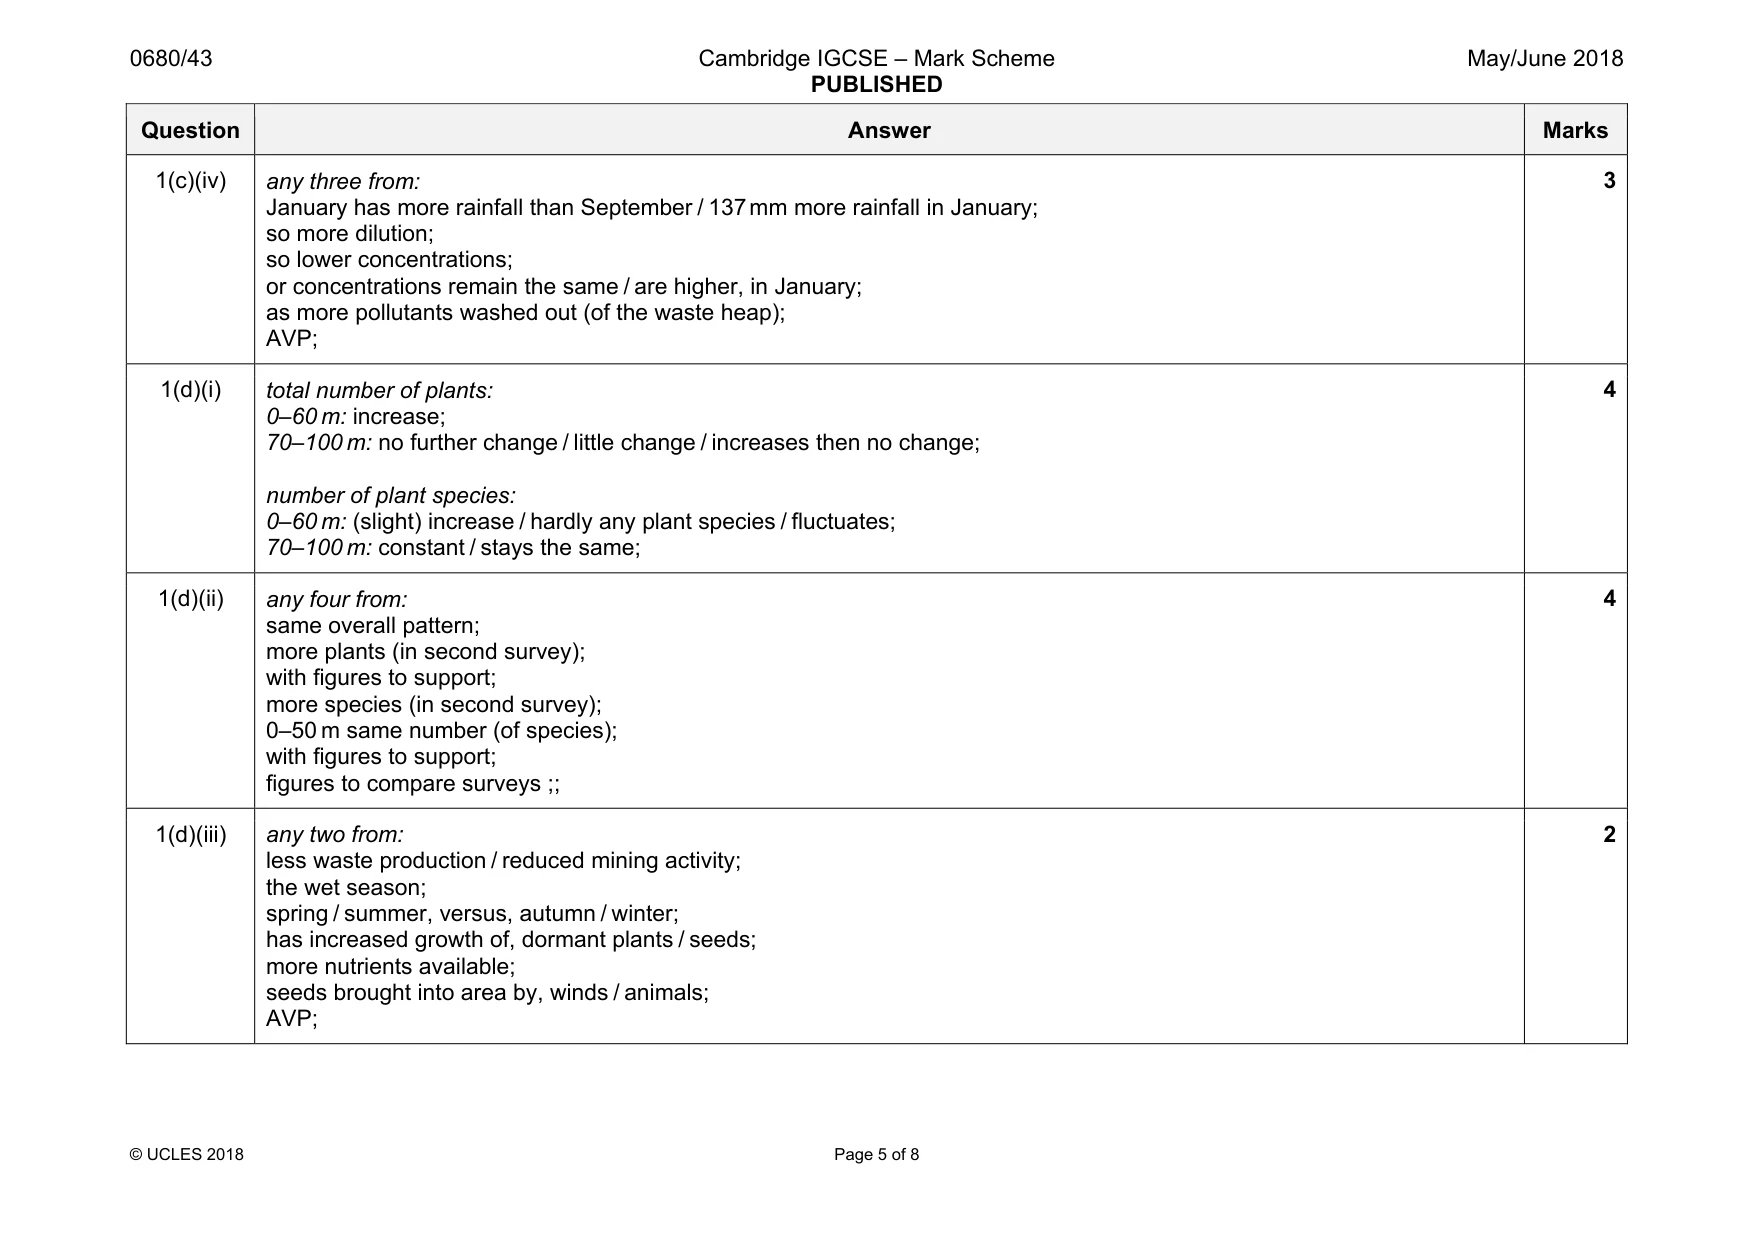
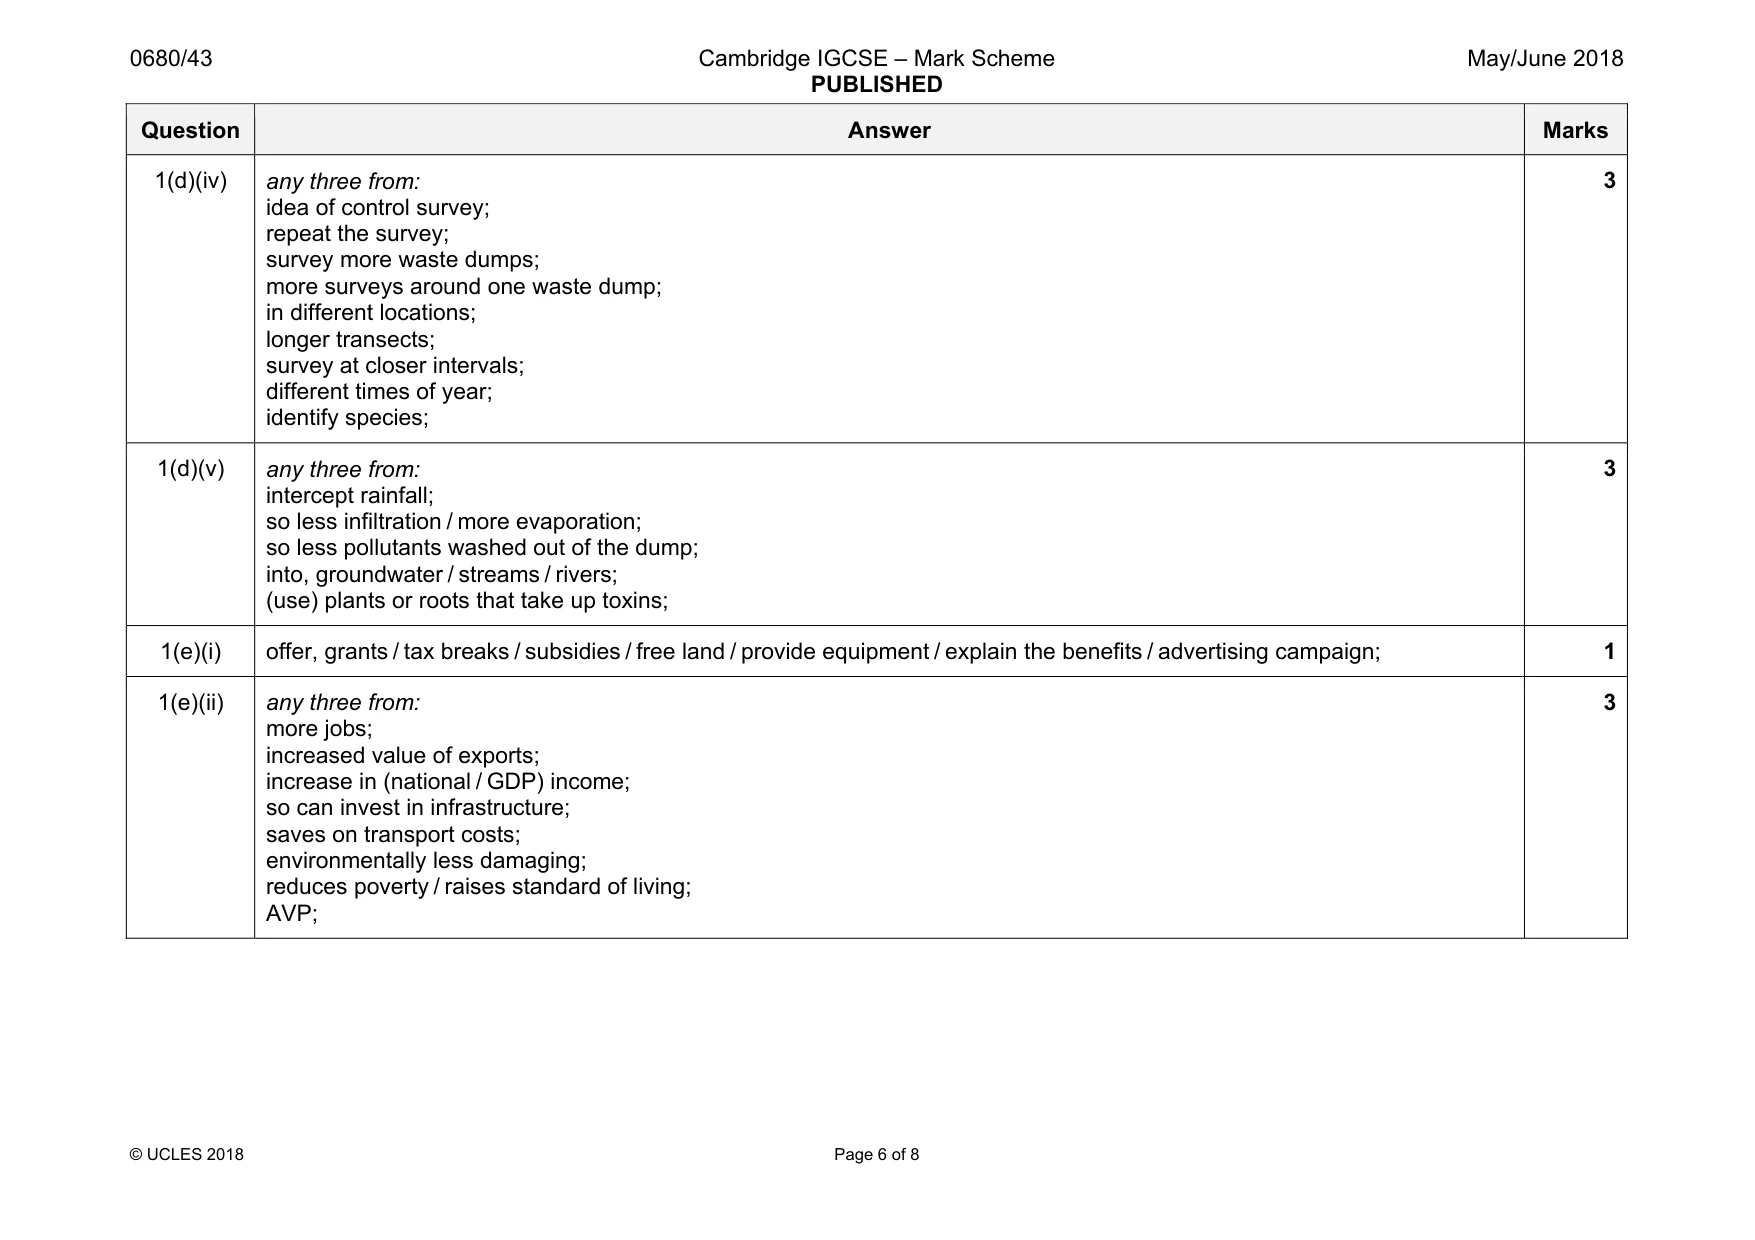
Mark scheme: 1(a)(i) 2.24(%) ;; (if answer incorrect, allow one mark for 350000 / 15.6 million × 100 [1]); 2 1(a)(ii) 4 (years); 1 1(a)(iii) 27 (USD) AND 64 (USD); (20)05 AND (20)08; 2 1(a)(iv) any two from: (over time the) value increases / can gain profit; only short term drops in price; constant demand / demand remains high; AVP; 2 1(b)(i) igneous; 1 1(b)(ii) any two from: diverging plates / weakness in Earth’s crust; (molten) magma pushed up; cools near surface; minerals formed (as magma cools); 2 1(c)(i) pH: drops / more acidic with increasing distance (into the mining area); cobalt: stays the same / no change; 2 1(c)(ii) 0.88 (ppm); 1 1(c)(iii) any three from: water too acidic / pH too low; materials / metals / sulfate / nickel / copper, are toxic / poisonous; sediments build-up; (sediment makes) photosynthesis impossible; (sediment) blocks gills; 3 Question Answer Marks 1(c)(iv) any three from: January has more rainfall than September / 137 mm more rainfall in January; so more dilution; so lower concentrations; or concentrations remain the same / are higher, in January; as more pollutants washed out (of the waste heap); AVP; 3 1(d)(i) total number of plants: 0–60 m: increase; 70–100 m: no further change / little change / increases then no change; number of plant species: 0–60 m: (slight) increase / hardly any plant species / fluctuates; 70–100 m: constant / stays the same; 4 1(d)(ii) any four from: same overall pattern; more plants (in second survey); with figures to support; more species (in second survey); 0–50 m same number (of species); with figures to support; figures to compare surveys ;; 4 1(d)(iii) any two from: less waste production / reduced mining activity; the wet season; spring / summer, versus, autumn / winter; has increased growth of, dormant plants / seeds; more nutrients available; seeds brought into area by, winds / animals; AVP; 2 Question Answer Marks 1(d)(iv) any three from: idea of control survey; repeat the survey; survey more waste dumps; more surveys around one waste dump; in different locations; longer transects; survey at closer intervals; different times of year; identify species; 3 1(d)(v) any three from: intercept rainfall; so less infiltration / more evaporation; so less pollutants washed out of the dump; into, groundwater / streams / rivers; (use) plants or roots that take up toxins; 3 1(e)(i) offer, grants / tax breaks / subsidies / free land / provide equipment / explain the benefits / advertising campaign; 1 1(e)(ii) any three from: more jobs; increased value of exports; increase in (national / GDP) income; so can invest in infrastructure; saves on transport costs; environmentally less damaging; reduces poverty / raises standard of living; AVP; 3
Q2 · Many people buy a licence from the government of Zimbabwe and start small mines
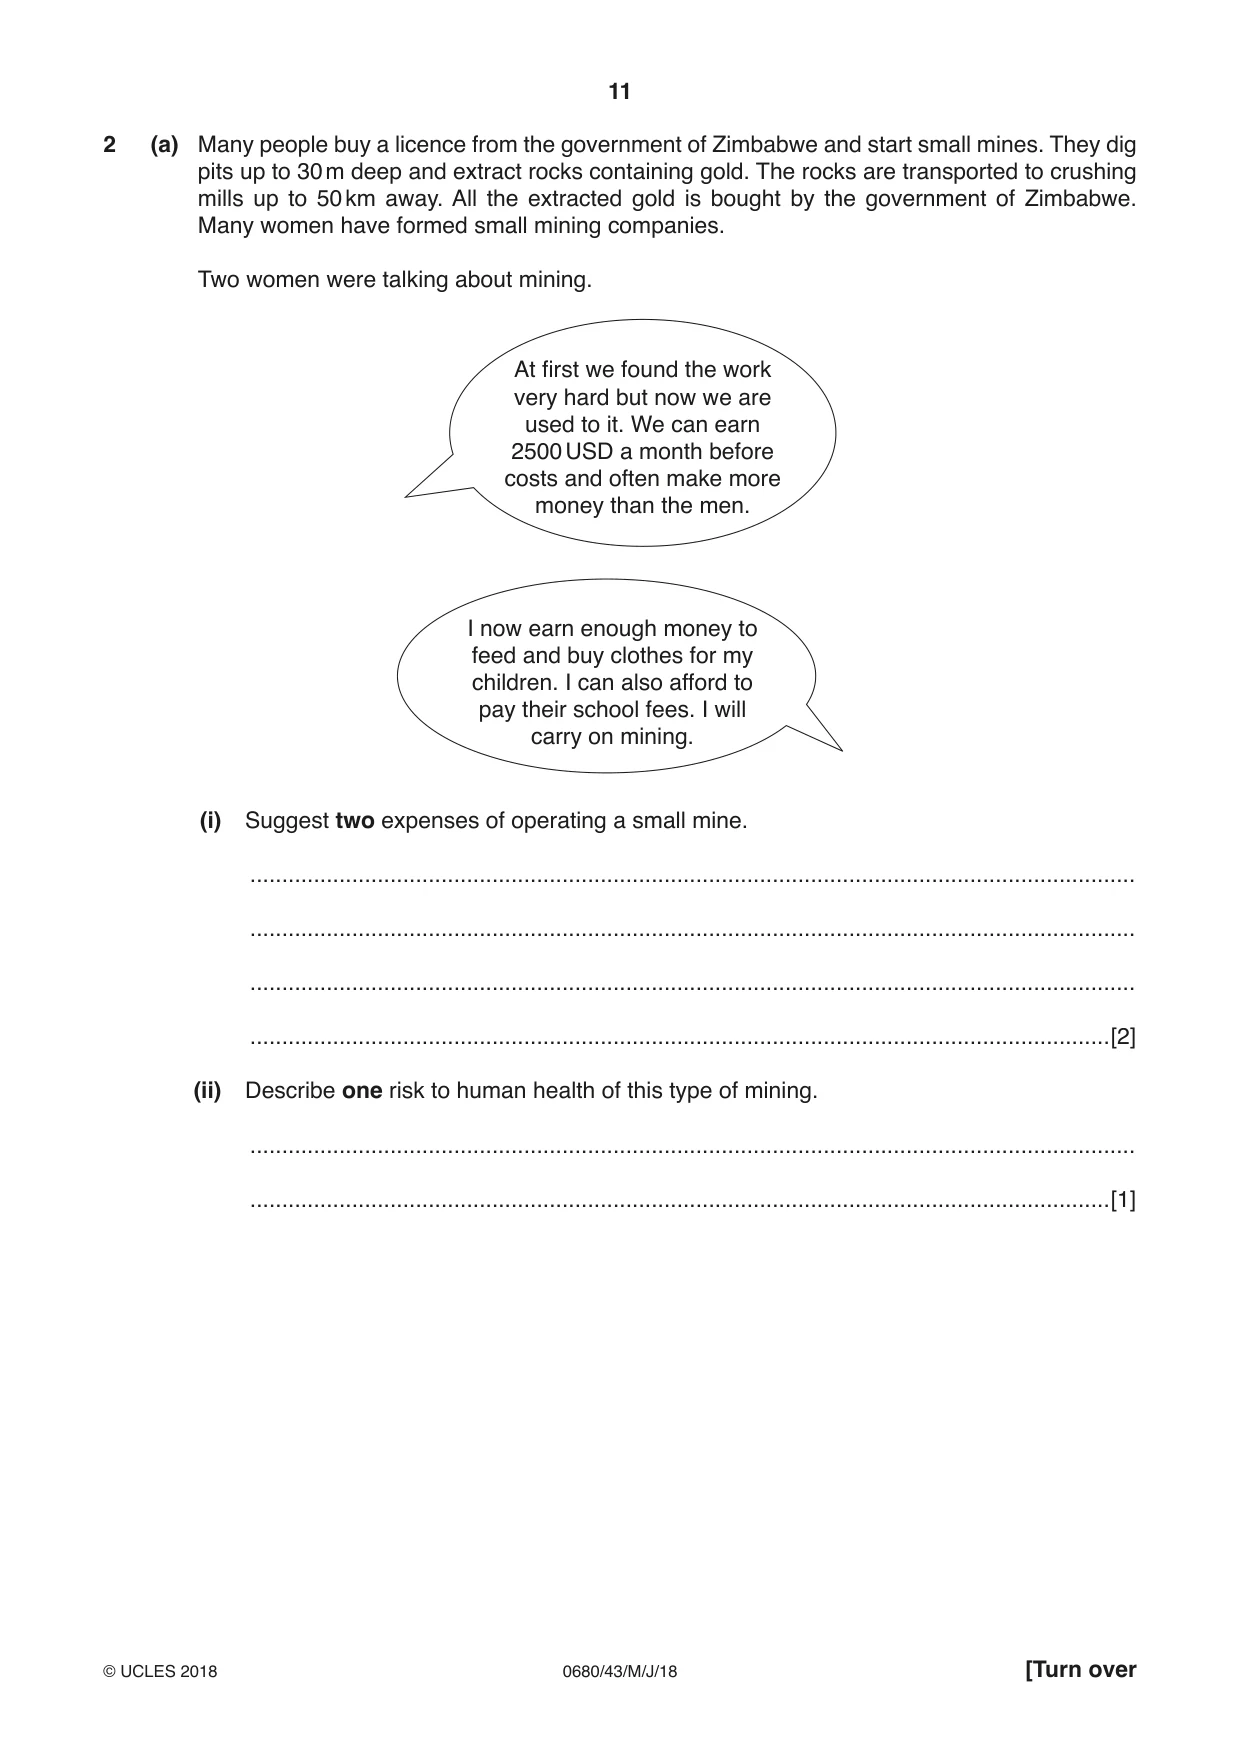
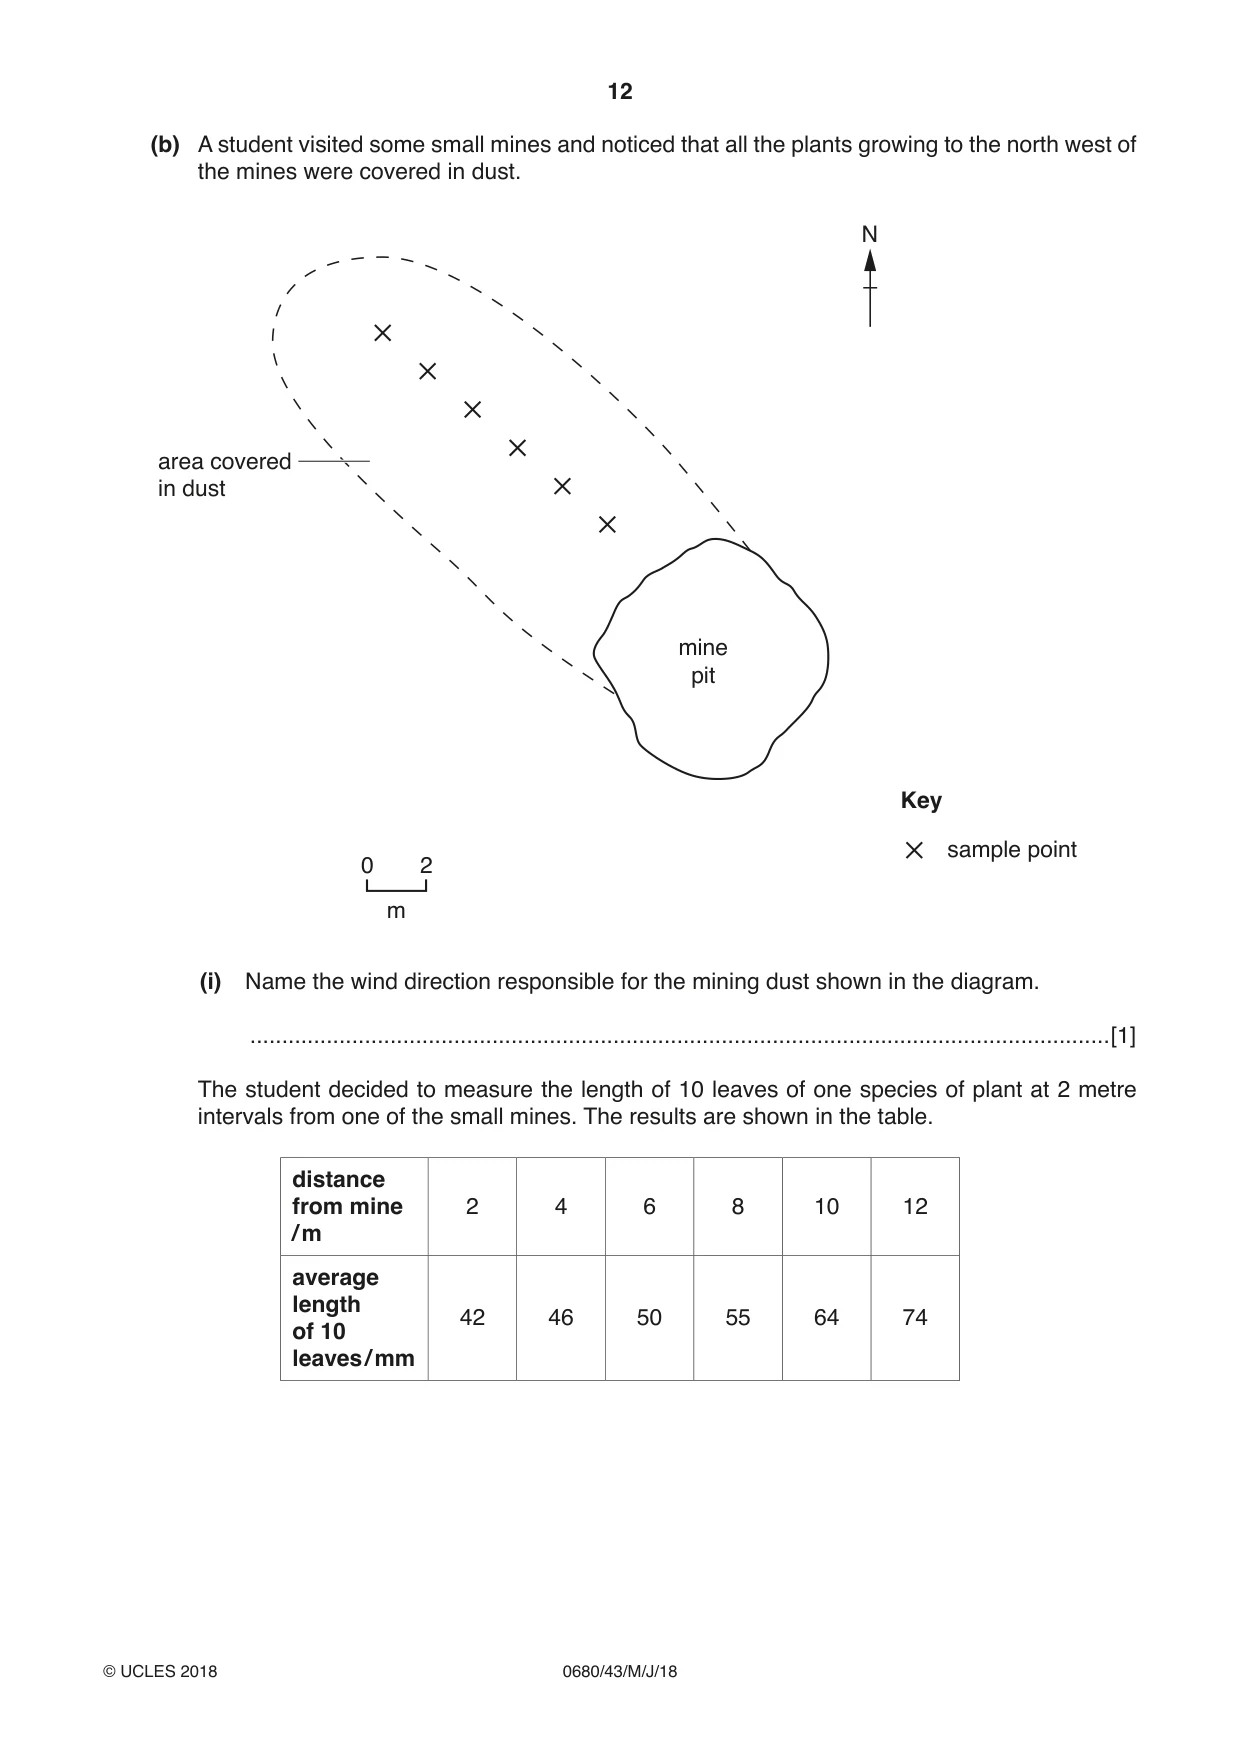
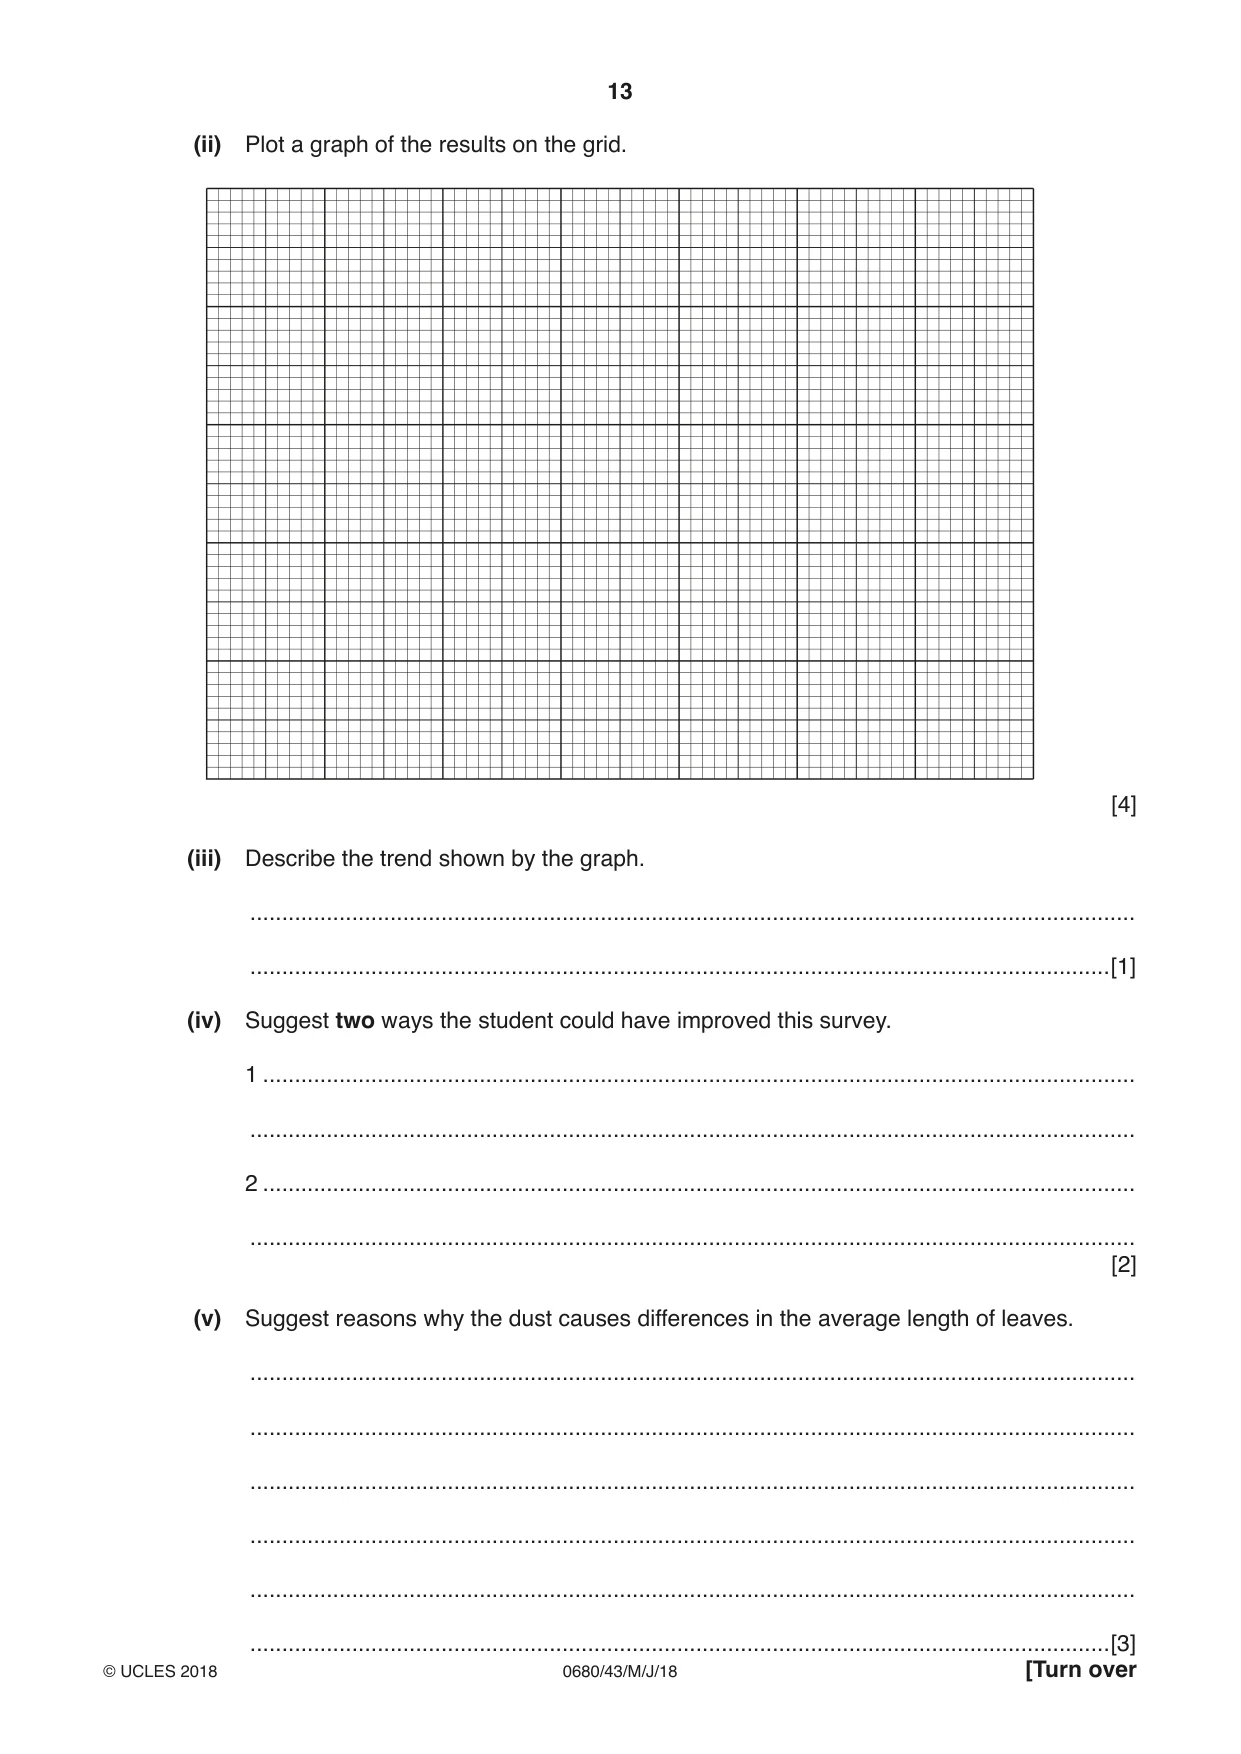
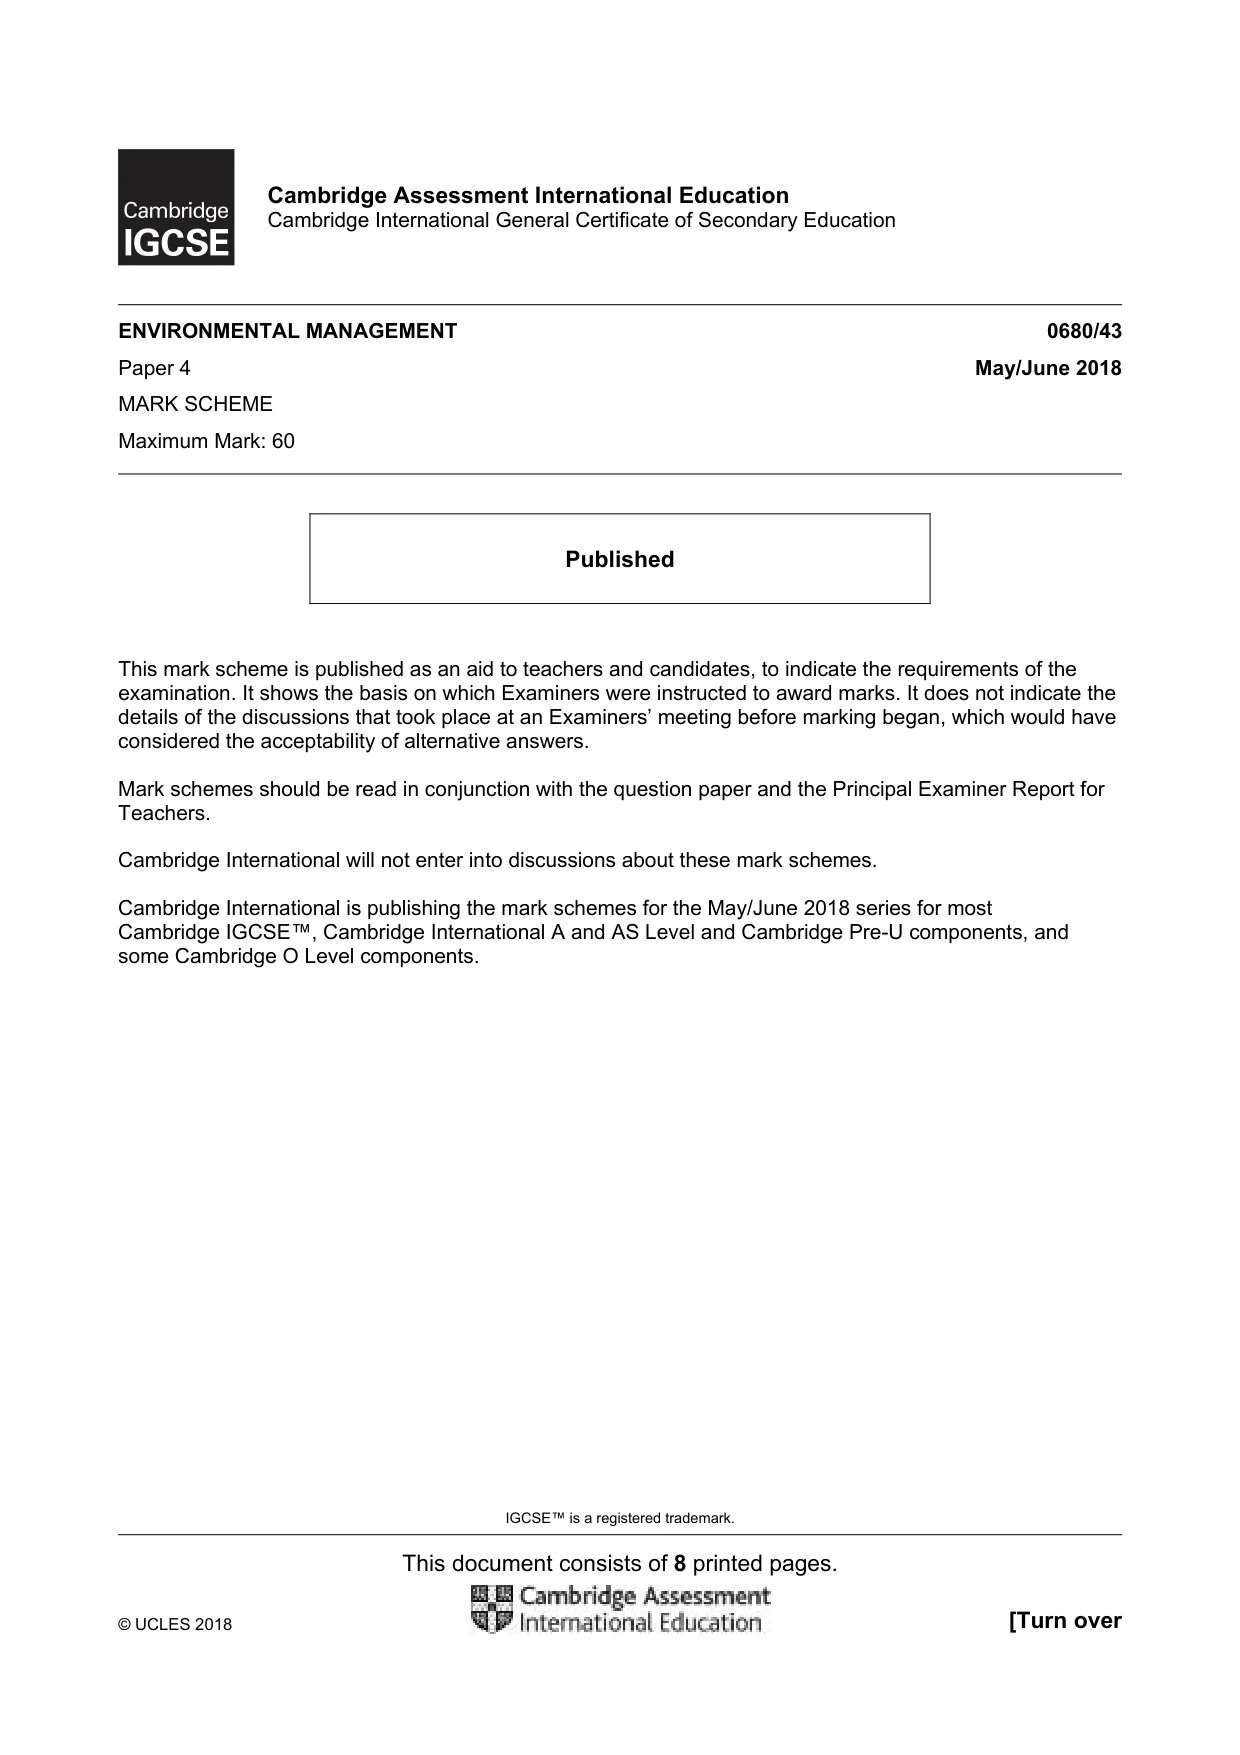
2 (a) Many people buy a licence from the government of Zimbabwe and start small mines. They dig pits up to 30 m deep and extract rocks containing gold. The rocks are transported to crushing mills up to 50 km away. All the extracted gold is bought by the government of Zimbabwe. Many women have formed small mining companies. Two women were talking about mining. At first we found the work very hard but now we are used to it. We can earn 2500 USD a month before costs and often make more money than the men. I now earn enough money to feed and buy clothes for my children. I can also afford to pay their school fees. I will carry on mining. (i) Suggest two expenses of operating a small mine. ........................................................................................................................................... ........................................................................................................................................... ........................................................................................................................................... .......................................................................................................................................[2] (ii) Describe one risk to human health of this type of mining. ........................................................................................................................................... .......................................................................................................................................[1] (b) A student visited some small mines and noticed that all the plants growing to the north west of the mines were covered in dust. N area covered in dust mine pit Key sample point 0 2 m (i) Name the wind direction responsible for the mining dust shown in the diagram. .......................................................................................................................................[1] The student decided to measure the length of 10 leaves of one species of plant at 2 metre intervals from one of the small mines. The results are shown in the table. distance from mine 2 4 6 8 10 12 / m average length 42 46 50 55 64 74 of 10 leaves / mm (ii) Plot a graph of the results on the grid. [4] (iii) Describe the trend shown by the graph. ........................................................................................................................................... .......................................................................................................................................[1] (iv) Suggest two ways the student could have improved this survey. 1 ......................................................................................................................................... ........................................................................................................................................... 2 ......................................................................................................................................... ........................................................................................................................................... [2] (v) Suggest reasons why the dust causes differences in the average length of leaves. ........................................................................................................................................... ........................................................................................................................................... ........................................................................................................................................... ........................................................................................................................................... ...........................................................................................................................................
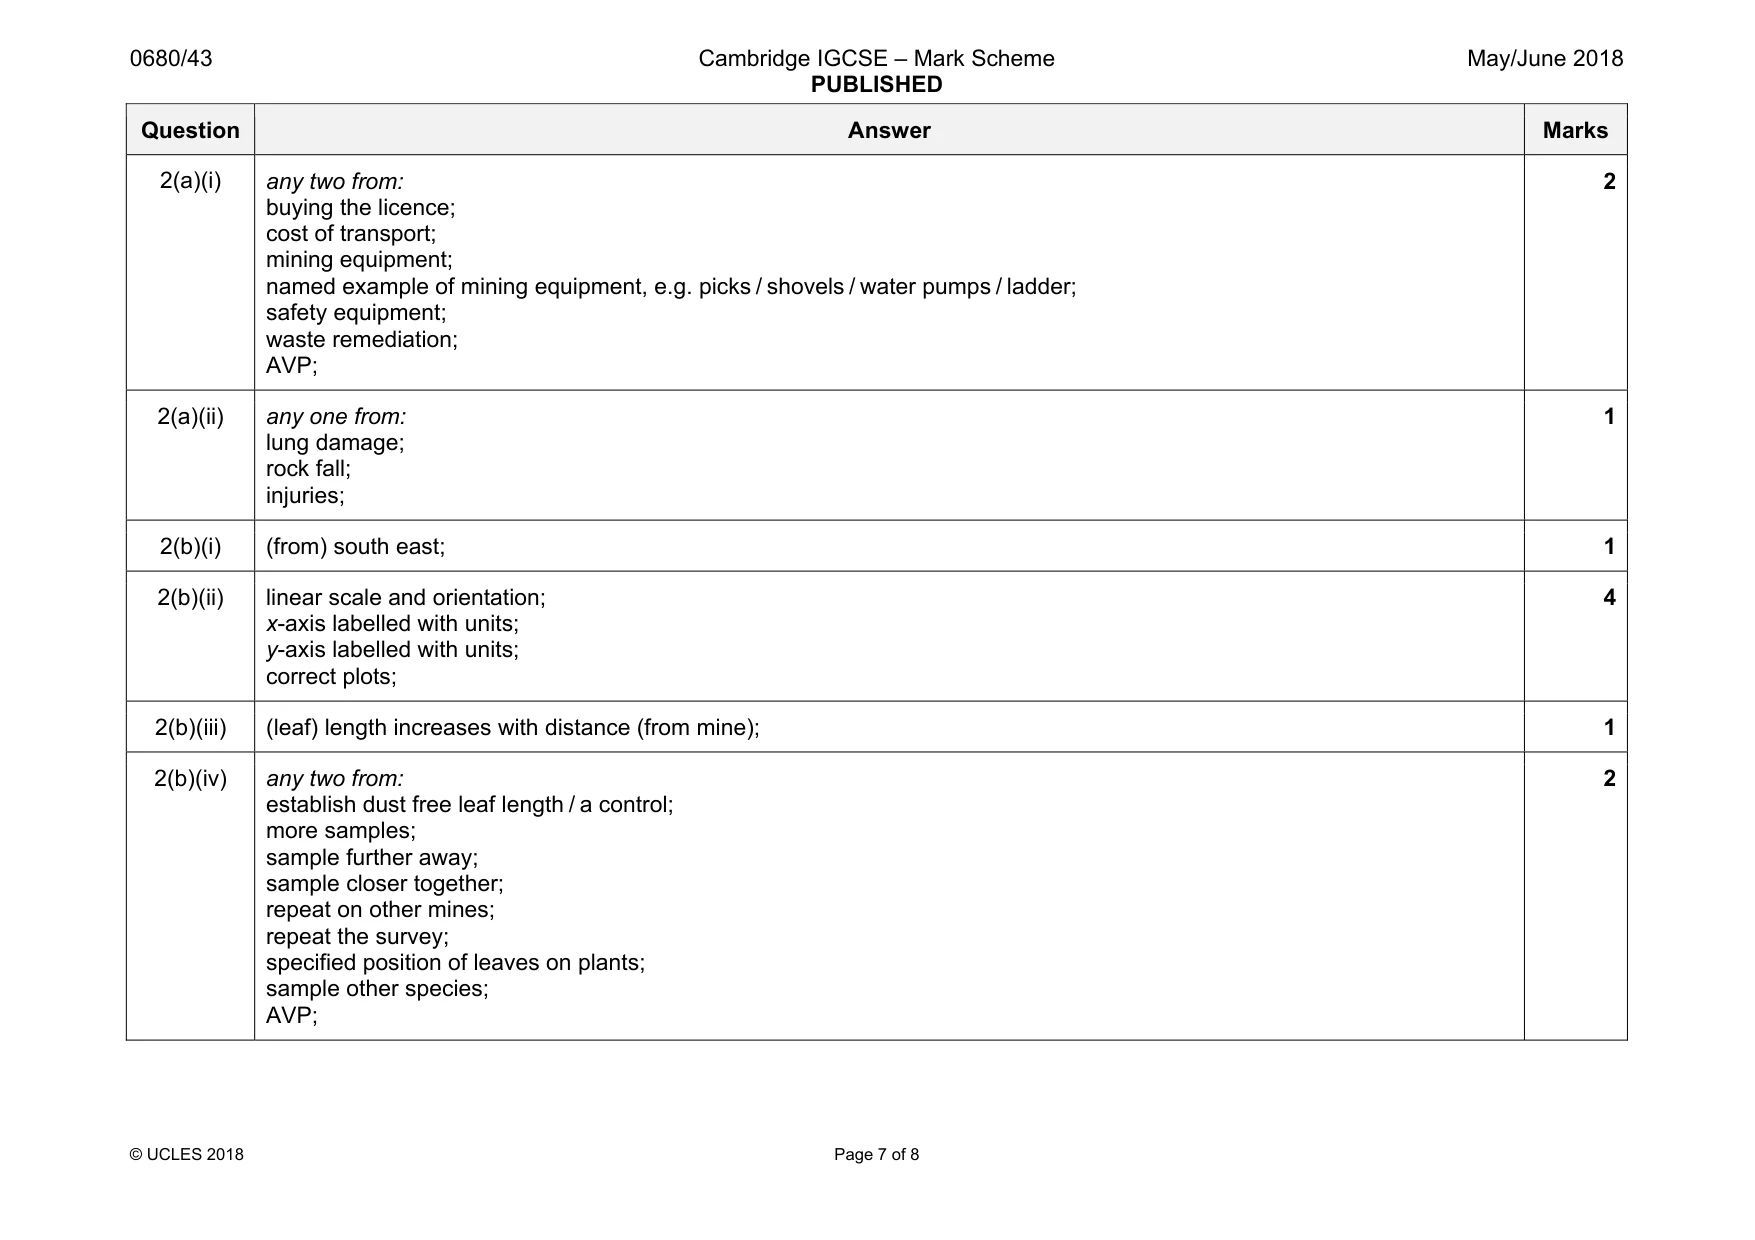
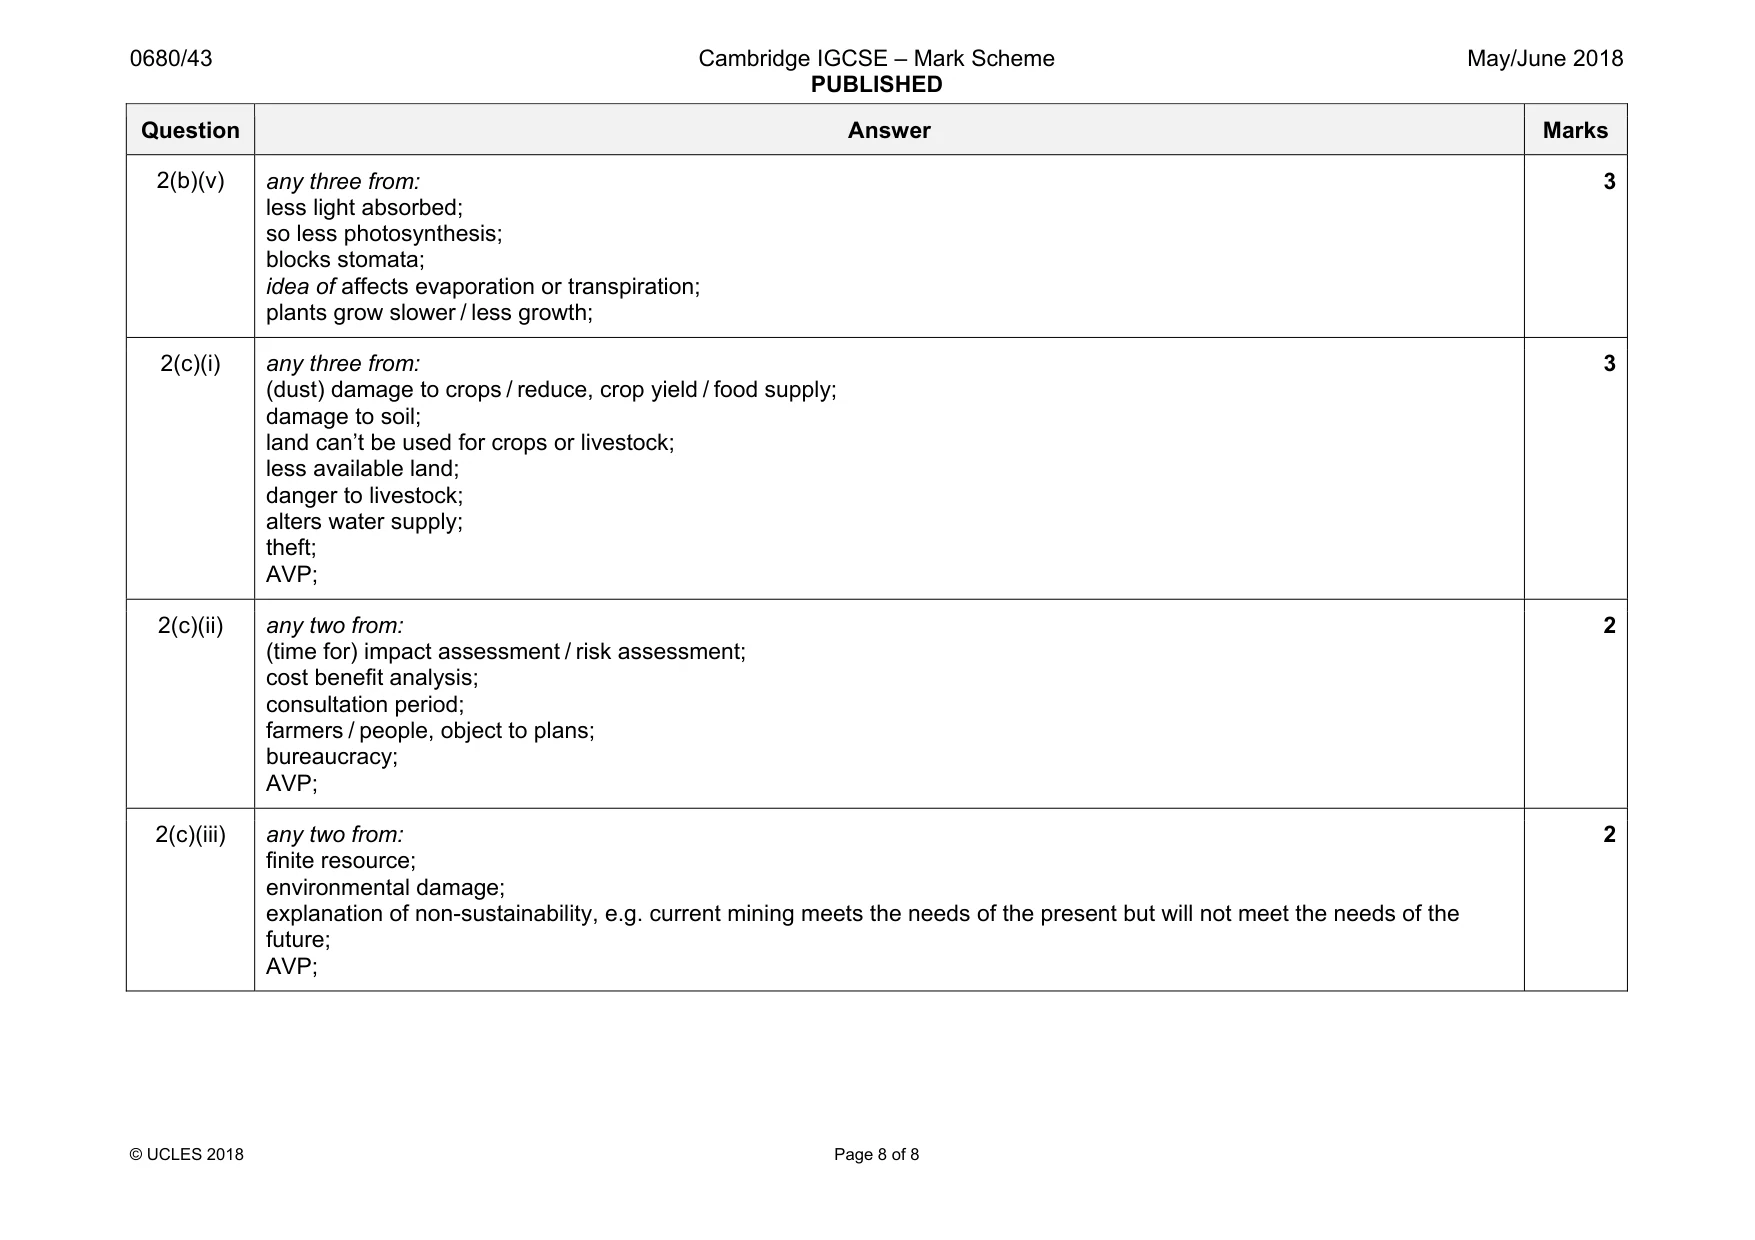
Mark scheme: 2(a)(i) any two from: buying the licence; cost of transport; mining equipment; named example of mining equipment, e.g. picks / shovels / water pumps / ladder; safety equipment; waste remediation; AVP; 2 2(a)(ii) any one from: lung damage; rock fall; injuries; 1 2(b)(i) (from) south east; 1 2(b)(ii) linear scale and orientation; x-axis labelled with units; y-axis labelled with units; correct plots; 4 2(b)(iii) (leaf) length increases with distance (from mine); 1 2(b)(iv) any two from: establish dust free leaf length / a control; more samples; sample further away; sample closer together; repeat on other mines; repeat the survey; specified position of leaves on plants; sample other species; AVP; 2 Question Answer Marks 2(b)(v) any three from: less light absorbed; so less photosynthesis; blocks stomata; idea of affects evaporation or transpiration; plants grow slower / less growth; 3 2(c)(i) any three from: (dust) damage to crops / reduce, crop yield / food supply; damage to soil; land can’t be used for crops or livestock; less available land; danger to livestock; alters water supply; theft; AVP; 3 2(c)(ii) any two from: (time for) impact assessment / risk assessment; cost benefit analysis; consultation period; farmers / people, object to plans; bureaucracy; AVP; 2 2(c)(iii) any two from: finite resource; environmental damage; explanation of non-sustainability, e.g. current mining meets the needs of the present but will not meet the needs of the future; AVP; 2
What was in this paper
The subtopics covered by these 2 questions, and how many questions each got. Open one in a new tab to see every Cambridge question on it.
What you needed in this session
Cambridge’s own grade thresholds for 2018 May/June, Paper 4 · Variant 3. A higher threshold means an easier paper — the bar moves with how the cohort did.