Cambridge IGCSE Environmental Management 0680 — 2018 Oct/Nov Paper 4 · Variant 3
0680/43/O/N/18 · 2 questions · 60 marks · ≈68 min
The question paper and its mark scheme, free to read here and free to download. This is Cambridge’s own paper, exactly as it was sat.
Question paper16 pages






Mark scheme7 pages
Answers below. Sit the paper first if you are practising.

Questions as text
Q1 · All the land in Tanzania is owned by the government
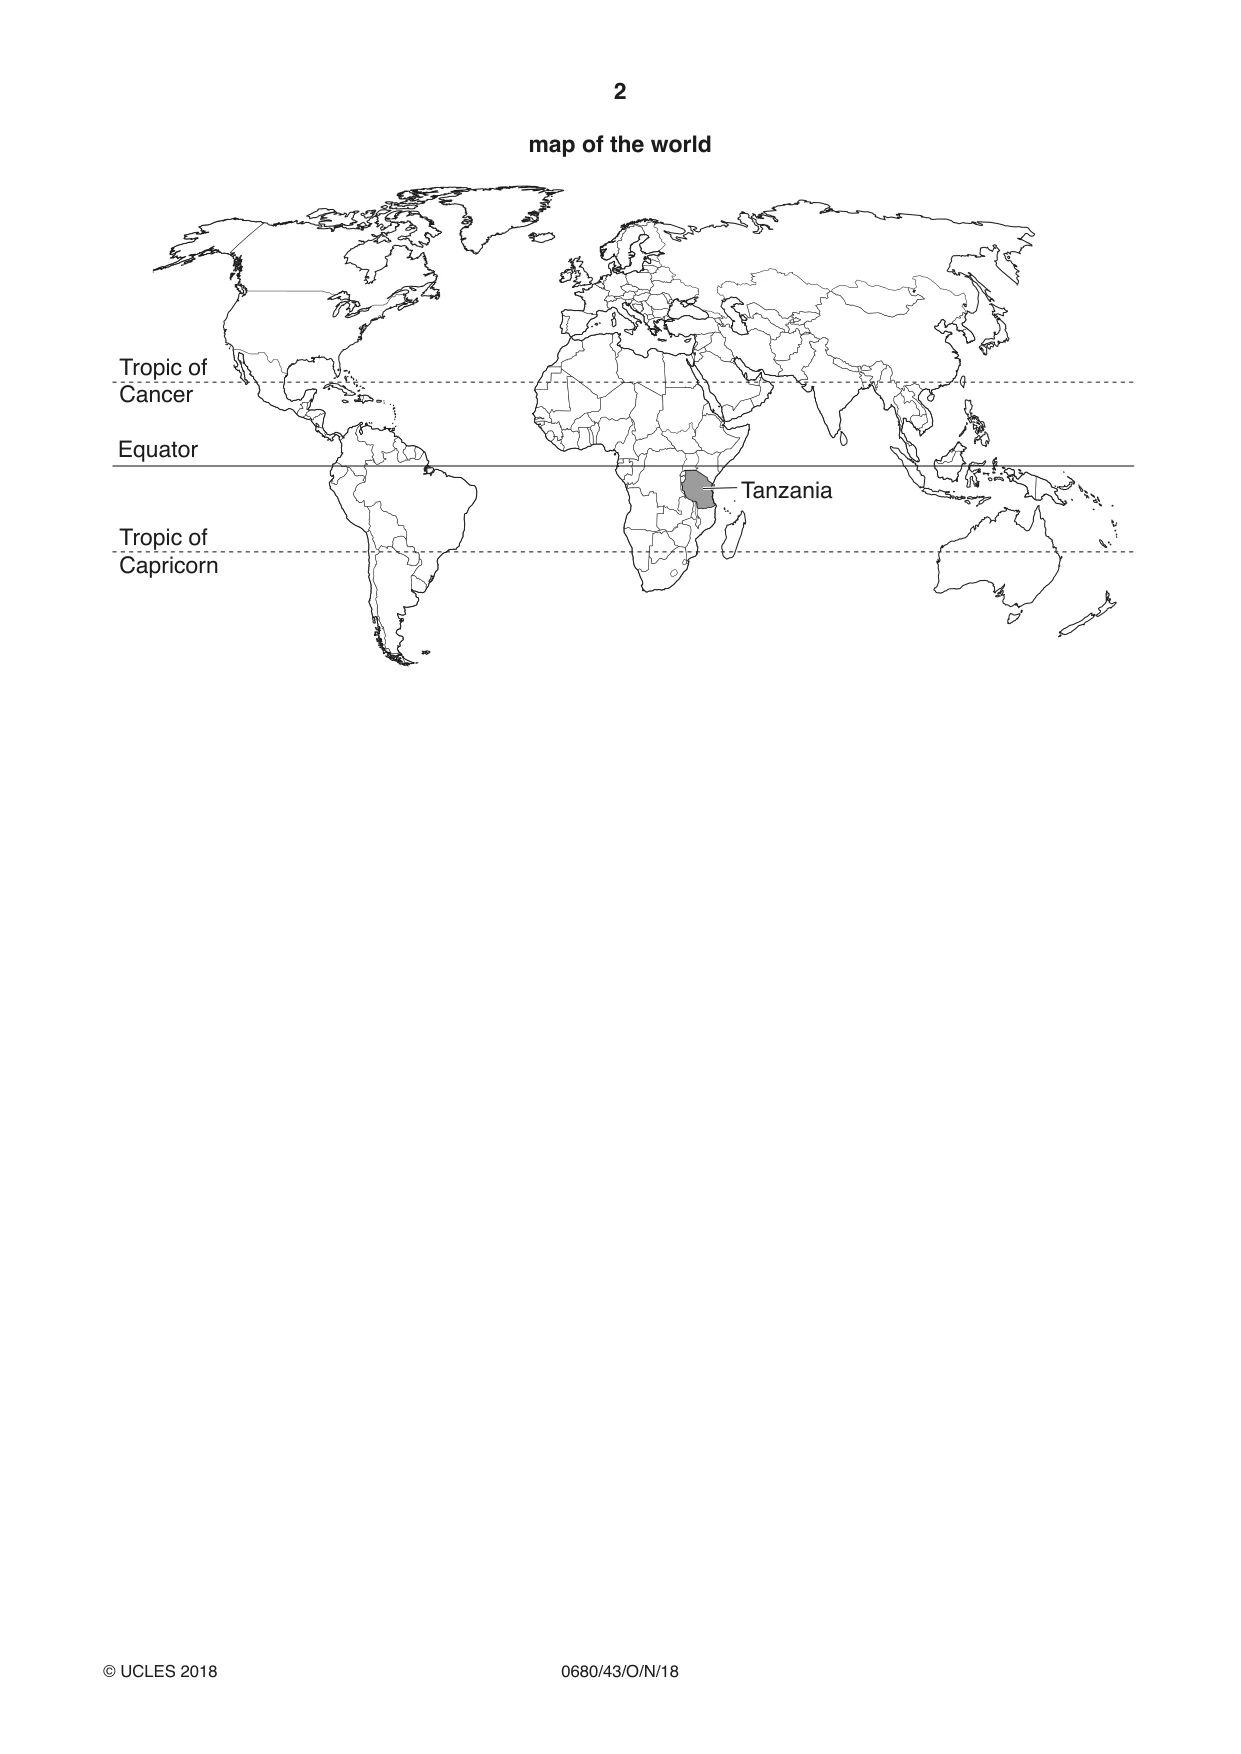
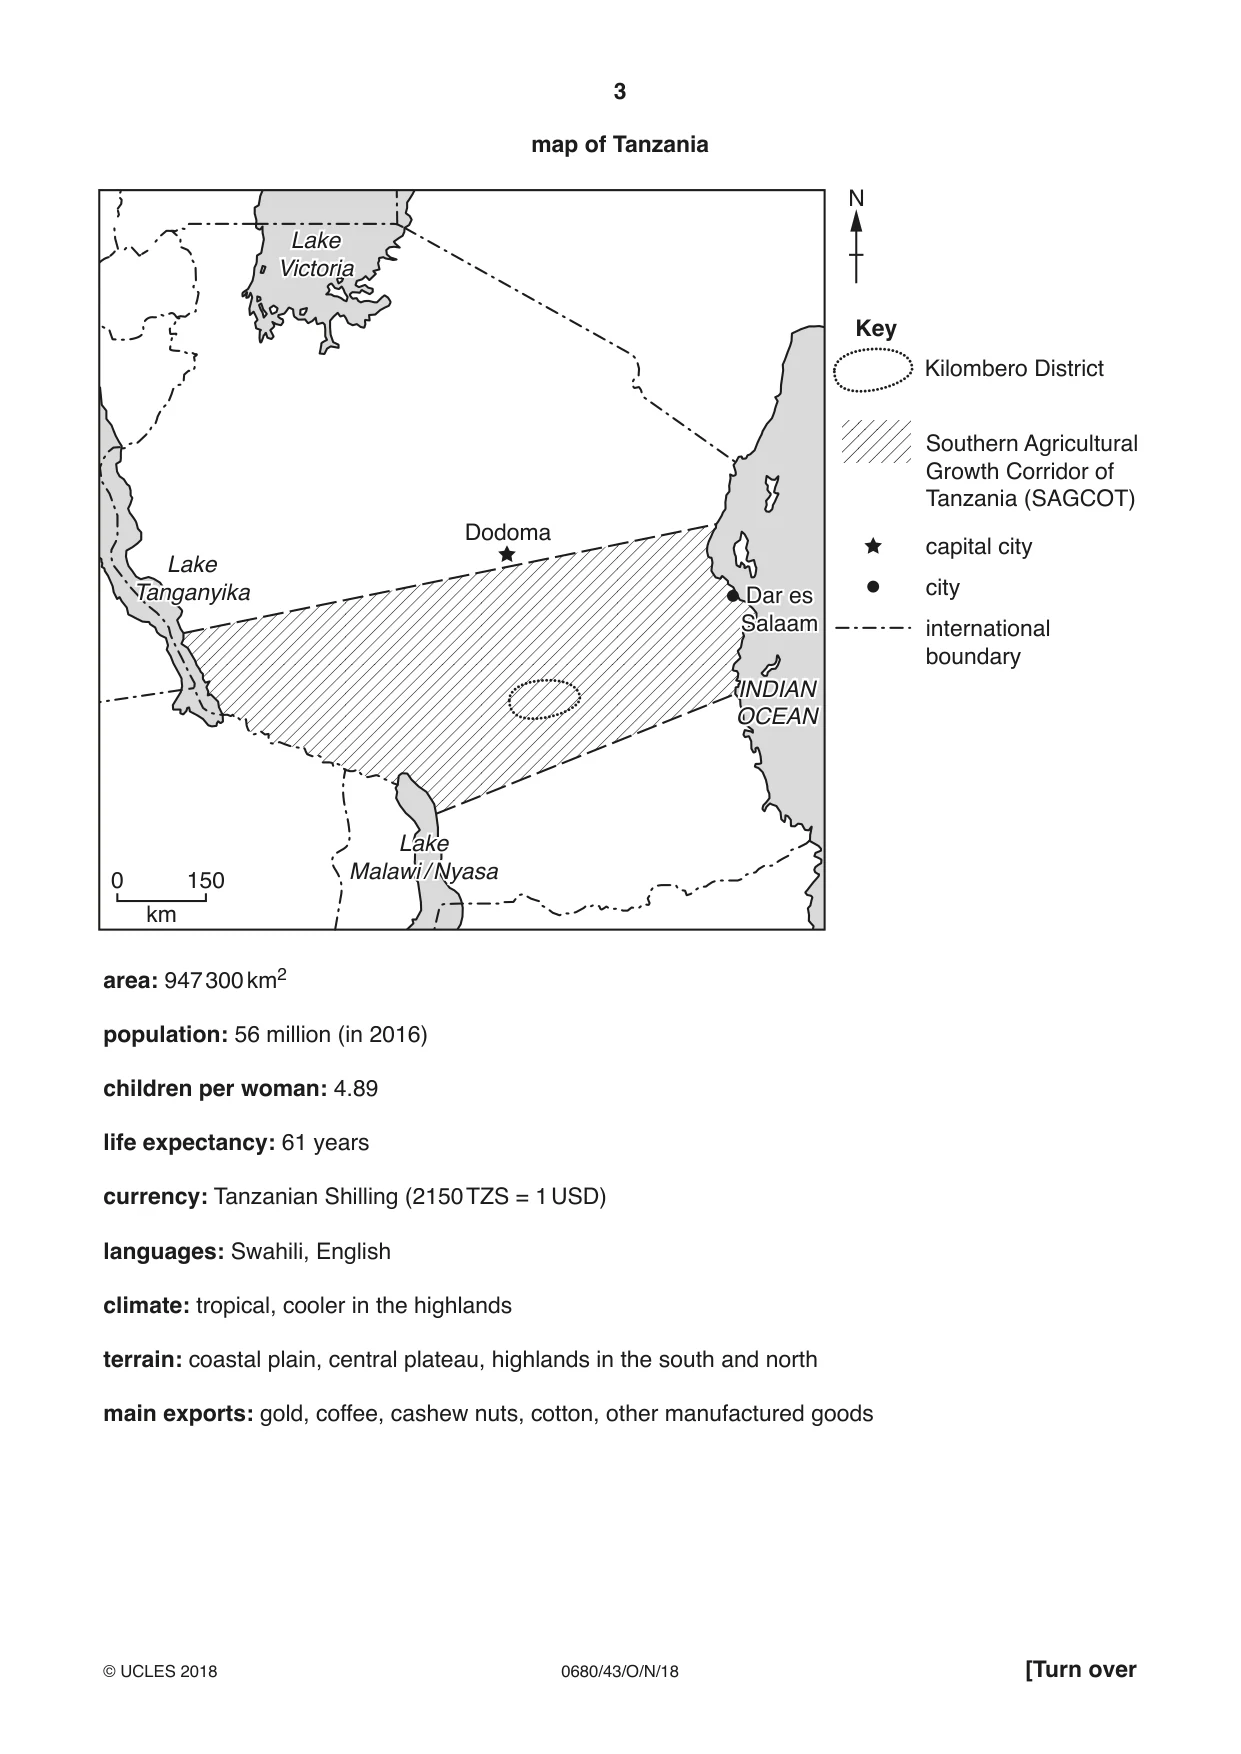
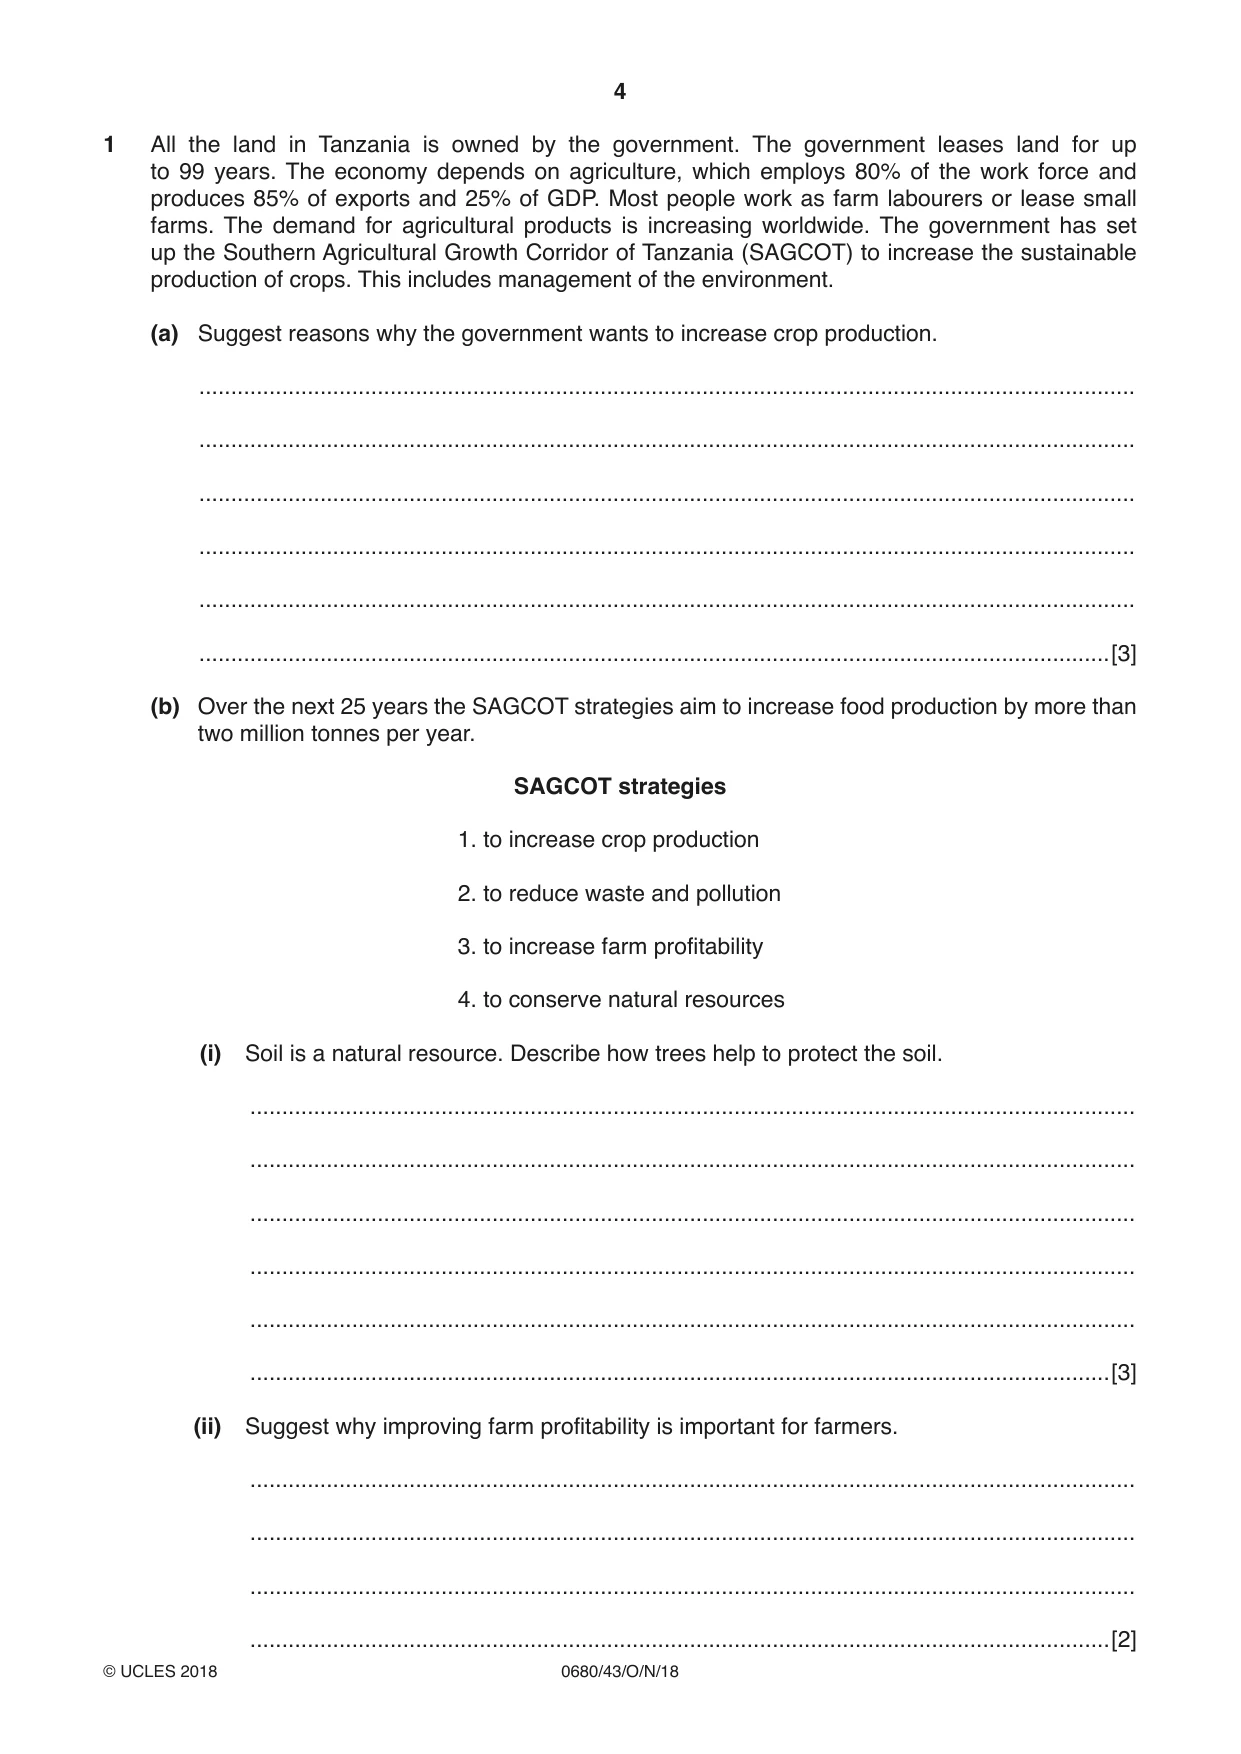
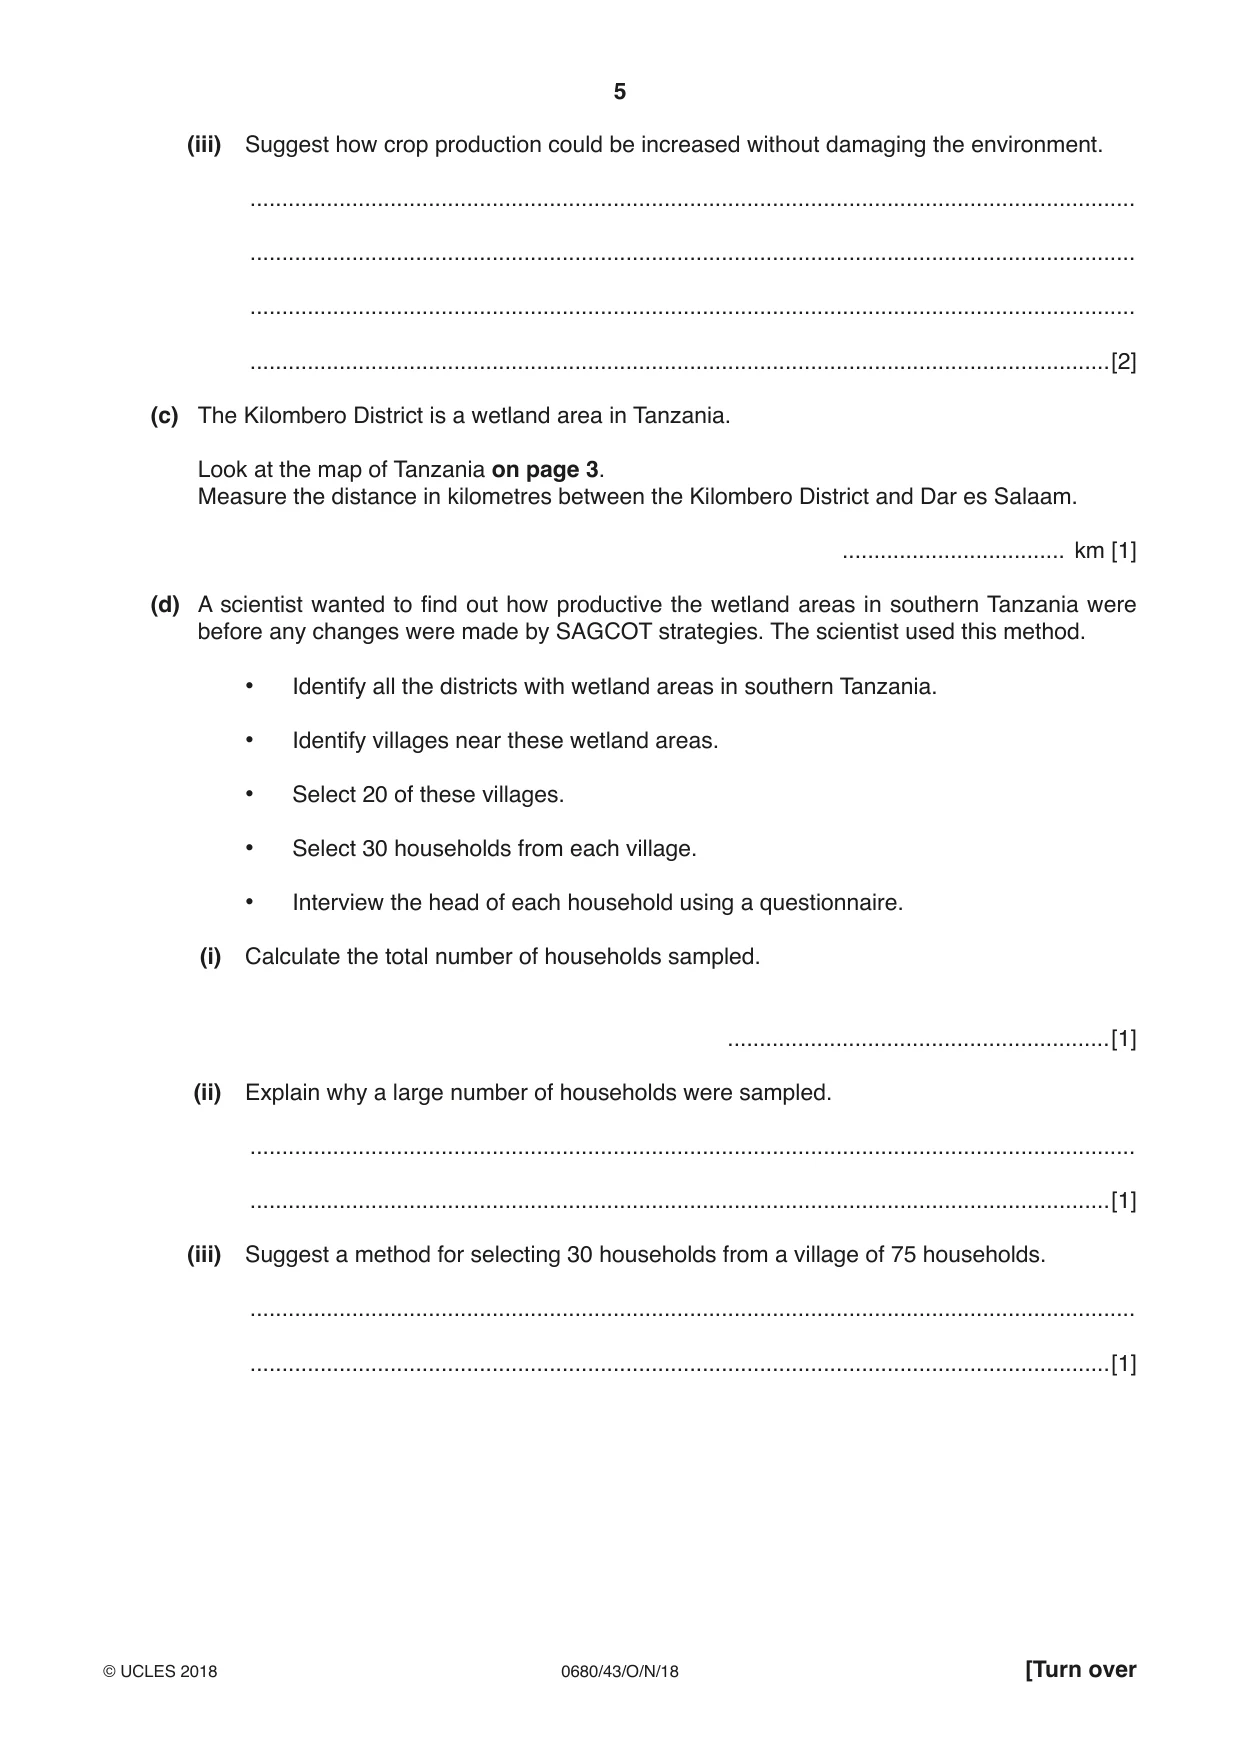
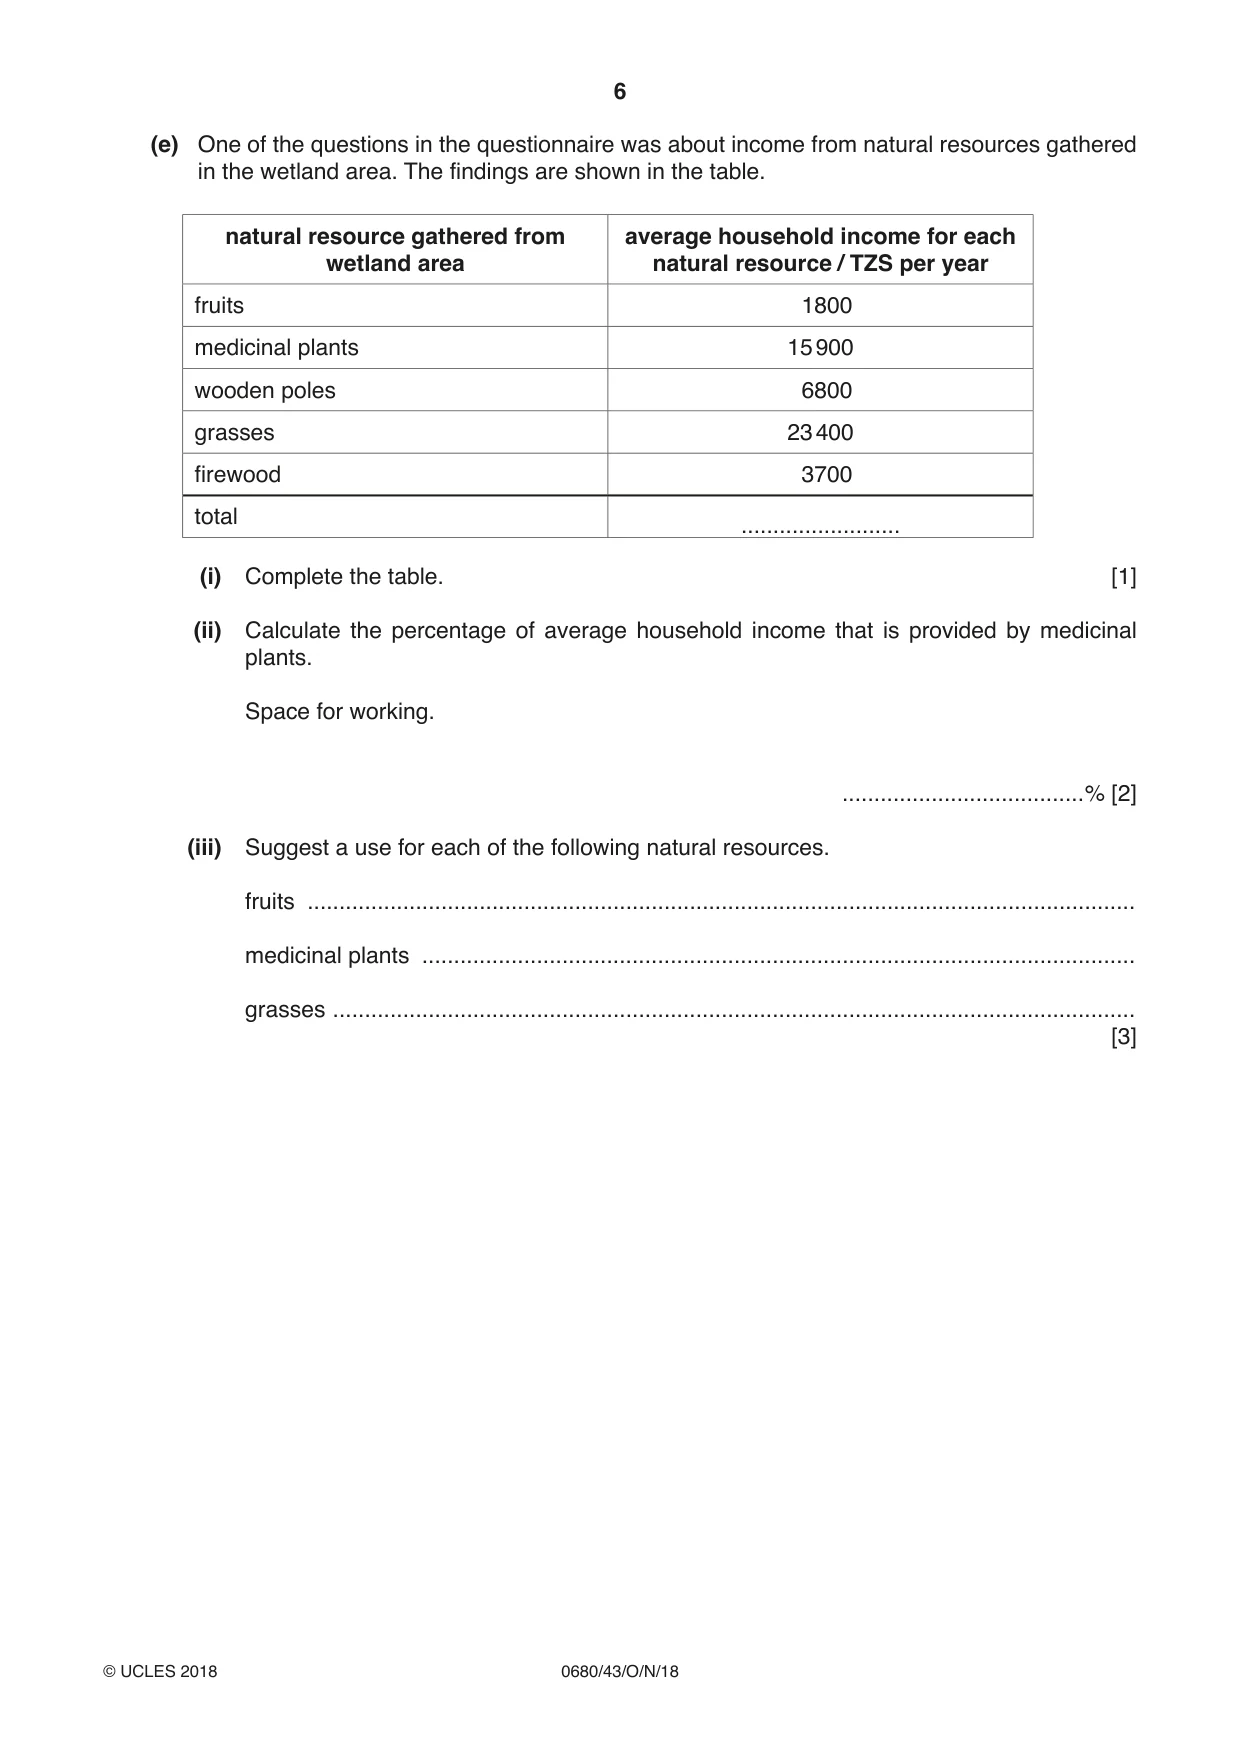
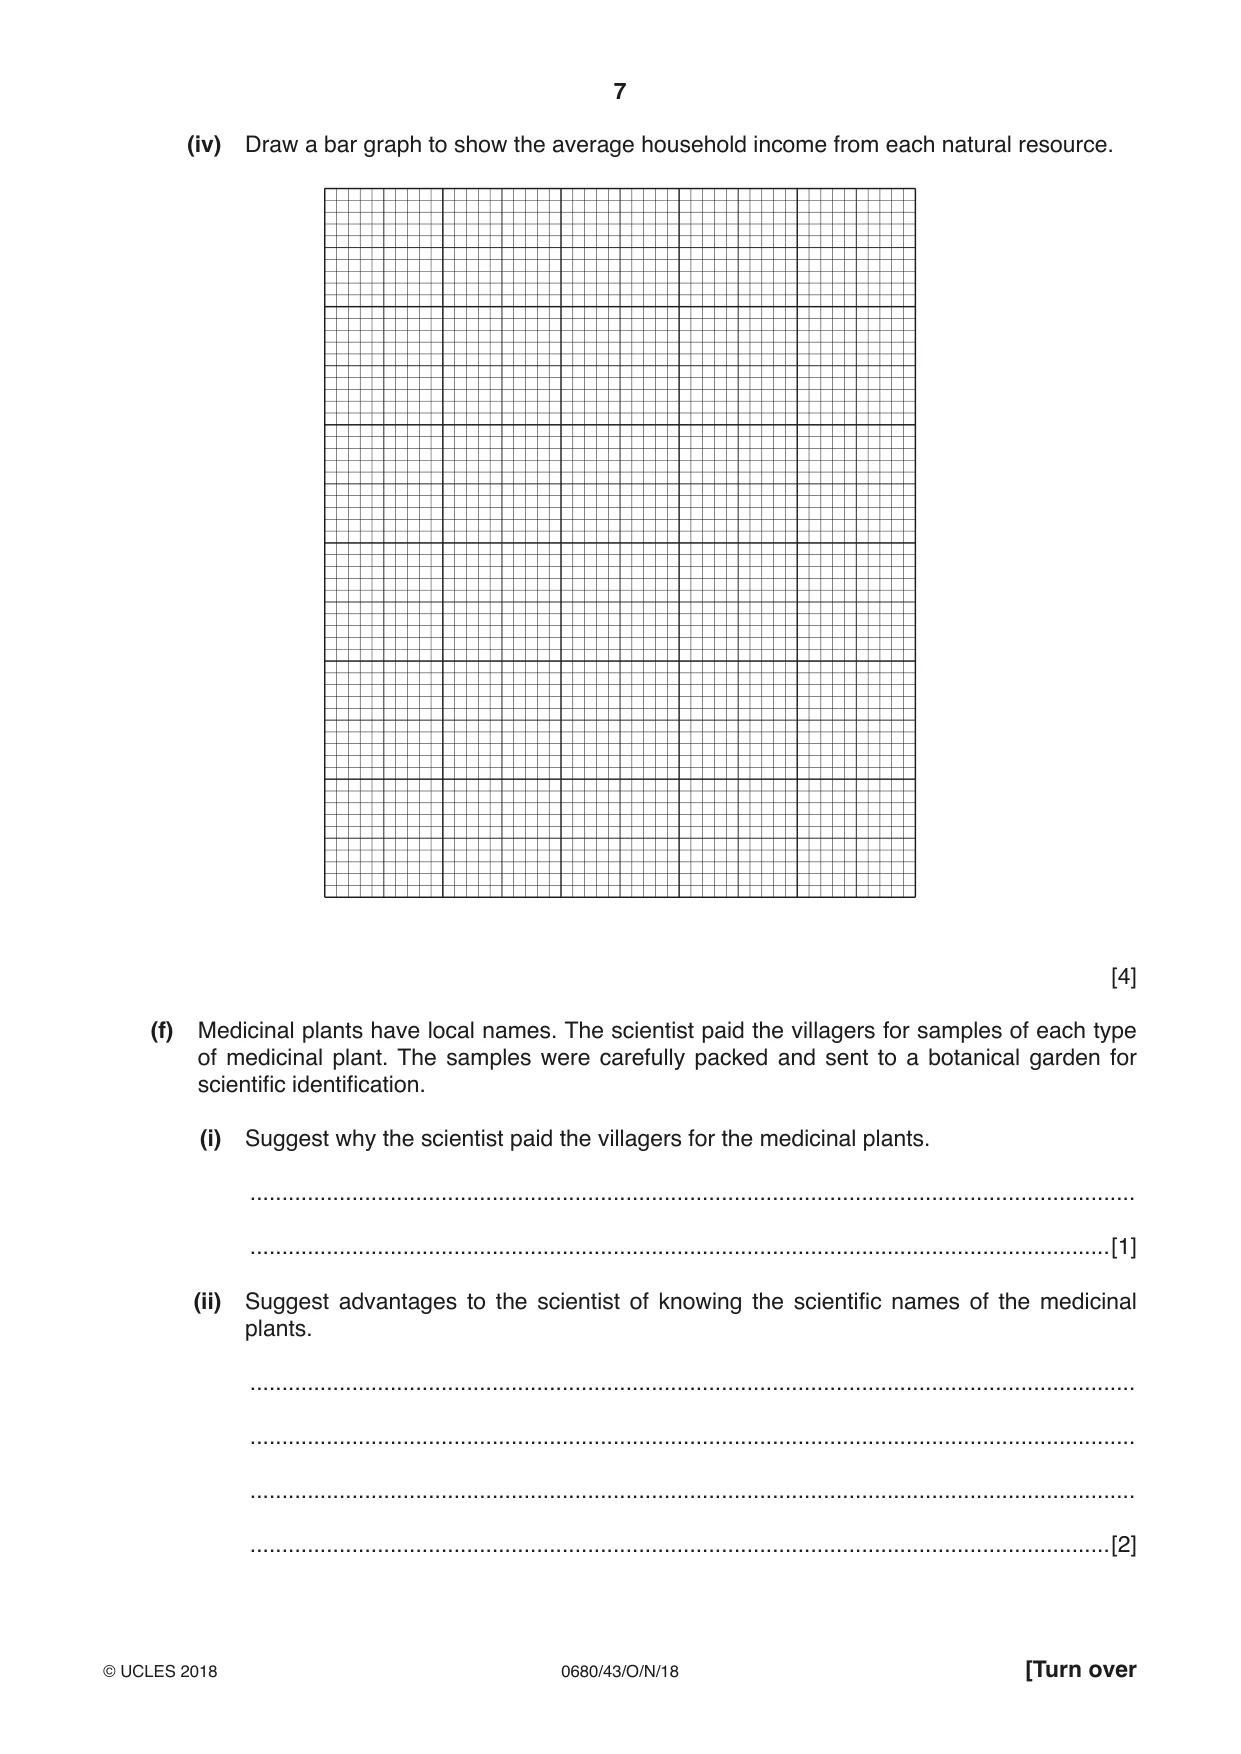
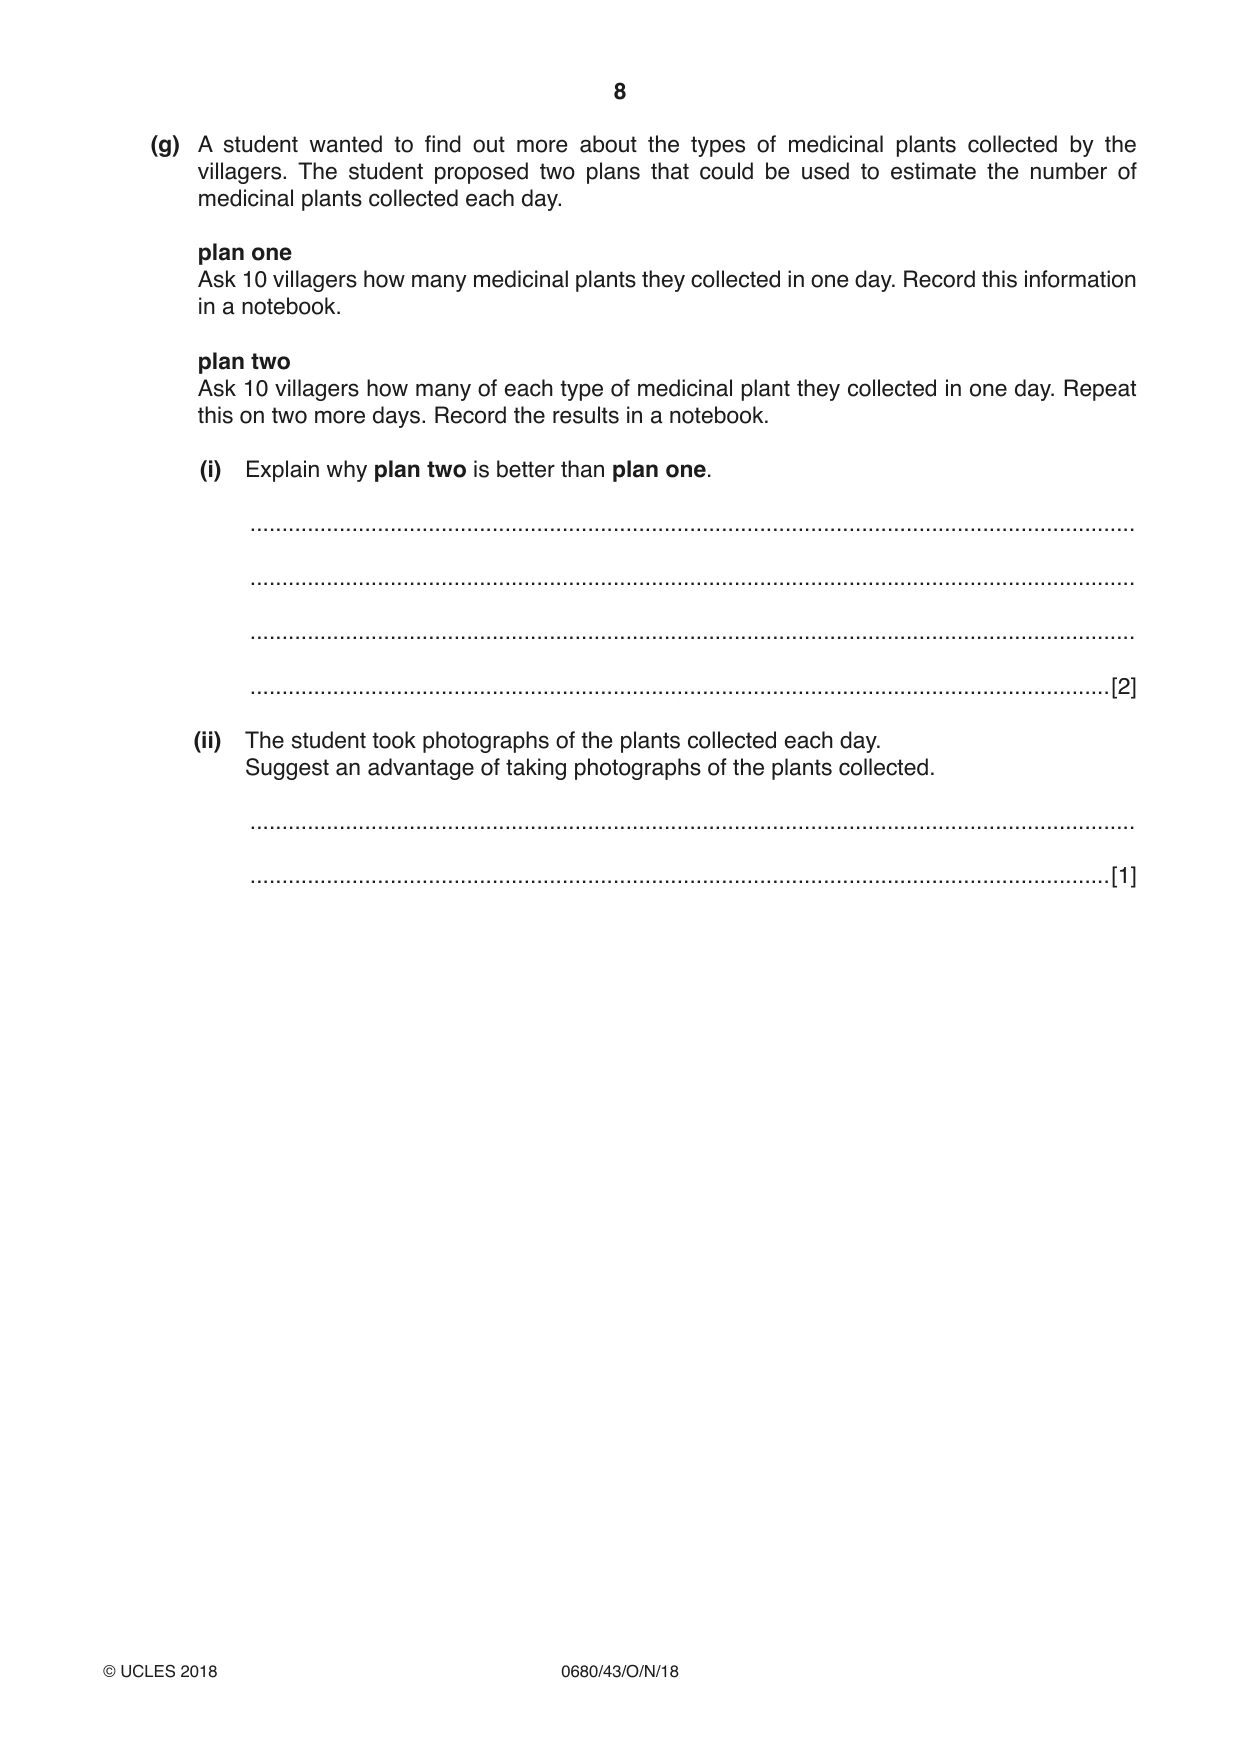
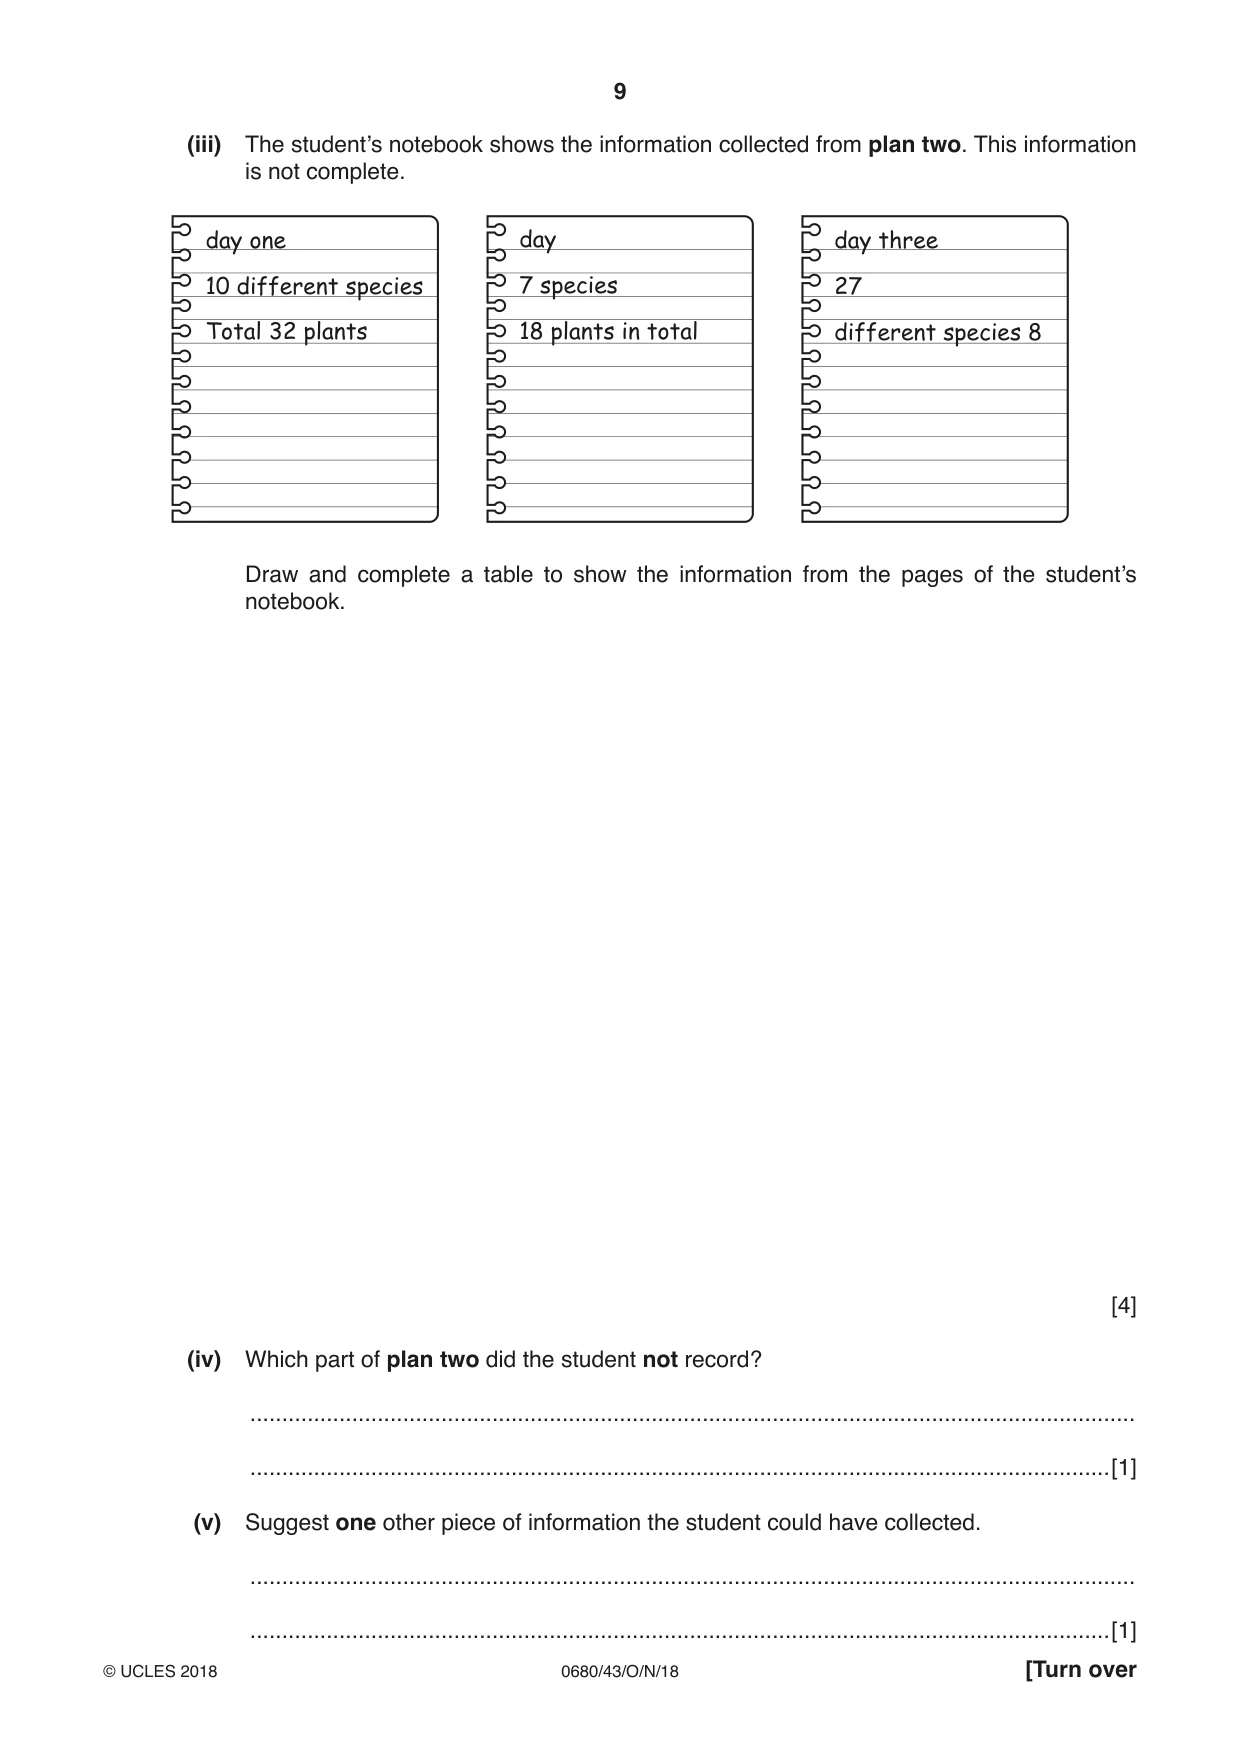
1 All the land in Tanzania is owned by the government. The government leases land for up to 99 years. The economy depends on agriculture, which employs 80% of the work force and produces 85% of exports and 25% of GDP. Most people work as farm labourers or lease small farms. The demand for agricultural products is increasing worldwide. The government has set up the Southern Agricultural Growth Corridor of Tanzania (SAGCOT) to increase the sustainable production of crops. This includes management of the environment. (a) Suggest reasons why the government wants to increase crop production. ................................................................................................................................................... ................................................................................................................................................... ................................................................................................................................................... ................................................................................................................................................... ................................................................................................................................................... ...............................................................................................................................................[3] (b) Over the next 25 years the SAGCOT strategies aim to increase food production by more than two million tonnes per year. SAGCOT strategies 1. to increase crop production 2. to reduce waste and pollution 3. to increase farm profitability 4. to conserve natural resources (i) Soil is a natural resource. Describe how trees help to protect the soil. ........................................................................................................................................... ........................................................................................................................................... ........................................................................................................................................... ........................................................................................................................................... ........................................................................................................................................... .......................................................................................................................................[3] (ii) Suggest why improving farm profitability is important for farmers. ........................................................................................................................................... ........................................................................................................................................... ........................................................................................................................................... .......................................................................................................................................[2] (iii) Suggest how crop production could be increased without damaging the environment. ........................................................................................................................................... ........................................................................................................................................... ........................................................................................................................................... .......................................................................................................................................[2] (c) The Kilombero District is a wetland area in Tanzania. Look at the map of Tanzania on page 3. Measure the distance in kilometres between the Kilombero District and Dar es Salaam. ................................... km [1] (d) A scientist wanted to find out how productive the wetland areas in southern Tanzania were before any changes were made by SAGCOT strategies. The scientist used this method. • Identify all the districts with wetland areas in southern Tanzania. • Identify villages near these wetland areas. • Select 20 of these villages. • Select 30 households from each village. • Interview the head of each household using a questionnaire. (i) Calculate the total number of households sampled. ............................................................[1] (ii) Explain why a large number of households were sampled. ........................................................................................................................................... .......................................................................................................................................[1] (iii) Suggest a method for selecting 30 households from a village of 75 households. ........................................................................................................................................... .......................................................................................................................................[1] (e) One of the questions in the questionnaire was about income from natural resources gathered in the wetland area. The findings are shown in the table. natural resource gathered from average household income for each wetland area natural resource / TZS per year fruits 1800 medicinal plants 15 900 wooden poles 6800 grasses 23 400 firewood 3700 total ......................... (i) Complete the table. [1] (ii) Calculate the percentage of average household income that is provided by medicinal plants. Space for working. ......................................% [2] (iii) Suggest a use for each of the following natural resources. fruits .................................................................................................................................. medicinal plants ................................................................................................................ grasses .............................................................................................................................. [3] (iv) Draw a bar graph to show the average household income from each natural resource. [4] (f) Medicinal plants have local names. The scientist paid the villagers for samples of each type of medicinal plant. The samples were carefully packed and sent to a botanical garden for scientific identification. (i) Suggest why the scientist paid the villagers for the medicinal plants. ........................................................................................................................................... .......................................................................................................................................[1] (ii) Suggest advantages to the scientist of knowing the scientific names of the medicinal plants. ........................................................................................................................................... ........................................................................................................................................... ........................................................................................................................................... .......................................................................................................................................[2] (g) A student wanted to find out more about the types of medicinal plants collected by the villagers. The student proposed two plans that could be used to estimate the number of medicinal plants collected each day. plan one Ask 10 villagers how many medicinal plants they collected in one day. Record this information in a notebook. plan two Ask 10 villagers how many of each type of medicinal plant they collected in one day. Repeat this on two more days. Record the results in a notebook. (i) Explain why plan two is better than plan one. ........................................................................................................................................... ........................................................................................................................................... ........................................................................................................................................... .......................................................................................................................................[2] (ii) The student took photographs of the plants collected each day. Suggest an advantage of taking photographs of the plants collected. ........................................................................................................................................... .......................................................................................................................................[1] (iii) The student’s notebook shows the information collected from plan two. This information is not complete. day one day day three 10 different species 7 species 27 Total 32 plants 18 plants in total different species 8 Draw and complete a table to show the information from the pages of the student’s notebook. [4] (iv) Which part of plan two did the student not record? ........................................................................................................................................... .......................................................................................................................................[1] (v) Suggest one other piece of information the student could have collected. ........................................................................................................................................... .......................................................................................................................................[1]
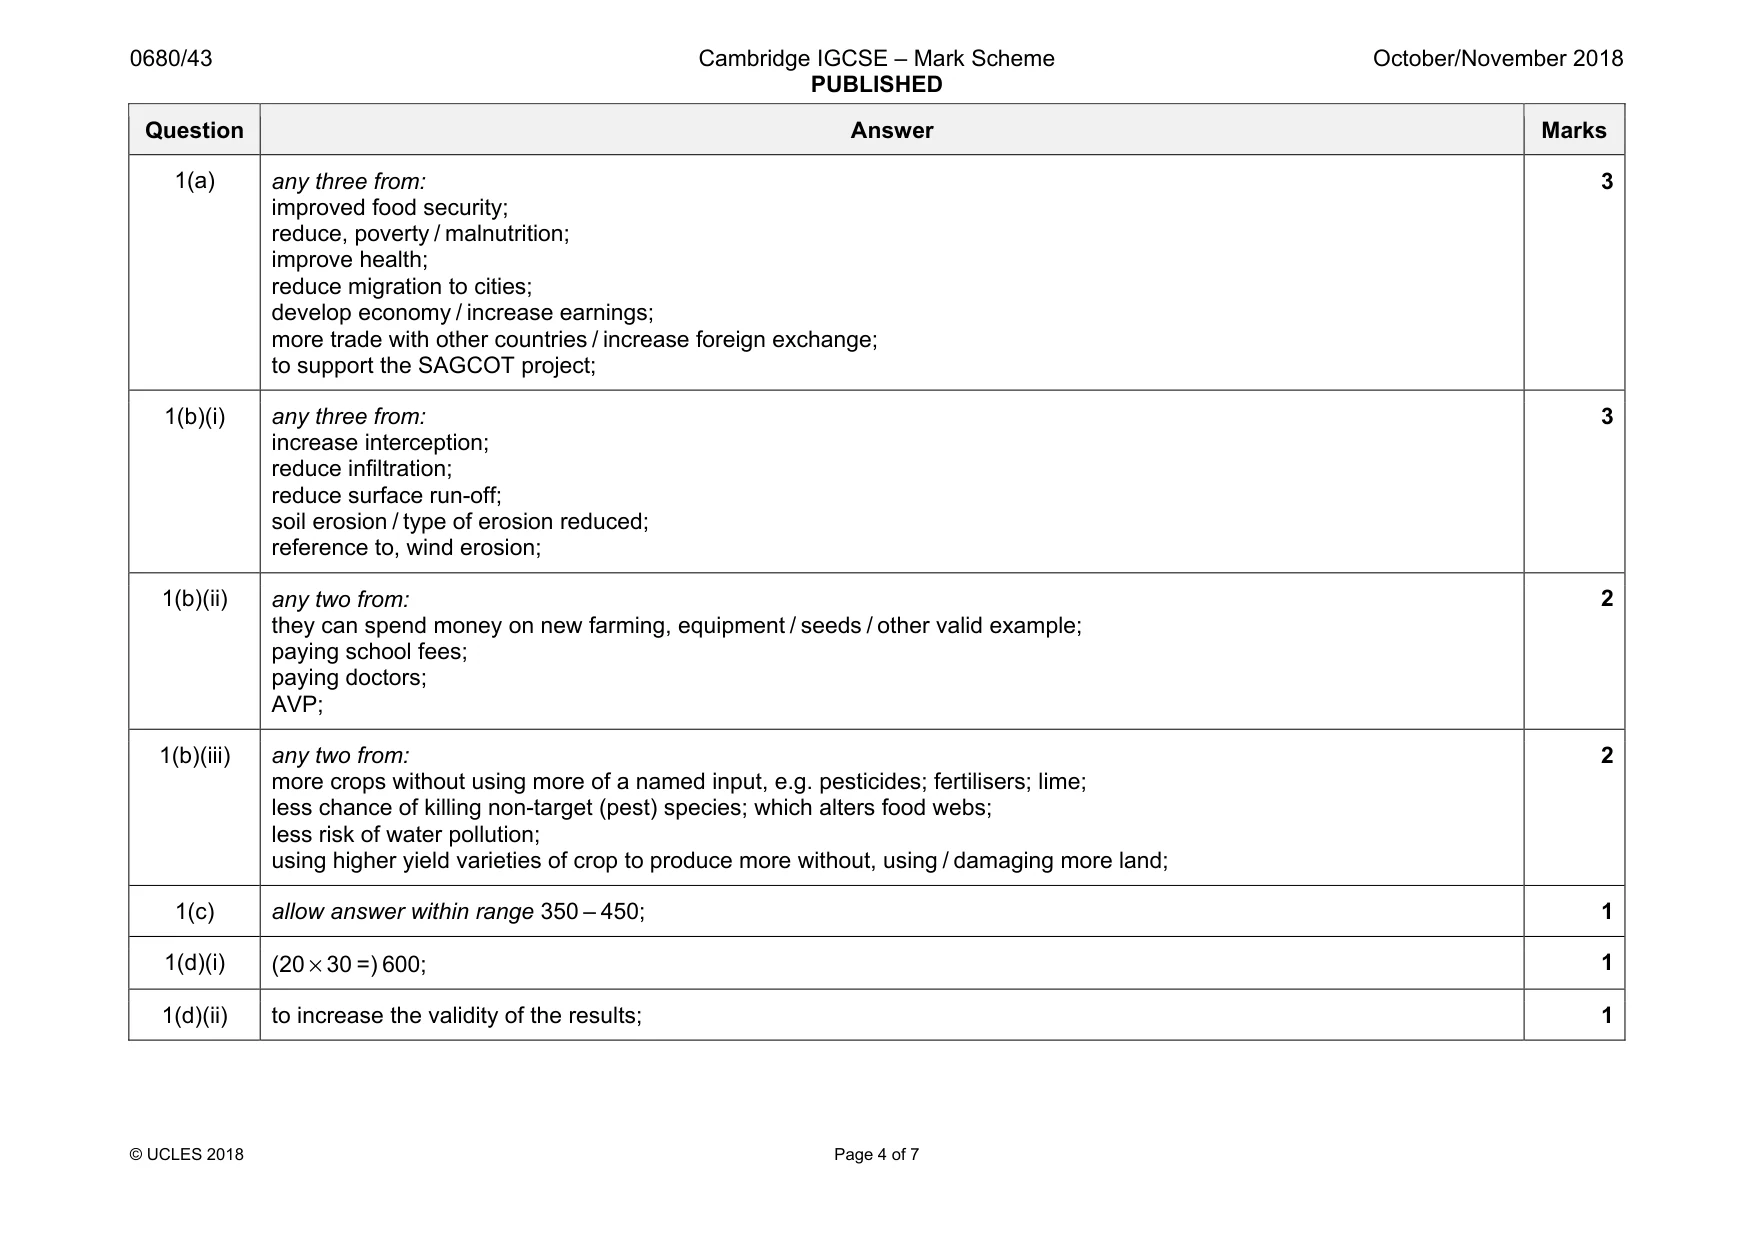
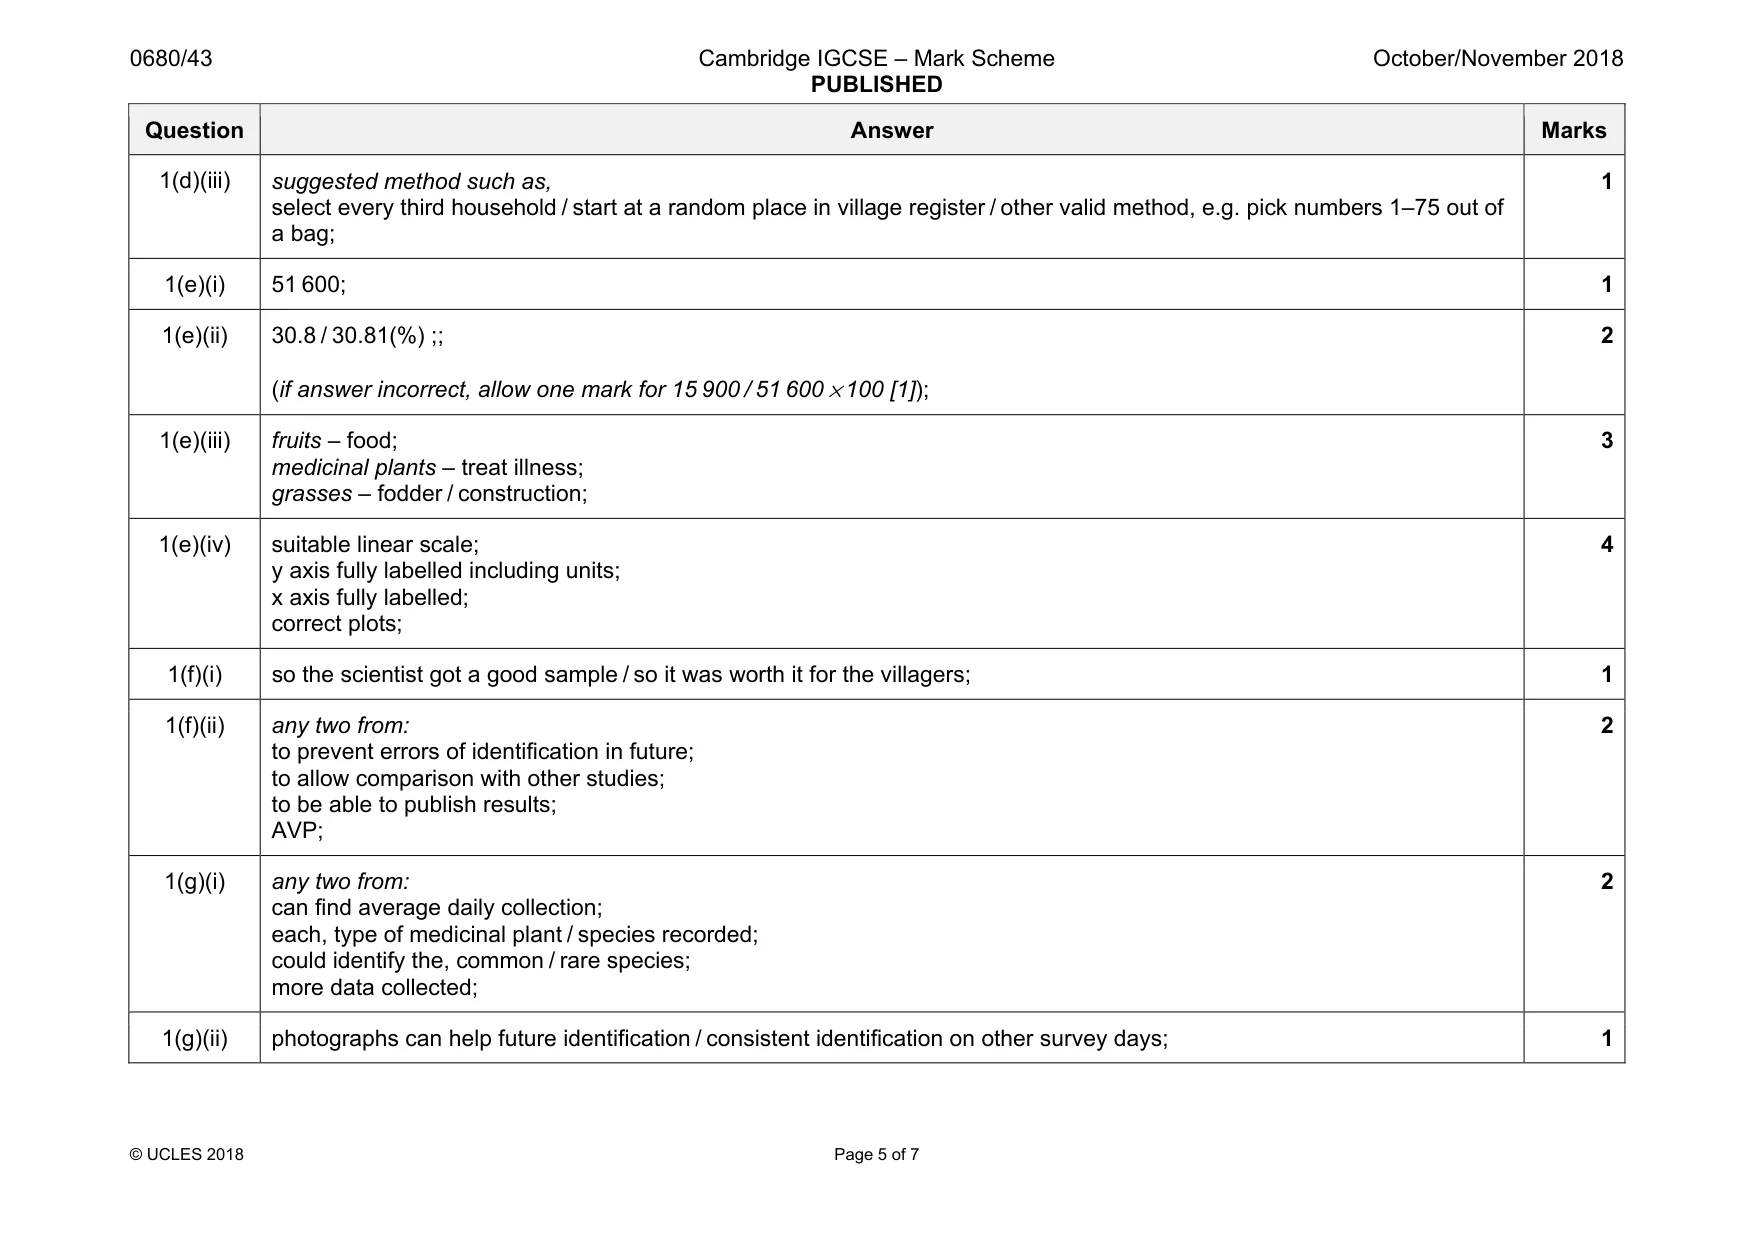
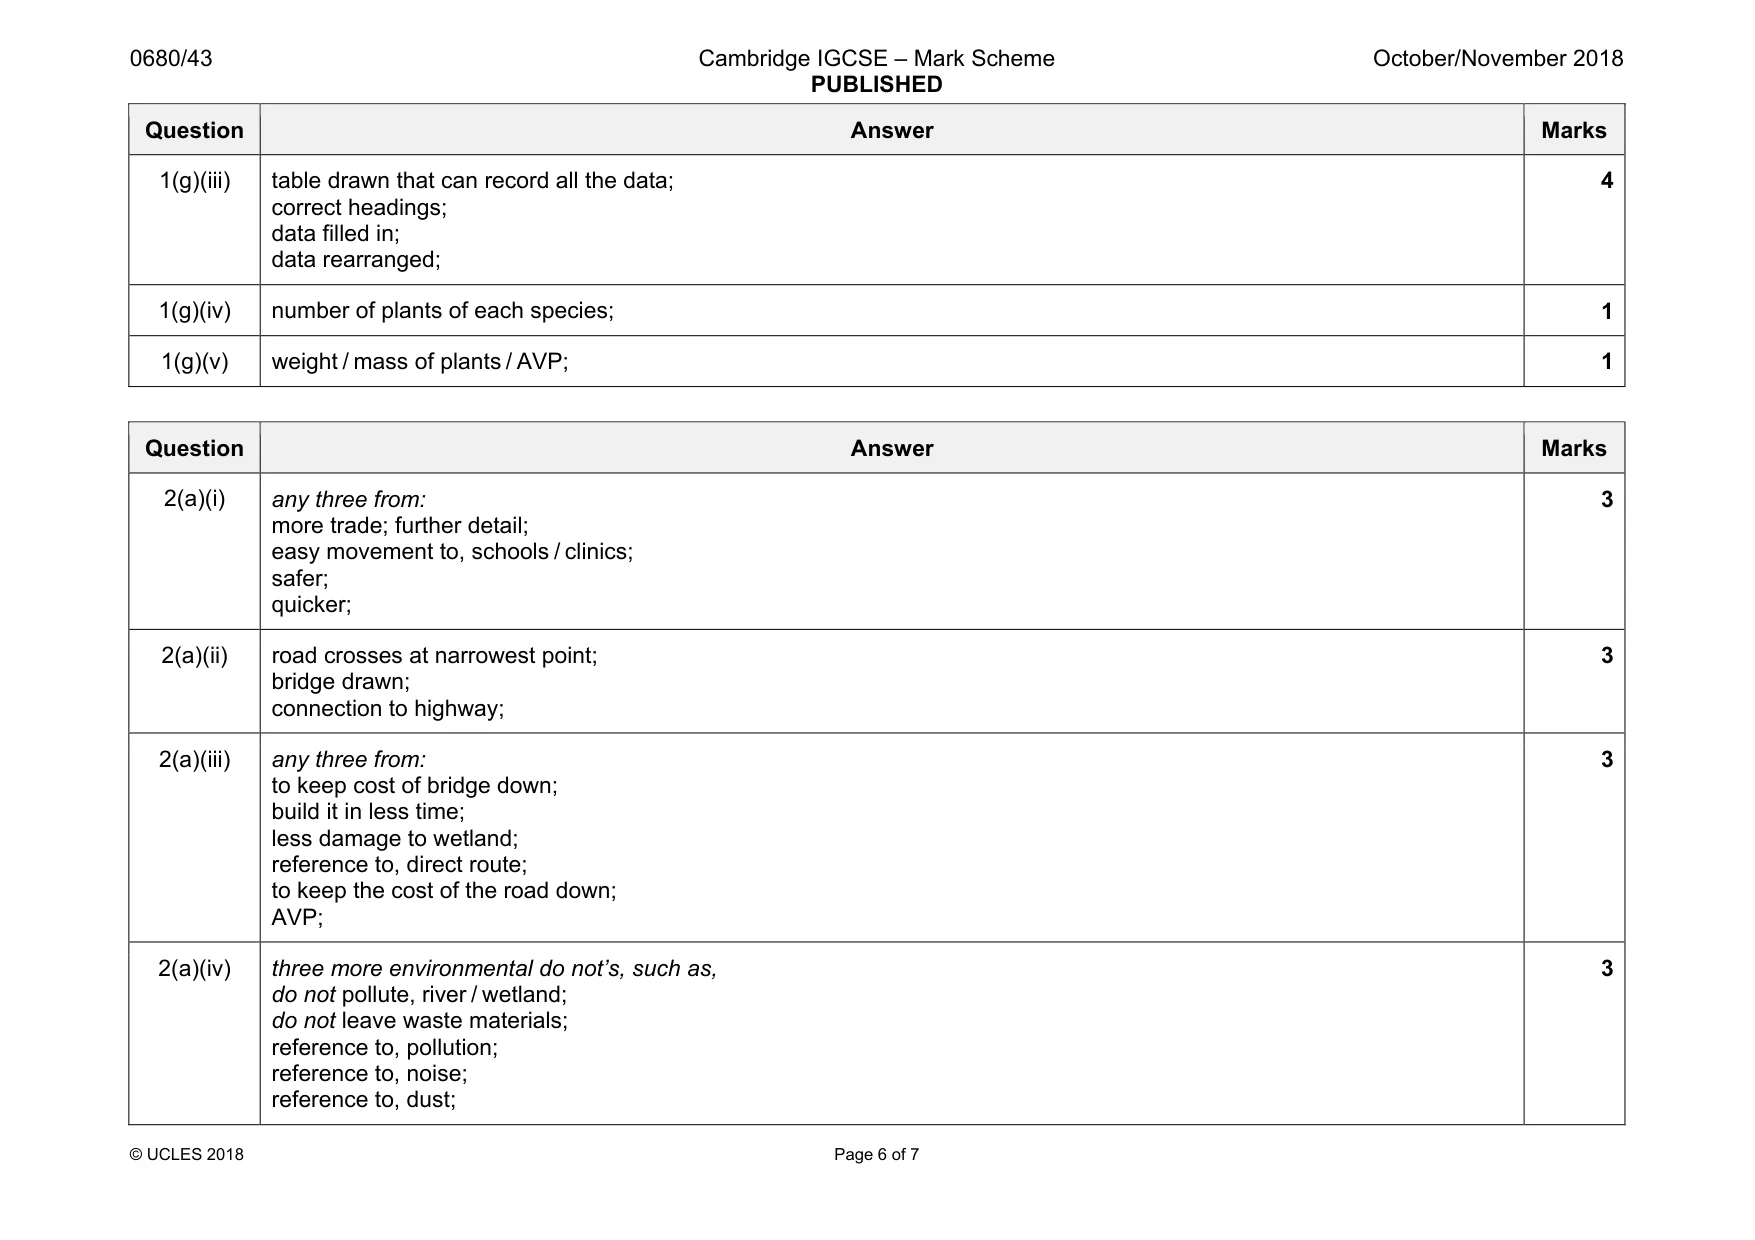
Mark scheme: 1(a) any three from: improved food security; reduce, poverty / malnutrition; improve health; reduce migration to cities; develop economy / increase earnings; more trade with other countries / increase foreign exchange; to support the SAGCOT project; 3 1(b)(i) any three from: increase interception; reduce infiltration; reduce surface run-off; soil erosion / type of erosion reduced; reference to, wind erosion; 3 1(b)(ii) any two from: they can spend money on new farming, equipment / seeds / other valid example; paying school fees; paying doctors; AVP; 2 1(b)(iii) any two from: more crops without using more of a named input, e.g. pesticides; fertilisers; lime; less chance of killing non-target (pest) species; which alters food webs; less risk of water pollution; using higher yield varieties of crop to produce more without, using / damaging more land; 2 1(c) allow answer within range 350 – 450; 1 1(d)(i) (20 × 30 =) 600; 1 1(d)(ii) to increase the validity of the results; 1 Question Answer Marks 1(d)(iii) suggested method such as, select every third household / start at a random place in village register / other valid method, e.g. pick numbers 1–75 out of a bag; 1 1(e)(i) 51 600; 1 1(e)(ii) 30.8 / 30.81(%) ;; (if answer incorrect, allow one mark for 15 900 / 51 600 × 100 [1]); 2 1(e)(iii) fruits – food; medicinal plants – treat illness; grasses – fodder / construction; 3 1(e)(iv) suitable linear scale; y axis fully labelled including units; x axis fully labelled; correct plots; 4 1(f)(i) so the scientist got a good sample / so it was worth it for the villagers; 1 1(f)(ii) any two from: to prevent errors of identification in future; to allow comparison with other studies; to be able to publish results; AVP; 2 1(g)(i) any two from: can find average daily collection; each, type of medicinal plant / species recorded; could identify the, common / rare species; more data collected; 2 1(g)(ii) photographs can help future identification / consistent identification on other survey days; 1 Question Answer Marks 1(g)(iii) table drawn that can record all the data; correct headings; data filled in; data rearranged; 4 1(g)(iv) number of plants of each species; 1 1(g)(v) weight / mass of plants / AVP; 1
Q2 · The government is completing the building of some roads to support SAGCOT strategies
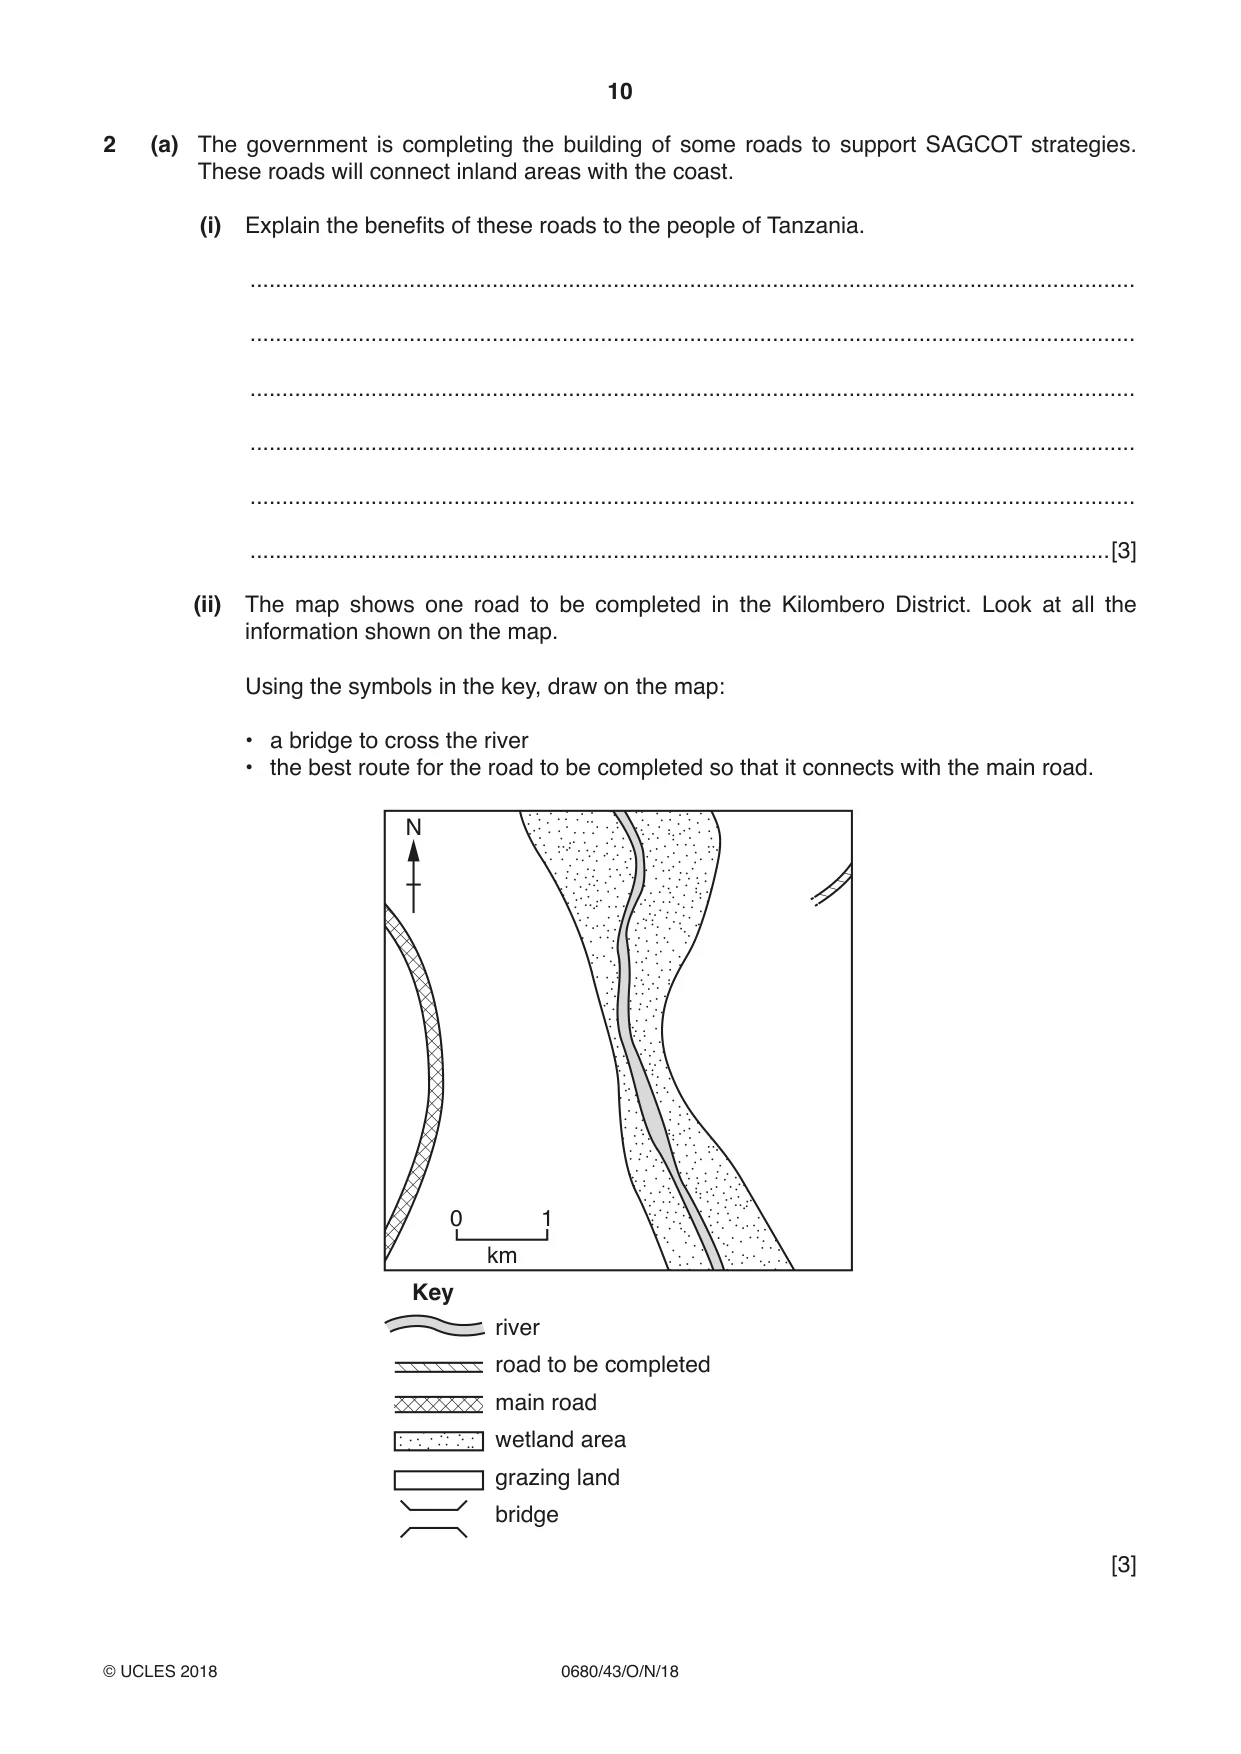
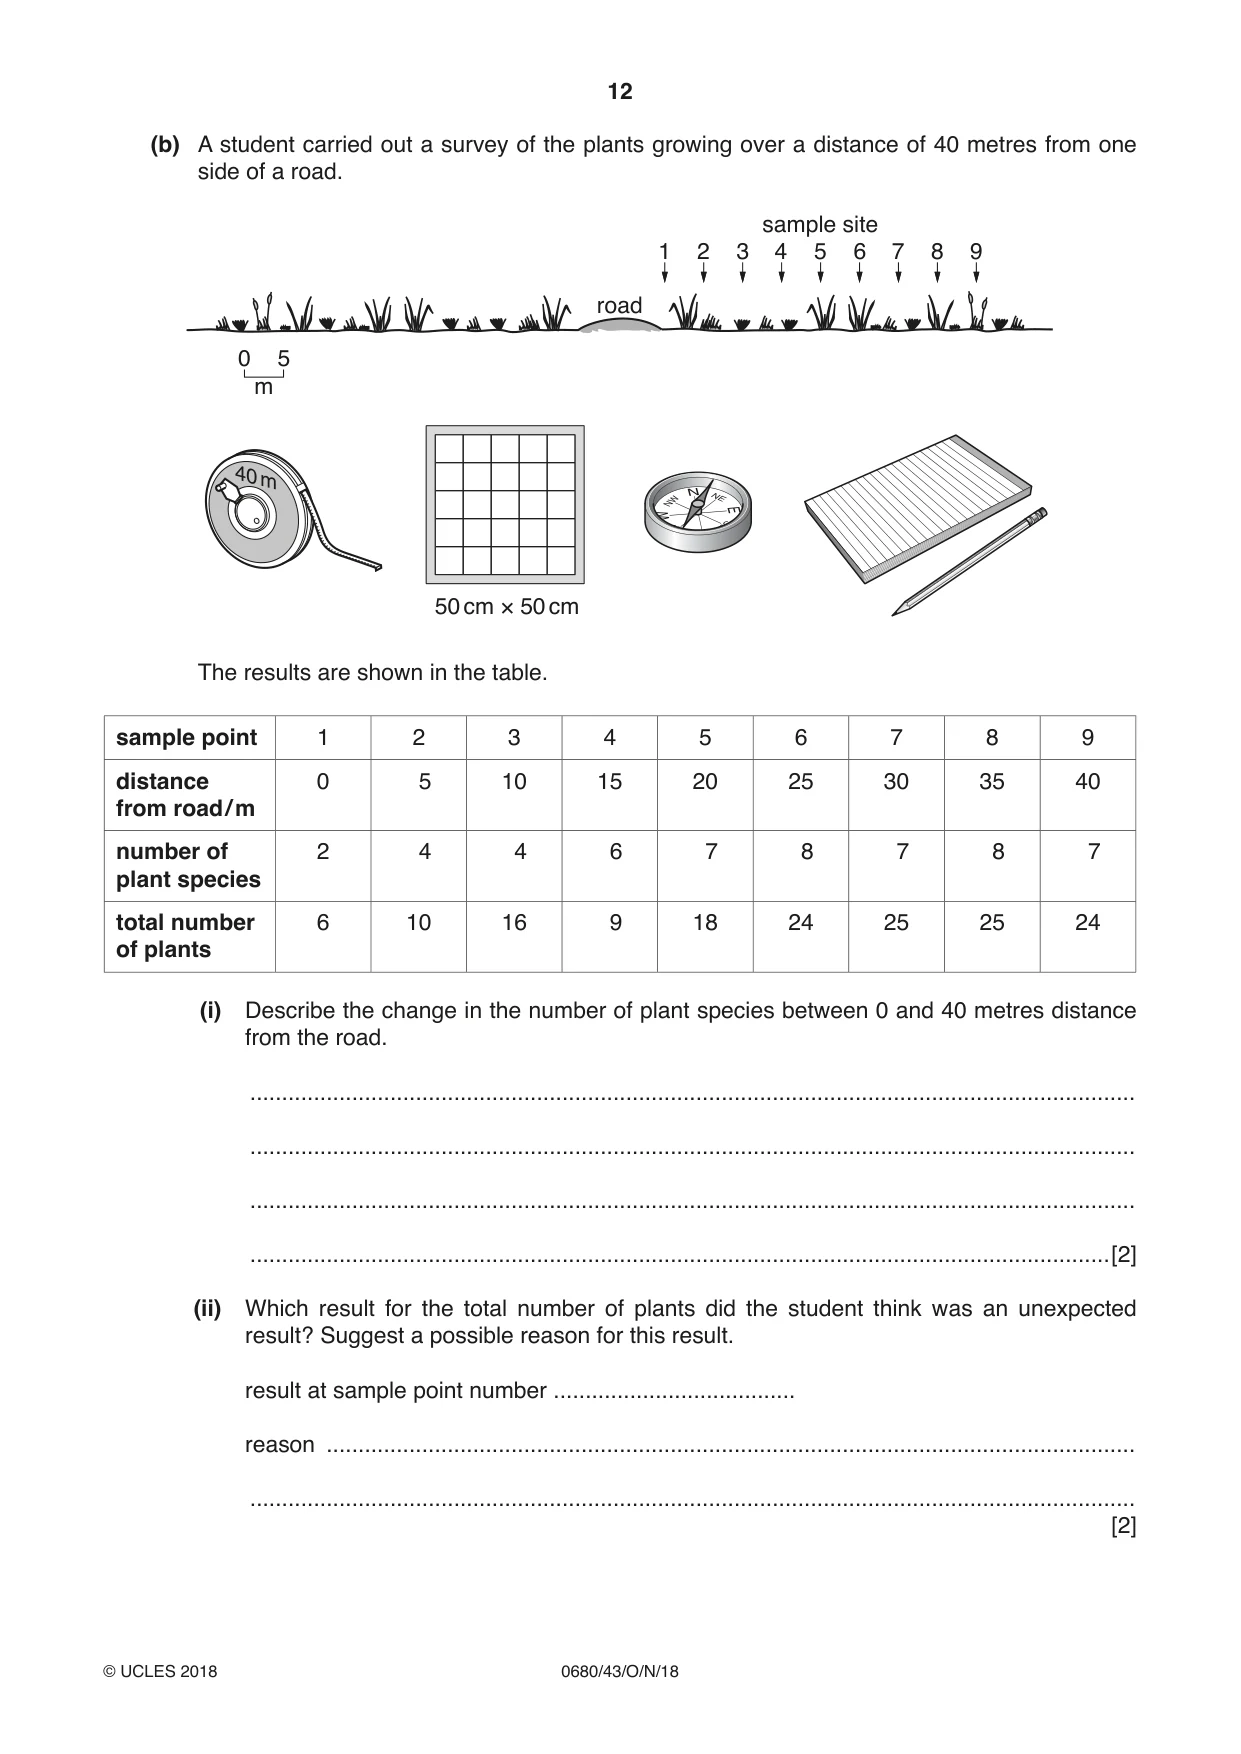
2 (a) The government is completing the building of some roads to support SAGCOT strategies. These roads will connect inland areas with the coast. (i) Explain the benefits of these roads to the people of Tanzania. ........................................................................................................................................... ........................................................................................................................................... ........................................................................................................................................... ........................................................................................................................................... ........................................................................................................................................... .......................................................................................................................................[3] (ii) The map shows one road to be completed in the Kilombero District. Look at all the information shown on the map. Using the symbols in the key, draw on the map: • a bridge to cross the river • the best route for the road to be completed so that it connects with the main road. N 0 1 km Key river road to be completed main road wetland area grazing land bridge [3] (iii) Explain why you decided to locate the road and bridge in the position you have drawn on the map. ........................................................................................................................................... ........................................................................................................................................... ........................................................................................................................................... ........................................................................................................................................... ........................................................................................................................................... .......................................................................................................................................[3] (iv) The road builders were given instructions to reduce damage to the local environment. Complete the instructions. The first instruction has been done for you. Instructions to road builders to reduce damage to the local environment: 1. Do not spill oil. 2. Do not ........................................................................................................................................... 3. Do not ........................................................................................................................................... 4. Do not ........................................................................................................................................... [3] (b) A student carried out a survey of the plants growing over a distance of 40 metres from one side of a road. sample site 1 2 3 4 5 6 7 8 9 road 0 5 m N NE NW W E SW S SE 50 cm × 50 cm The results are shown in the table. sample point 1 2 3 4 5 6 7 8 9 distance 0 5 10 15 20 25 30 35 40 from road / m number of 2 4 4 6 7 8 7 8 7 plant species total number 6 10 16 9 18 24 25 25 24 of plants (i) Describe the change in the number of plant species between 0 and 40 metres distance from the road. ........................................................................................................................................... ........................................................................................................................................... ........................................................................................................................................... .......................................................................................................................................[2] (ii) Which result for the total number of plants did the student think was an unexpected result? Suggest a possible reason for this result. result at sample point number ...................................... reason ............................................................................................................................... ........................................................................................................................................... [2]
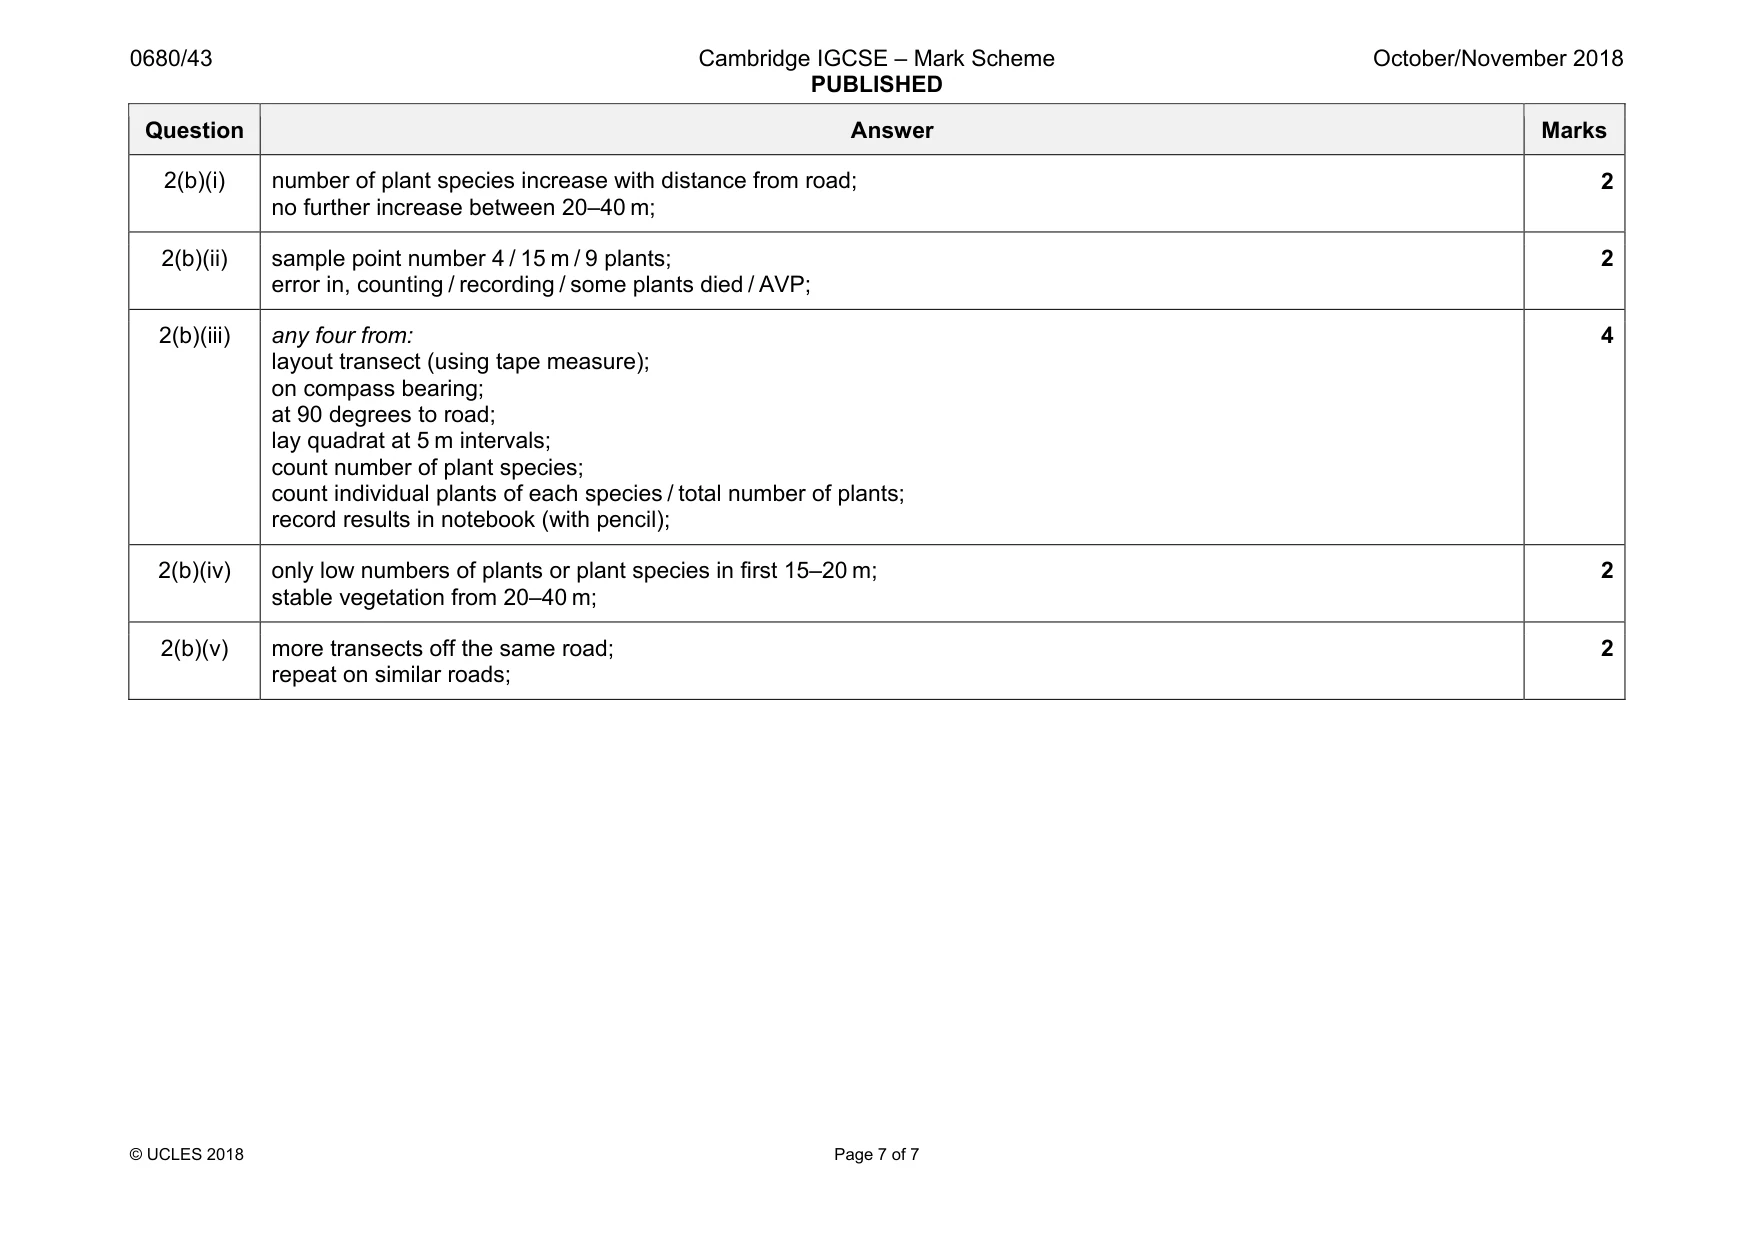
Mark scheme: 2(a)(i) any three from: more trade; further detail; easy movement to, schools / clinics; safer; quicker; 3 2(a)(ii) road crosses at narrowest point; bridge drawn; connection to highway; 3 2(a)(iii) any three from: to keep cost of bridge down; build it in less time; less damage to wetland; reference to, direct route; to keep the cost of the road down; AVP; 3 2(a)(iv) three more environmental do not’s, such as, do not pollute, river / wetland; do not leave waste materials; reference to, pollution; reference to, noise; reference to, dust; 3 Question Answer Marks 2(b)(i) number of plant species increase with distance from road; no further increase between 20–40 m; 2 2(b)(ii) sample point number 4 / 15 m / 9 plants; error in, counting / recording / some plants died / AVP; 2 2(b)(iii) any four from: layout transect (using tape measure); on compass bearing; at 90 degrees to road; lay quadrat at 5 m intervals; count number of plant species; count individual plants of each species / total number of plants; record results in notebook (with pencil); 4 2(b)(iv) only low numbers of plants or plant species in first 15–20 m; stable vegetation from 20–40 m; 2 2(b)(v) more transects off the same road; repeat on similar roads; 2
What was in this paper
The subtopics covered by these 2 questions, and how many questions each got. Open one in a new tab to see every Cambridge question on it.
What you needed in this session
Cambridge’s own grade thresholds for 2018 Oct/Nov, Paper 4 · Variant 3. A higher threshold means an easier paper — the bar moves with how the cohort did.