Cambridge IGCSE Environmental Management 0680 — 2018 May/June Paper 4 · Variant 2
0680/42/M/J/18 · 2 questions · 60 marks · ≈68 min
The question paper and its mark scheme, free to read here and free to download. This is Cambridge’s own paper, exactly as it was sat.
Question paper16 pages
Mark scheme8 pages
Answers below. Sit the paper first if you are practising.
Questions as text
Q1 · Hawaii is a state of the USA, it is a long chain of volcanic islands
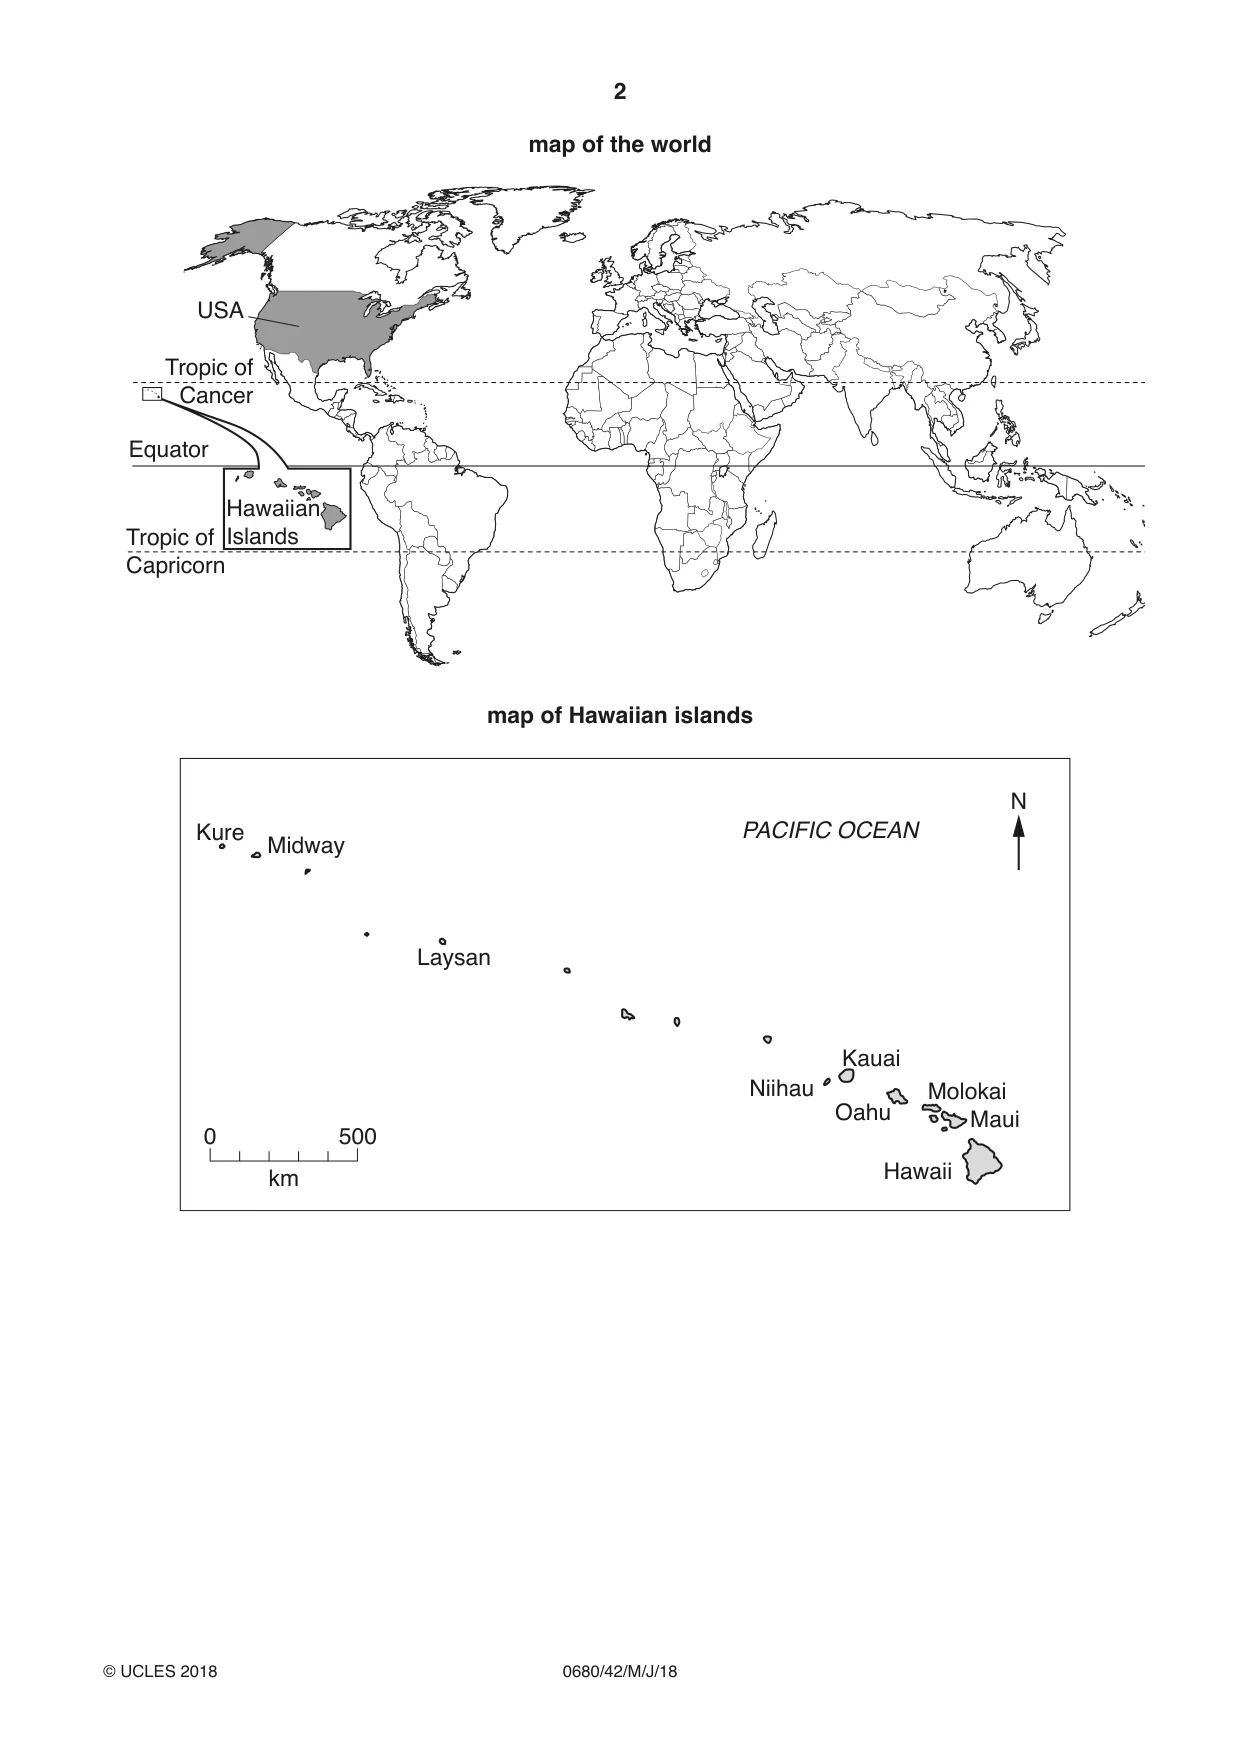
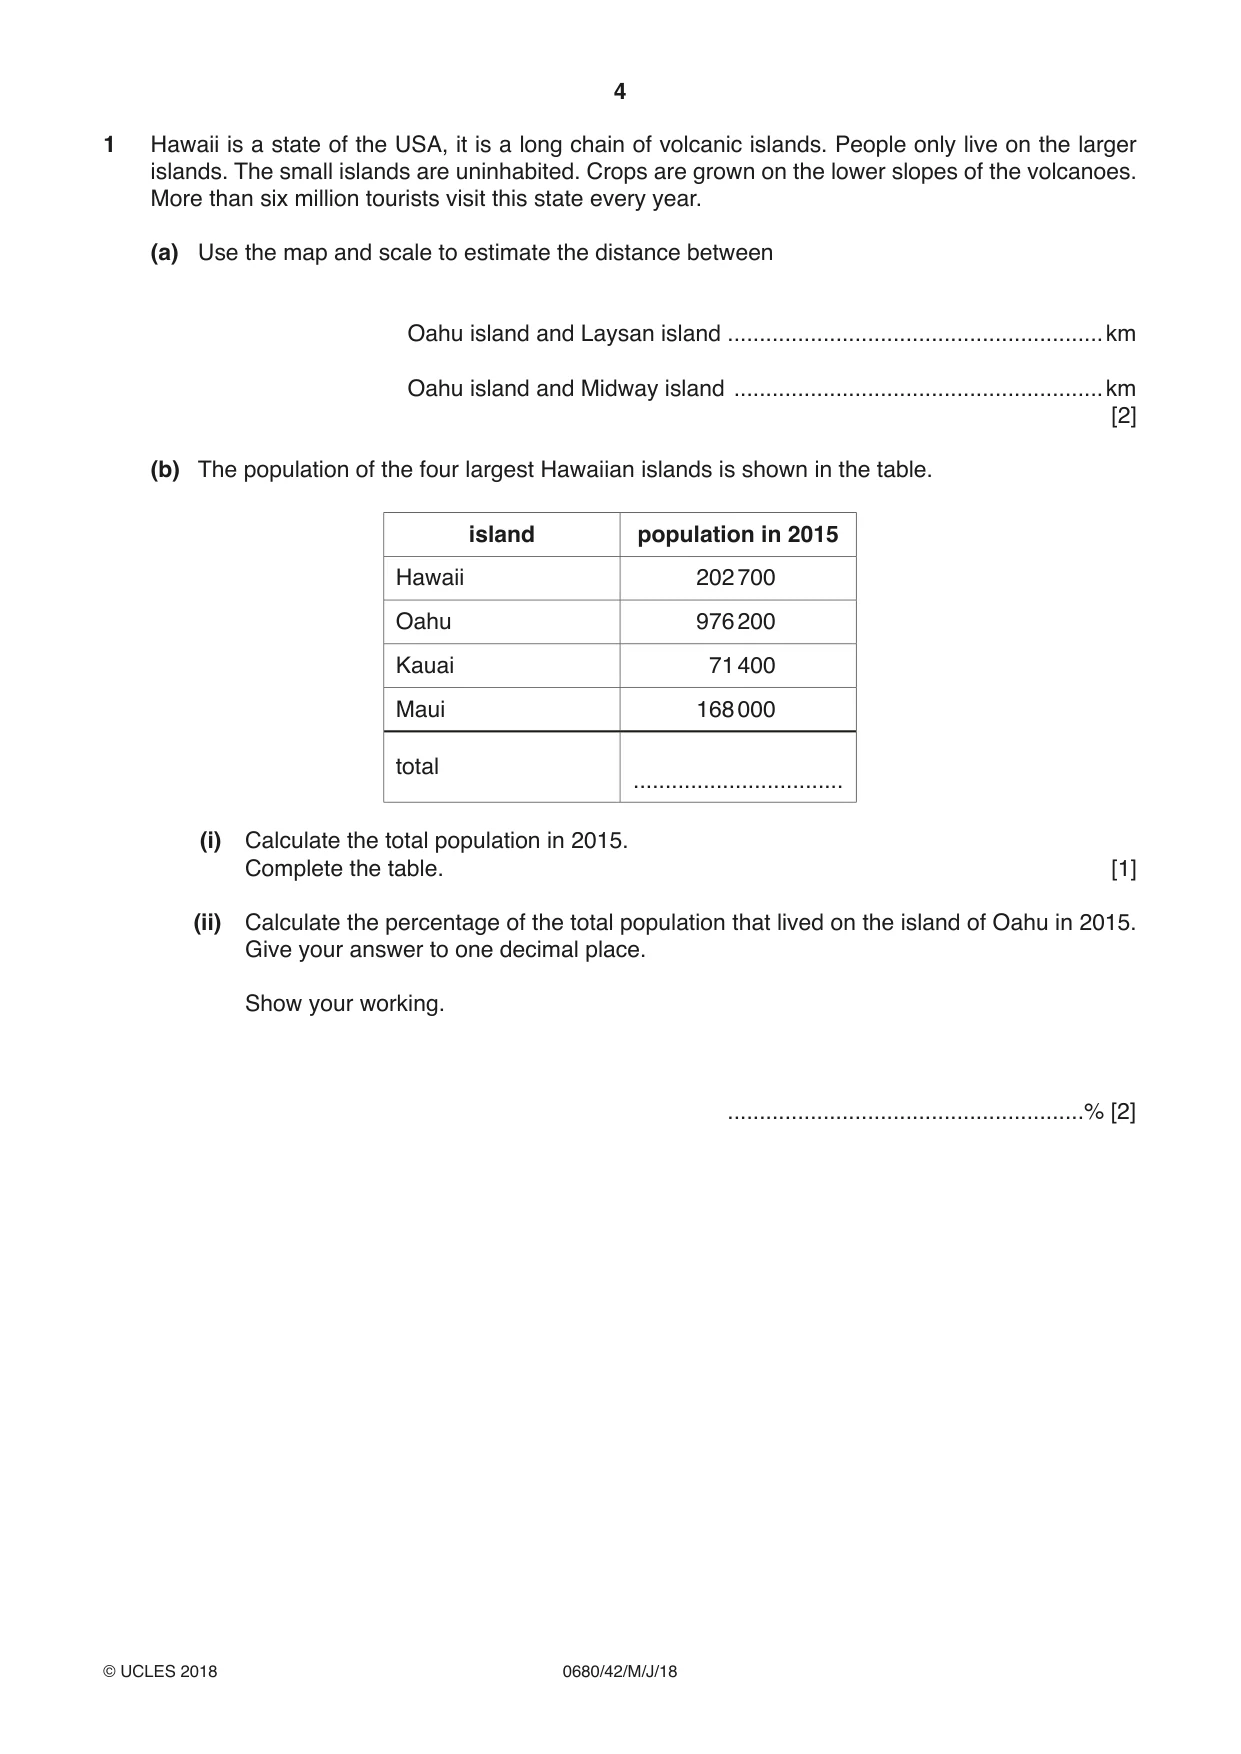
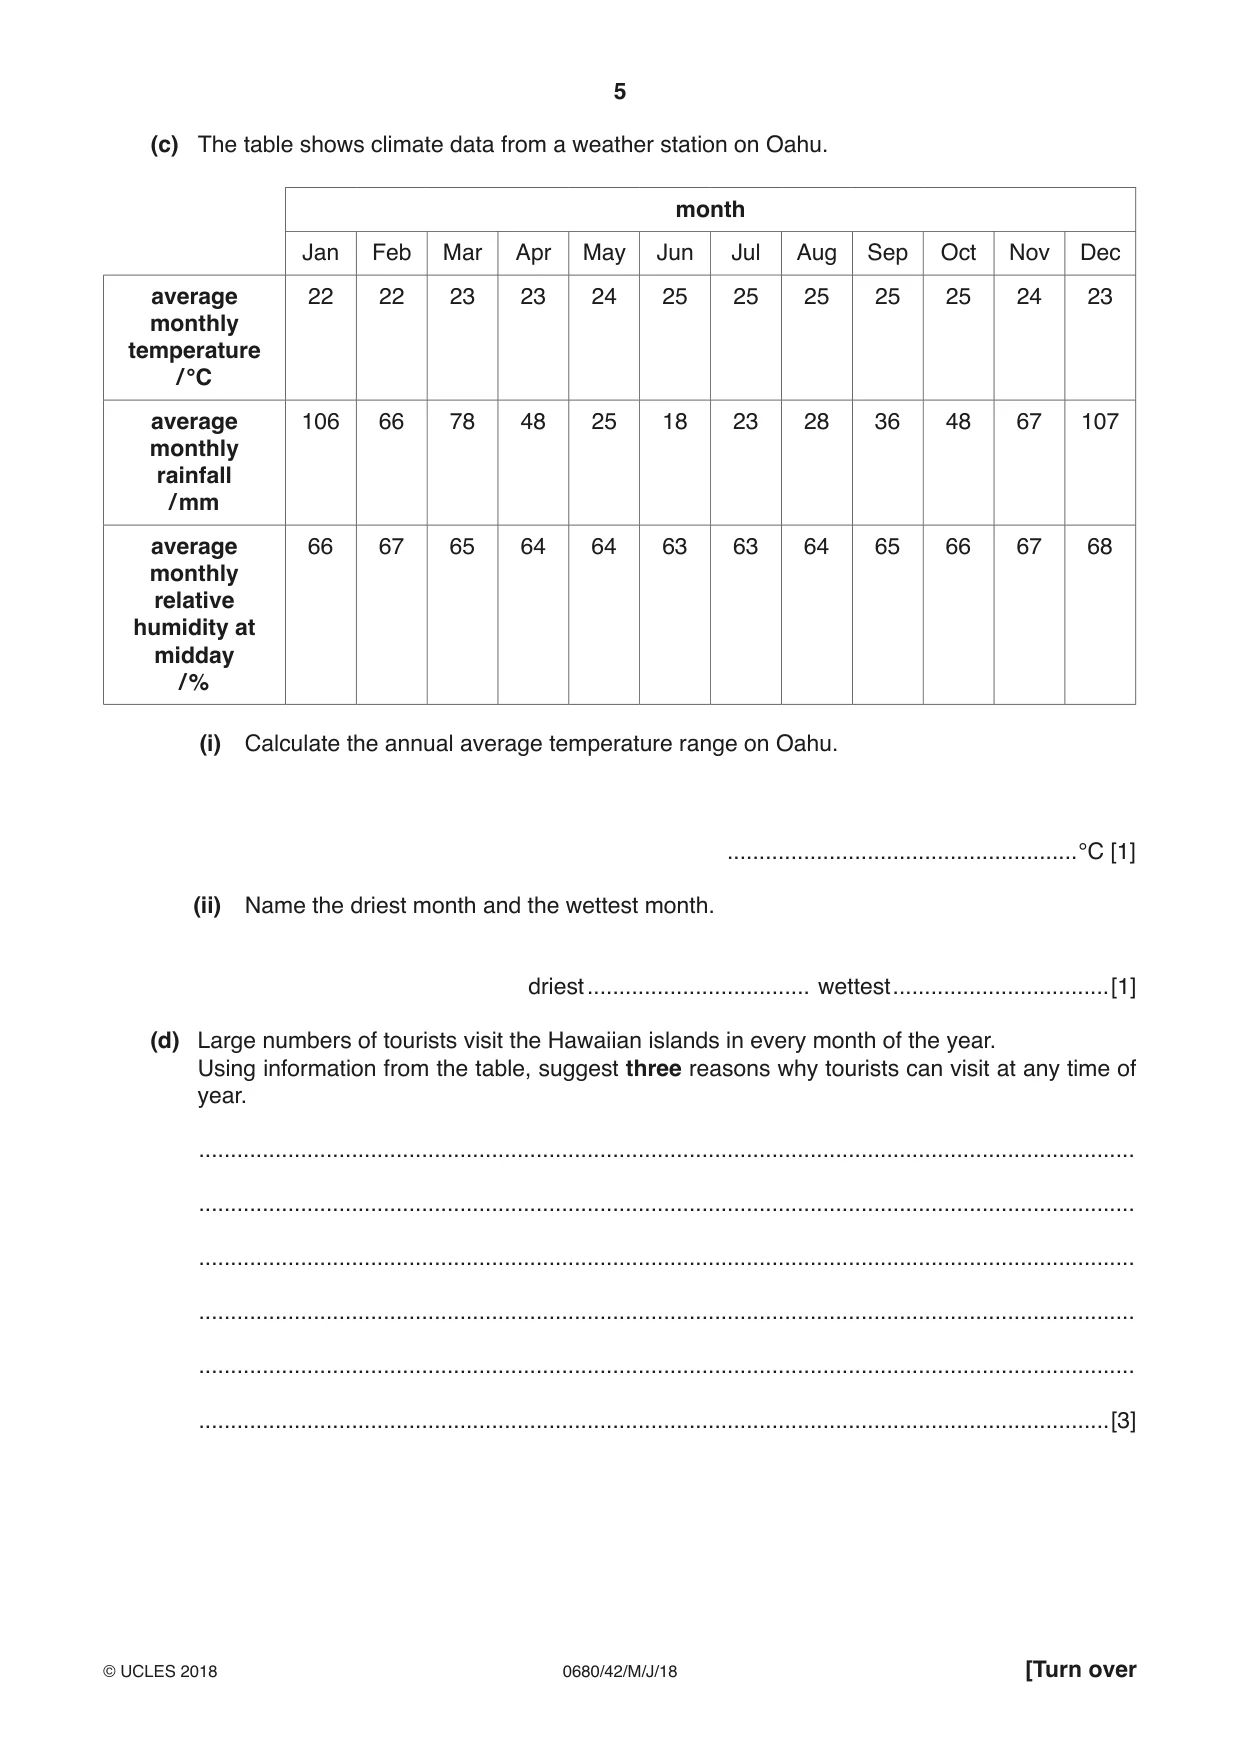
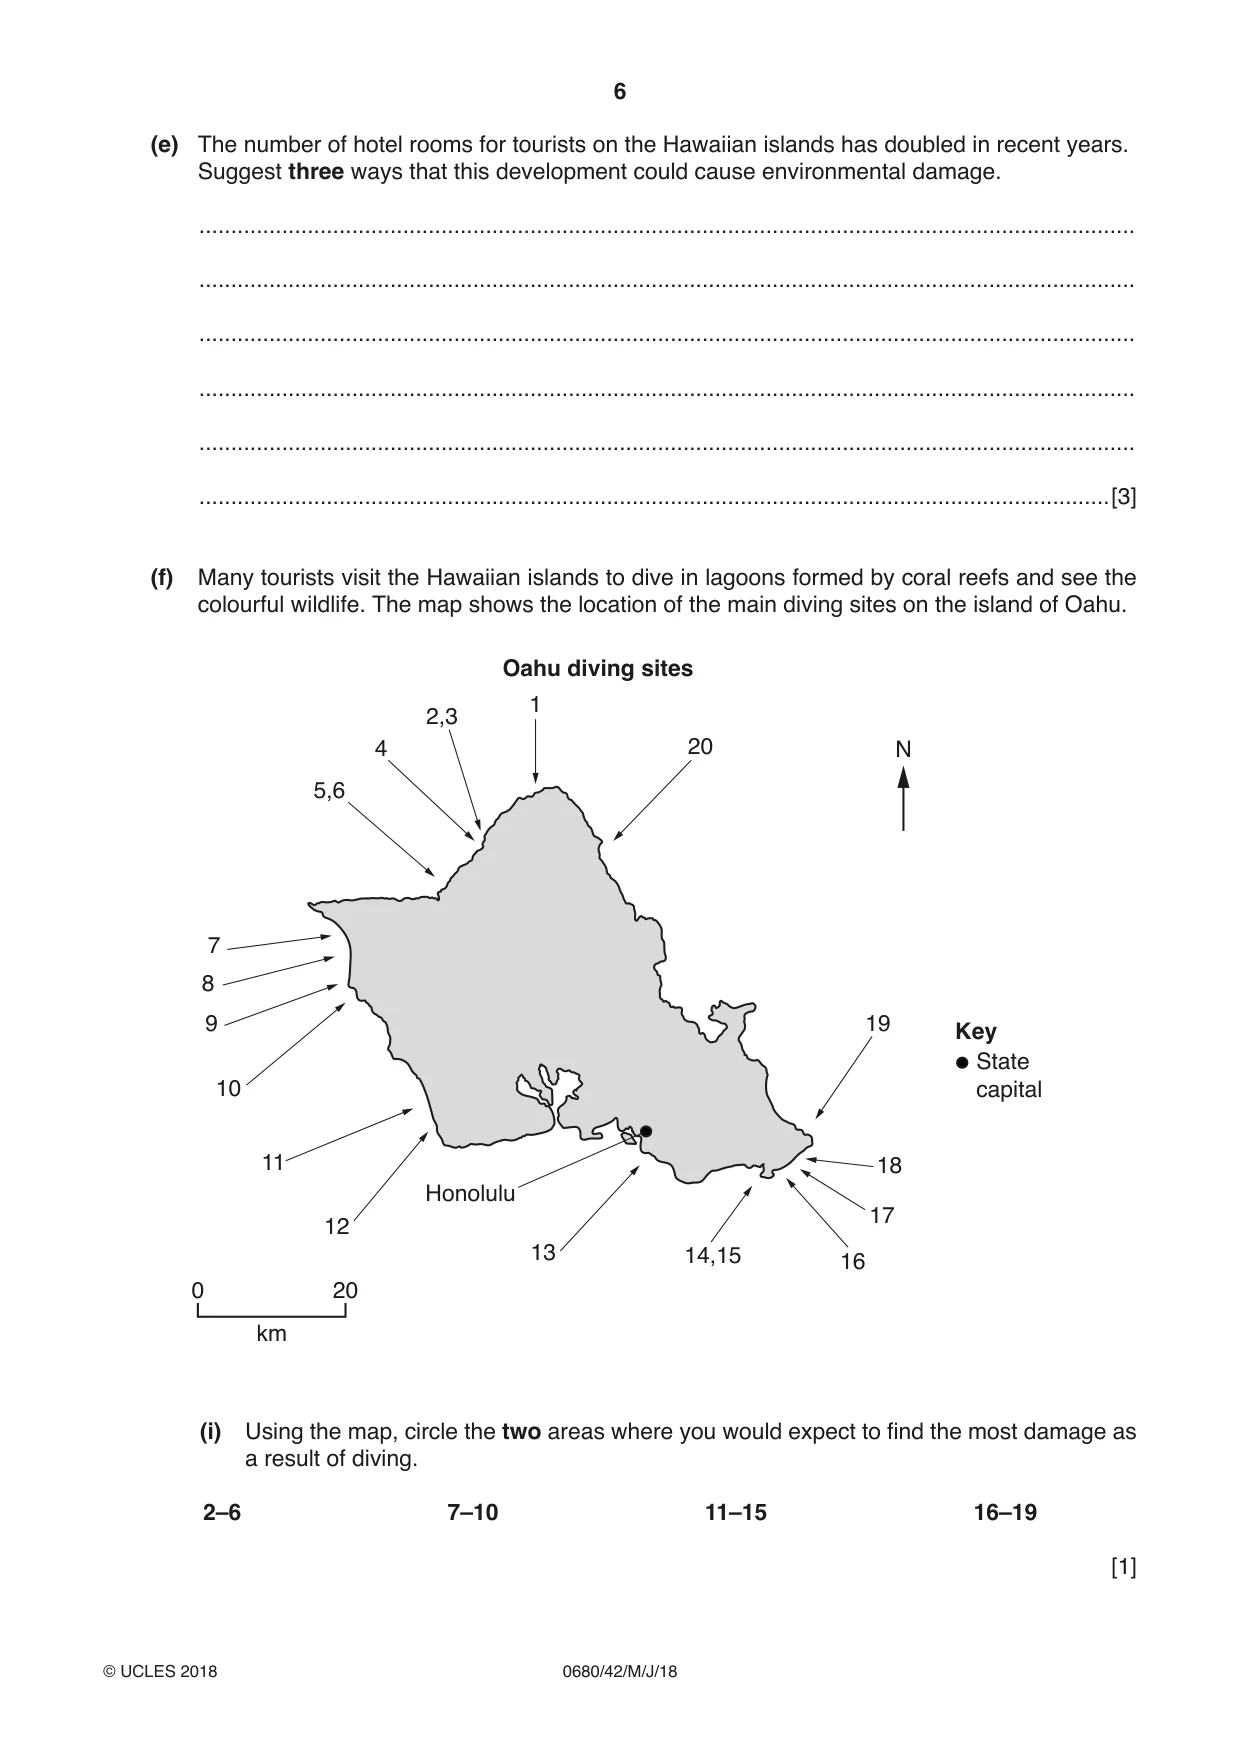
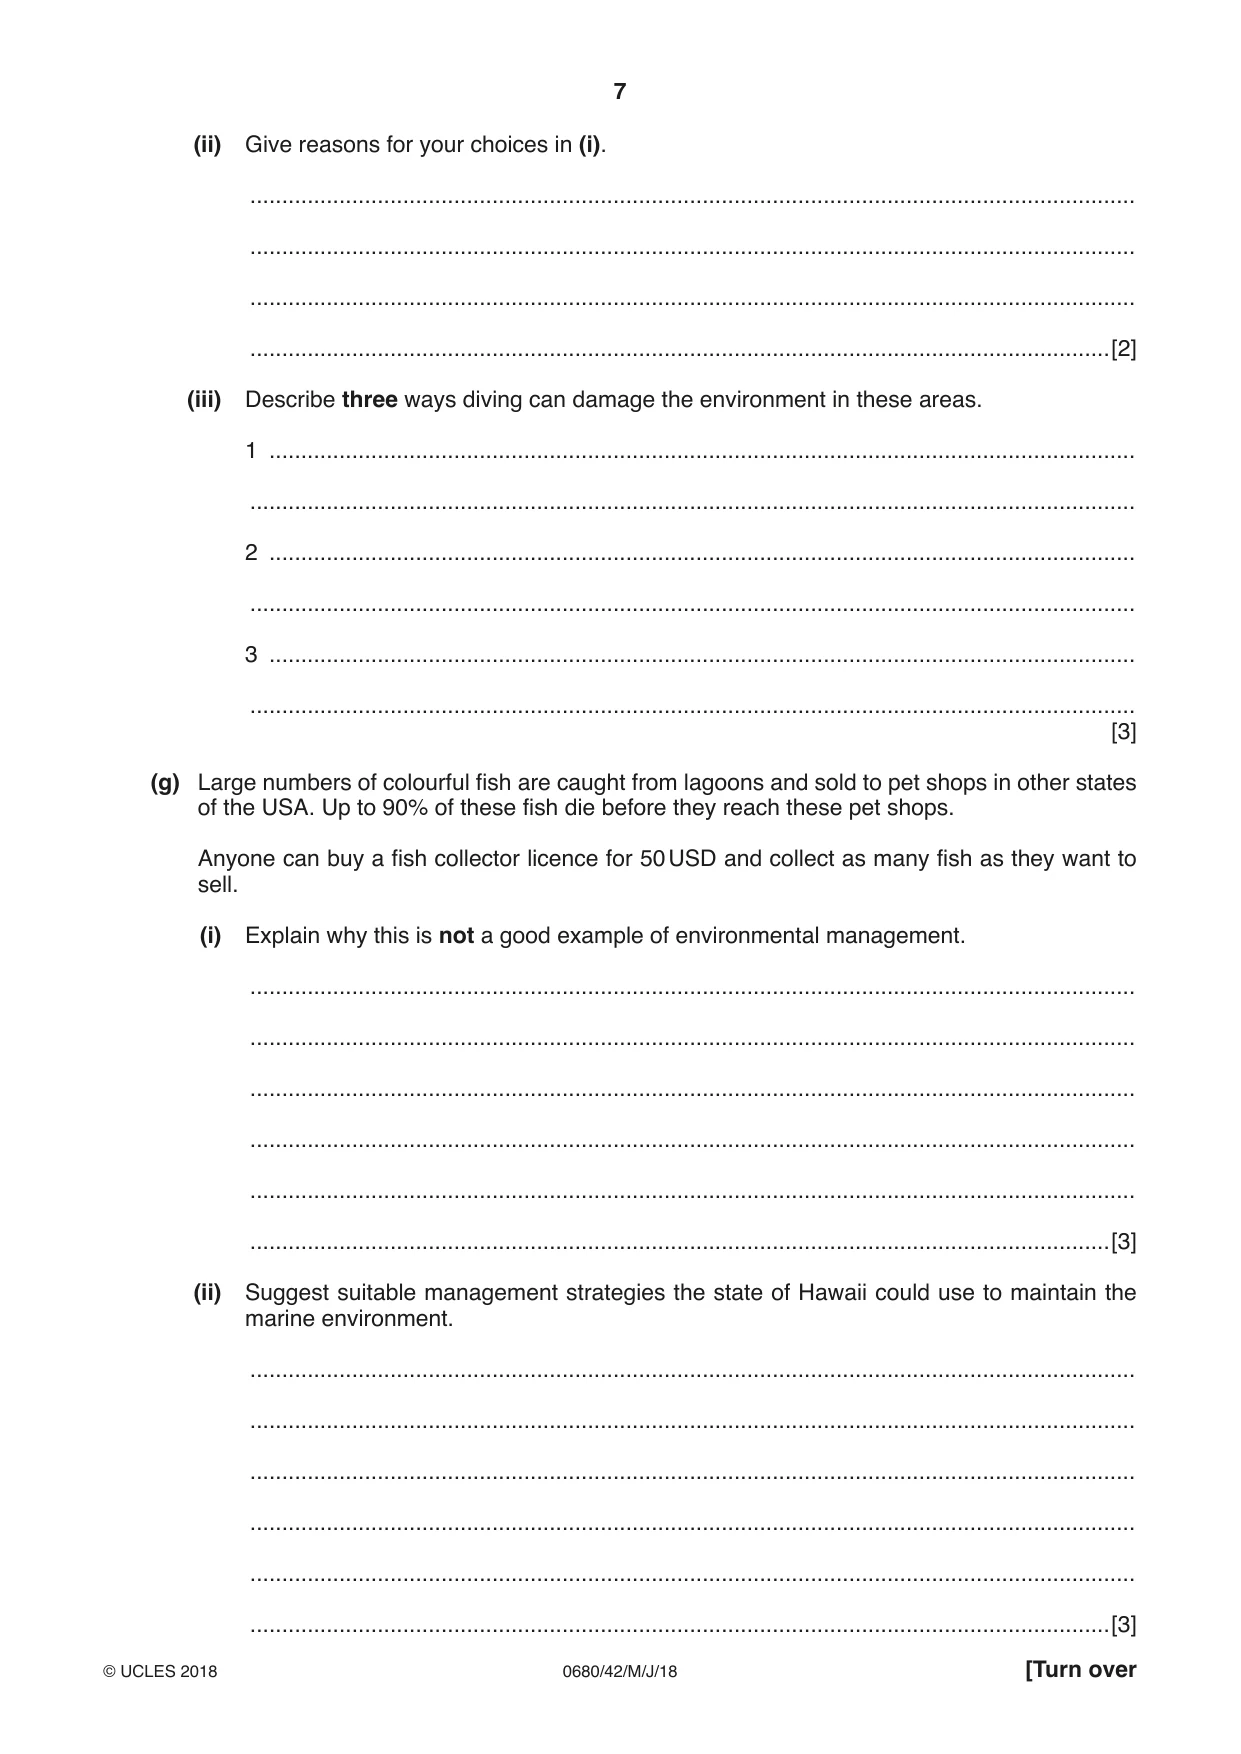
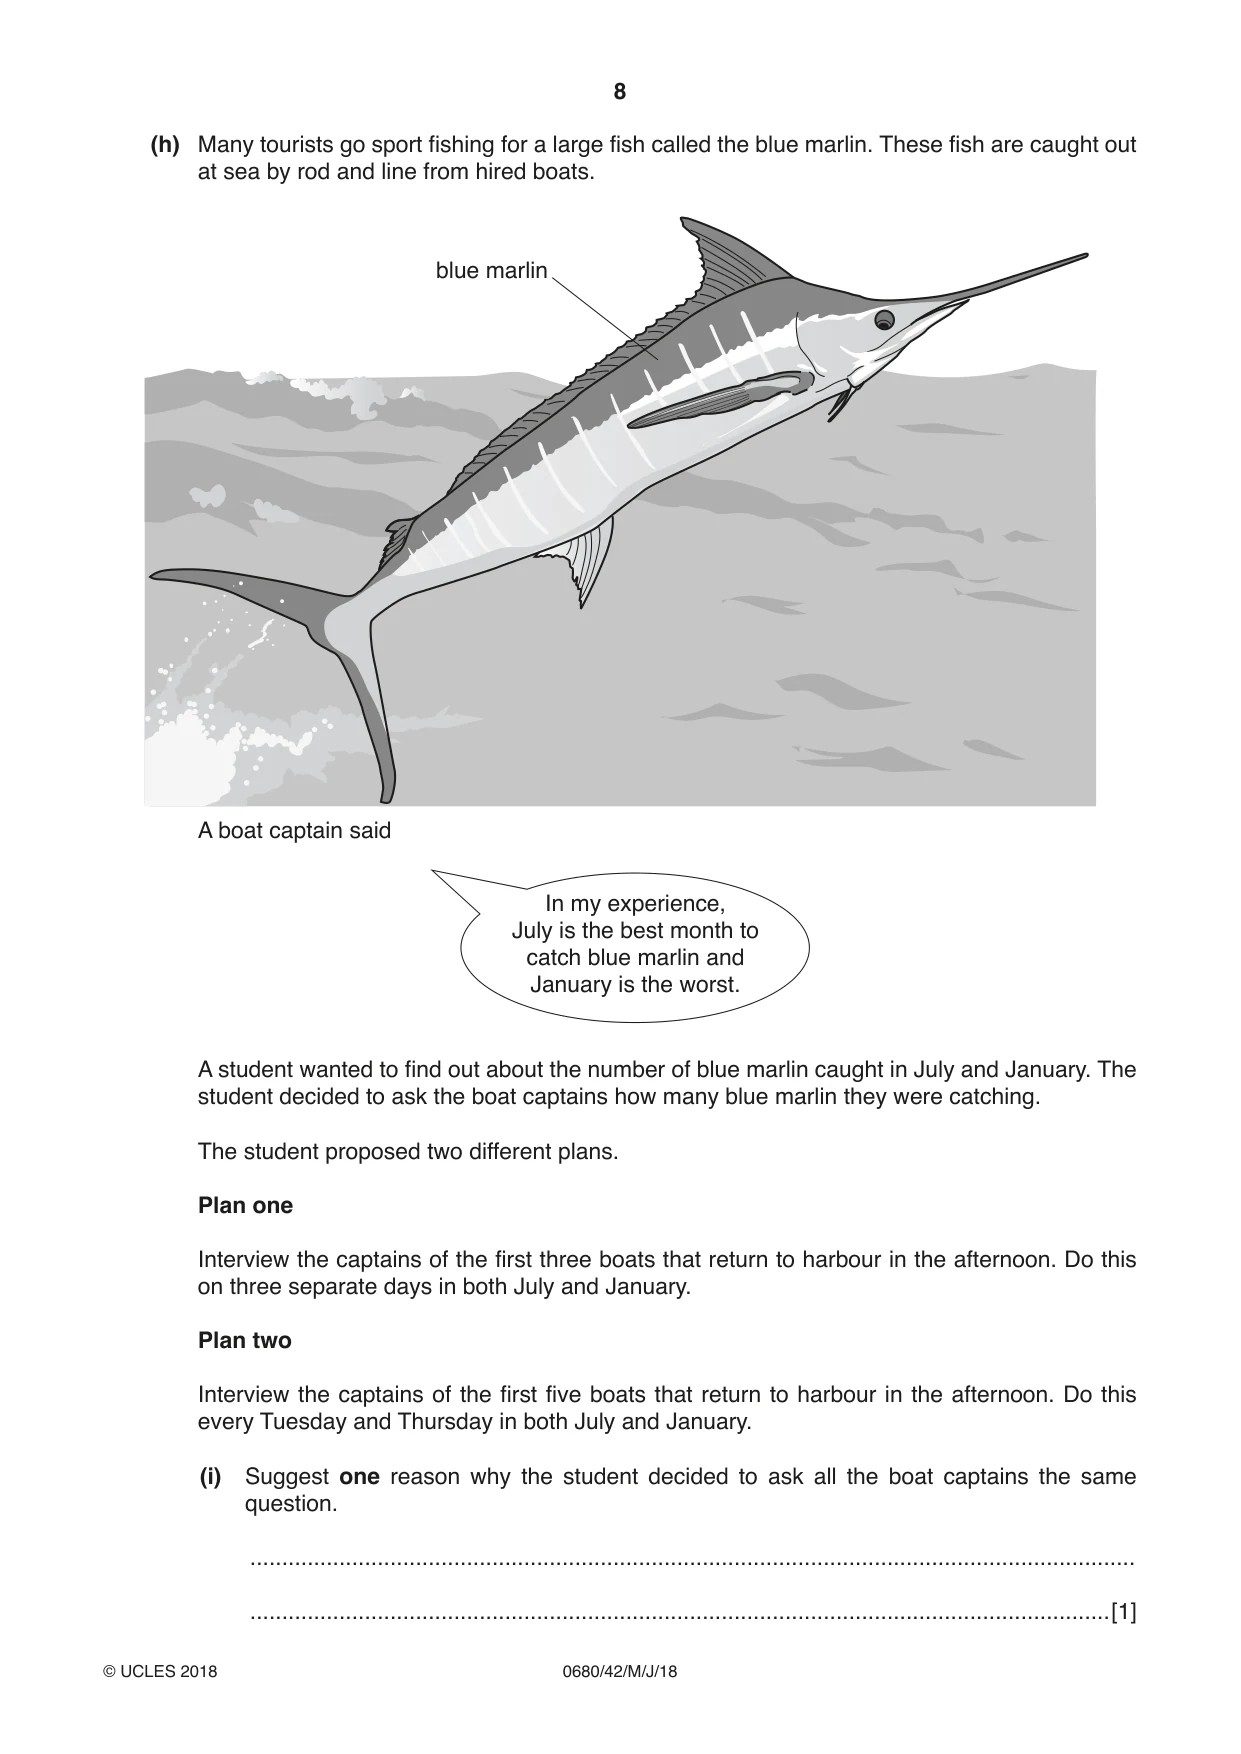
1 Hawaii is a state of the USA, it is a long chain of volcanic islands. People only live on the larger islands. The small islands are uninhabited. Crops are grown on the lower slopes of the volcanoes. More than six million tourists visit this state every year. (a) Use the map and scale to estimate the distance between Oahu island and Laysan island ...........................................................km Oahu island and Midway island ..........................................................km [2] (b) The population of the four largest Hawaiian islands is shown in the table. island population in 2015 Hawaii 202 700 Oahu 976 200 Kauai 71 400 Maui 168 000 total ................................. (i) Calculate the total population in 2015. Complete the table. [1] (ii) Calculate the percentage of the total population that lived on the island of Oahu in 2015. Give your answer to one decimal place. Show your working. ........................................................% [2] (c) The table shows climate data from a weather station on Oahu. month Jan Feb Mar Apr May Jun Jul Aug Sep Oct Nov Dec average 22 22 23 23 24 25 25 25 25 25 24 23 monthly temperature / °C average 106 66 78 48 25 18 23 28 36 48 67 107 monthly rainfall / mm average 66 67 65 64 64 63 63 64 65 66 67 68 monthly relative humidity at midday / % (i) Calculate the annual average temperature range on Oahu. .......................................................°C [1] (ii) Name the driest month and the wettest month. driest ................................... wettest ..................................[1] (d) Large numbers of tourists visit the Hawaiian islands in every month of the year. Using information from the table, suggest three reasons why tourists can visit at any time of year. ................................................................................................................................................... ................................................................................................................................................... ................................................................................................................................................... ................................................................................................................................................... ................................................................................................................................................... ...............................................................................................................................................[3] (e) The number of hotel rooms for tourists on the Hawaiian islands has doubled in recent years. Suggest three ways that this development could cause environmental damage. ................................................................................................................................................... ................................................................................................................................................... ................................................................................................................................................... ................................................................................................................................................... ................................................................................................................................................... ...............................................................................................................................................[3] (f) Many tourists visit the Hawaiian islands to dive in lagoons formed by coral reefs and see the colourful wildlife. The map shows the location of the main diving sites on the island of Oahu. Oahu diving sites 1 2,3 4 20 N 5,6 7 8 9 19 Key State 10 capital 11 18 Honolulu 17 12 13 14,15 16 0 20 km (i) Using the map, circle the two areas where you would expect to find the most damage as a result of diving. 2–6 7–10 11–15 16–19 [1] (ii) Give reasons for your choices in (i). ........................................................................................................................................... ........................................................................................................................................... ........................................................................................................................................... .......................................................................................................................................[2] (iii) Describe three ways diving can damage the environment in these areas. 1 ........................................................................................................................................ ........................................................................................................................................... 2 ........................................................................................................................................ ........................................................................................................................................... 3 ........................................................................................................................................ ........................................................................................................................................... [3] (g) Large numbers of colourful fish are caught from lagoons and sold to pet shops in other states of the USA. Up to 90% of these fish die before they reach these pet shops. Anyone can buy a fish collector licence for 50 USD and collect as many fish as they want to sell. (i) Explain why this is not a good example of environmental management. ........................................................................................................................................... ........................................................................................................................................... ........................................................................................................................................... ........................................................................................................................................... ........................................................................................................................................... .......................................................................................................................................[3] (ii) Suggest suitable management strategies the state of Hawaii could use to maintain the marine environment. ........................................................................................................................................... ........................................................................................................................................... ........................................................................................................................................... ........................................................................................................................................... ........................................................................................................................................... .......................................................................................................................................[3] (h) Many tourists go sport fishing for a large fish called the blue marlin. These fish are caught out at sea by rod and line from hired boats. blue marlin A boat captain said In my experience, July is the best month to catch blue marlin and January is the worst. A student wanted to find out about the number of blue marlin caught in July and January. The student decided to ask the boat captains how many blue marlin they were catching. The student proposed two different plans. Plan one Interview the captains of the first three boats that return to harbour in the afternoon. Do this on three separate days in both July and January. Plan two Interview the captains of the first five boats that return to harbour in the afternoon. Do this every Tuesday and Thursday in both July and January. (i) Suggest one reason why the student decided to ask all the boat captains the same question. ........................................................................................................................................... .......................................................................................................................................[1] (ii) Explain why plan two is a better method than plan one. ........................................................................................................................................... ........................................................................................................................................... ........................................................................................................................................... .......................................................................................................................................[2] (iii) Draw a table to record the results of plan two for one week in January. [3]
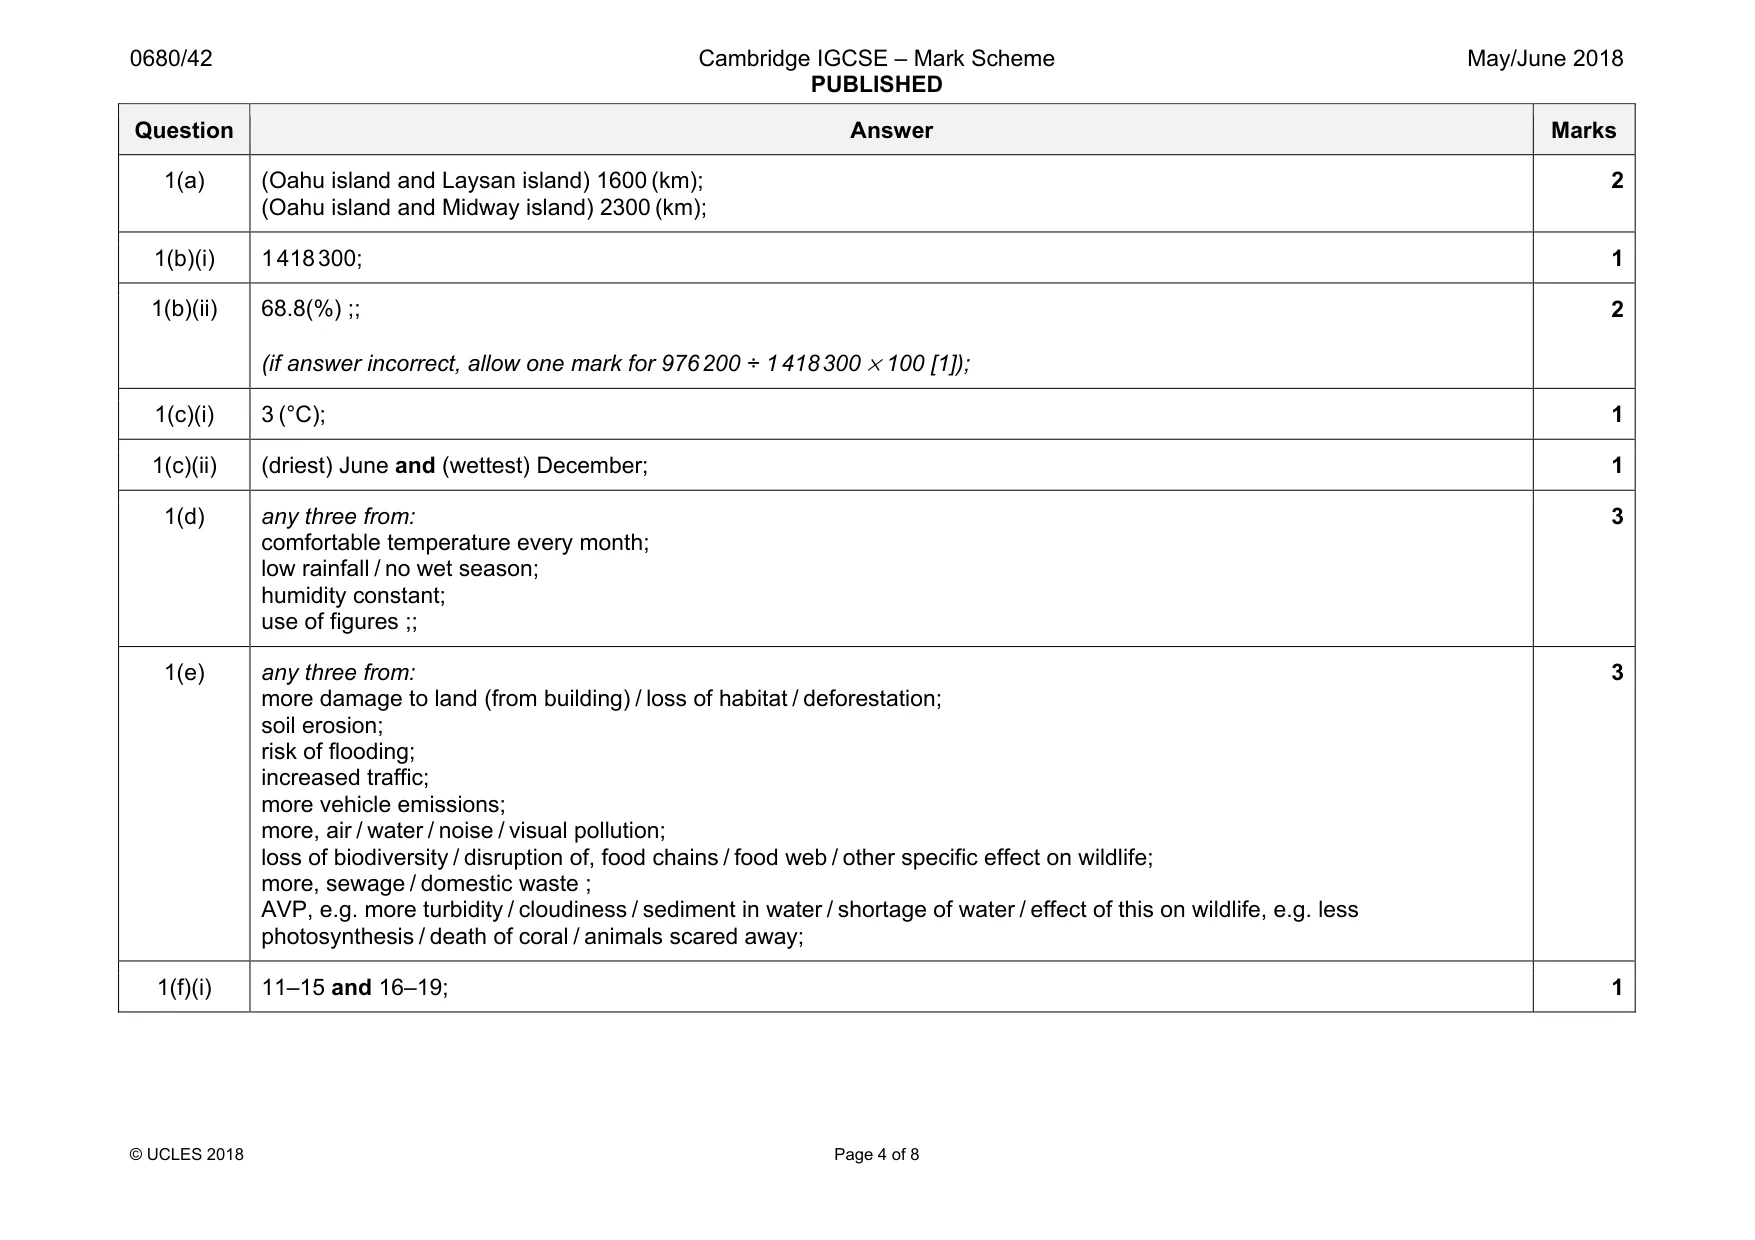
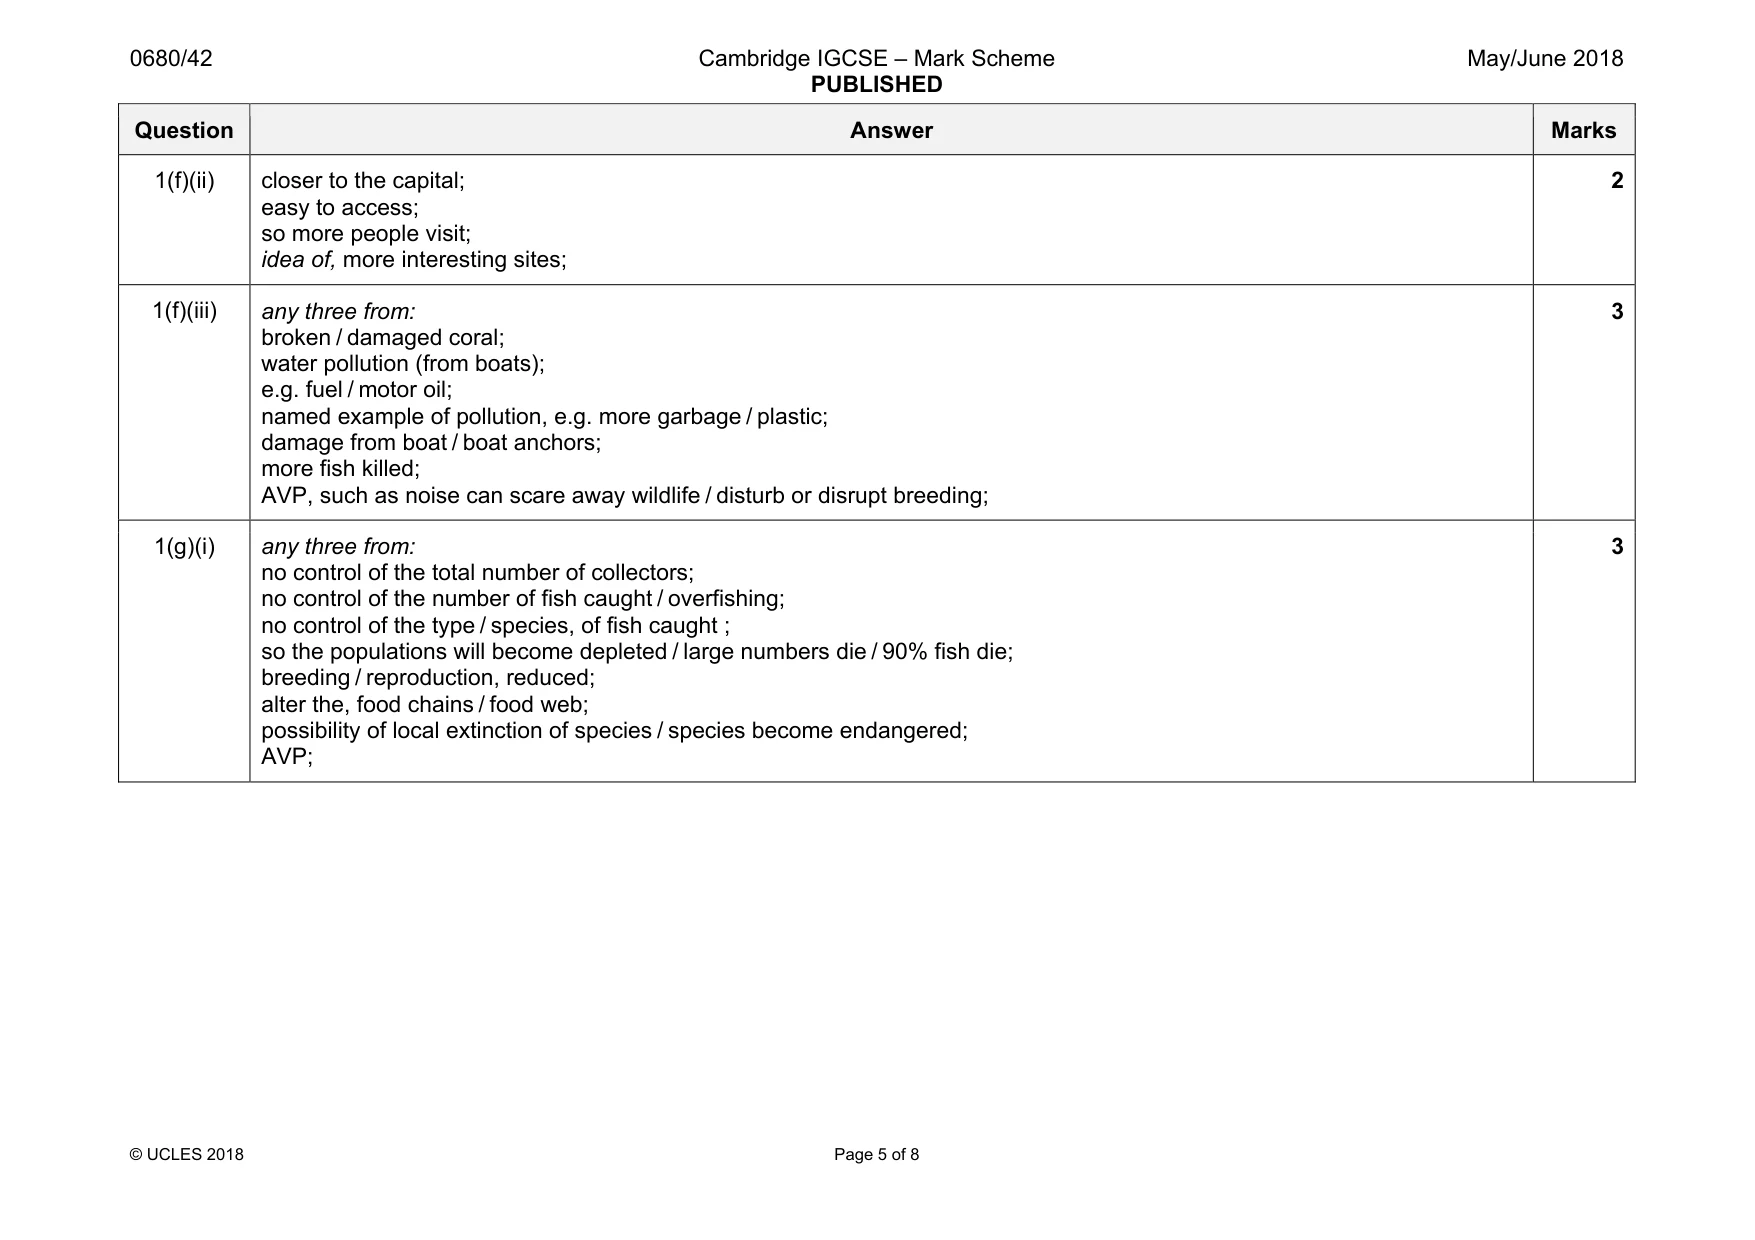
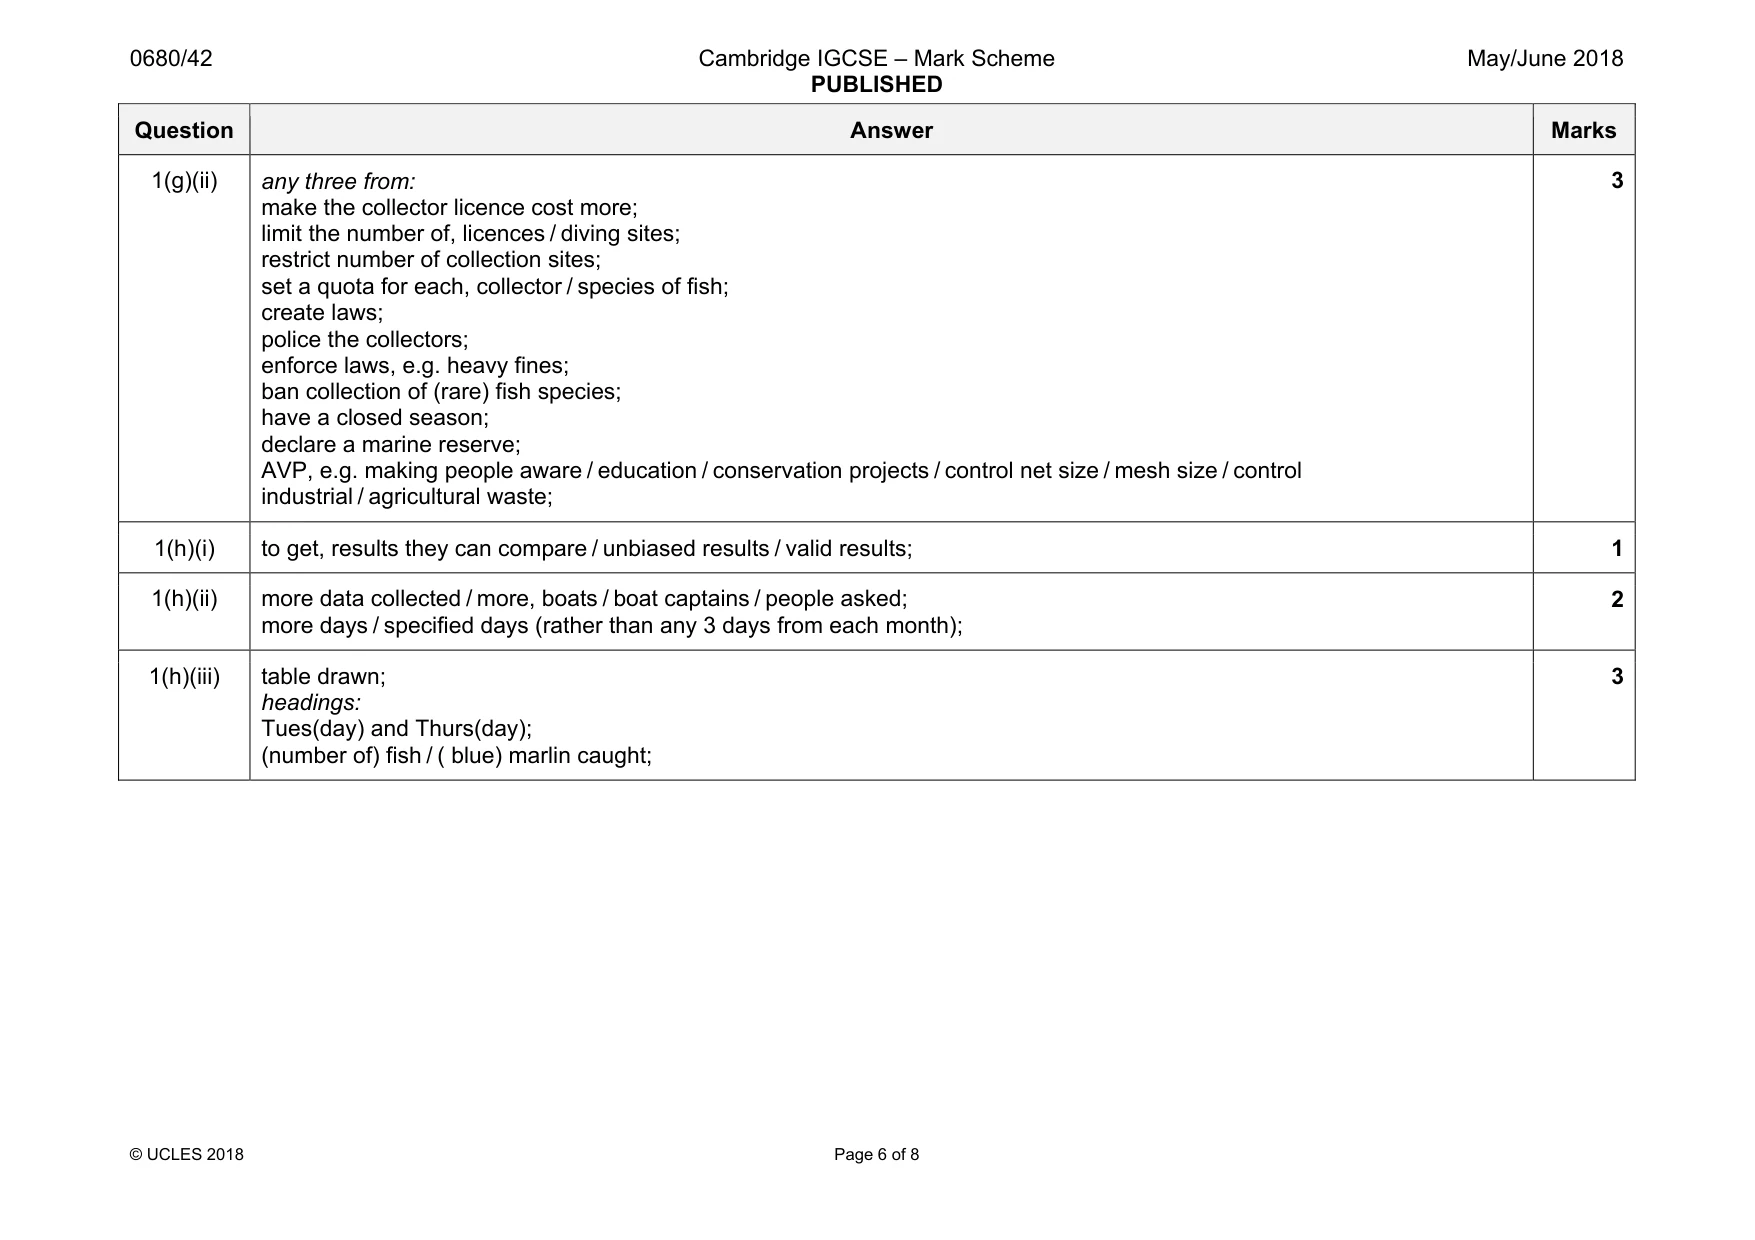
Mark scheme: 1(a) (Oahu island and Laysan island) 1600 (km); (Oahu island and Midway island) 2300 (km); 2 1(b)(i) 1418300; 1 1(b)(ii) 68.8(%) ;; (if answer incorrect, allow one mark for 976200 ÷ 1418300 × 100 [1]); 2 1(c)(i) 3 (°C); 1 1(c)(ii) (driest) June and (wettest) December; 1 1(d) any three from: comfortable temperature every month; low rainfall / no wet season; humidity constant; use of figures ;; 3 1(e) any three from: more damage to land (from building) / loss of habitat / deforestation; soil erosion; risk of flooding; increased traffic; more vehicle emissions; more, air / water / noise / visual pollution; loss of biodiversity / disruption of, food chains / food web / other specific effect on wildlife; more, sewage / domestic waste ; AVP, e.g. more turbidity / cloudiness / sediment in water / shortage of water / effect of this on wildlife, e.g. less photosynthesis / death of coral / animals scared away; 3 1(f)(i) 11–15 and 16–19; 1 Question Answer Marks 1(f)(ii) closer to the capital; easy to access; so more people visit; idea of, more interesting sites; 2 1(f)(iii) any three from: broken / damaged coral; water pollution (from boats); e.g. fuel / motor oil; named example of pollution, e.g. more garbage / plastic; damage from boat / boat anchors; more fish killed; AVP, such as noise can scare away wildlife / disturb or disrupt breeding; 3 1(g)(i) any three from: no control of the total number of collectors; no control of the number of fish caught / overfishing; no control of the type / species, of fish caught ; so the populations will become depleted / large numbers die / 90% fish die; breeding / reproduction, reduced; alter the, food chains / food web; possibility of local extinction of species / species become endangered; AVP; 3 Question Answer Marks 1(g)(ii) any three from: make the collector licence cost more; limit the number of, licences / diving sites; restrict number of collection sites; set a quota for each, collector / species of fish; create laws; police the collectors; enforce laws, e.g. heavy fines; ban collection of (rare) fish species; have a closed season; declare a marine reserve; AVP, e.g. making people aware / education / conservation projects / control net size / mesh size / control industrial / agricultural waste; 3 1(h)(i) to get, results they can compare / unbiased results / valid results; 1 1(h)(ii) more data collected / more, boats / boat captains / people asked; more days / specified days (rather than any 3 days from each month); 2 1(h)(iii) table drawn; headings: Tues(day) and Thurs(day); (number of) fish / ( blue) marlin caught; 3
Q2 · The photograph shows an albatross and chick
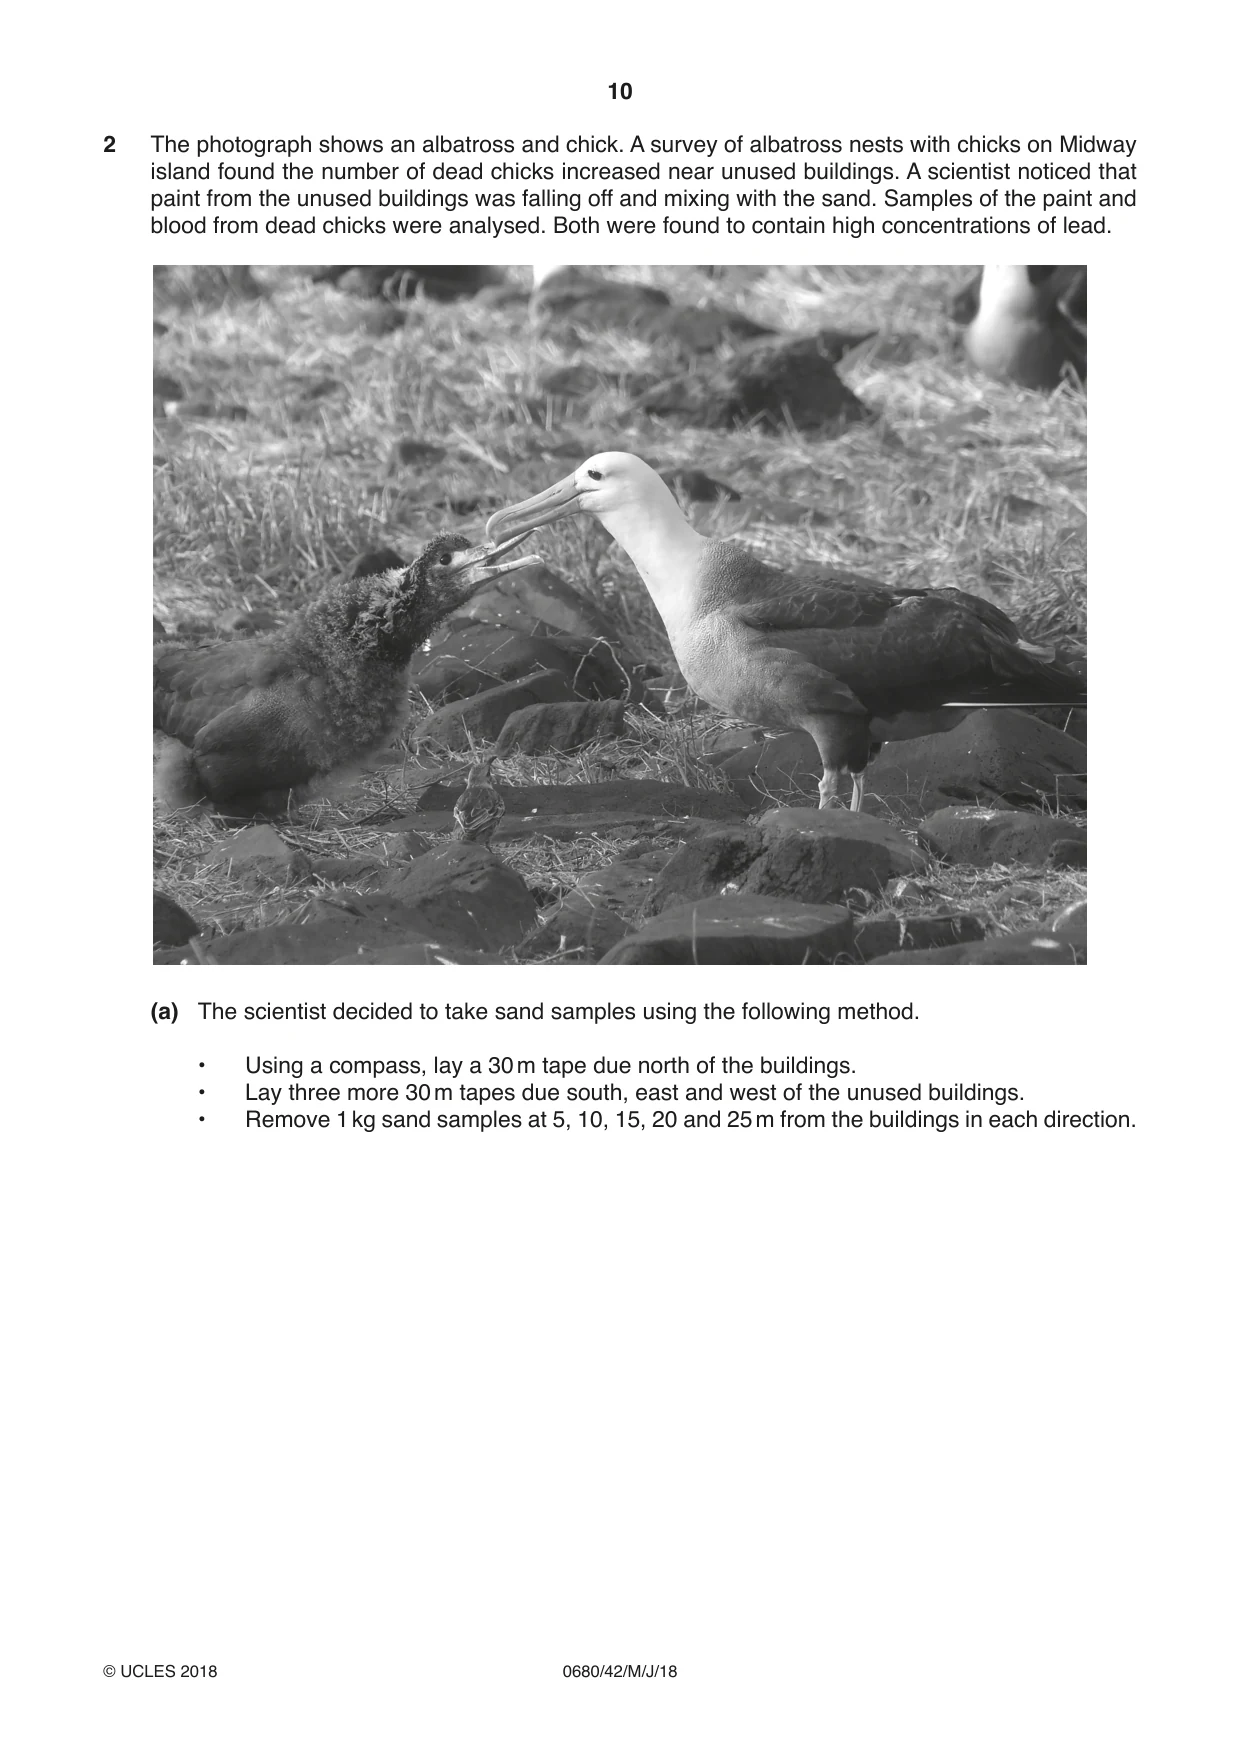
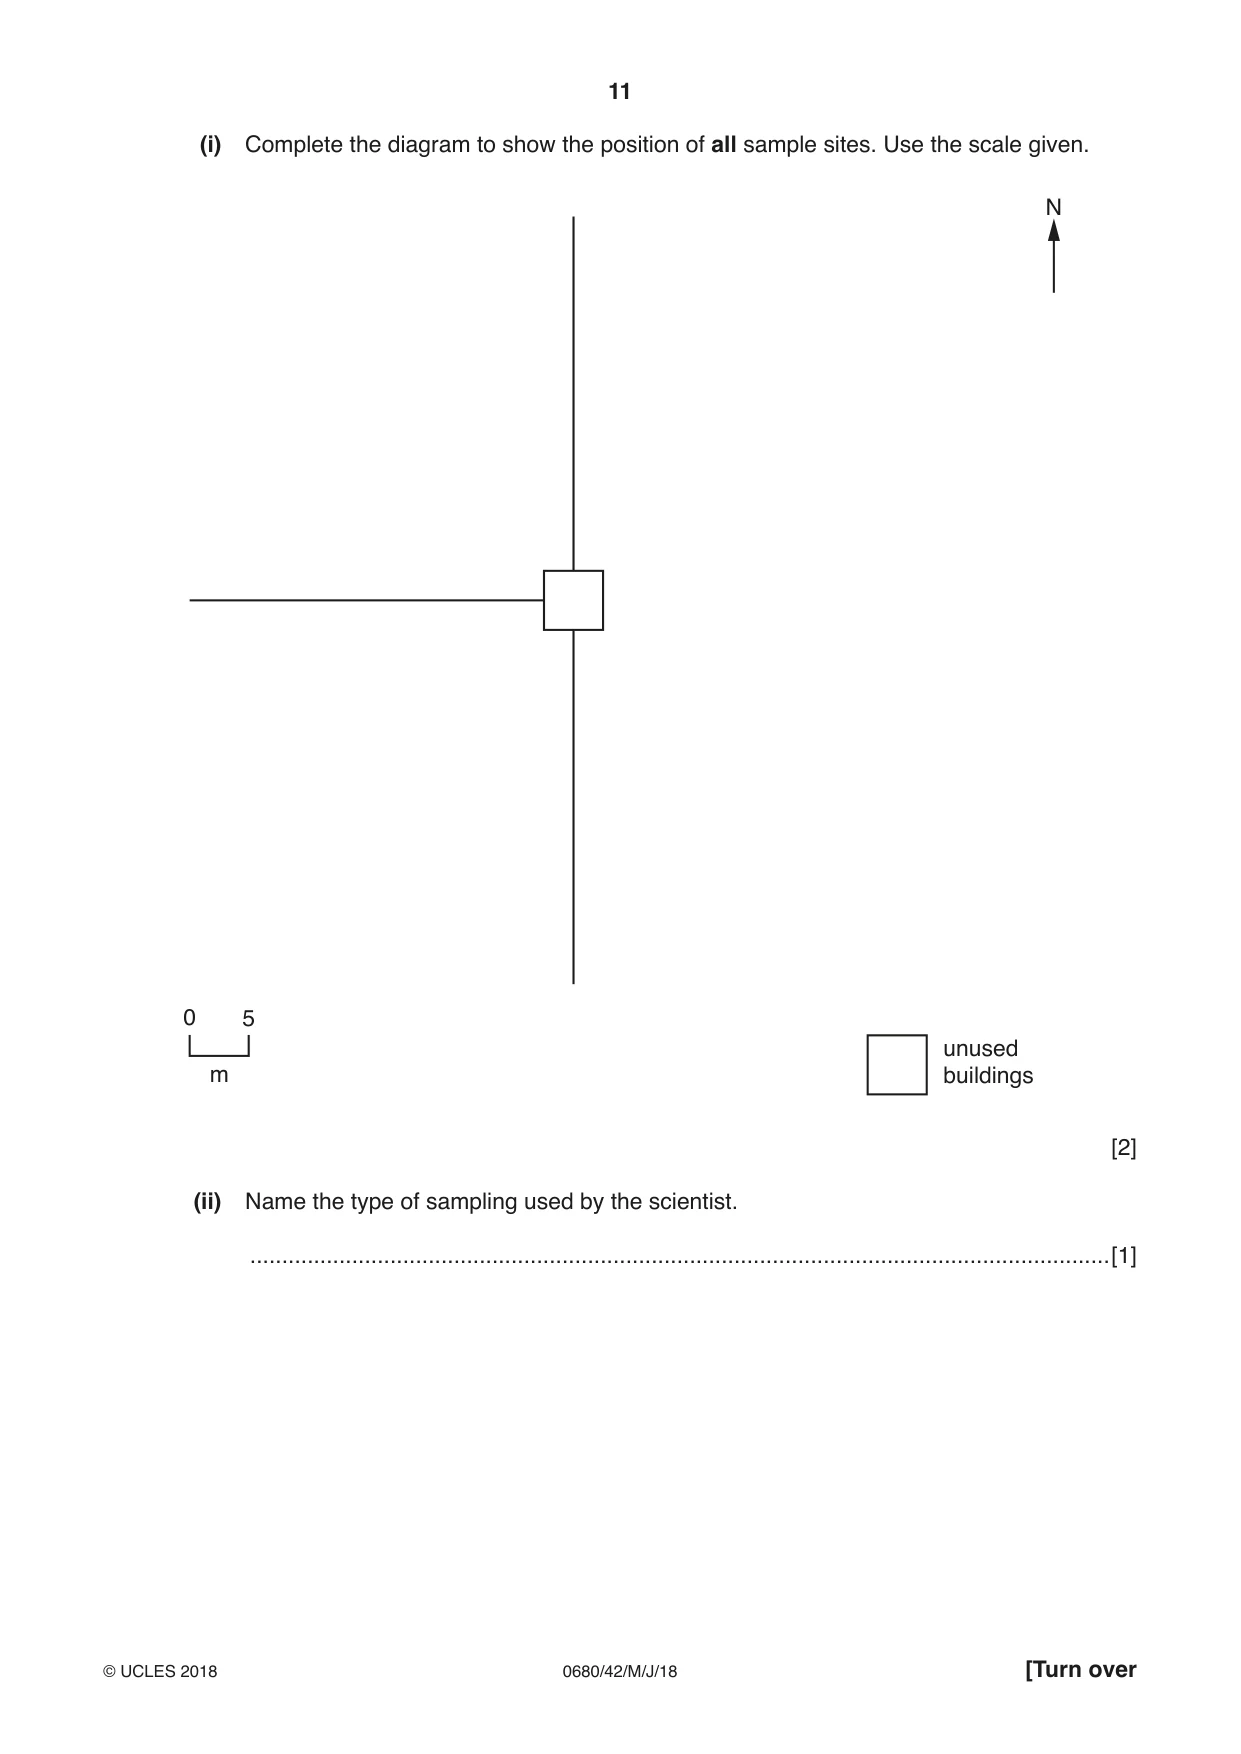
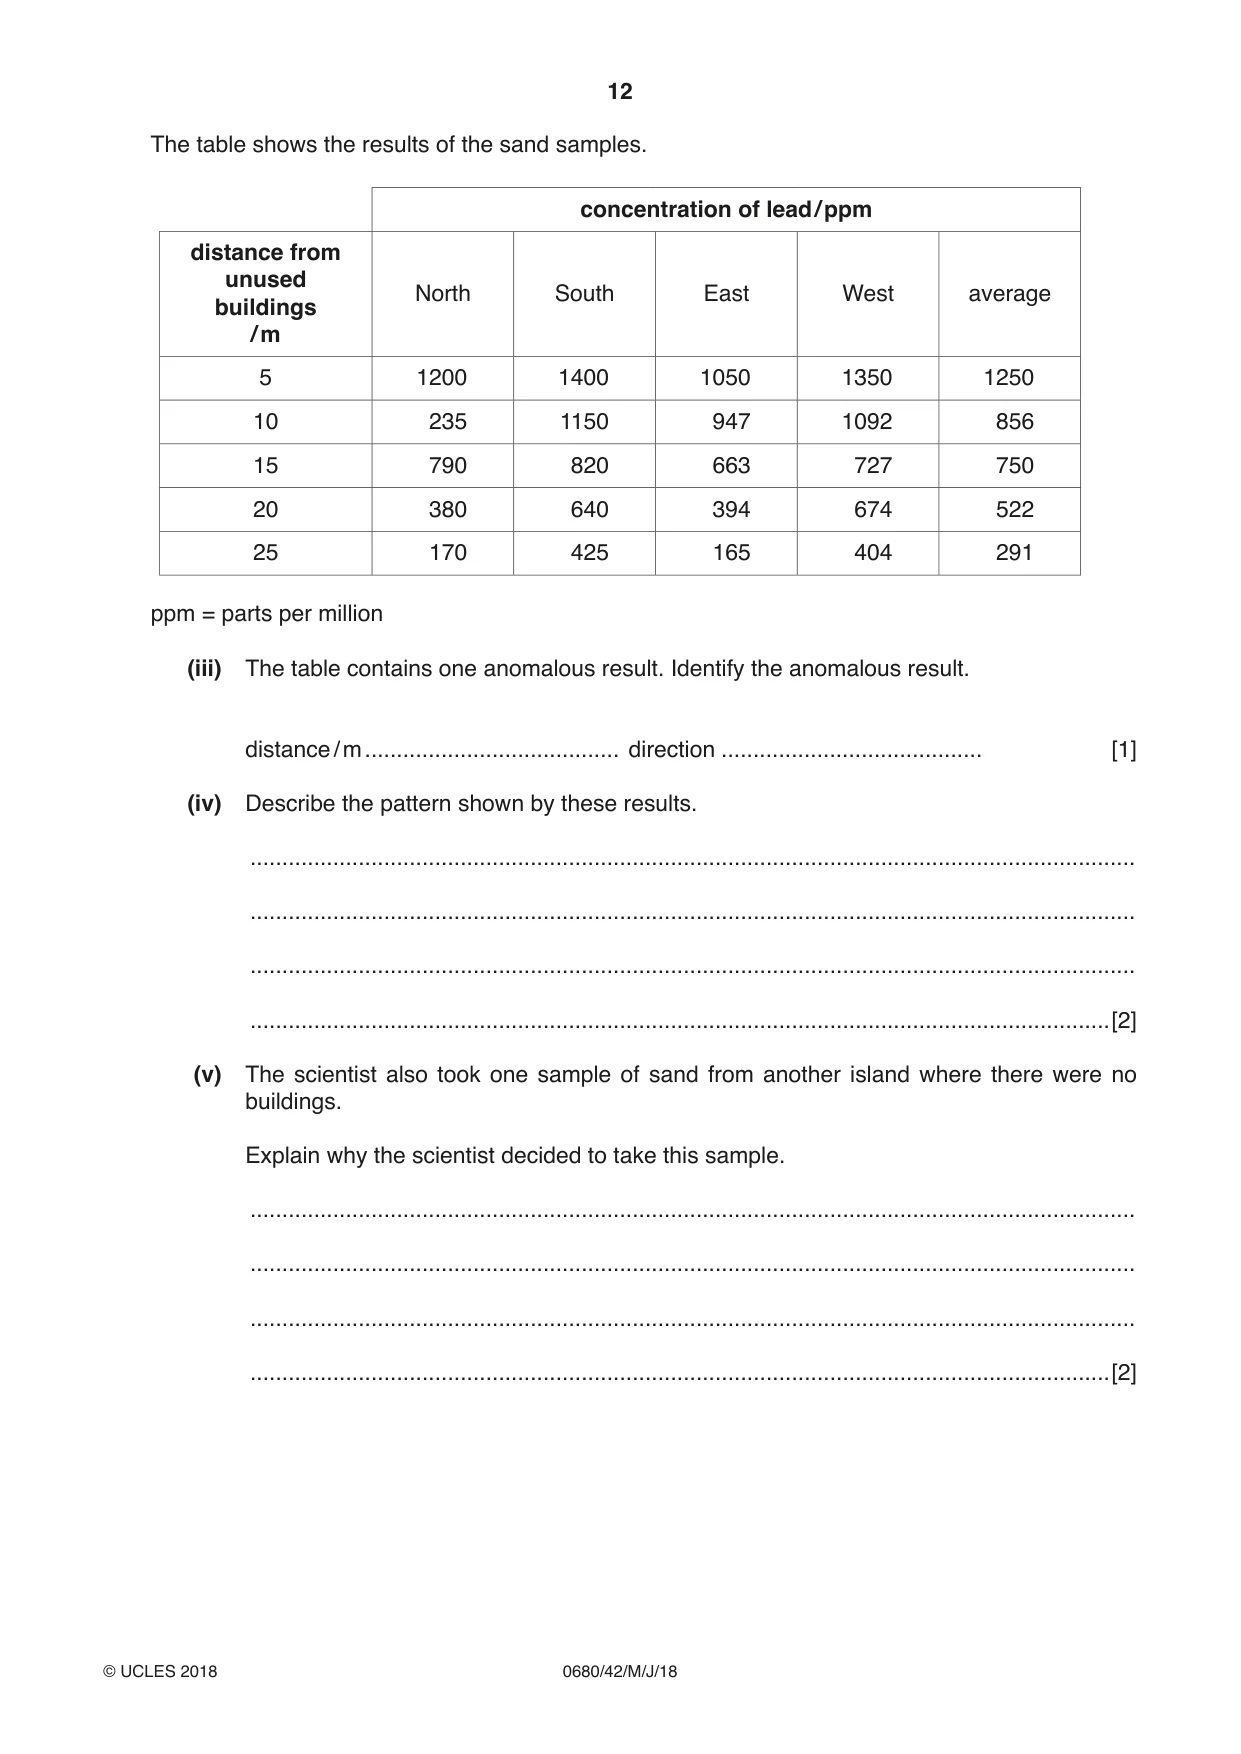
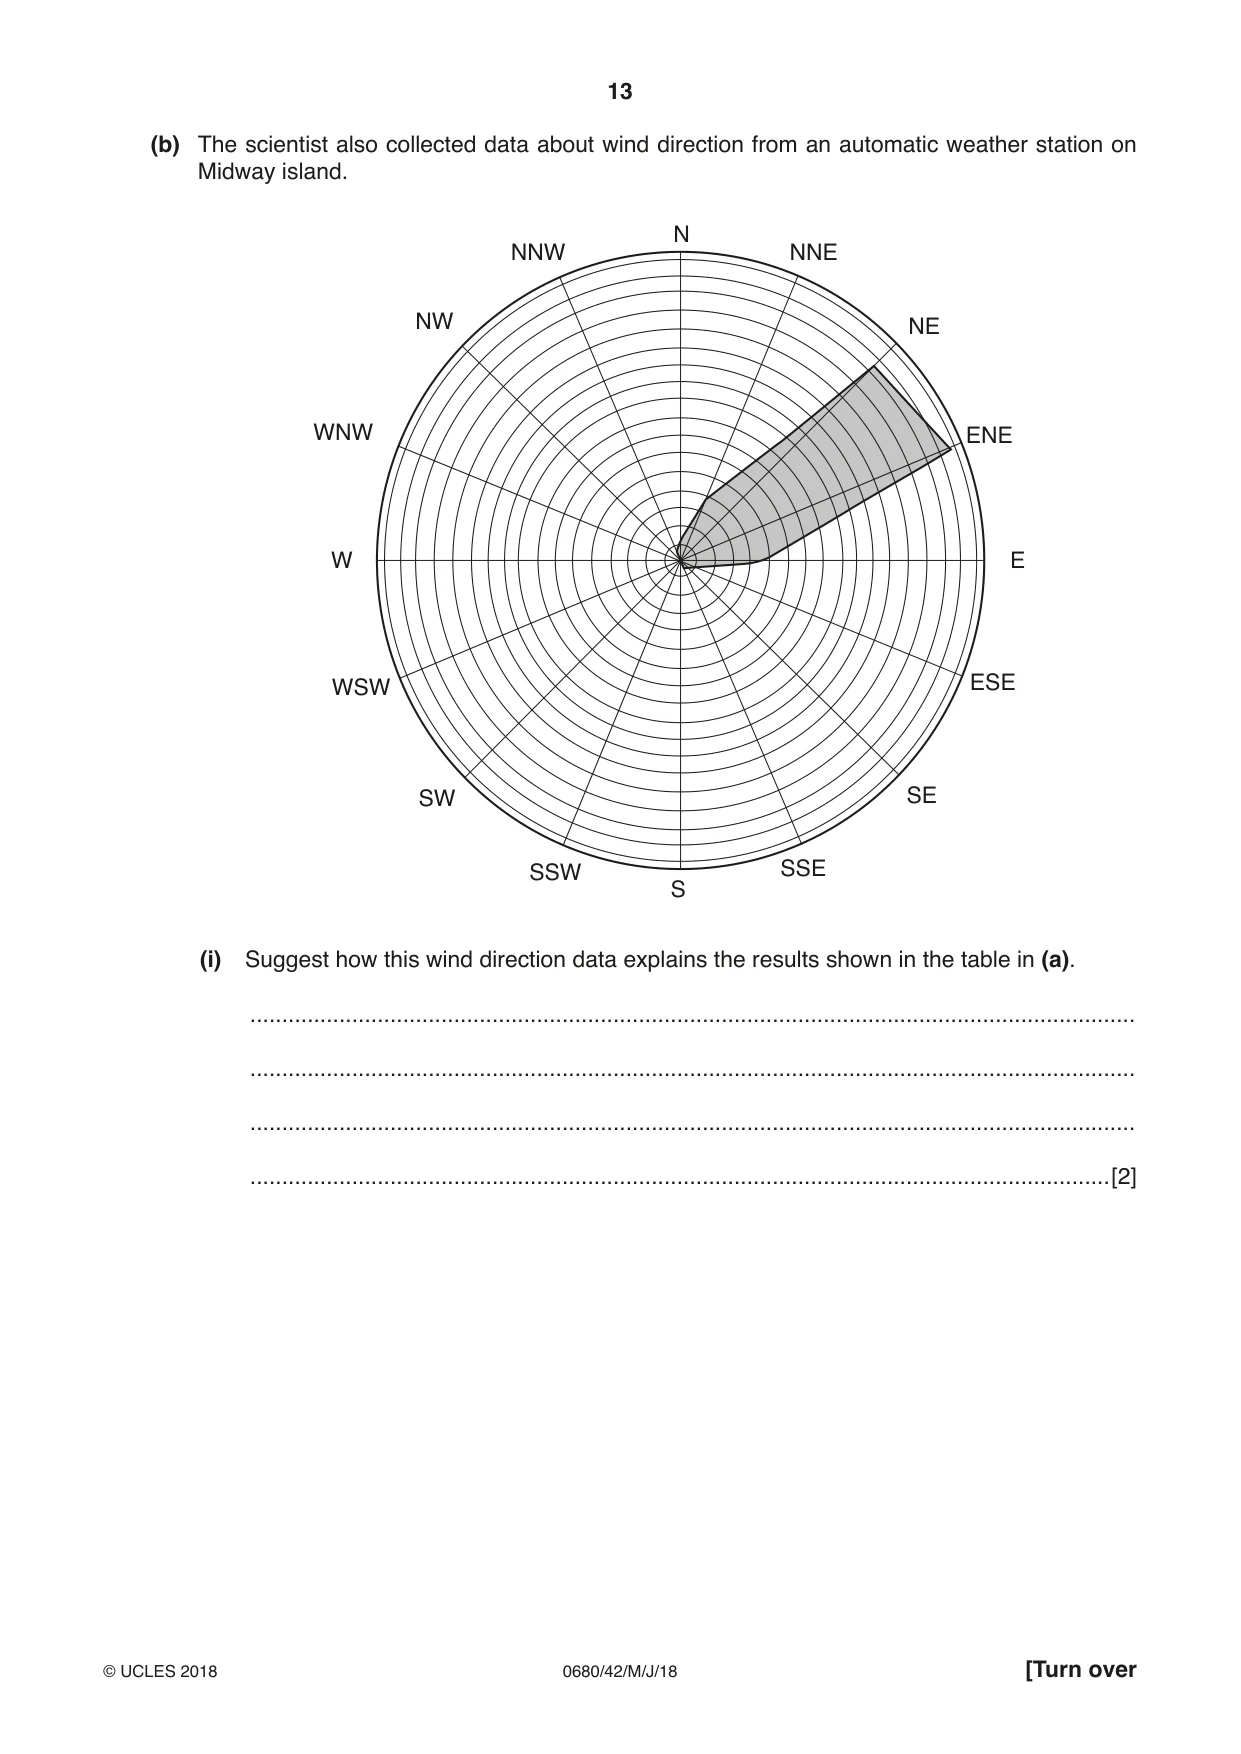
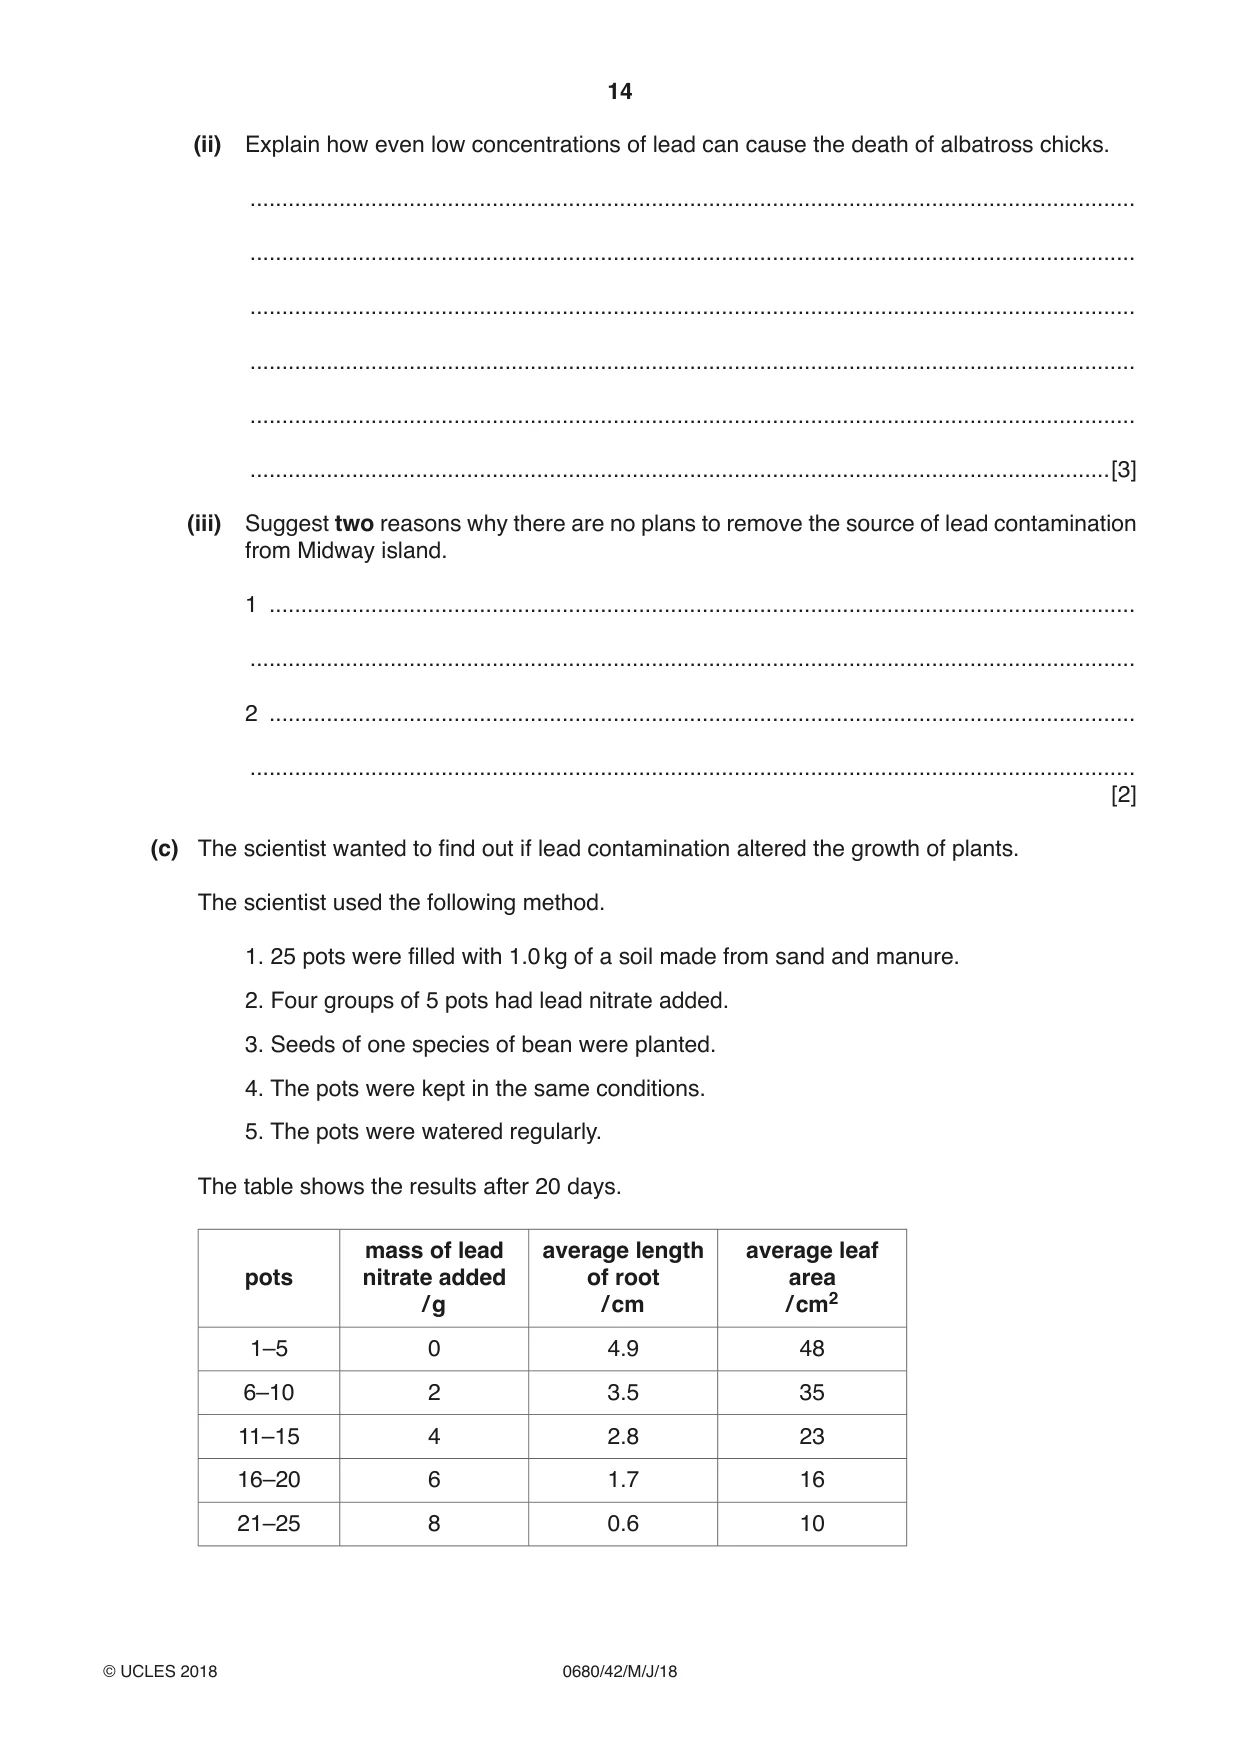
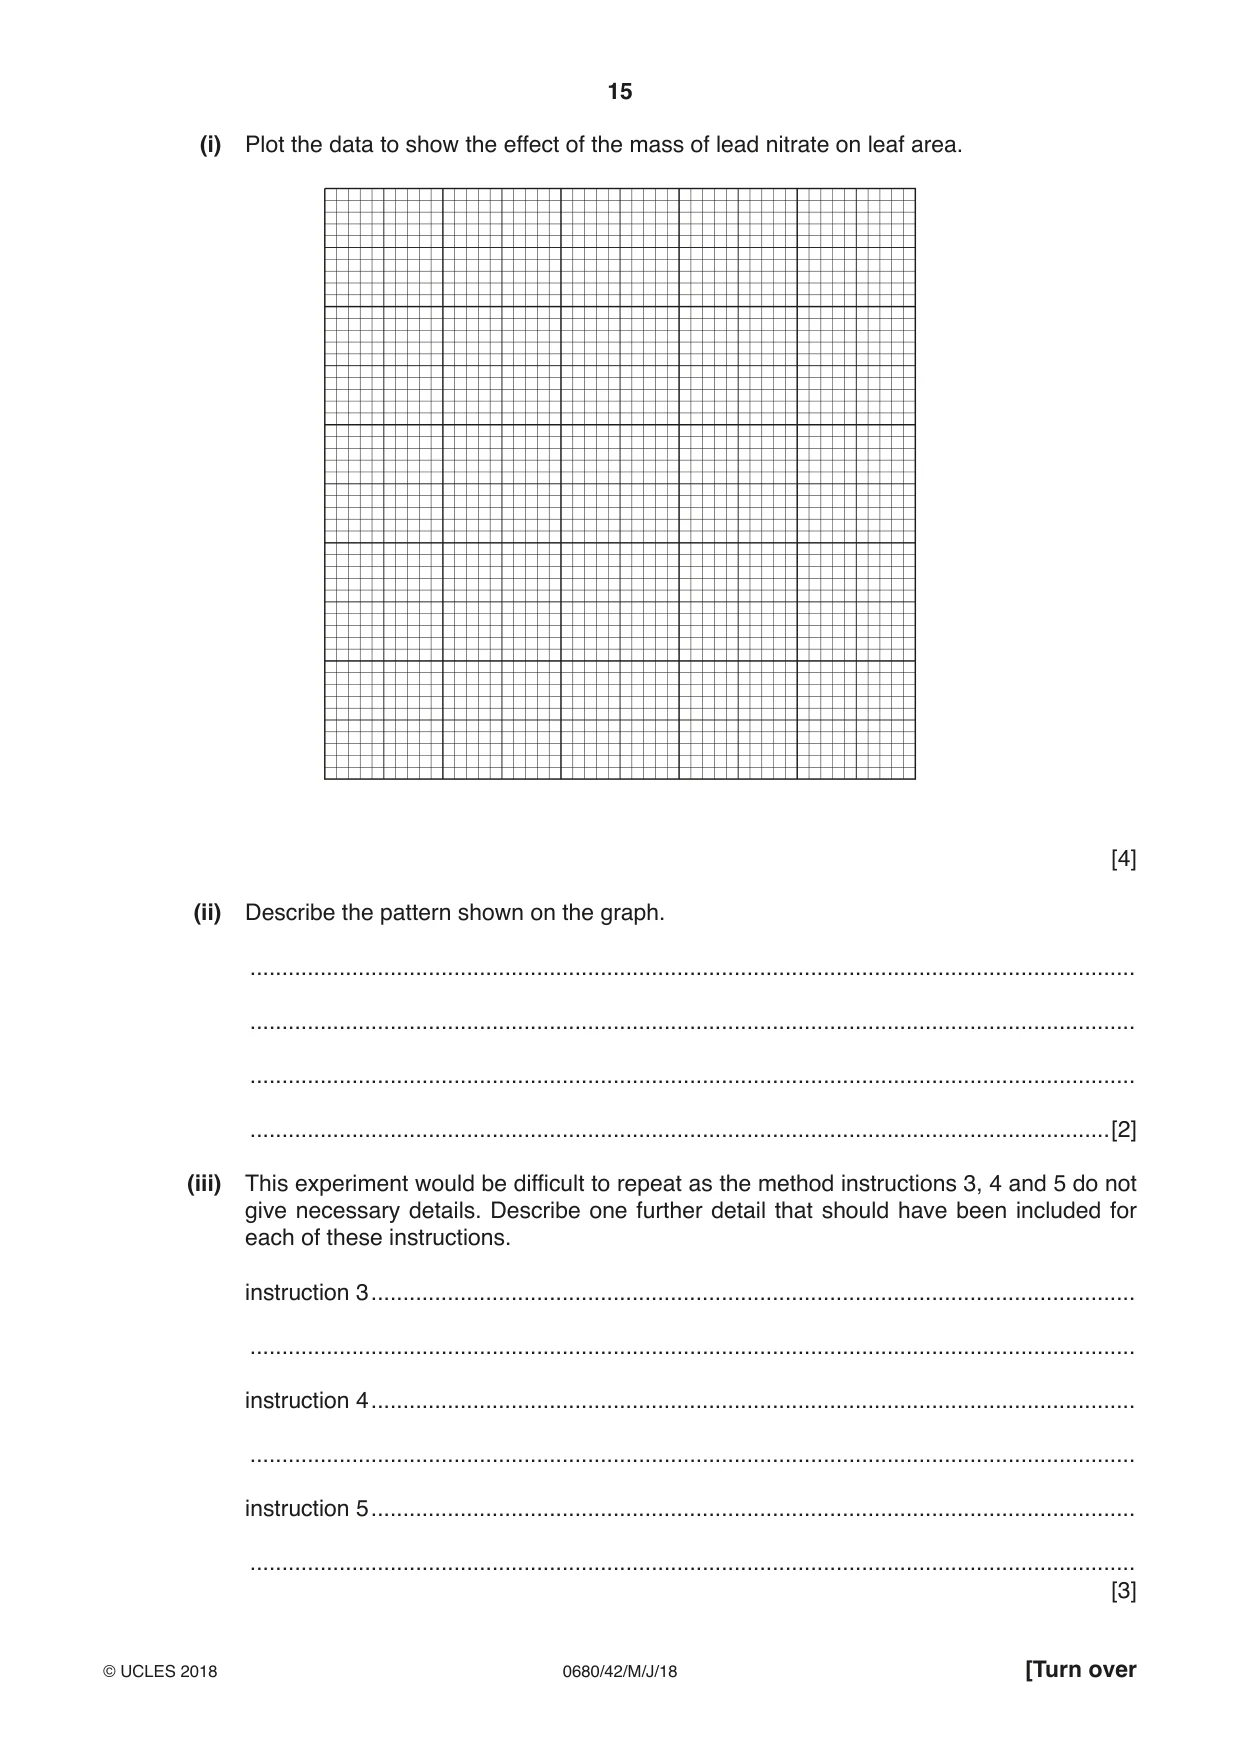
2 The photograph shows an albatross and chick. A survey of albatross nests with chicks on Midway island found the number of dead chicks increased near unused buildings. A scientist noticed that paint from the unused buildings was falling off and mixing with the sand. Samples of the paint and blood from dead chicks were analysed. Both were found to contain high concentrations of lead. (a) The scientist decided to take sand samples using the following method. • Using a compass, lay a 30 m tape due north of the buildings. • Lay three more 30 m tapes due south, east and west of the unused buildings. • Remove 1 kg sand samples at 5, 10, 15, 20 and 25 m from the buildings in each direction. (i) Complete the diagram to show the position of all sample sites. Use the scale given. N 0 5 unused m buildings [2] (ii) Name the type of sampling used by the scientist. .......................................................................................................................................[1] The table shows the results of the sand samples. concentration of lead / ppm distance from unused North South East West average buildings / m 5 1200 1400 1050 1350 1250 10 235 1150 947 1092 856 15 790 820 663 727 750 20 380 640 394 674 522 25 170 425 165 404 291 ppm = parts per million (iii) The table contains one anomalous result. Identify the anomalous result. distance / m ........................................ direction ......................................... [1] (iv) Describe the pattern shown by these results. ........................................................................................................................................... ........................................................................................................................................... ........................................................................................................................................... .......................................................................................................................................[2] (v) The scientist also took one sample of sand from another island where there were no buildings. Explain why the scientist decided to take this sample. ........................................................................................................................................... ........................................................................................................................................... ........................................................................................................................................... .......................................................................................................................................[2]
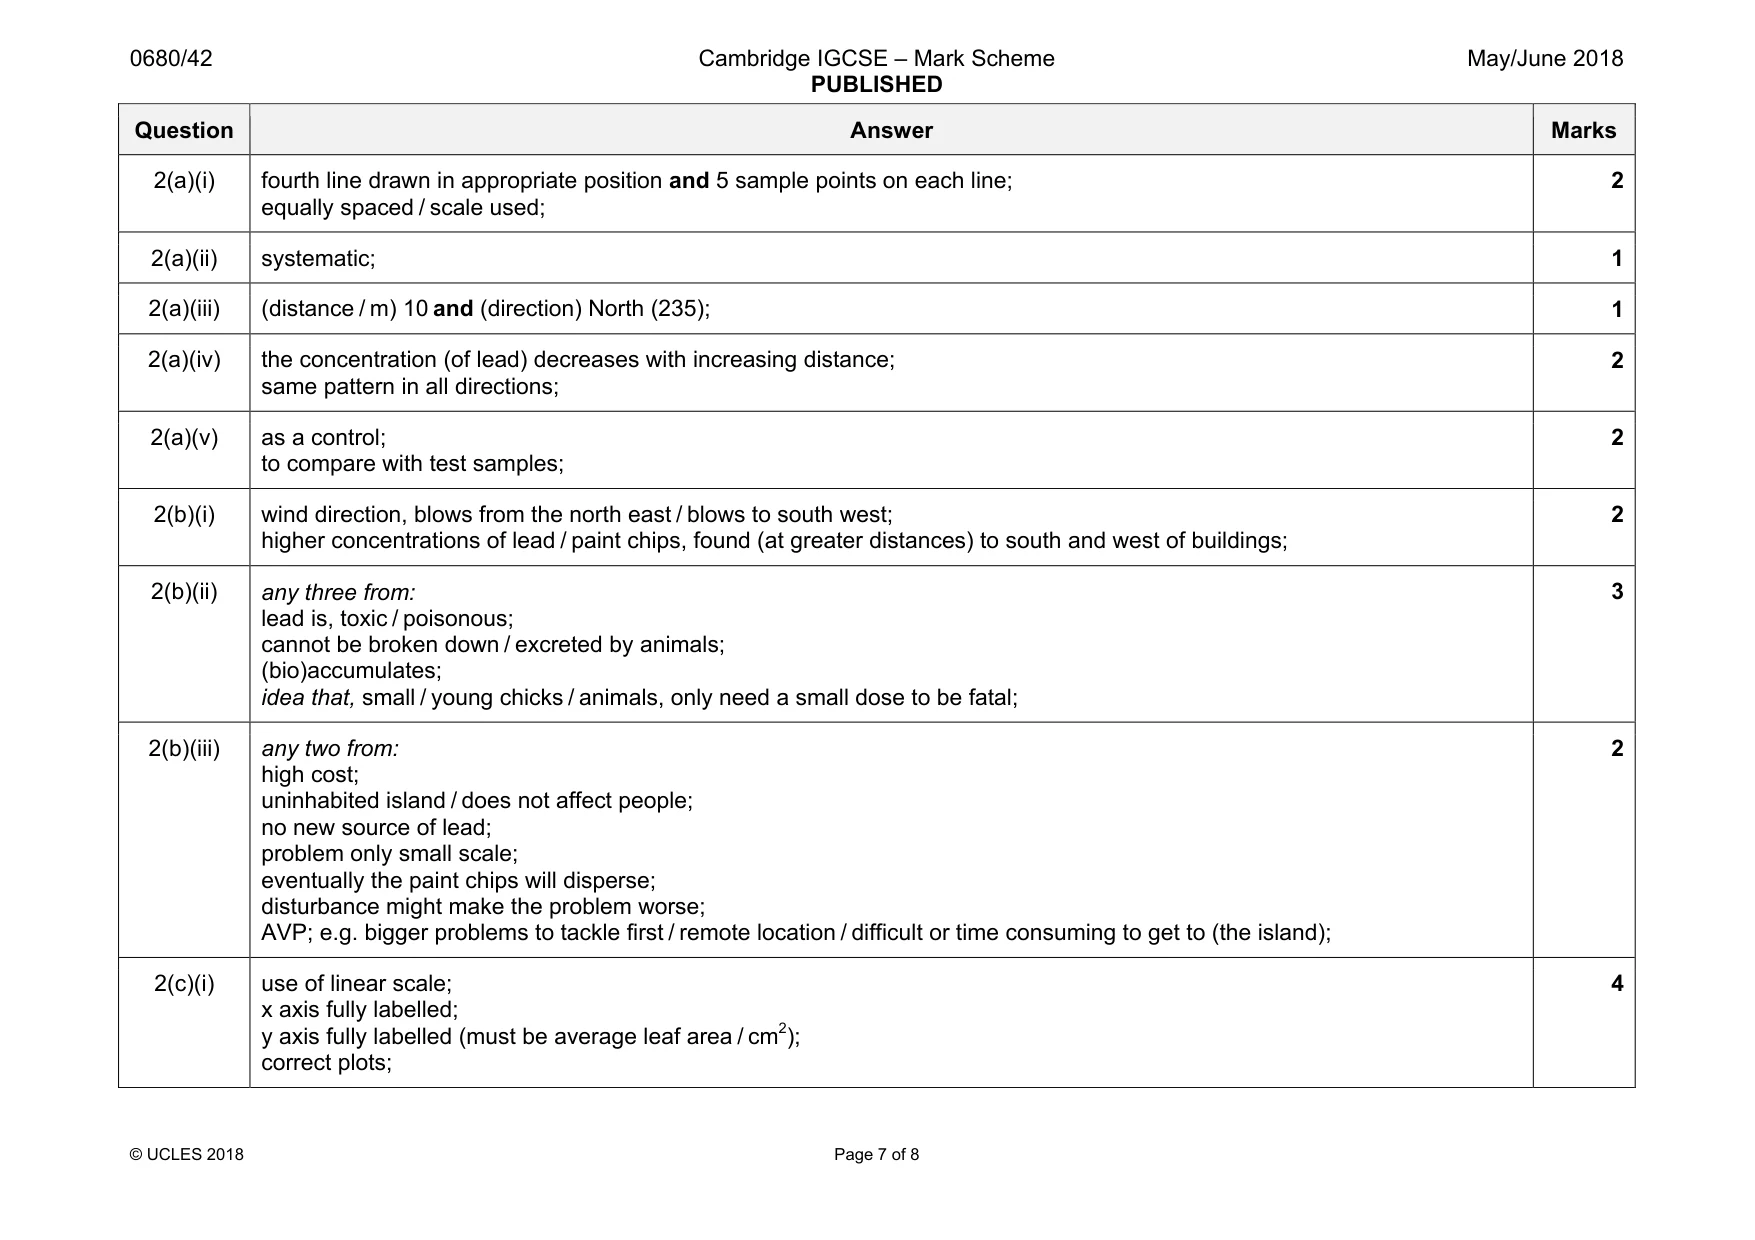
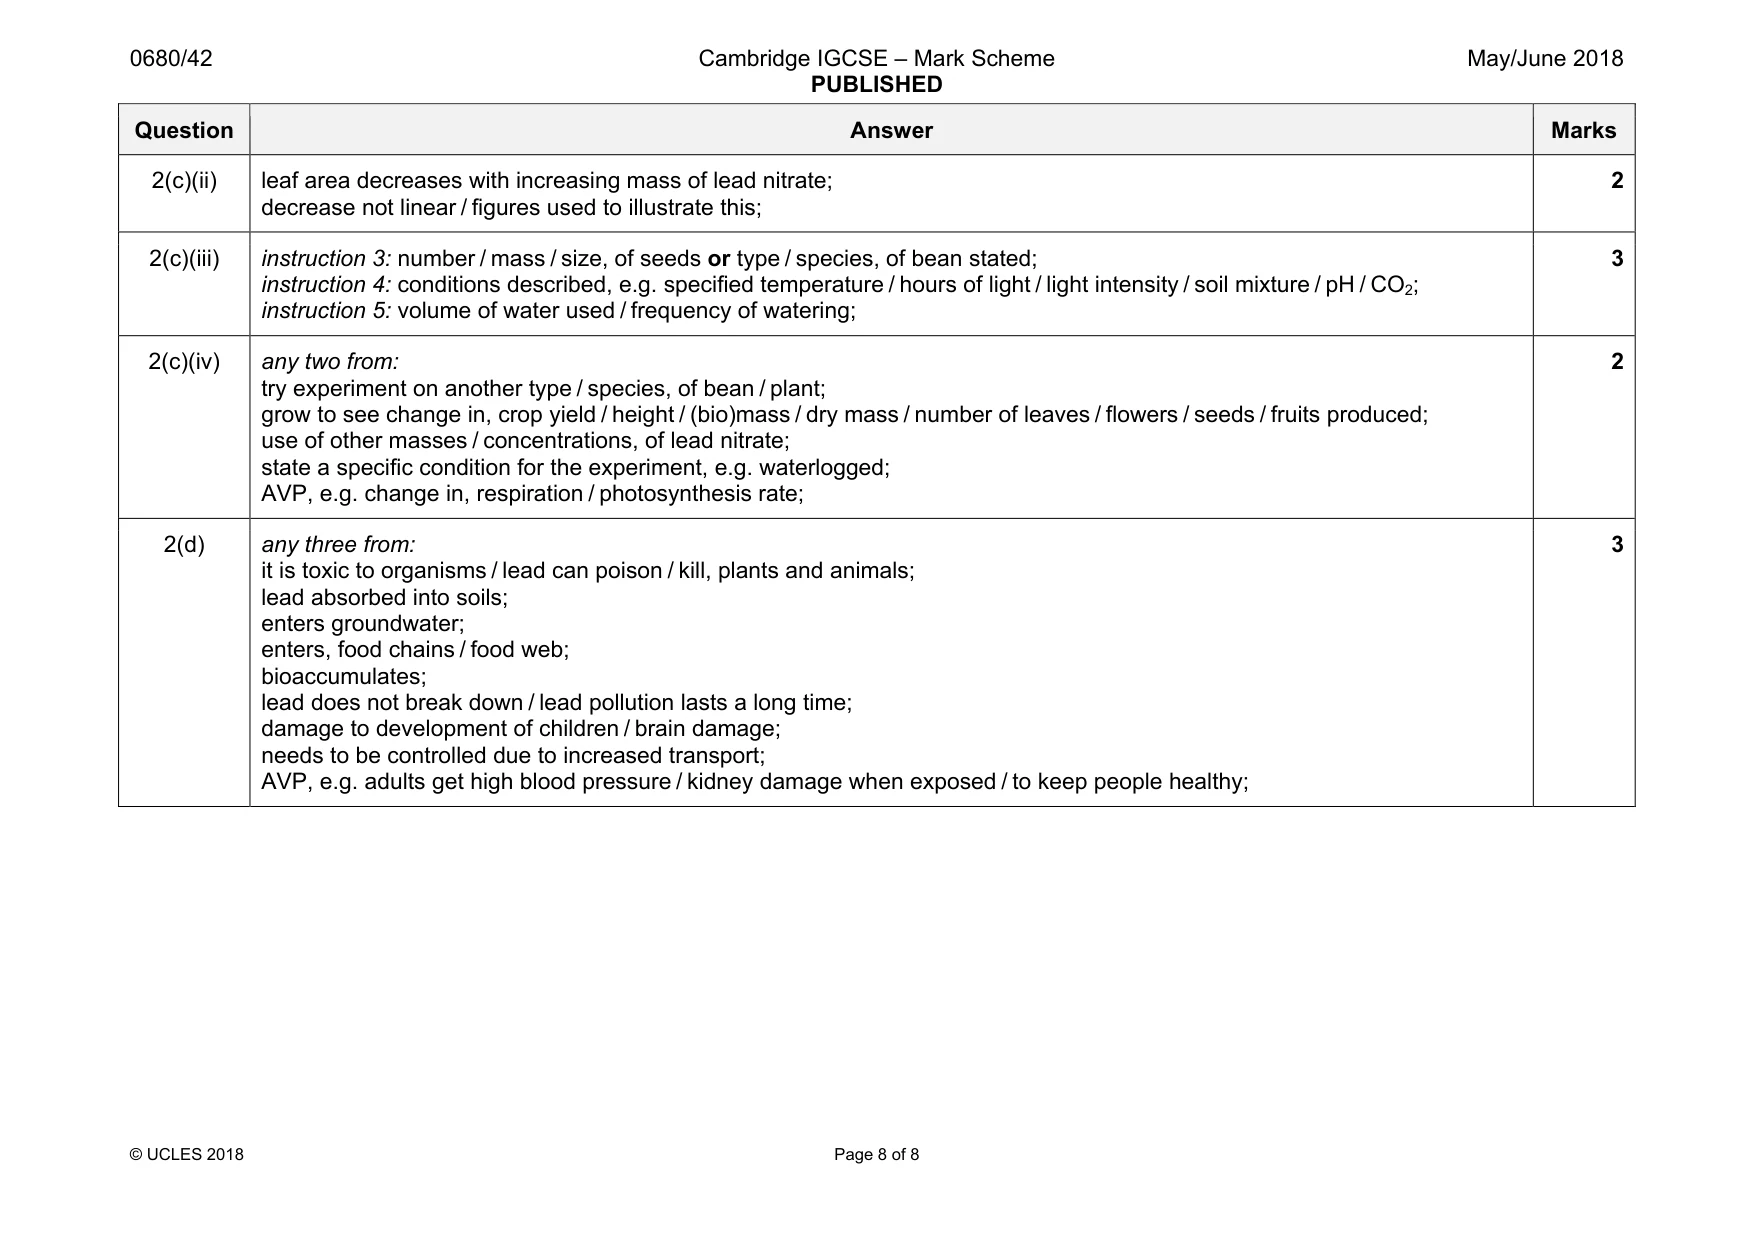
Mark scheme: 2(a)(i) fourth line drawn in appropriate position and 5 sample points on each line; equally spaced / scale used; 2 2(a)(ii) systematic; 1 2(a)(iii) (distance / m) 10 and (direction) North (235); 1 2(a)(iv) the concentration (of lead) decreases with increasing distance; same pattern in all directions; 2 2(a)(v) as a control; to compare with test samples; 2 2(b)(i) wind direction, blows from the north east / blows to south west; higher concentrations of lead / paint chips, found (at greater distances) to south and west of buildings; 2 2(b)(ii) any three from: lead is, toxic / poisonous; cannot be broken down / excreted by animals; (bio)accumulates; idea that, small / young chicks / animals, only need a small dose to be fatal; 3 2(b)(iii) any two from: high cost; uninhabited island / does not affect people; no new source of lead; problem only small scale; eventually the paint chips will disperse; disturbance might make the problem worse; AVP; e.g. bigger problems to tackle first / remote location / difficult or time consuming to get to (the island); 2 2(c)(i) use of linear scale; x axis fully labelled; y axis fully labelled (must be average leaf area / cm2); correct plots; 4 Question Answer Marks 2(c)(ii) leaf area decreases with increasing mass of lead nitrate; decrease not linear / figures used to illustrate this; 2 2(c)(iii) instruction 3: number / mass / size, of seeds or type / species, of bean stated; instruction 4: conditions described, e.g. specified temperature / hours of light / light intensity / soil mixture / pH / CO2; instruction 5: volume of water used / frequency of watering; 3 2(c)(iv) any two from: try experiment on another type / species, of bean / plant; grow to see change in, crop yield / height / (bio)mass / dry mass / number of leaves / flowers / seeds / fruits produced; use of other masses / concentrations, of lead nitrate; state a specific condition for the experiment, e.g. waterlogged; AVP, e.g. change in, respiration / photosynthesis rate; 2 2(d) any three from: it is toxic to organisms / lead can poison / kill, plants and animals; lead absorbed into soils; enters groundwater; enters, food chains / food web; bioaccumulates; lead does not break down / lead pollution lasts a long time; damage to development of children / brain damage; needs to be controlled due to increased transport; AVP, e.g. adults get high blood pressure / kidney damage when exposed / to keep people healthy; 3
What was in this paper
The subtopics covered by these 2 questions, and how many questions each got. Open one in a new tab to see every Cambridge question on it.
What you needed in this session
Cambridge’s own grade thresholds for 2018 May/June, Paper 4 · Variant 2. A higher threshold means an easier paper — the bar moves with how the cohort did.