Cambridge IGCSE Environmental Management 0680 — 2015 May/June Paper 4 · Variant 3
0680/43/M/J/15 · 60 marks · ≈68 min
The question paper and its mark scheme, free to read here and free to download. This is Cambridge’s own paper, exactly as it was sat.
Question paper16 pages

Mark scheme3 pages
Answers below. Sit the paper first if you are practising.
Paper as text
Question paper, page 1
This document consists of 14 printed pages and 2 blank pages. DC (ST/JG) 100157/3 © UCLES 2015 [Turn over Cambridge International Examinations Cambridge International General Certificate of Secondary Education * 1 5 1 4 9 4 2 5 6 4 * ENVIRONMENTAL MANAGEMENT 0680/43 Alternative to Coursework May/June 2015 1 hour 30 minutes Candidates answer on the Question Paper. No Additional Materials are required. READ THESE INSTRUCTIONS FIRST Write your Centre number, candidate number and name on all the work you hand in. Write in dark blue or black pen. You may use an HB pencil for any diagrams or graphs. Do not use staples, paper clips, glue or correction fluid. DO NOT WRITE IN ANY BARCODES. Answer all questions. Electronic calculators may be used. You may lose marks if you do not show your working or if you do not use appropriate units. Study the appropriate source materials before you start to write your answers. Credit will be given for appropriate selection and use of data in your answers and for relevant interpretation of these data. Suggestions for data sources are given in some questions. You may use the source data to draw diagrams and graphs or to do calculations to illustrate your answers. At the end of the examination, fasten all your work securely together. The number of marks is given in brackets [ ] at the end of each question or part question.
Question paper, page 2
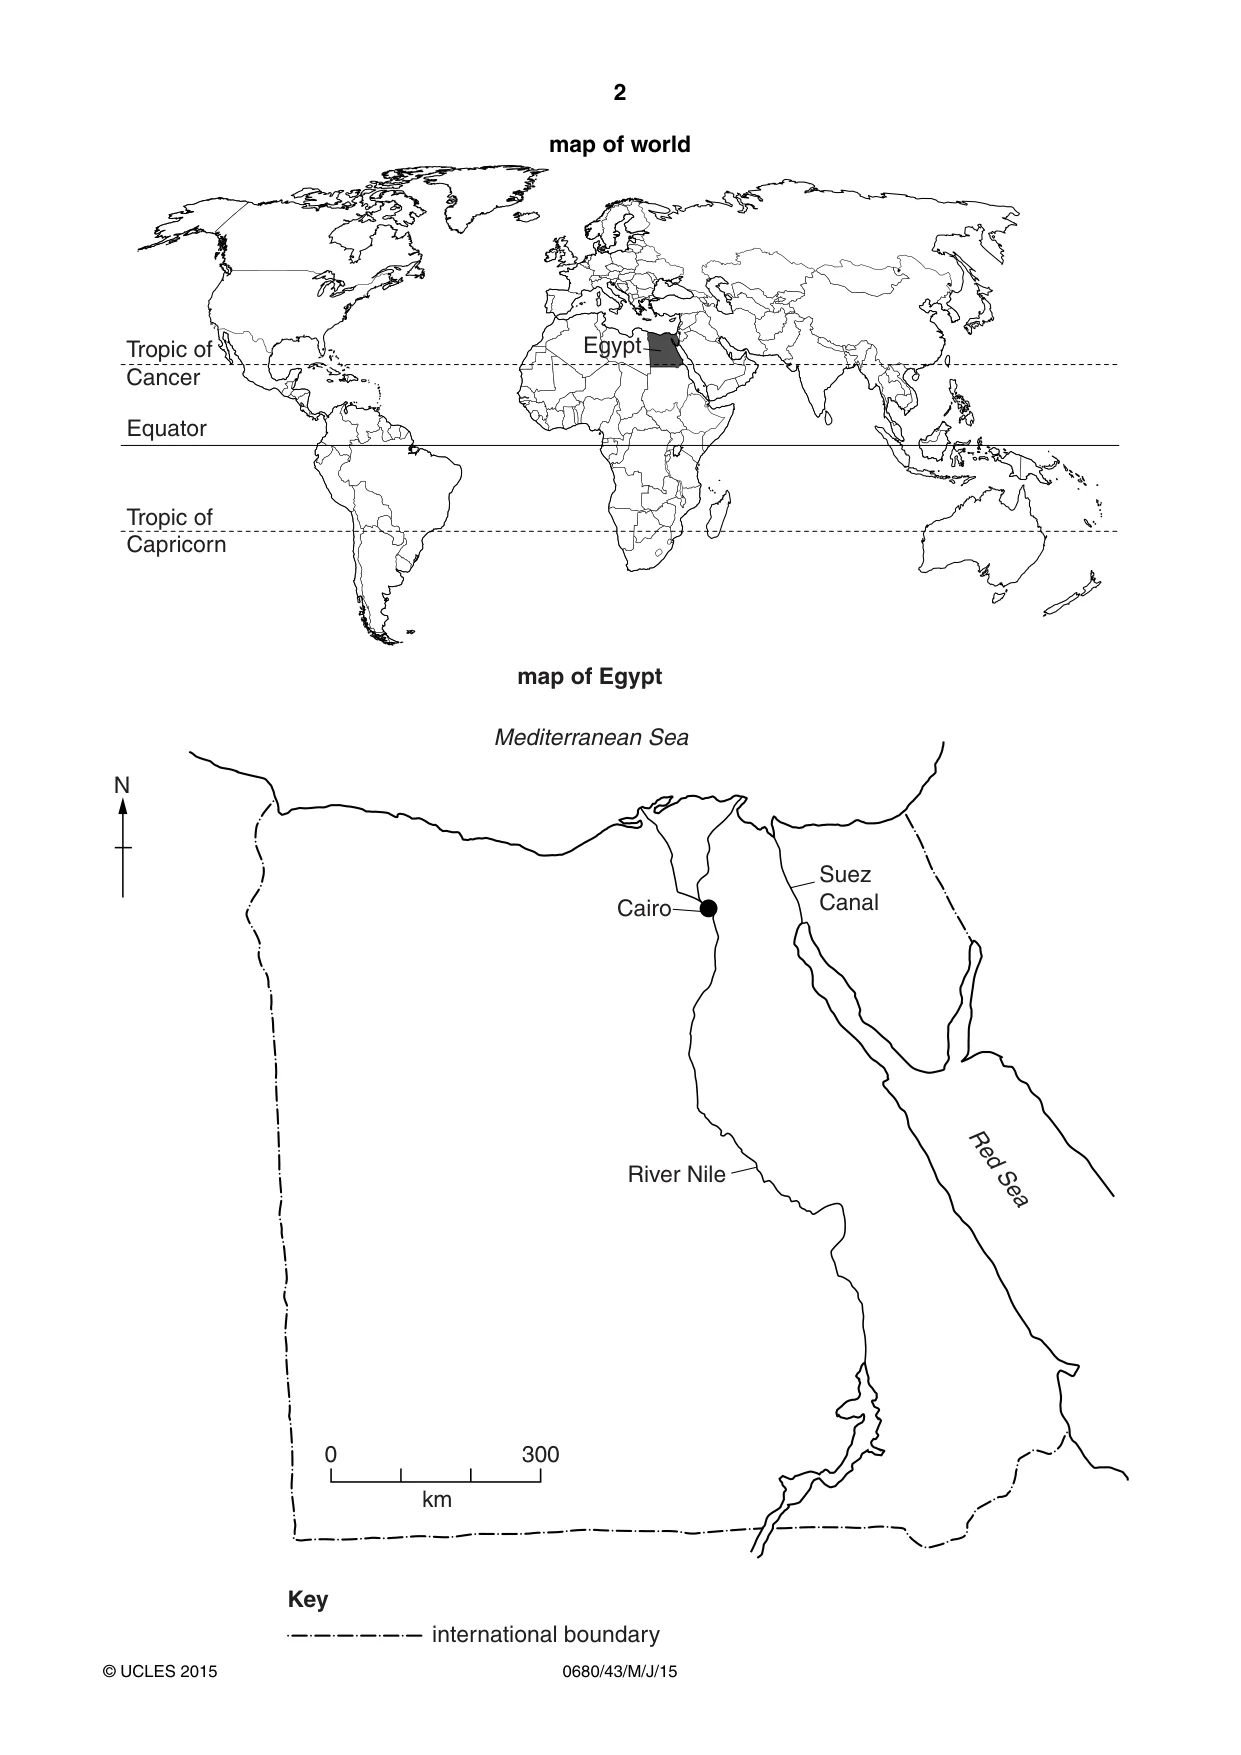
2 0680/43/M/J/15 © UCLES 2015 map of world Equator Tropic of Capricorn Tropic of Cancer Egypt Cairo Red Sea Suez Canal River Nile 0 300 km international boundary Mediterranean Sea map of Egypt Key N
Question paper, page 3
3 0680/43/M/J/15 © UCLES 2015 [Turn over Area of Egypt: 1 million sq km Population: about 87 million Children per woman: 2.81 Life expectancy: 73 years Currency: Egyptian pounds (7.0 EGP = 1 US$) Languages: Arabic, English, French Climate: desert; hot, dry summers and warm winters Terrain: vast desert plateau divided by the River Nile Main exports: crude oil and petroleum products, raw cotton, textiles, metal products, chemicals, processed foods Most economic activity takes place around the River Nile. The economy relies on exports of manufactured goods, construction and tourism. Cairo is the capital city where 25 percent of the population live. It is the main industrial and business centre of Egypt. The Suez Canal that links the Red Sea to the Mediterranean Sea provides revenue for the country. Despite economic growth living conditions for the average Egyptian remain poor. 1 (a) Calculate the population of Cairo. Space for working. …[1]
Question paper, page 4
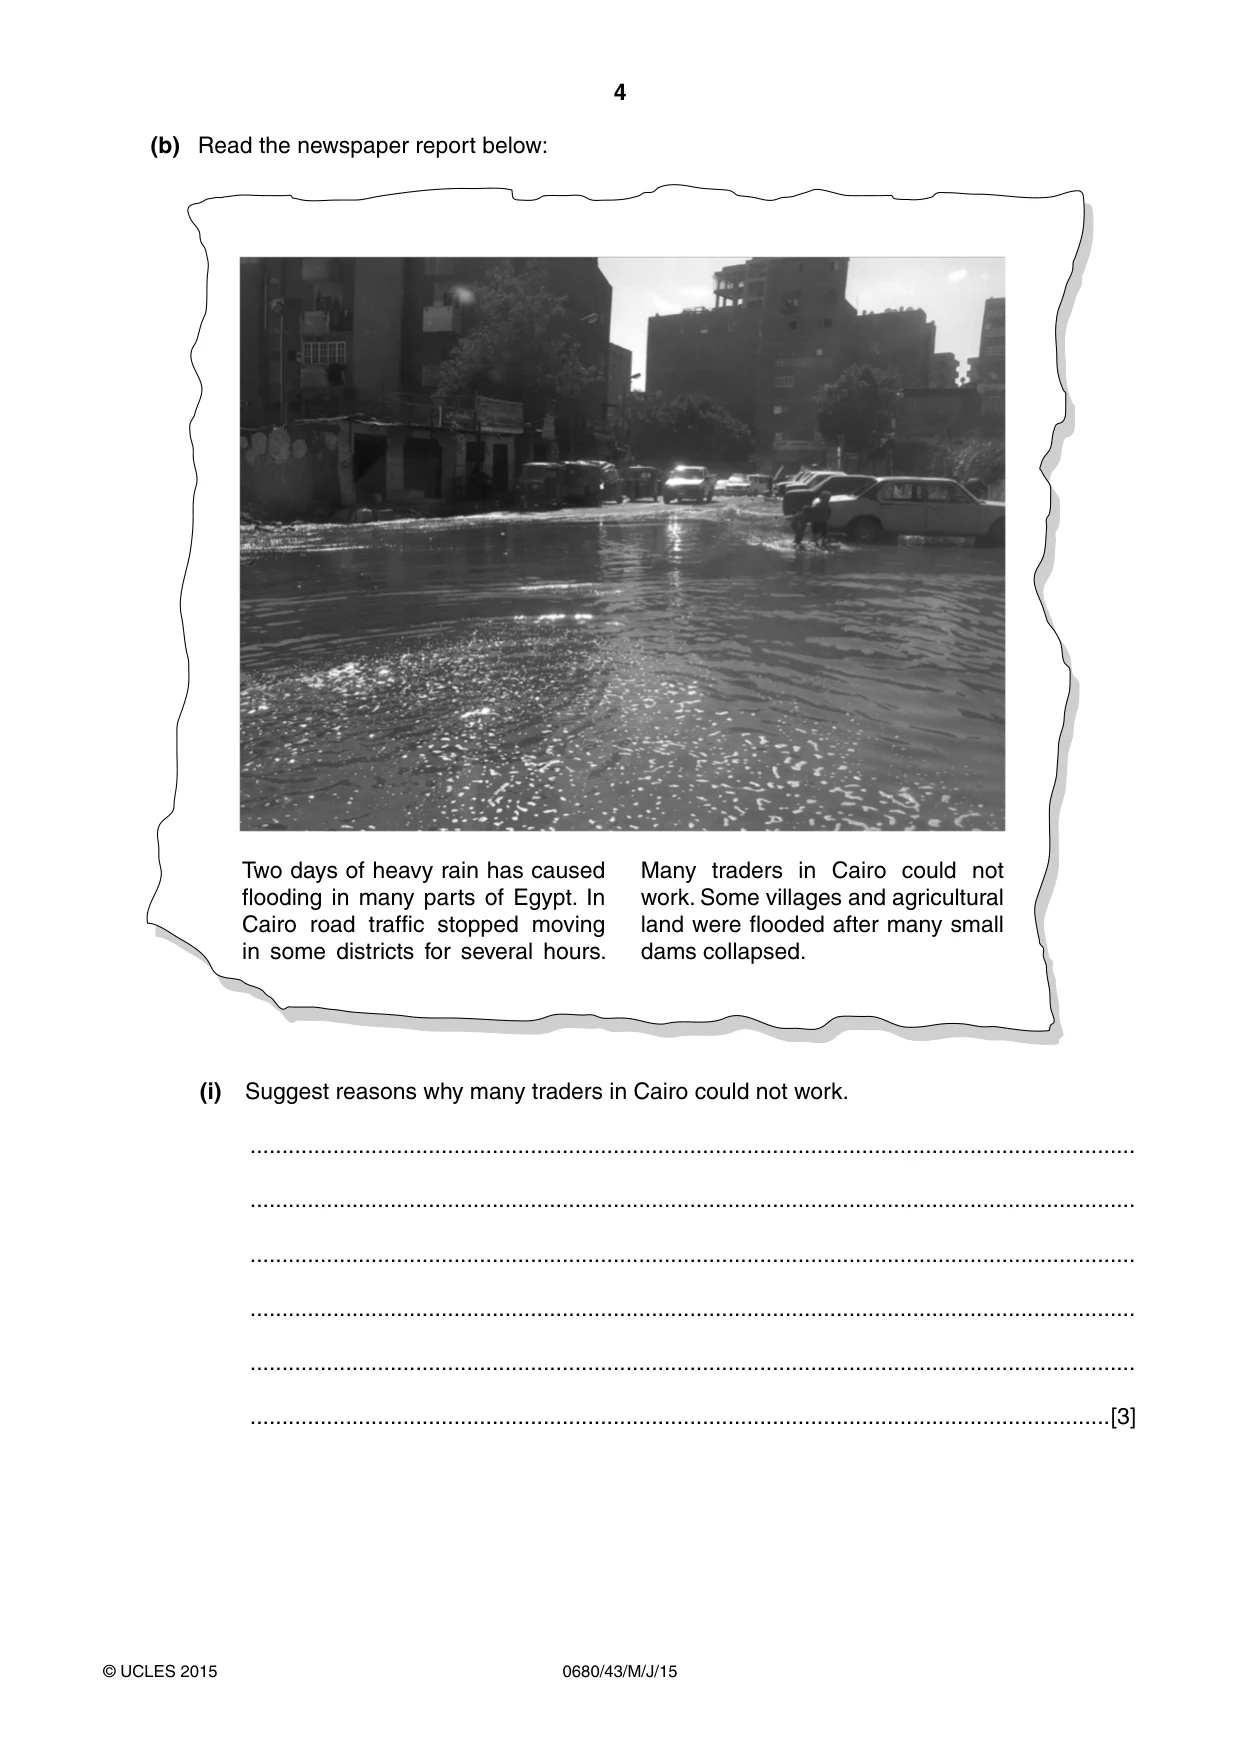
4 0680/43/M/J/15 © UCLES 2015 (b) Read the newspaper report below: Two days of heavy rain has caused flooding in many parts of Egypt. In Cairo road traffic stopped moving in some districts for several hours. Many traders in Cairo could not work. Some villages and agricultural land were flooded after many small dams collapsed. (i) Suggest reasons why many traders in Cairo could not work. … … … … … …[3]
Question paper, page 5
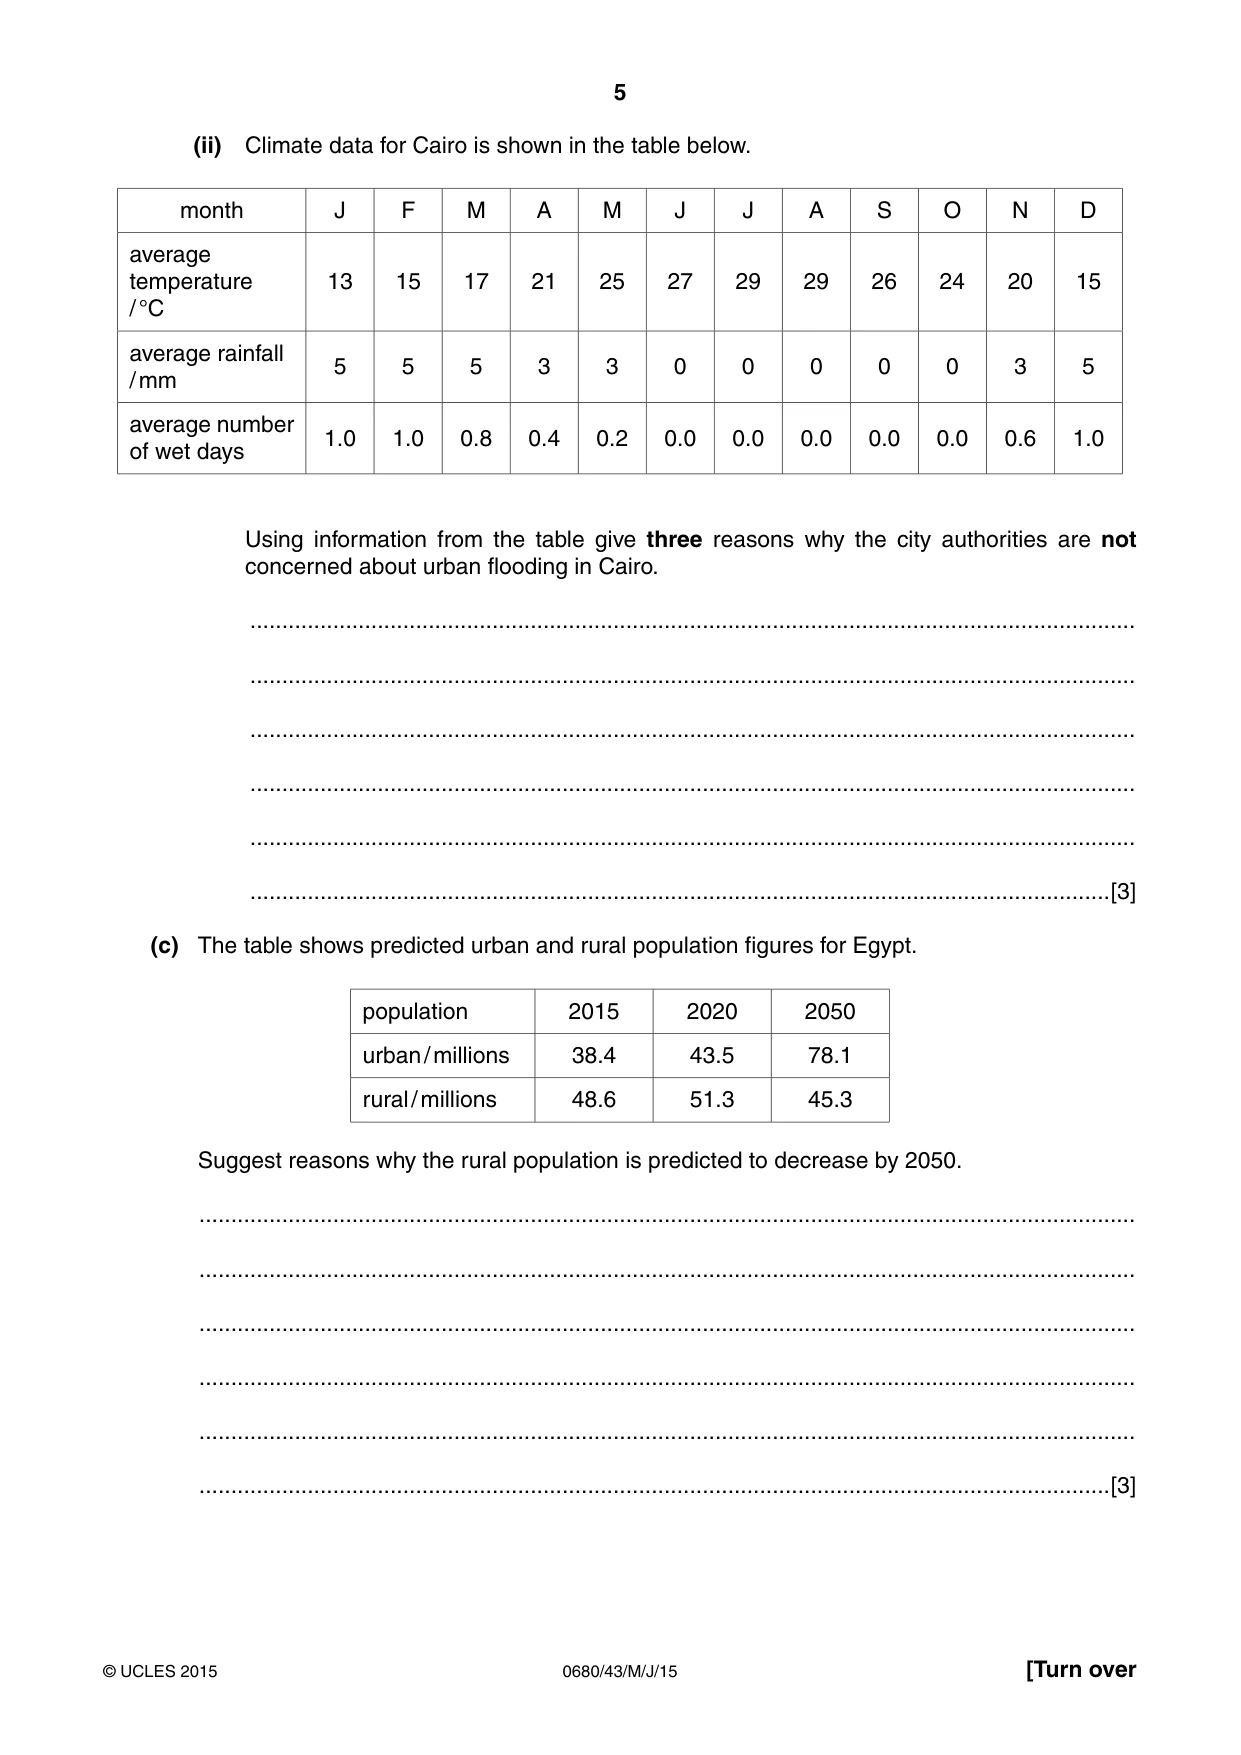
5 0680/43/M/J/15 © UCLES 2015 [Turn over (ii) Climate data for Cairo is shown in the table below. month J F M A M J J A S O N D average temperature / °C 13 15 17 21 25 27 29 29 26 24 20 15 average rainfall / mm 5 5 5 3 3 0 0 0 0 0 3 5 average number of wet days 1.0 1.0 0.8 0.4 0.2 0.0 0.0 0.0 0.0 0.0 0.6 1.0 Using information from the table give three reasons why the city authorities are not concerned about urban flooding in Cairo. … … … … … …[3] (c) The table shows predicted urban and rural population figures for Egypt. population 2015 2020 2050 urban / millions 38.4 43.5 78.1 rural / millions 48.6 51.3 45.3 Suggest reasons why the rural population is predicted to decrease by 2050. … … … … … …[3]
Question paper, page 6
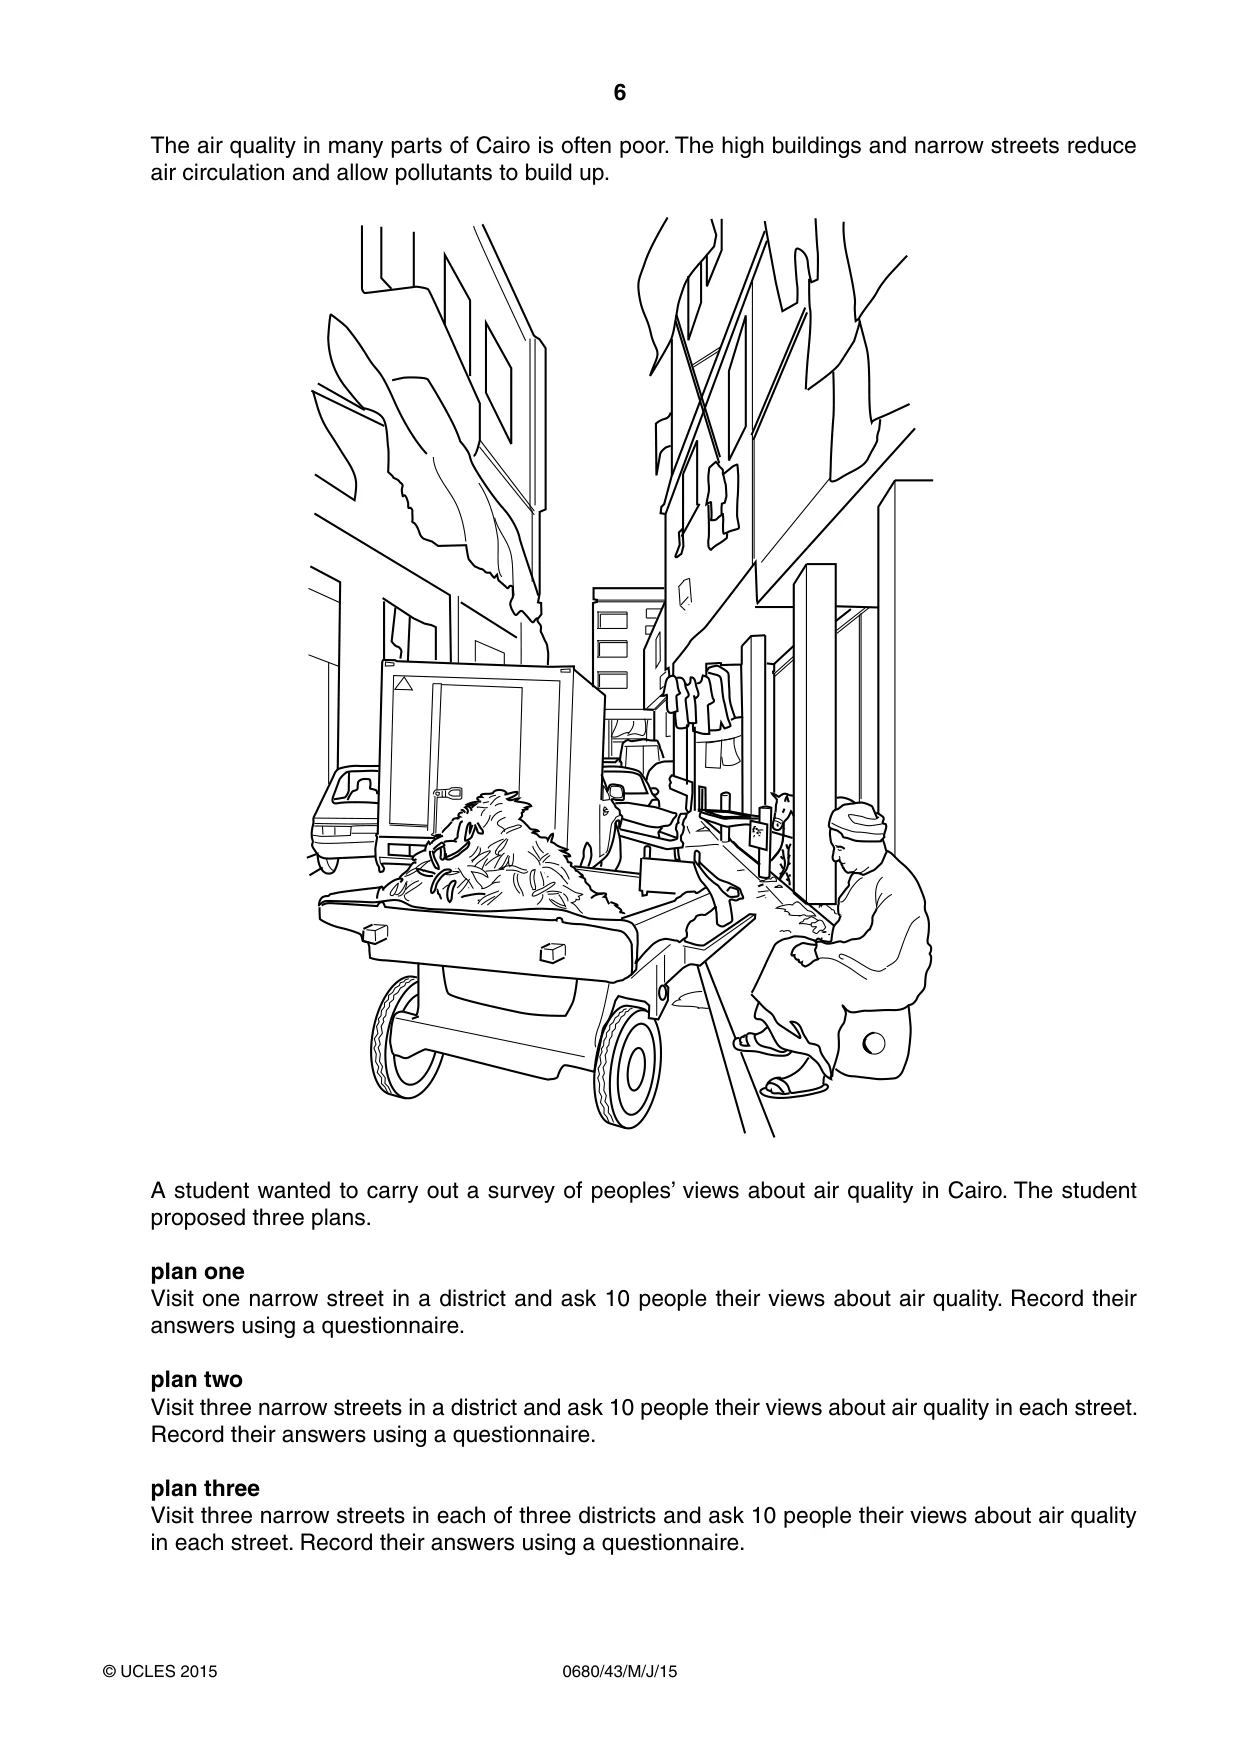
6 0680/43/M/J/15 © UCLES 2015 The air quality in many parts of Cairo is often poor. The high buildings and narrow streets reduce air circulation and allow pollutants to build up. A student wanted to carry out a survey of peoples’ views about air quality in Cairo. The student proposed three plans. plan one Visit one narrow street in a district and ask 10 people their views about air quality. Record their answers using a questionnaire. plan two Visit three narrow streets in a district and ask 10 people their views about air quality in each street. Record their answers using a questionnaire. plan three Visit three narrow streets in each of three districts and ask 10 people their views about air quality in each street. Record their answers using a questionnaire.
Question paper, page 7
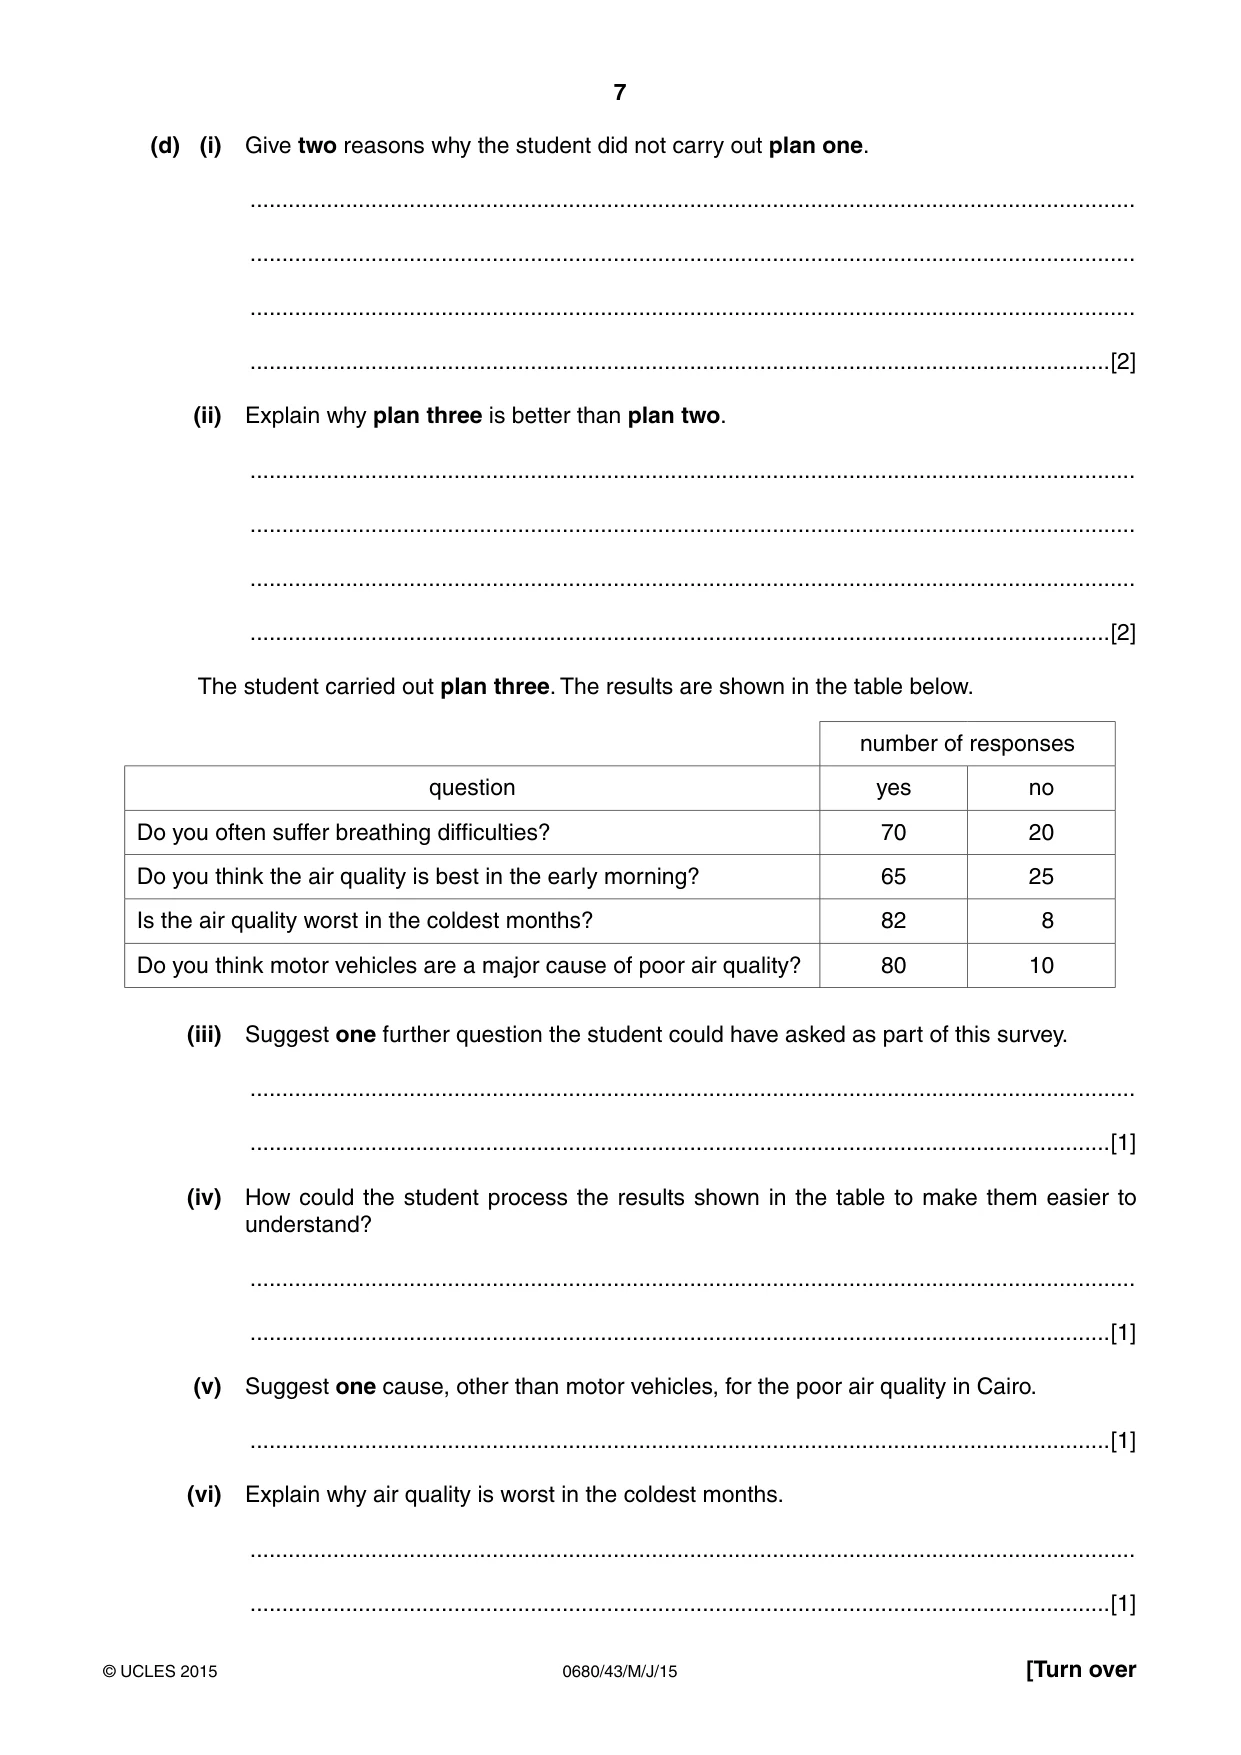
7 0680/43/M/J/15 © UCLES 2015 [Turn over (d) (i) Give two reasons why the student did not carry out plan one. … … … …[2] (ii) Explain why plan three is better than plan two. … … … …[2] The student carried out plan three. The results are shown in the table below. number of responses question yes no Do you often suffer breathing difficulties? 70 20 Do you think the air quality is best in the early morning? 65 25 Is the air quality worst in the coldest months? 82 8 Do you think motor vehicles are a major cause of poor air quality? 80 10 (iii) Suggest one further question the student could have asked as part of this survey. … …[1] (iv) How could the student process the results shown in the table to make them easier to understand? … …[1] (v) Suggest one cause, other than motor vehicles, for the poor air quality in Cairo. …[1] (vi) Explain why air quality is worst in the coldest months. … …[1]
Question paper, page 8
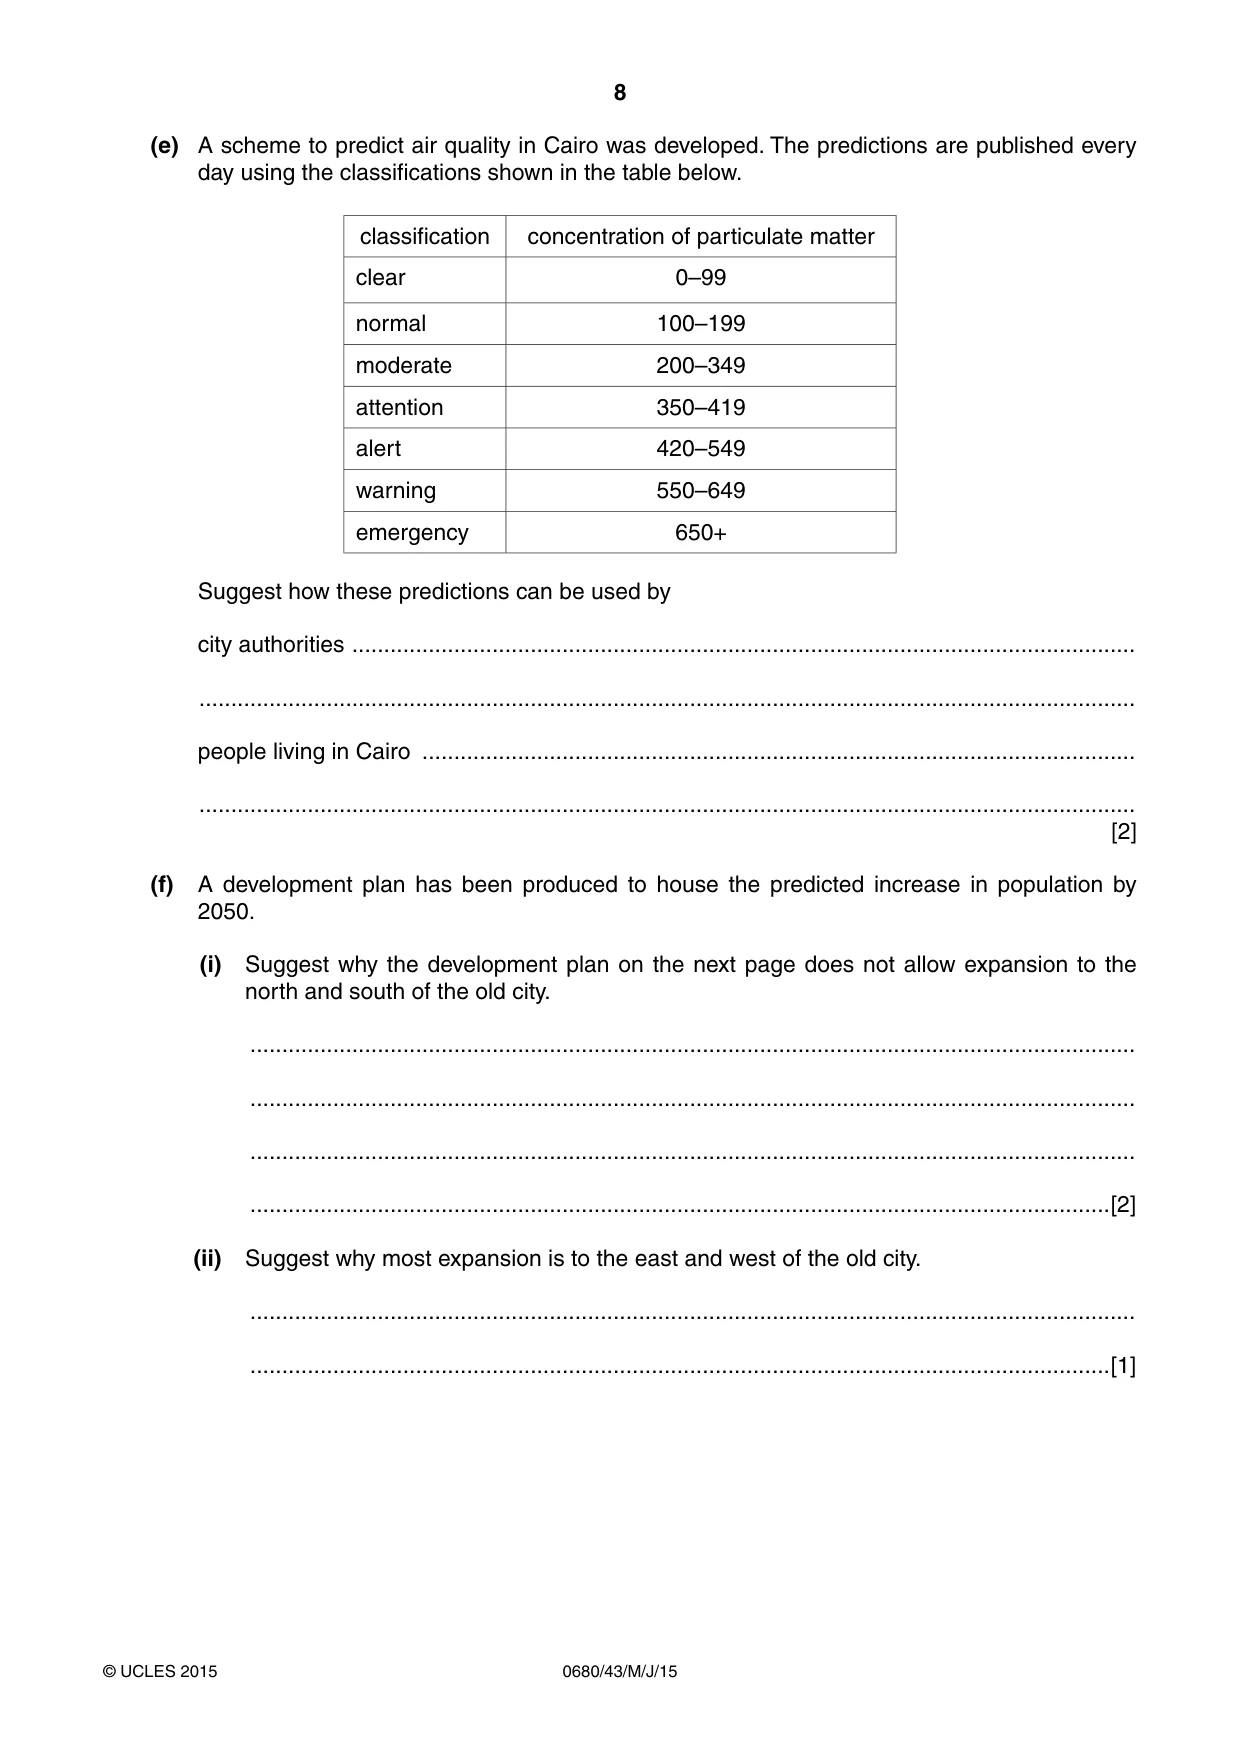
8 0680/43/M/J/15 © UCLES 2015 (e) A scheme to predict air quality in Cairo was developed. The predictions are published every day using the classifications shown in the table below. classification concentration of particulate matter clear 0–99 normal 100–199 moderate 200–349 attention 350–419 alert 420–549 warning 550–649 emergency 650+ Suggest how these predictions can be used by city authorities … … people living in Cairo … … [2] (f) A development plan has been produced to house the predicted increase in population by 2050. (i) Suggest why the development plan on the next page does not allow expansion to the north and south of the old city. … … … …[2] (ii) Suggest why most expansion is to the east and west of the old city. … …[1]
Question paper, page 9
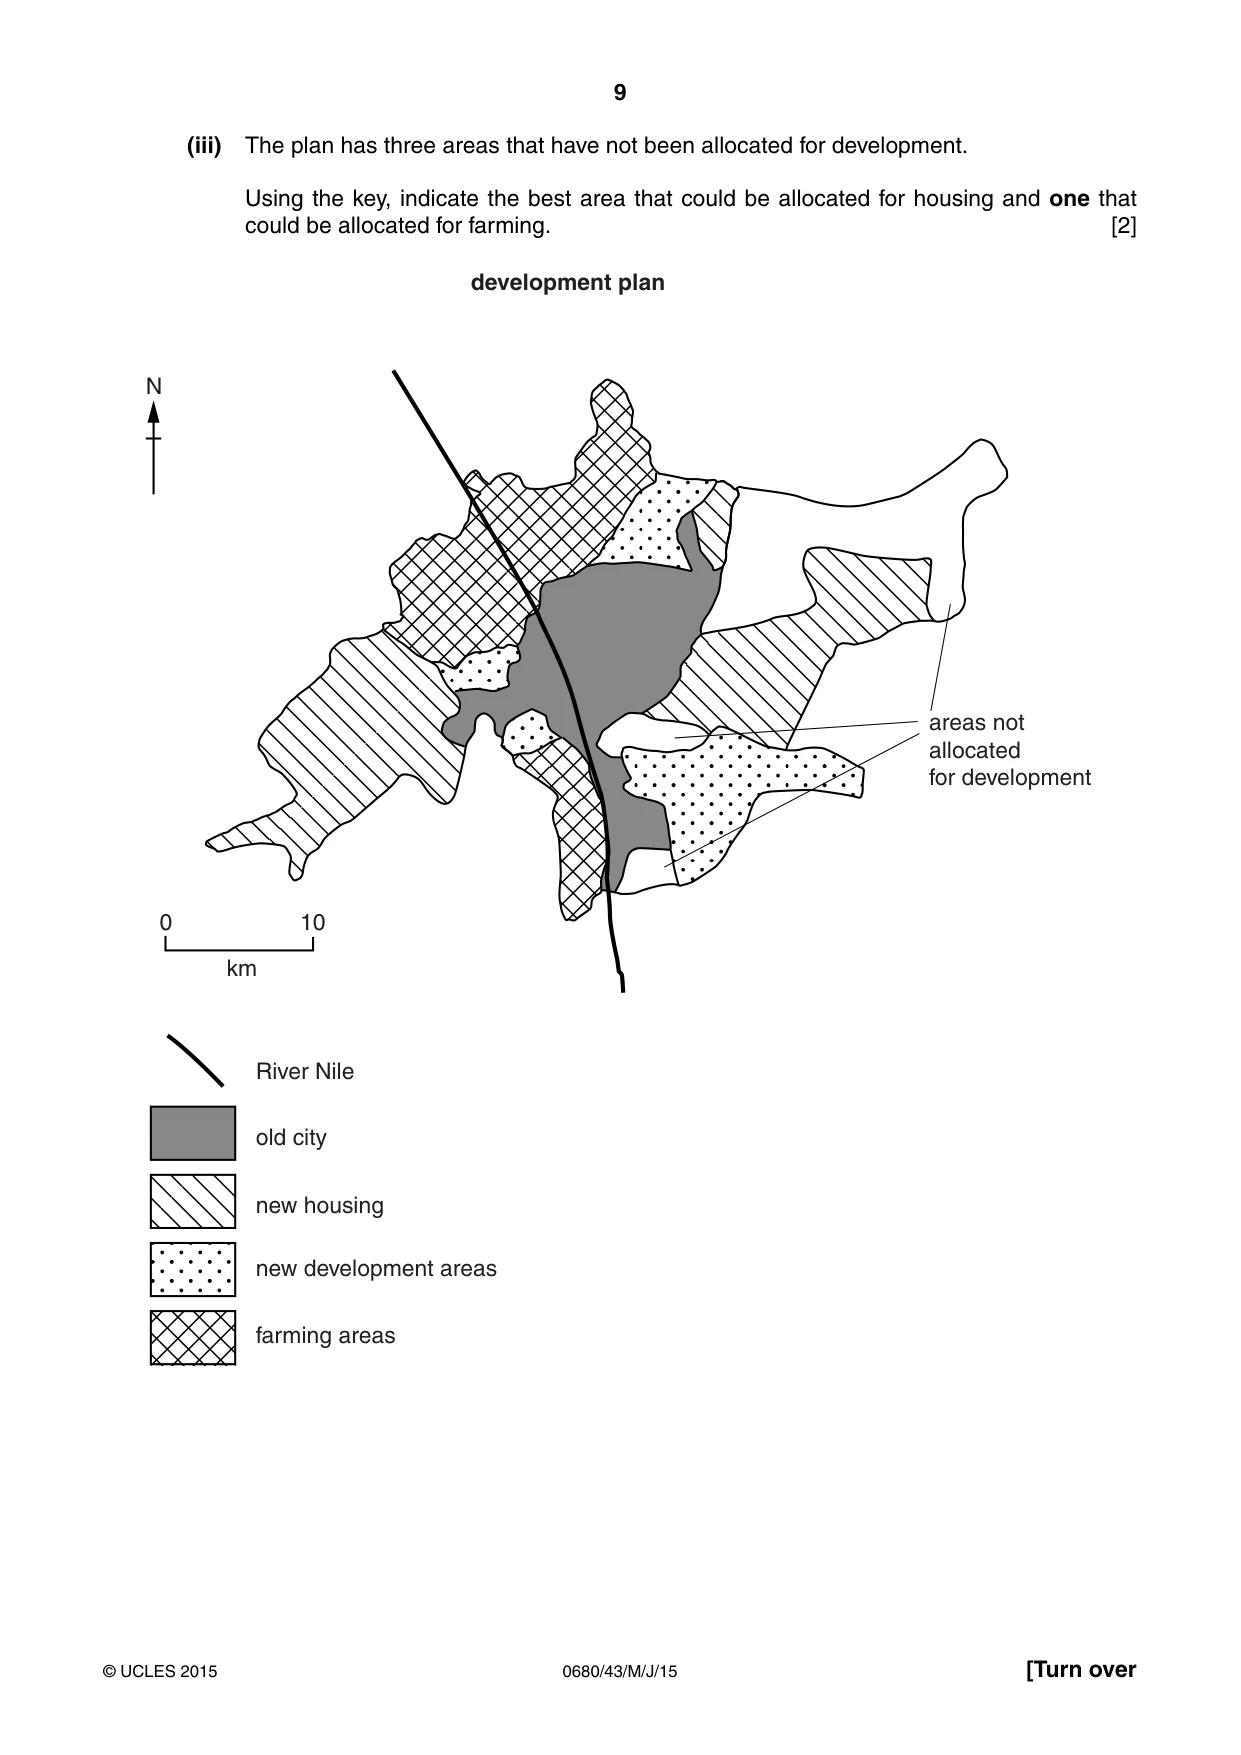
9 0680/43/M/J/15 © UCLES 2015 [Turn over (iii) The plan has three areas that have not been allocated for development. Using the key, indicate the best area that could be allocated for housing and one that could be allocated for farming. [2] old city areas not allocated for development new housing new development areas farming areas River Nile 0 10 km N development plan
Question paper, page 10
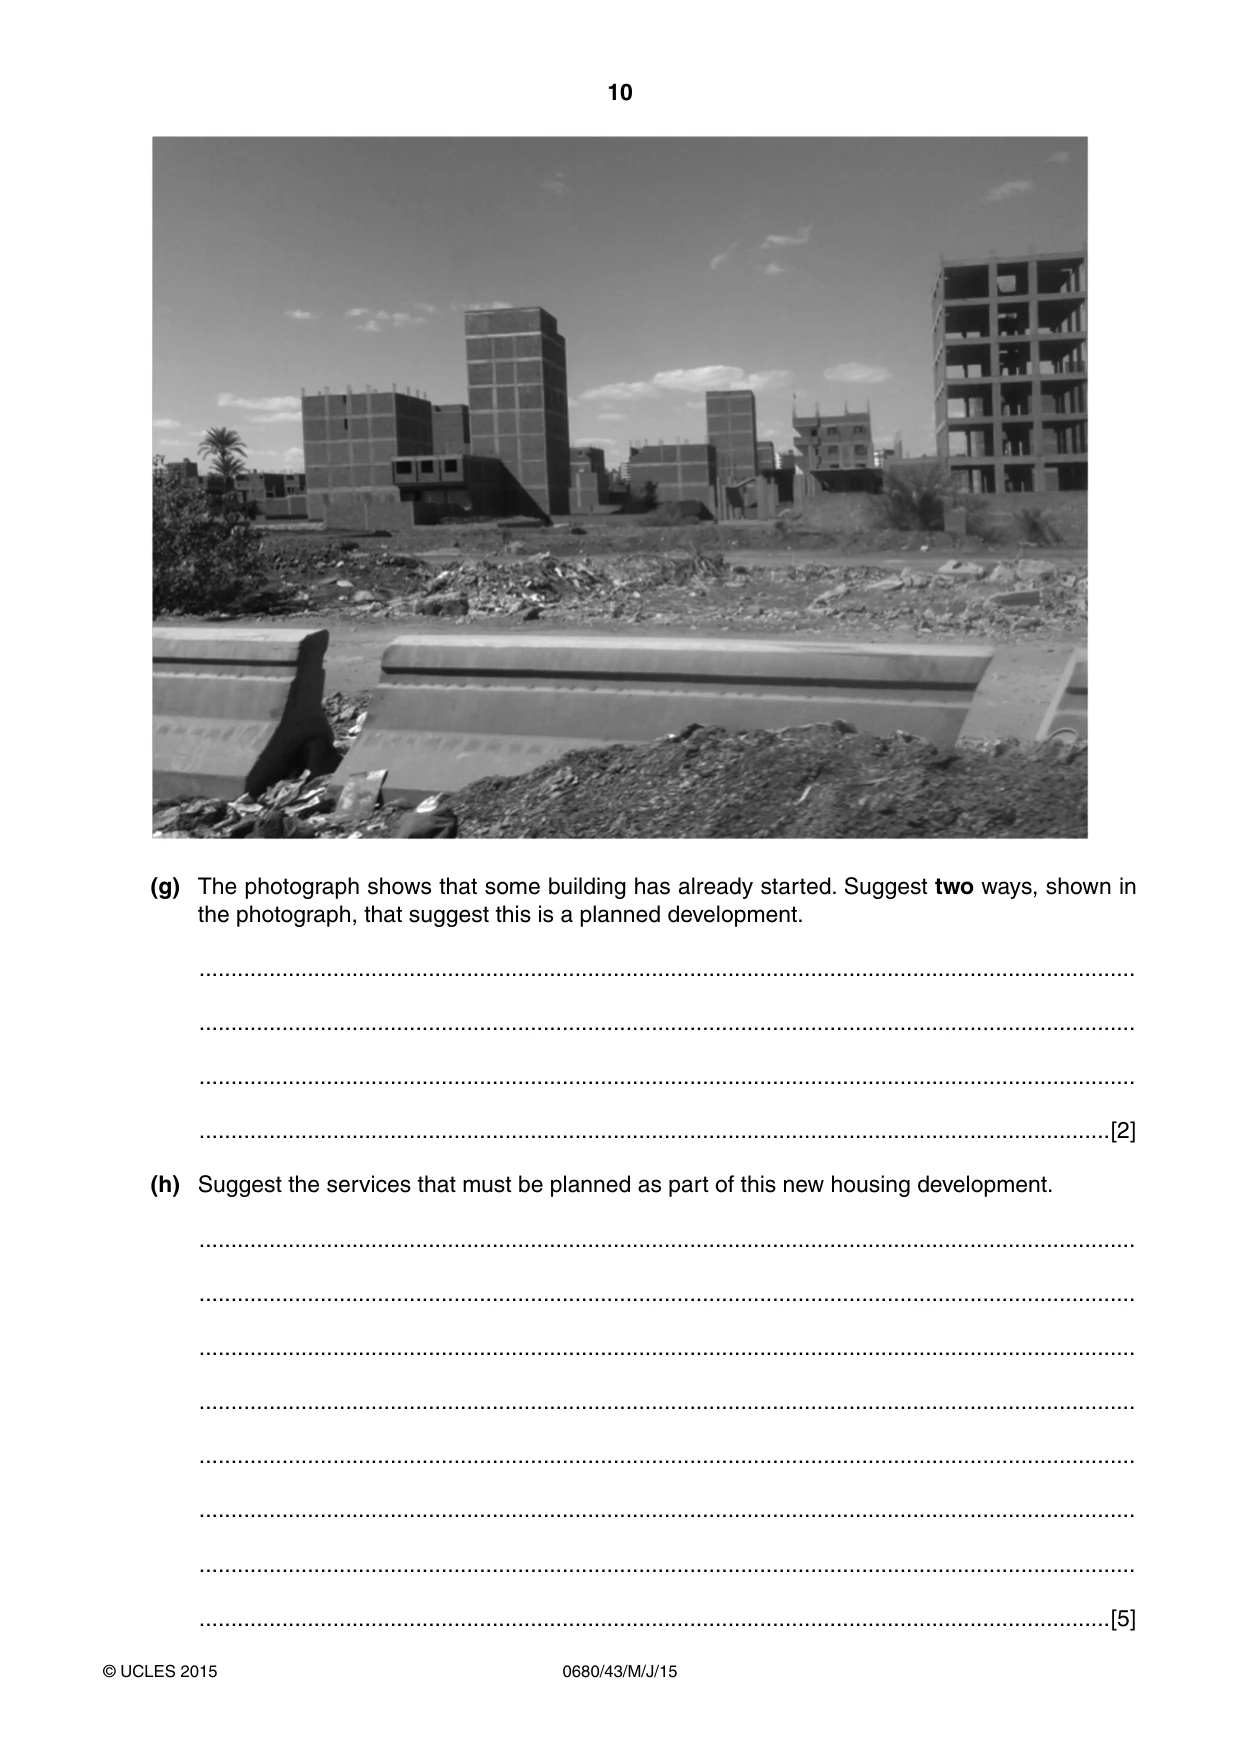
10 0680/43/M/J/15 © UCLES 2015 (g) The photograph shows that some building has already started. Suggest two ways, shown in the photograph, that suggest this is a planned development. … … … …[2] (h) Suggest the services that must be planned as part of this new housing development. … … … … … … … …[5]
Question paper, page 11
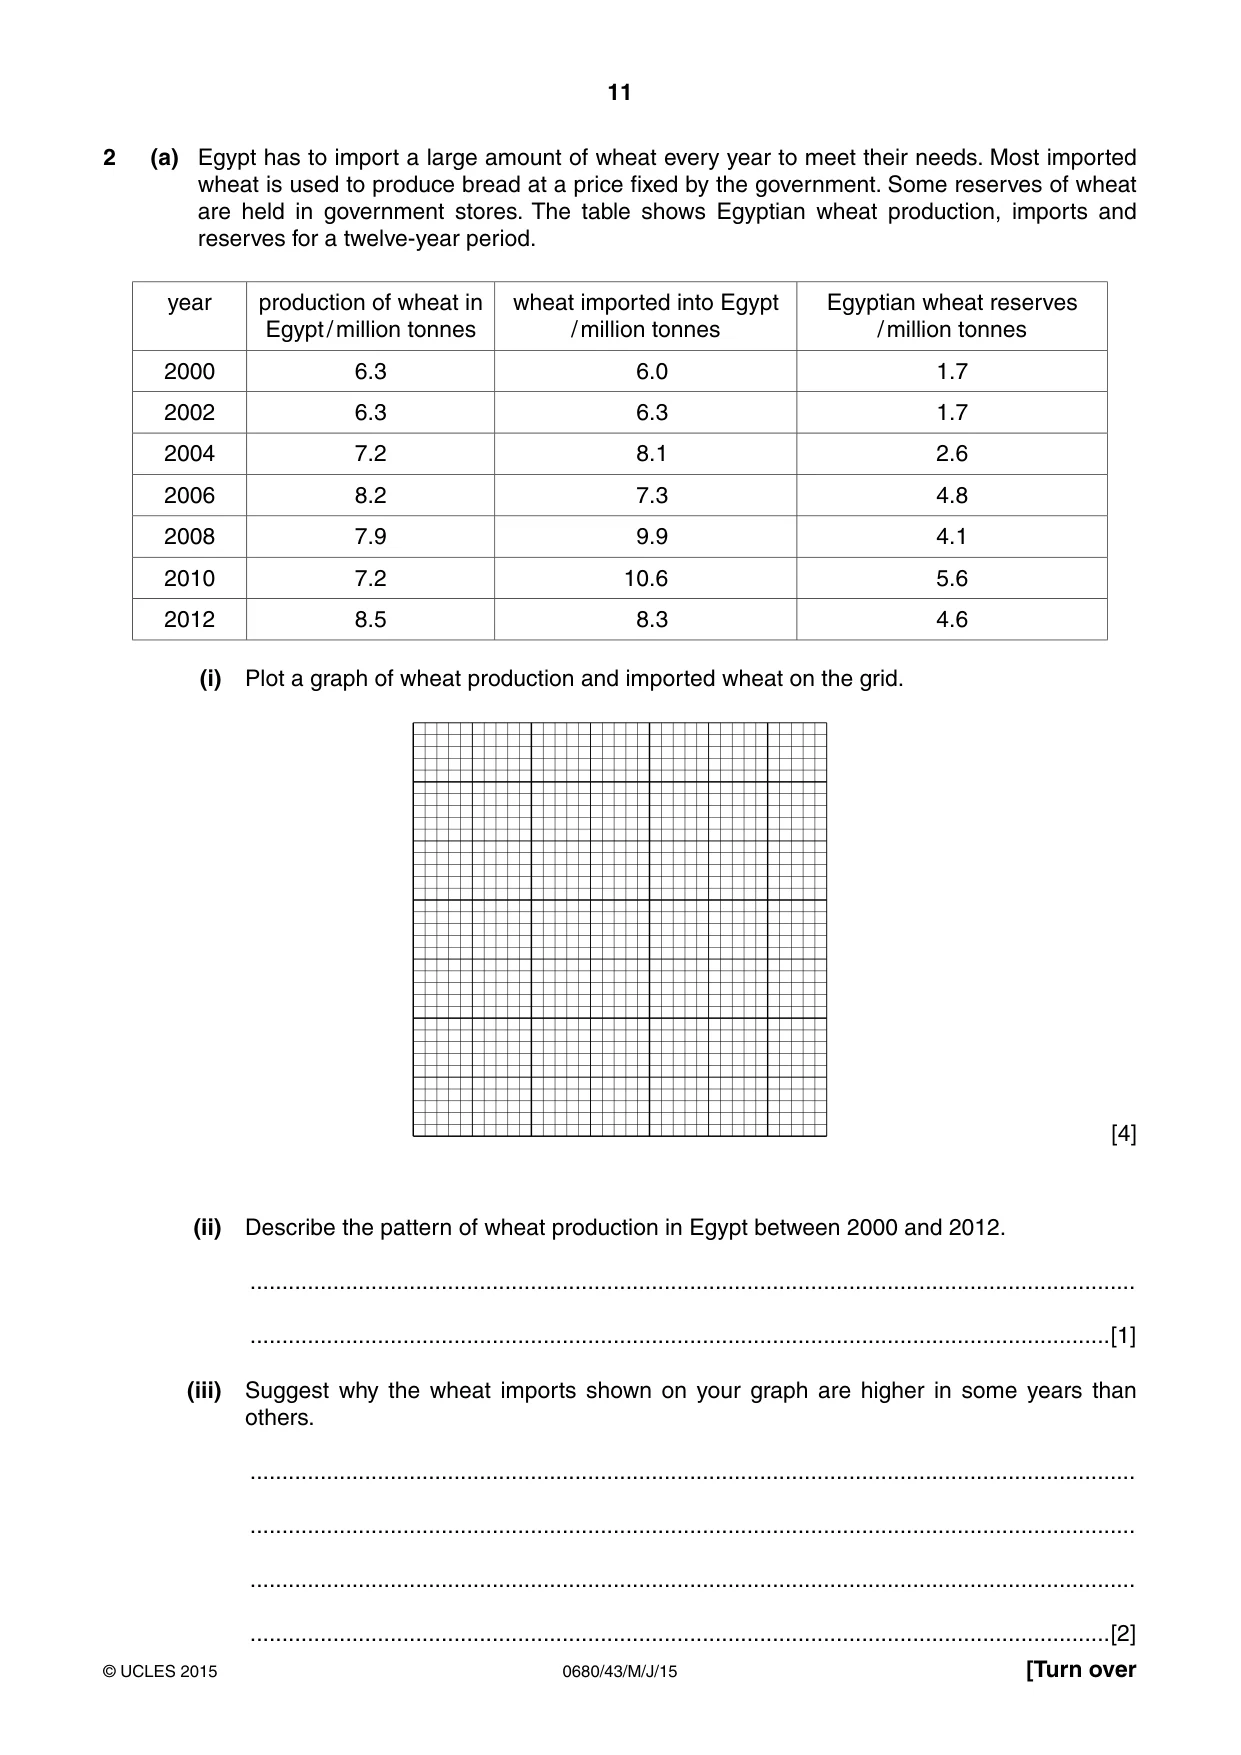
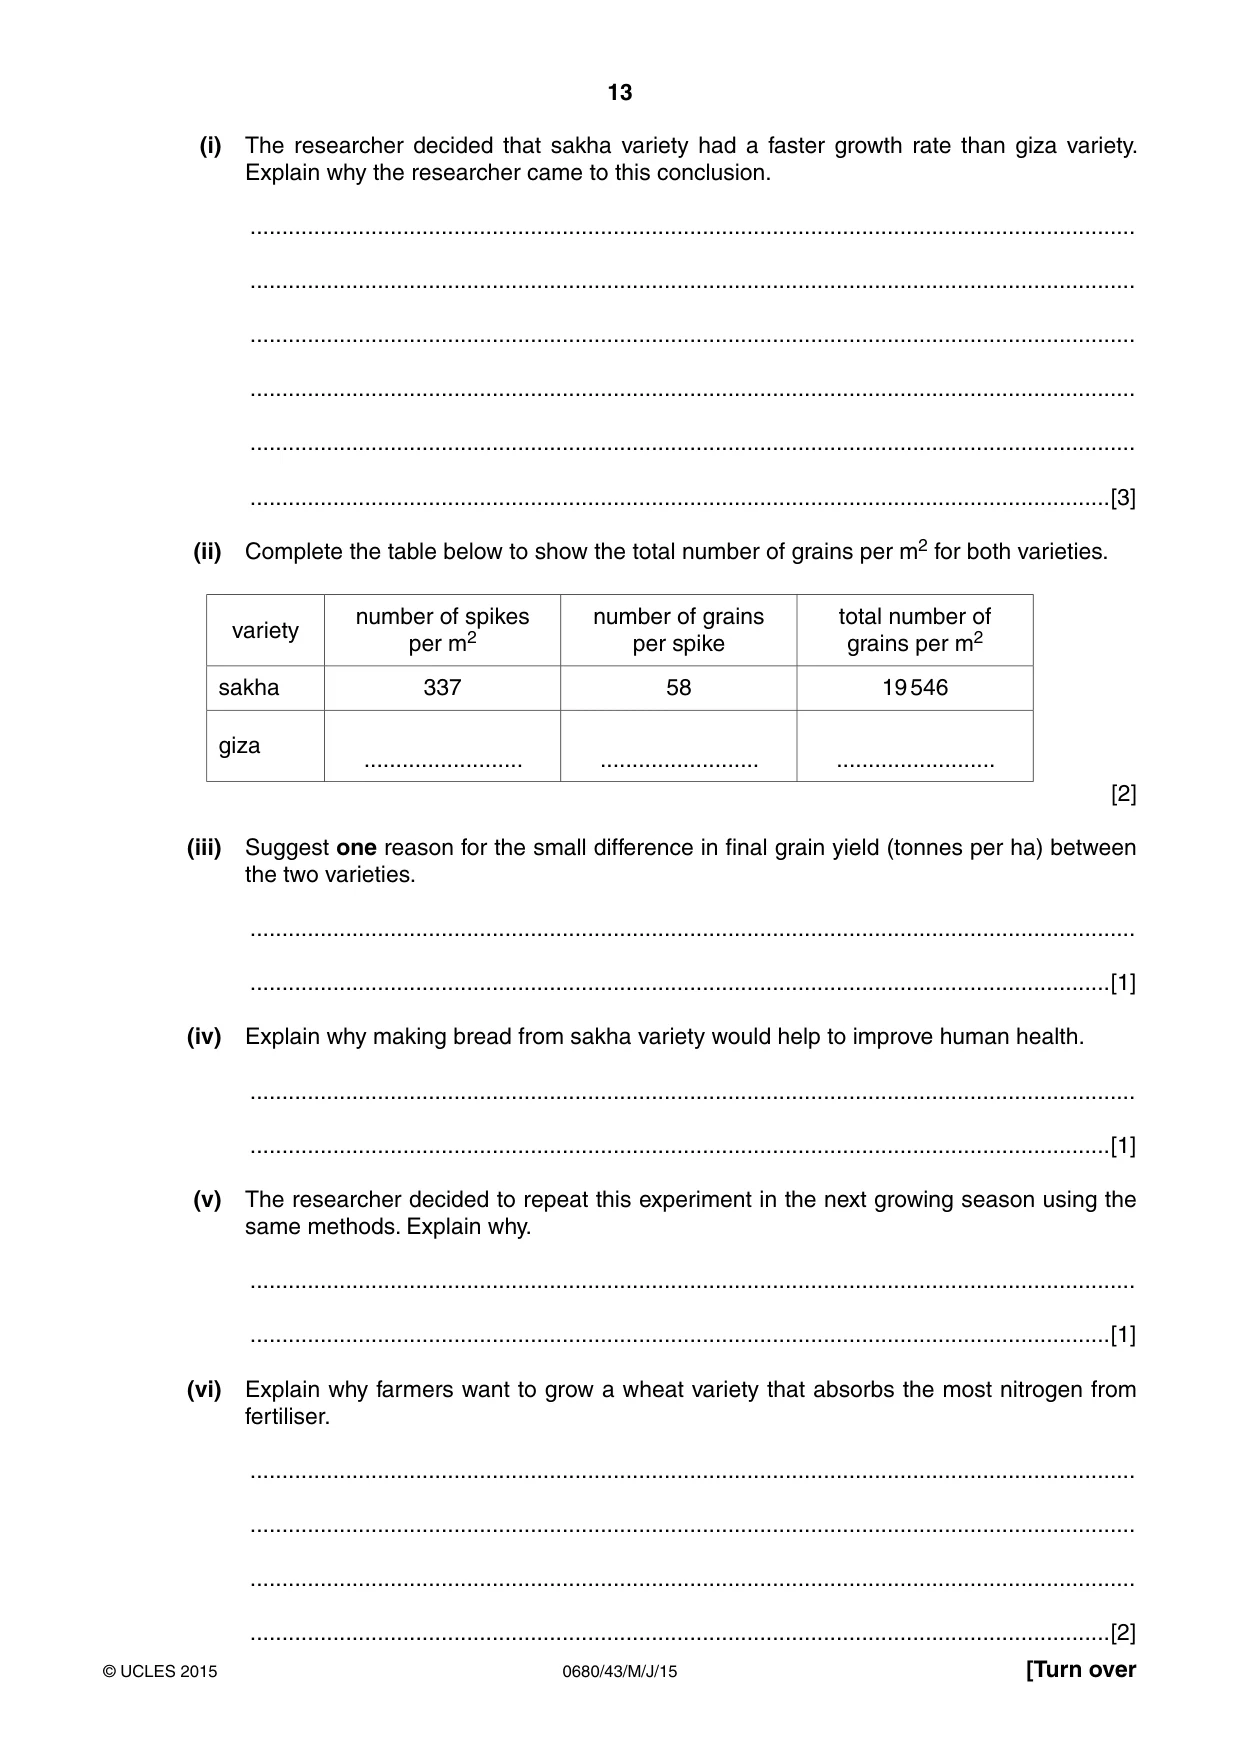
11 0680/43/M/J/15 © UCLES 2015 [Turn over 2 (a) Egypt has to import a large amount of wheat every year to meet their needs. Most imported wheat is used to produce bread at a price fixed by the government. Some reserves of wheat are held in government stores. The table shows Egyptian wheat production, imports and reserves for a twelve-year period. year production of wheat in Egypt / million tonnes wheat imported into Egypt / million tonnes Egyptian wheat reserves / million tonnes 2000 6.3 6.0 1.7 2002 6.3 6.3 1.7 2004 7.2 8.1 2.6 2006 8.2 7.3 4.8 2008 7.9 9.9 4.1 2010 7.2 10.6 5.6 2012 8.5 8.3 4.6 (i) Plot a graph of wheat production and imported wheat on the grid. [4] (ii) Describe the pattern of wheat production in Egypt between 2000 and 2012. … …[1] (iii) Suggest why the wheat imports shown on your graph are higher in some years than others. … … … …[2]
Question paper, page 12
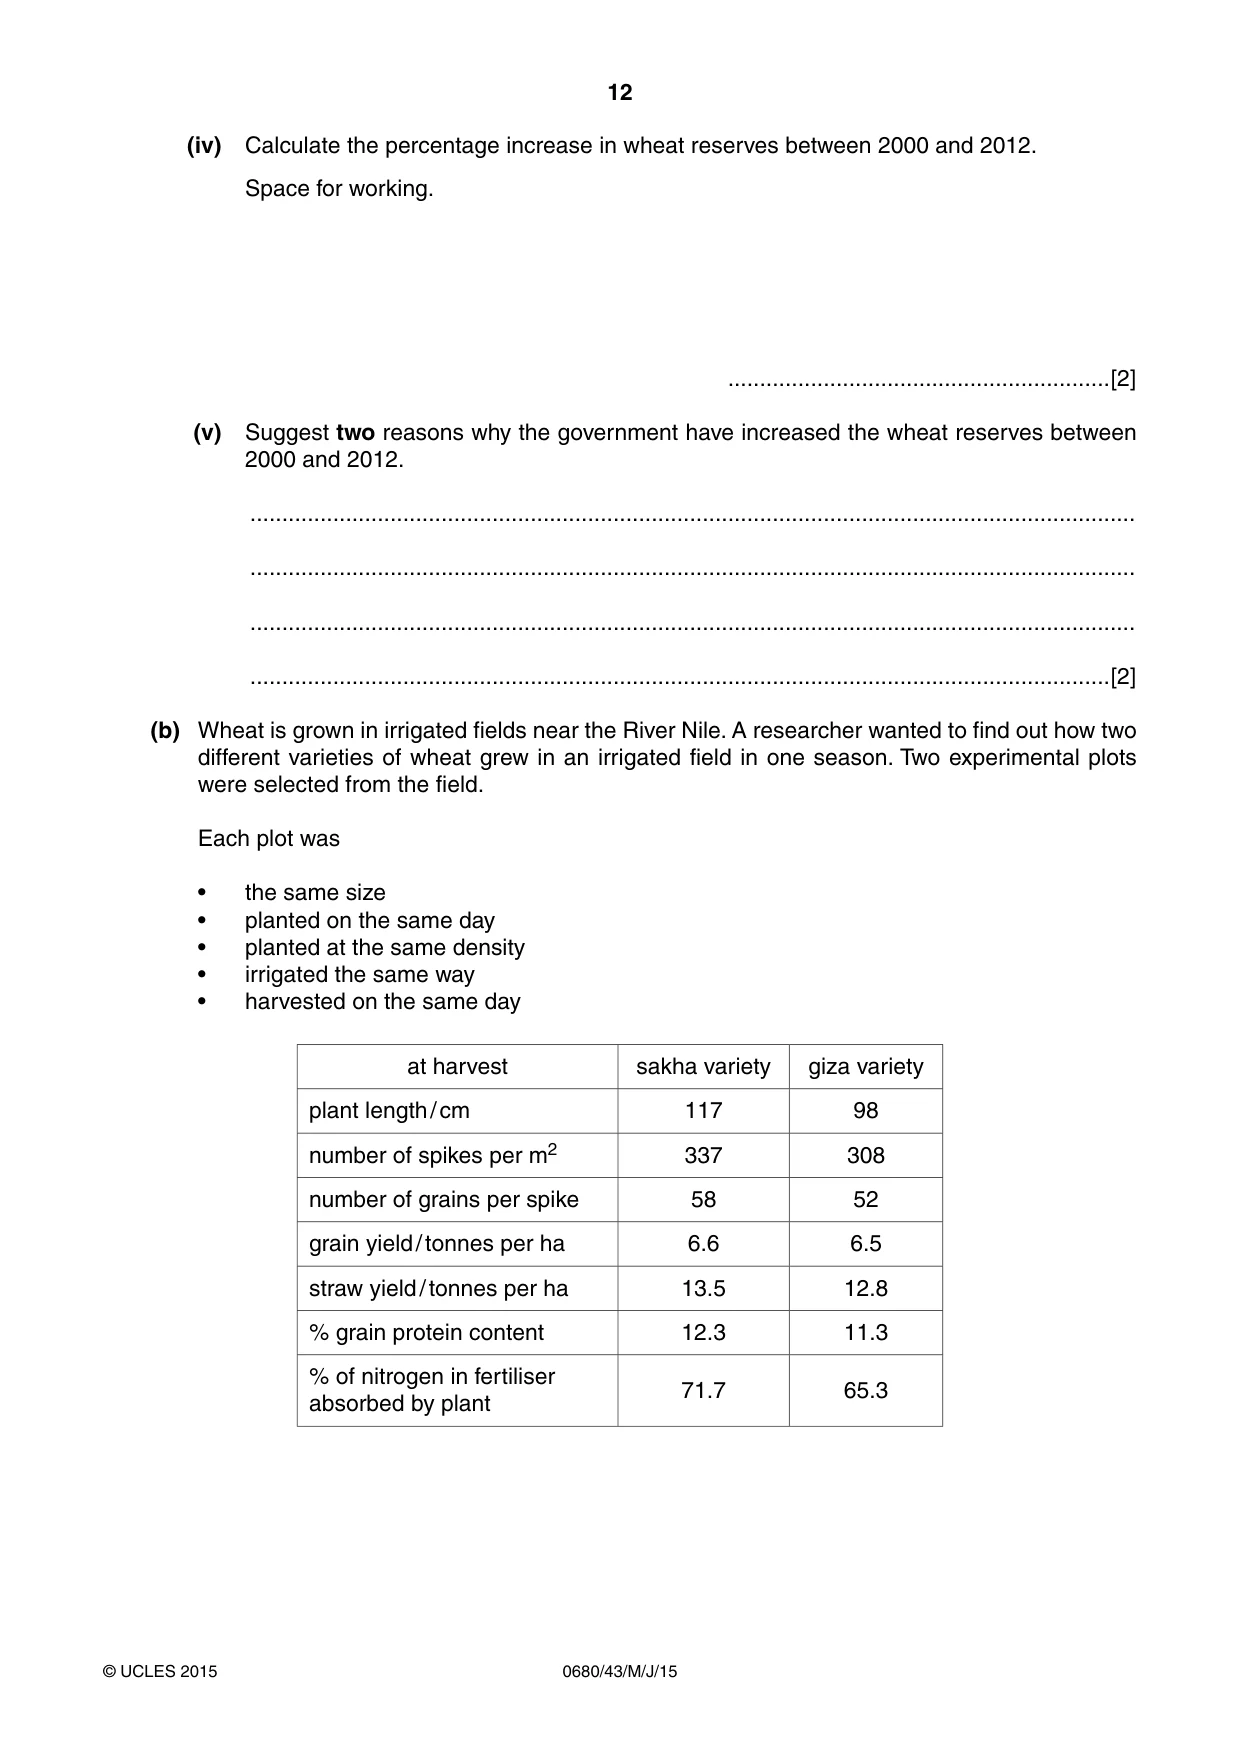
12 0680/43/M/J/15 © UCLES 2015 (iv) Calculate the percentage increase in wheat reserves between 2000 and 2012. Space for working. …[2] (v) Suggest two reasons why the government have increased the wheat reserves between 2000 and 2012. … … … …[2] (b) Wheat is grown in irrigated fields near the River Nile. A researcher wanted to find out how two different varieties of wheat grew in an irrigated field in one season. Two experimental plots were selected from the field. Each plot was • the same size • planted on the same day • planted at the same density • irrigated the same way • harvested on the same day at harvest sakha variety giza variety plant length / cm 117 98 number of spikes per m2 337 308 number of grains per spike 58 52 grain yield / tonnes per ha 6.6 6.5 straw yield / tonnes per ha 13.5 12.8 % grain protein content 12.3 11.3 % of nitrogen in fertiliser absorbed by plant 71.7 65.3
Question paper, page 13
13 0680/43/M/J/15 © UCLES 2015 [Turn over (i) The researcher decided that sakha variety had a faster growth rate than giza variety. Explain why the researcher came to this conclusion. … … … … … …[3] (ii) Complete the table below to show the total number of grains per m2 for both varieties. variety number of spikes per m2 number of grains per spike total number of grains per m2 sakha 337 58 19 546 giza … … … [2] (iii) Suggest one reason for the small difference in final grain yield (tonnes per ha) between the two varieties. … …[1] (iv) Explain why making bread from sakha variety would help to improve human health. … …[1] (v) The researcher decided to repeat this experiment in the next growing season using the same methods. Explain why. … …[1] (vi) Explain why farmers want to grow a wheat variety that absorbs the most nitrogen from fertiliser. … … … …[2]
Question paper, page 14
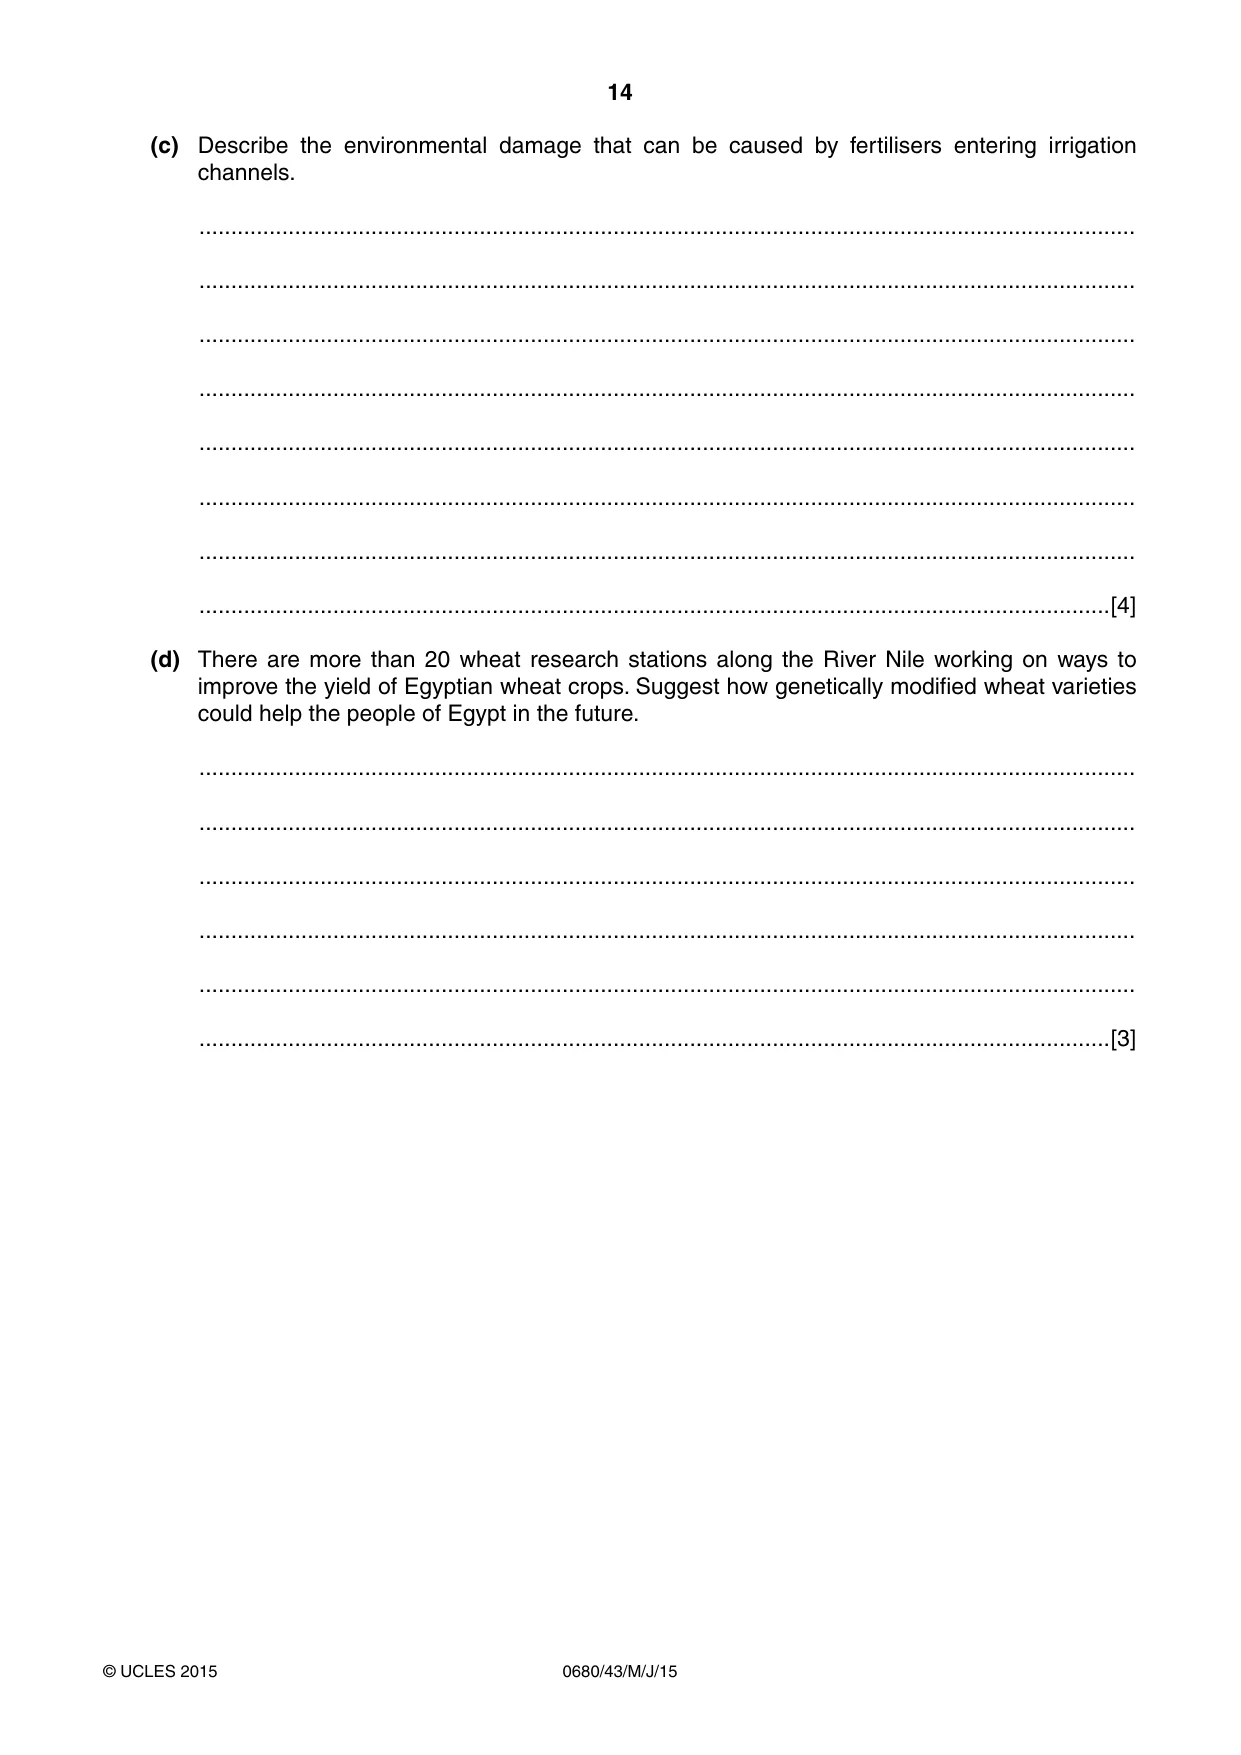
14 0680/43/M/J/15 © UCLES 2015 (c) Describe the environmental damage that can be caused by fertilisers entering irrigation channels. … … … … … … … …[4] (d) There are more than 20 wheat research stations along the River Nile working on ways to improve the yield of Egyptian wheat crops. Suggest how genetically modified wheat varieties could help the people of Egypt in the future. … … … … … …[3]
Question paper, page 15
15 0680/43/M/J/15 © UCLES 2015 BLANK PAGE
Question paper, page 16
16 0680/43/M/J/15 © UCLES 2015 Permission to reproduce items where third-party owned material protected by copyright is included has been sought and cleared where possible. Every reasonable effort has been made by the publisher (UCLES) to trace copyright holders, but if any items requiring clearance have unwittingly been included, the publisher will be pleased to make amends at the earliest possible opportunity. To avoid the issue of disclosure of answer-related information to candidates, all copyright acknowledgements are reproduced online in the Cambridge International Examinations Copyright Acknowledgements Booklet. This is produced for each series of examinations and is freely available to download at www.cie.org.uk after the live examination series. Cambridge International Examinations is part of the Cambridge Assessment Group. Cambridge Assessment is the brand name of University of Cambridge Local Examinations Syndicate (UCLES), which is itself a department of the University of Cambridge. BLANK PAGE
Mark scheme, page 1
® IGCSE is the registered trademark of Cambridge International Examinations. CAMBRIDGE INTERNATIONAL EXAMINATIONS Cambridge International General Certificate of Secondary Education MARK SCHEME for the May/June 2015 series 0680 ENVIRONMENTAL MANAGEMENT 0680/43 Paper 4 (Alternative to Coursework), maximum raw mark 60 This mark scheme is published as an aid to teachers and candidates, to indicate the requirements of the examination. It shows the basis on which Examiners were instructed to award marks. It does not indicate the details of the discussions that took place at an Examiners’ meeting before marking began, which would have considered the acceptability of alternative answers. Mark schemes should be read in conjunction with the question paper and the Principal Examiner Report for Teachers. Cambridge will not enter into discussions about these mark schemes. Cambridge is publishing the mark schemes for the May/June 2015 series for most Cambridge IGCSE®, Cambridge International A and AS Level components and some Cambridge O Level components.
Mark scheme, page 2
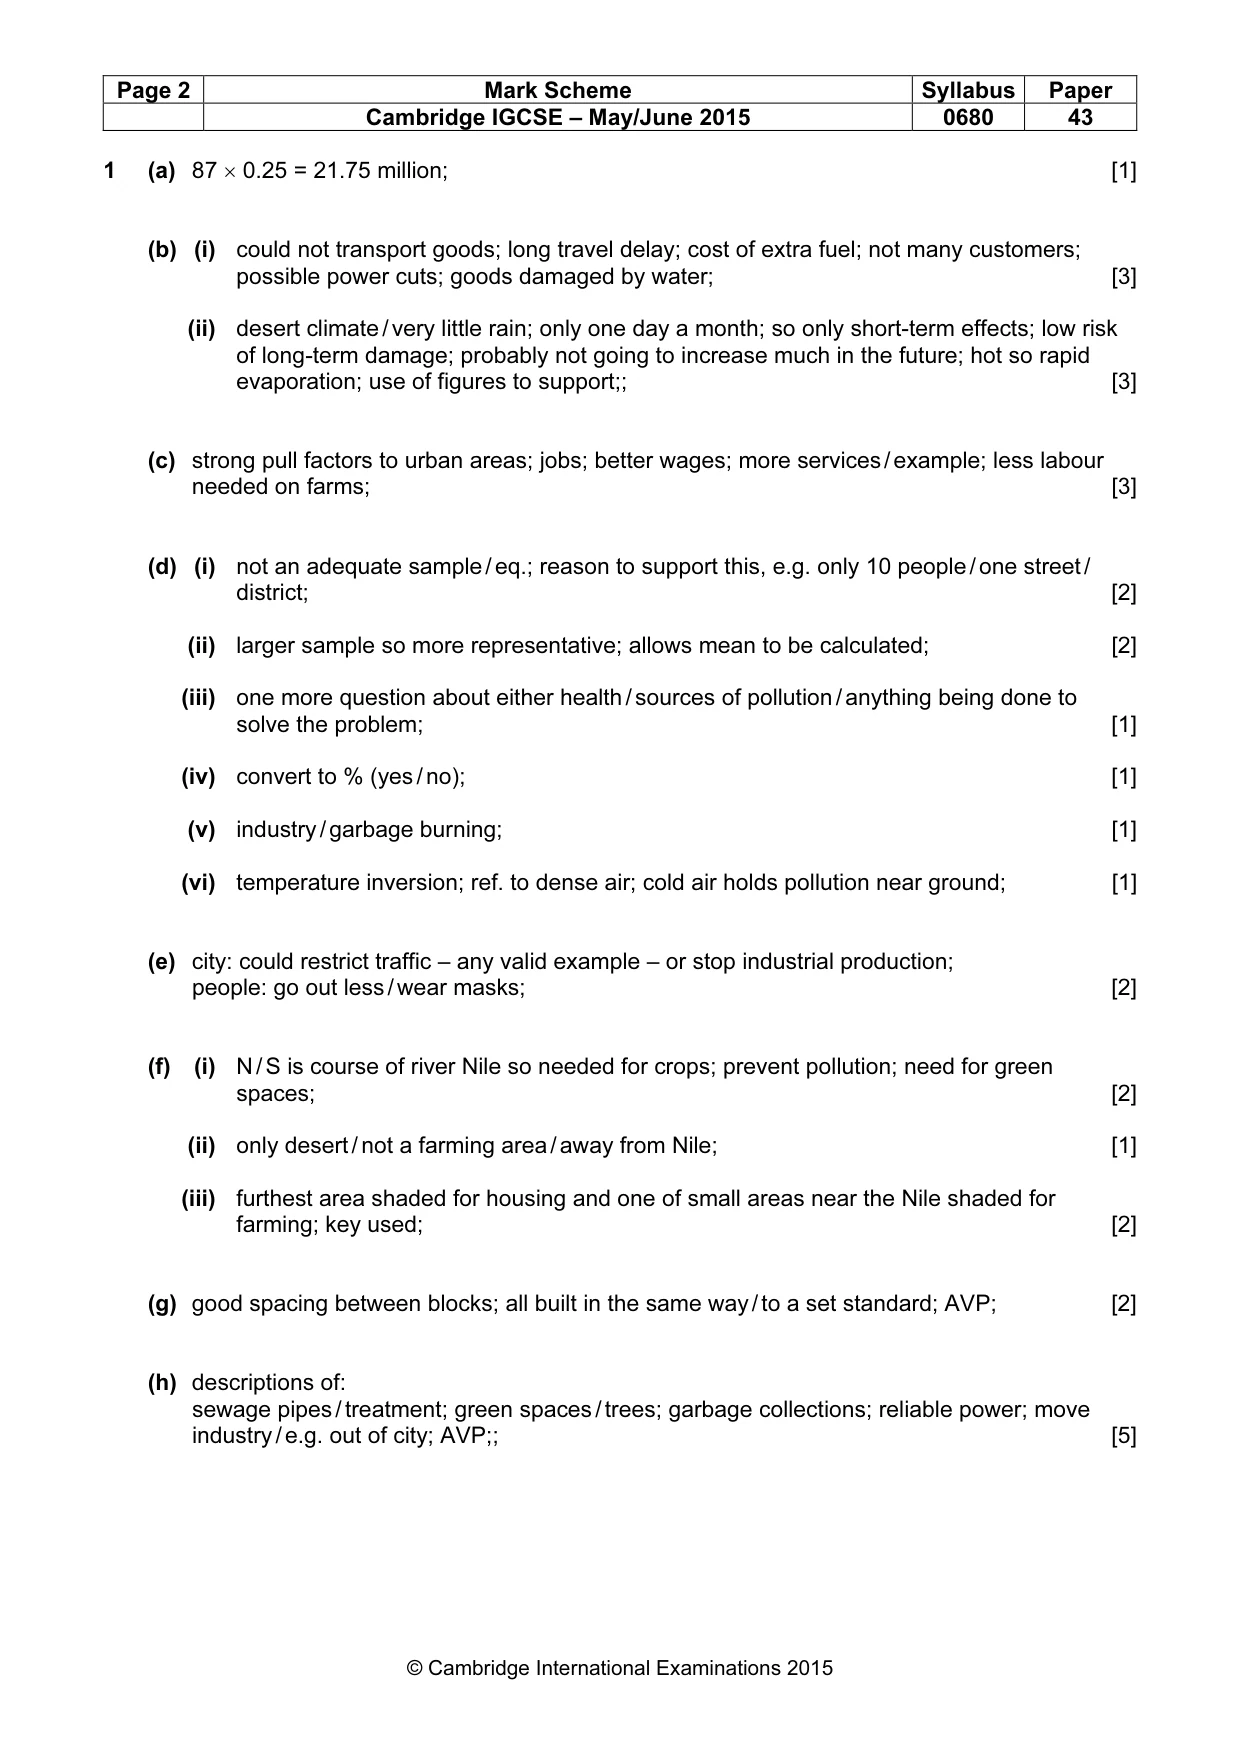
Page 2 Mark Scheme Syllabus Paper Cambridge IGCSE – May/June 2015 0680 43 © Cambridge International Examinations 2015 1 (a) 87 × 0.25 = 21.75 million; [1] (b) (i) could not transport goods; long travel delay; cost of extra fuel; not many customers; possible power cuts; goods damaged by water; [3] (ii) desert climate / very little rain; only one day a month; so only short-term effects; low risk of long-term damage; probably not going to increase much in the future; hot so rapid evaporation; use of figures to support;; [3] (c) strong pull factors to urban areas; jobs; better wages; more services / example; less labour needed on farms; [3] (d) (i) not an adequate sample / eq.; reason to support this, e.g. only 10 people / one street / district; [2] (ii) larger sample so more representative; allows mean to be calculated; [2] (iii) one more question about either health / sources of pollution / anything being done to solve the problem; [1] (iv) convert to % (yes / no); [1] (v) industry / garbage burning; [1] (vi) temperature inversion; ref. to dense air; cold air holds pollution near ground; [1] (e) city: could restrict traffic – any valid example – or stop industrial production; people: go out less / wear masks; [2] (f) (i) N / S is course of river Nile so needed for crops; prevent pollution; need for green spaces; [2] (ii) only desert / not a farming area / away from Nile; [1] (iii) furthest area shaded for housing and one of small areas near the Nile shaded for farming; key used; [2] (g) good spacing between blocks; all built in the same way / to a set standard; AVP; [2] (h) descriptions of: sewage pipes / treatment; green spaces / trees; garbage collections; reliable power; move industry / e.g. out of city; AVP;; [5]
Mark scheme, page 3
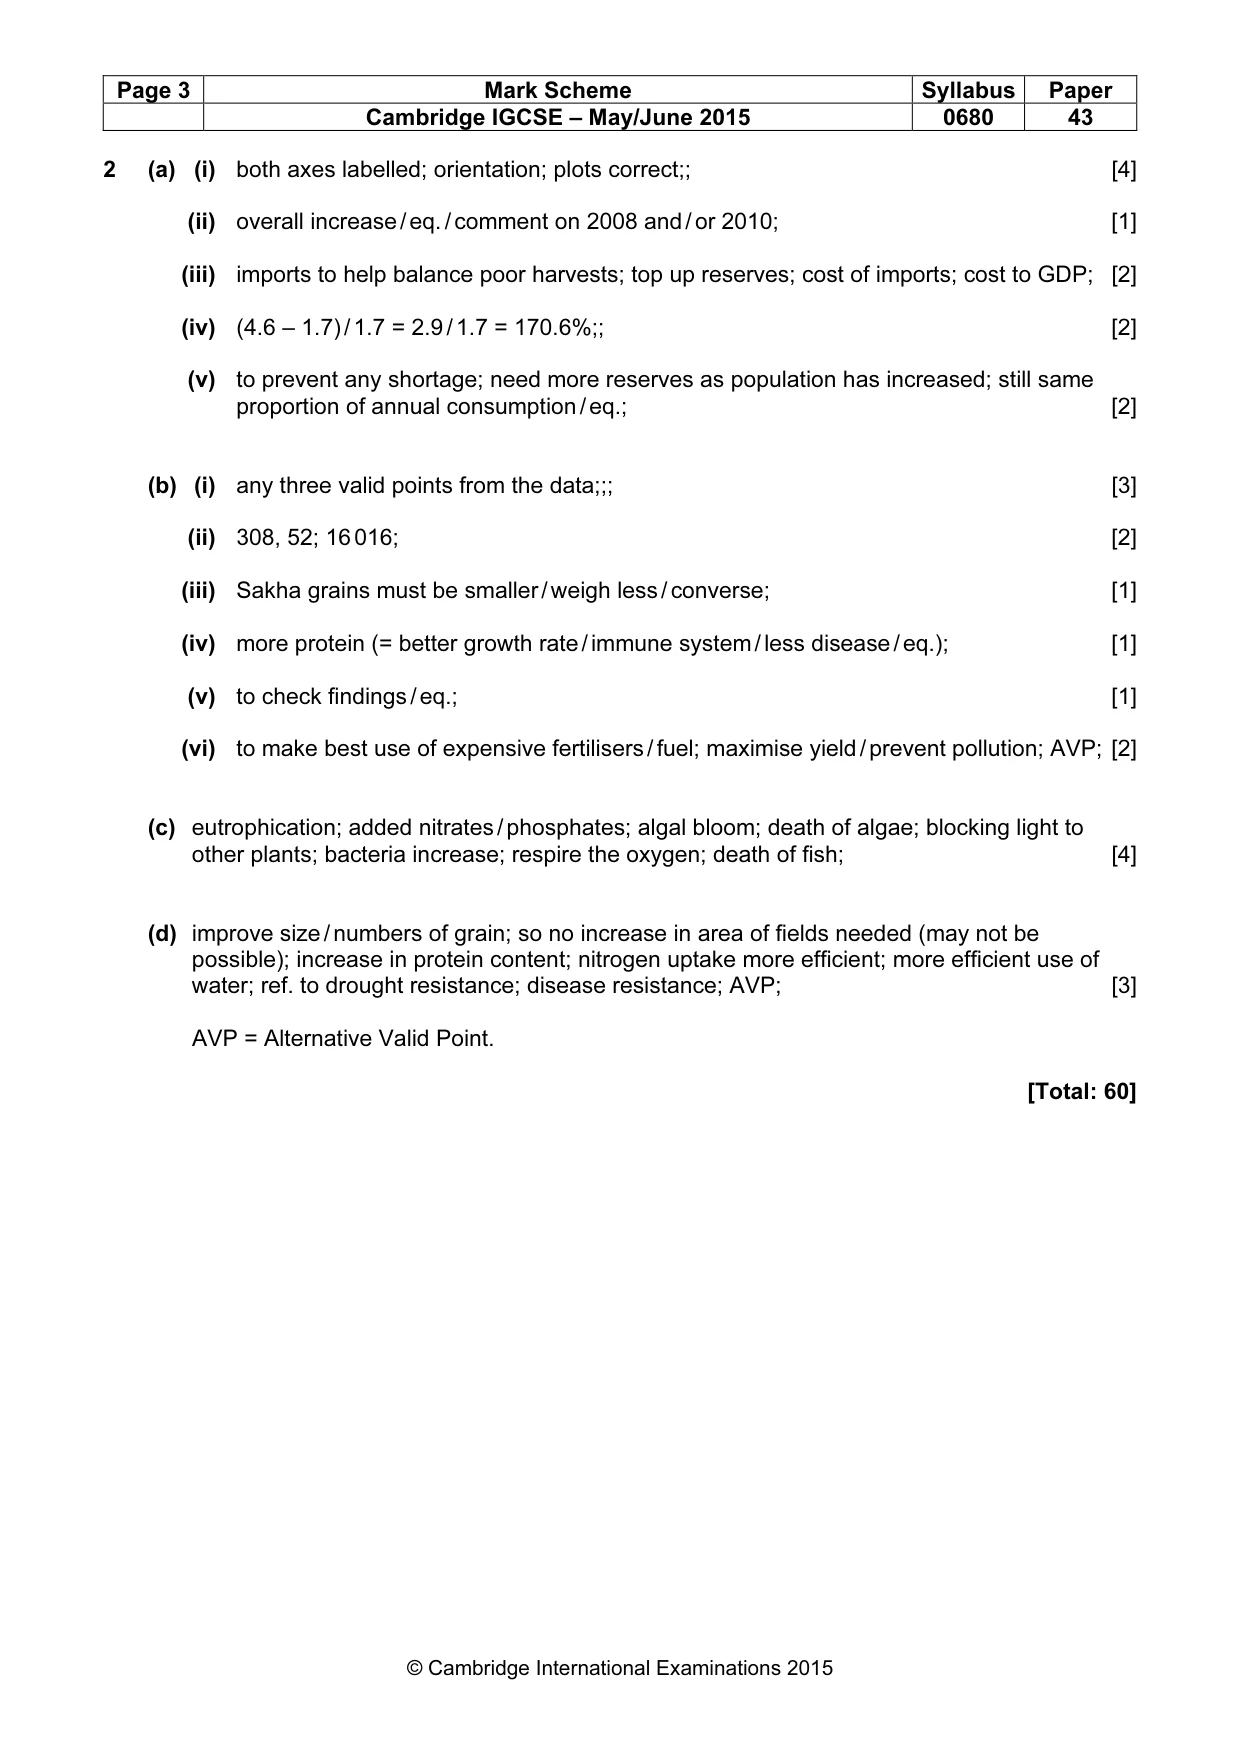
Page 3 Mark Scheme Syllabus Paper Cambridge IGCSE – May/June 2015 0680 43 © Cambridge International Examinations 2015 2 (a) (i) both axes labelled; orientation; plots correct;; [4] (ii) overall increase / eq. / comment on 2008 and / or 2010; [1] (iii) imports to help balance poor harvests; top up reserves; cost of imports; cost to GDP; [2] (iv) (4.6 – 1.7) / 1.7 = 2.9 / 1.7 = 170.6%;; [2] (v) to prevent any shortage; need more reserves as population has increased; still same proportion of annual consumption / eq.; [2] (b) (i) any three valid points from the data;;; [3] (ii) 308, 52; 16 016; [2] (iii) Sakha grains must be smaller / weigh less / converse; [1] (iv) more protein (= better growth rate / immune system / less disease / eq.); [1] (v) to check findings / eq.; [1] (vi) to make best use of expensive fertilisers / fuel; maximise yield / prevent pollution; AVP; [2] (c) eutrophication; added nitrates / phosphates; algal bloom; death of algae; blocking light to other plants; bacteria increase; respire the oxygen; death of fish; [4] (d) improve size / numbers of grain; so no increase in area of fields needed (may not be possible); increase in protein content; nitrogen uptake more efficient; more efficient use of water; ref. to drought resistance; disease resistance; AVP; [3] AVP = Alternative Valid Point. [Total: 60]
What you needed in this session
Cambridge’s own grade thresholds for 2015 May/June, Paper 4 · Variant 3. A higher threshold means an easier paper — the bar moves with how the cohort did.