Cambridge IGCSE Environmental Management 0680 — 2017 Oct/Nov Paper 4 · Variant 3
0680/43/O/N/17 · 60 marks · ≈68 min
The question paper and its mark scheme, free to read here and free to download. This is Cambridge’s own paper, exactly as it was sat.
Question paper16 pages

Mark scheme6 pages
Answers below. Sit the paper first if you are practising.
Paper as text
Question paper, page 1
* 0 0 0 2 5 6 7 3 0 7 * This document consists of 15 printed pages and 1 blank page. DC (NF/JG) 136871/4 © UCLES 2017 [Turn over Cambridge International Examinations Cambridge International General Certificate of Secondary Education ENVIRONMENTAL MANAGEMENT 0680/43 Paper 4 October/November 2017 1 hour 30 minutes Candidates answer on the Question Paper. No Additional Materials are required. READ THESE INSTRUCTIONS FIRST Write your Centre number, candidate number and name on all the work you hand in. Write in dark blue or black pen. You may use an HB pencil for any diagrams or graphs. Do not use staples, paper clips, glue or correction fluid. DO NOT WRITE IN ANY BARCODES. Answer all questions. Electronic calculators may be used. You may lose marks if you do not show your working or if you do not use appropriate units. Study the appropriate source materials before you start to write your answers. Credit will be given for appropriate selection and use of data in your answers and for relevant interpretation of these data. Suggestions for data sources are given in some questions. You may use the source data to draw diagrams and graphs or to do calculations to illustrate your answers. At the end of the examination, fasten all your work securely together. The number of marks is given in brackets [ ] at the end of each question or part question.
Question paper, page 2
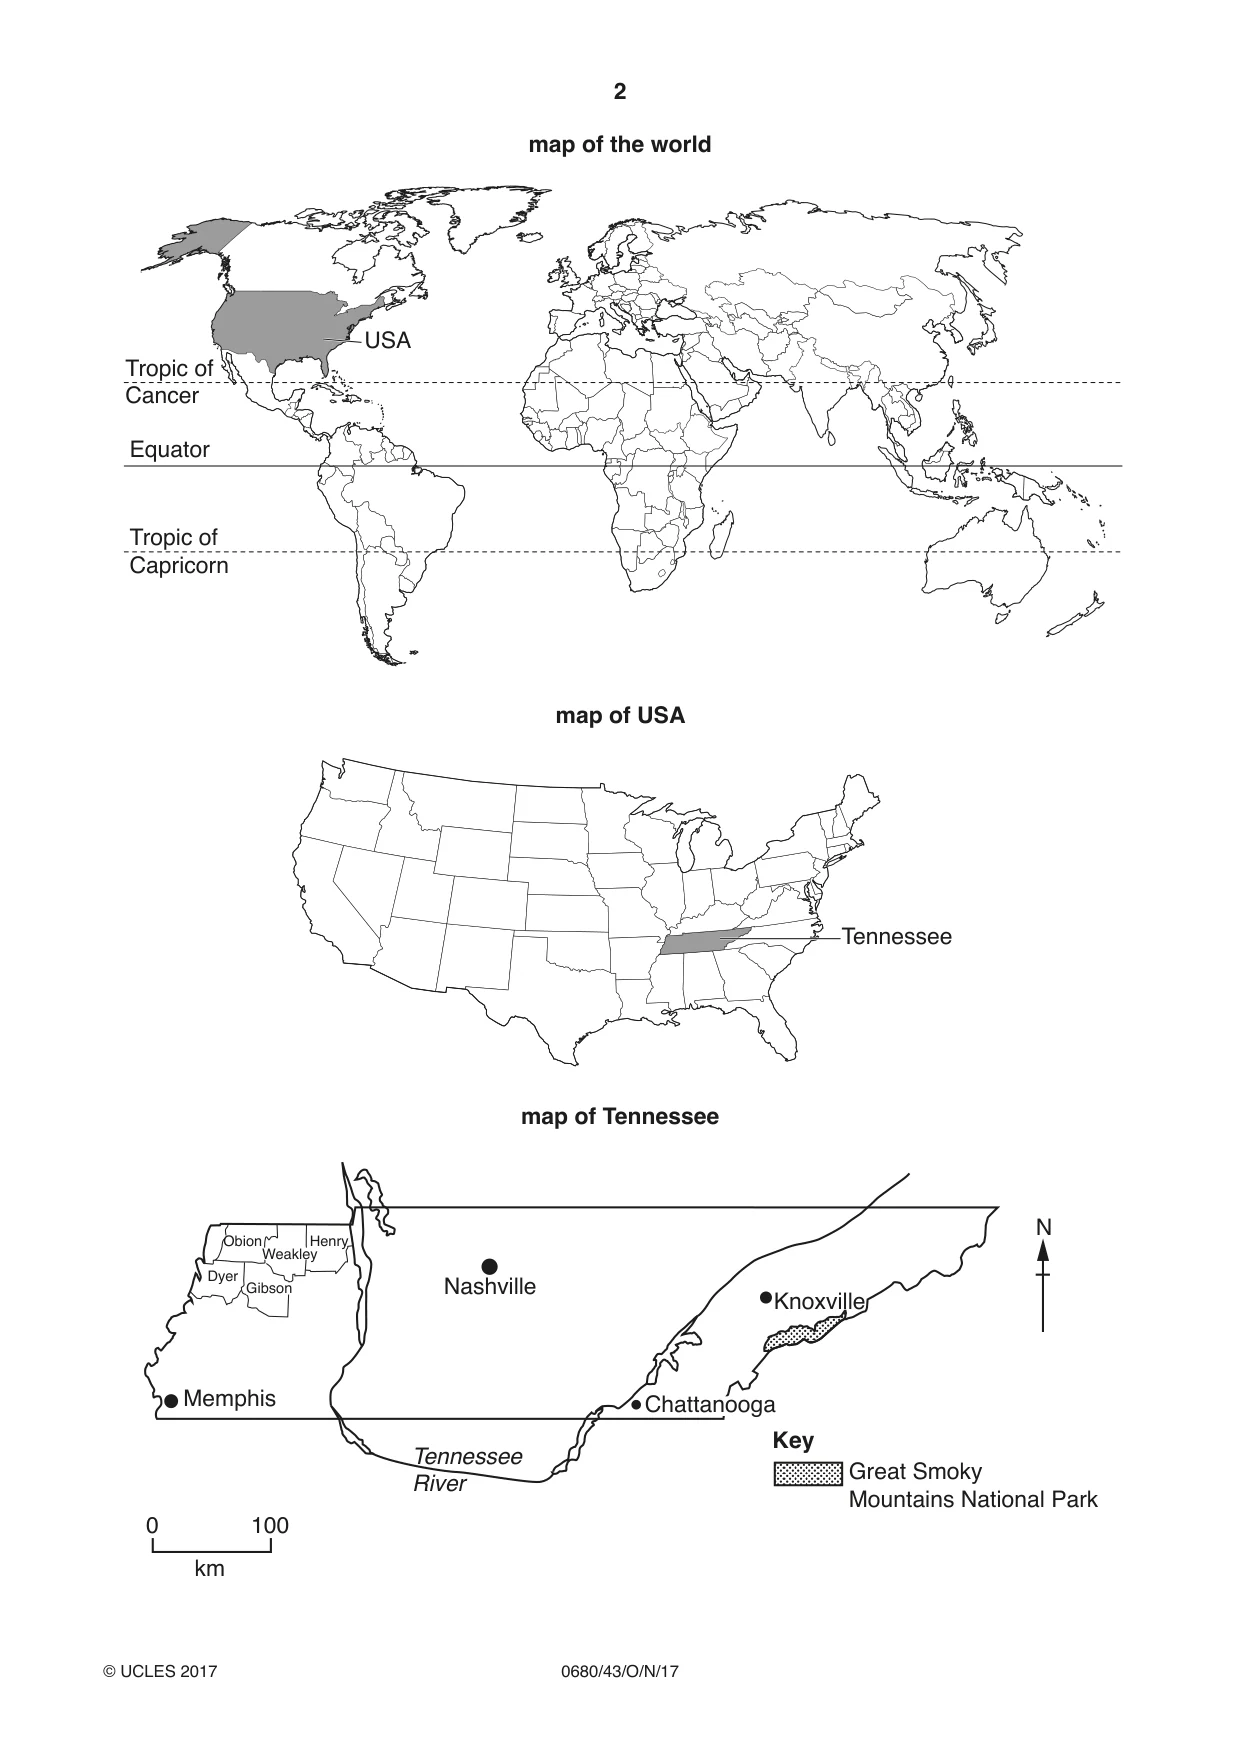
2 0680/43/O/N/17 © UCLES 2017 map of the world Equator Tropic of Capricorn Tropic of Cancer USA map of USA Tennessee map of Tennessee Tennessee River 0 100 km N Nashville Memphis Great Smoky Mountains National Park Knoxville Chattanooga Key Obion Henry Dyer Gibson Weakley
Question paper, page 3
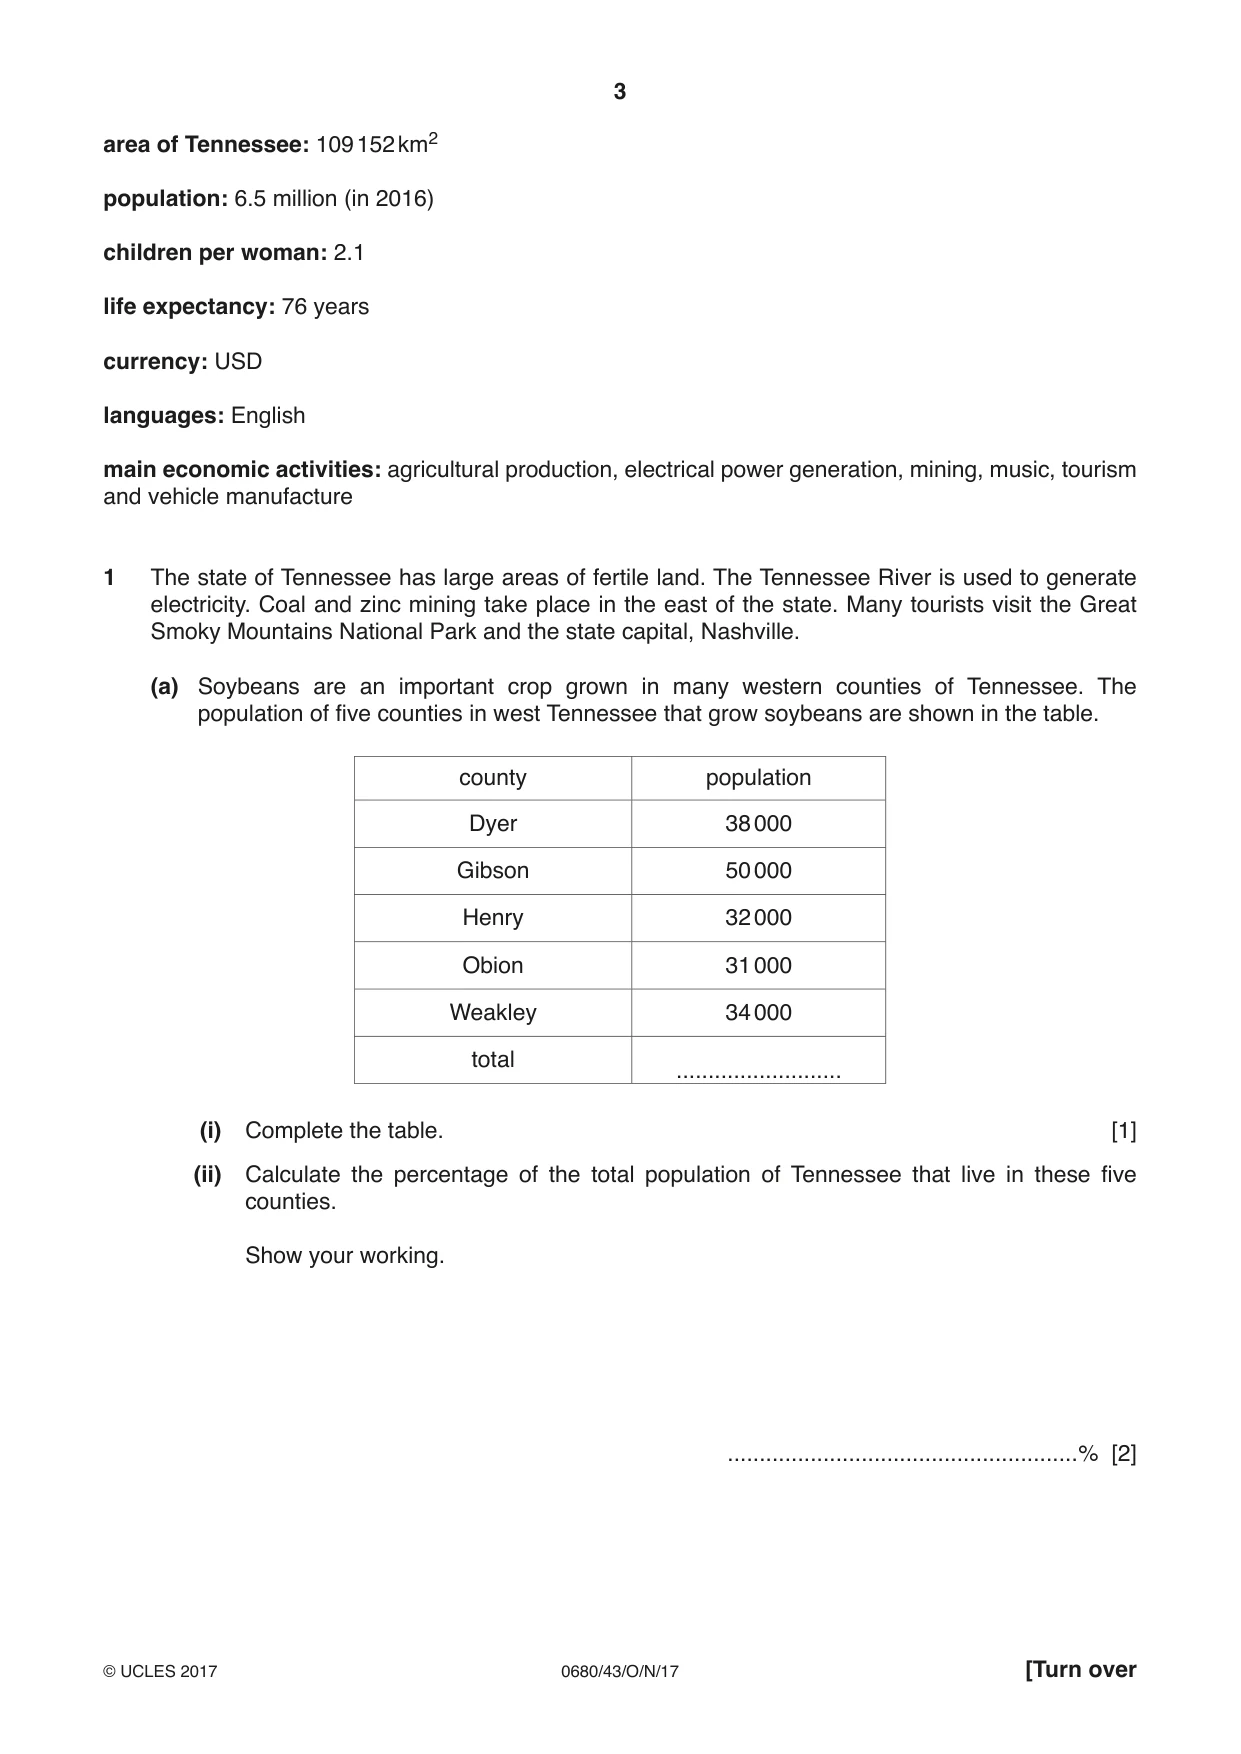
3 0680/43/O/N/17 © UCLES 2017 [Turn over area of Tennessee: 109 152 km2 population: 6.5 million (in 2016) children per woman: 2.1 life expectancy: 76 years currency: USD languages: English main economic activities: agricultural production, electrical power generation, mining, music, tourism and vehicle manufacture 1 The state of Tennessee has large areas of fertile land. The Tennessee River is used to generate electricity. Coal and zinc mining take place in the east of the state. Many tourists visit the Great Smoky Mountains National Park and the state capital, Nashville. (a) Soybeans are an important crop grown in many western counties of Tennessee. The population of five counties in west Tennessee that grow soybeans are shown in the table. county population Dyer 38 000 Gibson 50 000 Henry 32 000 Obion 31 000 Weakley 34 000 total … (i) Complete the table. [1] (ii) Calculate the percentage of the total population of Tennessee that live in these five counties. Show your working. …% [2]
Question paper, page 4
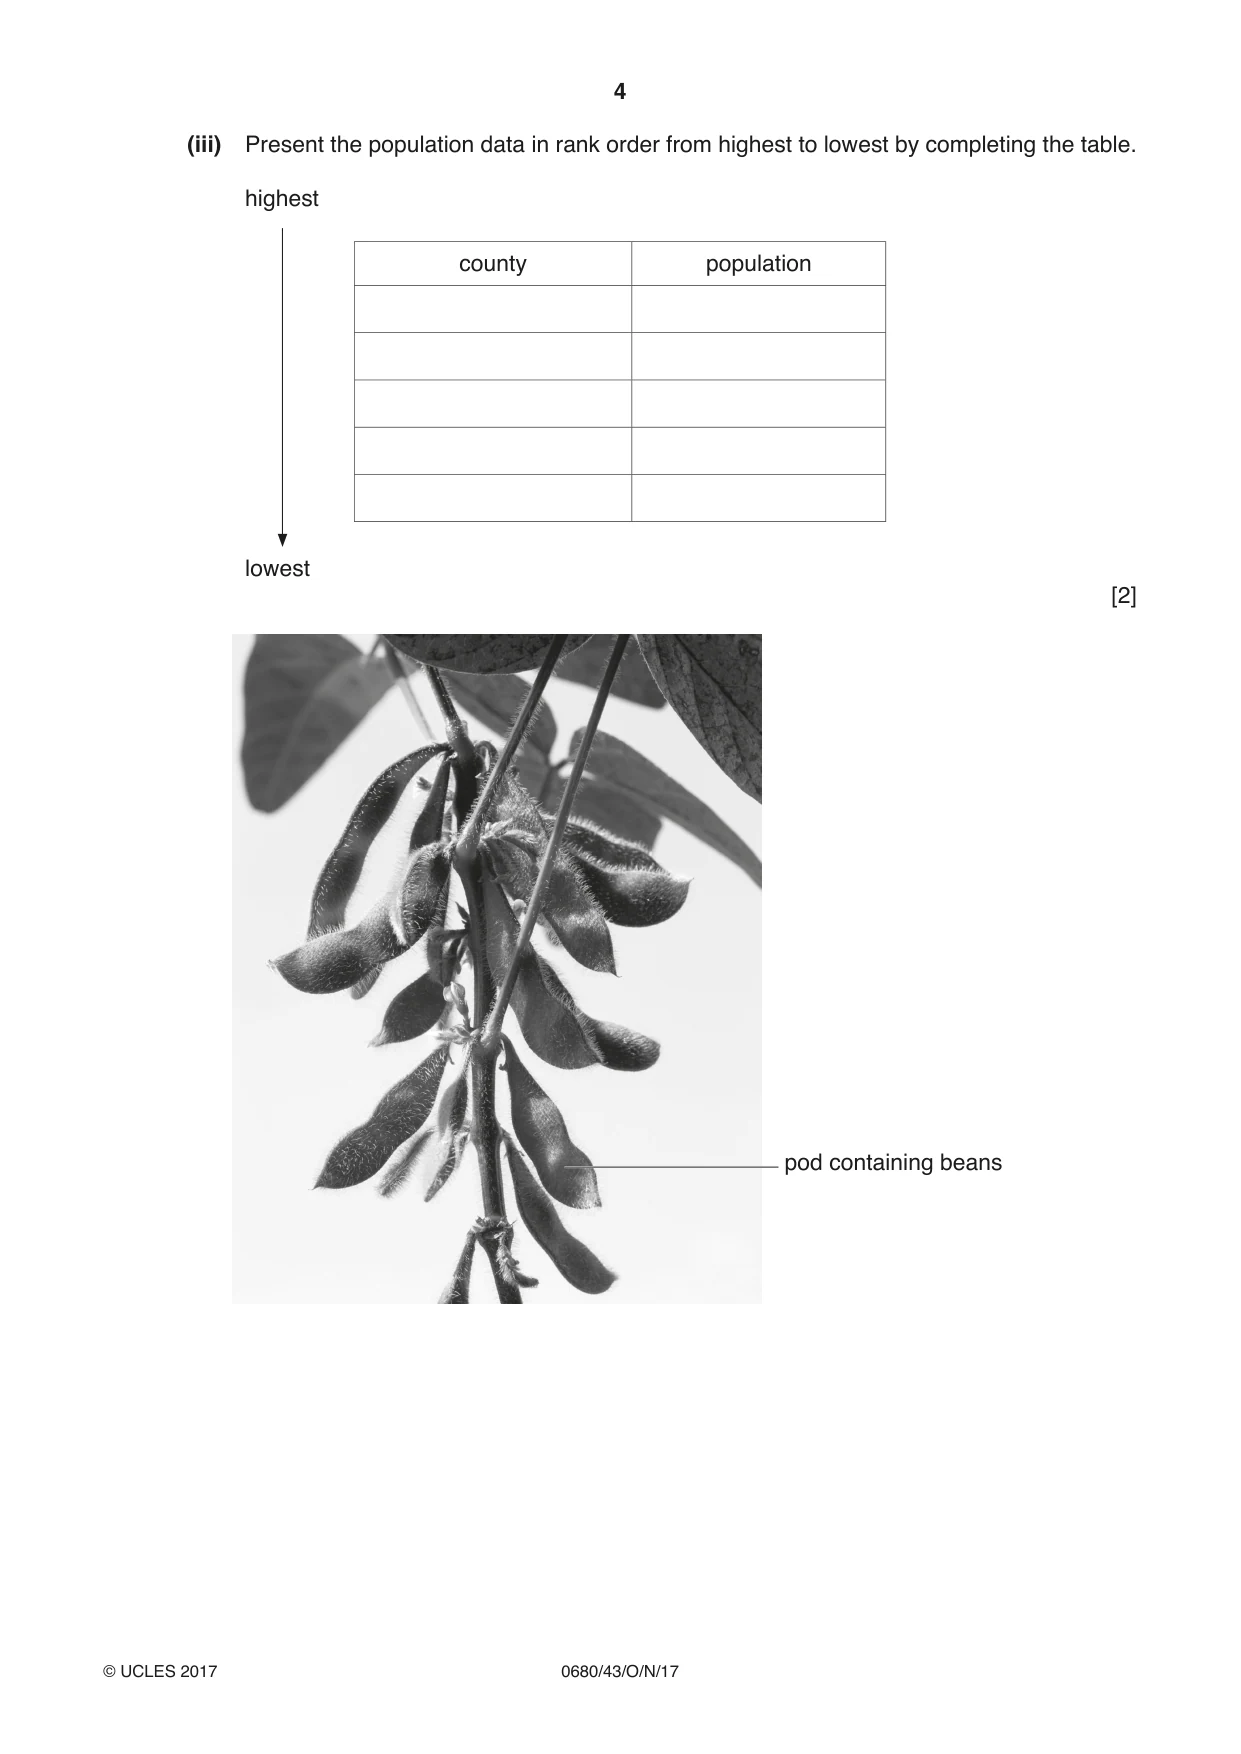
4 0680/43/O/N/17 © UCLES 2017 (iii) Present the population data in rank order from highest to lowest by completing the table. highest county population lowest [2] pod containing beans
Question paper, page 5
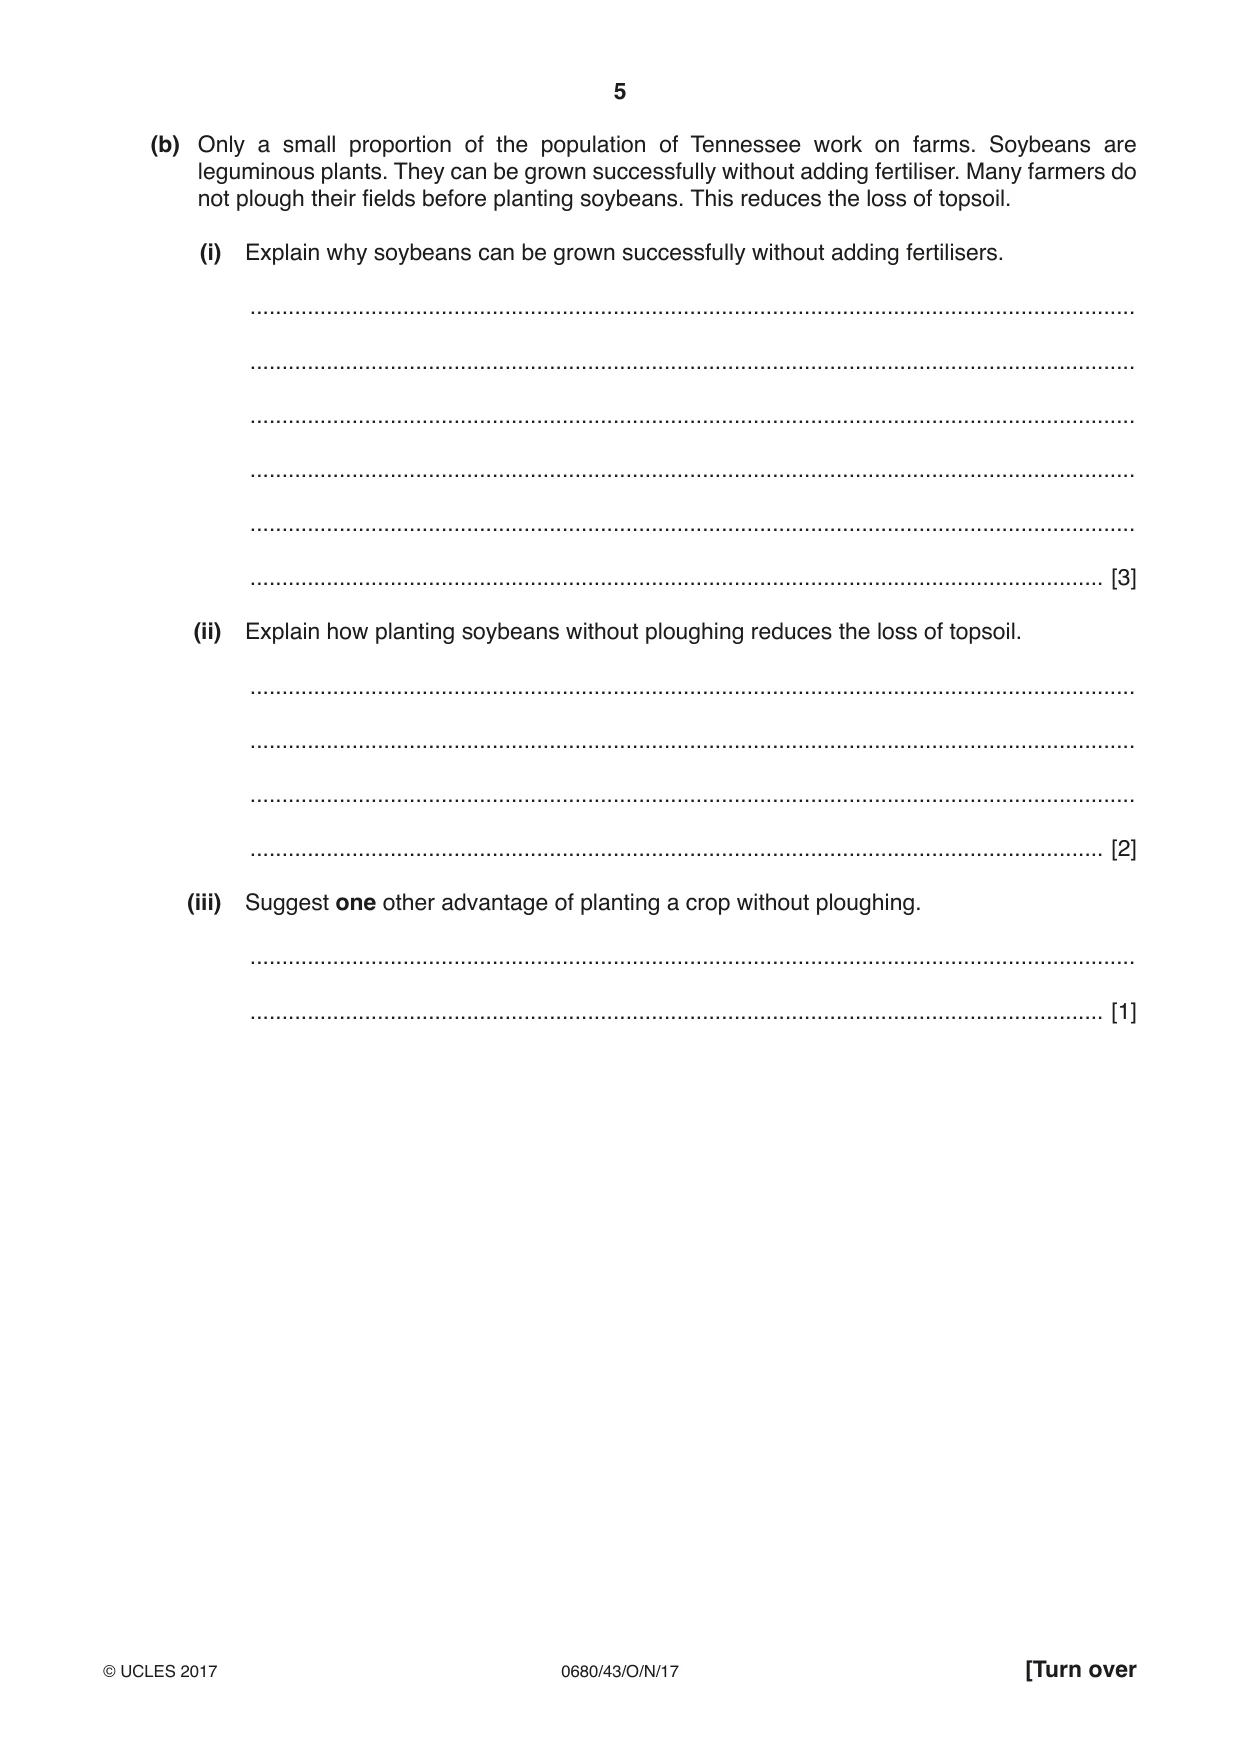
5 0680/43/O/N/17 © UCLES 2017 [Turn over (b) Only a small proportion of the population of Tennessee work on farms. Soybeans are leguminous plants. They can be grown successfully without adding fertiliser. Many farmers do not plough their fields before planting soybeans. This reduces the loss of topsoil. (i) Explain why soybeans can be grown successfully without adding fertilisers. … … … … … … [3] (ii) Explain how planting soybeans without ploughing reduces the loss of topsoil. … … … … [2] (iii) Suggest one other advantage of planting a crop without ploughing. … … [1]
Question paper, page 6
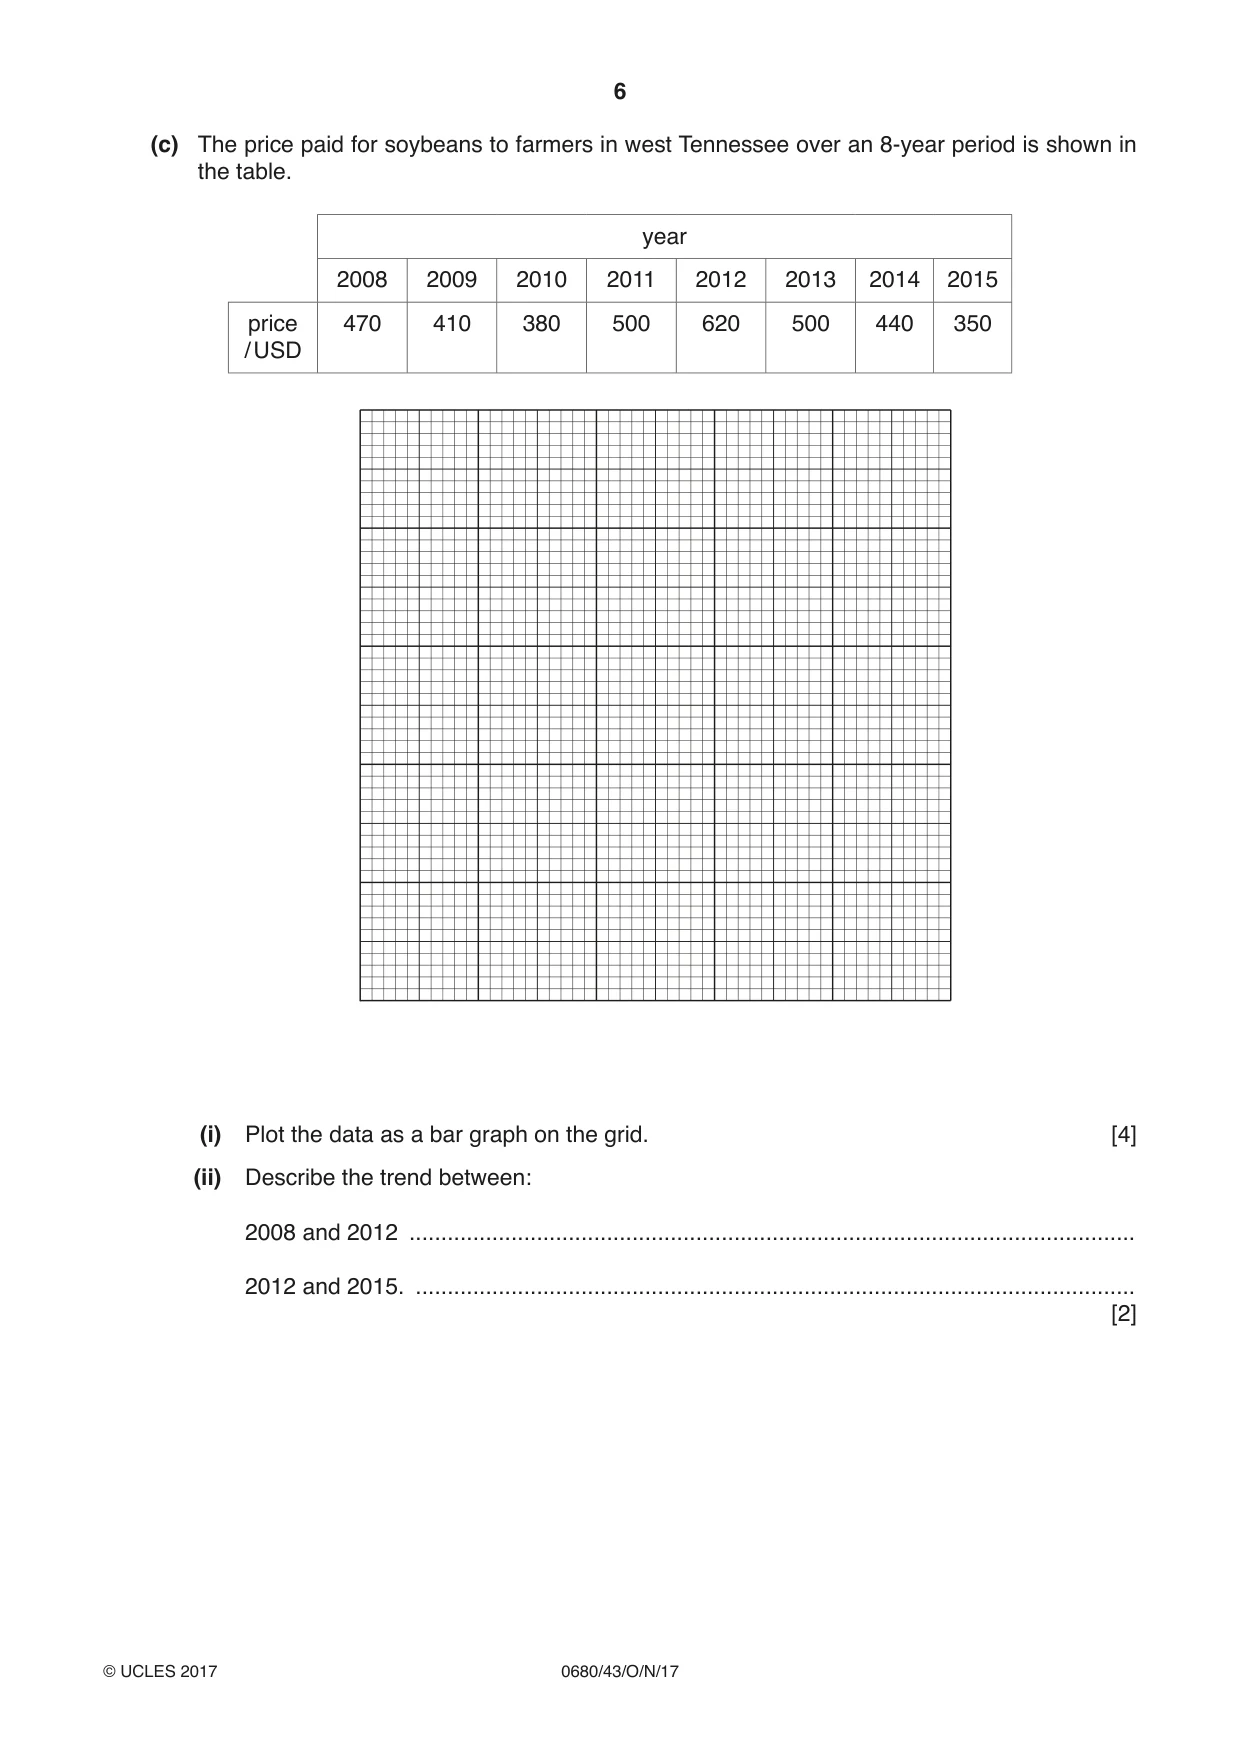
6 0680/43/O/N/17 © UCLES 2017 (c) The price paid for soybeans to farmers in west Tennessee over an 8-year period is shown in the table. year 2008 2009 2010 2011 2012 2013 2014 2015 price / USD 470 410 380 500 620 500 440 350 (i) Plot the data as a bar graph on the grid. [4] (ii) Describe the trend between: 2008 and 2012 … 2012 and 2015. … [2]
Question paper, page 7
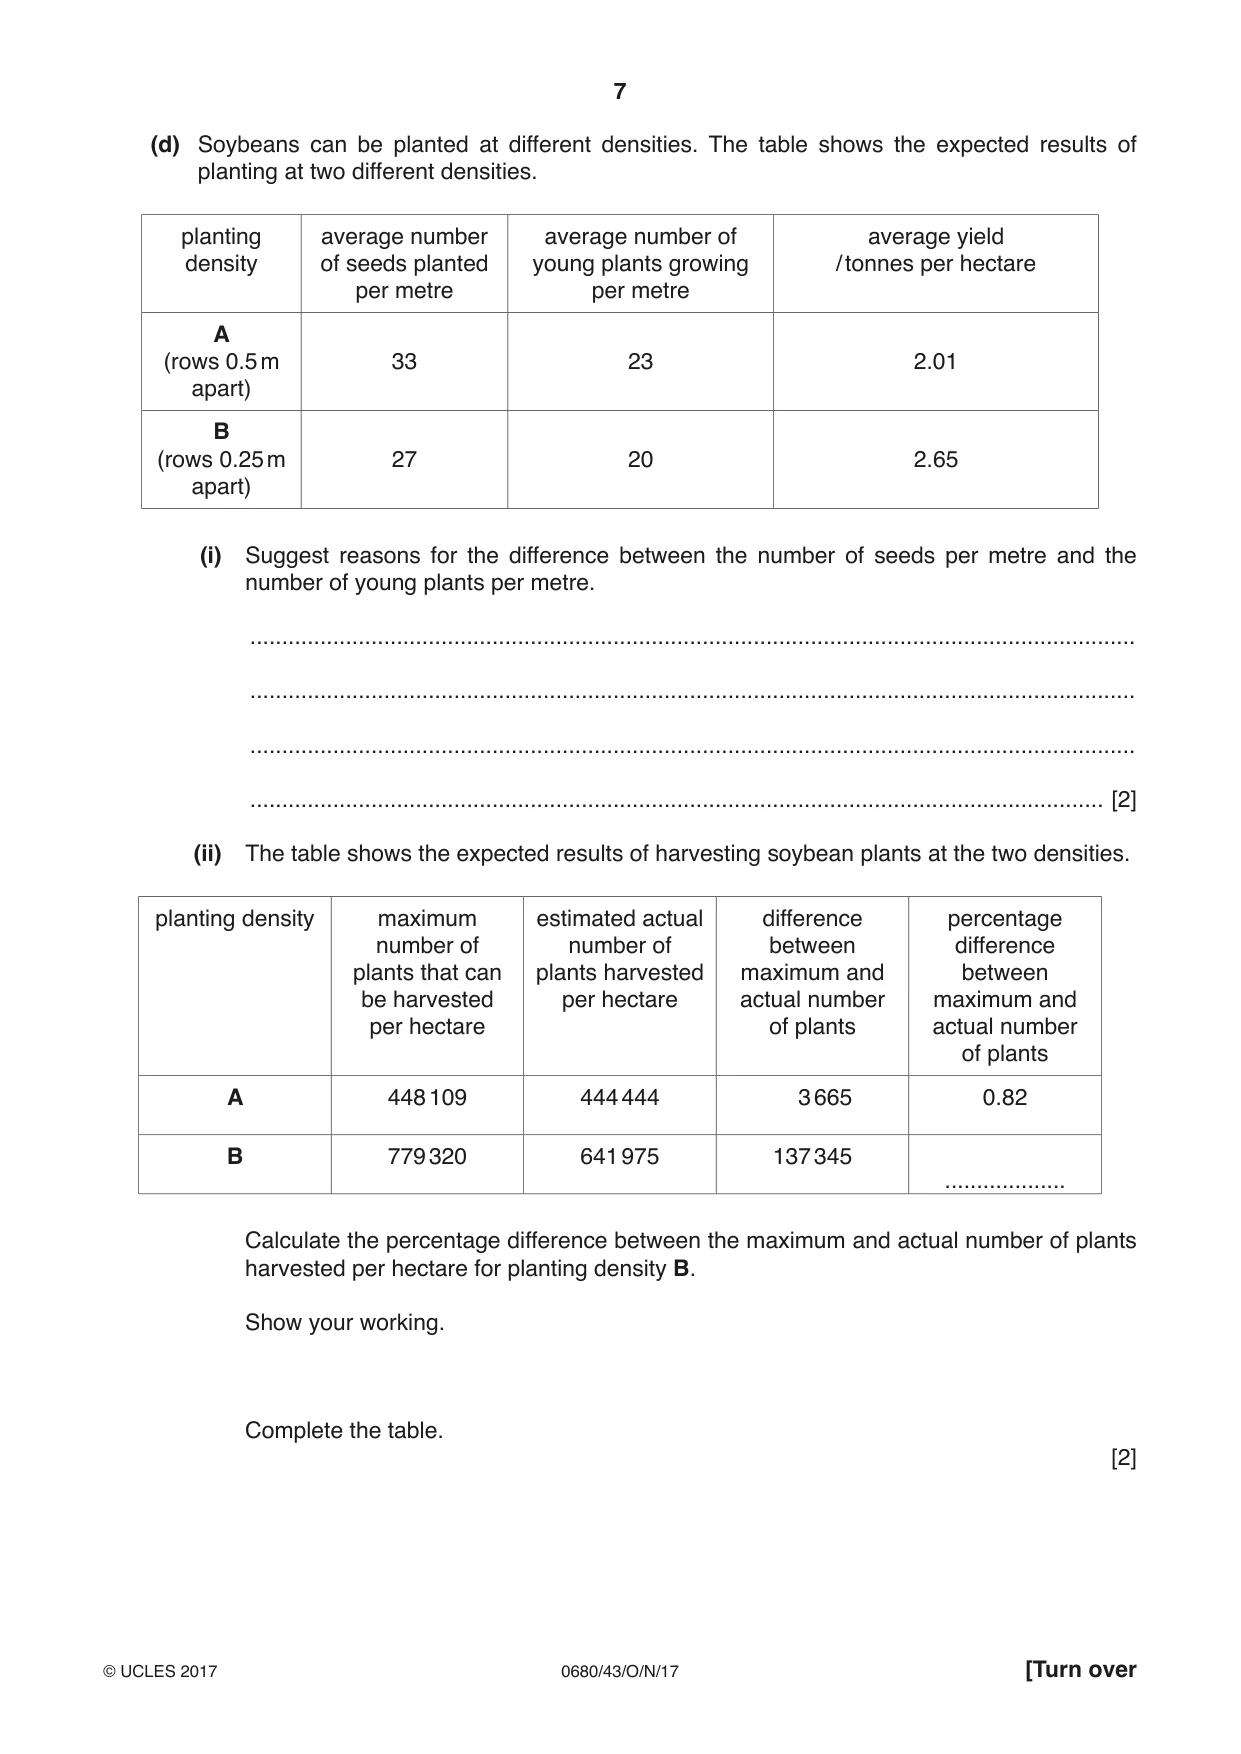
7 0680/43/O/N/17 © UCLES 2017 [Turn over (d) Soybeans can be planted at different densities. The table shows the expected results of planting at two different densities. planting density average number of seeds planted per metre average number of young plants growing per metre average yield / tonnes per hectare A (rows 0.5 m apart) 33 23 2.01 B (rows 0.25 m apart) 27 20 2.65 (i) Suggest reasons for the difference between the number of seeds per metre and the number of young plants per metre. … … … … [2] (ii) The table shows the expected results of harvesting soybean plants at the two densities. planting density maximum number of plants that can be harvested per hectare estimated actual number of plants harvested per hectare difference between maximum and actual number of plants percentage difference between maximum and actual number of plants A 448 109 444 444 3 665 0.82 B 779 320 641 975 137 345 … Calculate the percentage difference between the maximum and actual number of plants harvested per hectare for planting density B. Show your working. Complete the table. [2]
Question paper, page 8
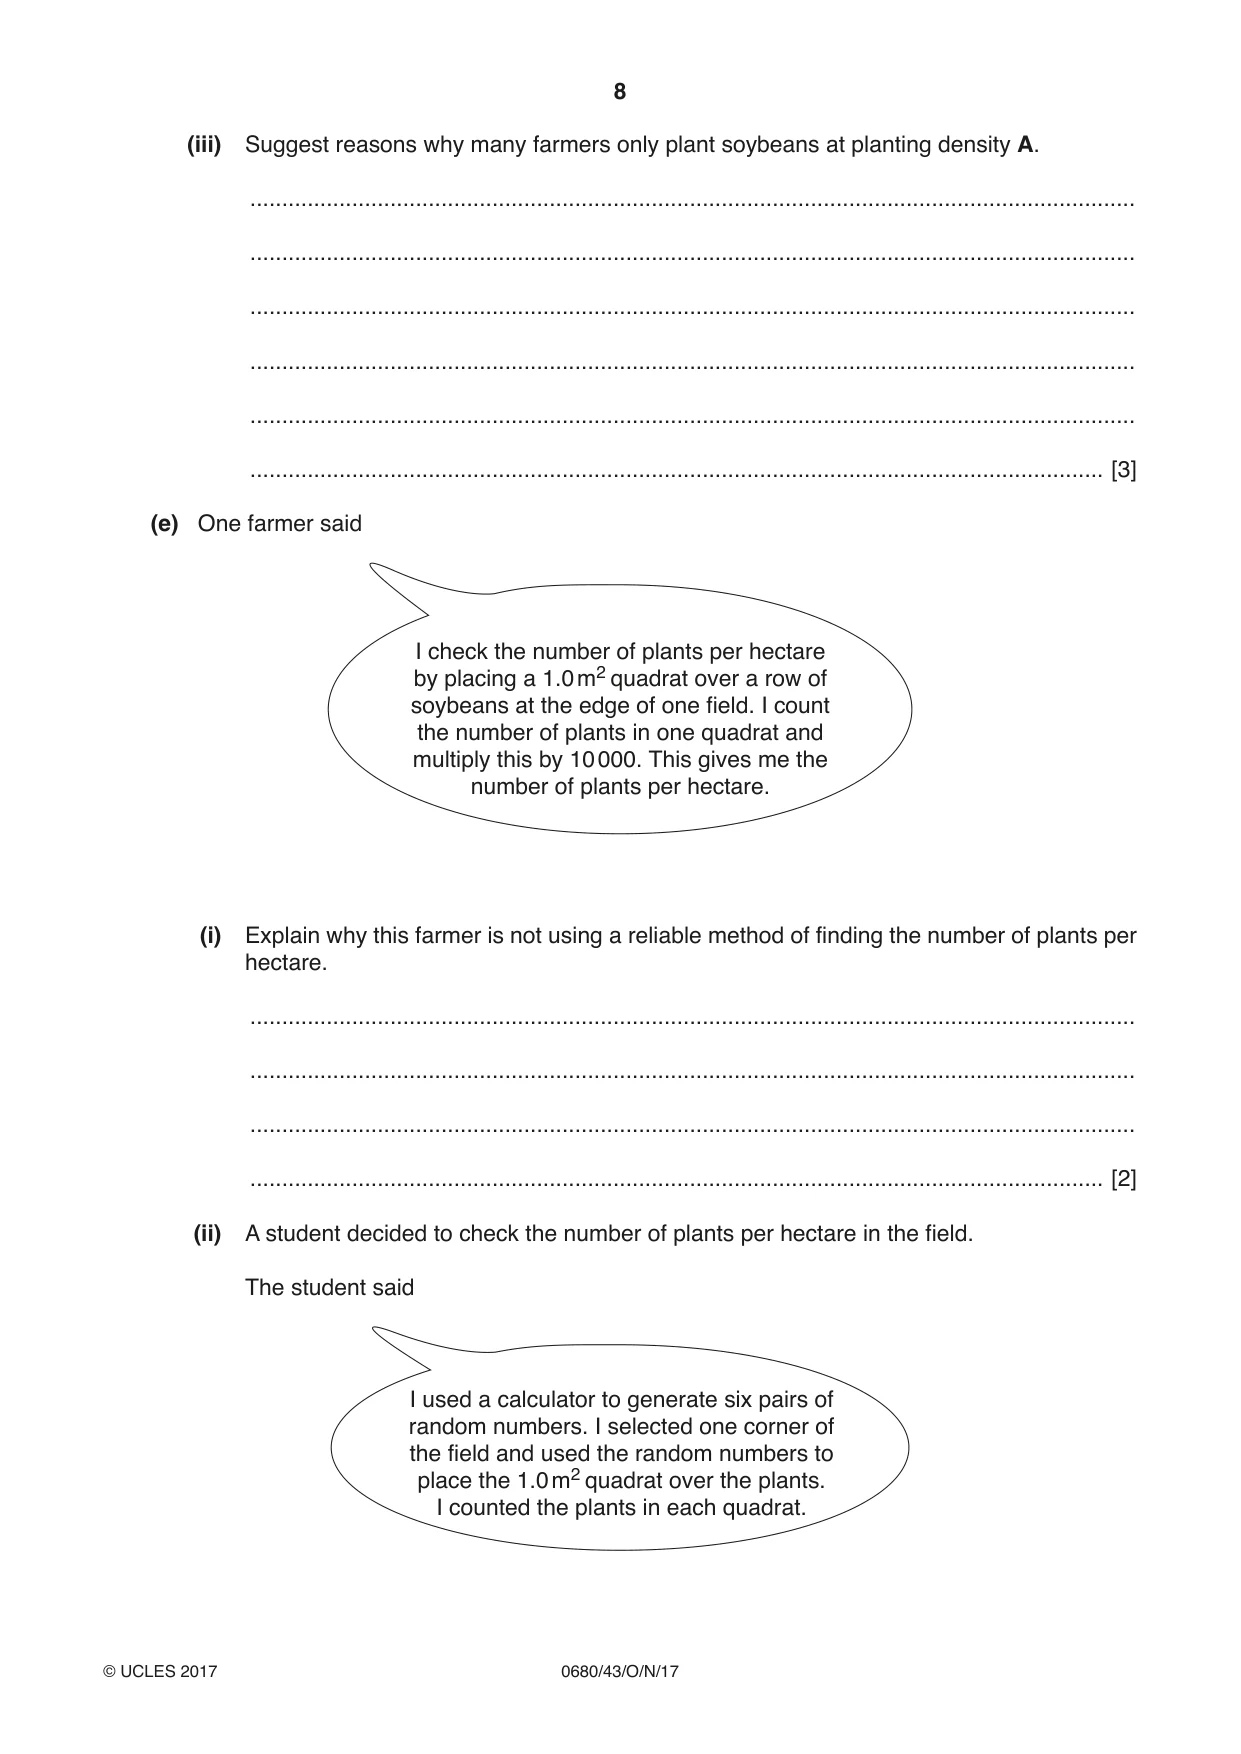
8 0680/43/O/N/17 © UCLES 2017 (iii) Suggest reasons why many farmers only plant soybeans at planting density A. … … … … … … [3] (e) One farmer said I check the number of plants per hectare by placing a 1.0 m2 quadrat over a row of soybeans at the edge of one field. I count the number of plants in one quadrat and multiply this by 10 000. This gives me the number of plants per hectare. (i) Explain why this farmer is not using a reliable method of finding the number of plants per hectare. … … … … [2] (ii) A student decided to check the number of plants per hectare in the field. The student said I used a calculator to generate six pairs of random numbers. I selected one corner of the field and used the random numbers to place the 1.0 m2 quadrat over the plants. I counted the plants in each quadrat.
Question paper, page 9
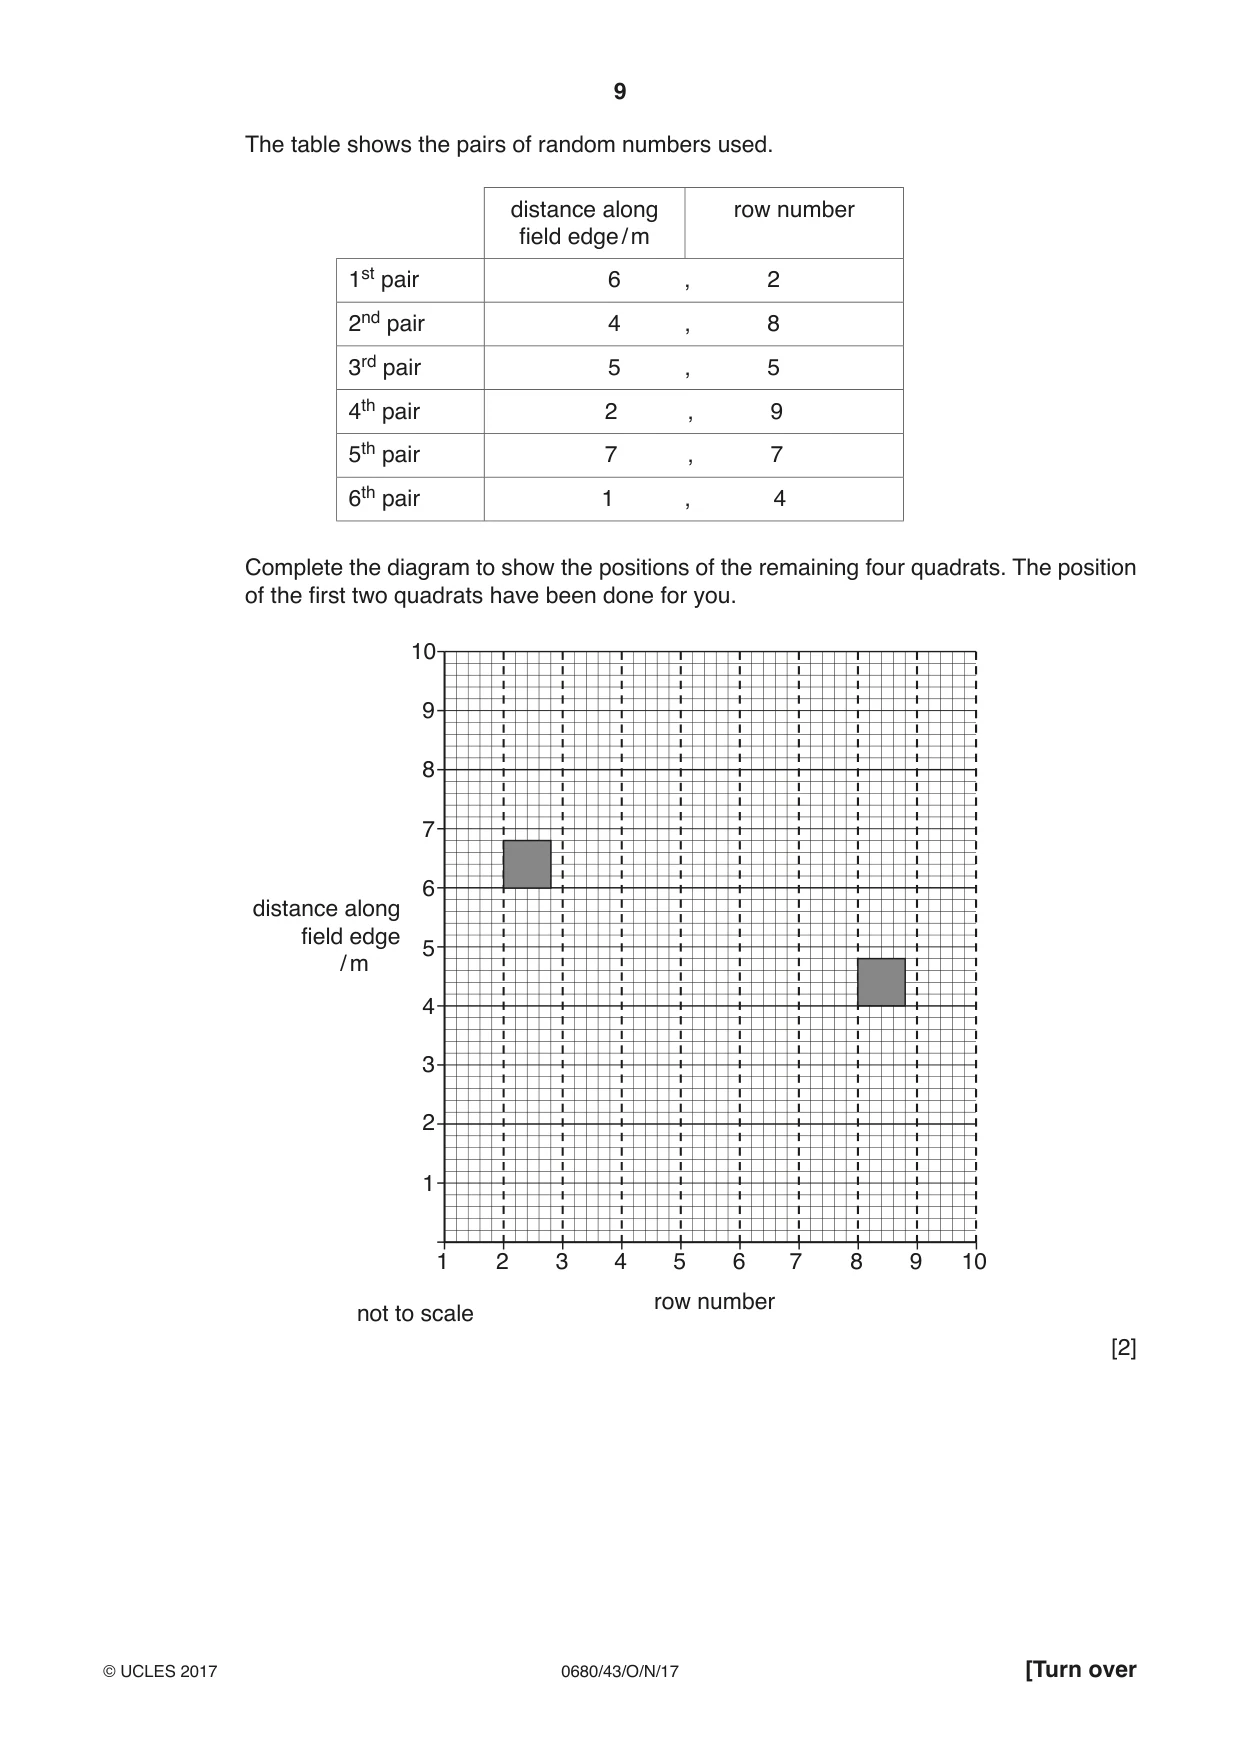
9 0680/43/O/N/17 © UCLES 2017 [Turn over The table shows the pairs of random numbers used. distance along field edge / m row number 1st pair 6 , 2 2nd pair 4 , 8 3rd pair 5 , 5 4th pair 2 , 9 5th pair 7 , 7 6th pair 1 , 4 Complete the diagram to show the positions of the remaining four quadrats. The position of the first two quadrats have been done for you. 1 1 2 3 4 5 6 7 8 9 10 2 3 4 5 6 7 8 9 10 distance along field edge / m row number not to scale [2]
Question paper, page 10
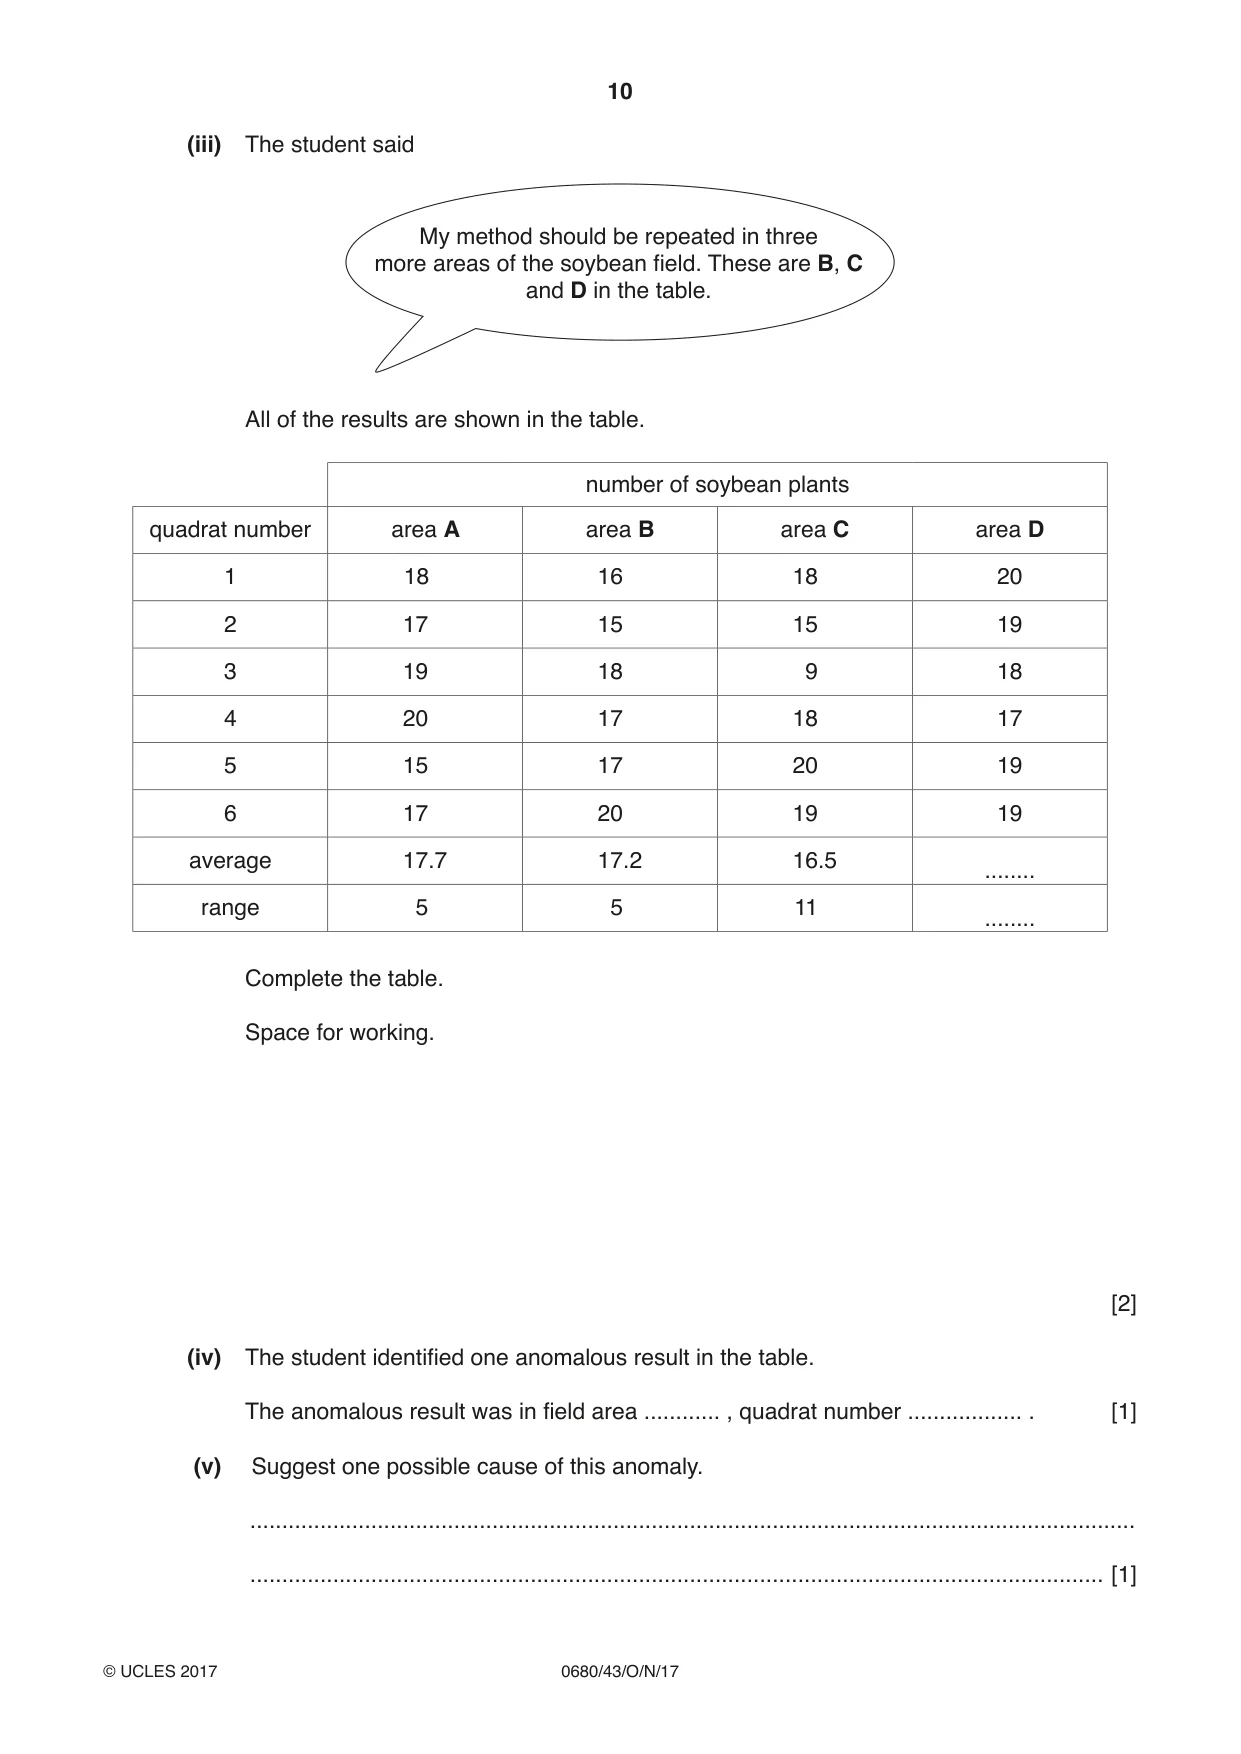
10 0680/43/O/N/17 © UCLES 2017 (iii) The student said My method should be repeated in three more areas of the soybean field. These are B, C and D in the table. All of the results are shown in the table. number of soybean plants quadrat number area A area B area C area D 1 18 16 18 20 2 17 15 15 19 3 19 18 9 18 4 20 17 18 17 5 15 17 20 19 6 17 20 19 19 average 17.7 17.2 16.5 … range 5 5 11 … Complete the table. Space for working. [2] (iv) The student identified one anomalous result in the table. The anomalous result was in field area … , quadrat number … . [1] (v) Suggest one possible cause of this anomaly. … … [1]
Question paper, page 11
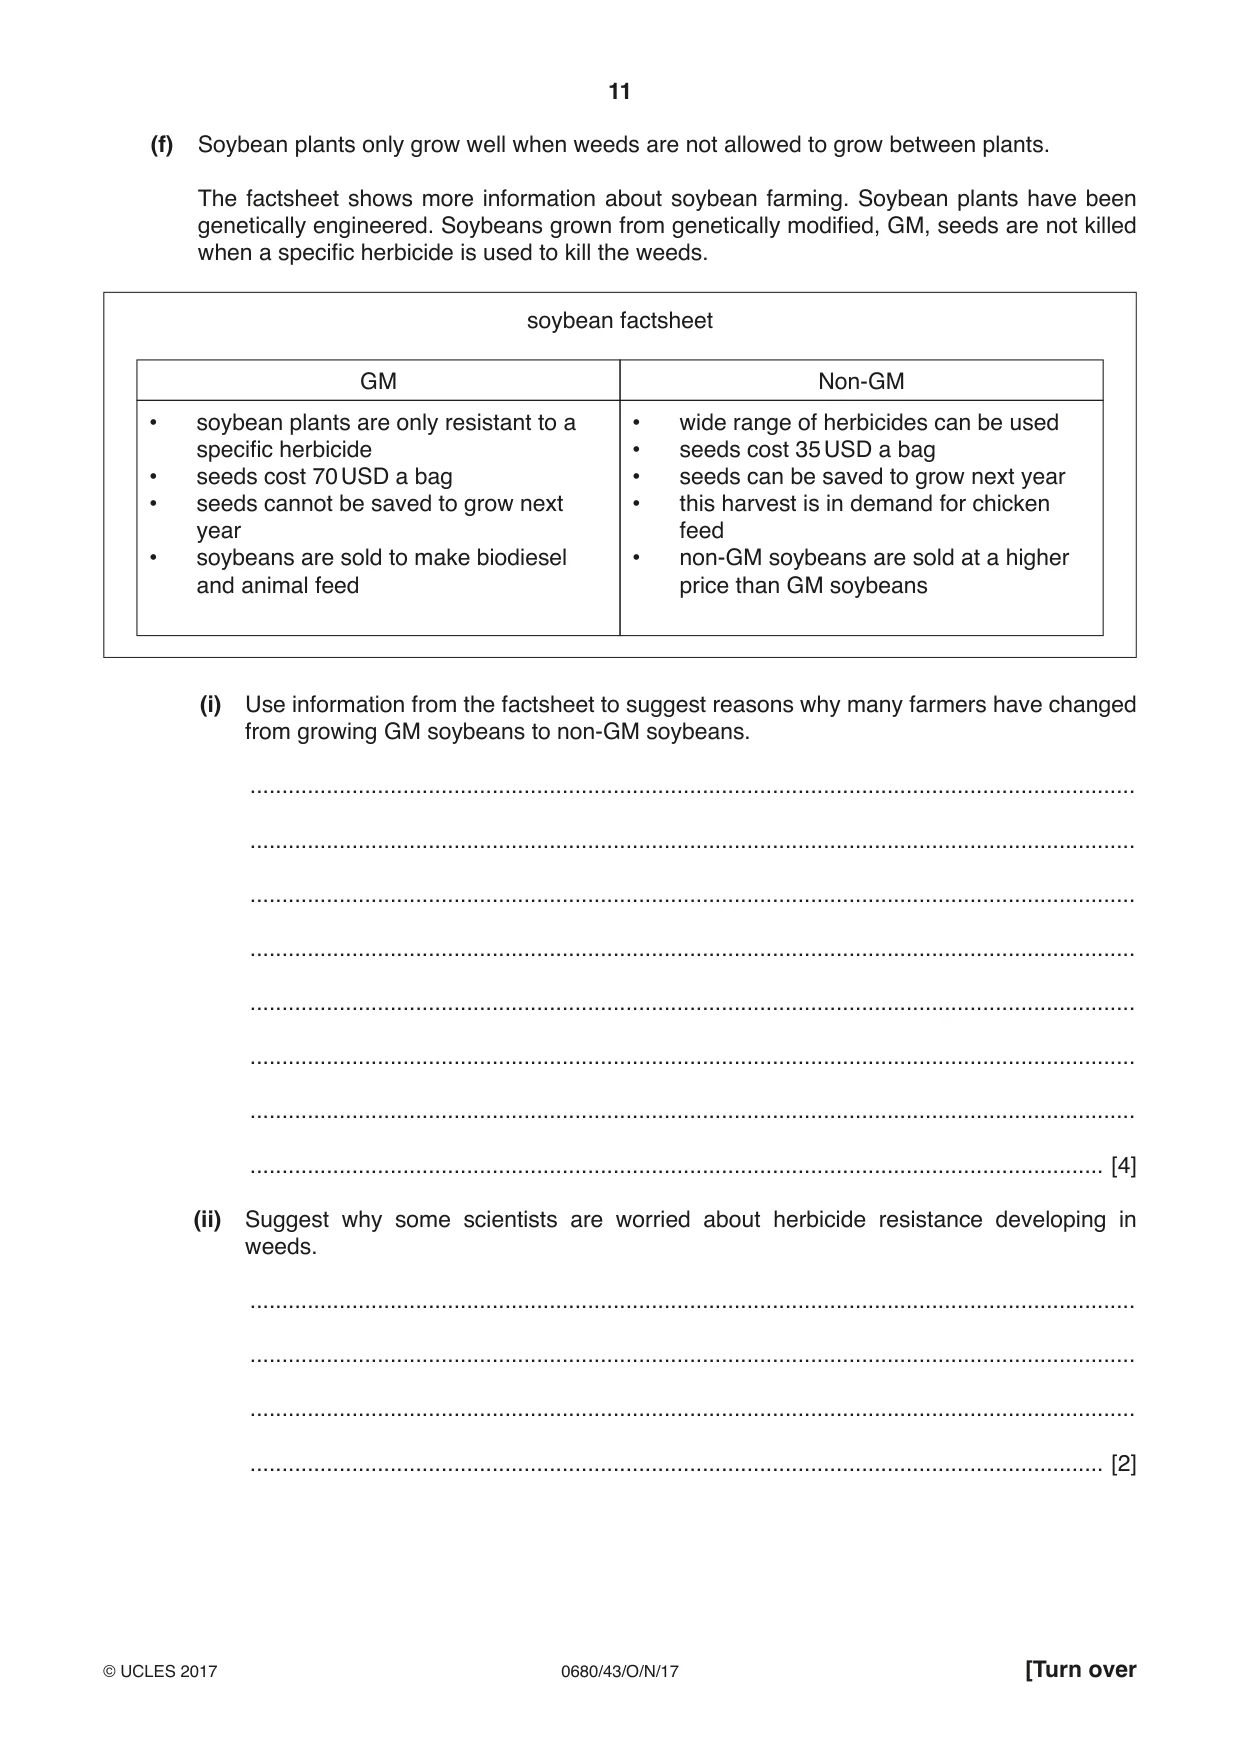
11 0680/43/O/N/17 © UCLES 2017 [Turn over (f) Soybean plants only grow well when weeds are not allowed to grow between plants. The factsheet shows more information about soybean farming. Soybean plants have been genetically engineered. Soybeans grown from genetically modified, GM, seeds are not killed when a specific herbicide is used to kill the weeds. soybean factsheet • soybean plants are only resistant to a specific herbicide • seeds cost 70 USD a bag • seeds cannot be saved to grow next year • soybeans are sold to make biodiesel and animal feed • wide range of herbicides can be used • seeds cost 35 USD a bag • seeds can be saved to grow next year • this harvest is in demand for chicken feed • non-GM soybeans are sold at a higher price than GM soybeans GM Non-GM (i) Use information from the factsheet to suggest reasons why many farmers have changed from growing GM soybeans to non-GM soybeans. … … … … … … … … [4] (ii) Suggest why some scientists are worried about herbicide resistance developing in weeds. … … … … [2]
Question paper, page 12
12 0680/43/O/N/17 © UCLES 2017 (g) Oil can be extracted from soybeans to make biodiesel. The use of biodiesel is encouraged in Tennessee. Diesel engines can burn diesel or biodiesel. (i) Suggest two problems with burning diesel in vehicles. 1 … … 2 … … [2] (ii) Explain why burning biodiesel is thought to be less harmful to the environment than burning diesel. … … … … [2]
Question paper, page 13
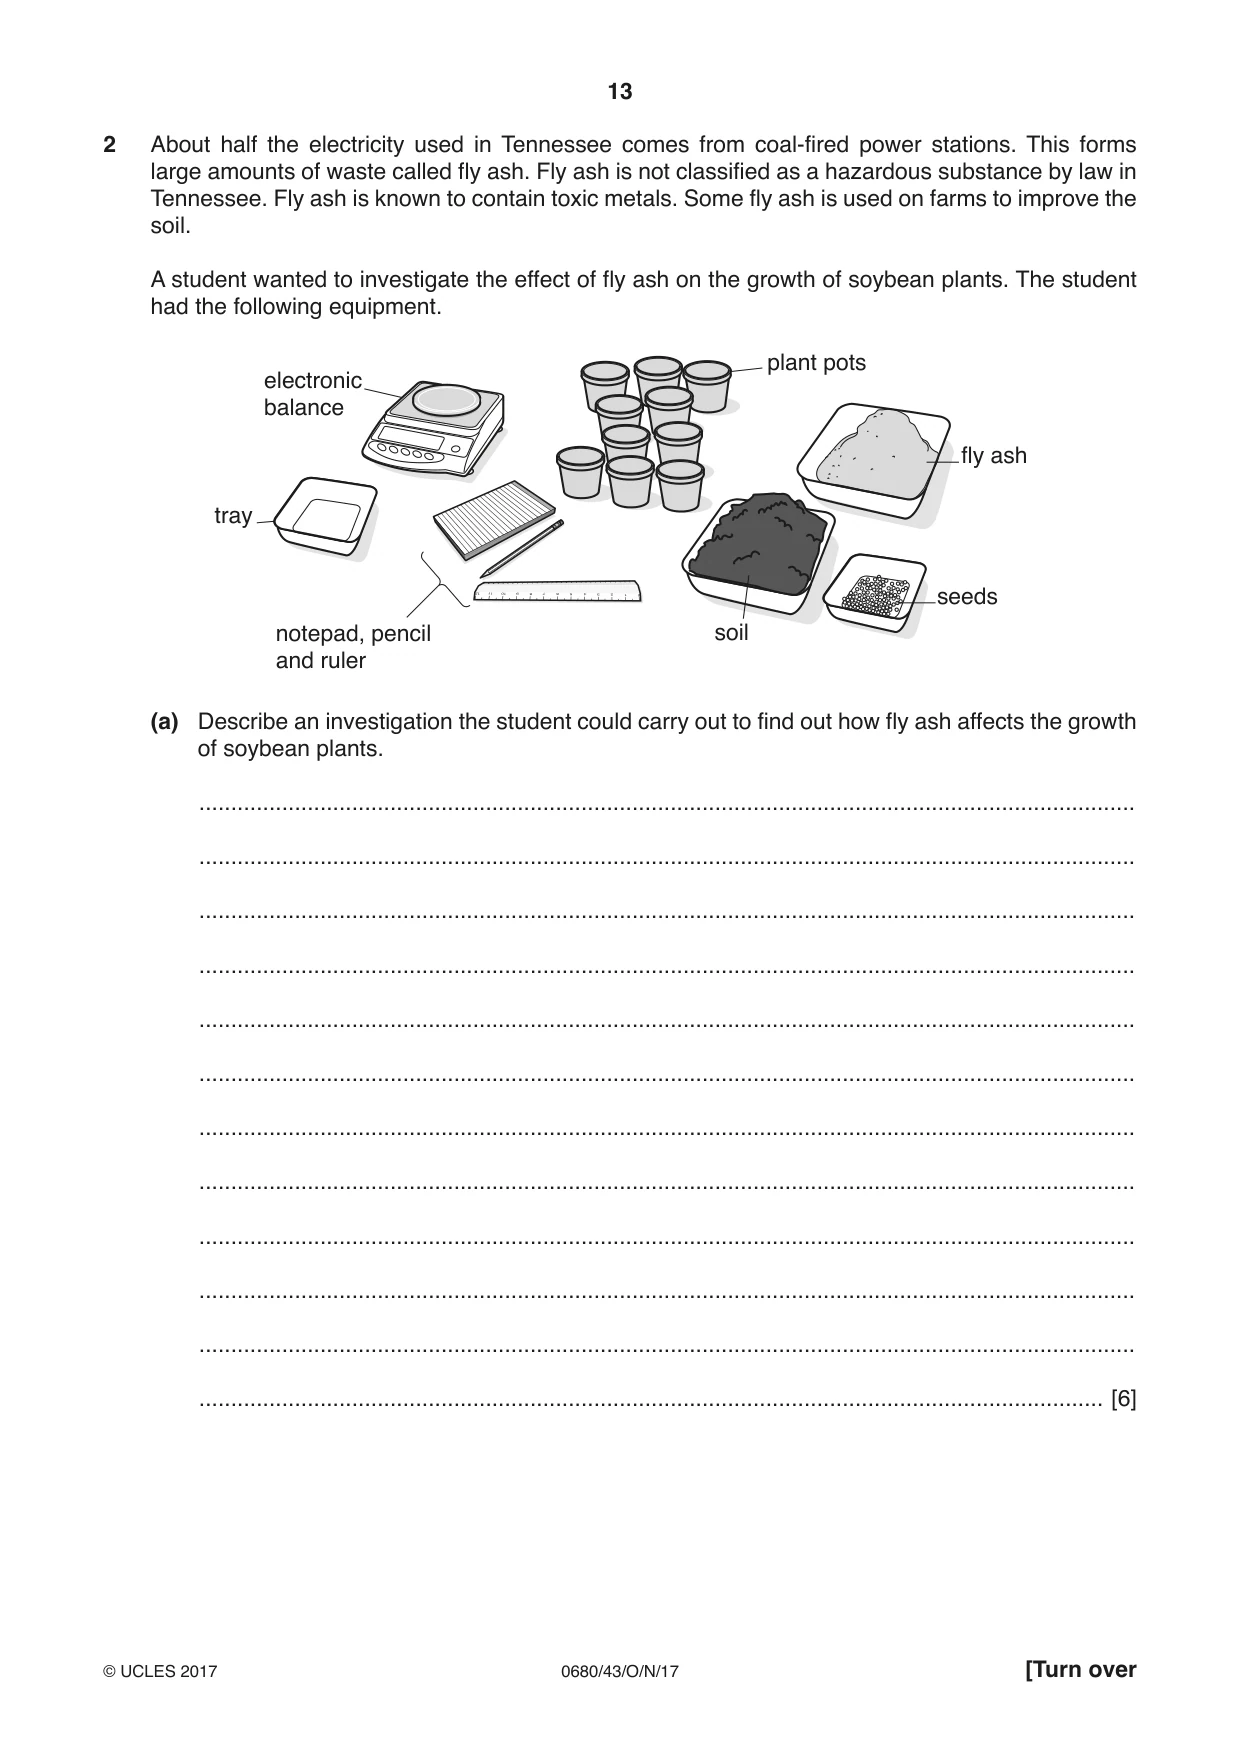
13 0680/43/O/N/17 © UCLES 2017 [Turn over 2 About half the electricity used in Tennessee comes from coal-fired power stations. This forms large amounts of waste called fly ash. Fly ash is not classified as a hazardous substance by law in Tennessee. Fly ash is known to contain toxic metals. Some fly ash is used on farms to improve the soil. A student wanted to investigate the effect of fly ash on the growth of soybean plants. The student had the following equipment. electronic balance plant pots fly ash seeds soil notepad, pencil and ruler tray (a) Describe an investigation the student could carry out to find out how fly ash affects the growth of soybean plants. … … … … … … … … … … … … [6]
Question paper, page 14
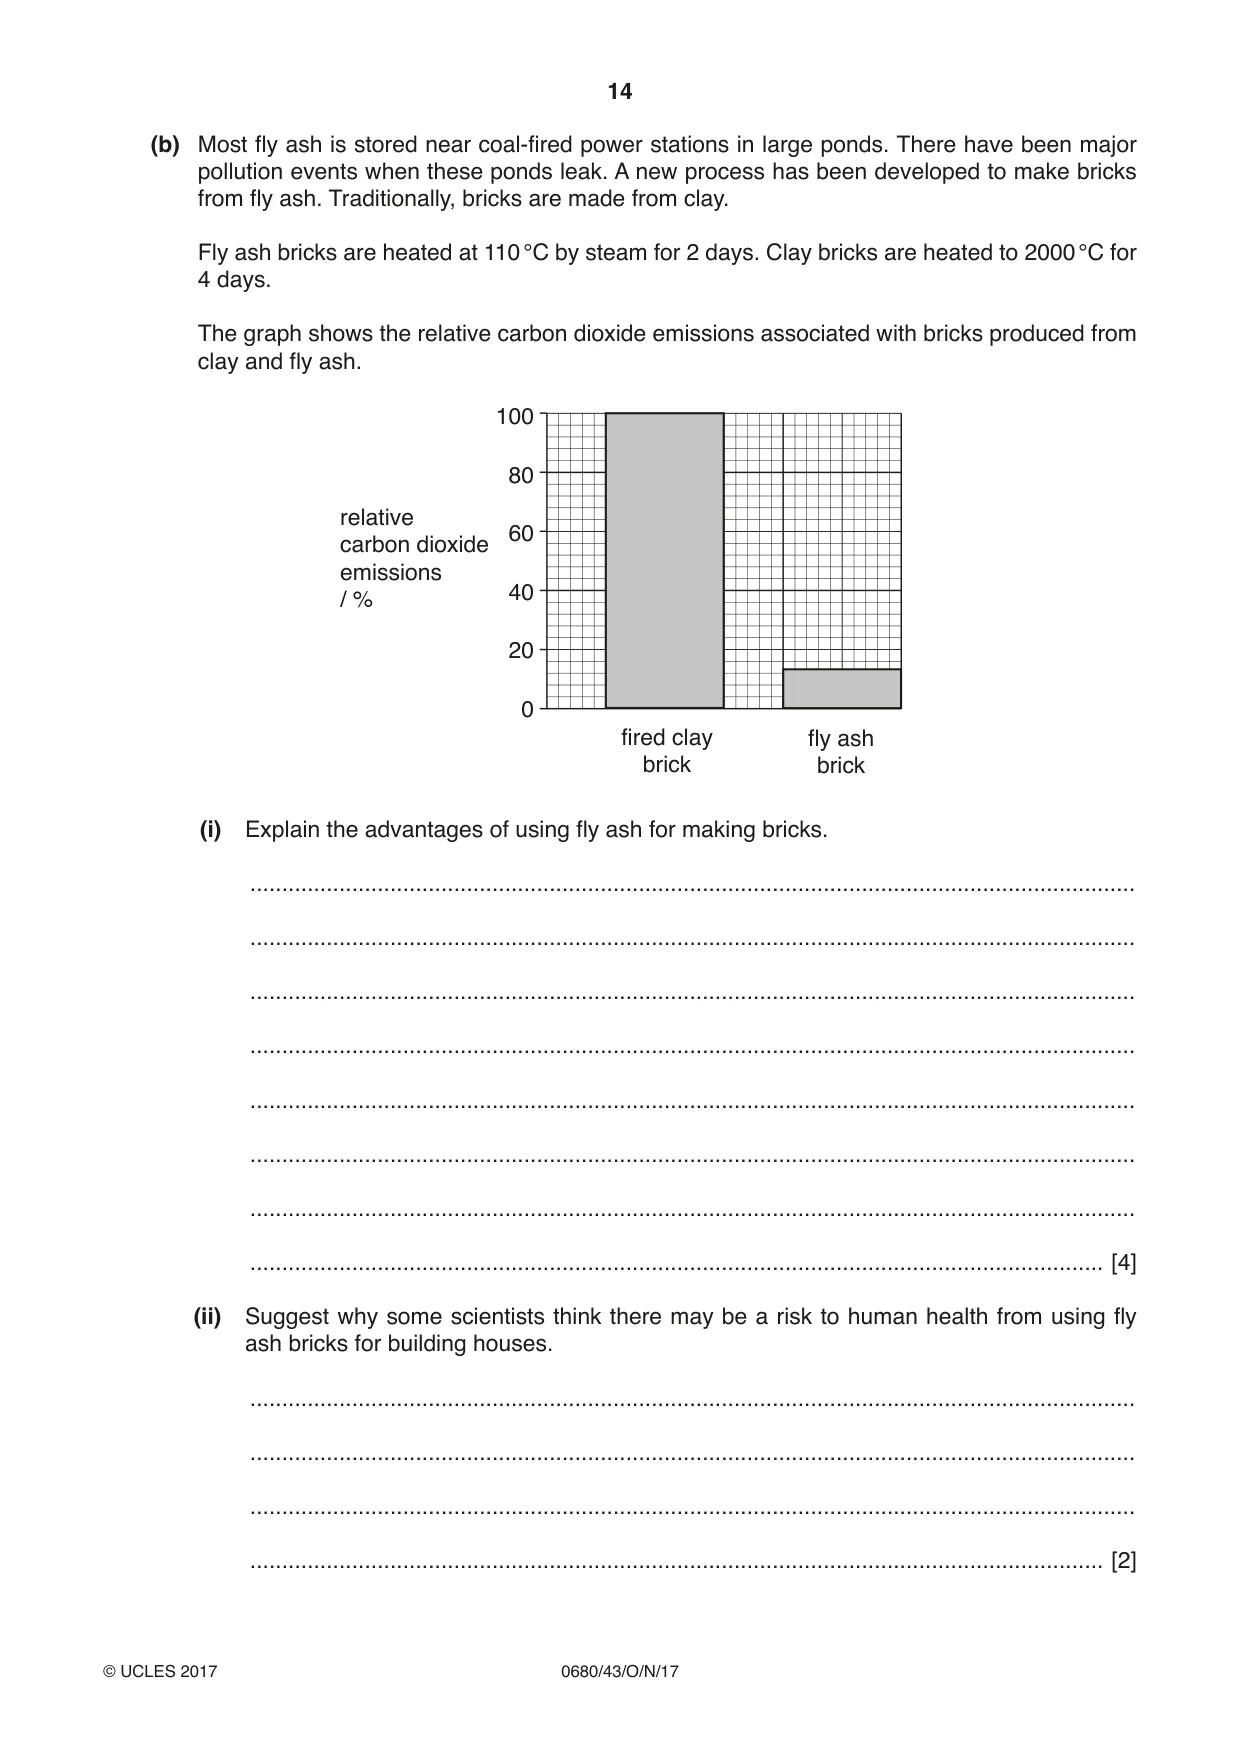
14 0680/43/O/N/17 © UCLES 2017 (b) Most fly ash is stored near coal-fired power stations in large ponds. There have been major pollution events when these ponds leak. A new process has been developed to make bricks from fly ash. Traditionally, bricks are made from clay. Fly ash bricks are heated at 110 °C by steam for 2 days. Clay bricks are heated to 2000 °C for 4 days. The graph shows the relative carbon dioxide emissions associated with bricks produced from clay and fly ash. fired clay brick fly ash brick 0 20 40 60 80 100 relative carbon dioxide emissions / % (i) Explain the advantages of using fly ash for making bricks. … … … … … … … … [4] (ii) Suggest why some scientists think there may be a risk to human health from using fly ash bricks for building houses. … … … … [2]
Question paper, page 15
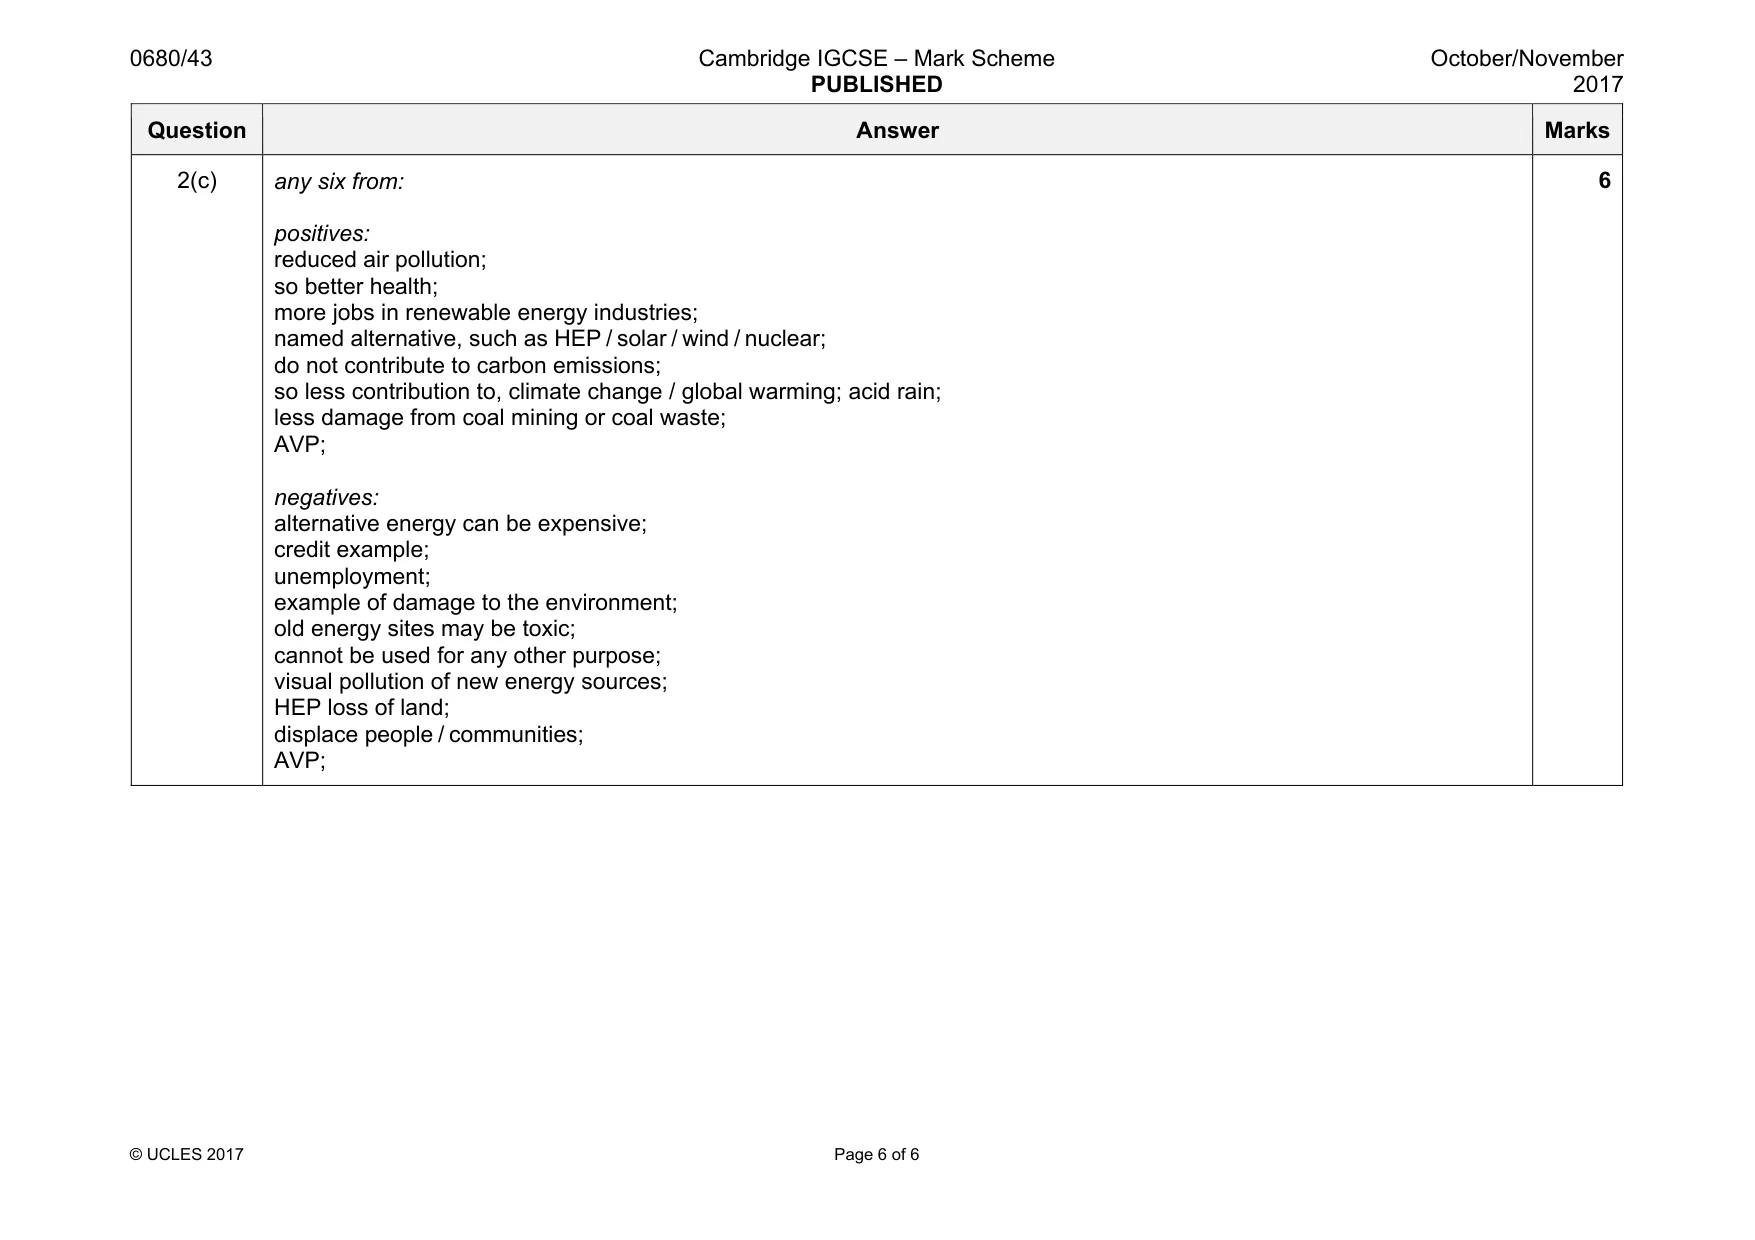
15 0680/43/O/N/17 © UCLES 2017 (c) The Tennessee Valley Authority are investing in new methods of generating electricity and are closing down old coal-fired power stations. Describe the effects of this strategy on the people and environment. … … … … … … … … … … … … [6]
Question paper, page 16
16 0680/43/O/N/17 © UCLES 2017 Permission to reproduce items where third-party owned material protected by copyright is included has been sought and cleared where possible. Every reasonable effort has been made by the publisher (UCLES) to trace copyright holders, but if any items requiring clearance have unwittingly been included, the publisher will be pleased to make amends at the earliest possible opportunity. To avoid the issue of disclosure of answer-related information to candidates, all copyright acknowledgements are reproduced online in the Cambridge International Examinations Copyright Acknowledgements Booklet. This is produced for each series of examinations and is freely available to download at www.cie.org.uk after the live examination series. Cambridge International Examinations is part of the Cambridge Assessment Group. Cambridge Assessment is the brand name of University of Cambridge Local Examinations Syndicate (UCLES), which is itself a department of the University of Cambridge. BLANK PAGE
Mark scheme, page 1
® IGCSE is a registered trademark. This document consists of 6 printed pages. © UCLES 2017 [Turn over Cambridge Assessment International Education Cambridge International General Certificate of Secondary Education ENVIRONMENTAL MANAGEMENT 0680/43 Paper 4 October/November 2017 MARK SCHEME Maximum Mark: 60 Published This mark scheme is published as an aid to teachers and candidates, to indicate the requirements of the examination. It shows the basis on which Examiners were instructed to award marks. It does not indicate the details of the discussions that took place at an Examiners’ meeting before marking began, which would have considered the acceptability of alternative answers. Mark schemes should be read in conjunction with the question paper and the Principal Examiner Report for Teachers. Cambridge International will not enter into discussions about these mark schemes. Cambridge International is publishing the mark schemes for the October/November 2017 series for most Cambridge IGCSE®, Cambridge International A and AS Level components and some Cambridge O Level components.
Mark scheme, page 2
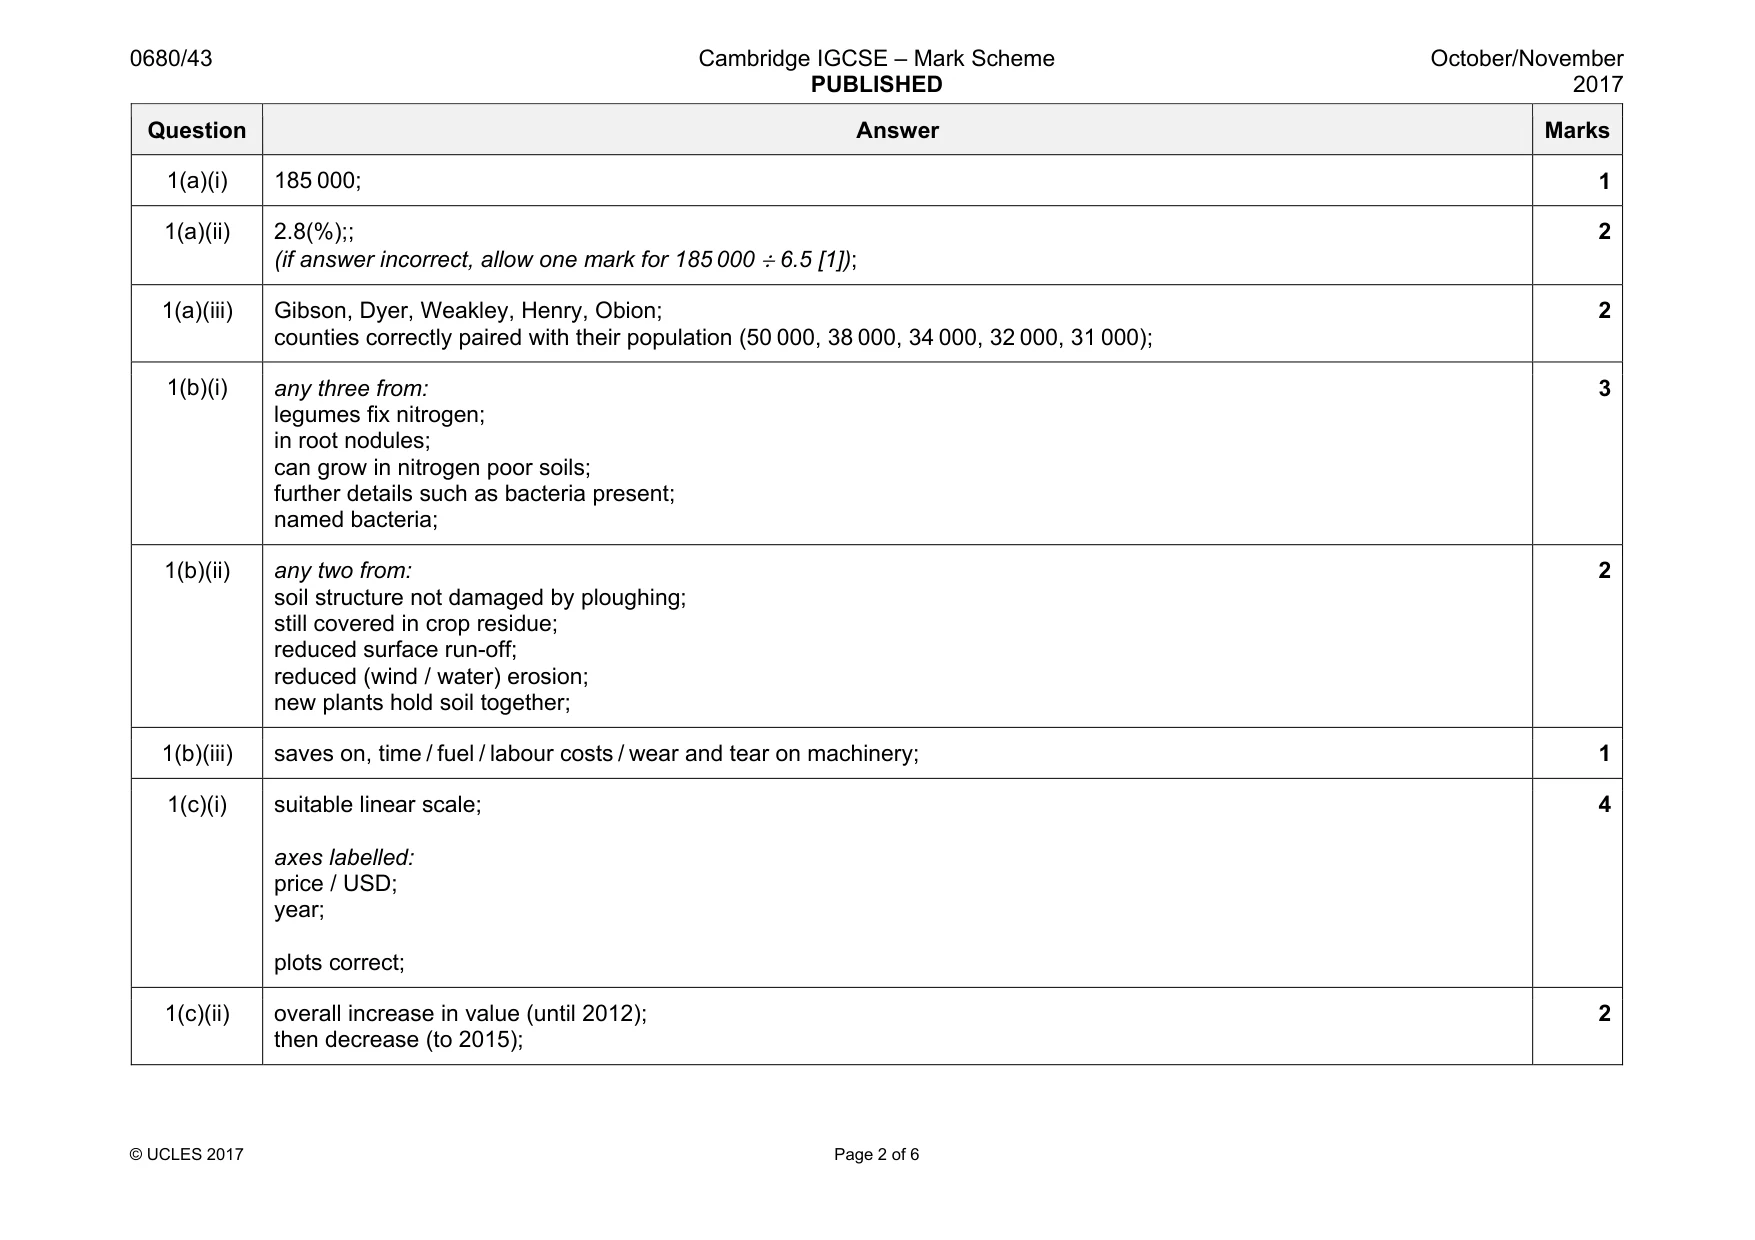
0680/43 Cambridge IGCSE – Mark Scheme PUBLISHED October/November 2017 © UCLES 2017 Page 2 of 6 Question Answer Marks 1(a)(i) 185 000; 1 1(a)(ii) 2.8(%);; (if answer incorrect, allow one mark for 185 000 ÷ 6.5 [1]); 2 1(a)(iii) Gibson, Dyer, Weakley, Henry, Obion; counties correctly paired with their population (50 000, 38 000, 34 000, 32 000, 31 000); 2 1(b)(i) any three from: legumes fix nitrogen; in root nodules; can grow in nitrogen poor soils; further details such as bacteria present; named bacteria; 3 1(b)(ii) any two from: soil structure not damaged by ploughing; still covered in crop residue; reduced surface run-off; reduced (wind / water) erosion; new plants hold soil together; 2 1(b)(iii) saves on, time / fuel / labour costs / wear and tear on machinery; 1 1(c)(i) suitable linear scale; axes labelled: price / USD; year; plots correct; 4 1(c)(ii) overall increase in value (until 2012); then decrease (to 2015); 2
Mark scheme, page 3
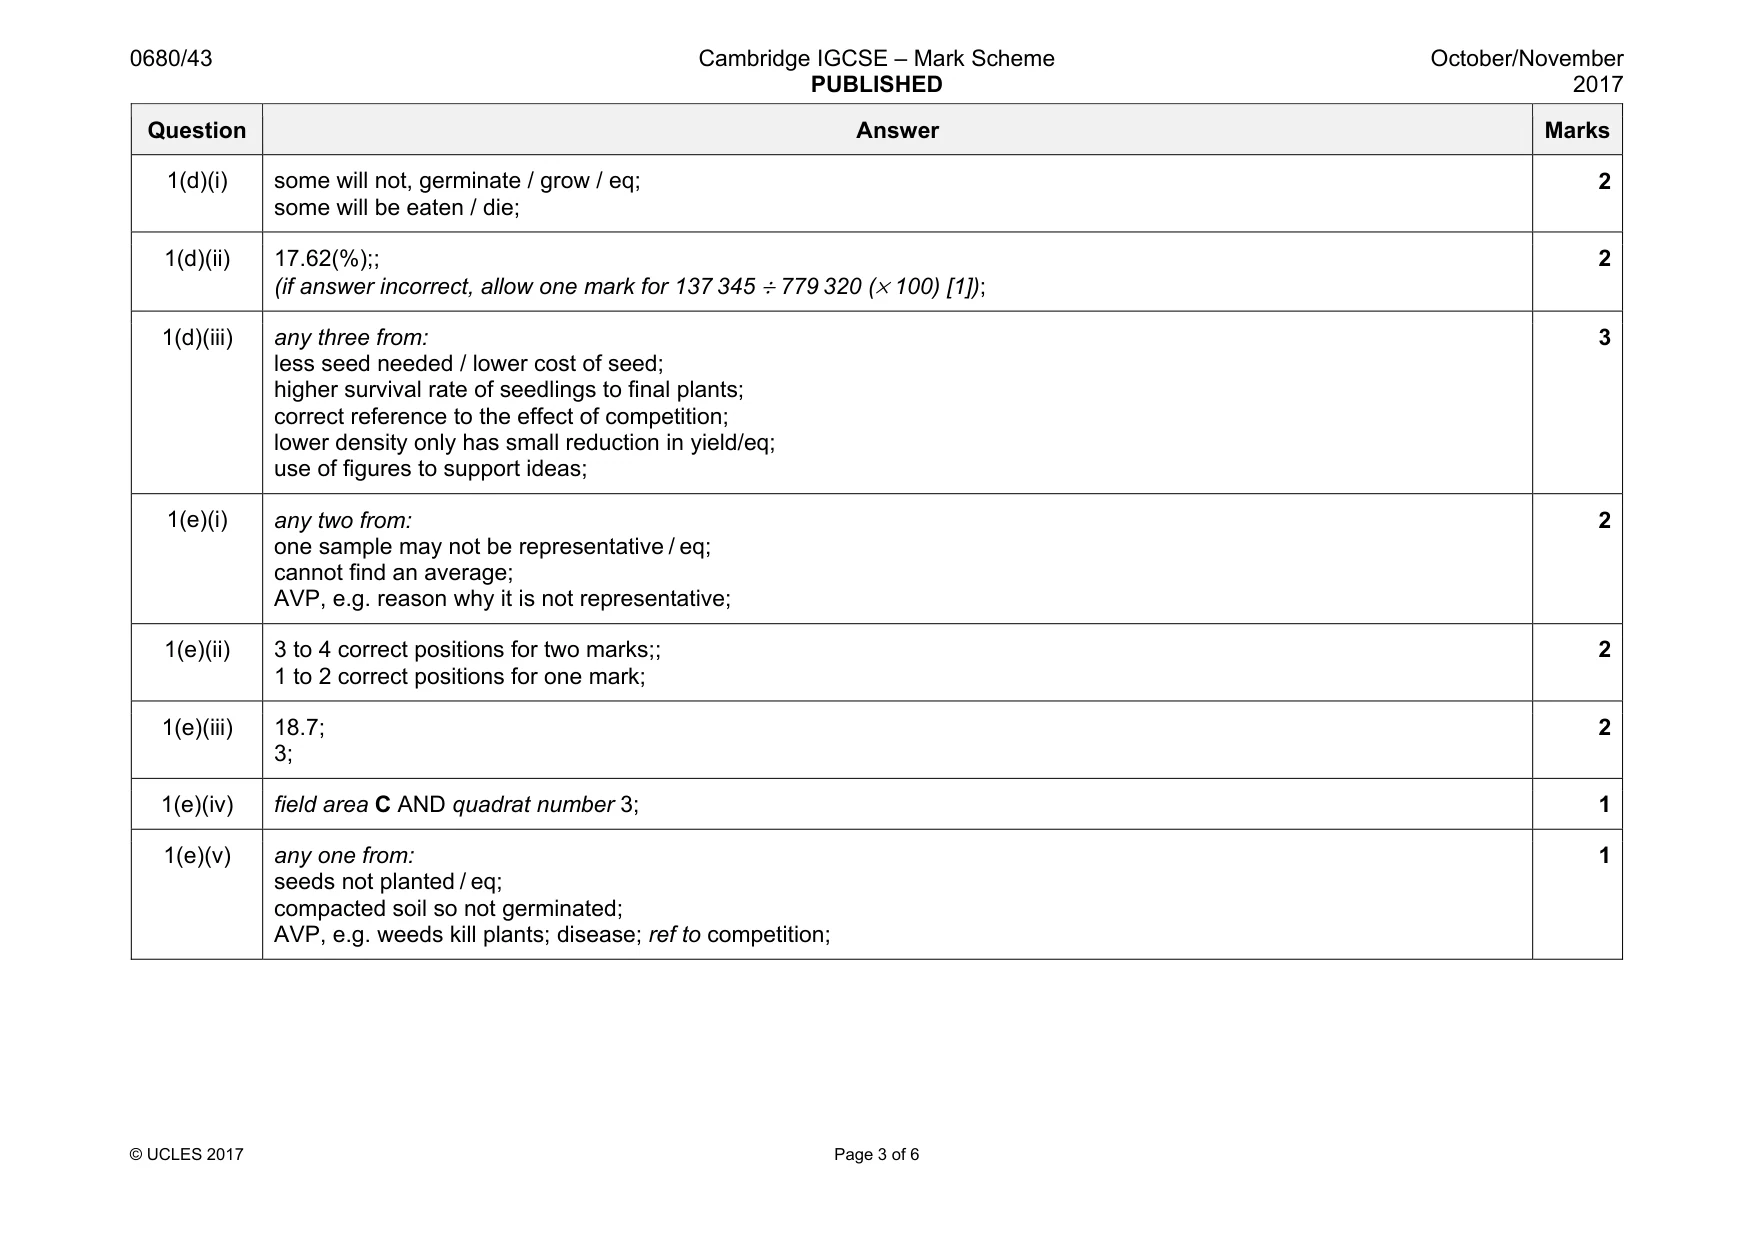
0680/43 Cambridge IGCSE – Mark Scheme PUBLISHED October/November 2017 © UCLES 2017 Page 3 of 6 Question Answer Marks 1(d)(i) some will not, germinate / grow / eq; some will be eaten / die; 2 1(d)(ii) 17.62(%);; (if answer incorrect, allow one mark for 137 345 ÷ 779 320 (× 100) [1]); 2 1(d)(iii) any three from: less seed needed / lower cost of seed; higher survival rate of seedlings to final plants; correct reference to the effect of competition; lower density only has small reduction in yield/eq; use of figures to support ideas; 3 1(e)(i) any two from: one sample may not be representative / eq; cannot find an average; AVP, e.g. reason why it is not representative; 2 1(e)(ii) 3 to 4 correct positions for two marks;; 1 to 2 correct positions for one mark; 2 1(e)(iii) 18.7; 3; 2 1(e)(iv) field area C AND quadrat number 3; 1 1(e)(v) any one from: seeds not planted / eq; compacted soil so not germinated; AVP, e.g. weeds kill plants; disease; ref to competition; 1
Mark scheme, page 4
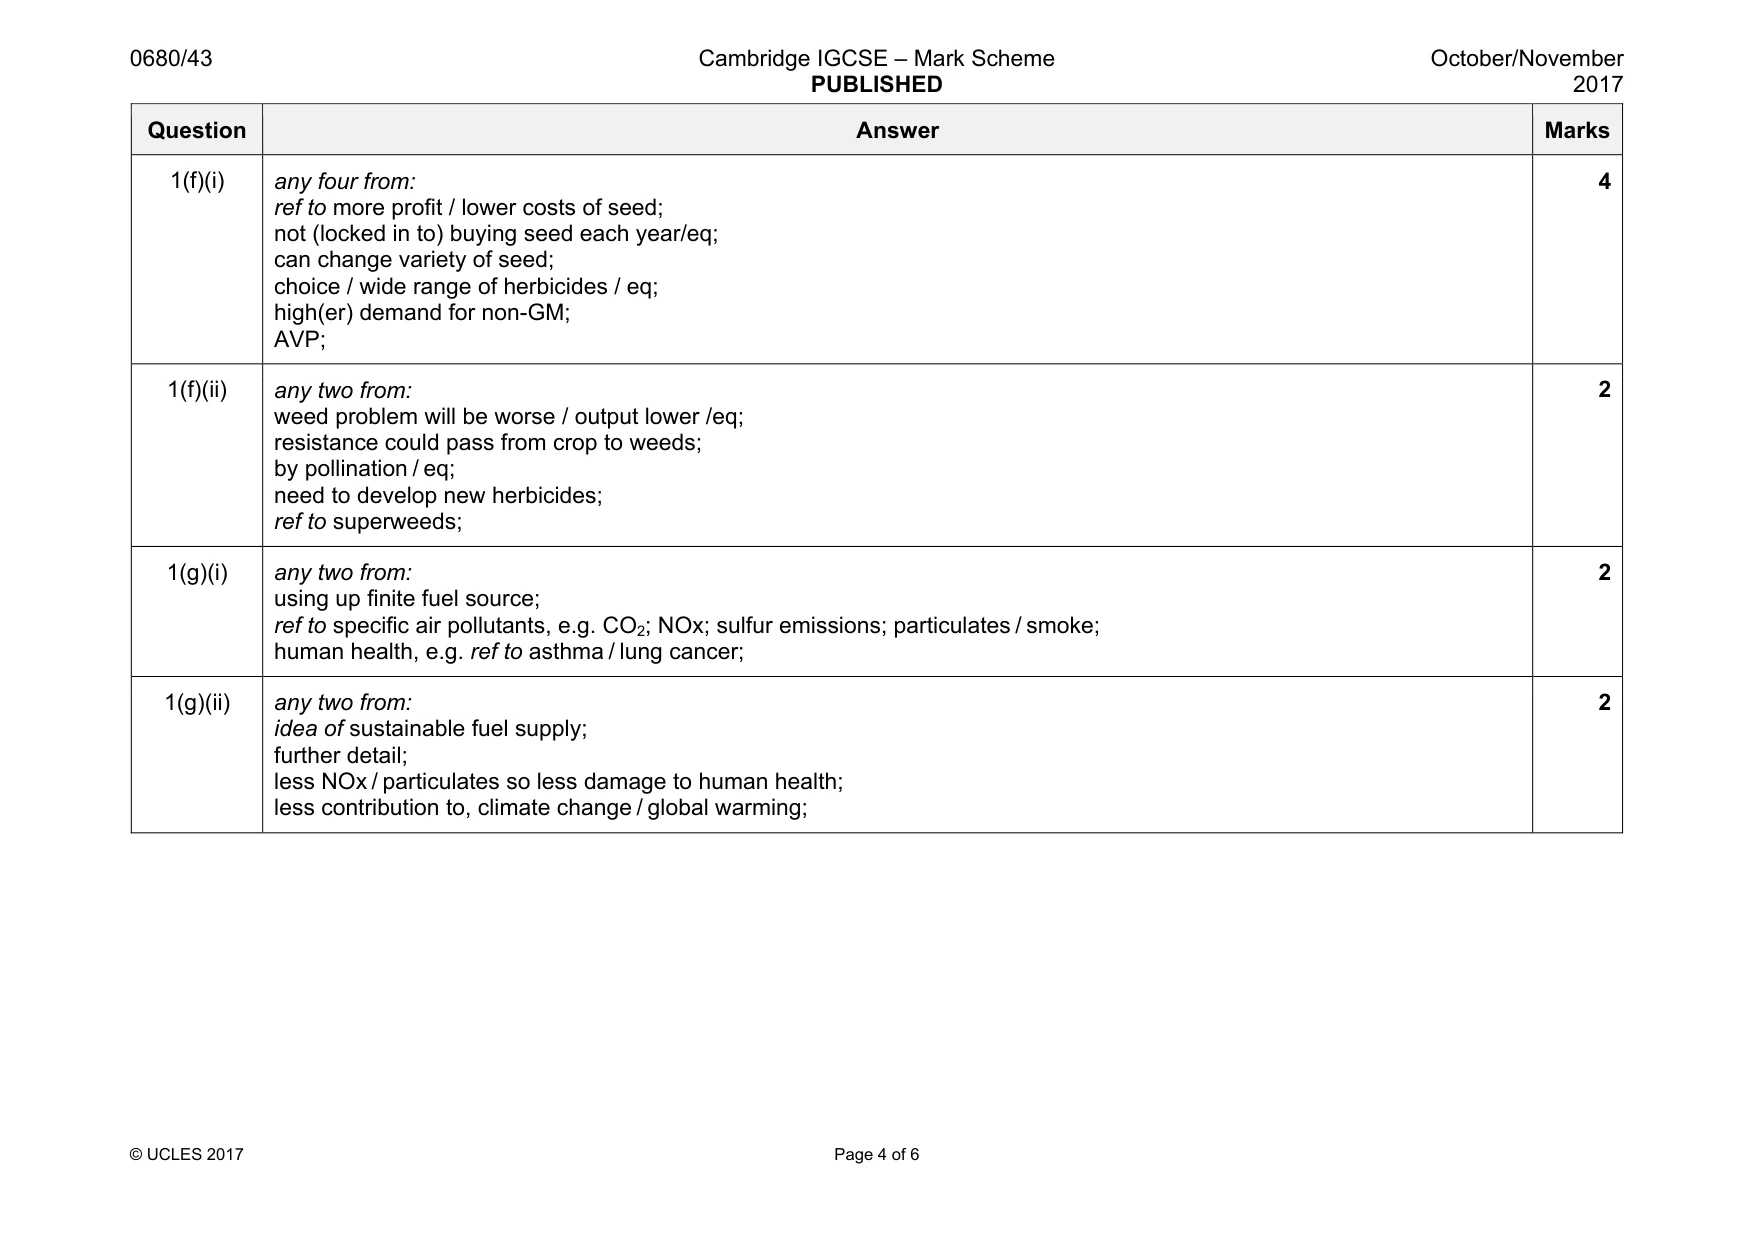
0680/43 Cambridge IGCSE – Mark Scheme PUBLISHED October/November 2017 © UCLES 2017 Page 4 of 6 Question Answer Marks 1(f)(i) any four from: ref to more profit / lower costs of seed; not (locked in to) buying seed each year/eq; can change variety of seed; choice / wide range of herbicides / eq; high(er) demand for non-GM; AVP; 4 1(f)(ii) any two from: weed problem will be worse / output lower /eq; resistance could pass from crop to weeds; by pollination / eq; need to develop new herbicides; ref to superweeds; 2 1(g)(i) any two from: using up finite fuel source; ref to specific air pollutants, e.g. CO2; NOx; sulfur emissions; particulates / smoke; human health, e.g. ref to asthma / lung cancer; 2 1(g)(ii) any two from: idea of sustainable fuel supply; further detail; less NOx / particulates so less damage to human health; less contribution to, climate change / global warming; 2
Mark scheme, page 5
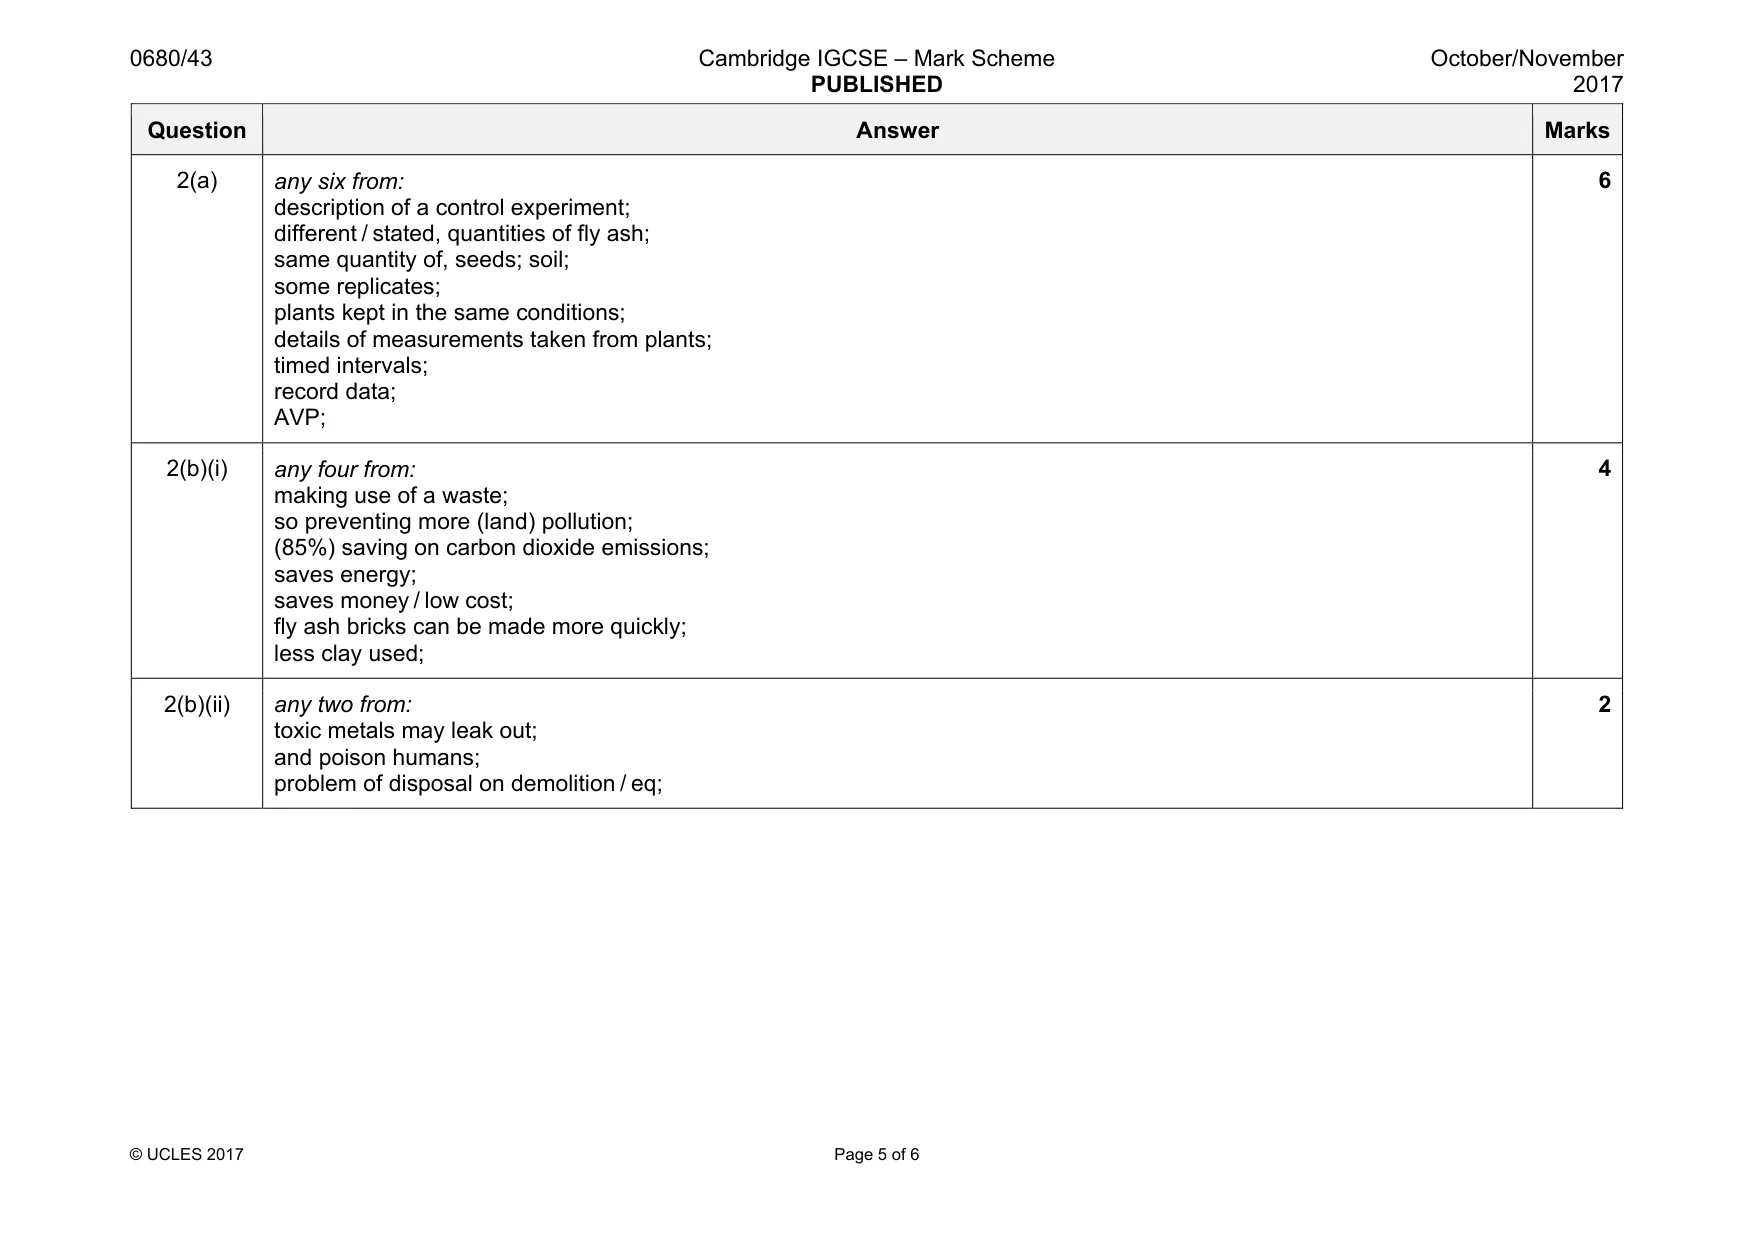
0680/43 Cambridge IGCSE – Mark Scheme PUBLISHED October/November 2017 © UCLES 2017 Page 5 of 6 Question Answer Marks 2(a) any six from: description of a control experiment; different / stated, quantities of fly ash; same quantity of, seeds; soil; some replicates; plants kept in the same conditions; details of measurements taken from plants; timed intervals; record data; AVP; 6 2(b)(i) any four from: making use of a waste; so preventing more (land) pollution; (85%) saving on carbon dioxide emissions; saves energy; saves money / low cost; fly ash bricks can be made more quickly; less clay used; 4 2(b)(ii) any two from: toxic metals may leak out; and poison humans; problem of disposal on demolition / eq; 2
Mark scheme, page 6
0680/43 Cambridge IGCSE – Mark Scheme PUBLISHED October/November 2017 © UCLES 2017 Page 6 of 6 Question Answer Marks 2(c) any six from: positives: reduced air pollution; so better health; more jobs in renewable energy industries; named alternative, such as HEP / solar / wind / nuclear; do not contribute to carbon emissions; so less contribution to, climate change / global warming; acid rain; less damage from coal mining or coal waste; AVP; negatives: alternative energy can be expensive; credit example; unemployment; example of damage to the environment; old energy sites may be toxic; cannot be used for any other purpose; visual pollution of new energy sources; HEP loss of land; displace people / communities; AVP; 6
What you needed in this session
Cambridge’s own grade thresholds for 2017 Oct/Nov, Paper 4 · Variant 3. A higher threshold means an easier paper — the bar moves with how the cohort did.