Cambridge IGCSE Environmental Management 0680 — 2017 Oct/Nov Paper 4 · Variant 2
0680/42/O/N/17 · 2 questions · 60 marks · ≈68 min
The question paper and its mark scheme, free to read here and free to download. This is Cambridge’s own paper, exactly as it was sat.
Question paper16 pages




Mark scheme6 pages
Answers below. Sit the paper first if you are practising.
Questions as text
Q1 · The state of Tennessee has large areas of fertile land
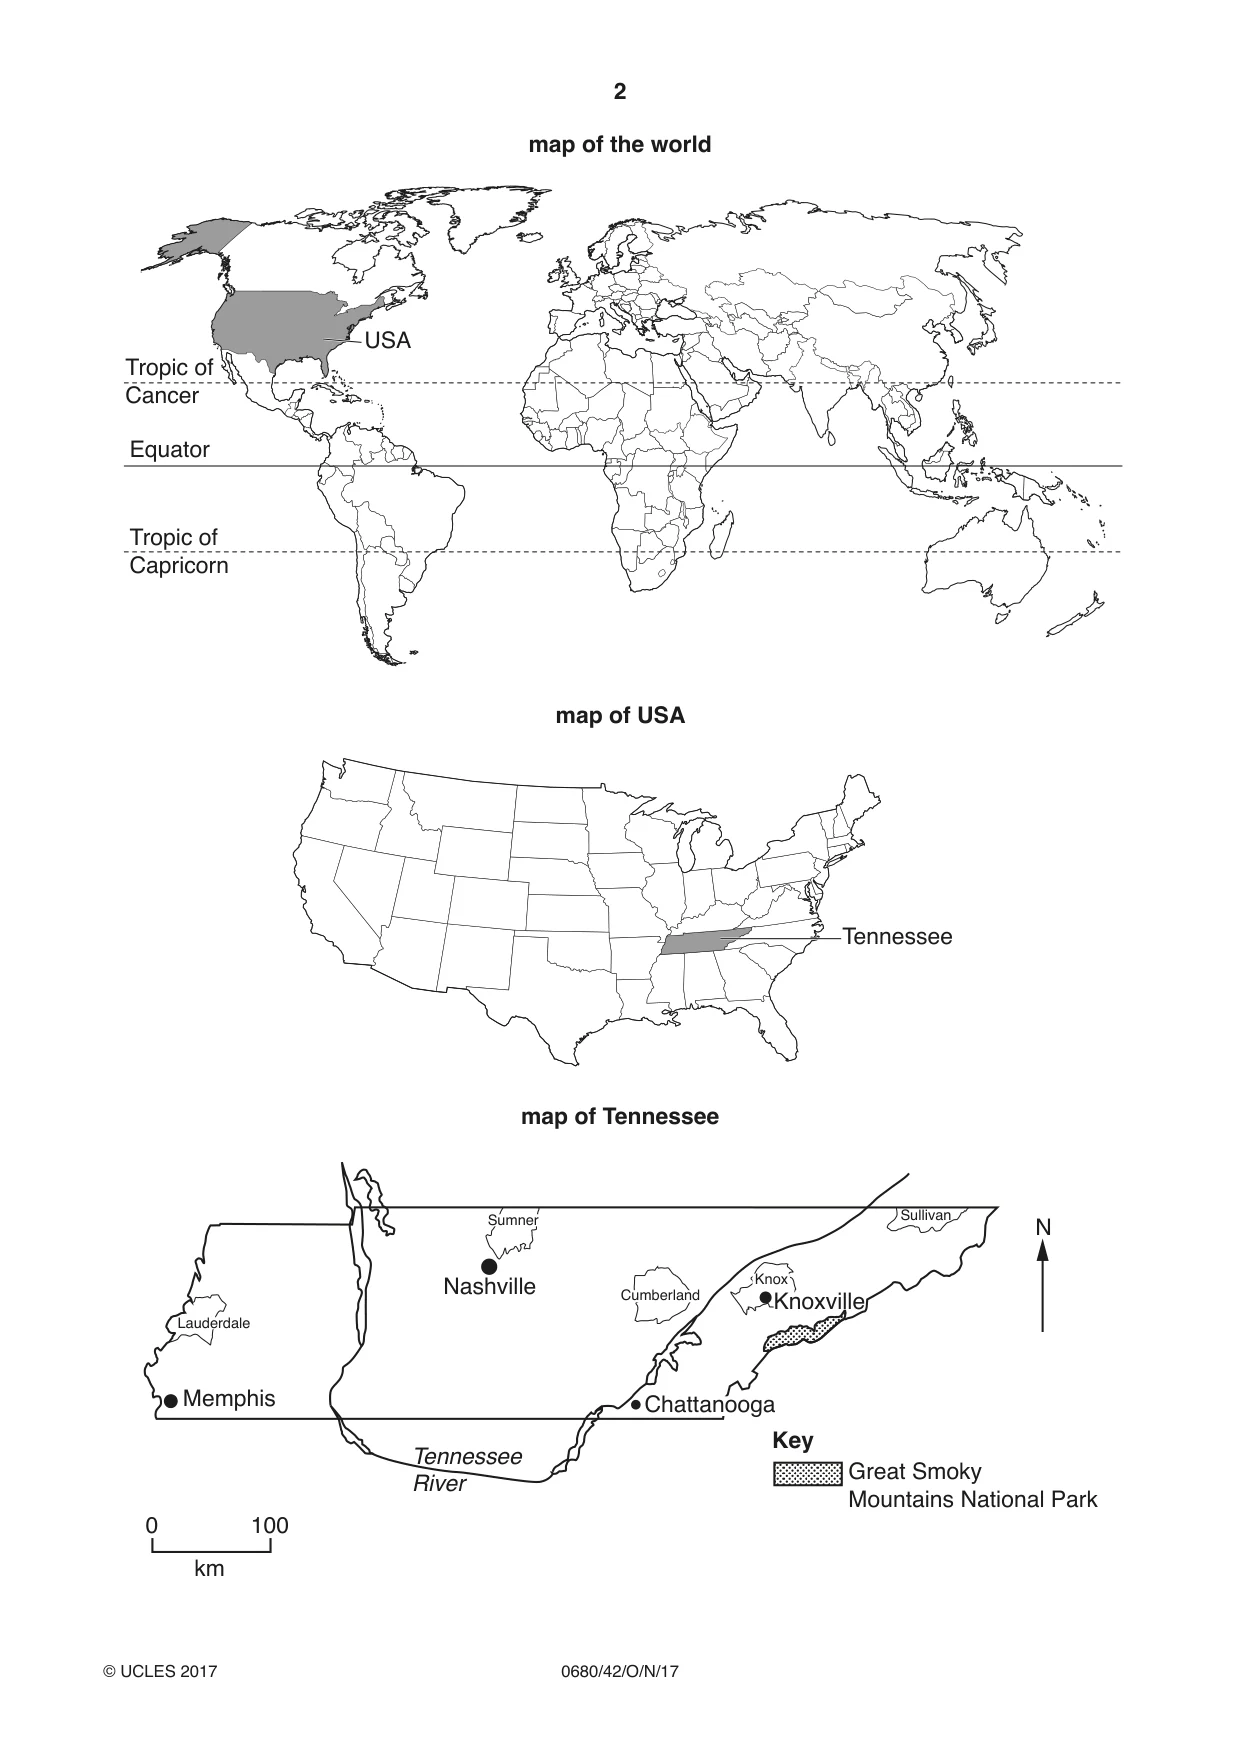
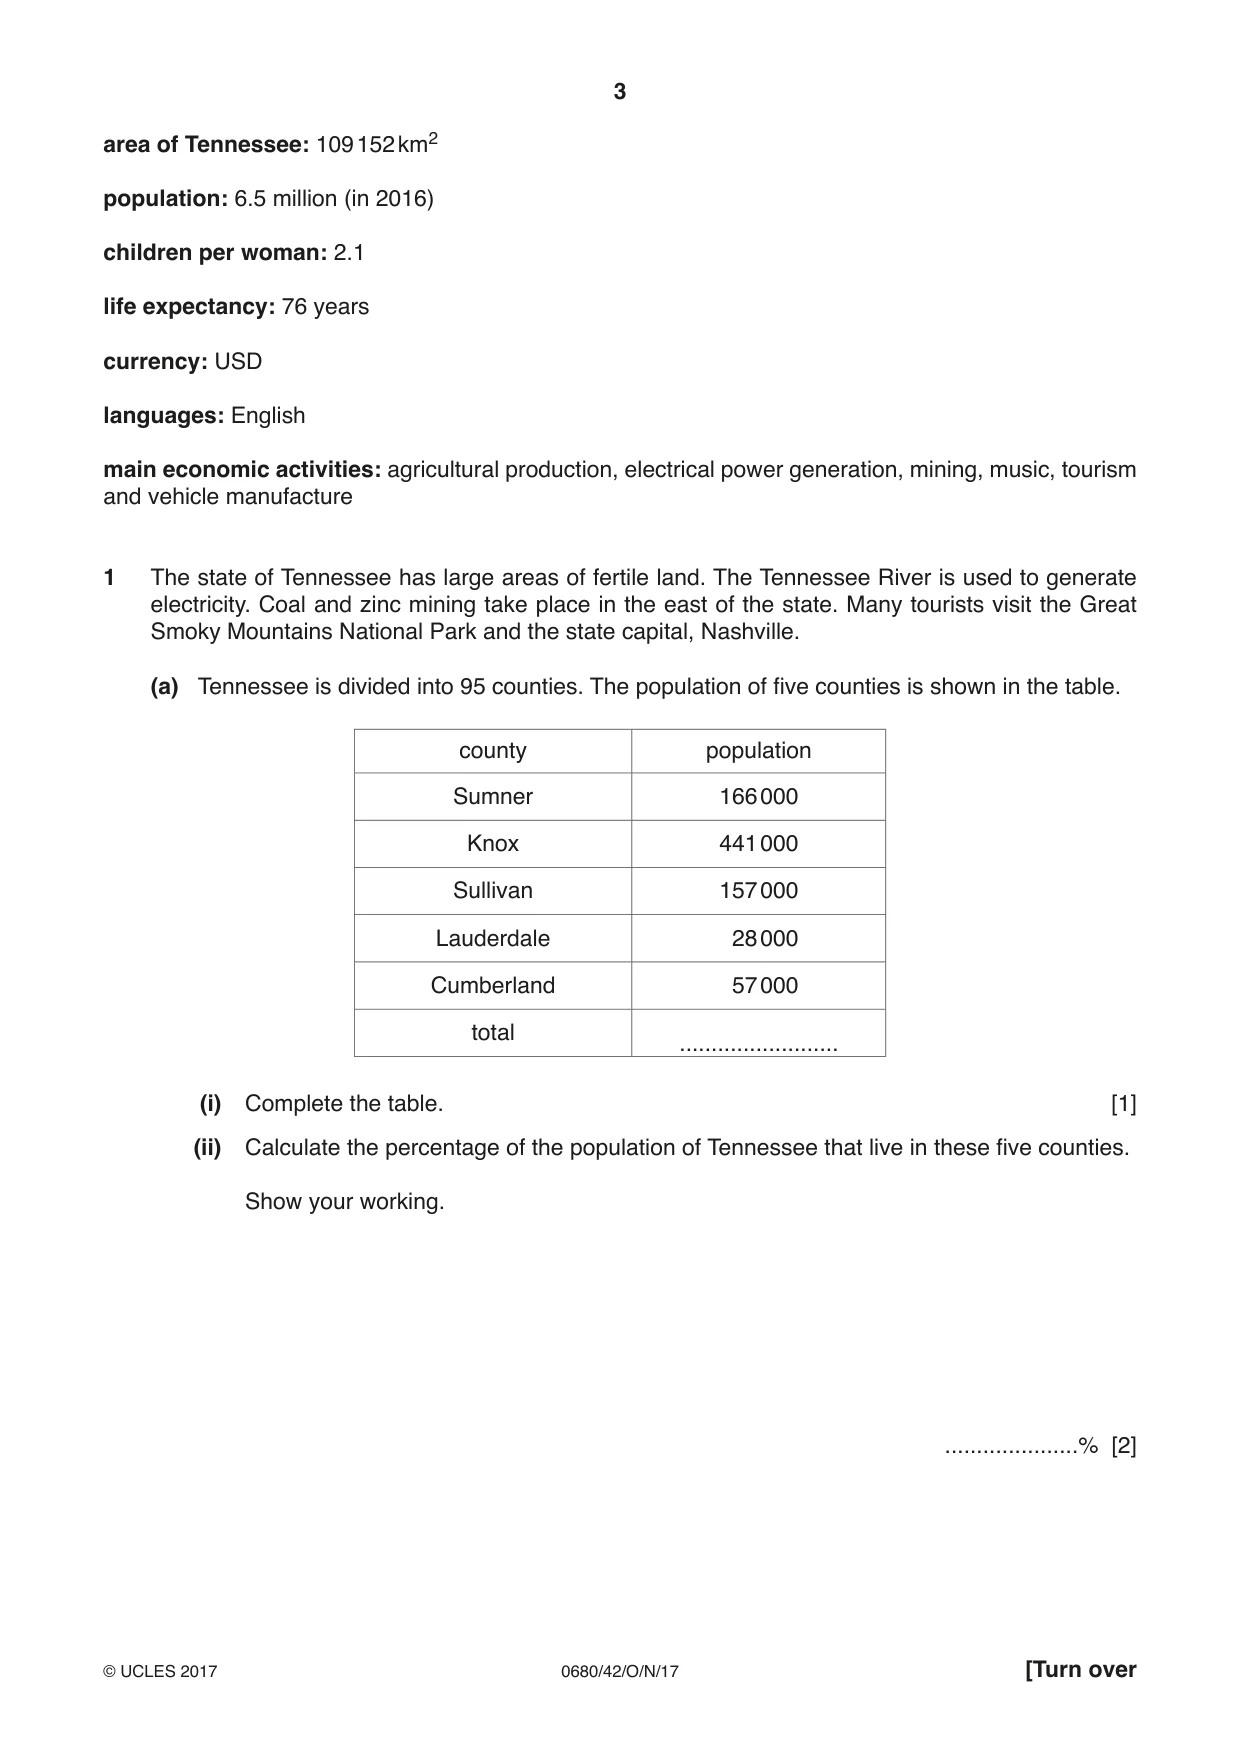
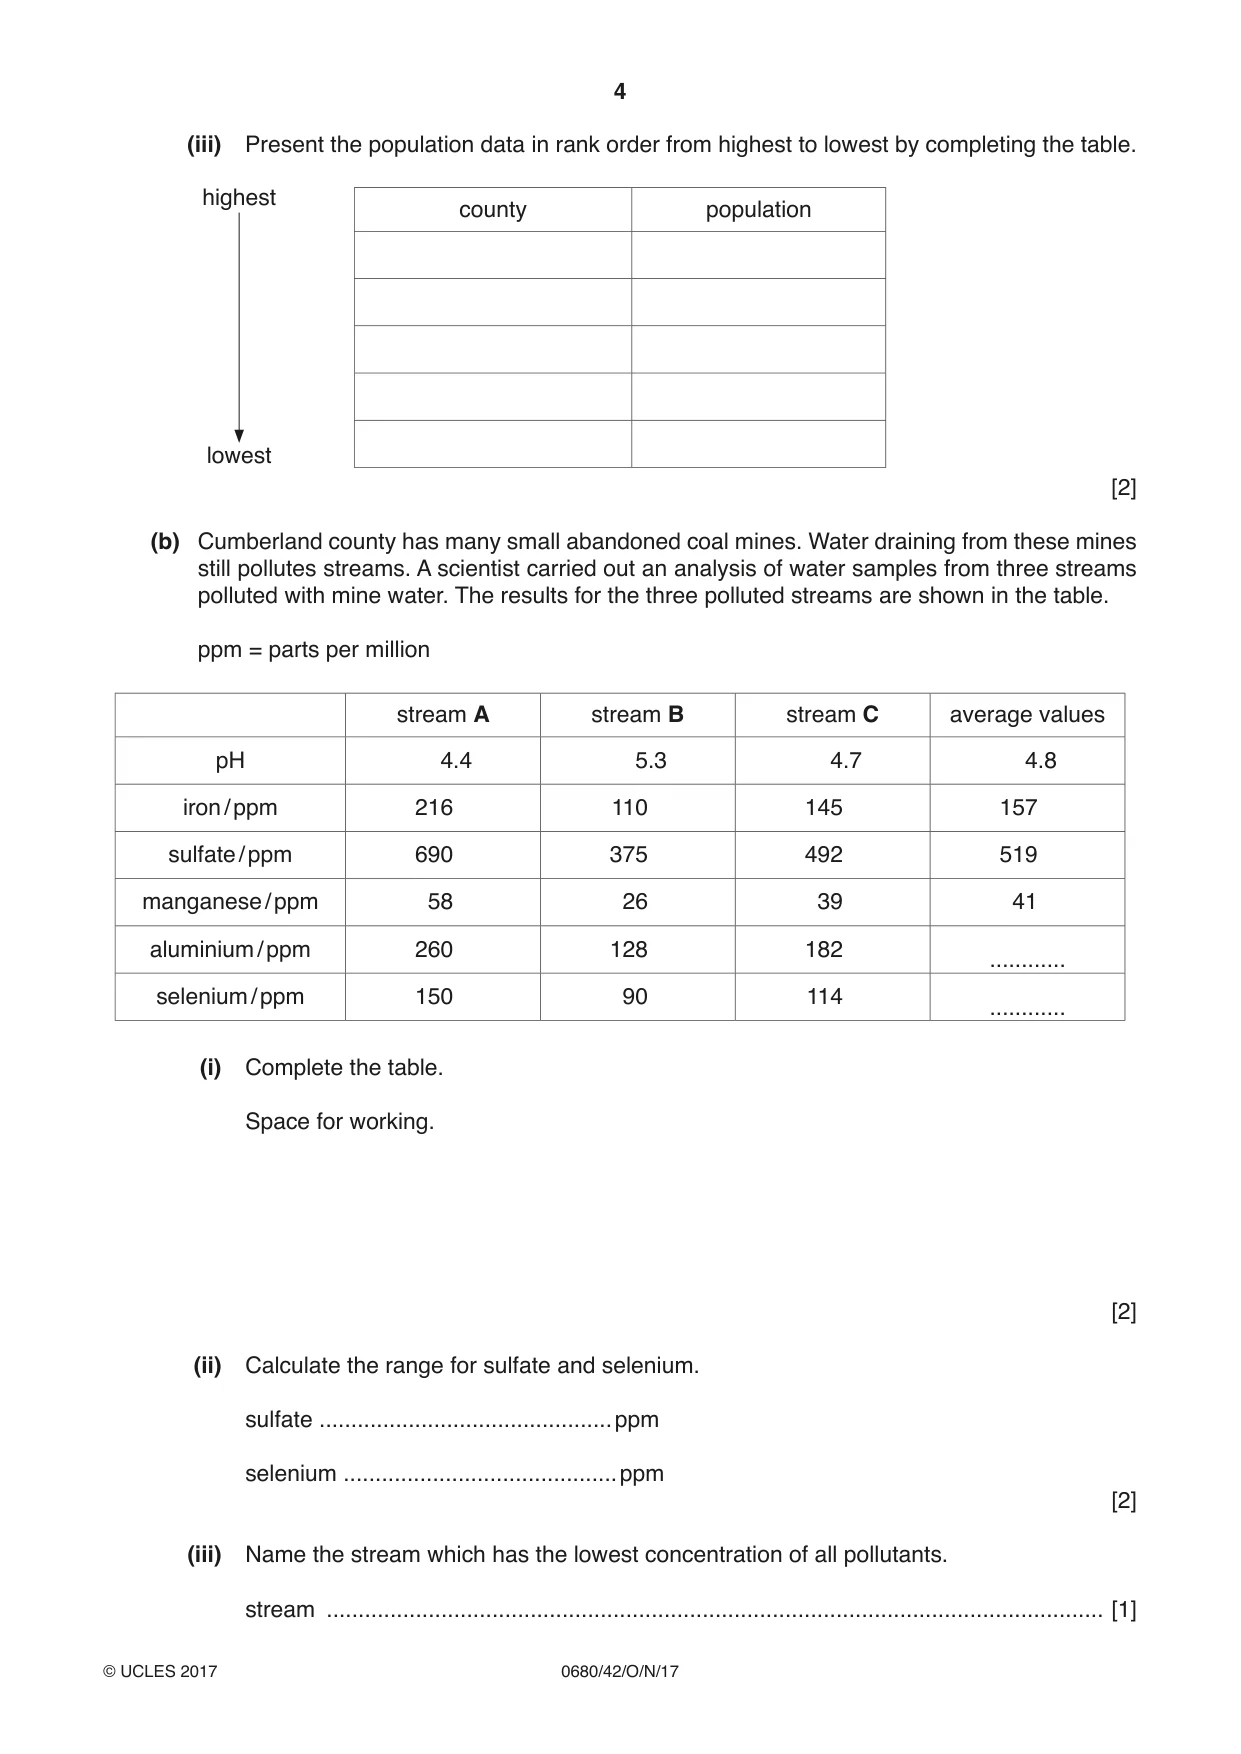
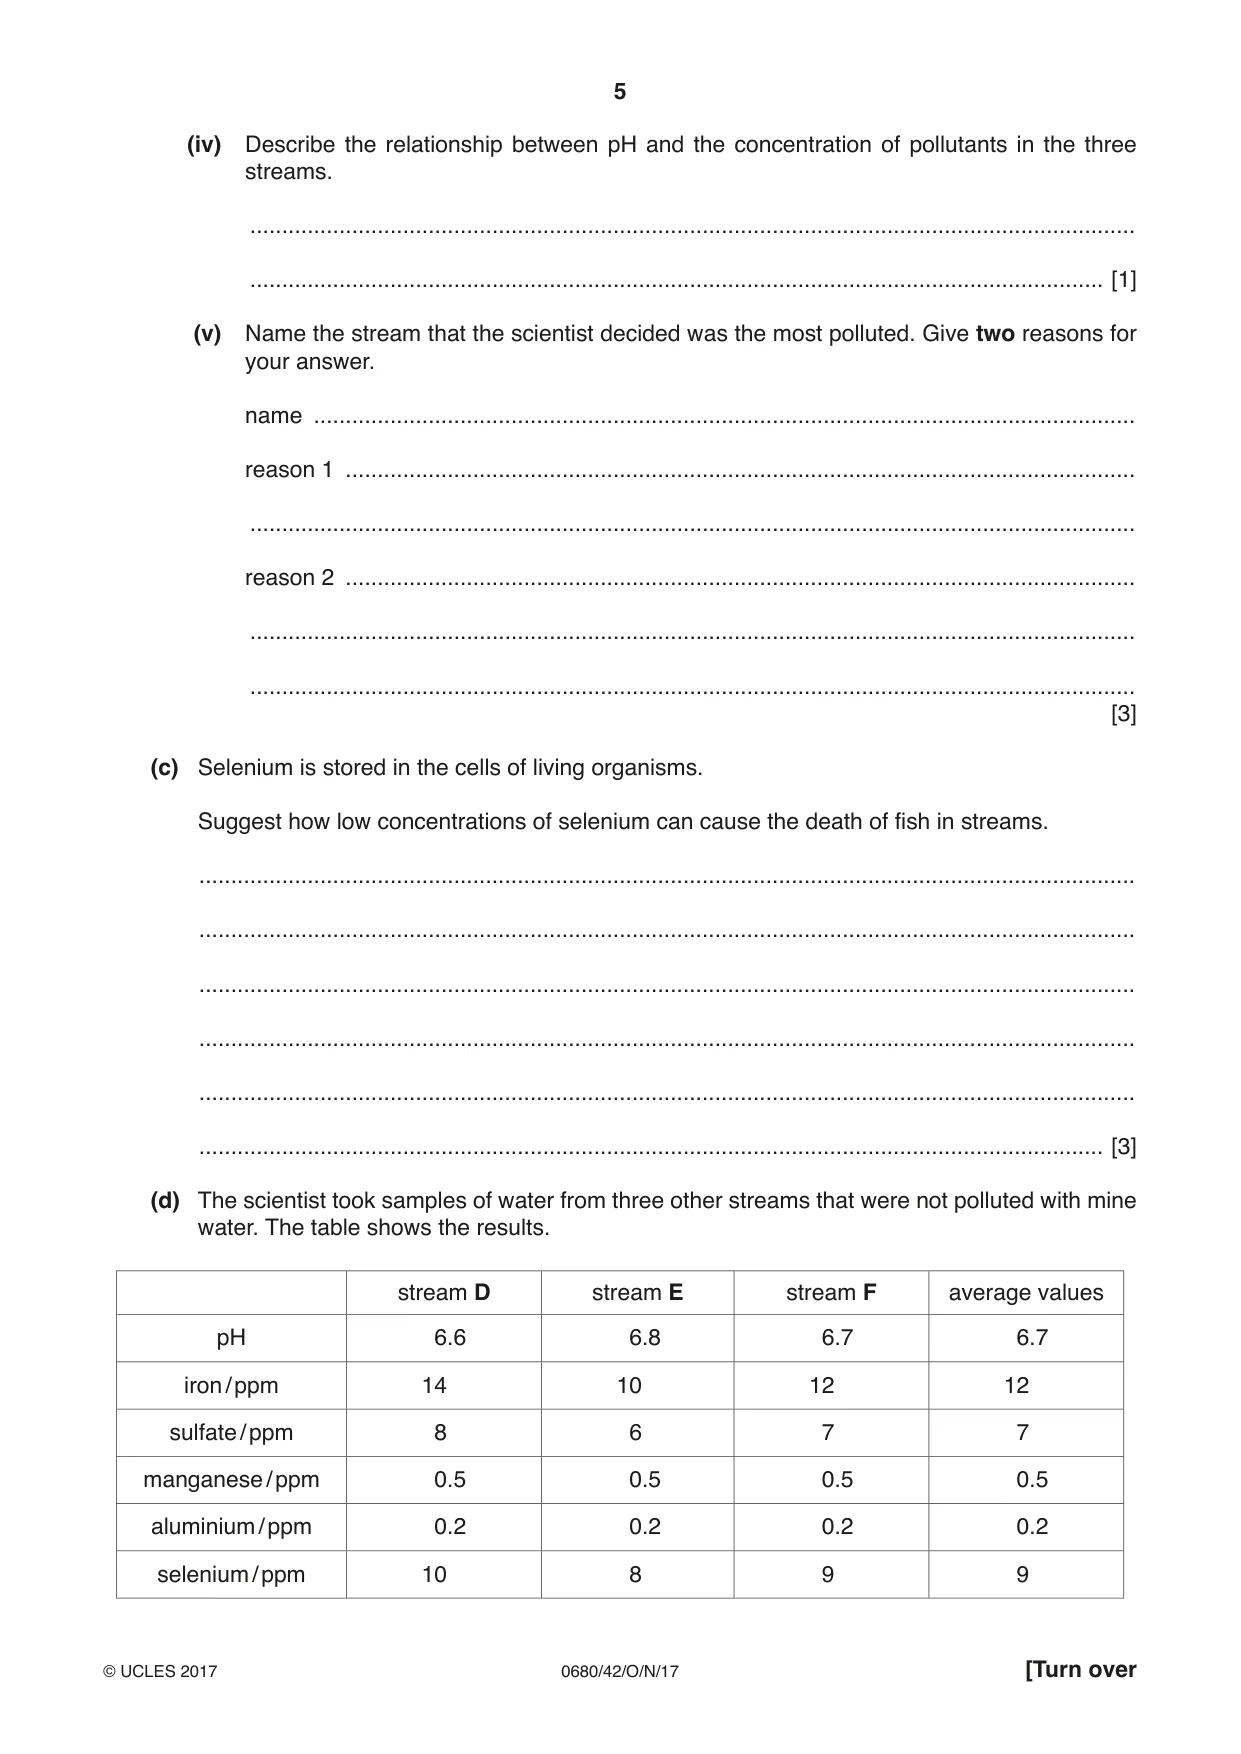
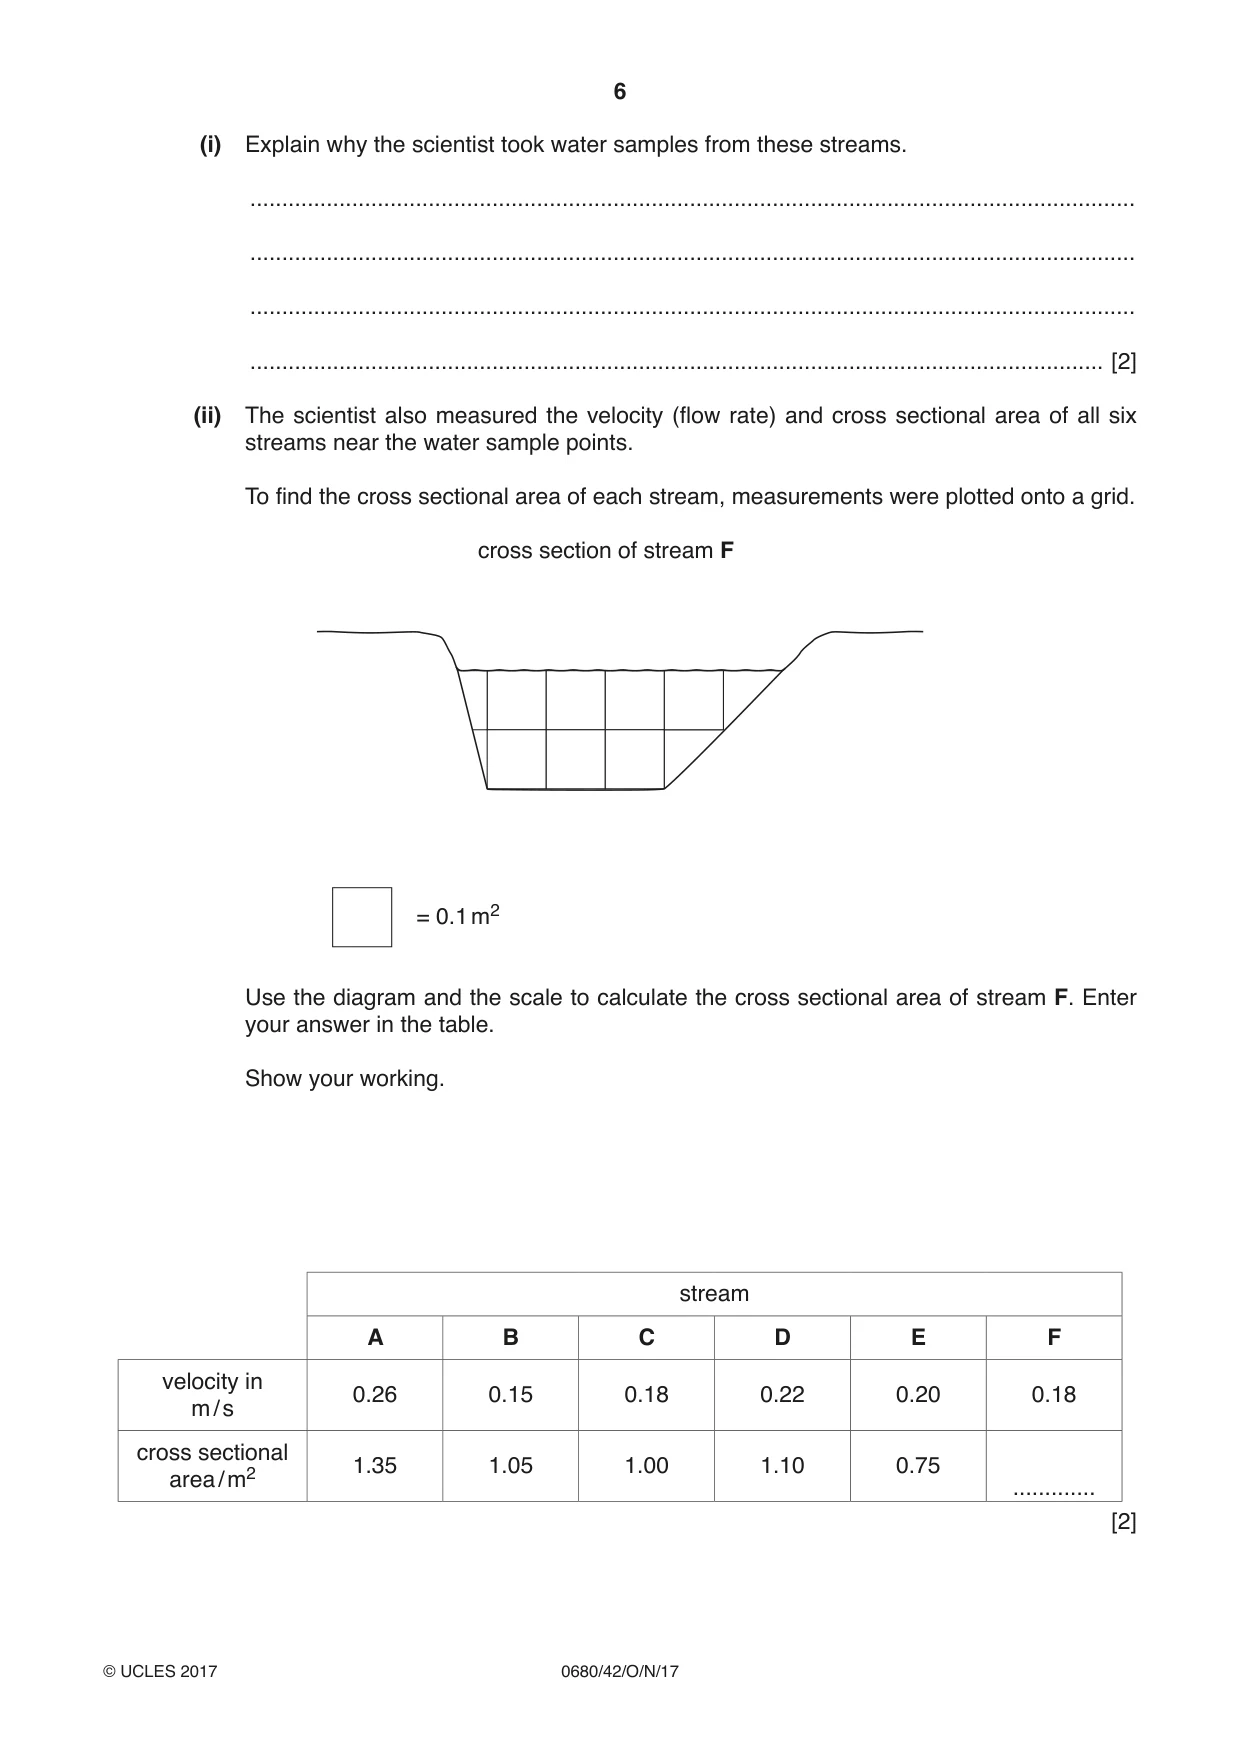
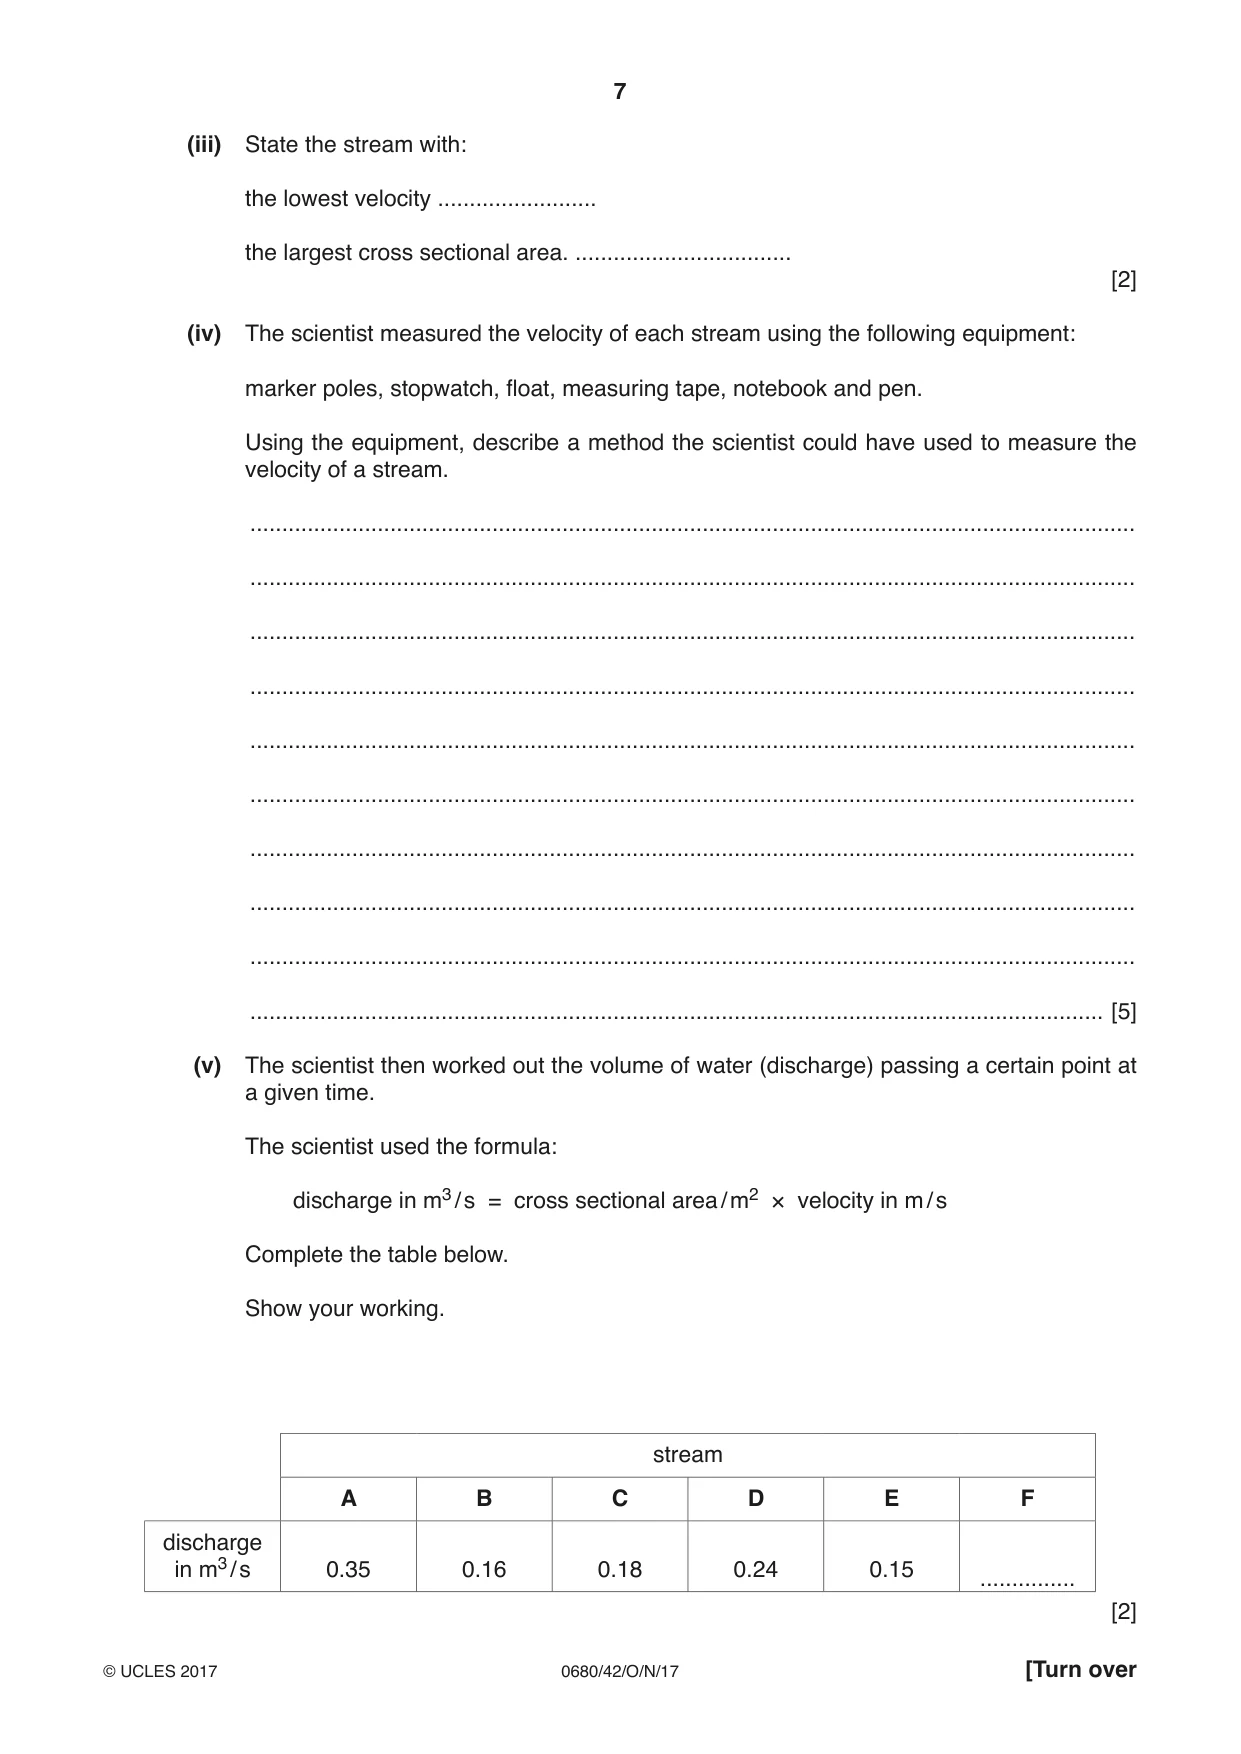
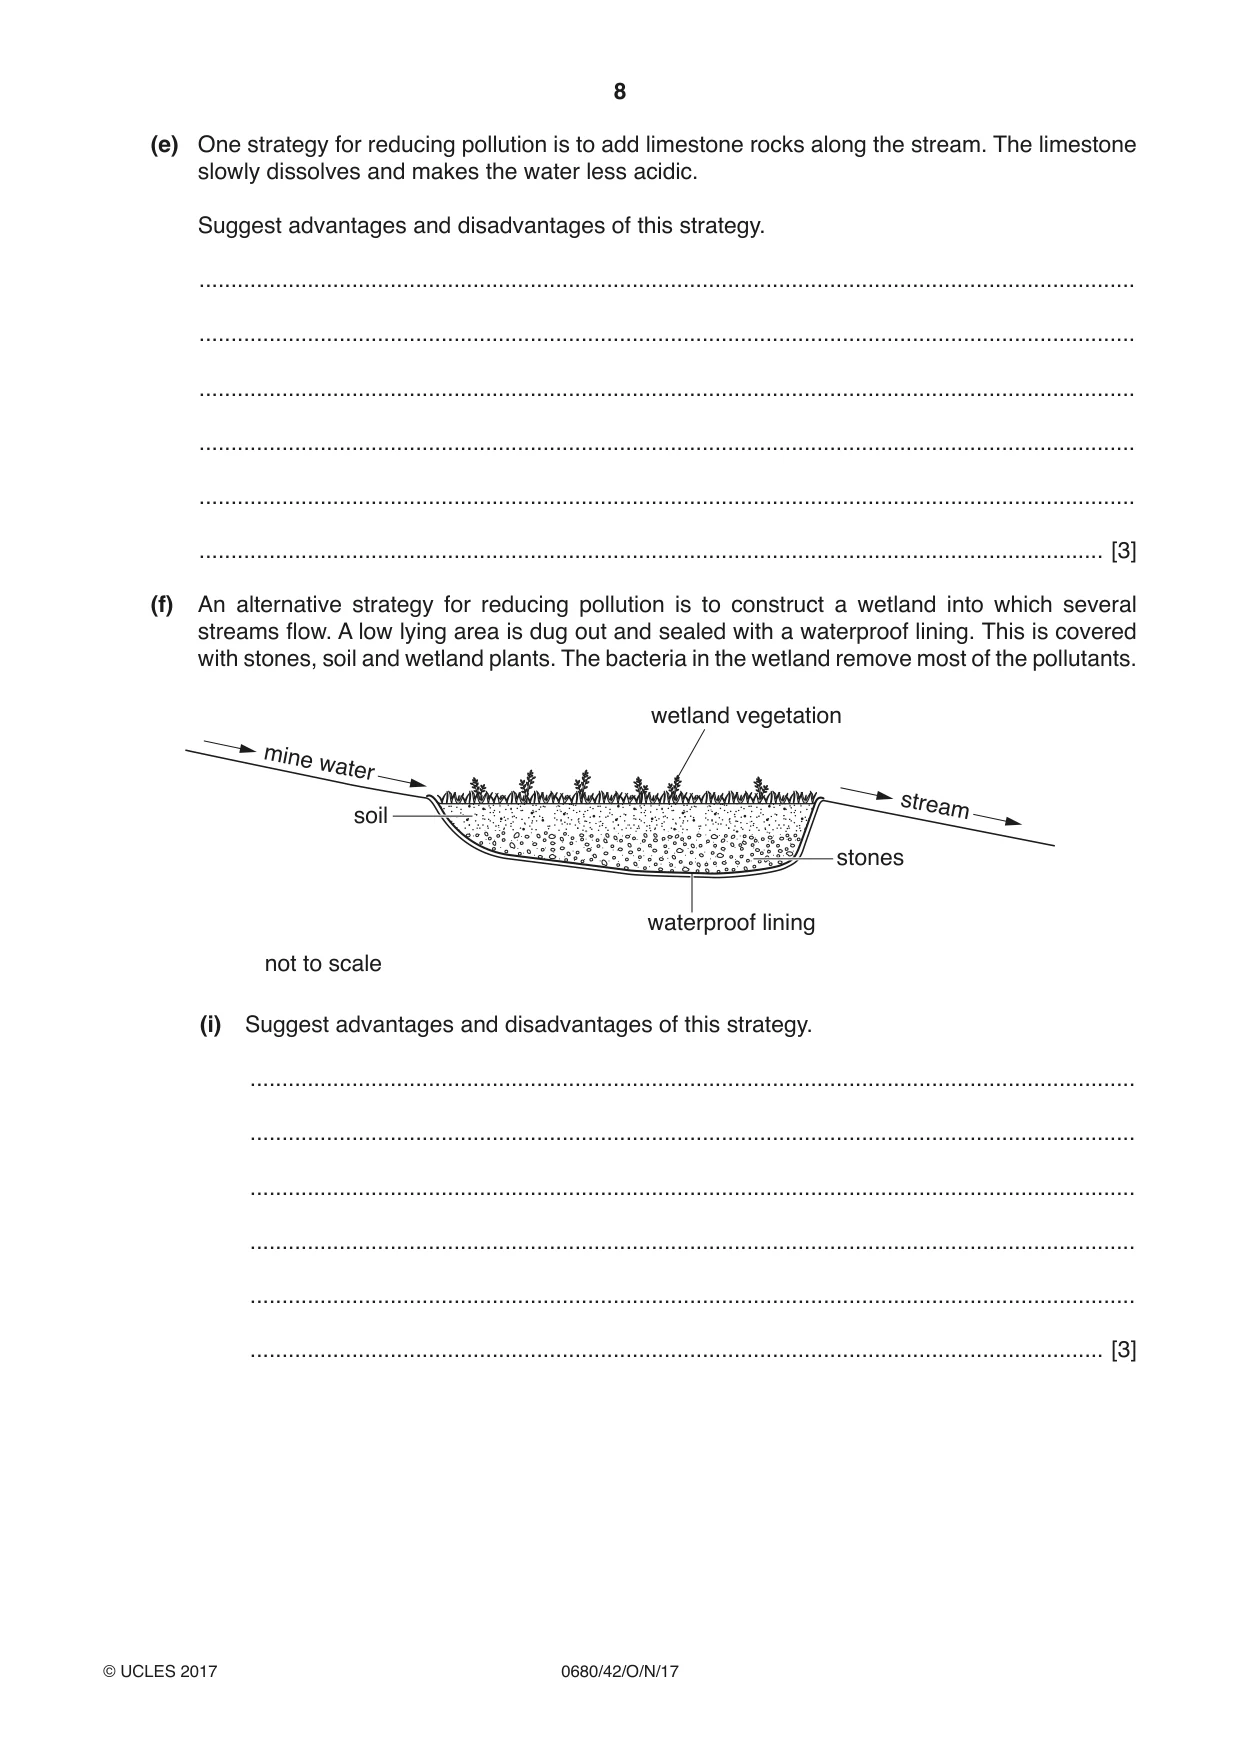
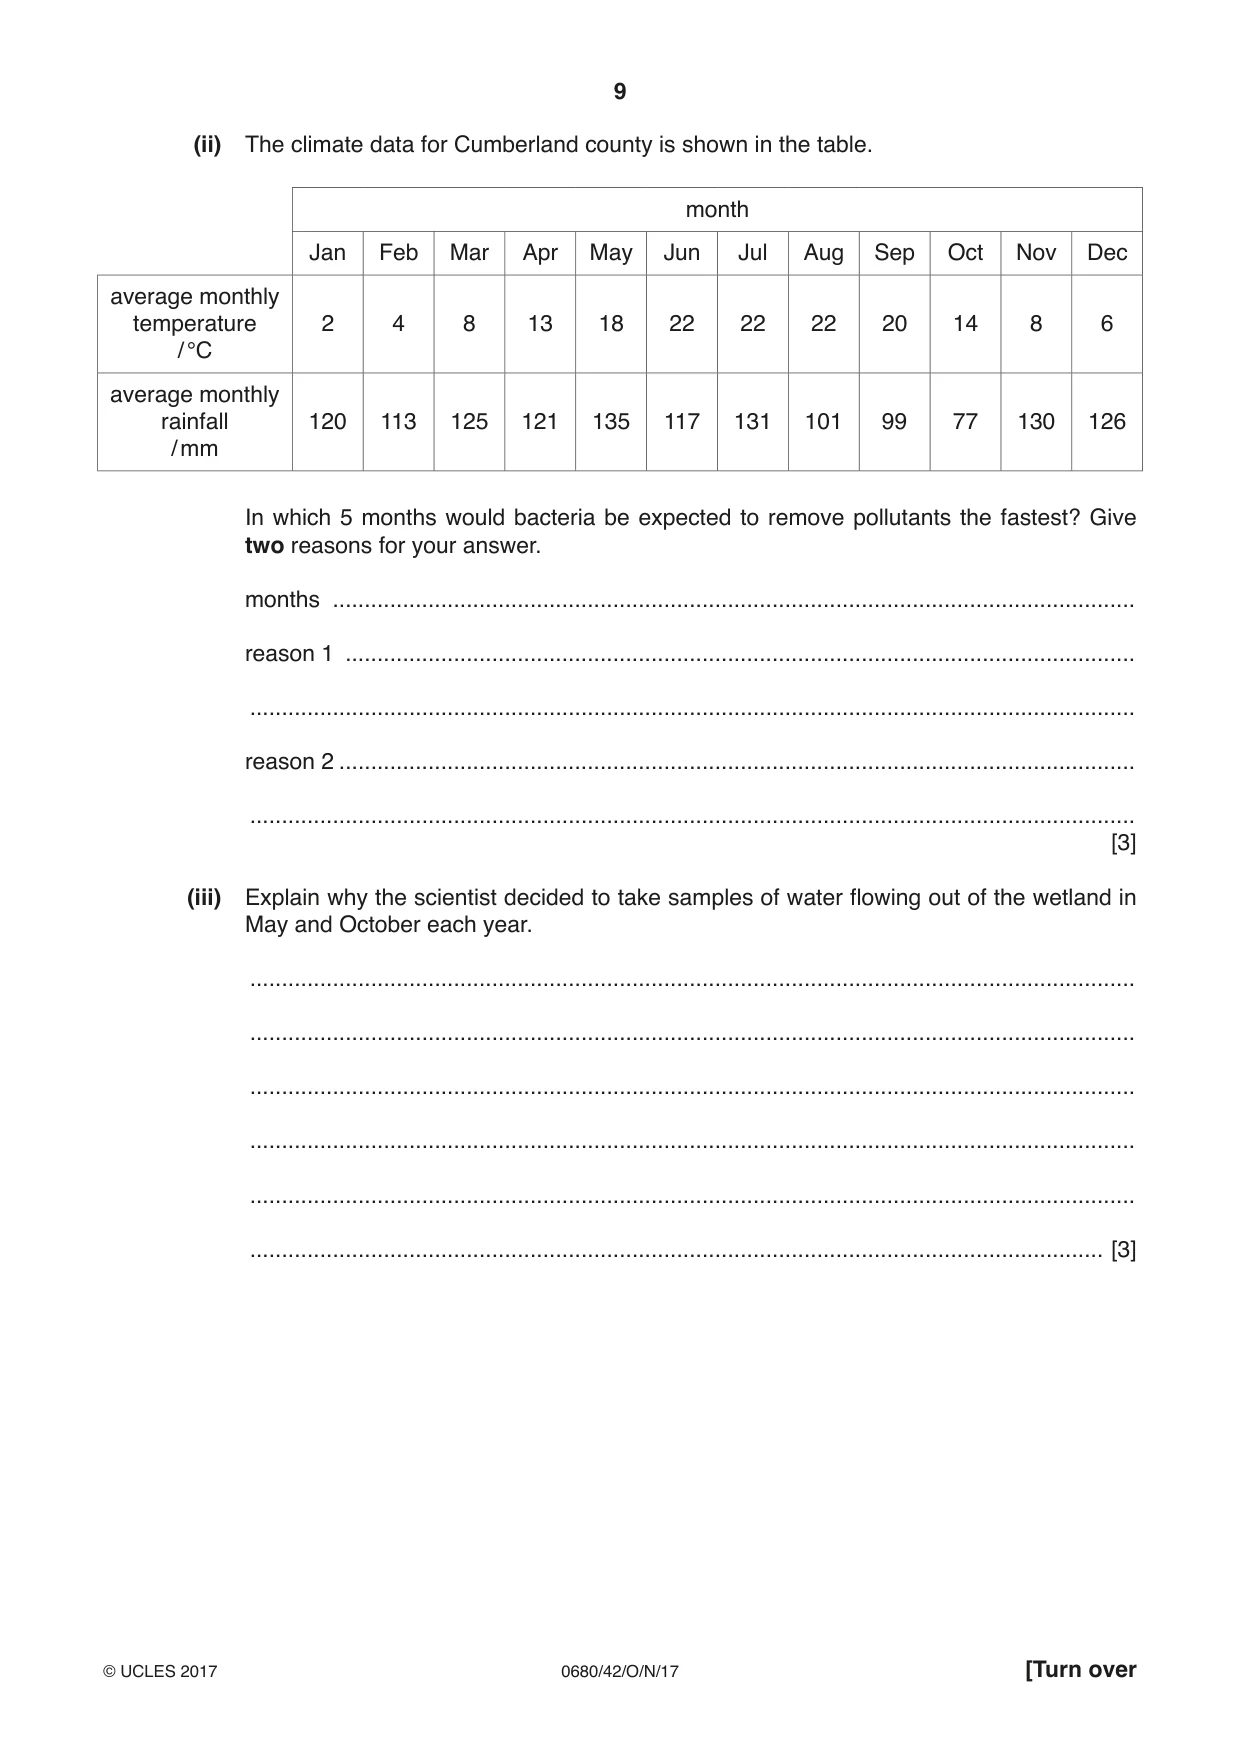
1 The state of Tennessee has large areas of fertile land. The Tennessee River is used to generate electricity. Coal and zinc mining take place in the east of the state. Many tourists visit the Great Smoky Mountains National Park and the state capital, Nashville. (a) Tennessee is divided into 95 counties. The population of five counties is shown in the table. county population Sumner 166 000 Knox 441 000 Sullivan 157 000 Lauderdale 28 000 Cumberland 57 000 total ......................... (i) Complete the table. [1] (ii) Calculate the percentage of the population of Tennessee that live in these five counties. Show your working. .....................% [2] (iii) Present the population data in rank order from highest to lowest by completing the table. highest county population lowest [2] (b) Cumberland county has many small abandoned coal mines. Water draining from these mines still pollutes streams. A scientist carried out an analysis of water samples from three streams polluted with mine water. The results for the three polluted streams are shown in the table. ppm = parts per million stream A stream B stream C average values pH 4.4 5.3 4.7 4.8 iron / ppm 216 110 145 157 sulfate / ppm 690 375 492 519 manganese / ppm 58 26 39 41 aluminium / ppm 260 128 182 ............ selenium / ppm 150 90 114 ............ (i) Complete the table. Space for working. [2] (ii) Calculate the range for sulfate and selenium. sulfate .............................................. ppm selenium ........................................... ppm [2] (iii) Name the stream which has the lowest concentration of all pollutants. stream .......................................................................................................................... [1] (iv) Describe the relationship between pH and the concentration of pollutants in the three streams. ........................................................................................................................................... ...................................................................................................................................... [1] (v) Name the stream that the scientist decided was the most polluted. Give two reasons for your answer. name ................................................................................................................................. reason 1 ............................................................................................................................ ........................................................................................................................................... reason 2 ............................................................................................................................ ........................................................................................................................................... ........................................................................................................................................... [3] (c) Selenium is stored in the cells of living organisms. Suggest how low concentrations of selenium can cause the death of fish in streams. ................................................................................................................................................... ................................................................................................................................................... ................................................................................................................................................... ................................................................................................................................................... ................................................................................................................................................... .............................................................................................................................................. [3] (d) The scientist took samples of water from three other streams that were not polluted with mine water. The table shows the results. stream D stream E stream F average values pH 6.6 6.8 6.7 6.7 iron / ppm 14 10 12 12 sulfate / ppm 8 6 7 7 manganese / ppm 0.5 0.5 0.5 0.5 aluminium / ppm 0.2 0.2 0.2 0.2 selenium / ppm 10 8 9 9 (i) Explain why the scientist took water samples from these streams. ........................................................................................................................................... ........................................................................................................................................... ........................................................................................................................................... ...................................................................................................................................... [2] (ii) The scientist also measured the velocity (flow rate) and cross sectional area of all six streams near the water sample points. To find the cross sectional area of each stream, measurements were plotted onto a grid. cross section of stream F = 0.1 m2 Use the diagram and the scale to calculate the cross sectional area of stream F. Enter your answer in the table. Show your working. stream A B C D E F velocity in 0.26 0.15 0.18 0.22 0.20 0.18 m / s cross sectional 1.35 1.05 1.00 1.10 0.75 area / m2 ............. [2] (iii) State the stream with: the lowest velocity ......................... the largest cross sectional area. .................................. [2] (iv) The scientist measured the velocity of each stream using the following equipment: marker poles, stopwatch, float, measuring tape, notebook and pen. Using the equipment, describe a method the scientist could have used to measure the velocity of a stream. ........................................................................................................................................... ........................................................................................................................................... ........................................................................................................................................... ........................................................................................................................................... ........................................................................................................................................... ........................................................................................................................................... ........................................................................................................................................... ........................................................................................................................................... ........................................................................................................................................... ...................................................................................................................................... [5] (v) The scientist then worked out the volume of water (discharge) passing a certain point at a given time. The scientist used the formula: discharge in m3 / s = cross sectional area / m2 × velocity in m / s Complete the table below. Show your working. stream A B C D E F discharge in m3 / s 0.35 0.16 0.18 0.24 0.15 ............... [2] One strategy for reducing pollution is to add limestone rocks along the stream. The limestone slowly dissolves and makes the water less acidic. Suggest advantages and disadvantages of this strategy. ................................................................................................................................................... ................................................................................................................................................... ................................................................................................................................................... ................................................................................................................................................... ................................................................................................................................................... .............................................................................................................................................. [3] (f) An alternative strategy for reducing pollution is to construct a wetland into which several streams flow. A low lying area is dug out and sealed with a waterproof lining. This is covered with stones, soil and wetland plants. The bacteria in the wetland remove most of the pollutants. wetland vegetation mine water soil stream stones waterproof lining not to scale (i) Suggest advantages and disadvantages of this strategy. ........................................................................................................................................... ........................................................................................................................................... ........................................................................................................................................... ........................................................................................................................................... ........................................................................................................................................... ...................................................................................................................................... [3] (ii) The climate data for Cumberland county is shown in the table. month Jan Feb Mar Apr May Jun Jul Aug Sep Oct Nov Dec average monthly temperature 2 4 8 13 18 22 22 22 20 14 8 6 / °C average monthly rainfall 120 113 125 121 135 117 131 101 99 77 130 126 / mm In which 5 months would bacteria be expected to remove pollutants the fastest? Give two reasons for your answer. months .............................................................................................................................. reason 1 ............................................................................................................................ ........................................................................................................................................... reason 2 ............................................................................................................................. ........................................................................................................................................... [3] (iii) Explain why the scientist decided to take samples of water flowing out of the wetland in May and October each year. ........................................................................................................................................... ........................................................................................................................................... ........................................................................................................................................... ........................................................................................................................................... ........................................................................................................................................... ...................................................................................................................................... [3]
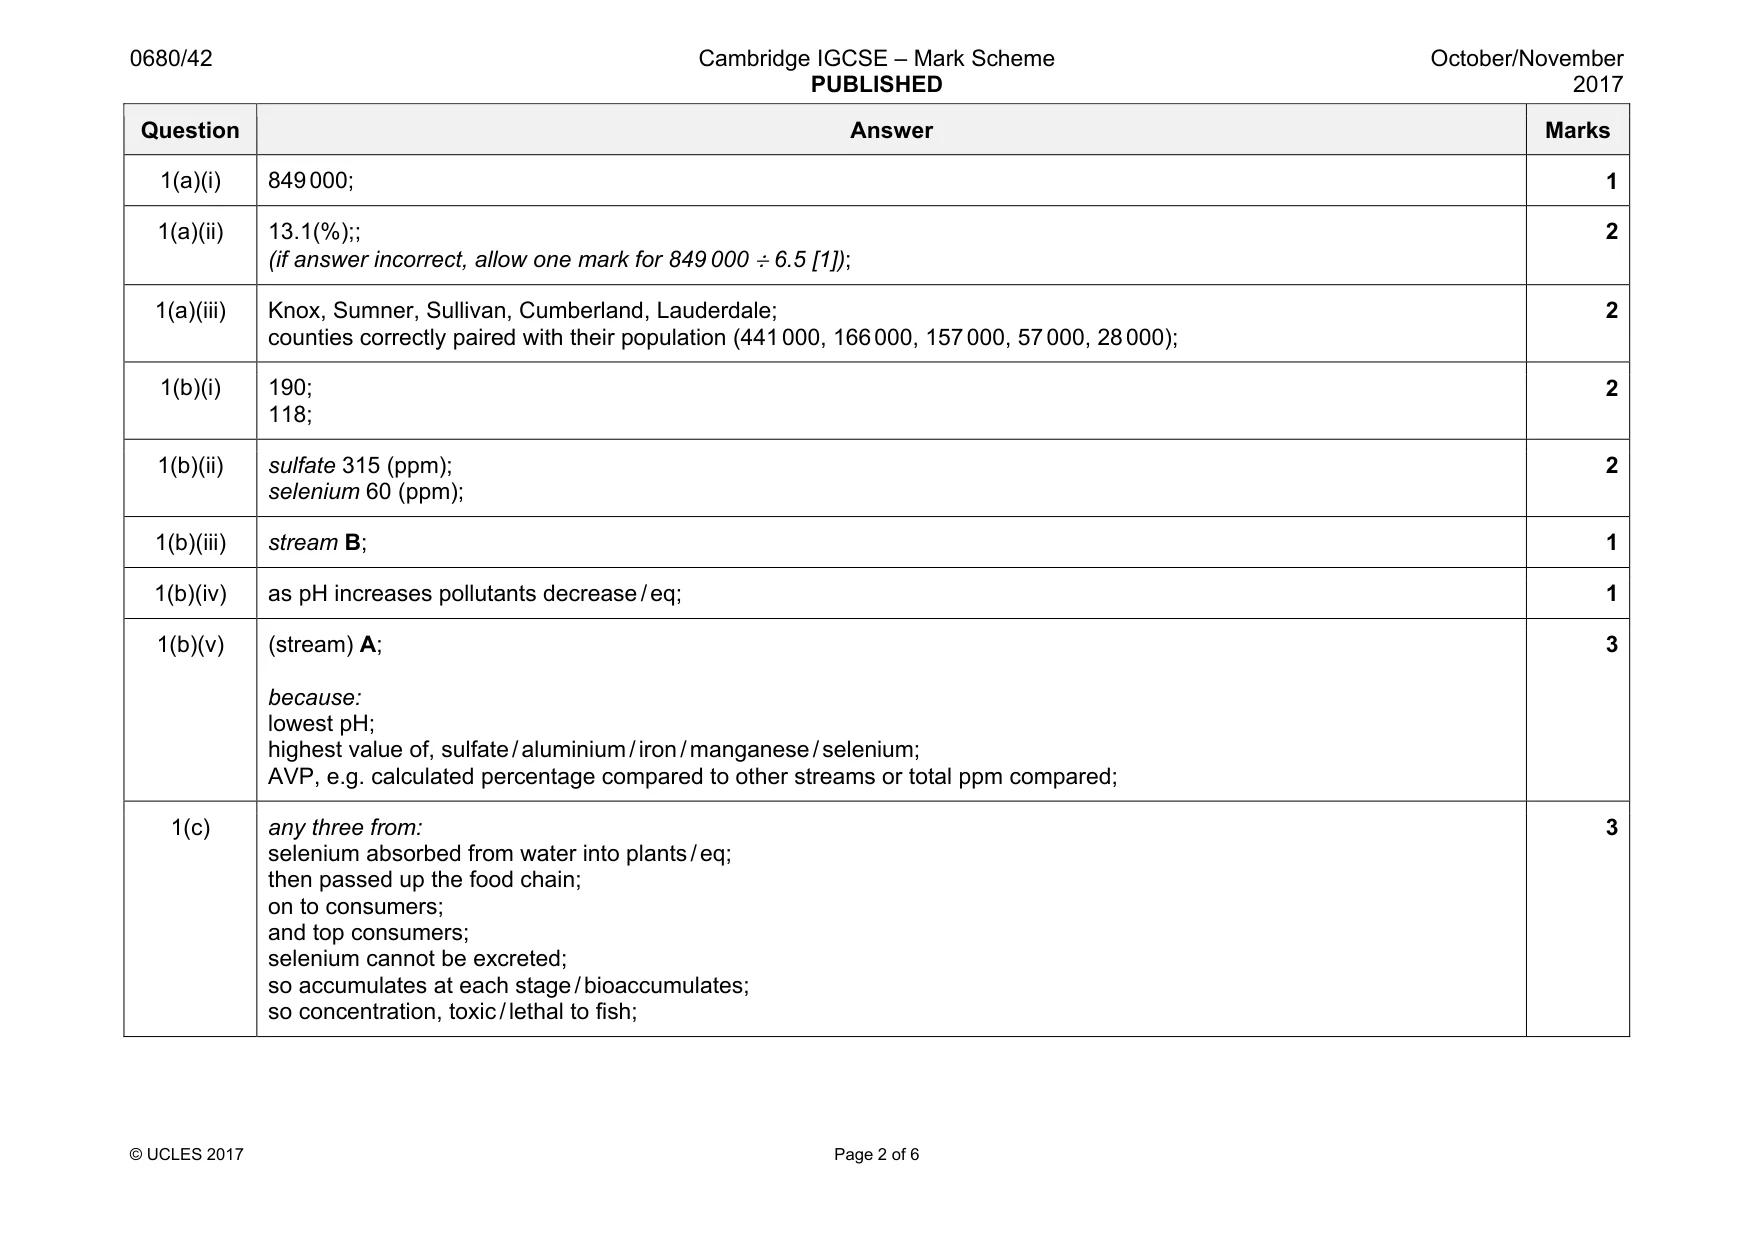
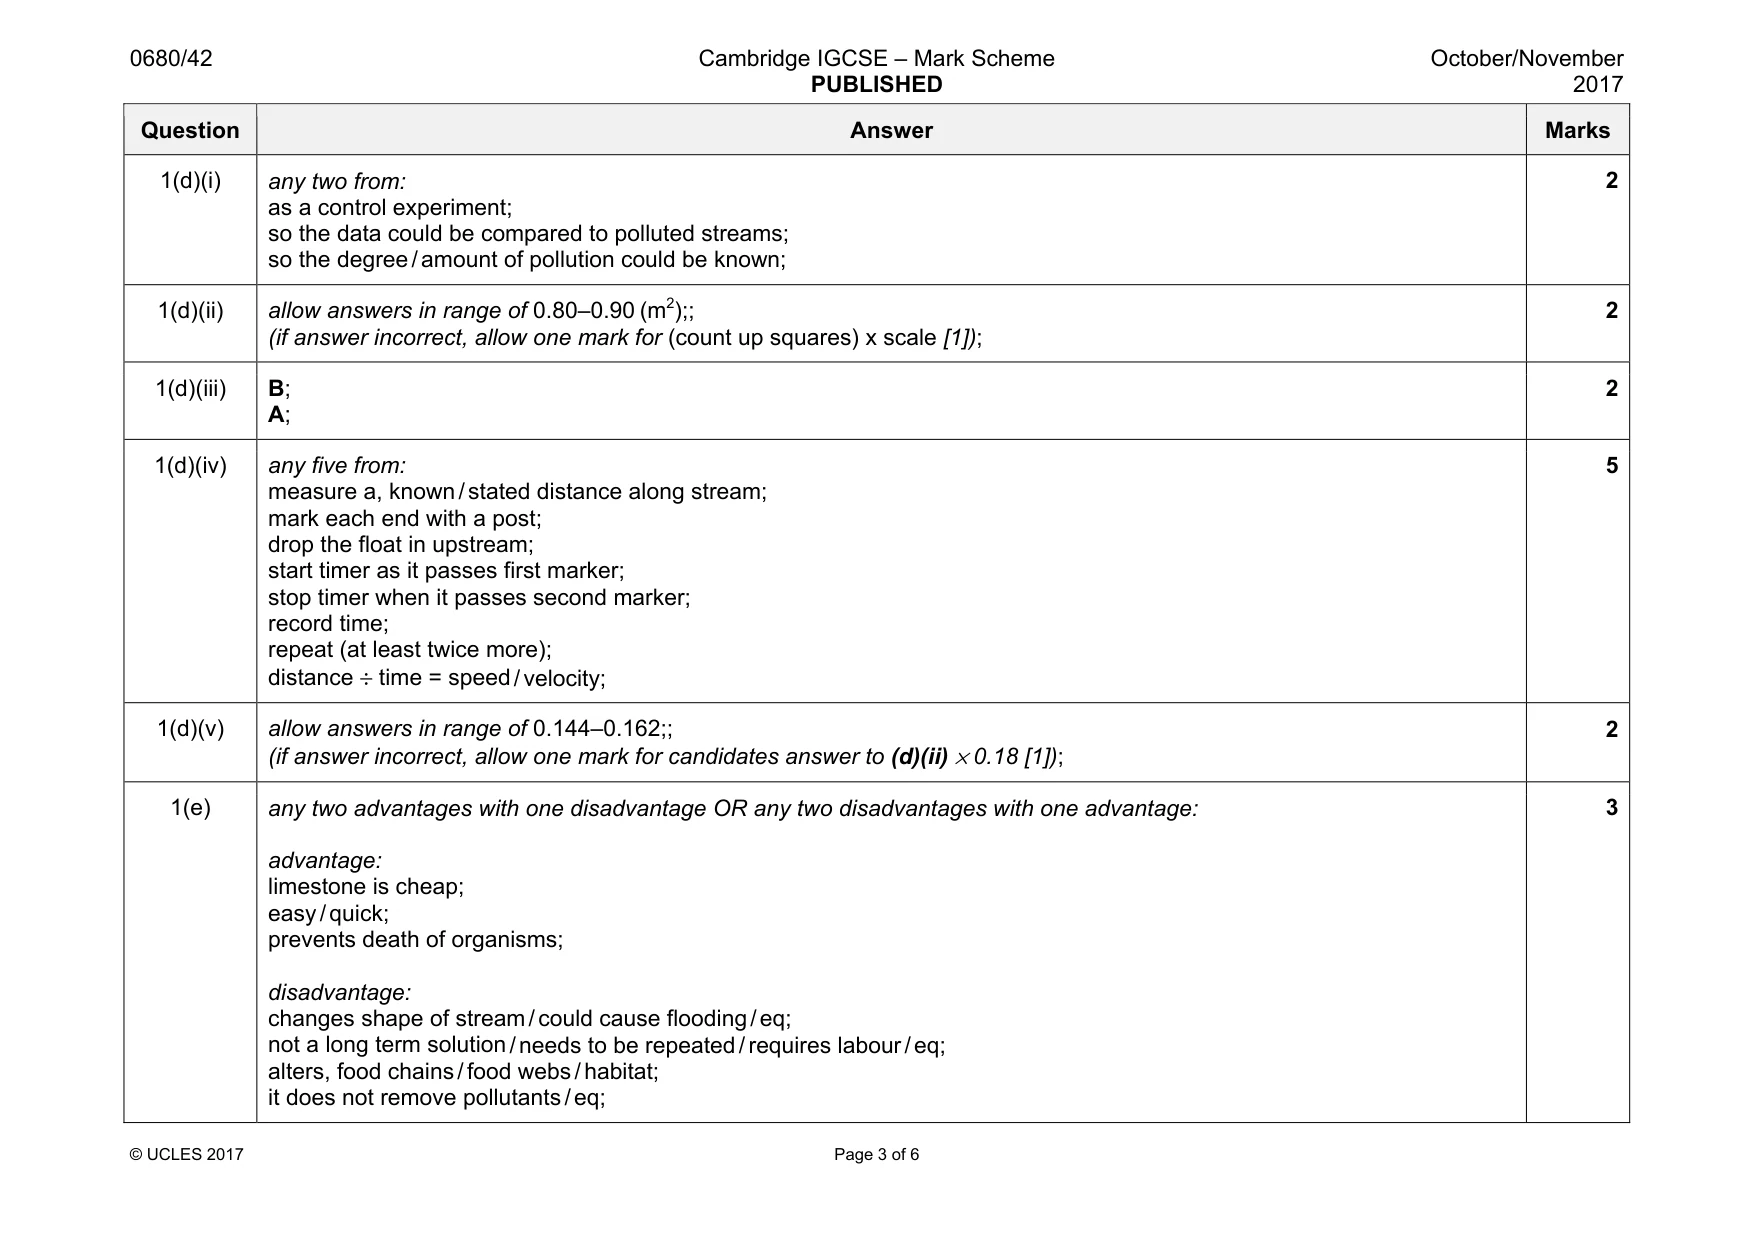
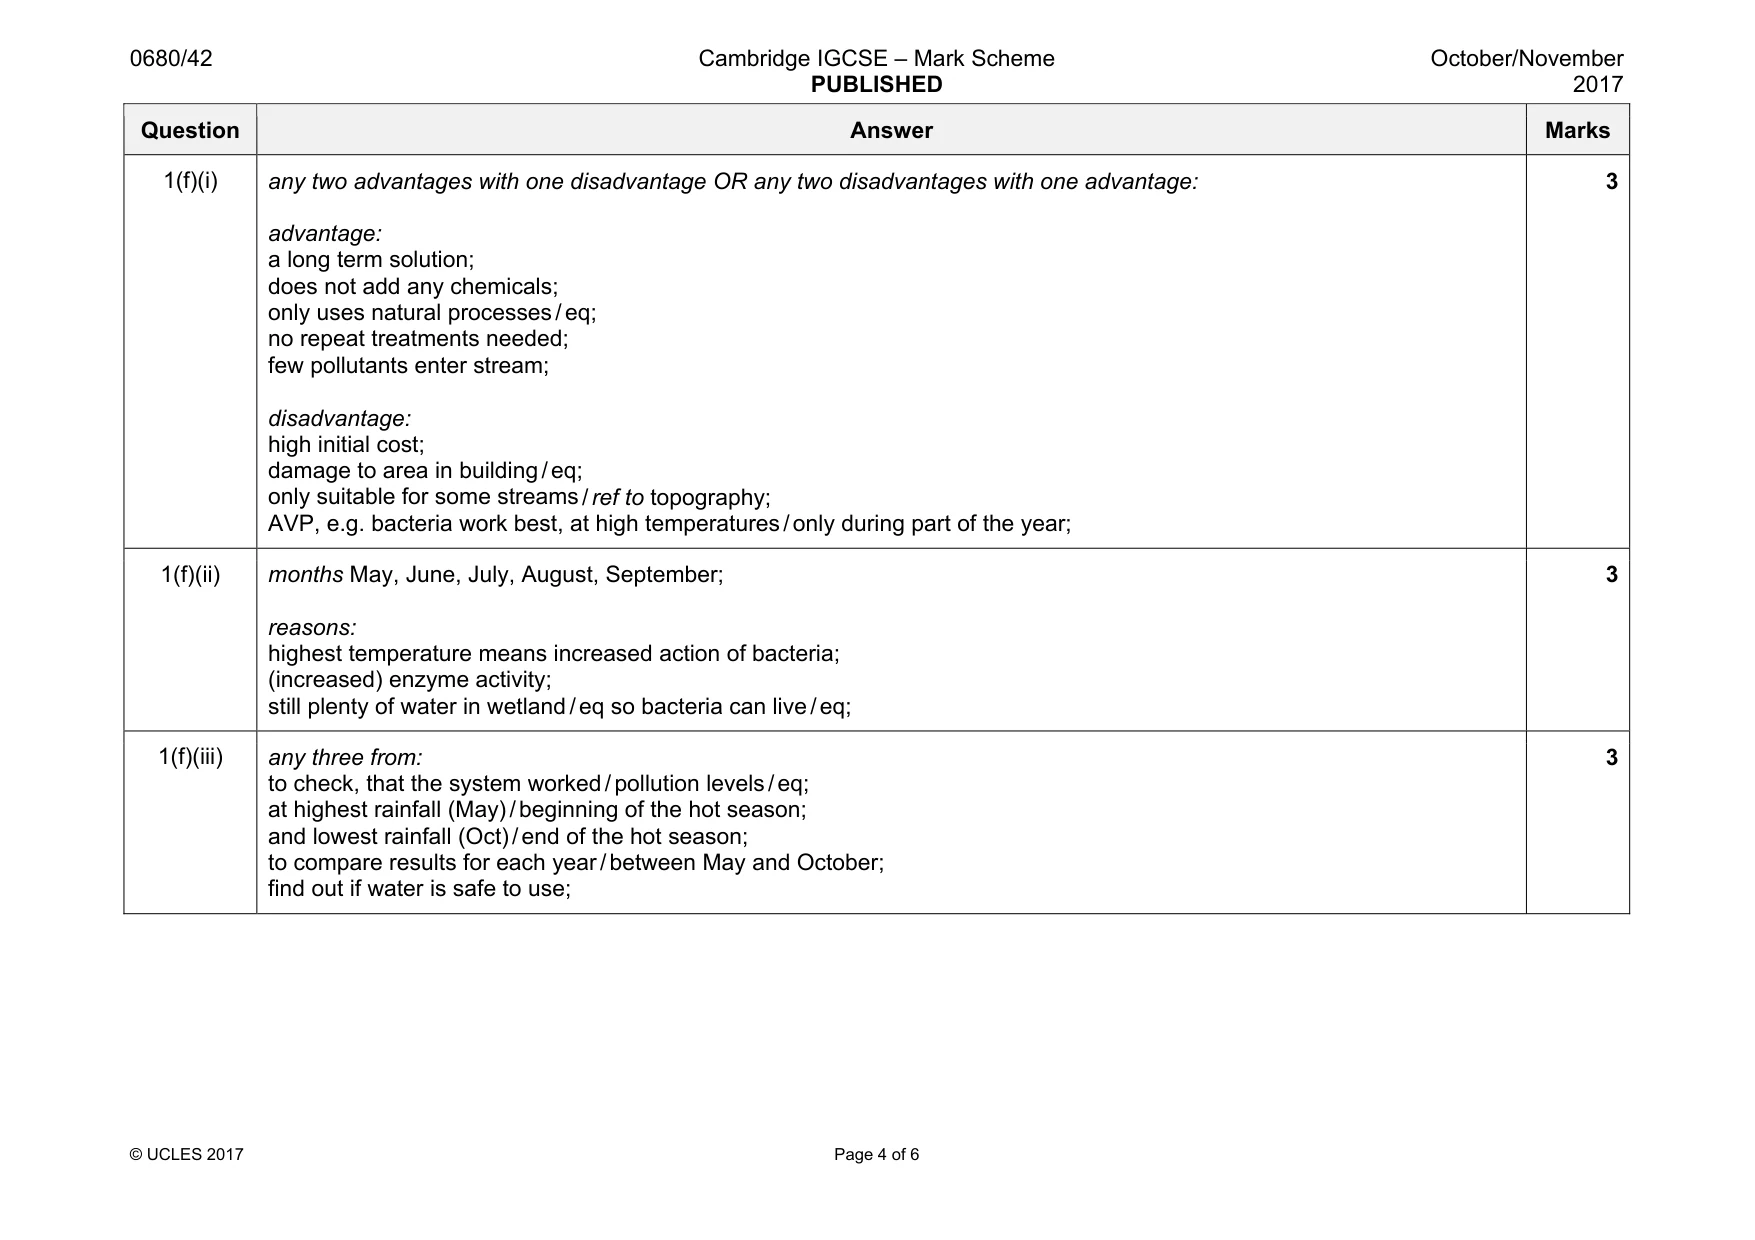
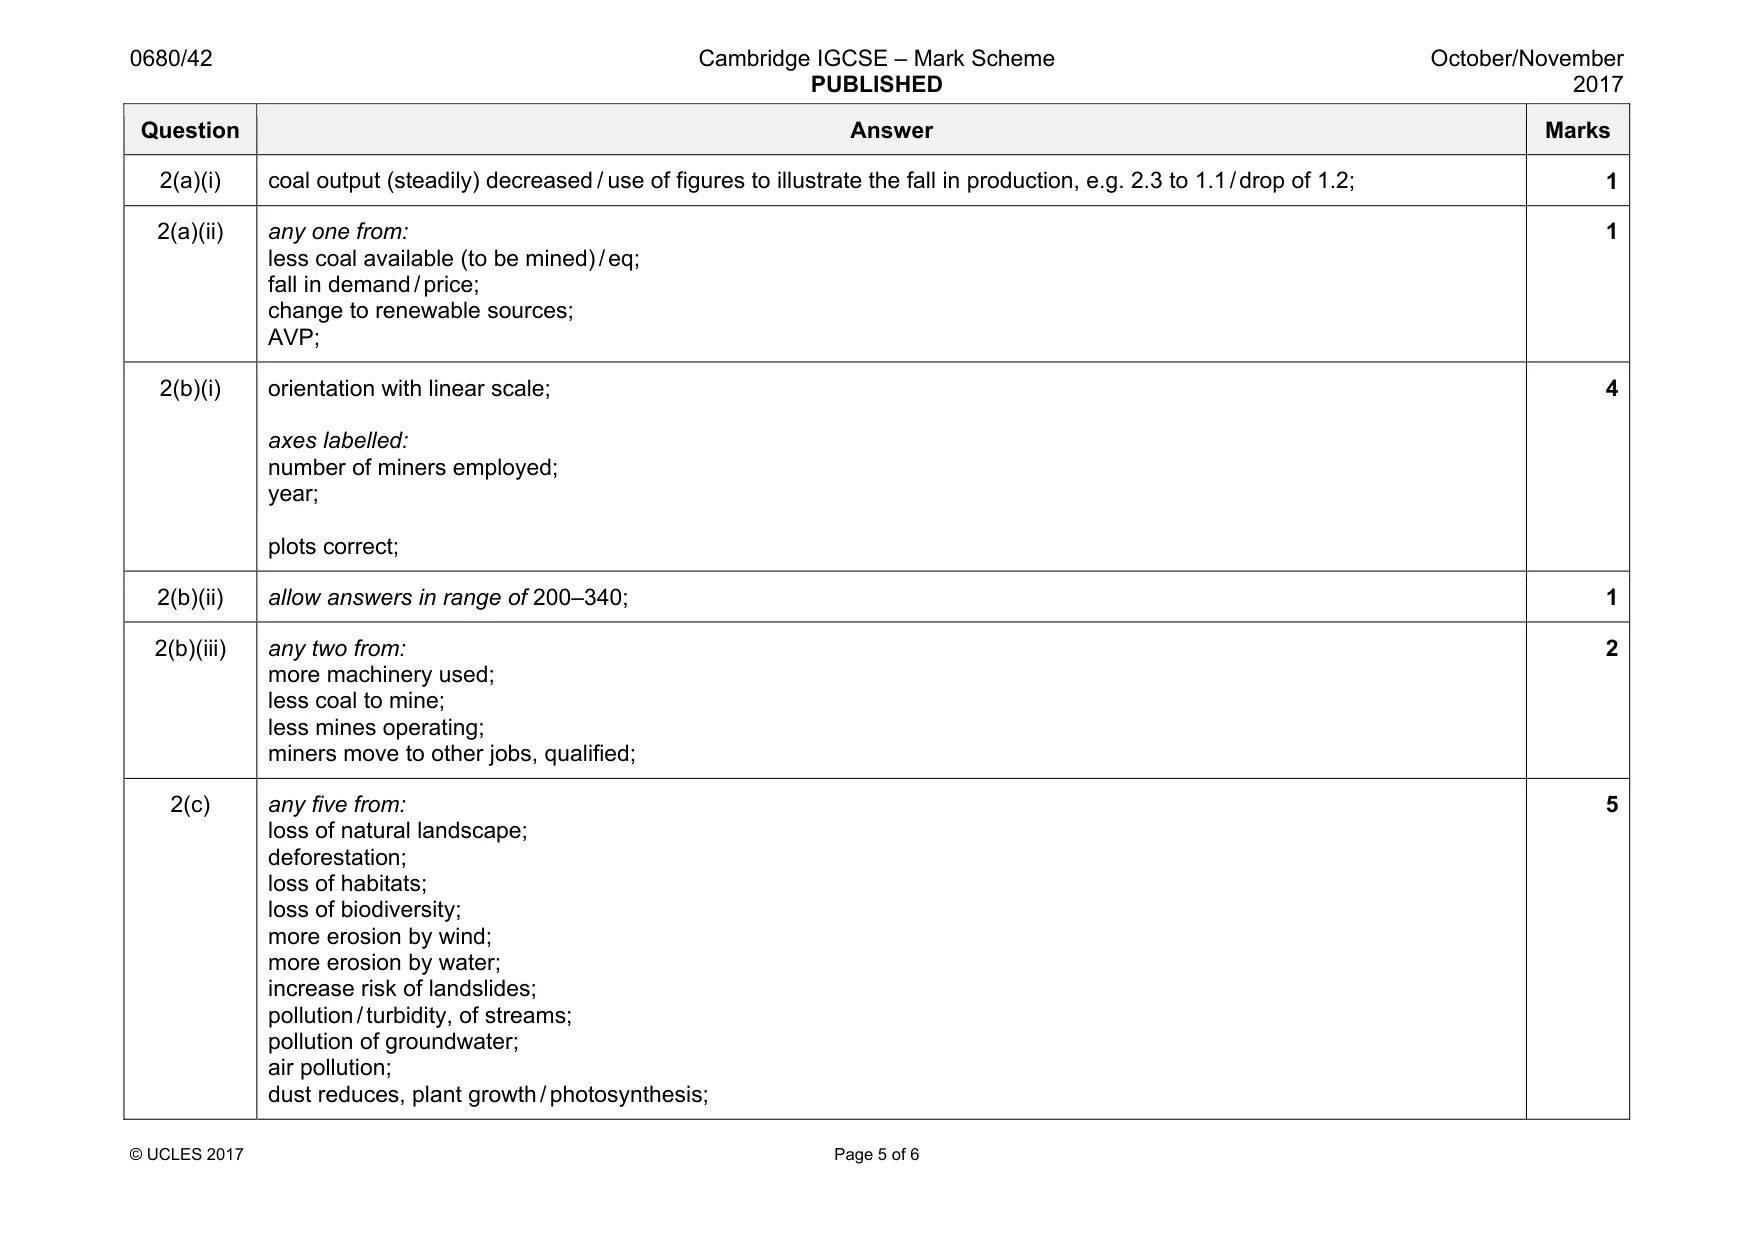
Mark scheme: 1(a)(i) 849 000; 1 1(a)(ii) 13.1(%);; (if answer incorrect, allow one mark for 849 000 ÷ 6.5 [1]); 2 1(a)(iii) Knox, Sumner, Sullivan, Cumberland, Lauderdale; counties correctly paired with their population (441 000, 166 000, 157 000, 57 000, 28 000); 2 1(b)(i) 190; 118; 2 1(b)(ii) sulfate 315 (ppm); selenium 60 (ppm); 2 1(b)(iii) stream B; 1 1(b)(iv) as pH increases pollutants decrease / eq; 1 1(b)(v) (stream) A; because: lowest pH; highest value of, sulfate / aluminium / iron / manganese / selenium; AVP, e.g. calculated percentage compared to other streams or total ppm compared; 3 1(c) any three from: selenium absorbed from water into plants / eq; then passed up the food chain; on to consumers; and top consumers; selenium cannot be excreted; so accumulates at each stage / bioaccumulates; so concentration, toxic / lethal to fish; 3 Question Answer Marks 1(d)(i) any two from: as a control experiment; so the data could be compared to polluted streams; so the degree / amount of pollution could be known; 2 1(d)(ii) allow answers in range of 0.80–0.90 (m2);; (if answer incorrect, allow one mark for (count up squares) x scale [1]); 2 1(d)(iii) B; A; 2 1(d)(iv) any five from: measure a, known / stated distance along stream; mark each end with a post; drop the float in upstream; start timer as it passes first marker; stop timer when it passes second marker; record time; repeat (at least twice more); distance ÷ time = speed / velocity; 5 1(d)(v) allow answers in range of 0.144–0.162;; (if answer incorrect, allow one mark for candidates answer to (d)(ii) × 0.18 [1]); 2 1(e) any two advantages with one disadvantage OR any two disadvantages with one advantage: advantage: limestone is cheap; easy / quick; prevents death of organisms; disadvantage: changes shape of stream / could cause flooding / eq; not a long term solution / needs to be repeated / requires labour / eq; alters, food chains / food webs / habitat; it does not remove pollutants / eq; 3 Question Answer Marks 1(f)(i) any two advantages with one disadvantage OR any two disadvantages with one advantage: advantage: a long term solution; does not add any chemicals; only uses natural processes / eq; no repeat treatments needed; few pollutants enter stream; disadvantage: high initial cost; damage to area in building / eq; only suitable for some streams / ref to topography; AVP, e.g. bacteria work best, at high temperatures / only during part of the year; 3 1(f)(ii) months May, June, July, August, September; reasons: highest temperature means increased action of bacteria; (increased) enzyme activity; still plenty of water in wetland / eq so bacteria can live / eq; 3 1(f)(iii) any three from: to check, that the system worked / pollution levels / eq; at highest rainfall (May) / beginning of the hot season; and lowest rainfall (Oct) / end of the hot season; to compare results for each year / between May and October; find out if water is safe to use; 3
Q2 · The amount of coal extracted from underground mines in Tennessee has been decreasing
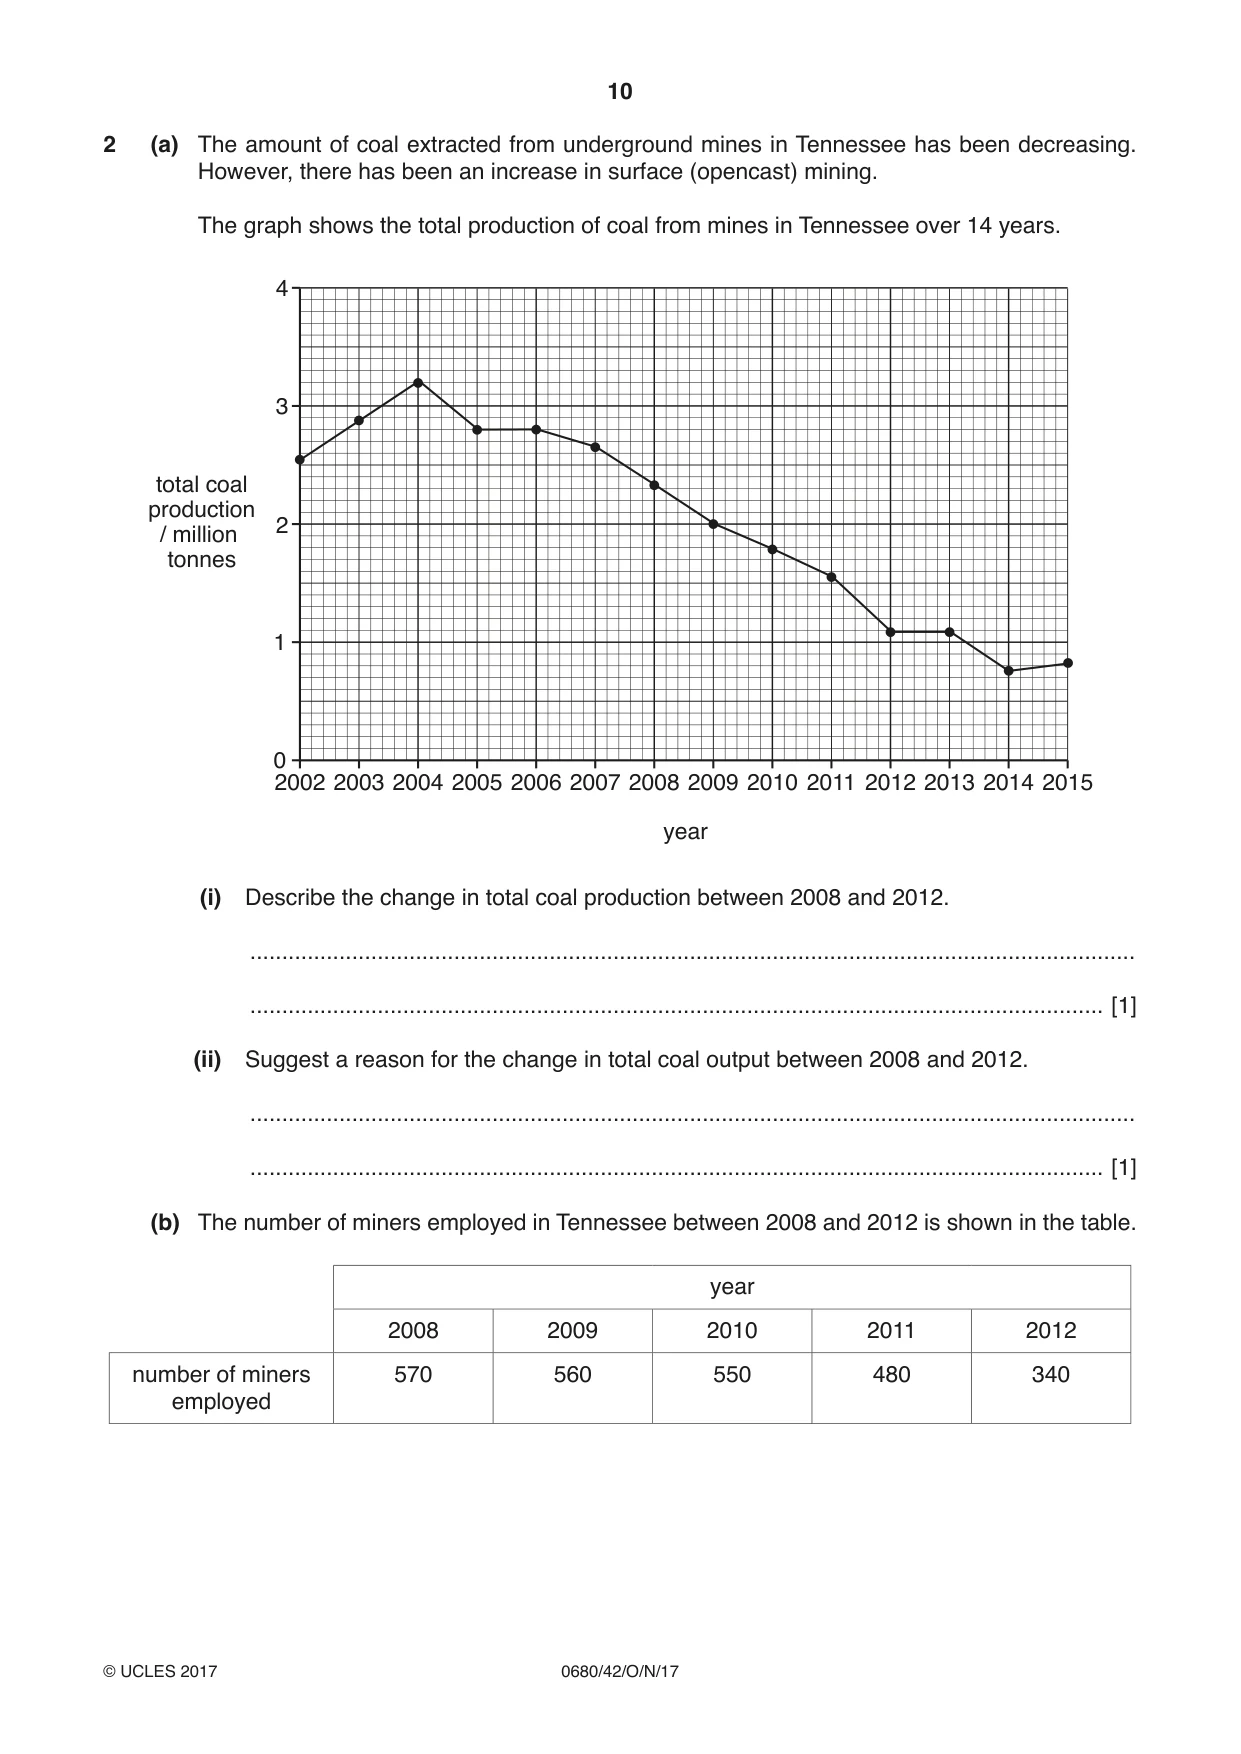
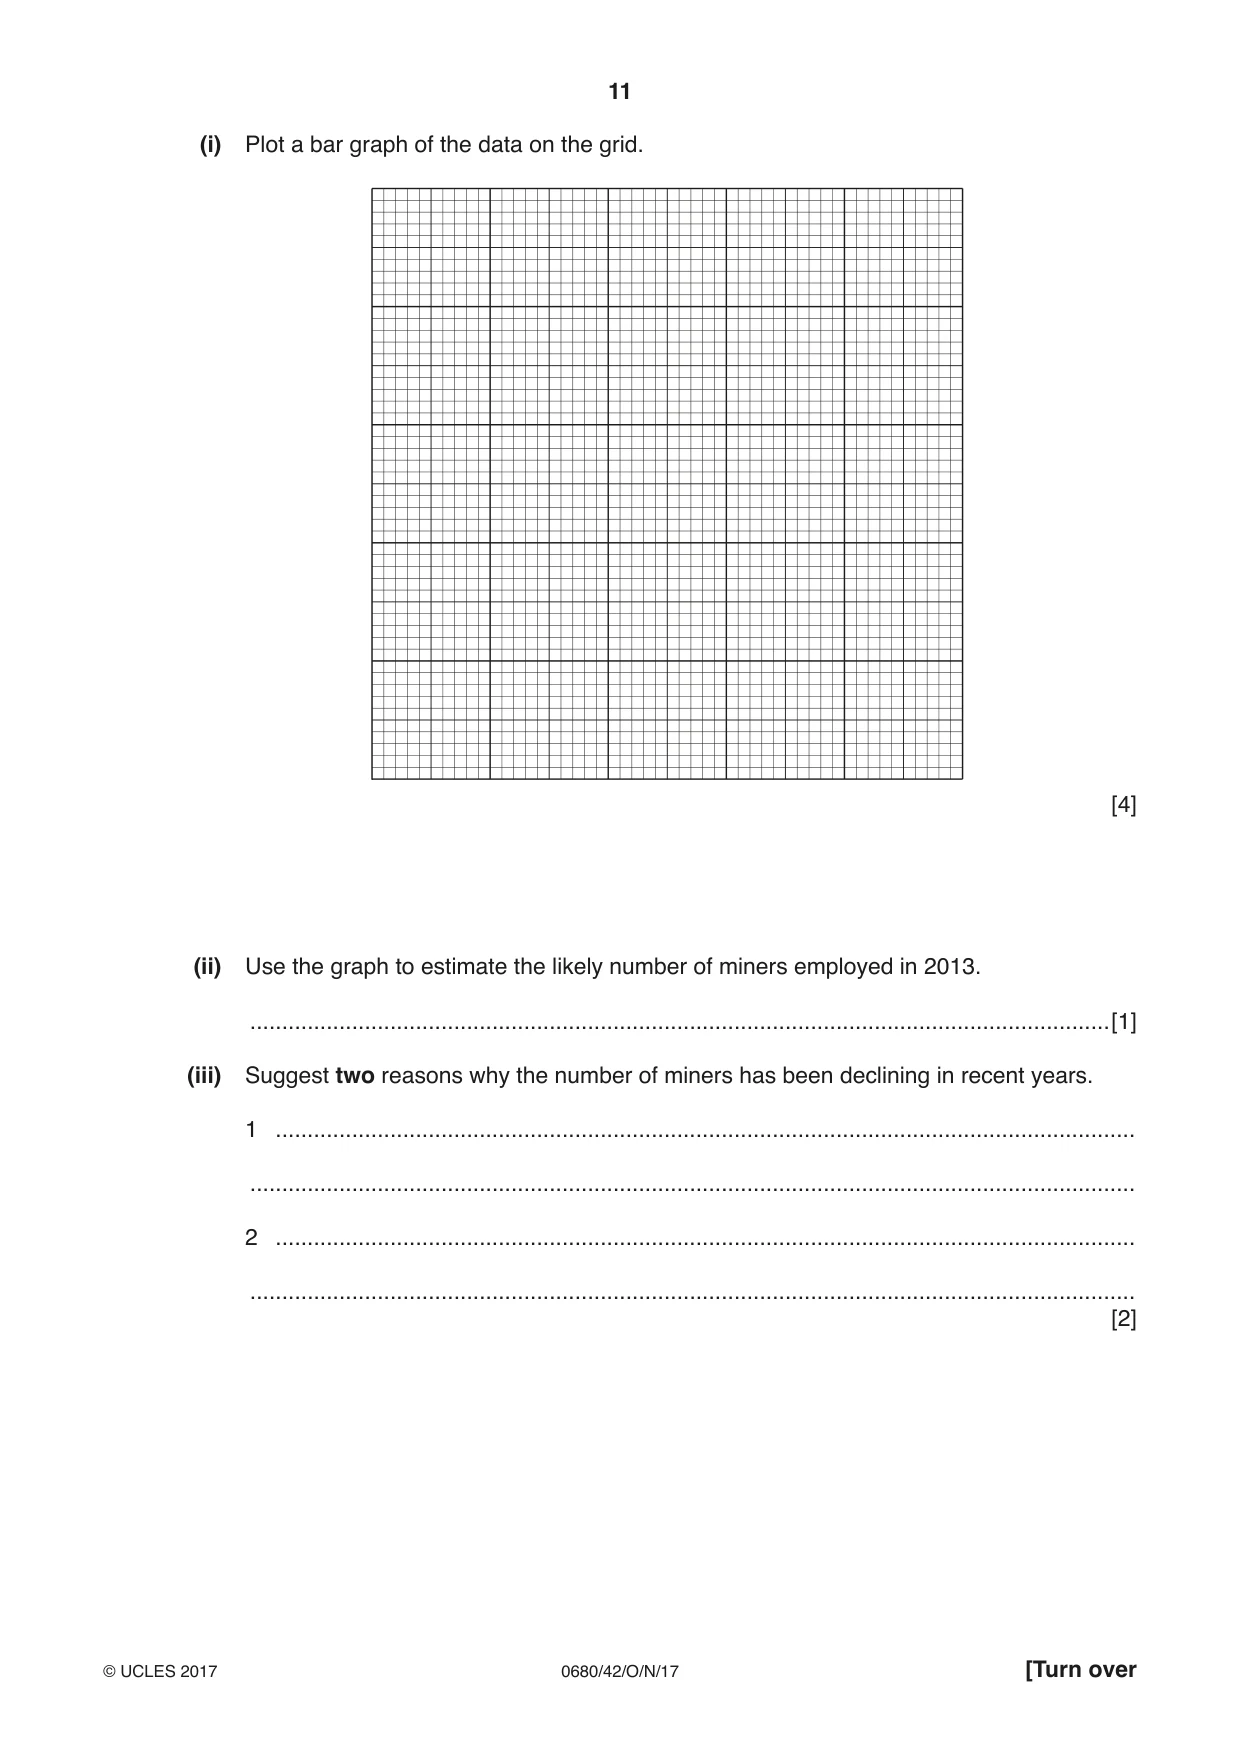
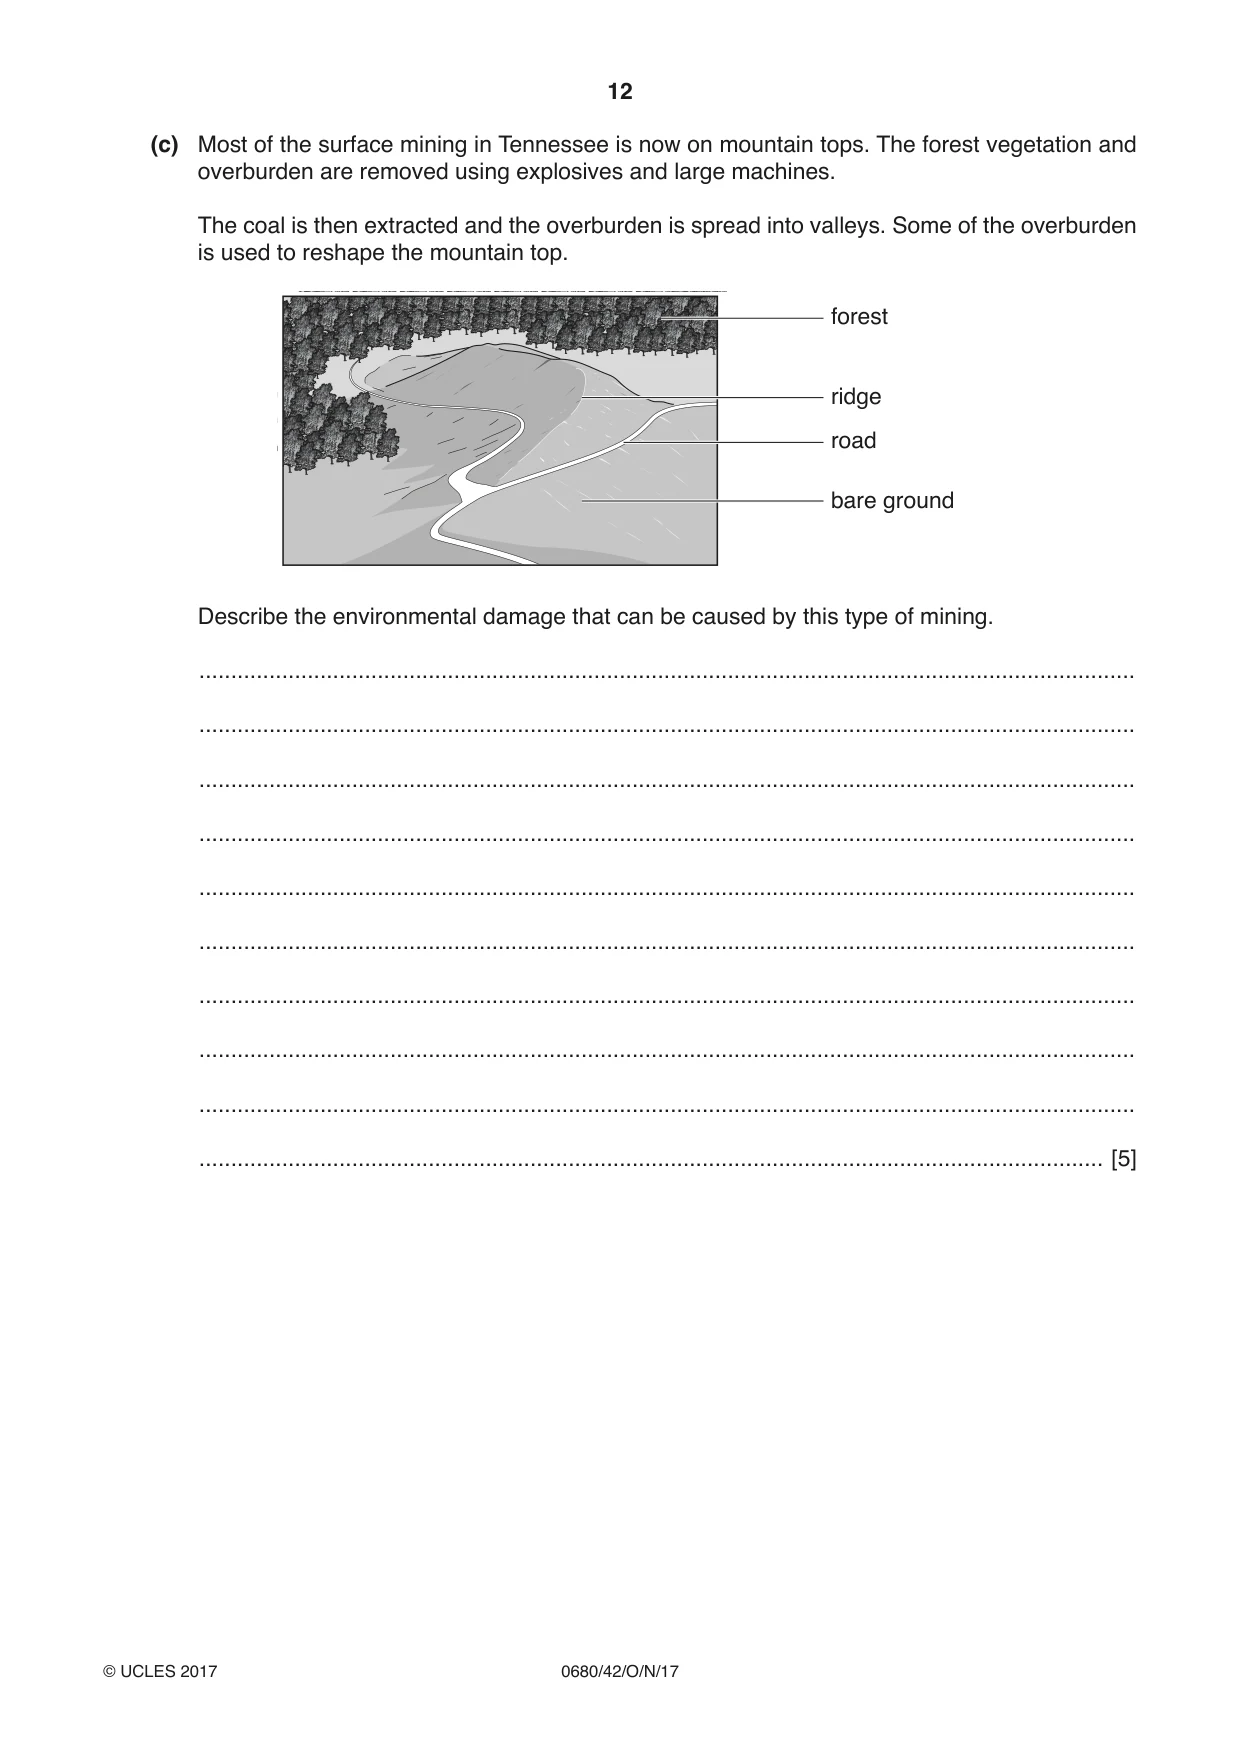
2 (a) The amount of coal extracted from underground mines in Tennessee has been decreasing. However, there has been an increase in surface (opencast) mining. The graph shows the total production of coal from mines in Tennessee over 14 years. 4 3 total coal production 2 / million tonnes 1 0 2002 2003 2004 2005 2006 2007 2008 2009 2010 2011 2012 2013 2014 2015 year (i) Describe the change in total coal production between 2008 and 2012. ........................................................................................................................................... ...................................................................................................................................... [1] (ii) Suggest a reason for the change in total coal output between 2008 and 2012. ........................................................................................................................................... ...................................................................................................................................... [1] (b) The number of miners employed in Tennessee between 2008 and 2012 is shown in the table. year 2008 2009 2010 2011 2012 number of miners 570 560 550 480 340 employed (i) Plot a bar graph of the data on the grid. [4] (ii) Use the graph to estimate the likely number of miners employed in 2013. .......................................................................................................................................[1] (iii) Suggest two reasons why the number of miners has been declining in recent years. 1 ....................................................................................................................................... ........................................................................................................................................... 2 ....................................................................................................................................... ........................................................................................................................................... [2] (c) Most of the surface mining in Tennessee is now on mountain tops. The forest vegetation and overburden are removed using explosives and large machines. The coal is then extracted and the overburden is spread into valleys. Some of the overburden is used to reshape the mountain top. forest ridge road bare ground Describe the environmental damage that can be caused by this type of mining. ................................................................................................................................................... ................................................................................................................................................... ................................................................................................................................................... ................................................................................................................................................... ................................................................................................................................................... ................................................................................................................................................... ................................................................................................................................................... ................................................................................................................................................... ................................................................................................................................................... .............................................................................................................................................. [5]
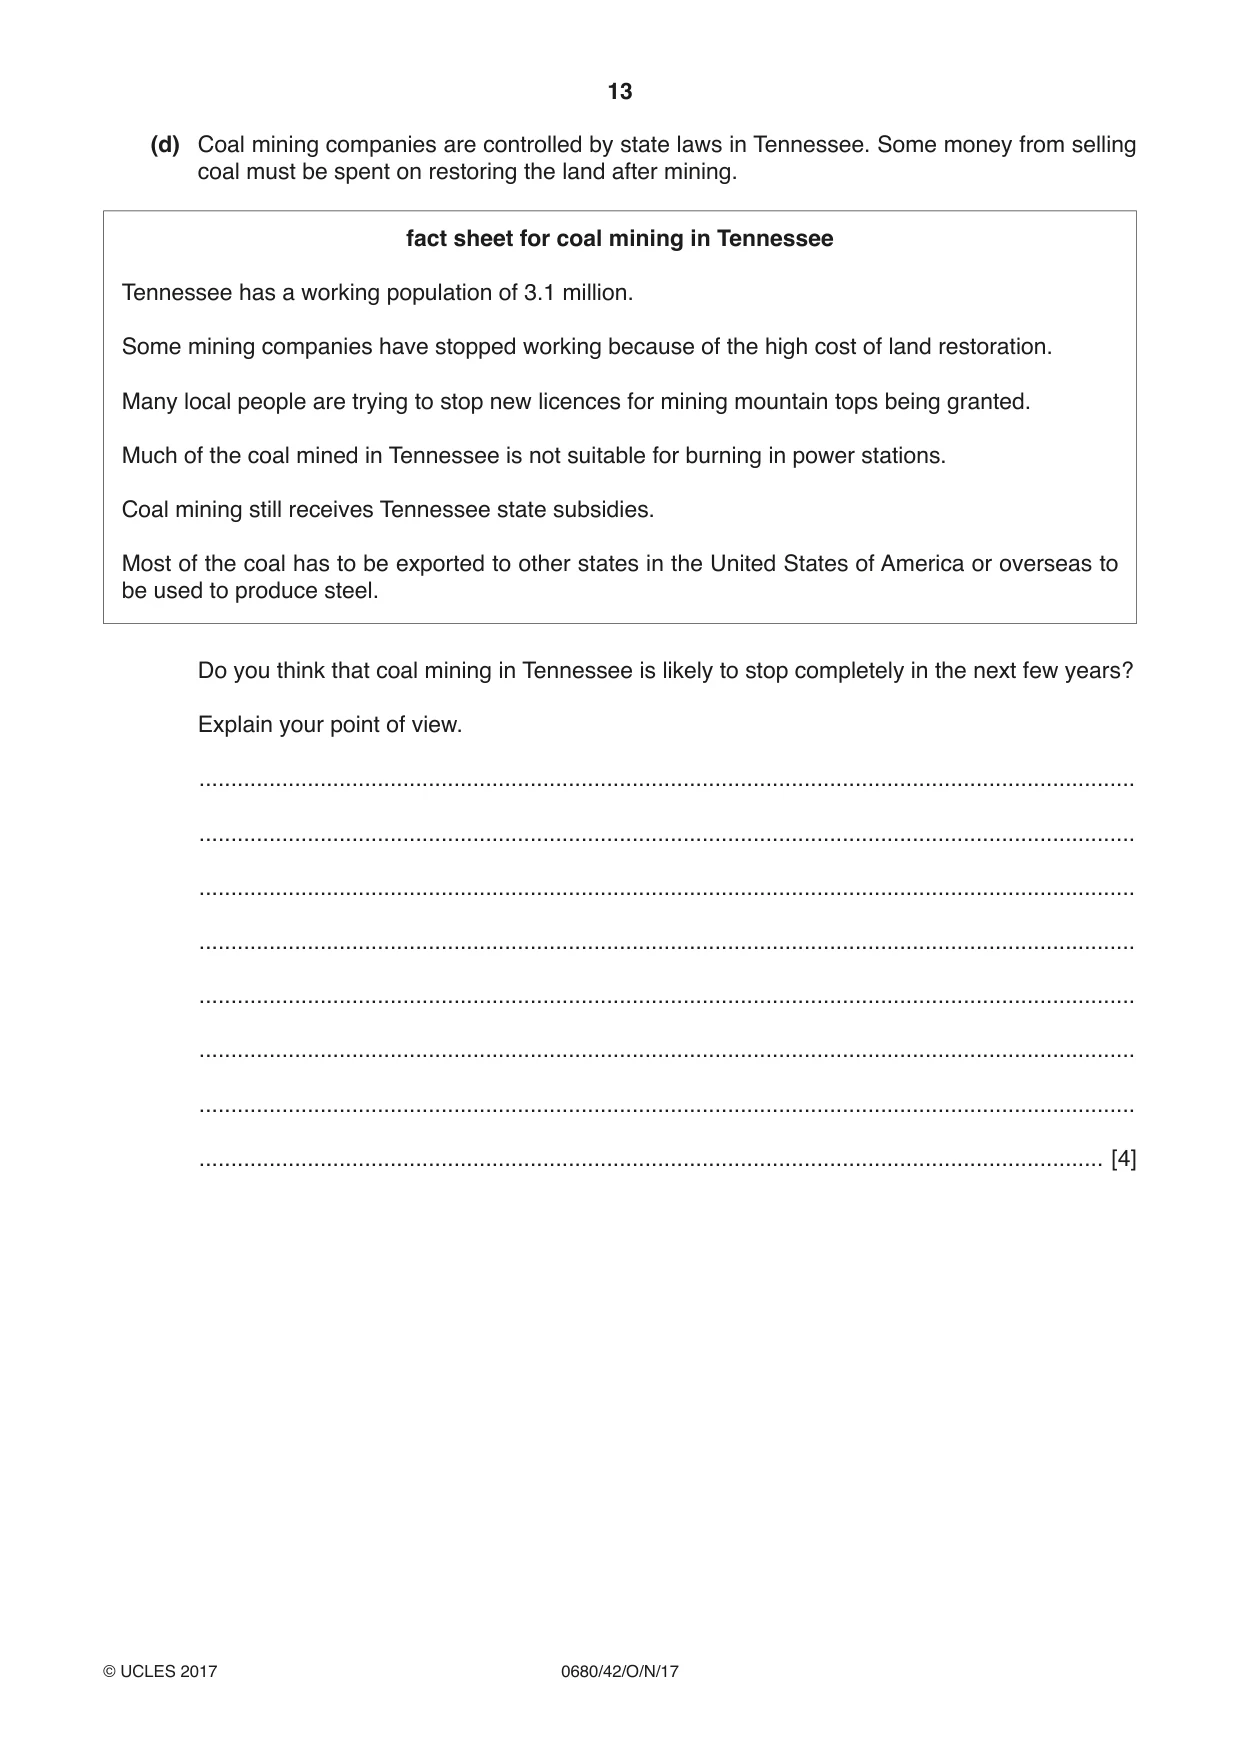
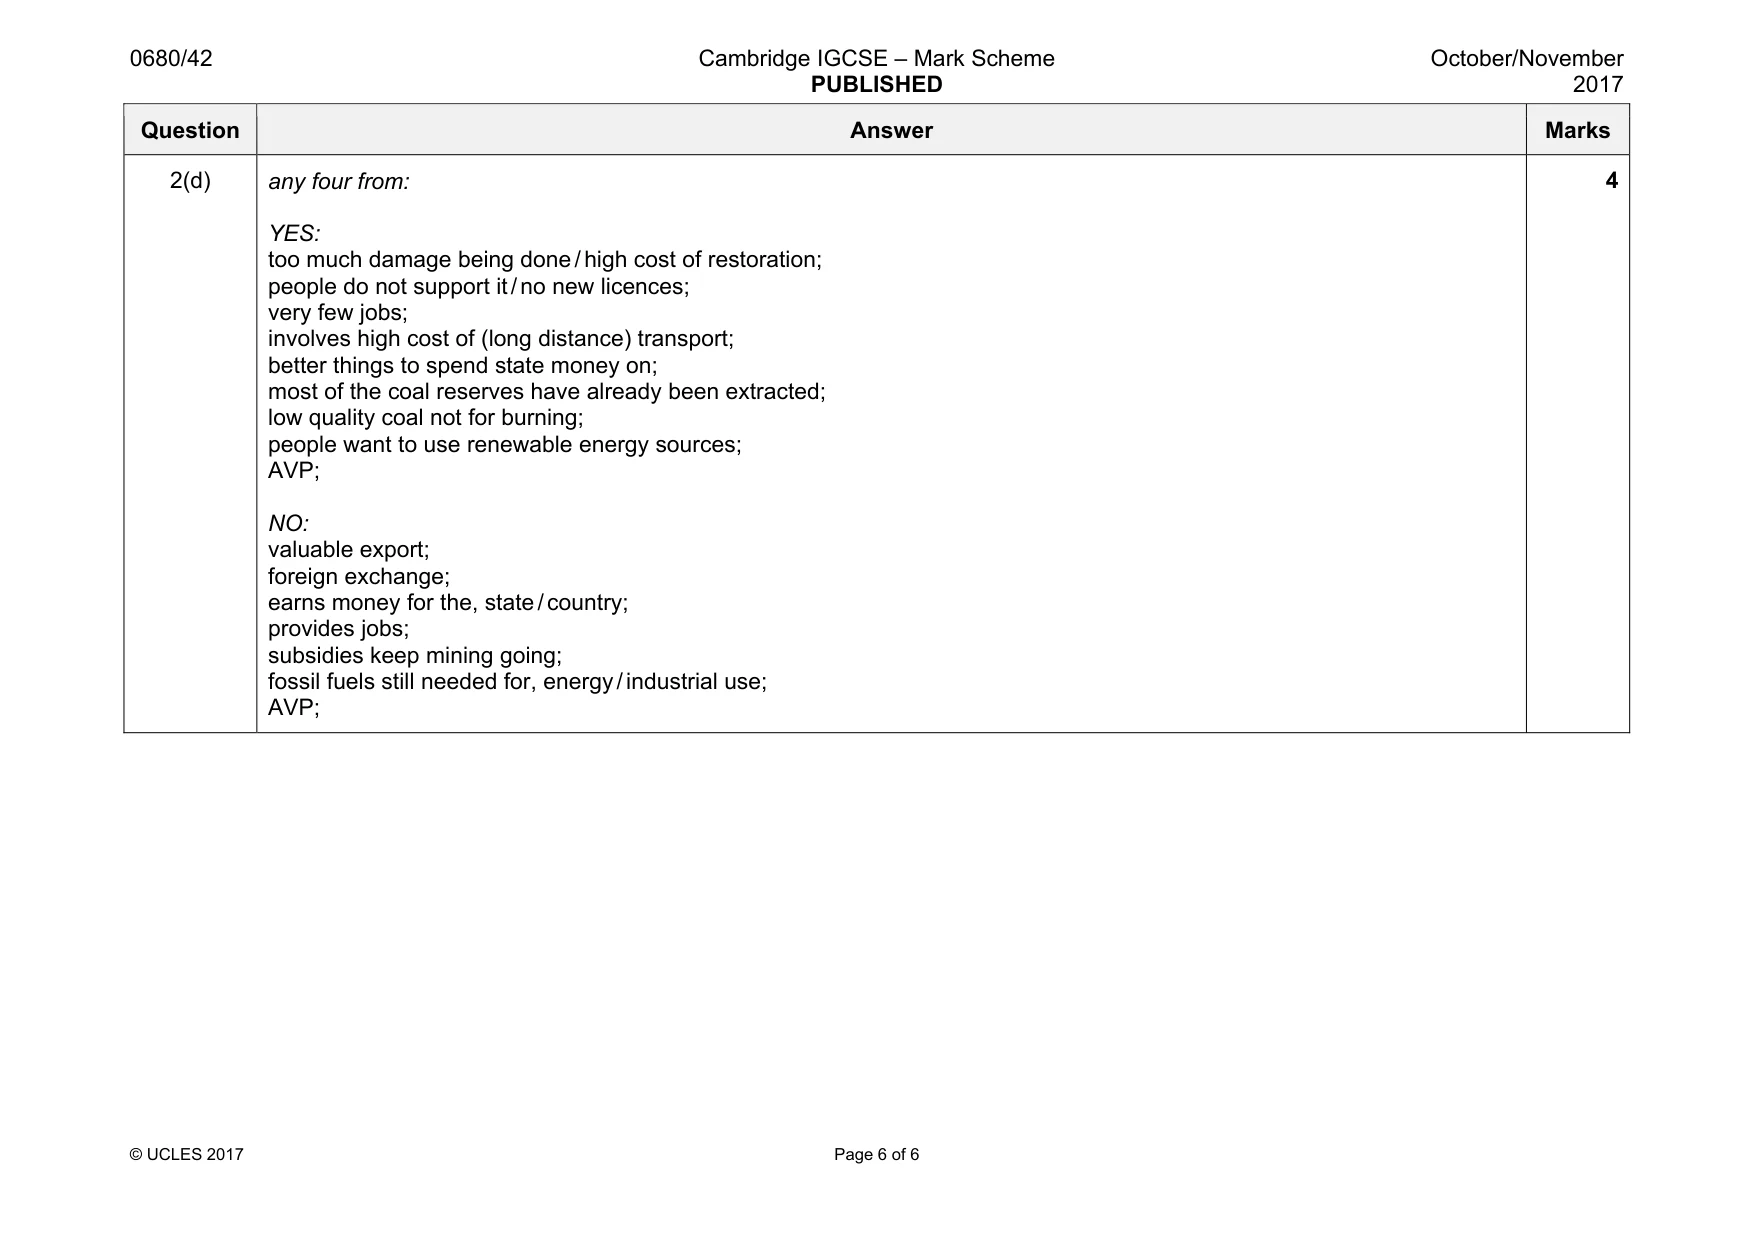
Mark scheme: 2(a)(i) coal output (steadily) decreased / use of figures to illustrate the fall in production, e.g. 2.3 to 1.1 / drop of 1.2; 1 2(a)(ii) any one from: less coal available (to be mined) / eq; fall in demand / price; change to renewable sources; AVP; 1 2(b)(i) orientation with linear scale; axes labelled: number of miners employed; year; plots correct; 4 2(b)(ii) allow answers in range of 200–340; 1 2(b)(iii) any two from: more machinery used; less coal to mine; less mines operating; miners move to other jobs, qualified; 2 2(c) any five from: loss of natural landscape; deforestation; loss of habitats; loss of biodiversity; more erosion by wind; more erosion by water; increase risk of landslides; pollution / turbidity, of streams; pollution of groundwater; air pollution; dust reduces, plant growth / photosynthesis; 5 Question Answer Marks 2(d) any four from: YES: too much damage being done / high cost of restoration; people do not support it / no new licences; very few jobs; involves high cost of (long distance) transport; better things to spend state money on; most of the coal reserves have already been extracted; low quality coal not for burning; people want to use renewable energy sources; AVP; NO: valuable export; foreign exchange; earns money for the, state / country; provides jobs; subsidies keep mining going; fossil fuels still needed for, energy / industrial use; AVP; 4
What was in this paper
The subtopics covered by these 2 questions, and how many questions each got. Open one in a new tab to see every Cambridge question on it.
What you needed in this session
Cambridge’s own grade thresholds for 2017 Oct/Nov, Paper 4 · Variant 2. A higher threshold means an easier paper — the bar moves with how the cohort did.