Cambridge IGCSE Environmental Management 0680 — 2017 May/June Paper 2 · Variant 2
0680/22/M/J/17 · 2 questions · 80 marks · ≈90 min
The question paper and its mark scheme, free to read here and free to download. This is Cambridge’s own paper, exactly as it was sat.
Question paper16 pages


Mark scheme10 pages
Answers below. Sit the paper first if you are practising.
Questions as text
Q1 · Name the types of rock formed by each of the following: heat and/or pressure deep in the…
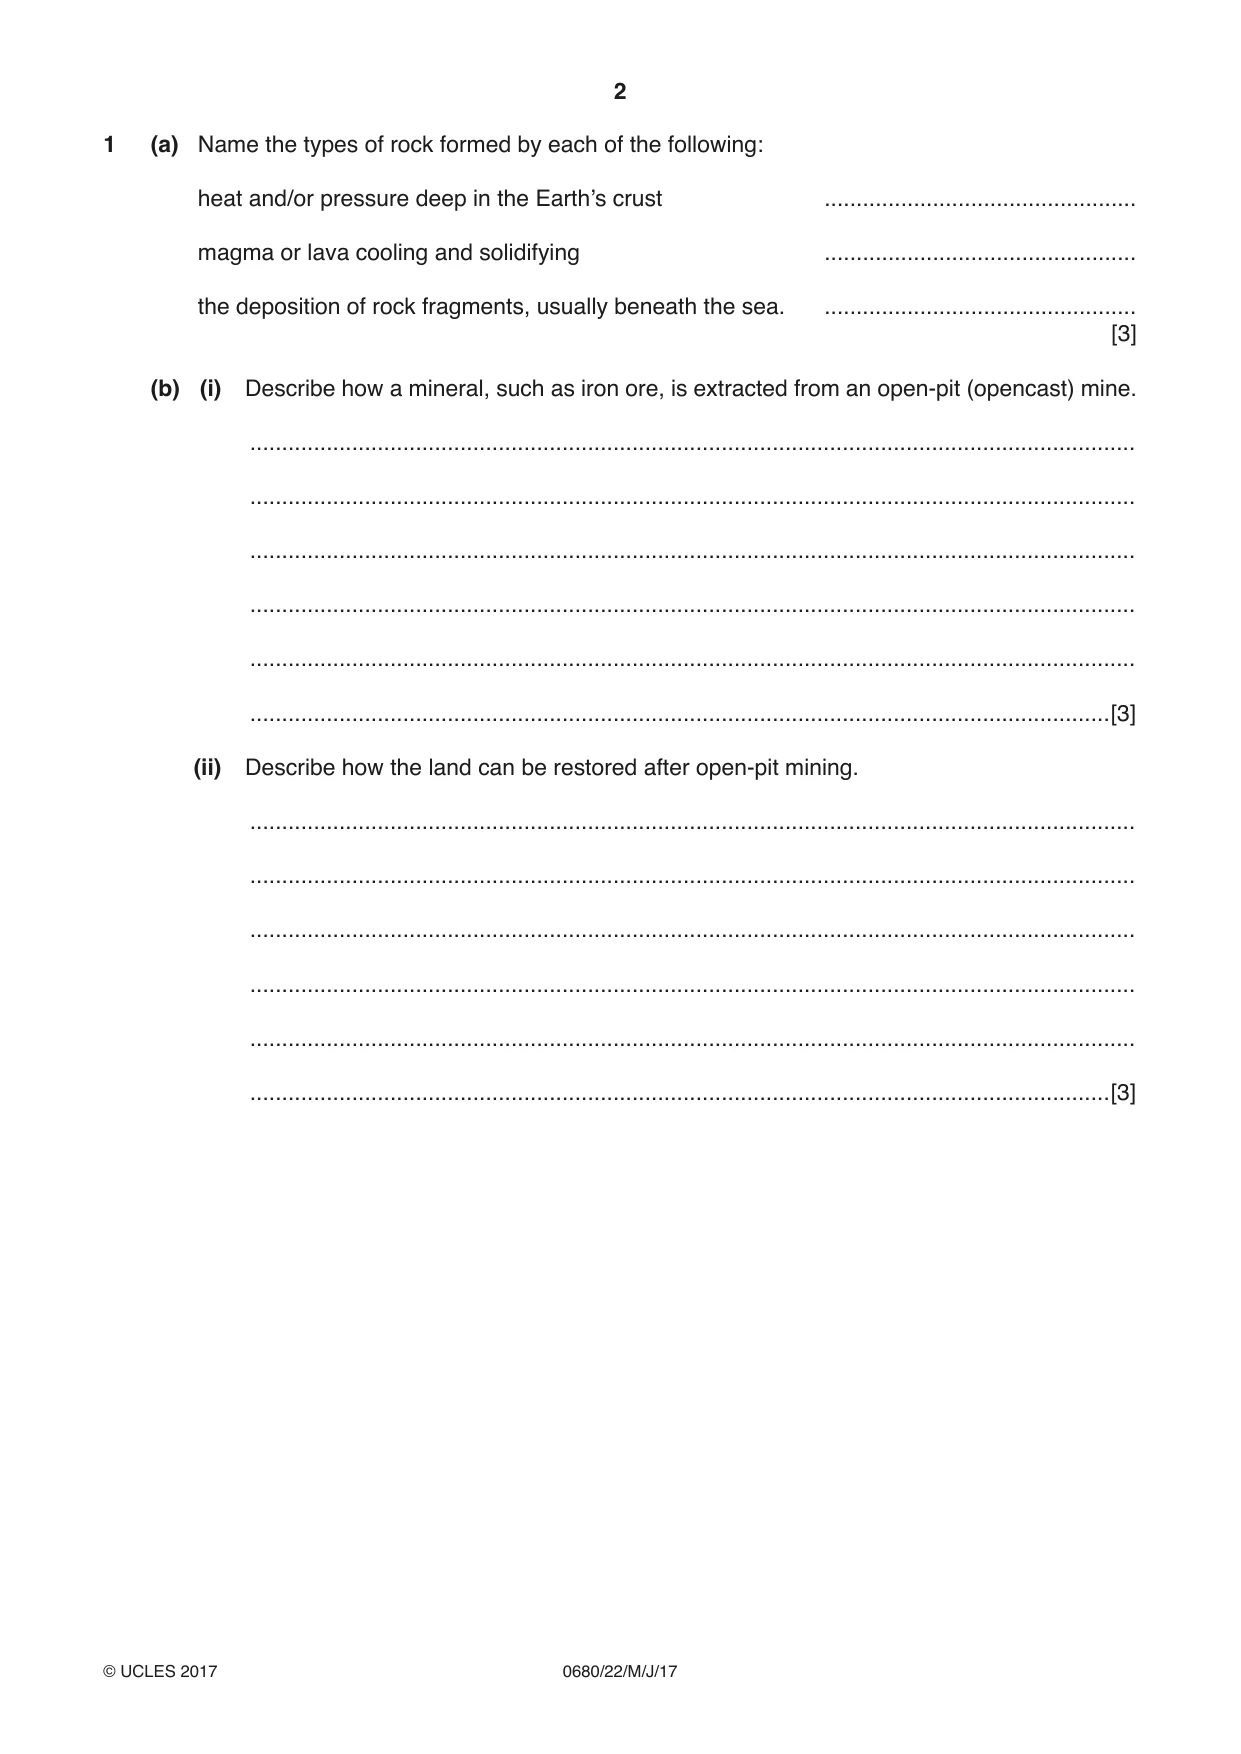
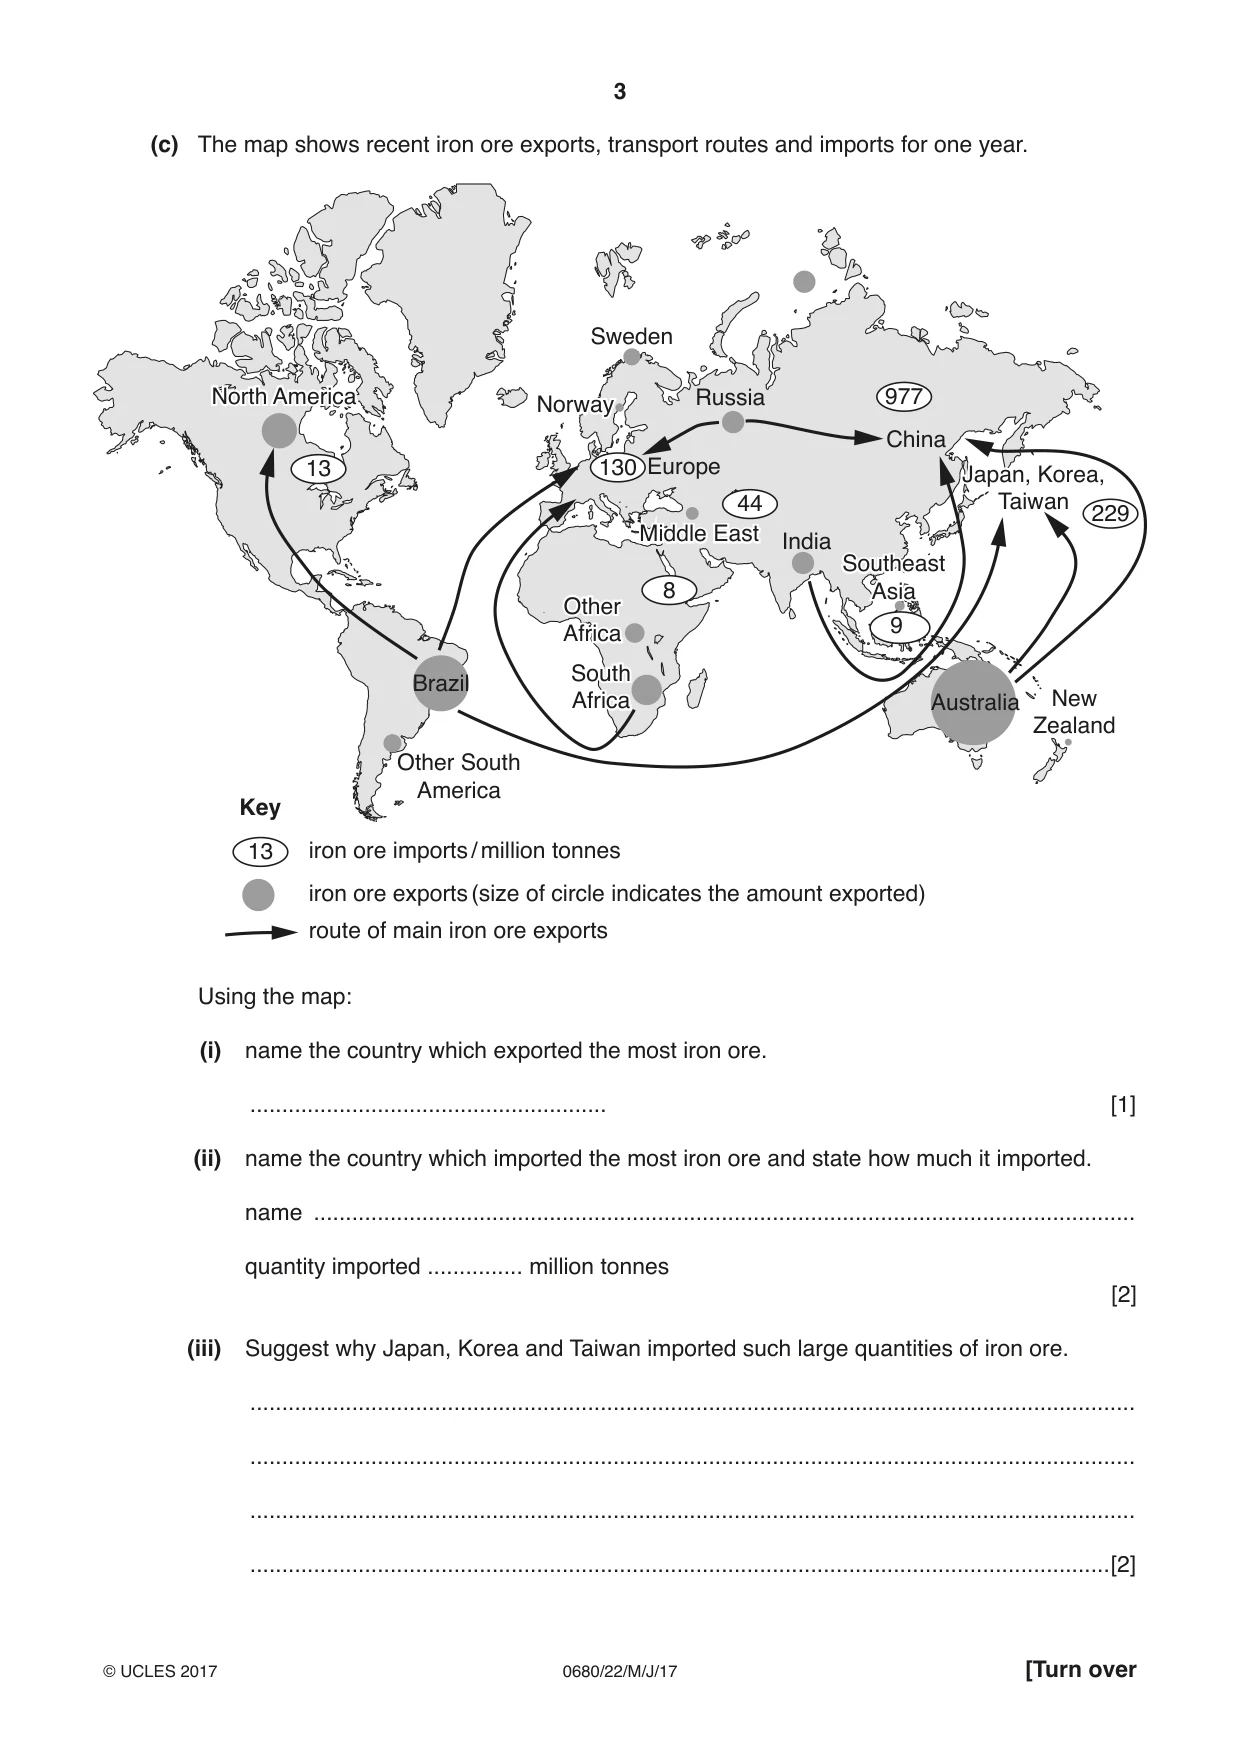
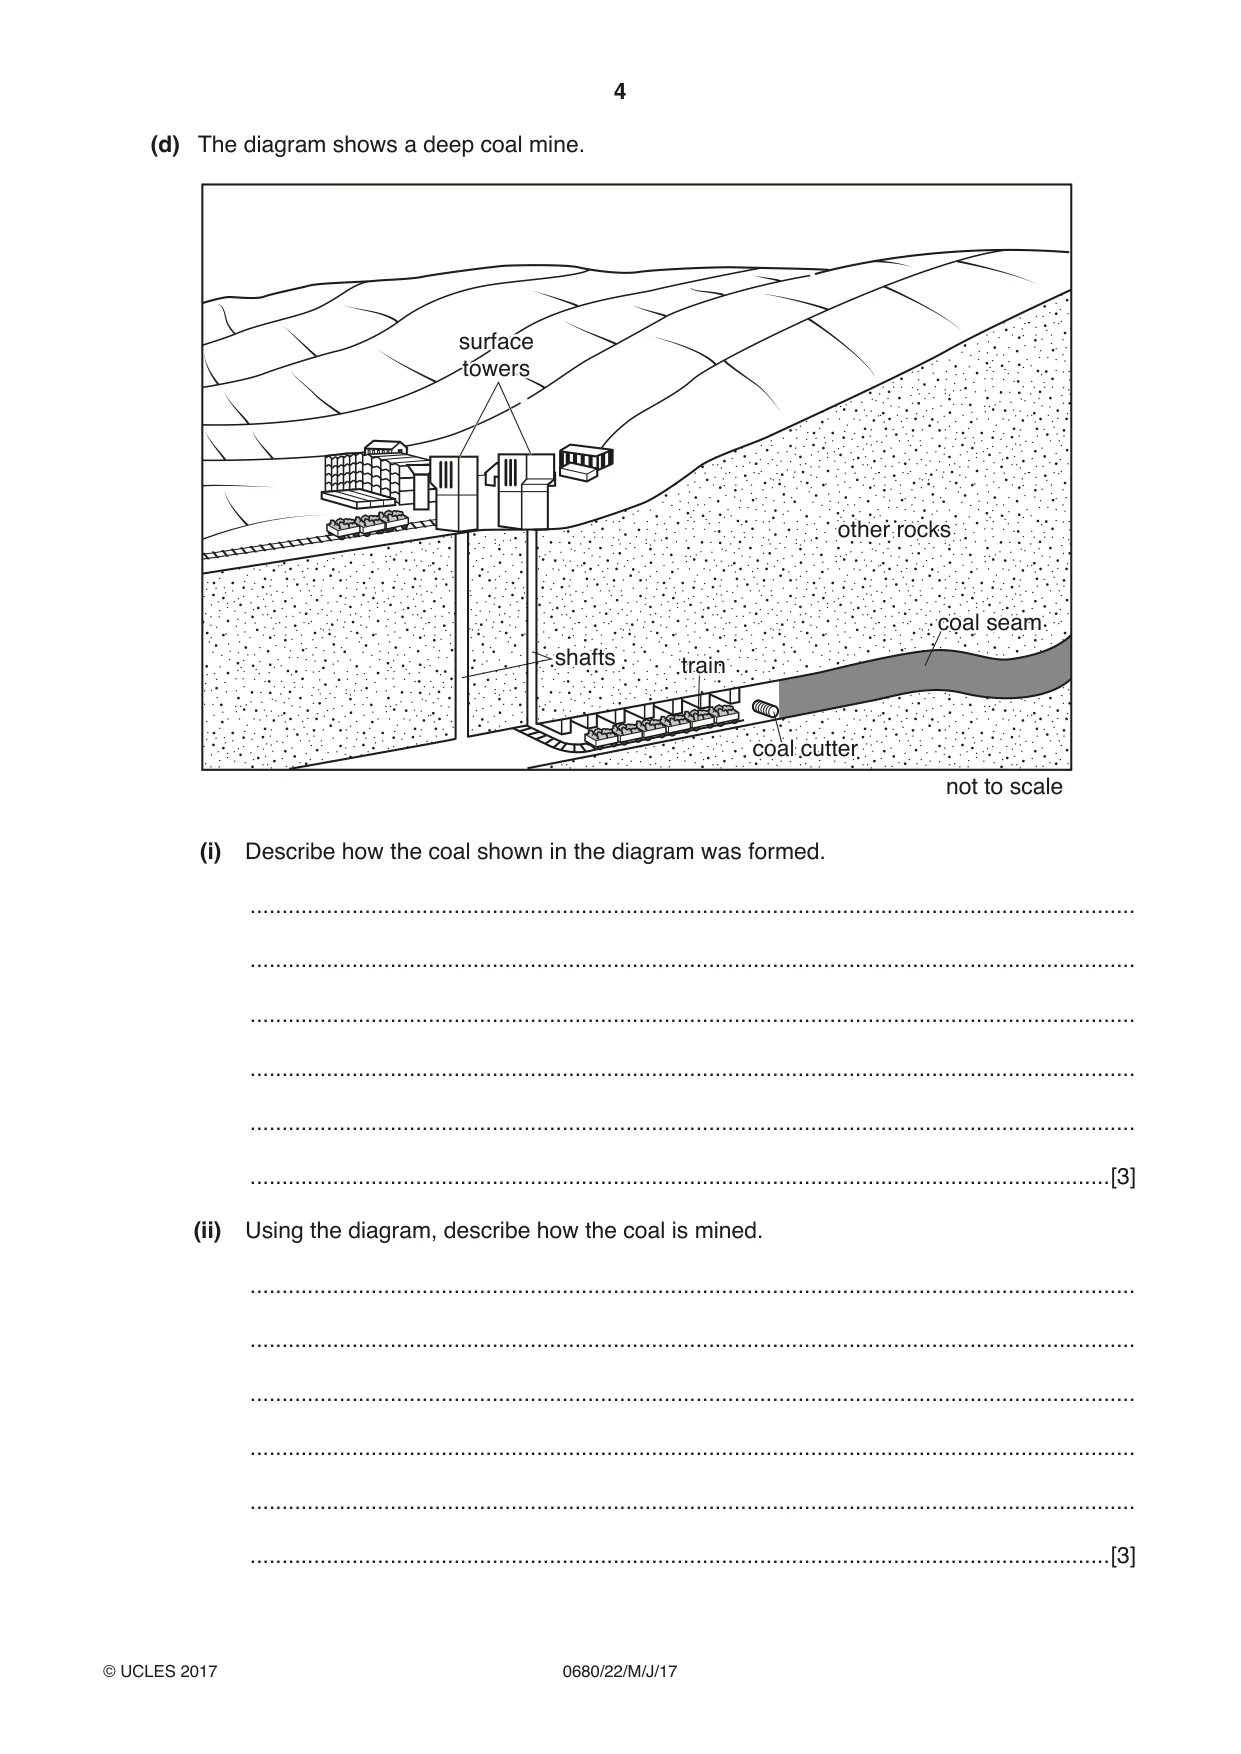
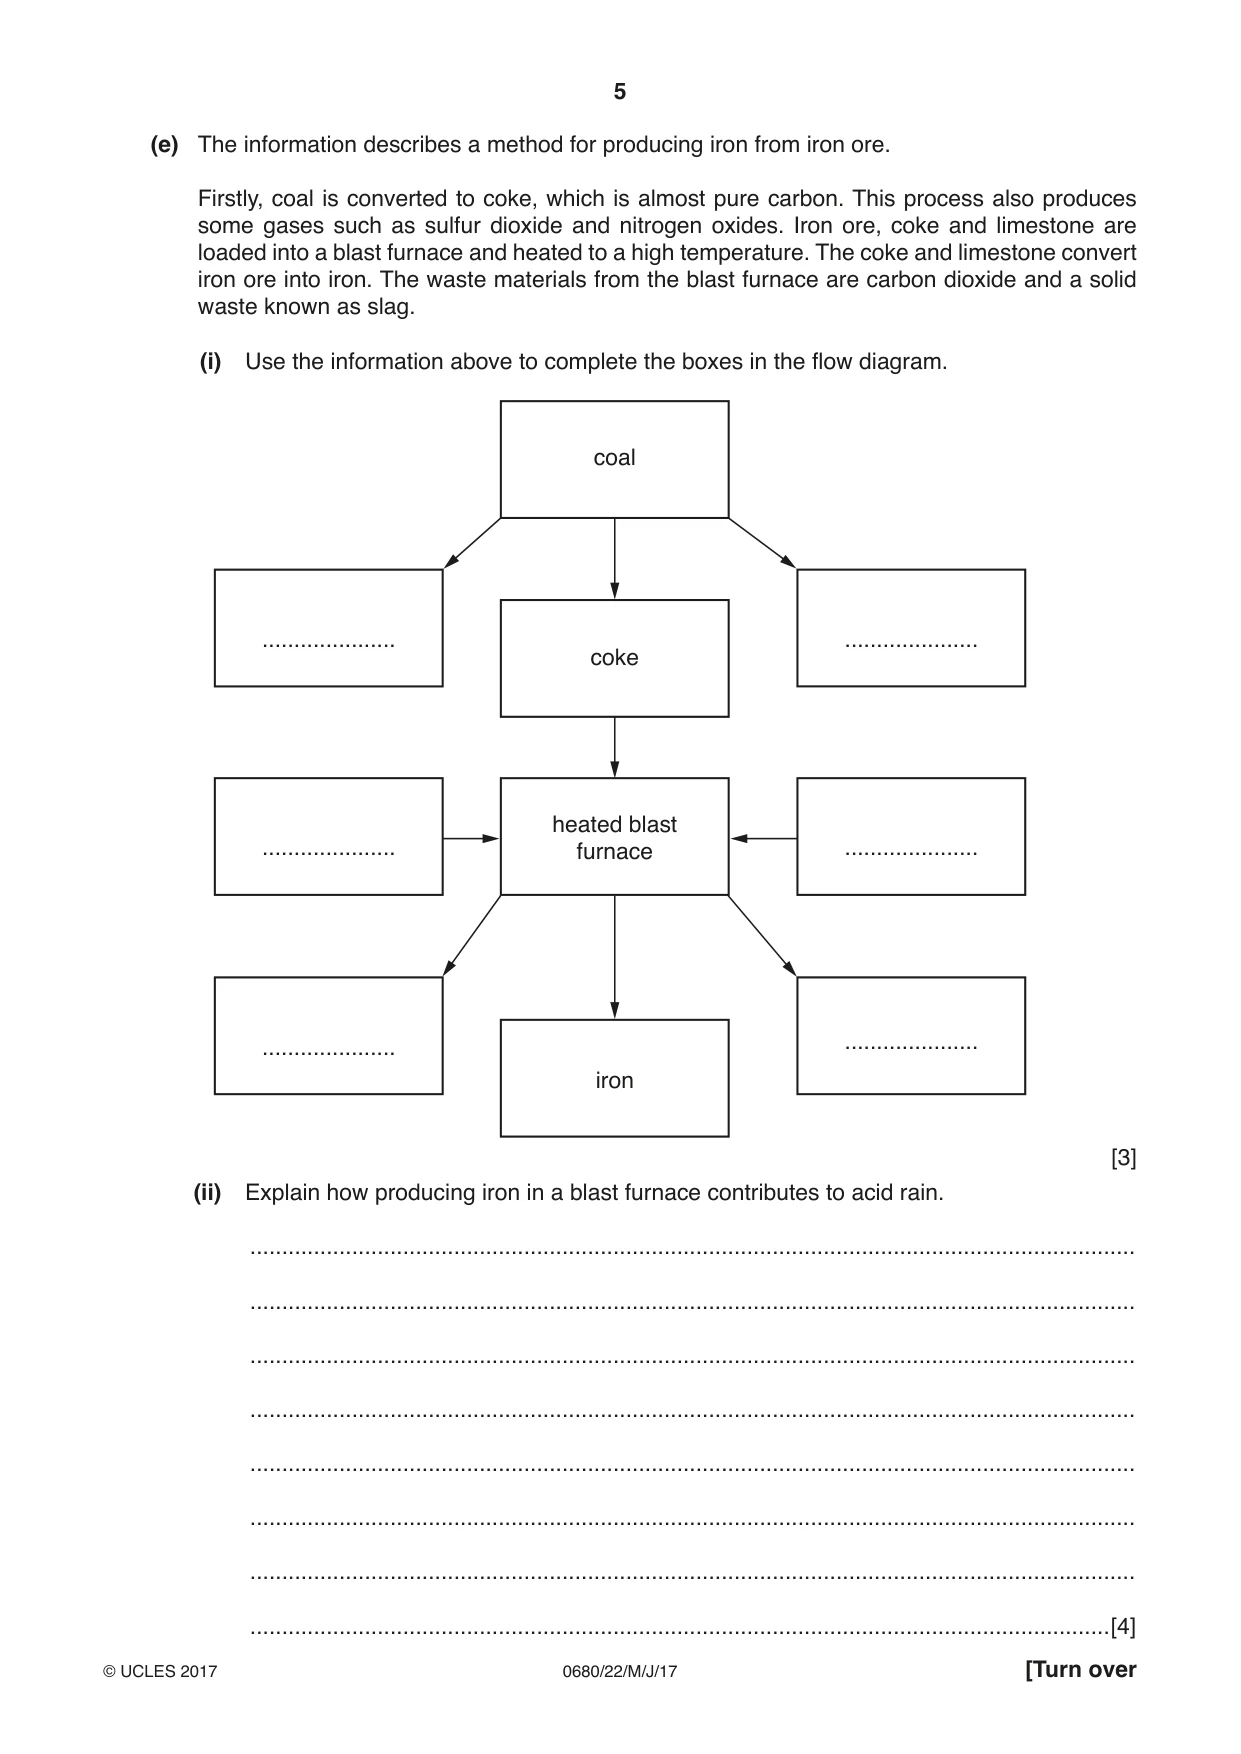
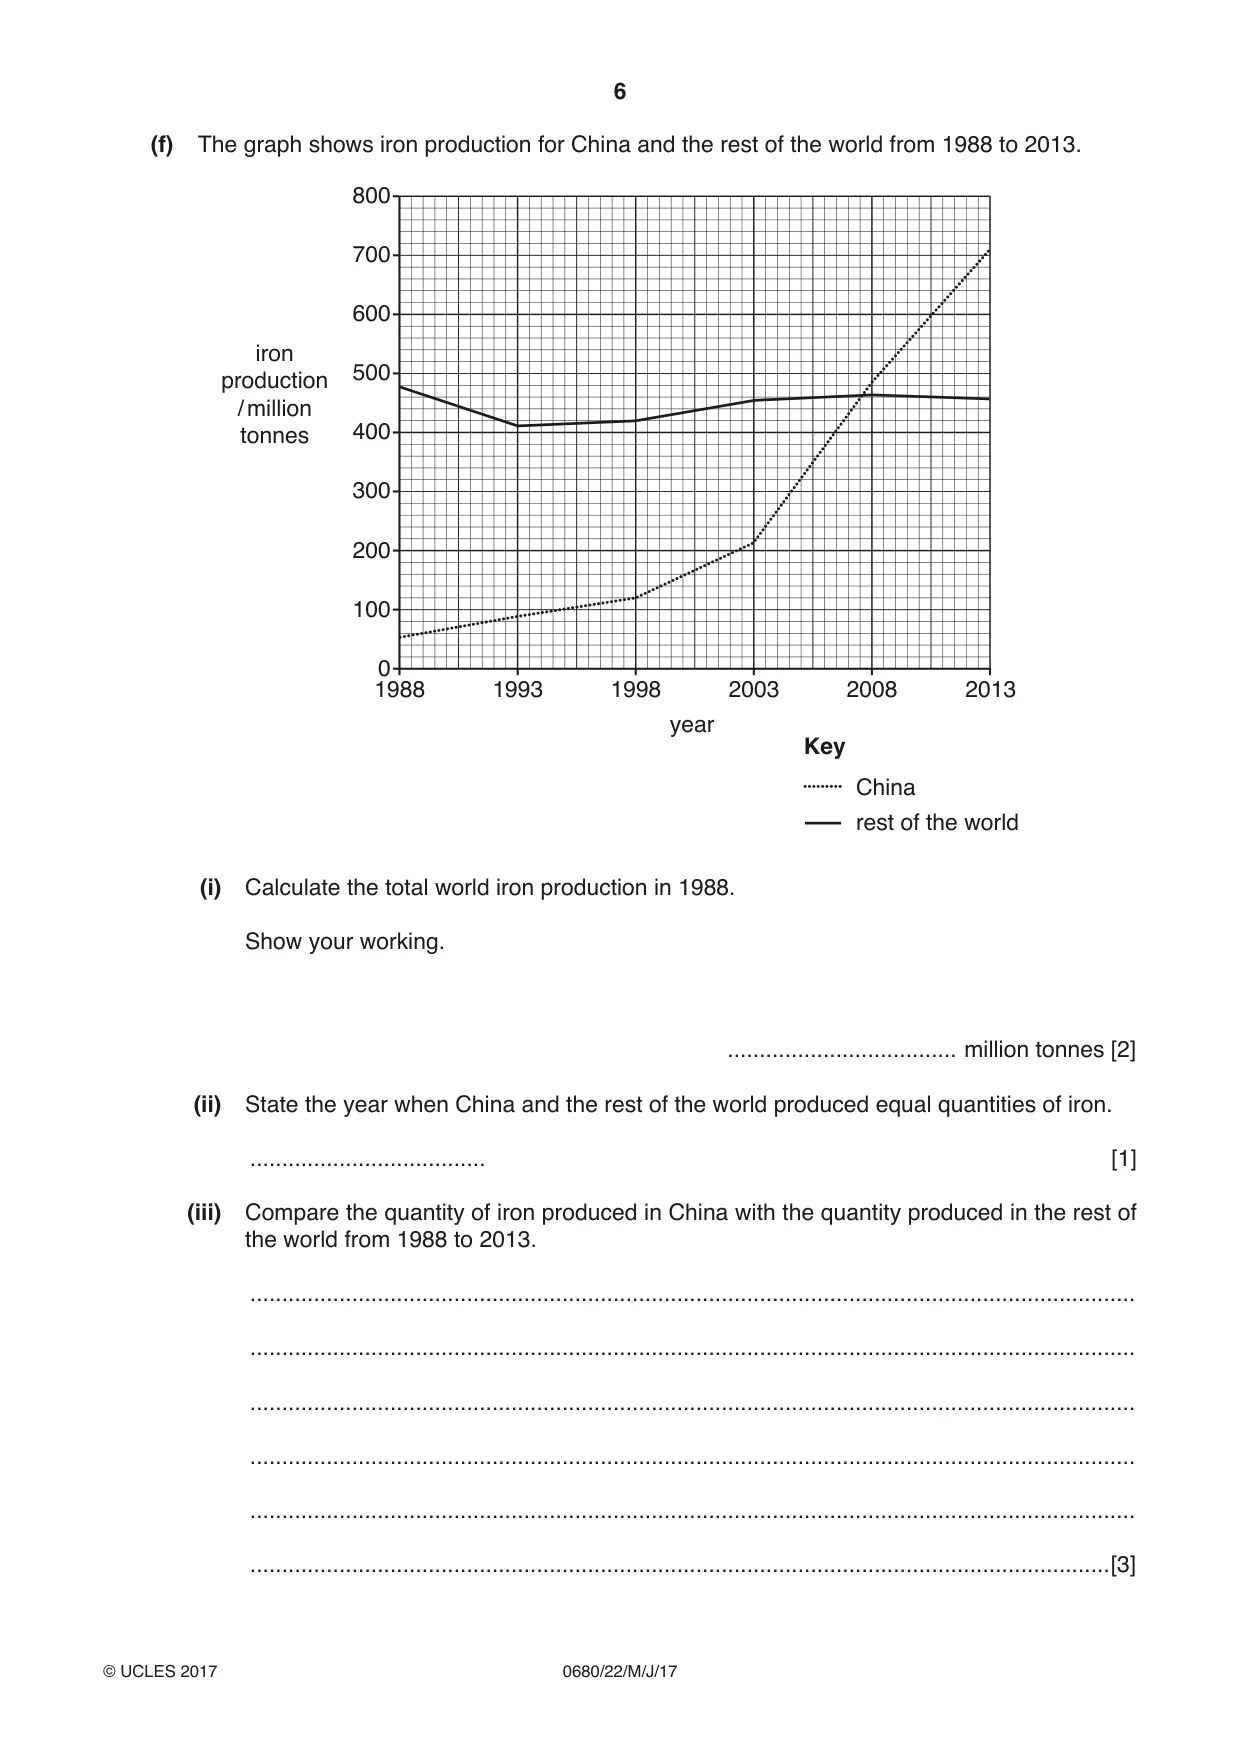
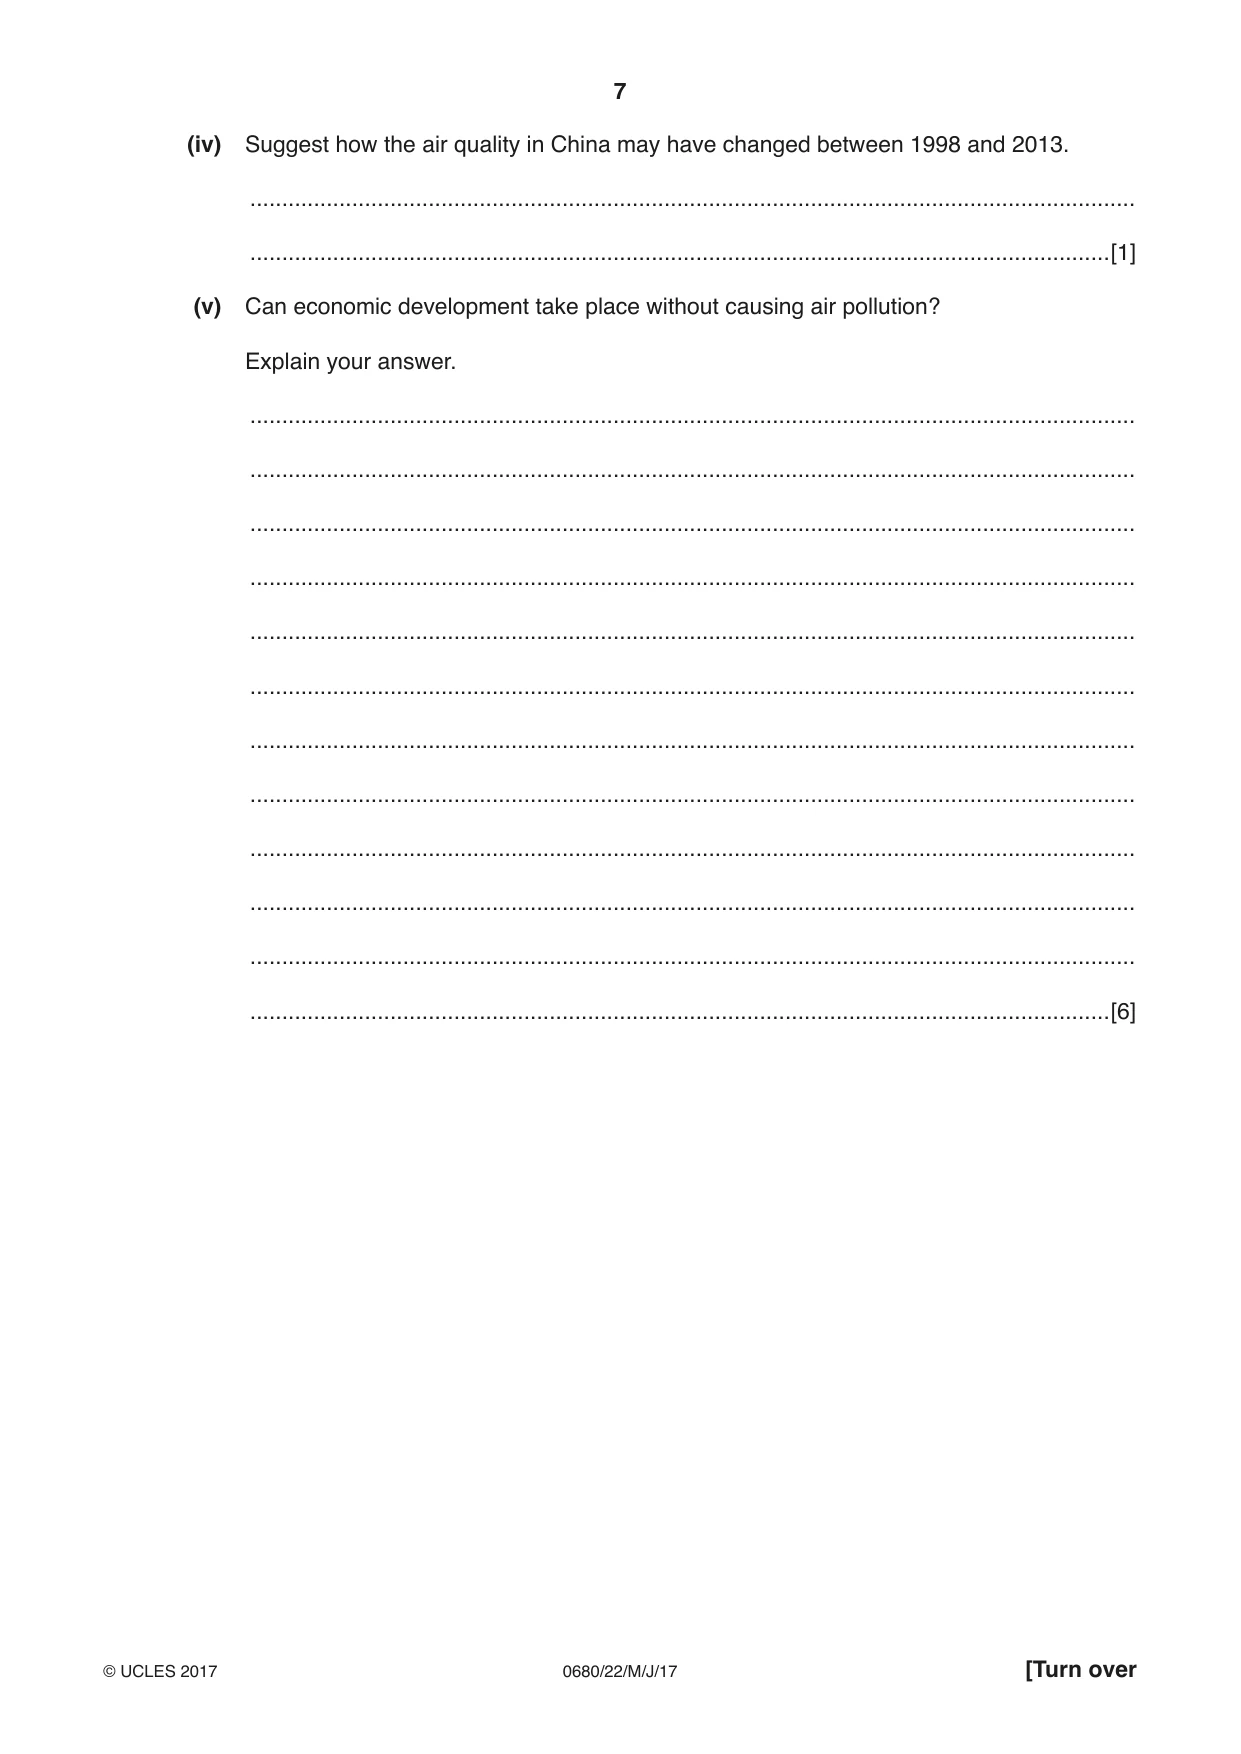
1 (a) Name the types of rock formed by each of the following: heat and/or pressure deep in the Earth’s crust ................................................. magma or lava cooling and solidifying ................................................. the deposition of rock fragments, usually beneath the sea. ................................................. [3] (b) (i) Describe how a mineral, such as iron ore, is extracted from an open-pit (opencast) mine. ........................................................................................................................................... ........................................................................................................................................... ........................................................................................................................................... ........................................................................................................................................... ........................................................................................................................................... .......................................................................................................................................[3] (ii) Describe how the land can be restored after open-pit mining. ........................................................................................................................................... ........................................................................................................................................... ........................................................................................................................................... ........................................................................................................................................... ........................................................................................................................................... .......................................................................................................................................[3] (c) The map shows recent iron ore exports, transport routes and imports for one year. Sweden NorthNorth AmericaAmerica Russia 977 NorwayNorway China 13 130 Europe Japan,Japan, Korea,Korea, 44 TaiwanTaiwan 229 MiddleMiddle EastEast India SoutheastSoutheast 8 AsiaAsia OtherOther 9 AfricaAfrica SouthSouth Brazil AfricaAfrica Australia New Zealand Other South America Key 13 iron ore imports / million tonnes iron ore exports (size of circle indicates the amount exported) route of main iron ore exports Using the map: (i) name the country which exported the most iron ore. ........................................................ [1] (ii) name the country which imported the most iron ore and state how much it imported. name ................................................................................................................................. quantity imported ............... million tonnes [2] (iii) Suggest why Japan, Korea and Taiwan imported such large quantities of iron ore. ........................................................................................................................................... ........................................................................................................................................... ........................................................................................................................................... .......................................................................................................................................[2] (d) The diagram shows a deep coal mine. surfacesurface towerstowers otherother rocksrocks coalcoal seamseam shaftsshafts traintrain coalcoal cuttercutter not to scale (i) Describe how the coal shown in the diagram was formed. ........................................................................................................................................... ........................................................................................................................................... ........................................................................................................................................... ........................................................................................................................................... ........................................................................................................................................... .......................................................................................................................................[3] (ii) Using the diagram, describe how the coal is mined. ........................................................................................................................................... ........................................................................................................................................... ........................................................................................................................................... ........................................................................................................................................... ........................................................................................................................................... .......................................................................................................................................[3] (e) The information describes a method for producing iron from iron ore. Firstly, coal is converted to coke, which is almost pure carbon. This process also produces some gases such as sulfur dioxide and nitrogen oxides. Iron ore, coke and limestone are loaded into a blast furnace and heated to a high temperature. The coke and limestone convert iron ore into iron. The waste materials from the blast furnace are carbon dioxide and a solid waste known as slag. (i) Use the information above to complete the boxes in the flow diagram. coal ..................... ..................... coke heated blast ..................... furnace ..................... ..................... ..................... iron [3] (ii) Explain how producing iron in a blast furnace contributes to acid rain. ........................................................................................................................................... ........................................................................................................................................... ........................................................................................................................................... ........................................................................................................................................... ........................................................................................................................................... ........................................................................................................................................... ........................................................................................................................................... .......................................................................................................................................[4] (f) The graph shows iron production for China and the rest of the world from 1988 to 2013. 800 700 600 iron 500 production / million tonnes 400 300 200 100 0 1988 1993 1998 2003 2008 2013 year Key China rest of the world (i) Calculate the total world iron production in 1988. Show your working. .................................... million tonnes [2] (ii) State the year when China and the rest of the world produced equal quantities of iron. ..................................... [1] (iii) Compare the quantity of iron produced in China with the quantity produced in the rest of the world from 1988 to 2013. ........................................................................................................................................... ........................................................................................................................................... ........................................................................................................................................... ........................................................................................................................................... ........................................................................................................................................... .......................................................................................................................................[3] (iv) Suggest how the air quality in China may have changed between 1998 and 2013. ........................................................................................................................................... .......................................................................................................................................[1] (v) Can economic development take place without causing air pollution? Explain your answer. ........................................................................................................................................... ........................................................................................................................................... ........................................................................................................................................... ........................................................................................................................................... ........................................................................................................................................... ........................................................................................................................................... ........................................................................................................................................... ........................................................................................................................................... ........................................................................................................................................... ........................................................................................................................................... ........................................................................................................................................... .......................................................................................................................................[6]
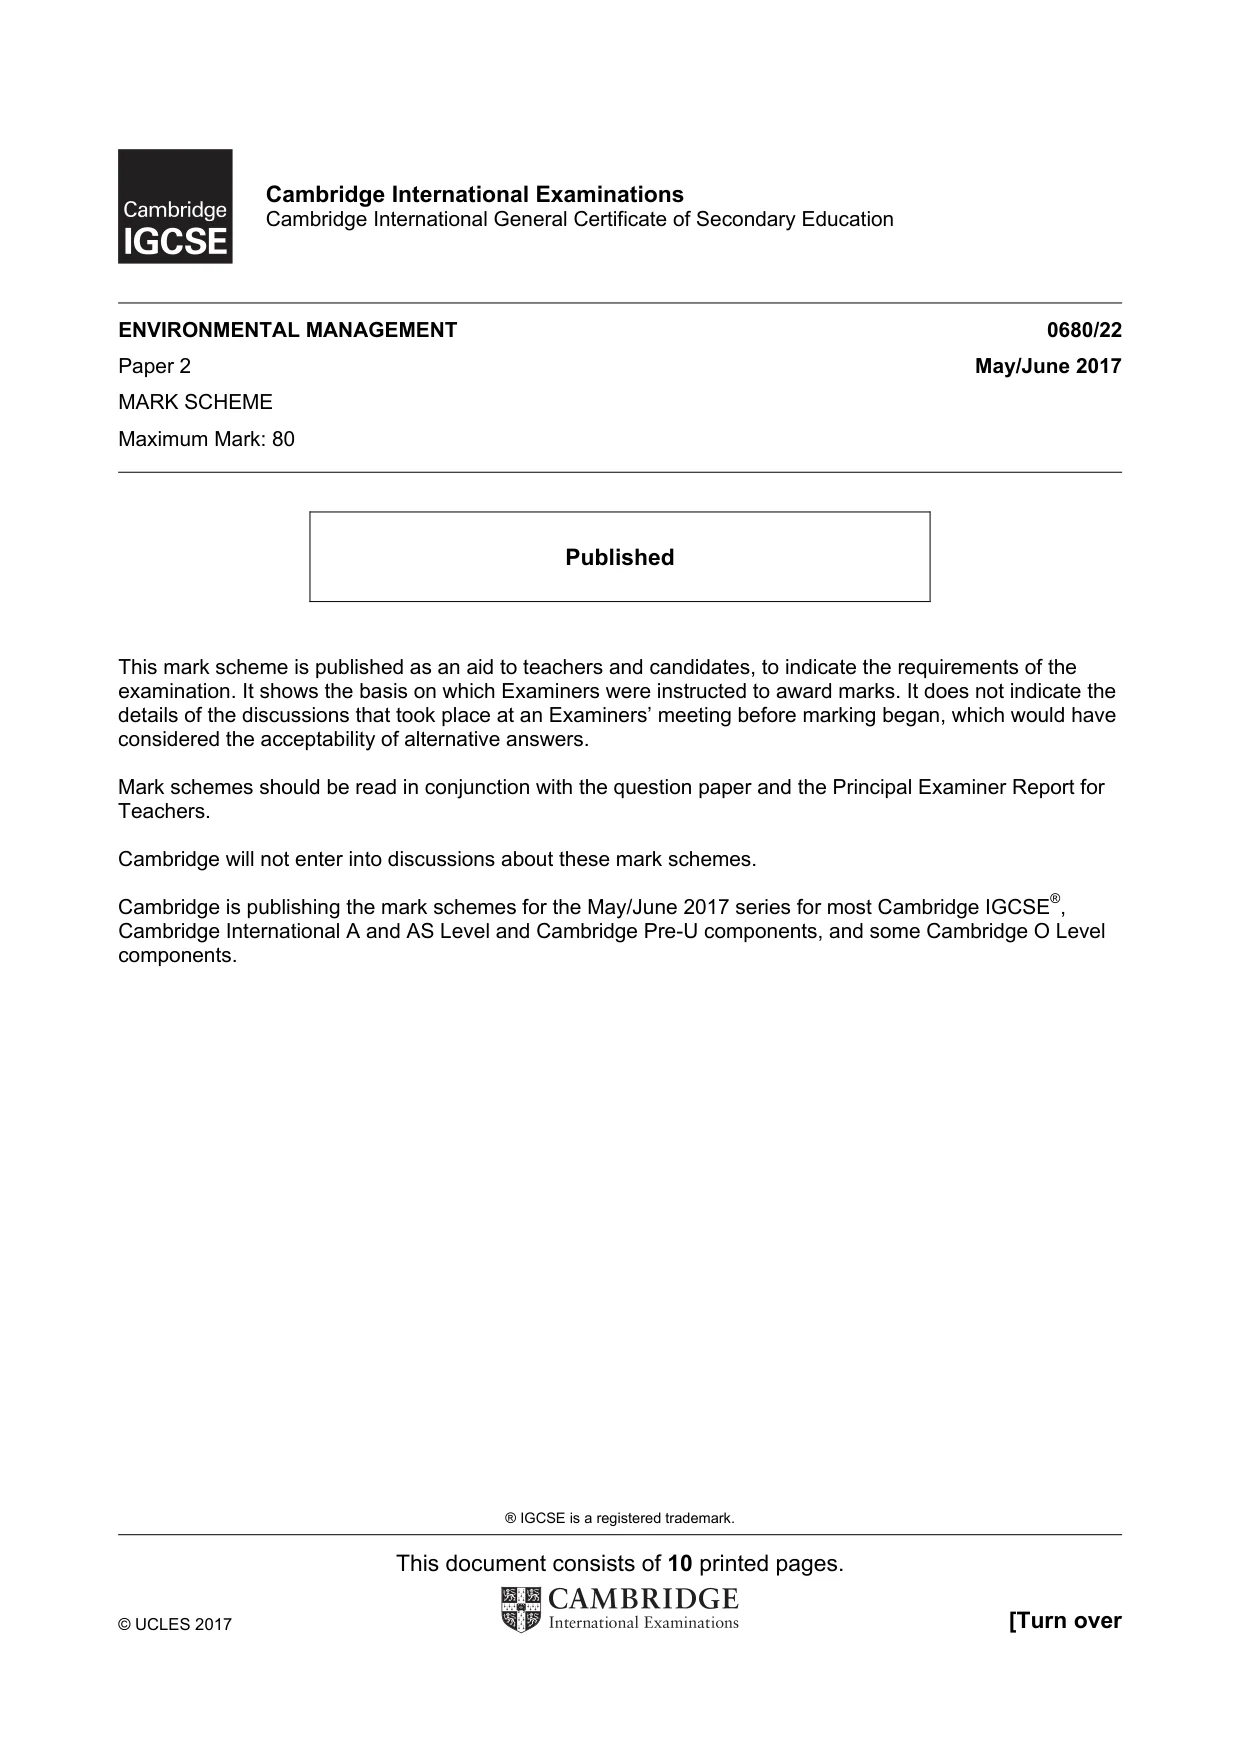
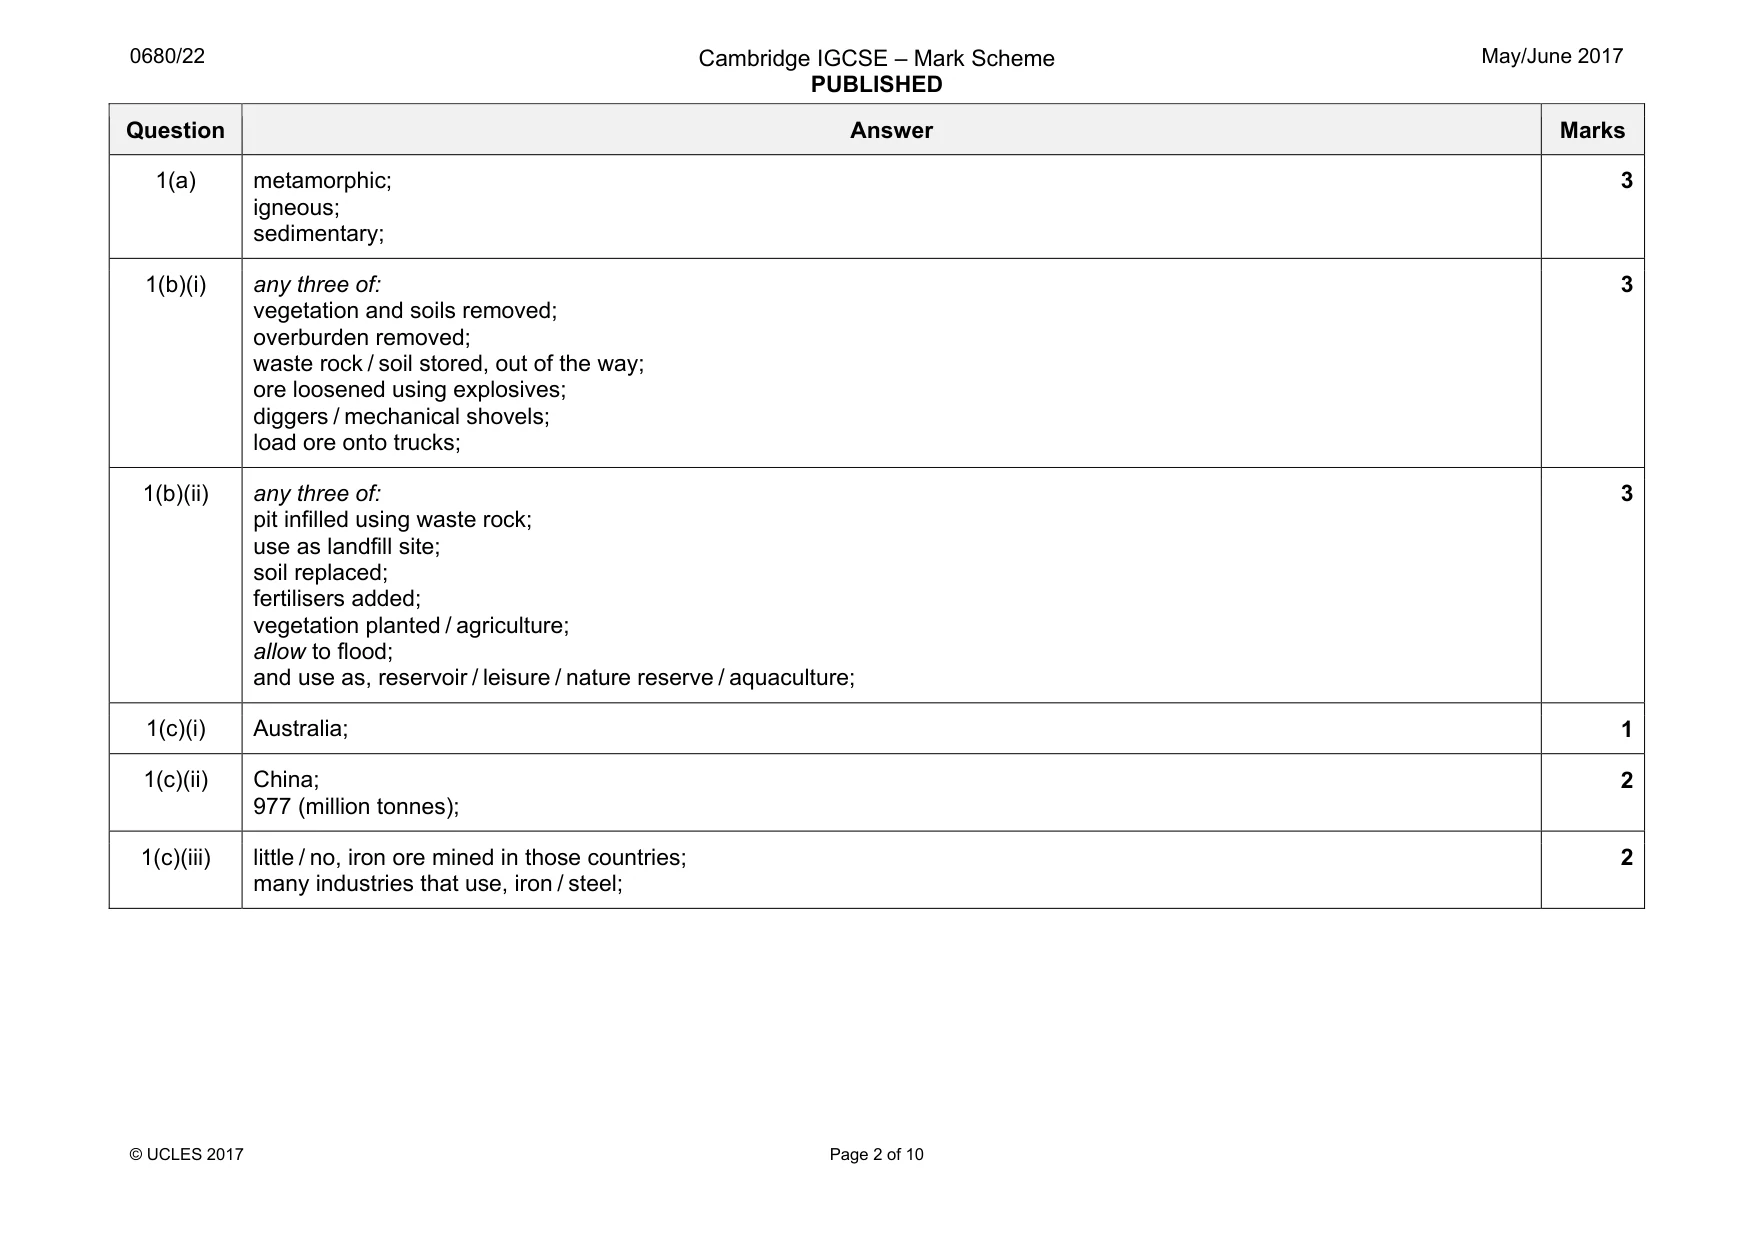
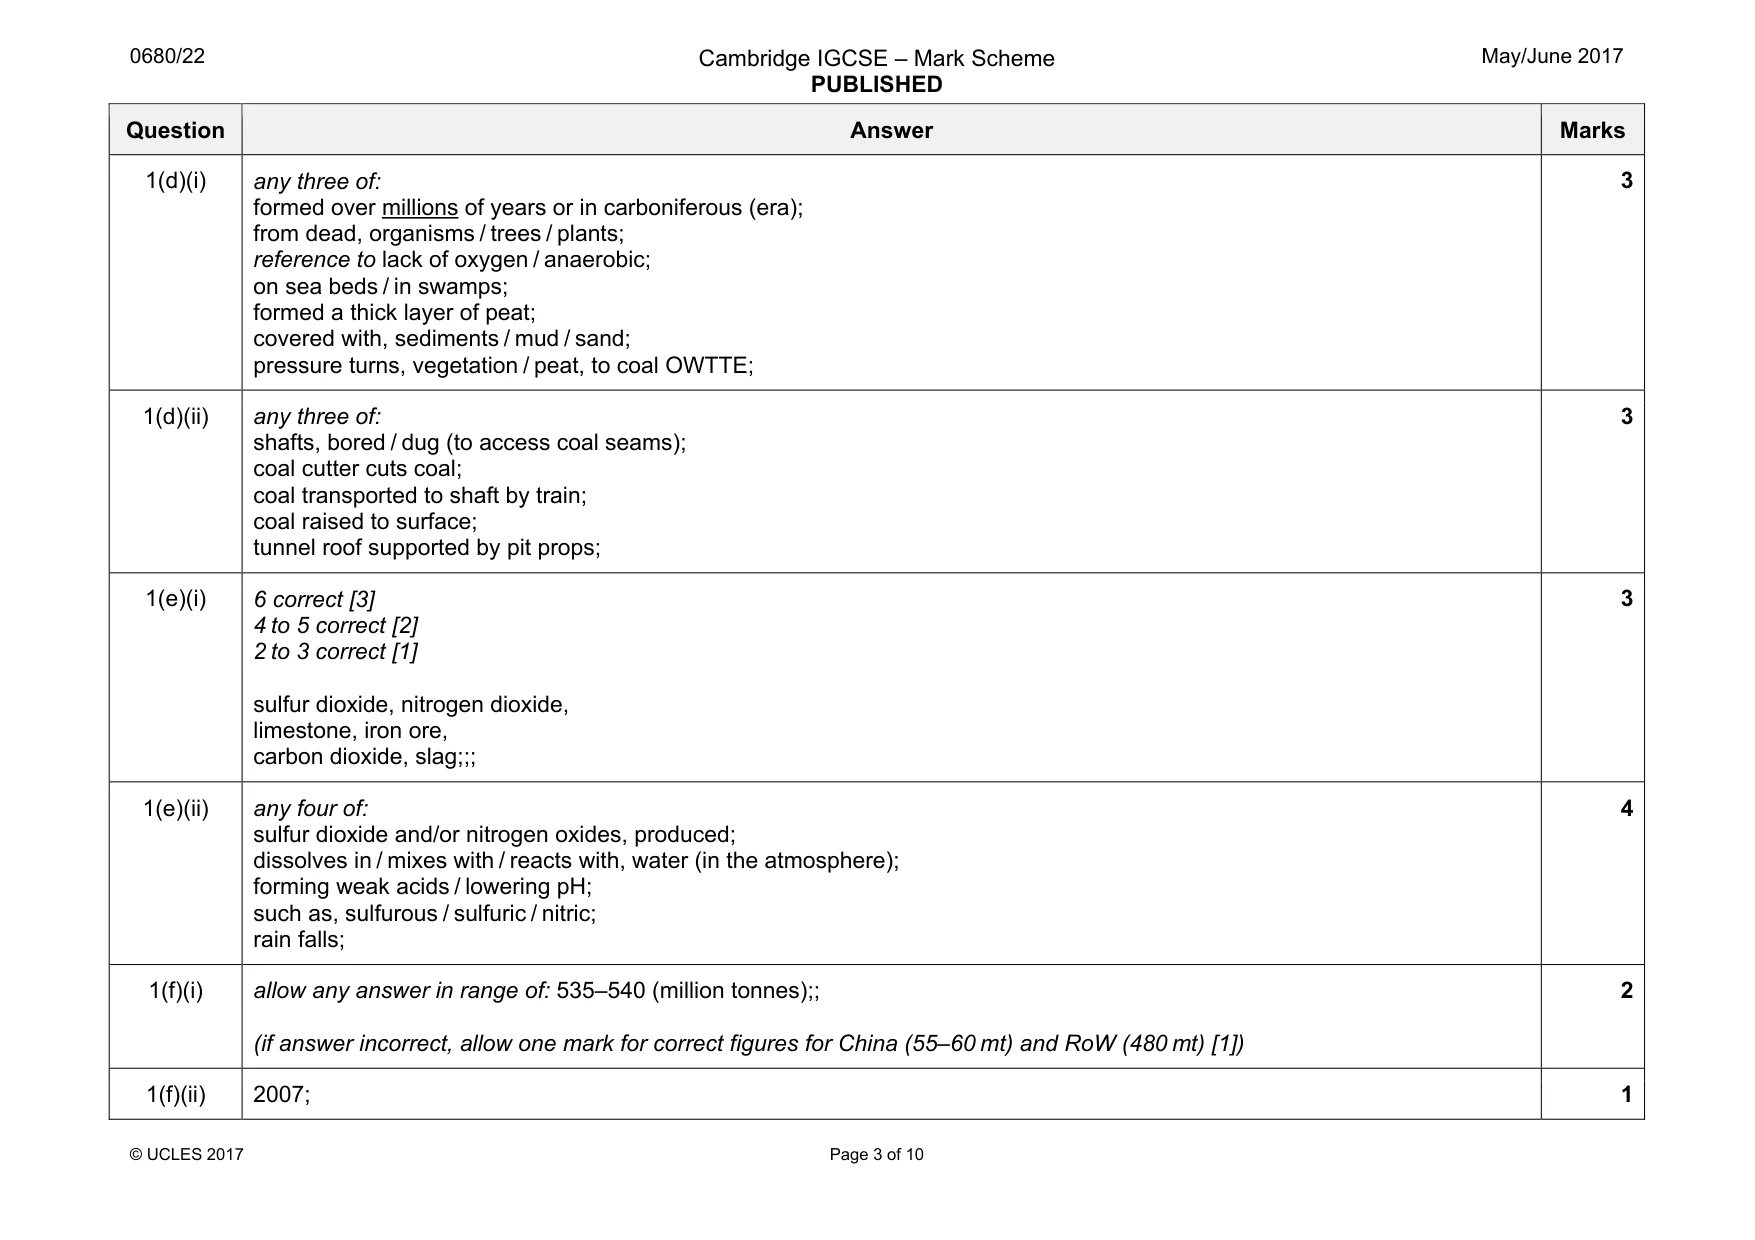
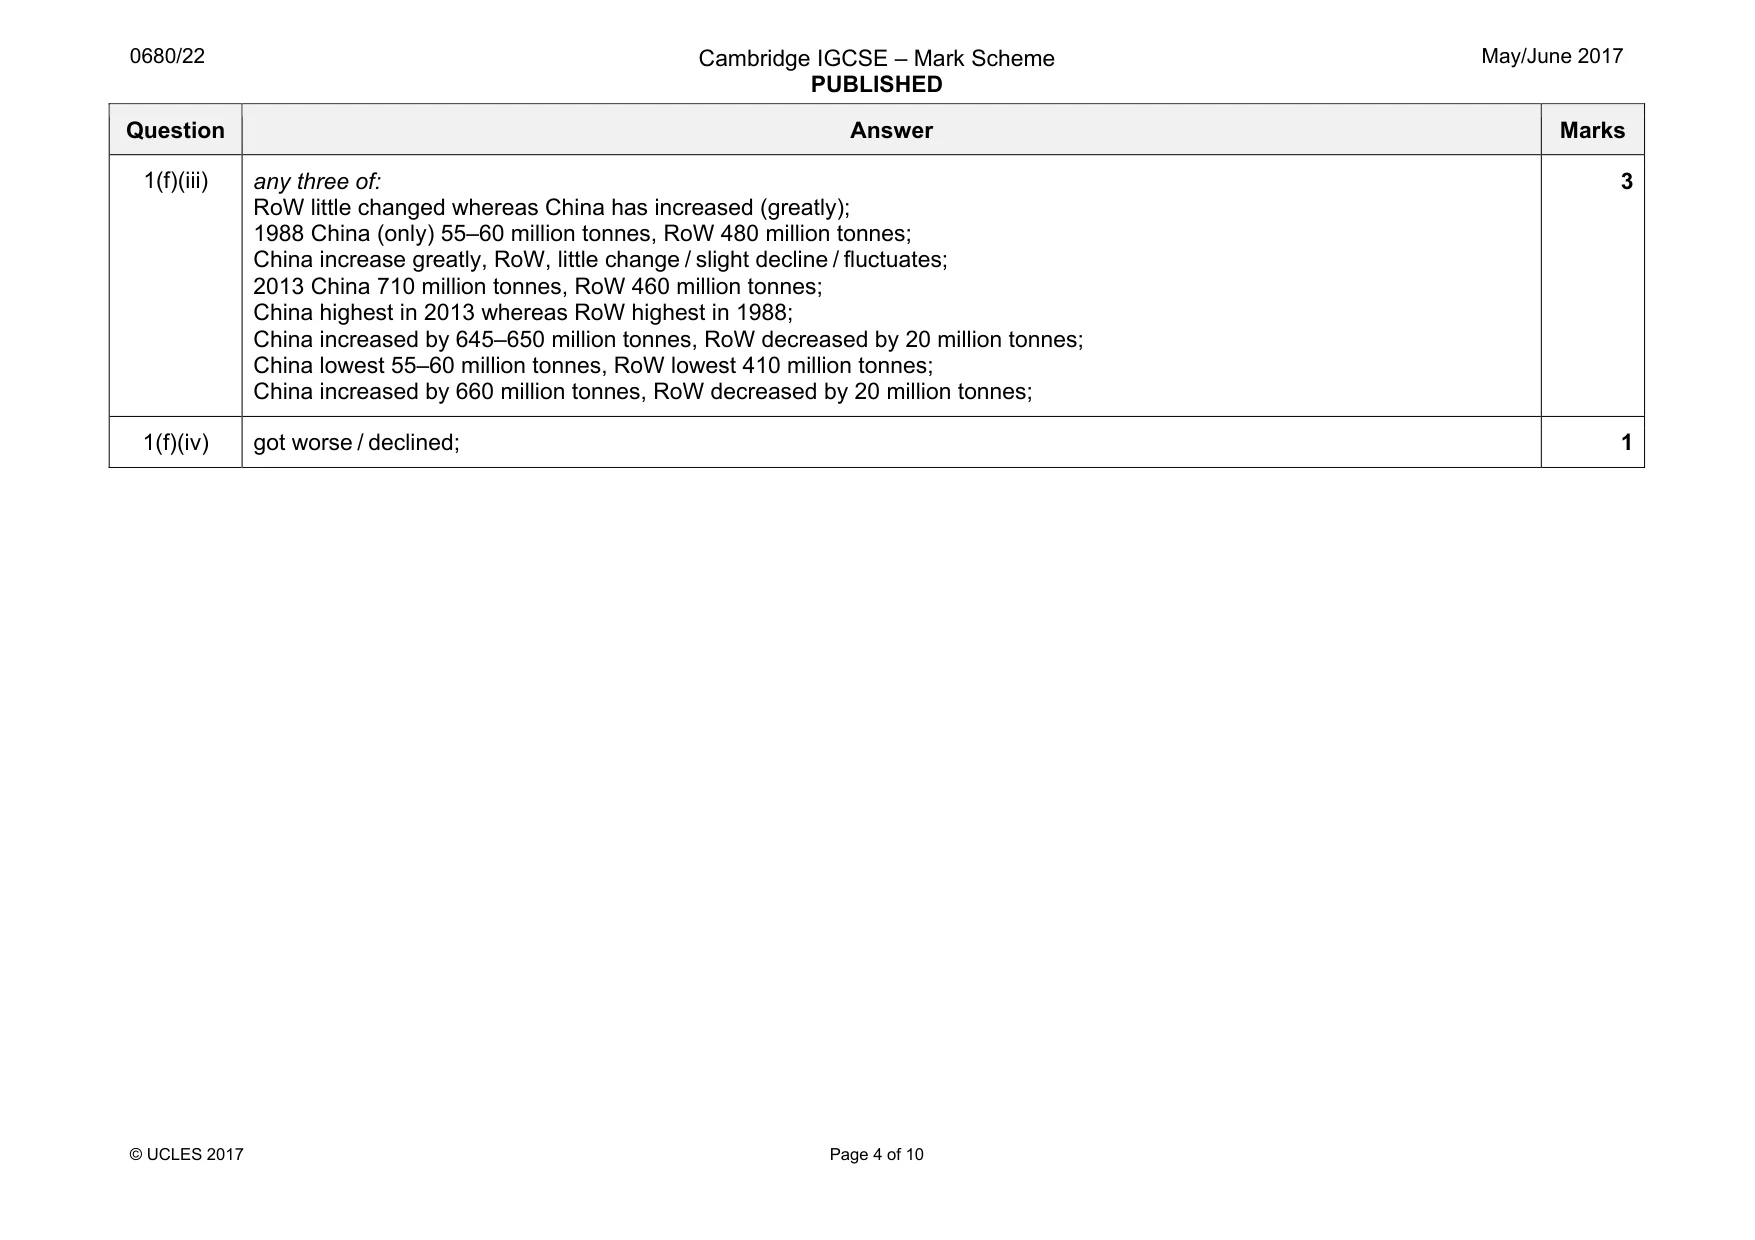
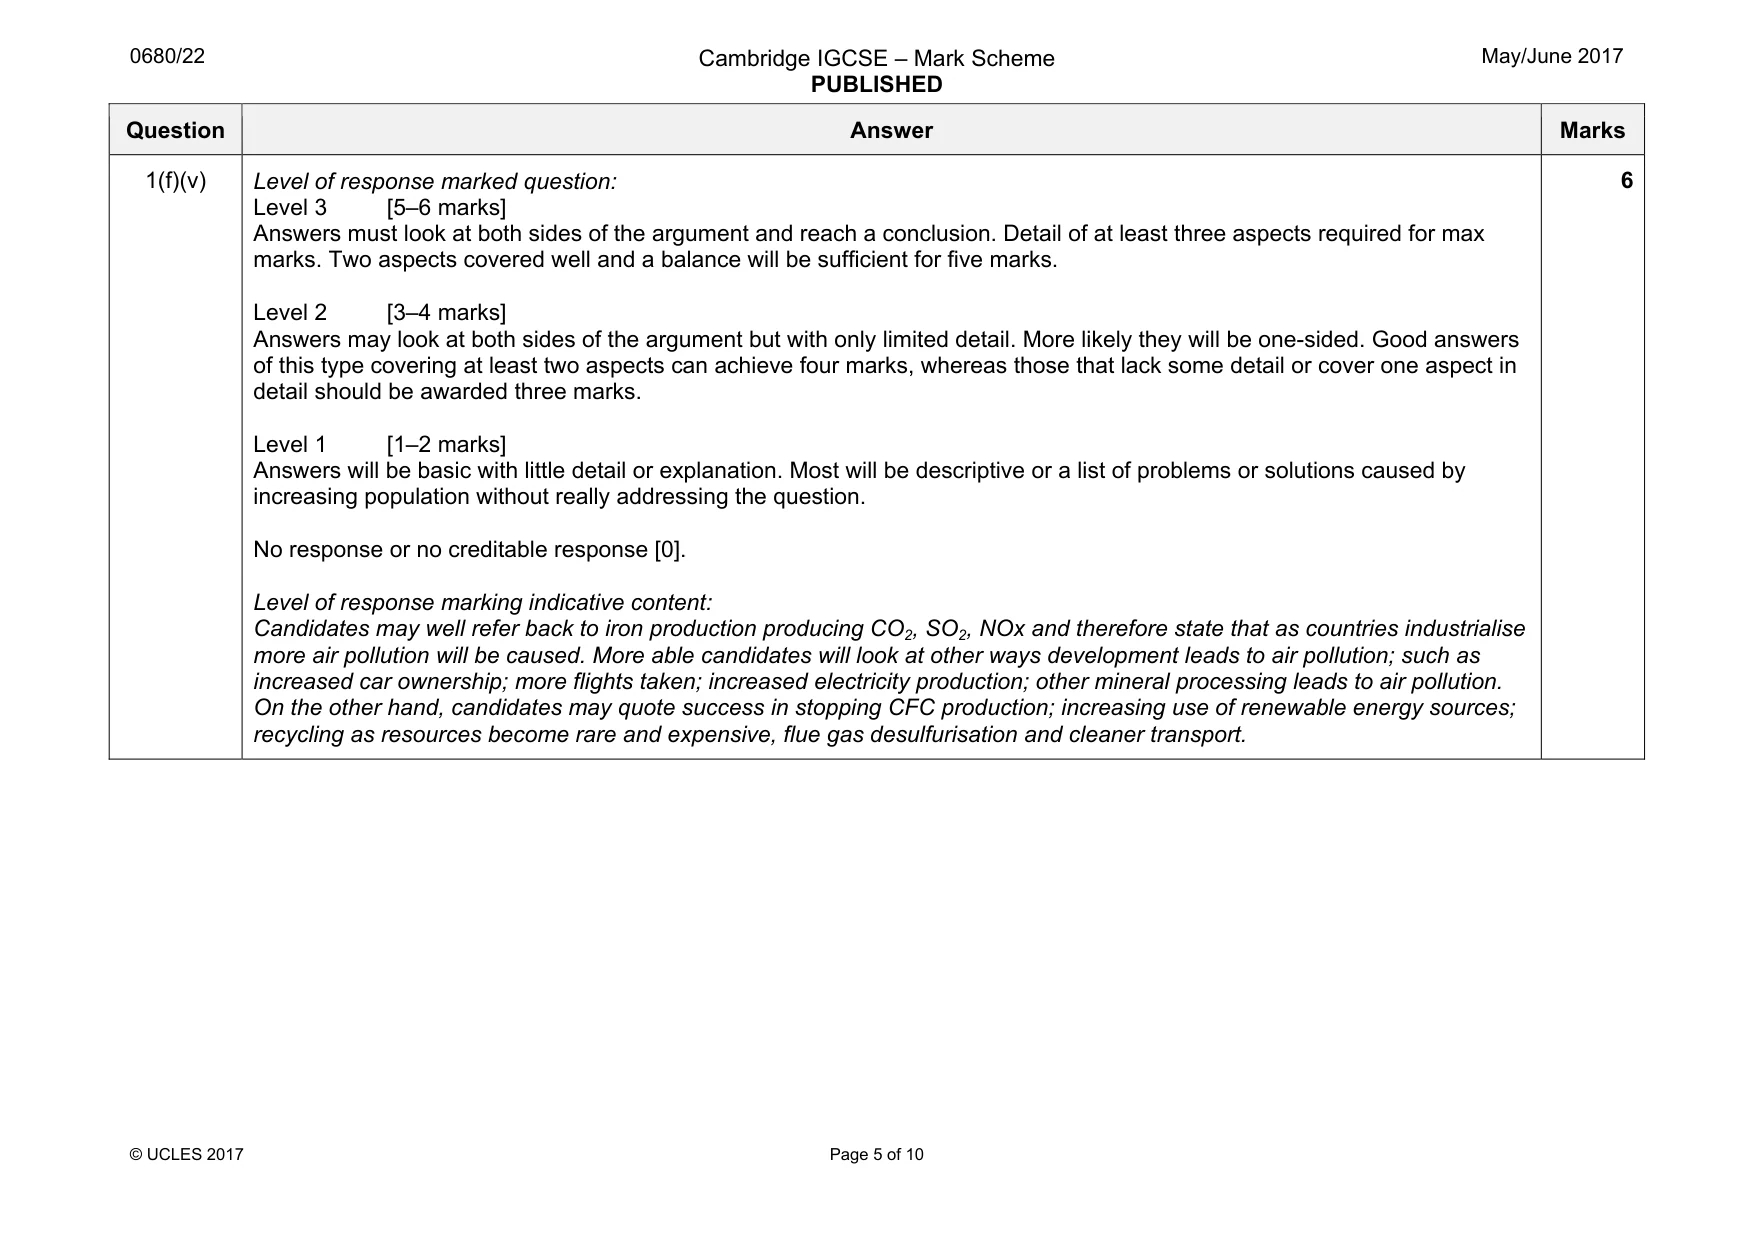
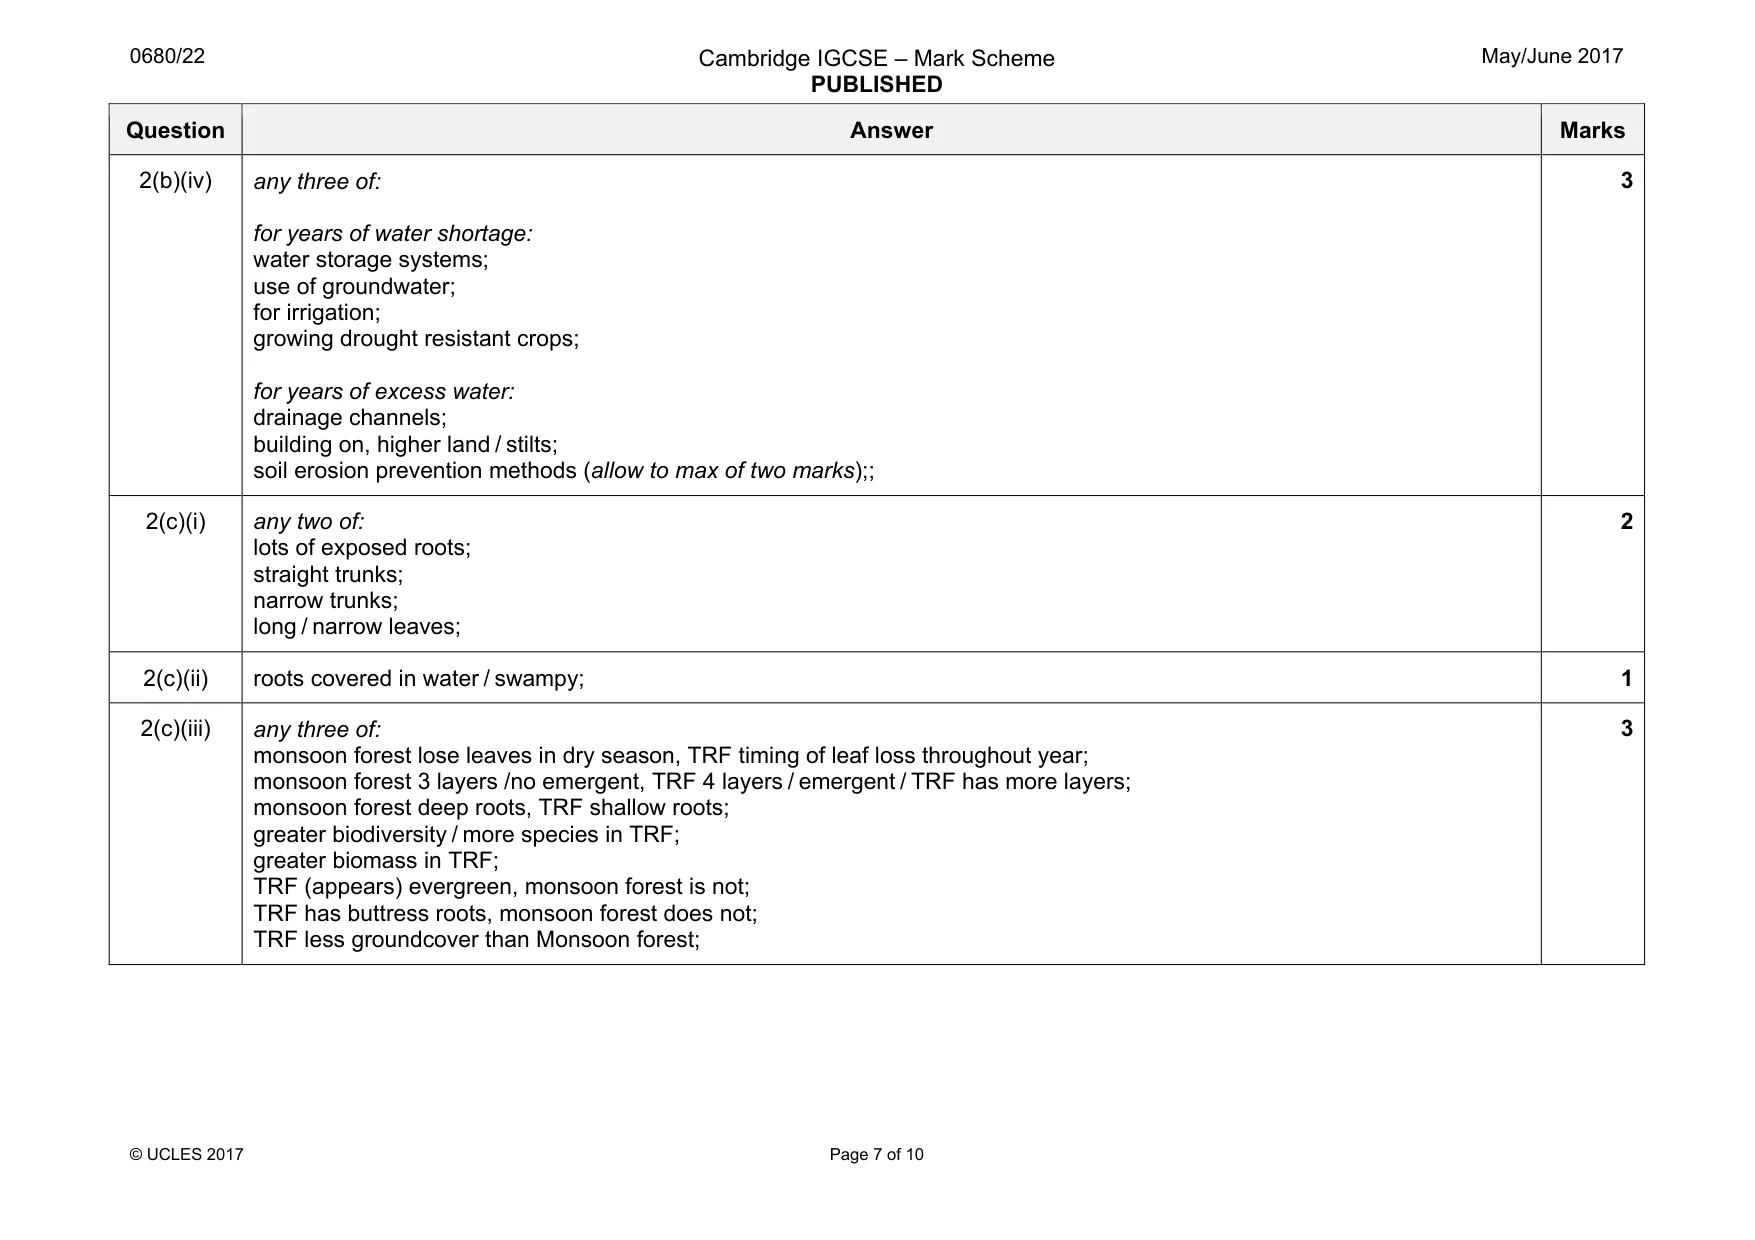
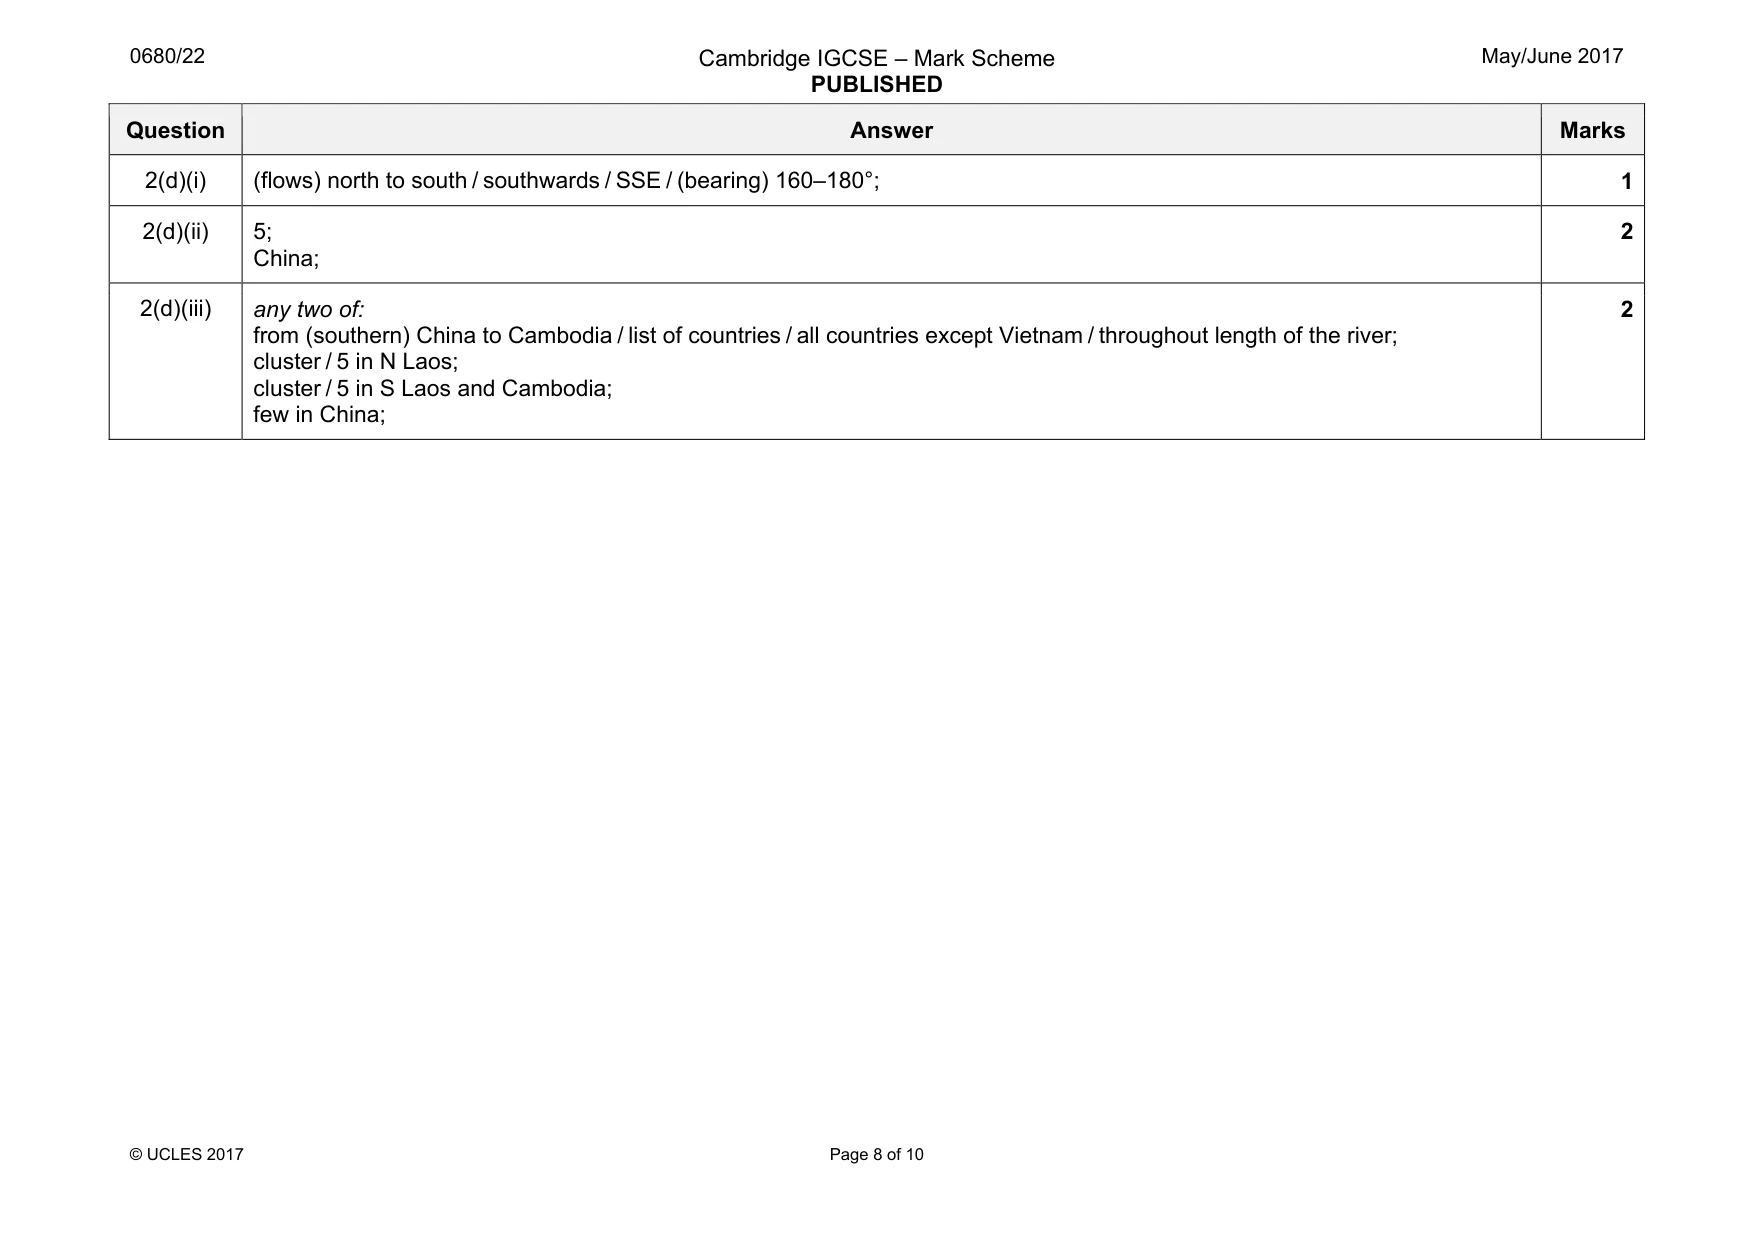
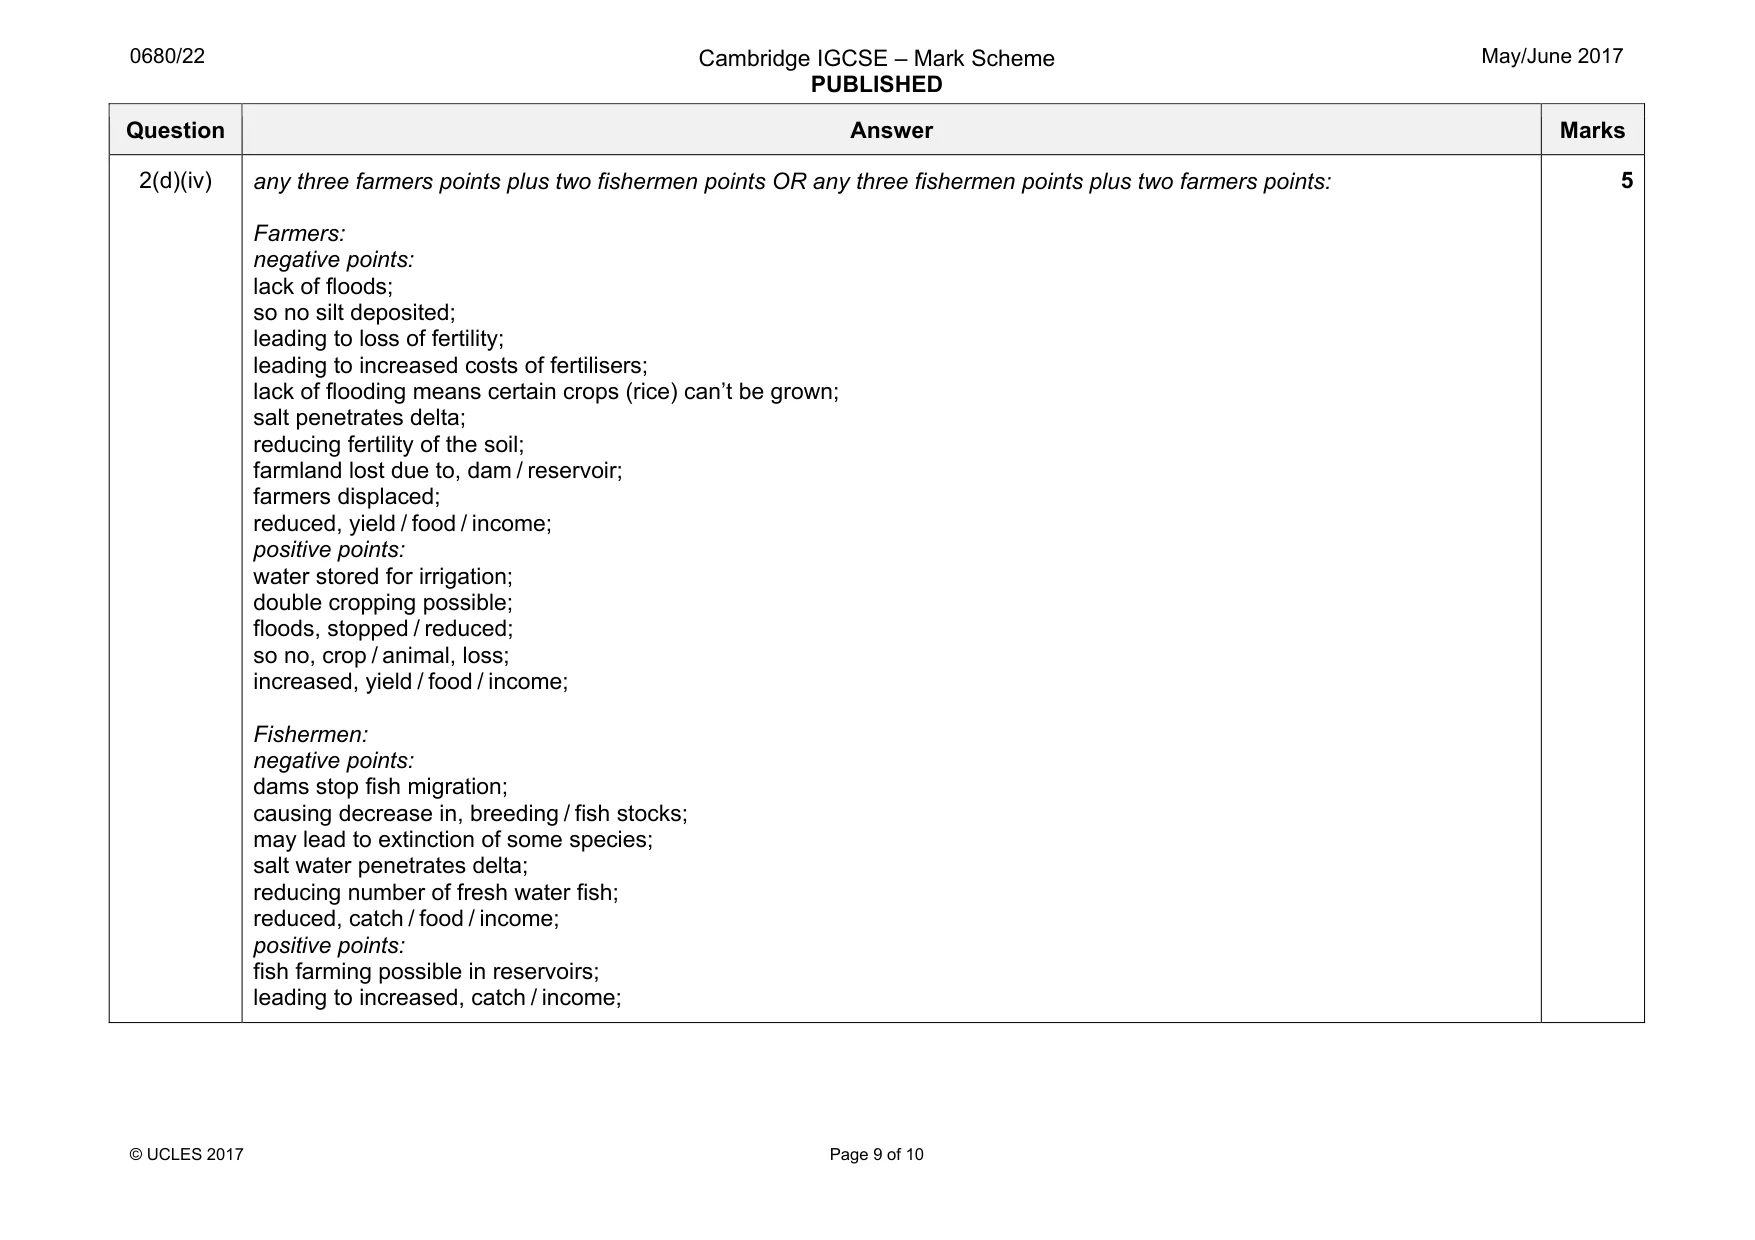
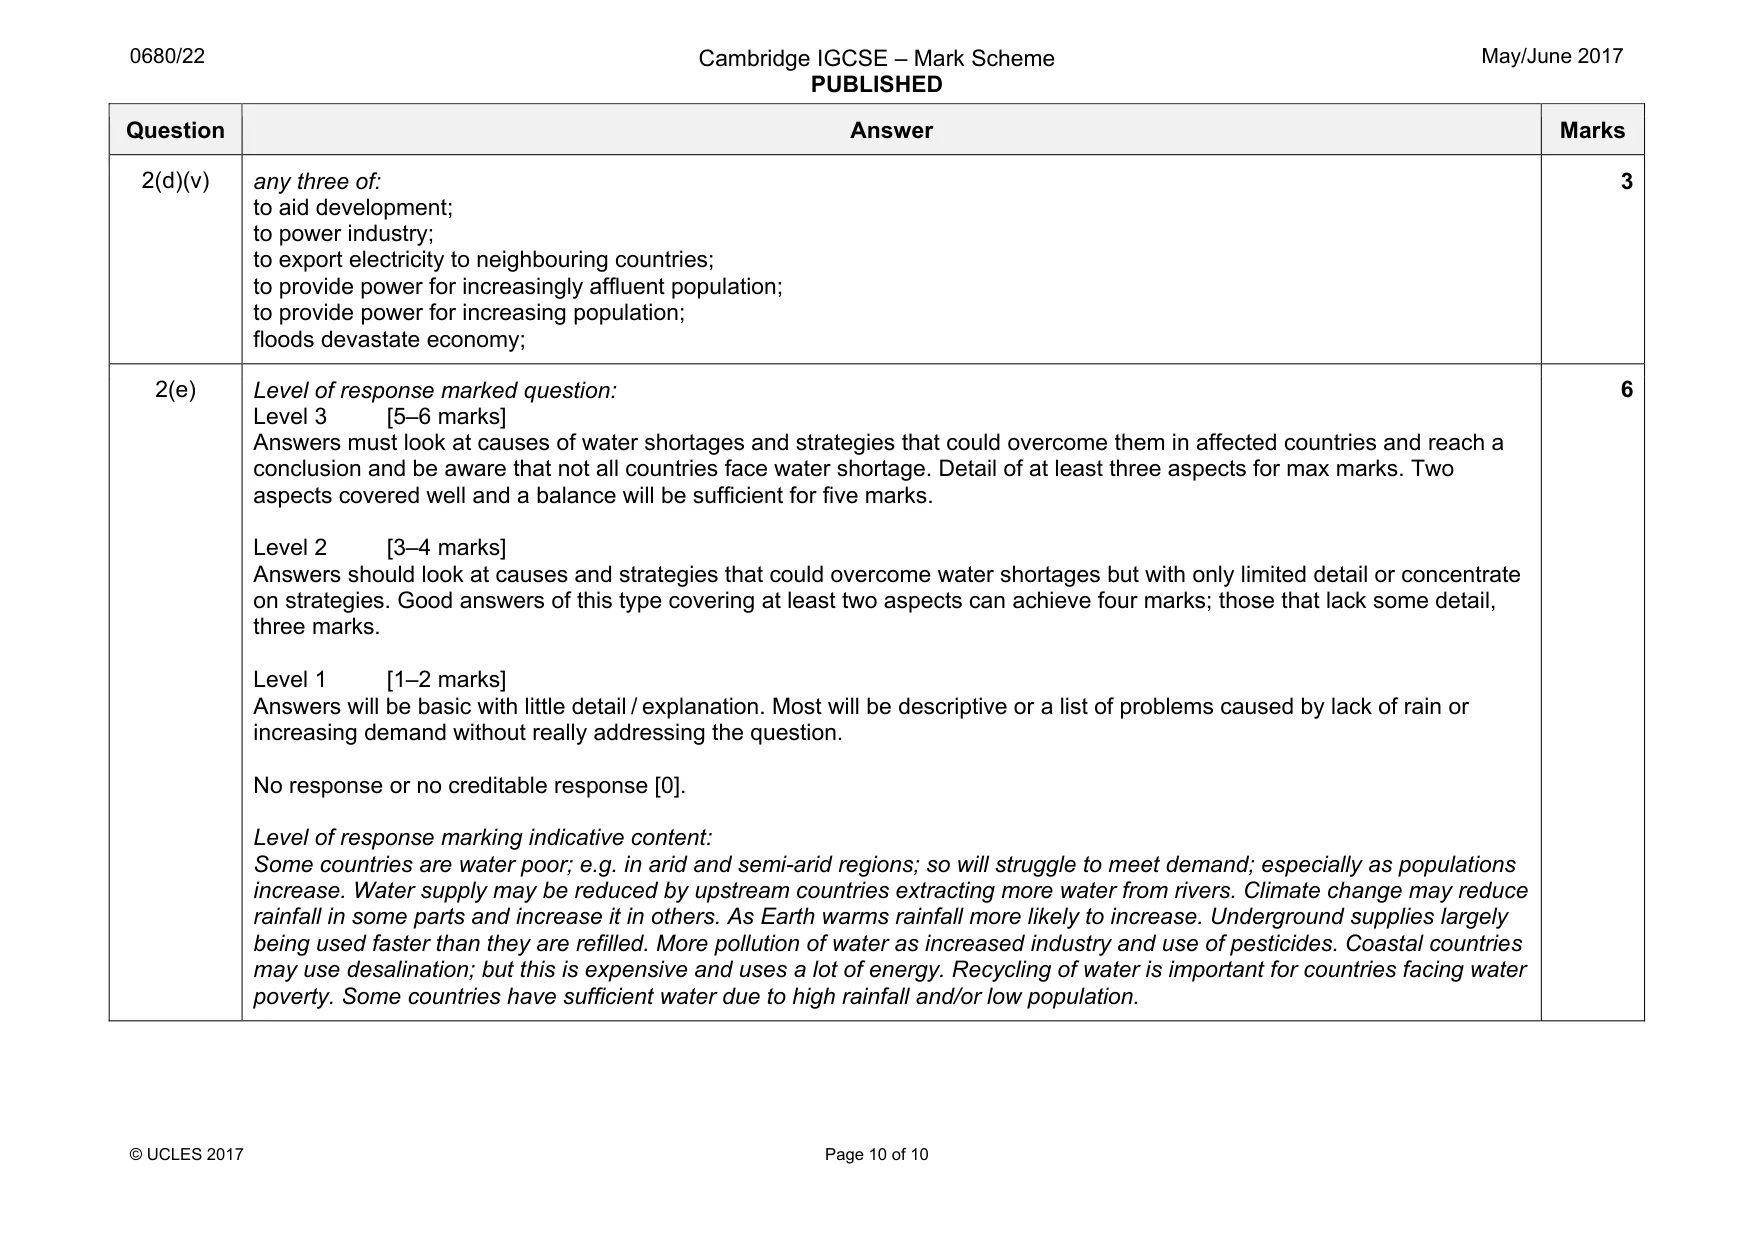
Mark scheme: 1(a) metamorphic; igneous; sedimentary; 3 1(b)(i) any three of: vegetation and soils removed; overburden removed; waste rock / soil stored, out of the way; ore loosened using explosives; diggers / mechanical shovels; load ore onto trucks; 3 1(b)(ii) any three of: pit infilled using waste rock; use as landfill site; soil replaced; fertilisers added; vegetation planted / agriculture; allow to flood; and use as, reservoir / leisure / nature reserve / aquaculture; 3 1(c)(i) Australia; 1 1(c)(ii) China; 977 (million tonnes); 2 1(c)(iii) little / no, iron ore mined in those countries; many industries that use, iron / steel; 2 Question Answer Marks 1(d)(i) any three of: formed over millions of years or in carboniferous (era); from dead, organisms / trees / plants; reference to lack of oxygen / anaerobic; on sea beds / in swamps; formed a thick layer of peat; covered with, sediments / mud / sand; pressure turns, vegetation / peat, to coal OWTTE; 3 1(d)(ii) any three of: shafts, bored / dug (to access coal seams); coal cutter cuts coal; coal transported to shaft by train; coal raised to surface; tunnel roof supported by pit props; 3 1(e)(i) 6 correct [3] 4 to 5 correct [2] 2 to 3 correct [1] sulfur dioxide, nitrogen dioxide, limestone, iron ore, carbon dioxide, slag;;; 3 1(e)(ii) any four of: sulfur dioxide and/or nitrogen oxides, produced; dissolves in / mixes with / reacts with, water (in the atmosphere); forming weak acids / lowering pH; such as, sulfurous / sulfuric / nitric; rain falls; 4 1(f)(i) allow any answer in range of: 535–540 (million tonnes);; (if answer incorrect, allow one mark for correct figures for China (55–60 mt) and RoW (480 mt) [1]) 2 1(f)(ii) 2007; 1 Question Answer Marks 1(f)(iii) any three of: RoW little changed whereas China has increased (greatly); 1988 China (only) 55–60 million tonnes, RoW 480 million tonnes; China increase greatly, RoW, little change / slight decline / fluctuates; 2013 China 710 million tonnes, RoW 460 million tonnes; China highest in 2013 whereas RoW highest in 1988; China increased by 645–650 million tonnes, RoW decreased by 20 million tonnes; China lowest 55–60 million tonnes, RoW lowest 410 million tonnes; China increased by 660 million tonnes, RoW decreased by 20 million tonnes; 3 1(f)(iv) got worse / declined; 1 Question Answer Marks 1(f)(v) Level of response marked question: Level 3 [5–6 marks] Answers must look at both sides of the argument and reach a conclusion. Detail of at least three aspects required for max marks. Two aspects covered well and a balance will be sufficient for five marks. Level 2 [3–4 marks] Answers may look at both sides of the argument but with only limited detail. More likely they will be one-sided. Good answers of this type covering at least two aspects can achieve four marks, whereas those that lack some detail or cover one aspect in detail should be awarded three marks. Level 1 [1–2 marks] Answers will be basic with little detail or explanation. Most will be descriptive or a list of problems or solutions caused by increasing population without really addressing the question. No response or no creditable response [0]. Level of response marking indicative content: Candidates may well refer back to iron production producing CO2, SO2, NOx and therefore state that as countries industrialise more air pollution will be caused. More able candidates will look at other ways development leads to air pollution; such as increased car ownership; more flights taken; increased electricity production; other mineral processing leads to air pollution. On the other hand, candidates may quote success in stopping CFC production; increasing use of renewable energy sources; recycling as resources become rare and expensive, flue gas desulfurisation and cleaner transport. 6
Q2 · The table shows climate data for five different climates
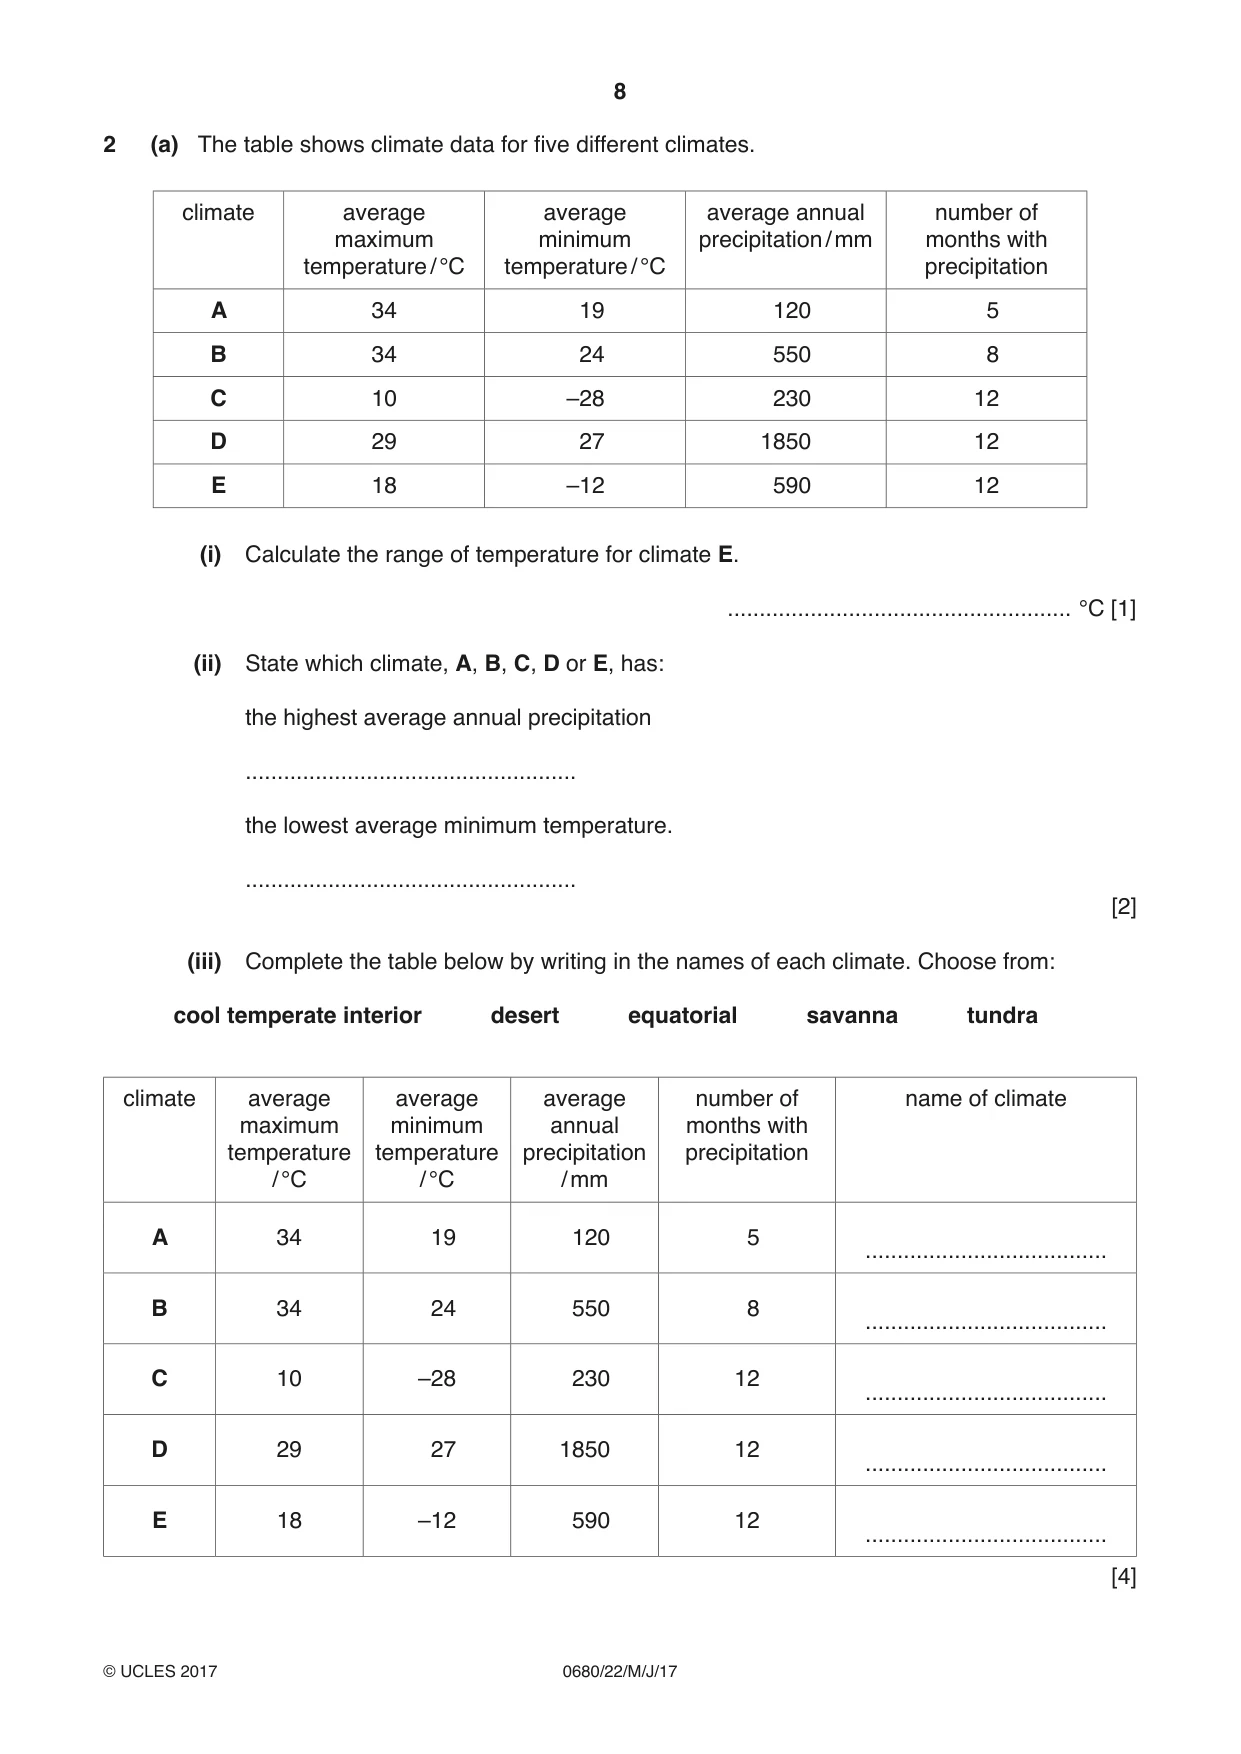
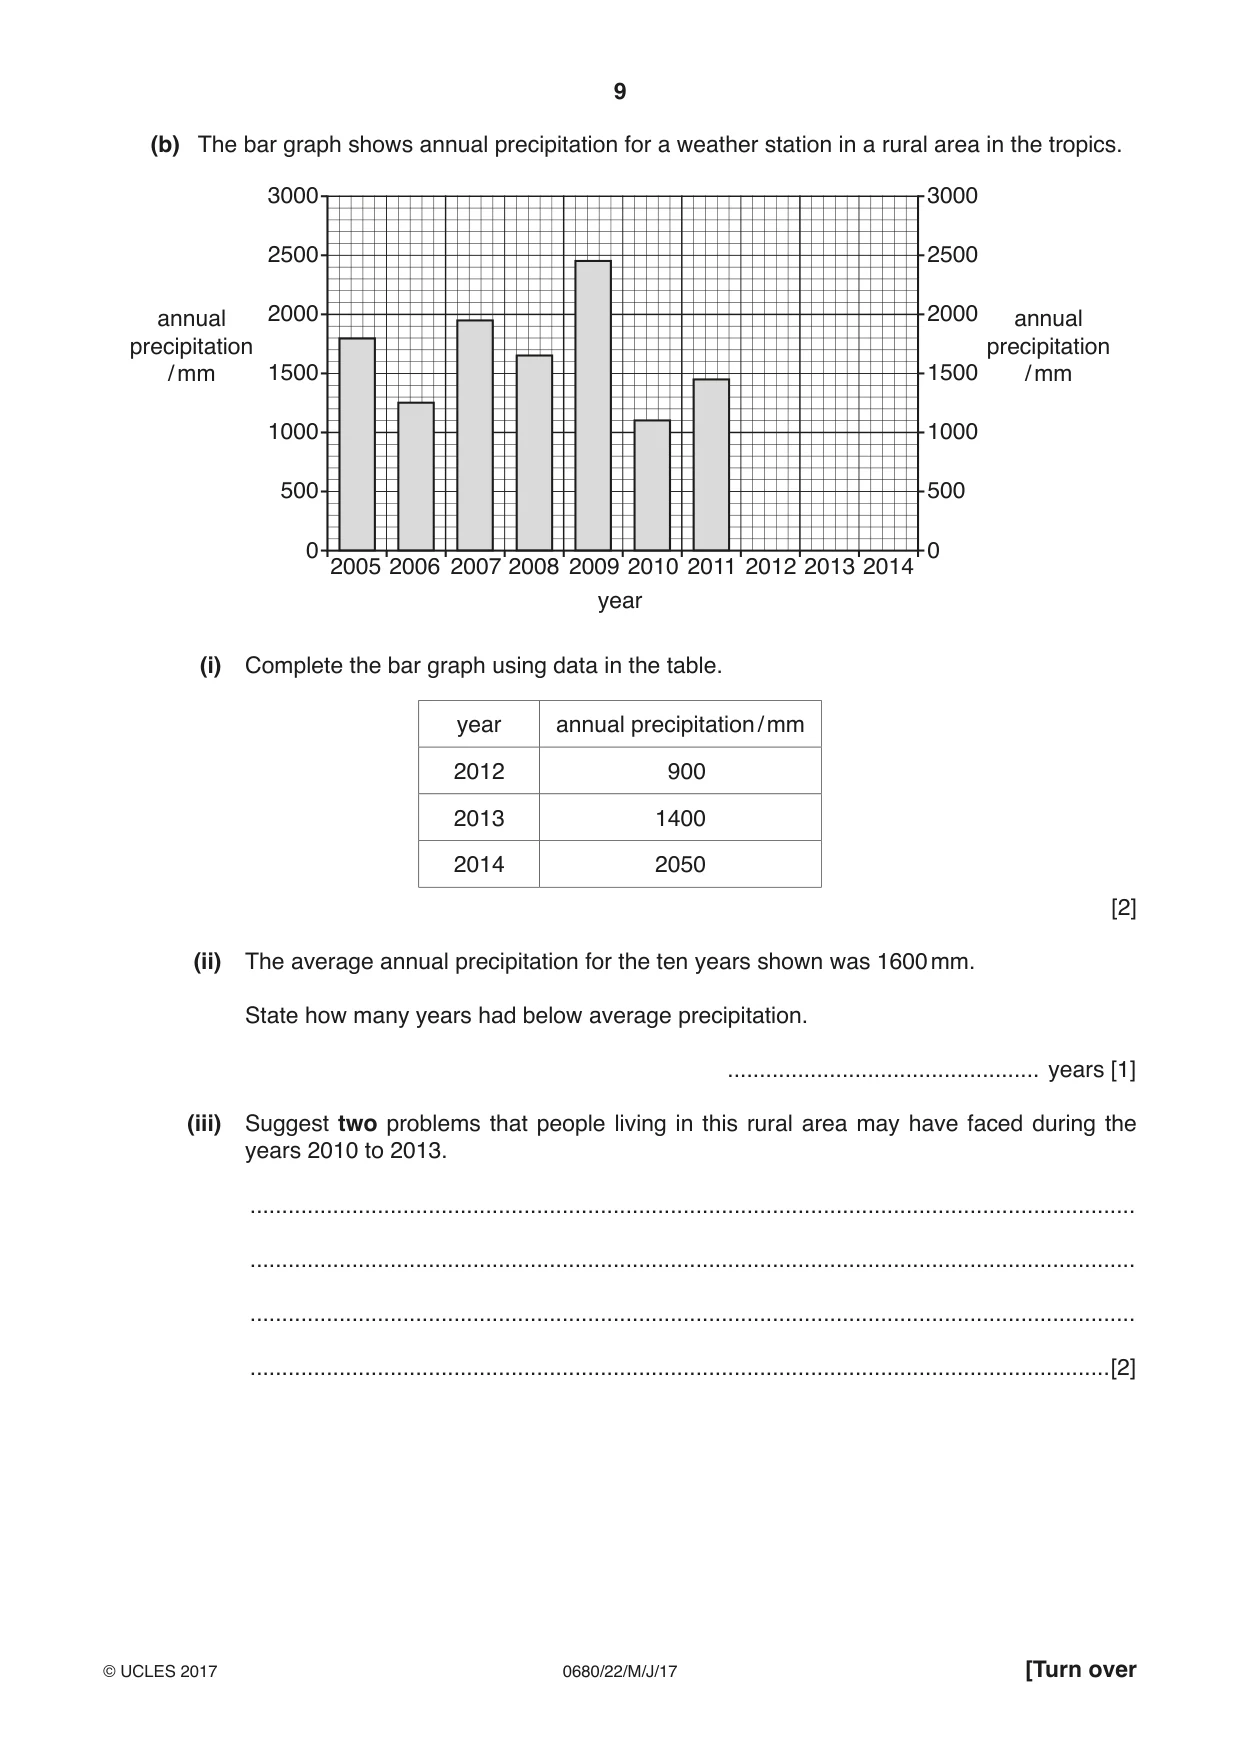
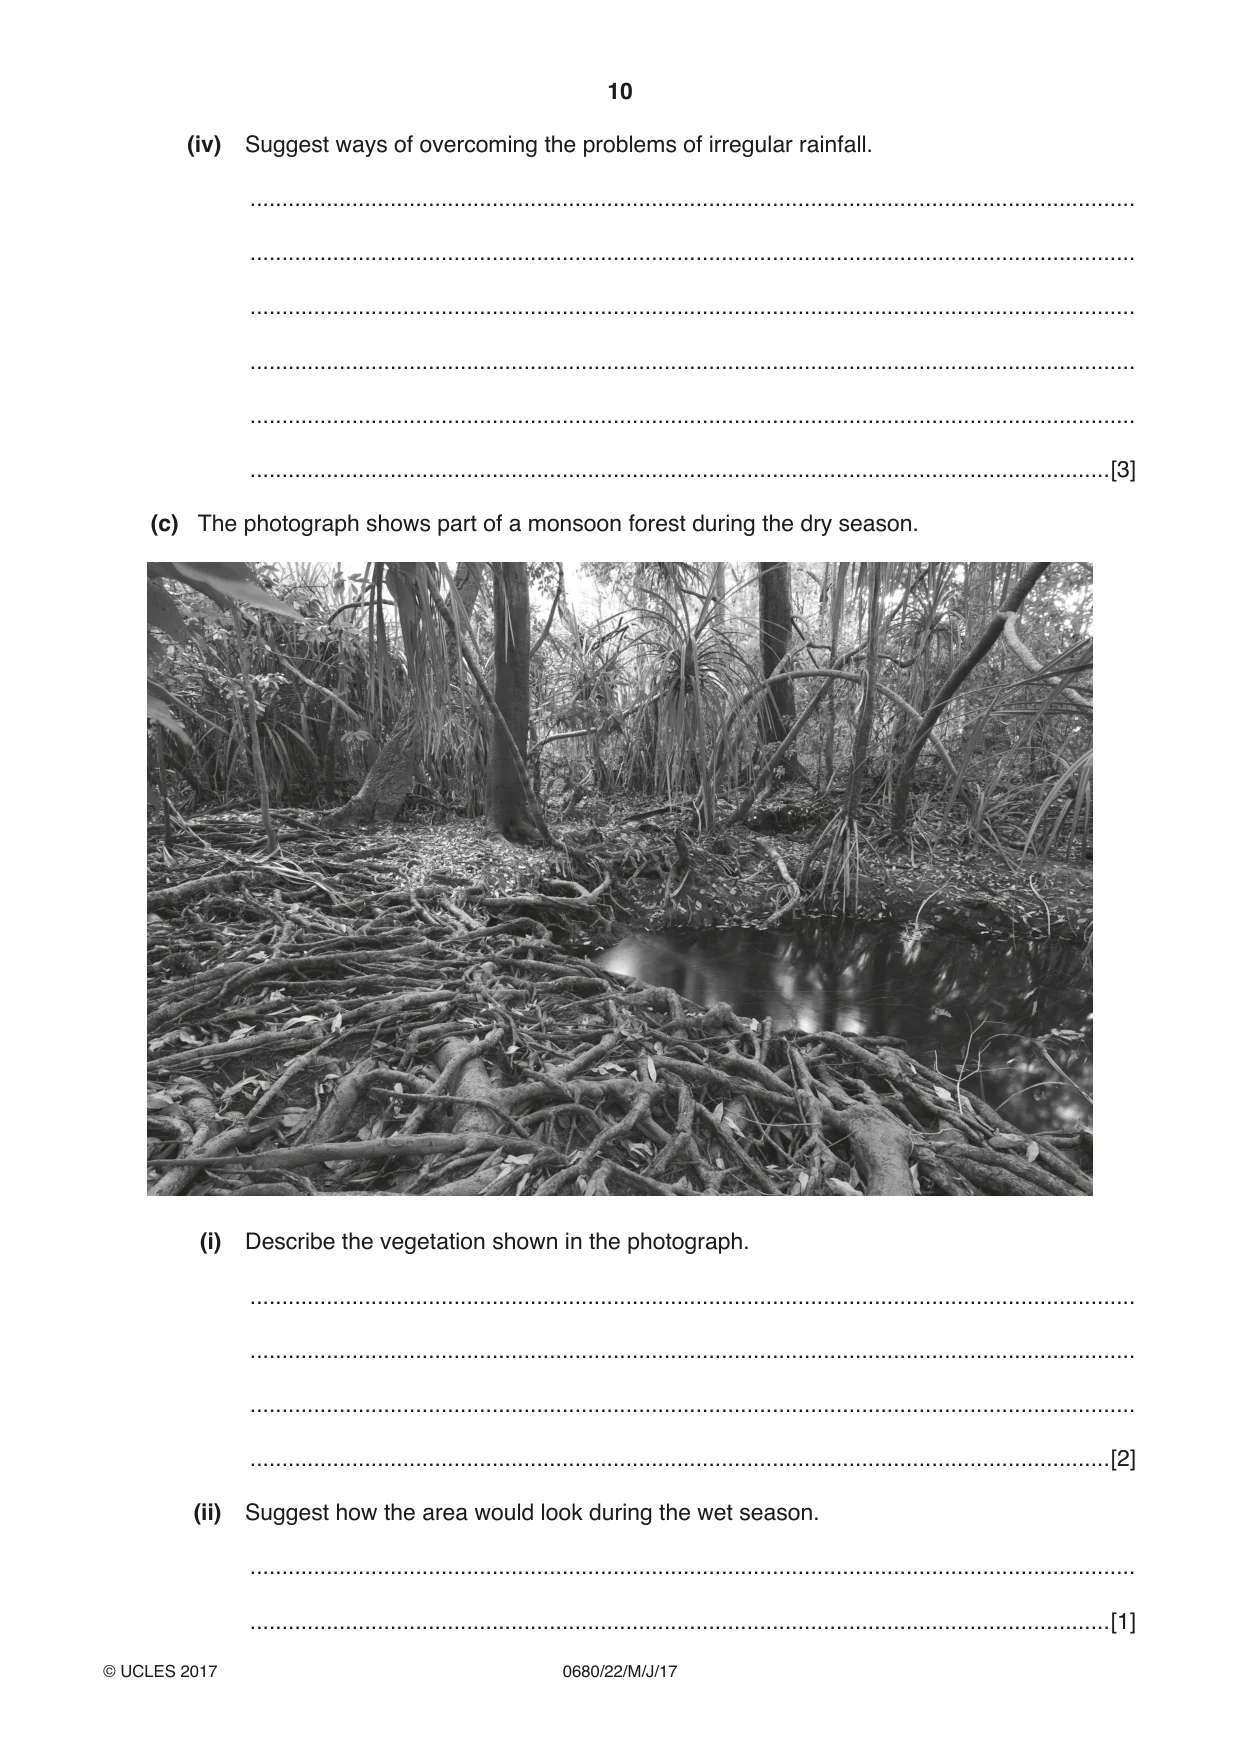
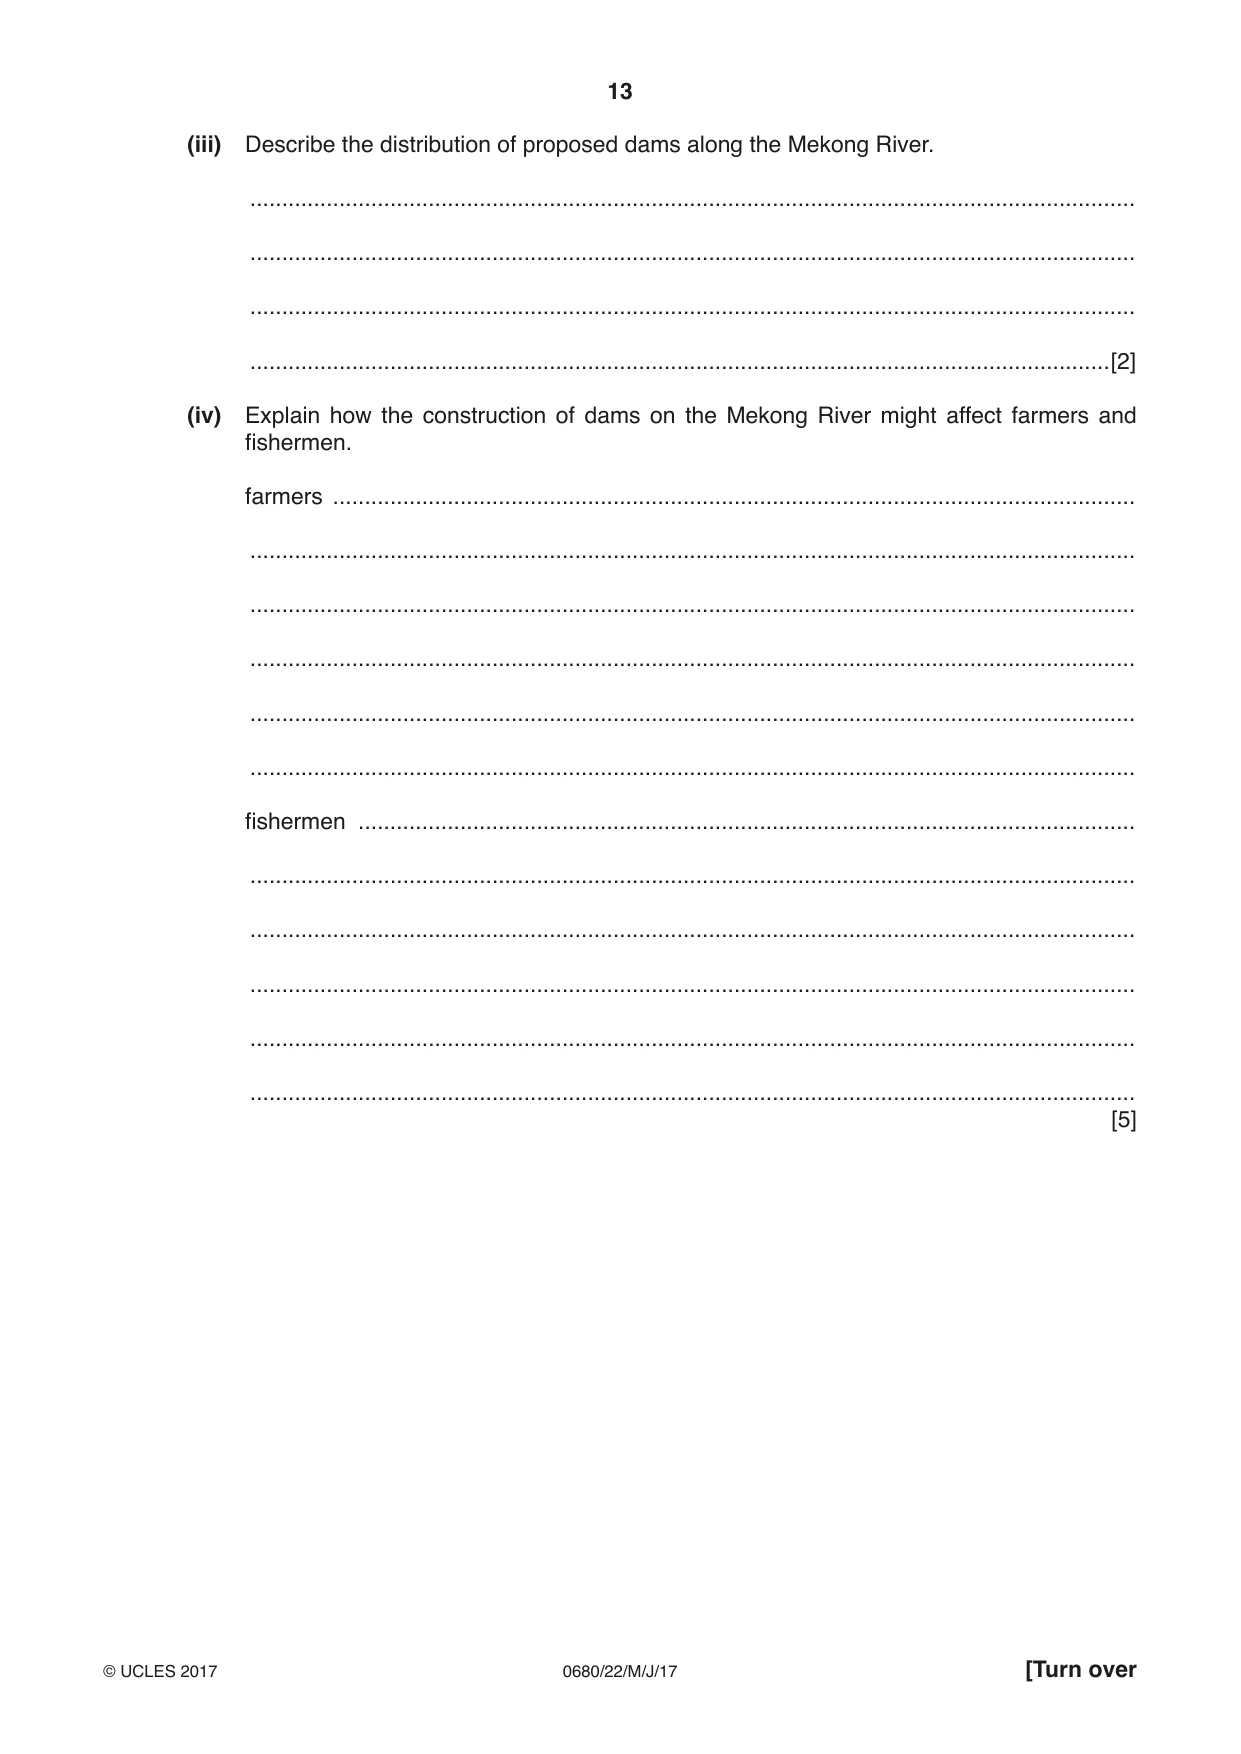
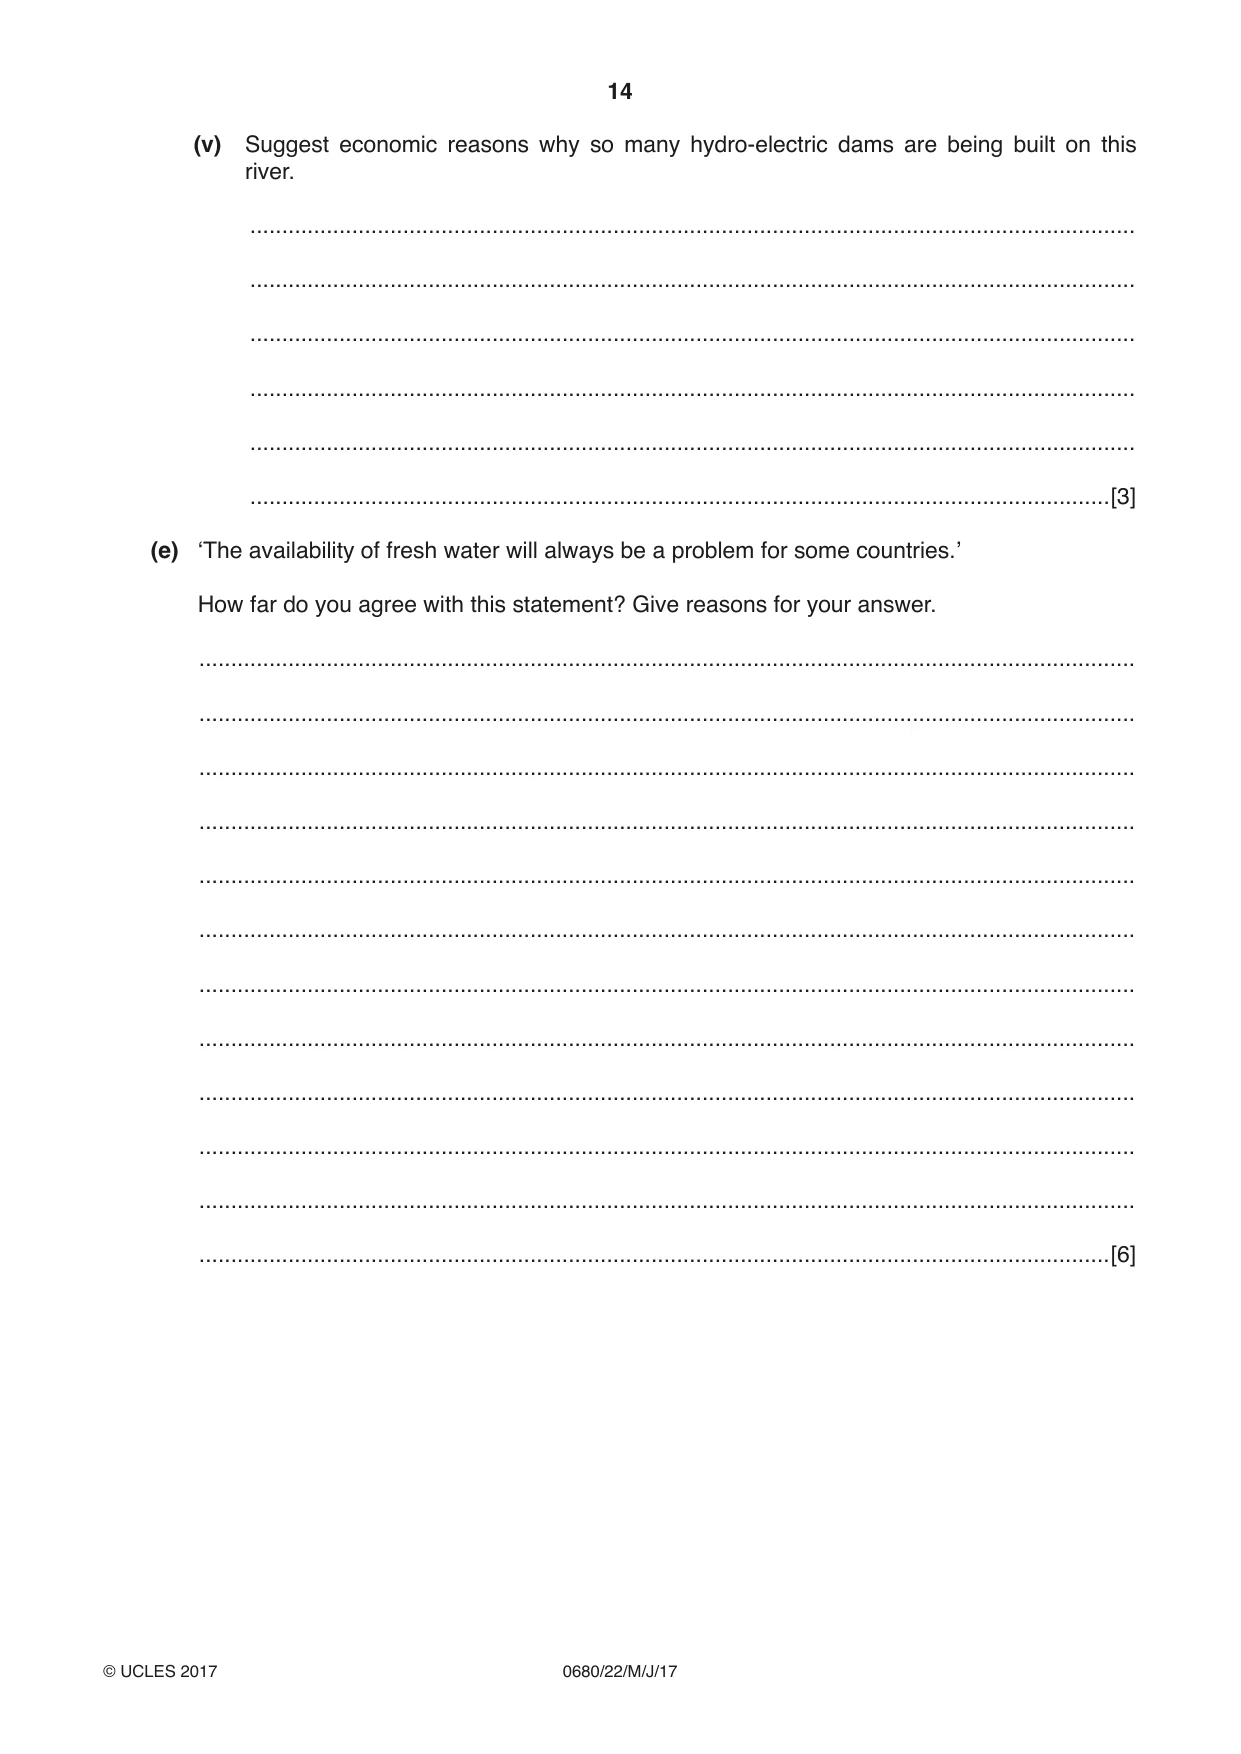
2 (a) The table shows climate data for five different climates. climate average average average annual number of maximum minimum precipitation / mm months with temperature / °C temperature / °C precipitation A 34 19 120 5 B 34 24 550 8 C 10 –28 230 12 D 29 27 1850 12 E 18 –12 590 12 (i) Calculate the range of temperature for climate E. ...................................................... °C [1] (ii) State which climate, A, B, C, D or E, has: the highest average annual precipitation .................................................... the lowest average minimum temperature. .................................................... [2] (iii) Complete the table below by writing in the names of each climate. Choose from: cool temperate interior desert equatorial savanna tundra climate average average average number of name of climate maximum minimum annual months with temperature temperature precipitation precipitation / °C / °C / mm A 34 19 120 5 ...................................... B 34 24 550 8 ...................................... C 10 –28 230 12 ...................................... D 29 27 1850 12 ...................................... E 18 –12 590 12 ...................................... [4] (b) The bar graph shows annual precipitation for a weather station in a rural area in the tropics. 3000 3000 2500 2500 annual 2000 2000 annual precipitation precipitation / mm 1500 1500 / mm 1000 1000 500 500 0 0 2005 2006 2007 2008 2009 2010 2011 2012 2013 2014 year (i) Complete the bar graph using data in the table. year annual precipitation / mm 2012 900 2013 1400 2014 2050 [2] (ii) The average annual precipitation for the ten years shown was 1600 mm. State how many years had below average precipitation. ................................................. years [1] (iii) Suggest two problems that people living in this rural area may have faced during the years 2010 to 2013. ........................................................................................................................................... ........................................................................................................................................... ........................................................................................................................................... .......................................................................................................................................[2] (iv) Suggest ways of overcoming the problems of irregular rainfall. ........................................................................................................................................... ........................................................................................................................................... ........................................................................................................................................... ........................................................................................................................................... ........................................................................................................................................... .......................................................................................................................................[3] (c) The photograph shows part of a monsoon forest during the dry season. (i) Describe the vegetation shown in the photograph. ........................................................................................................................................... ........................................................................................................................................... ........................................................................................................................................... .......................................................................................................................................[2] (ii) Suggest how the area would look during the wet season. ........................................................................................................................................... .......................................................................................................................................[1]
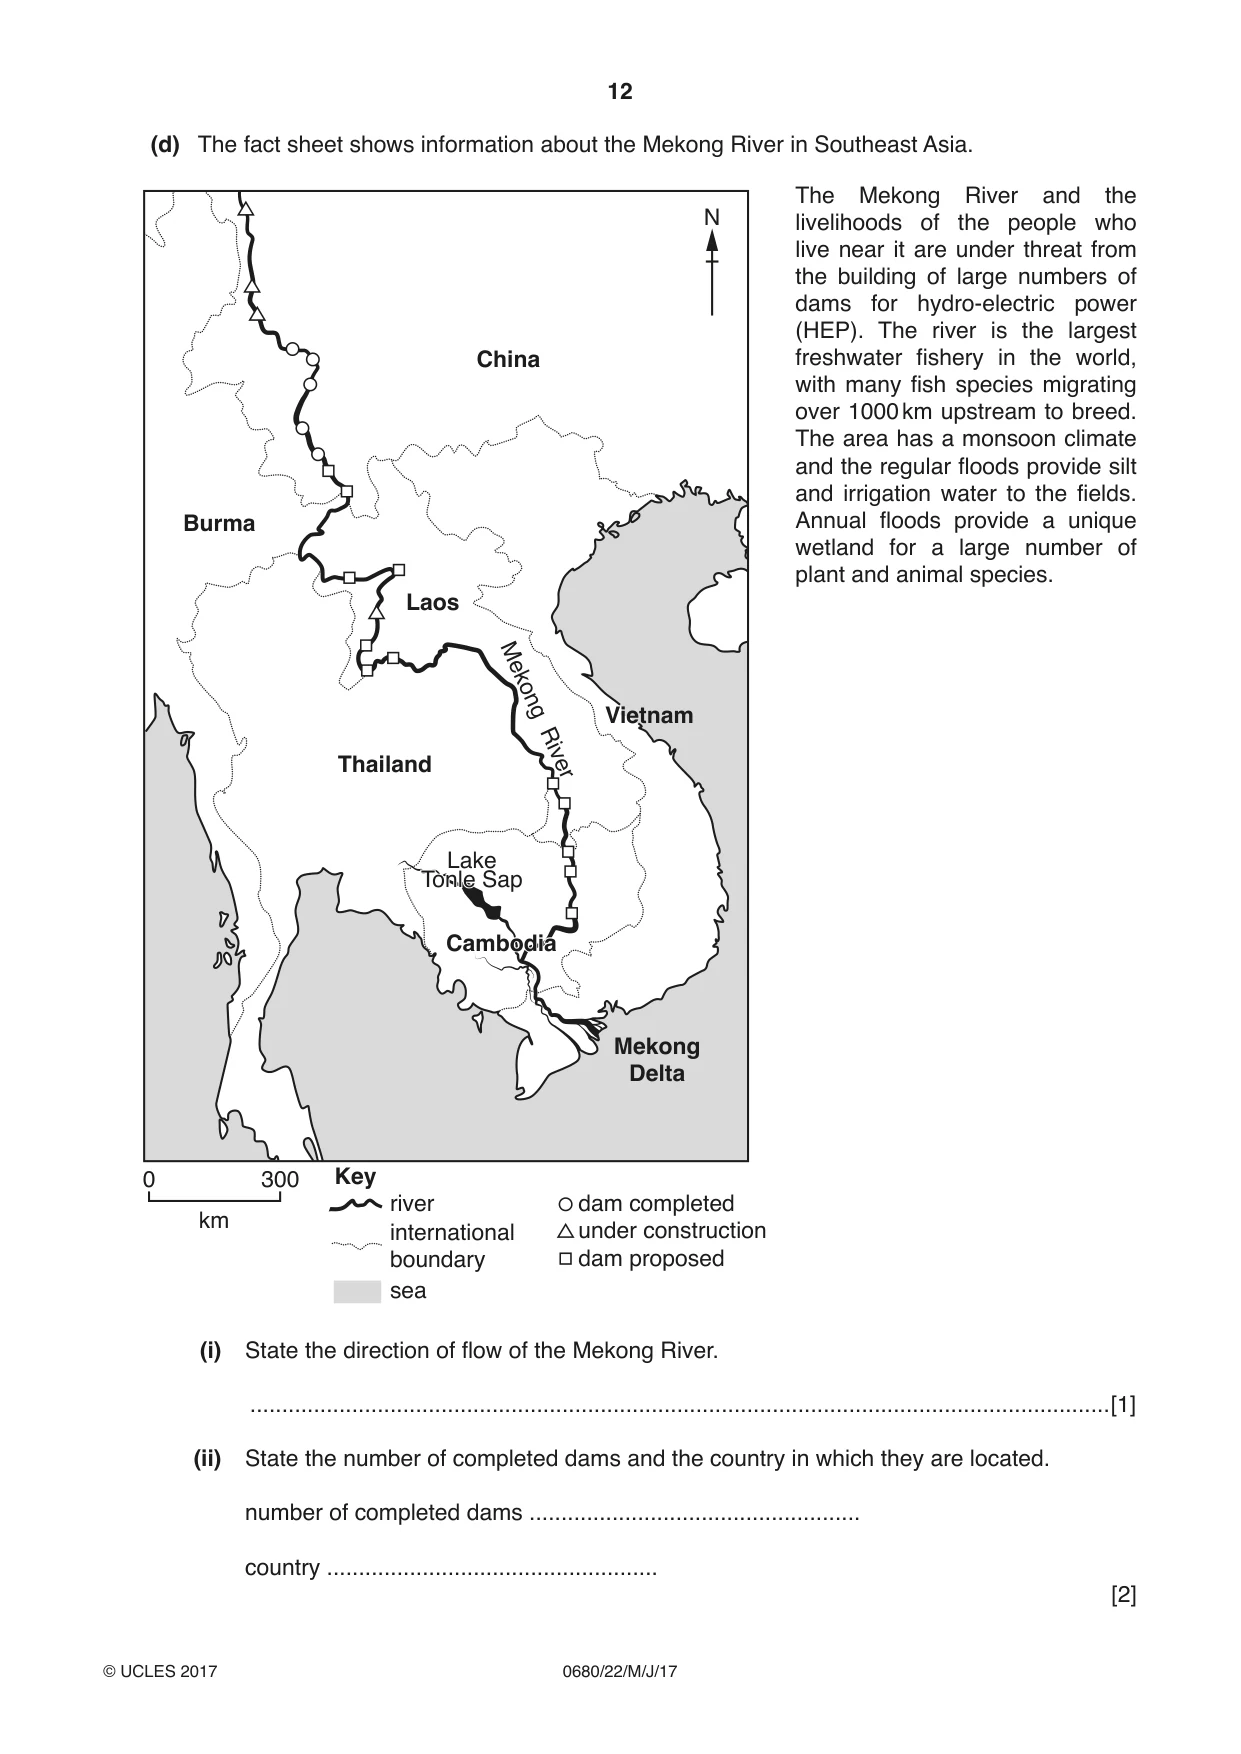
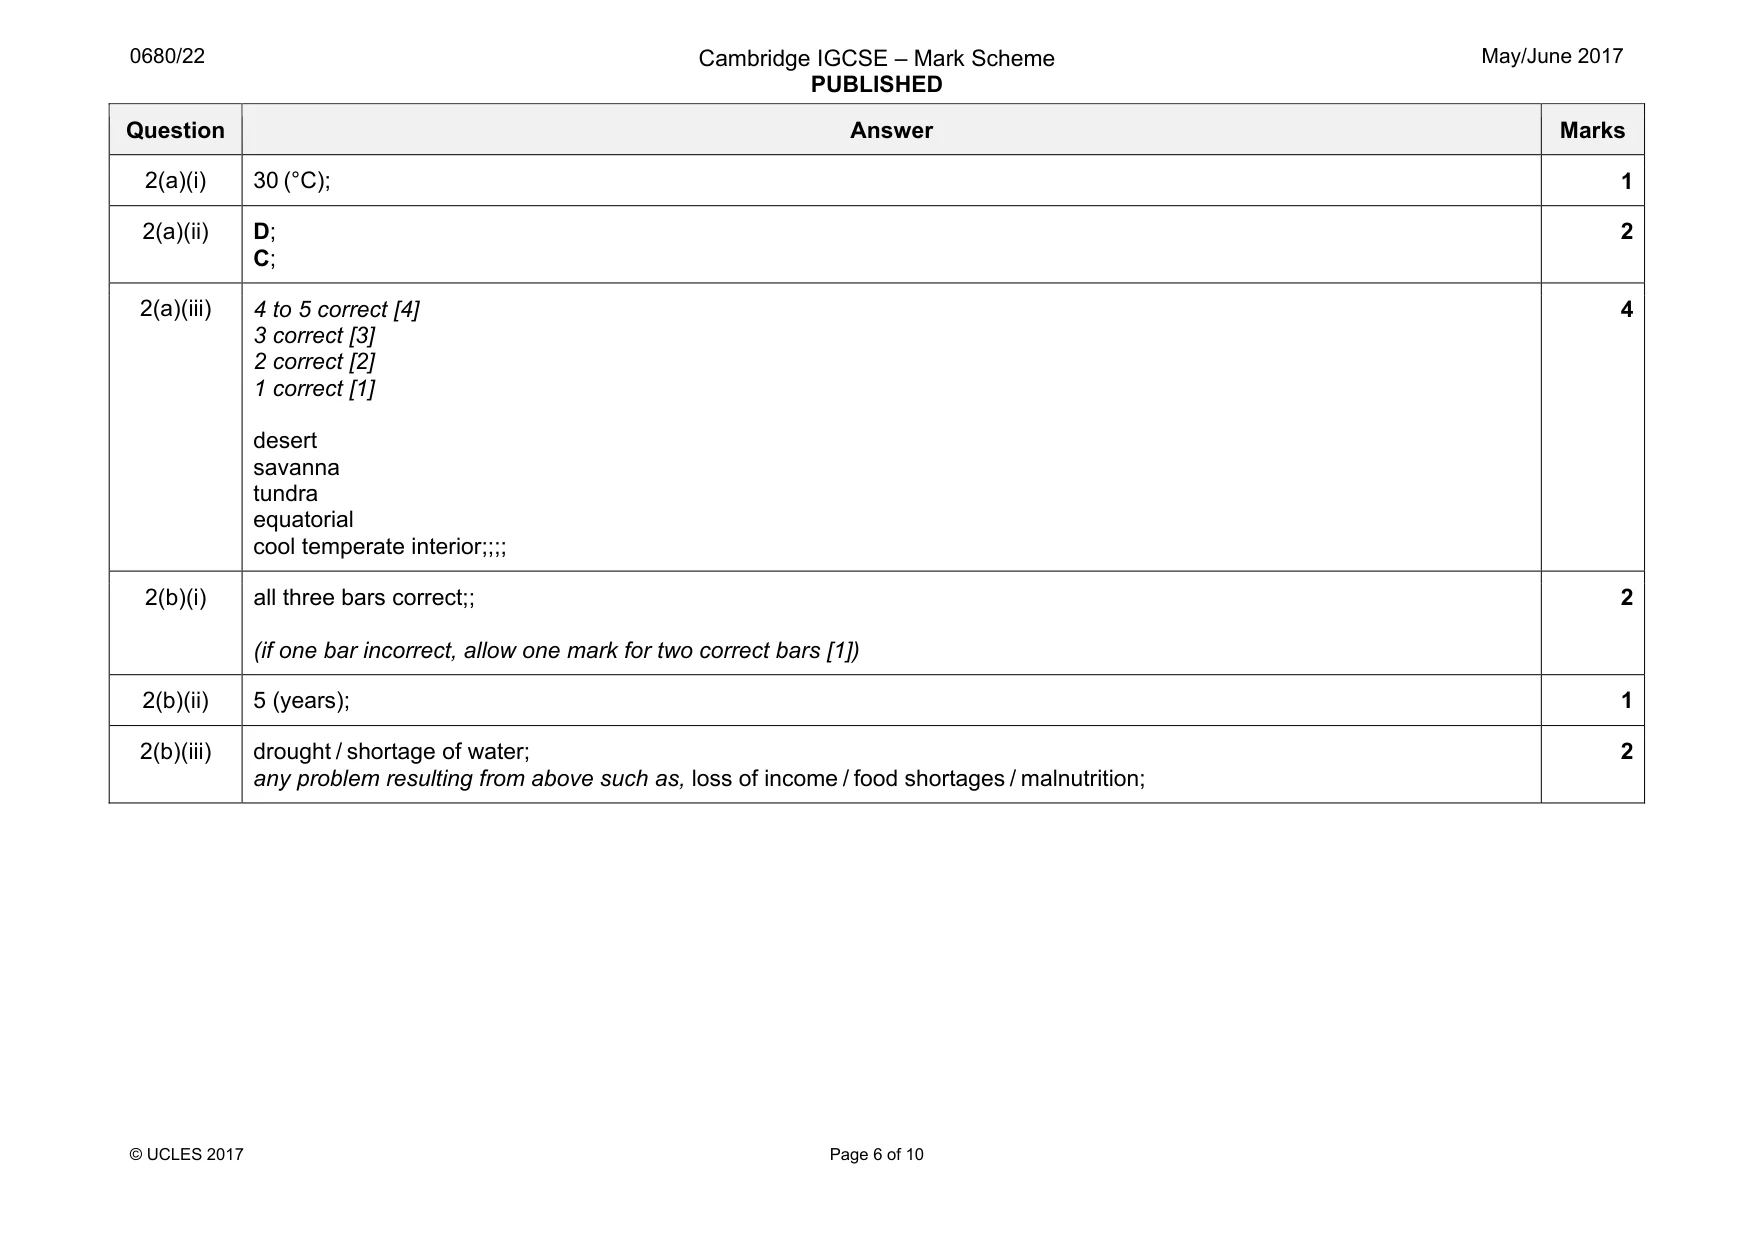
Mark scheme: 2(a)(i) 30 (°C); 1 2(a)(ii) D; C; 2 2(a)(iii) 4 to 5 correct [4] 3 correct [3] 2 correct [2] 1 correct [1] desert savanna tundra equatorial cool temperate interior;;;; 4 2(b)(i) all three bars correct;; (if one bar incorrect, allow one mark for two correct bars [1]) 2 2(b)(ii) 5 (years); 1 2(b)(iii) drought / shortage of water; any problem resulting from above such as, loss of income / food shortages / malnutrition; 2 Question Answer Marks 2(b)(iv) any three of: for years of water shortage: water storage systems; use of groundwater; for irrigation; growing drought resistant crops; for years of excess water: drainage channels; building on, higher land / stilts; soil erosion prevention methods (allow to max of two marks);; 3 2(c)(i) any two of: lots of exposed roots; straight trunks; narrow trunks; long / narrow leaves; 2 2(c)(ii) roots covered in water / swampy; 1 2(c)(iii) any three of: monsoon forest lose leaves in dry season, TRF timing of leaf loss throughout year; monsoon forest 3 layers /no emergent, TRF 4 layers / emergent / TRF has more layers; monsoon forest deep roots, TRF shallow roots; greater biodiversity / more species in TRF; greater biomass in TRF; TRF (appears) evergreen, monsoon forest is not; TRF has buttress roots, monsoon forest does not; TRF less groundcover than Monsoon forest; 3 Question Answer Marks 2(d)(i) (flows) north to south / southwards / SSE / (bearing) 160–180°; 1 2(d)(ii) 5; China; 2 2(d)(iii) any two of: from (southern) China to Cambodia / list of countries / all countries except Vietnam / throughout length of the river; cluster / 5 in N Laos; cluster / 5 in S Laos and Cambodia; few in China; 2 Question Answer Marks 2(d)(iv) any three farmers points plus two fishermen points OR any three fishermen points plus two farmers points: Farmers: negative points: lack of floods; so no silt deposited; leading to loss of fertility; leading to increased costs of fertilisers; lack of flooding means certain crops (rice) can’t be grown; salt penetrates delta; reducing fertility of the soil; farmland lost due to, dam / reservoir; farmers displaced; reduced, yield / food / income; positive points: water stored for irrigation; double cropping possible; floods, stopped / reduced; so no, crop / animal, loss; increased, yield / food / income; Fishermen: negative points: dams stop fish migration; causing decrease in, breeding / fish stocks; may lead to extinction of some species; salt water penetrates delta; reducing number of fresh water fish; reduced, catch / food / income; positive points: fish farming possible in reservoirs; leading to increased, catch / income; 5 Question Answer Marks 2(d)(v) any three of: to aid development; to power industry; to export electricity to neighbouring countries; to provide power for increasingly affluent population; to provide power for increasing population; floods devastate economy; 3 2(e) Level of response marked question: Level 3 [5–6 marks] Answers must look at causes of water shortages and strategies that could overcome them in affected countries and reach a conclusion and be aware that not all countries face water shortage. Detail of at least three aspects for max marks. Two aspects covered well and a balance will be sufficient for five marks. Level 2 [3–4 marks] Answers should look at causes and strategies that could overcome water shortages but with only limited detail or concentrate on strategies. Good answers of this type covering at least two aspects can achieve four marks; those that lack some detail, three marks. Level 1 [1–2 marks] Answers will be basic with little detail / explanation. Most will be descriptive or a list of problems caused by lack of rain or increasing demand without really addressing the question. No response or no creditable response [0]. Level of response marking indicative content: Some countries are water poor; e.g. in arid and semi-arid regions; so will struggle to meet demand; especially as populations increase. Water supply may be reduced by upstream countries extracting more water from rivers. Climate change may reduce rainfall in some parts and increase it in others. As Earth warms rainfall more likely to increase. Underground supplies largely being used faster than they are refilled. More pollution of water as increased industry and use of pesticides. Coastal countries may use desalination; but this is expensive and uses a lot of energy. Recycling of water is important for countries facing water poverty. Some countries have sufficient water due to high rainfall and/or low population. 6
What was in this paper
The subtopics covered by these 2 questions, and how many questions each got. Open one in a new tab to see every Cambridge question on it.
What you needed in this session
Cambridge’s own grade thresholds for 2017 May/June, Paper 2 · Variant 2. A higher threshold means an easier paper — the bar moves with how the cohort did.