Cambridge IGCSE Environmental Management 0680 — 2017 May/June Paper 2 · Variant 1
0680/21/M/J/17 · 2 questions · 80 marks · ≈90 min
The question paper and its mark scheme, free to read here and free to download. This is Cambridge’s own paper, exactly as it was sat.
Question paper16 pages
Mark scheme8 pages
Answers below. Sit the paper first if you are practising.
Questions as text
Q1 · State a weather instrument used to measure: temperature…
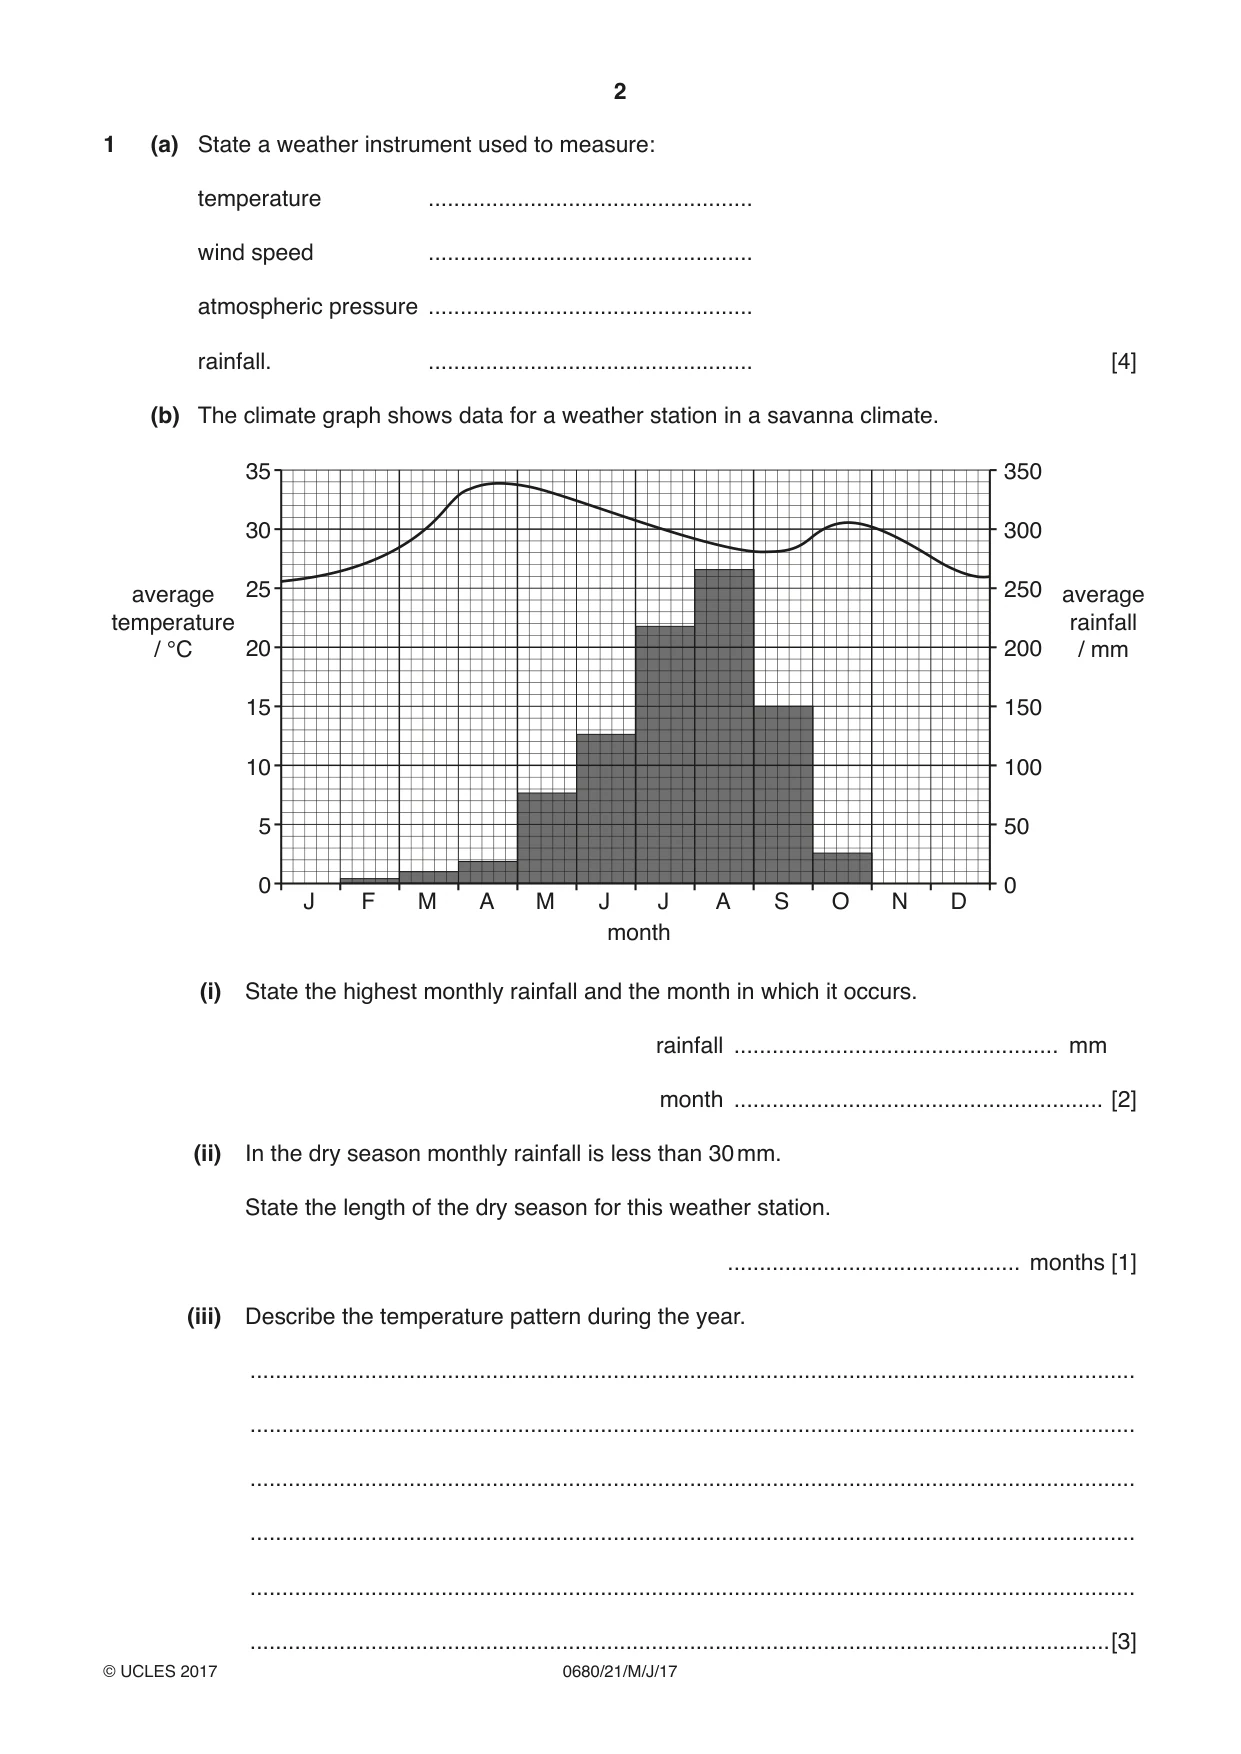
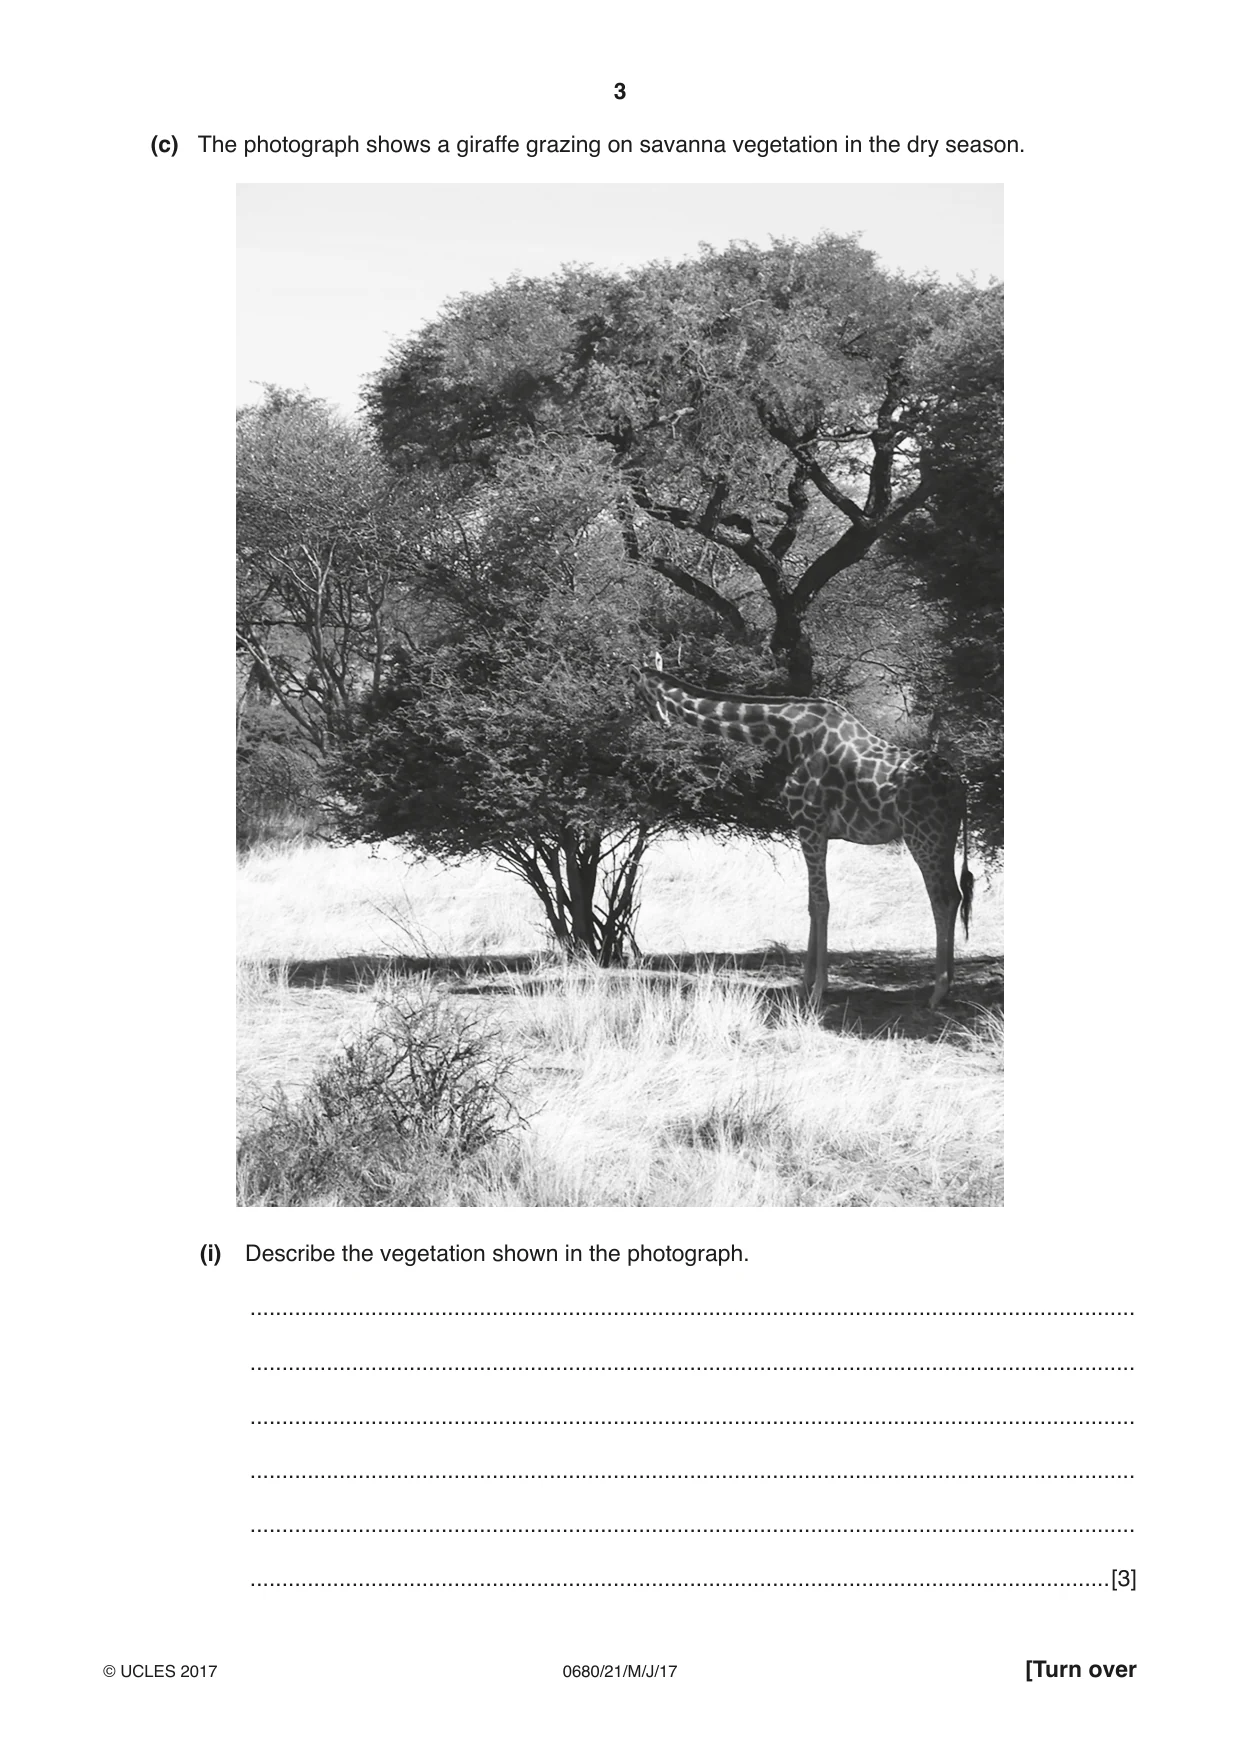
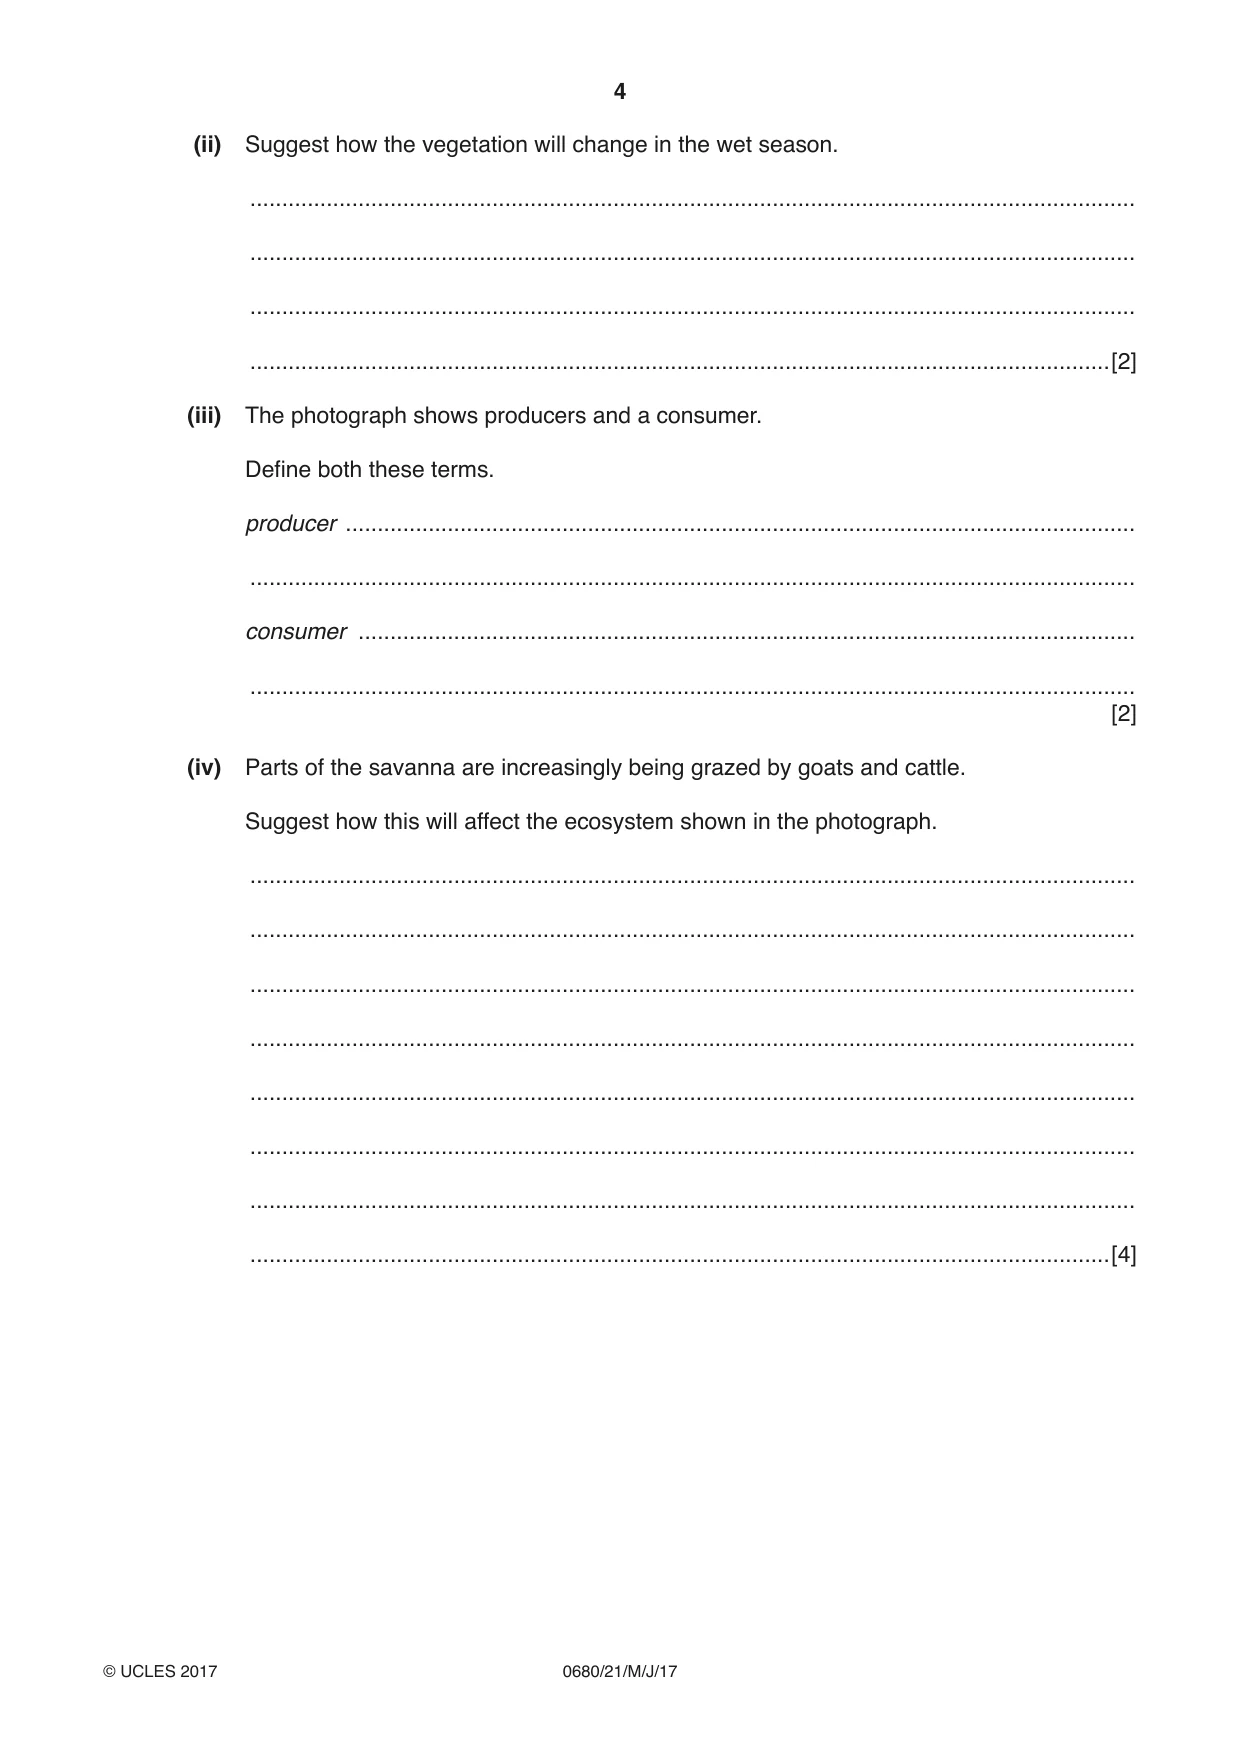
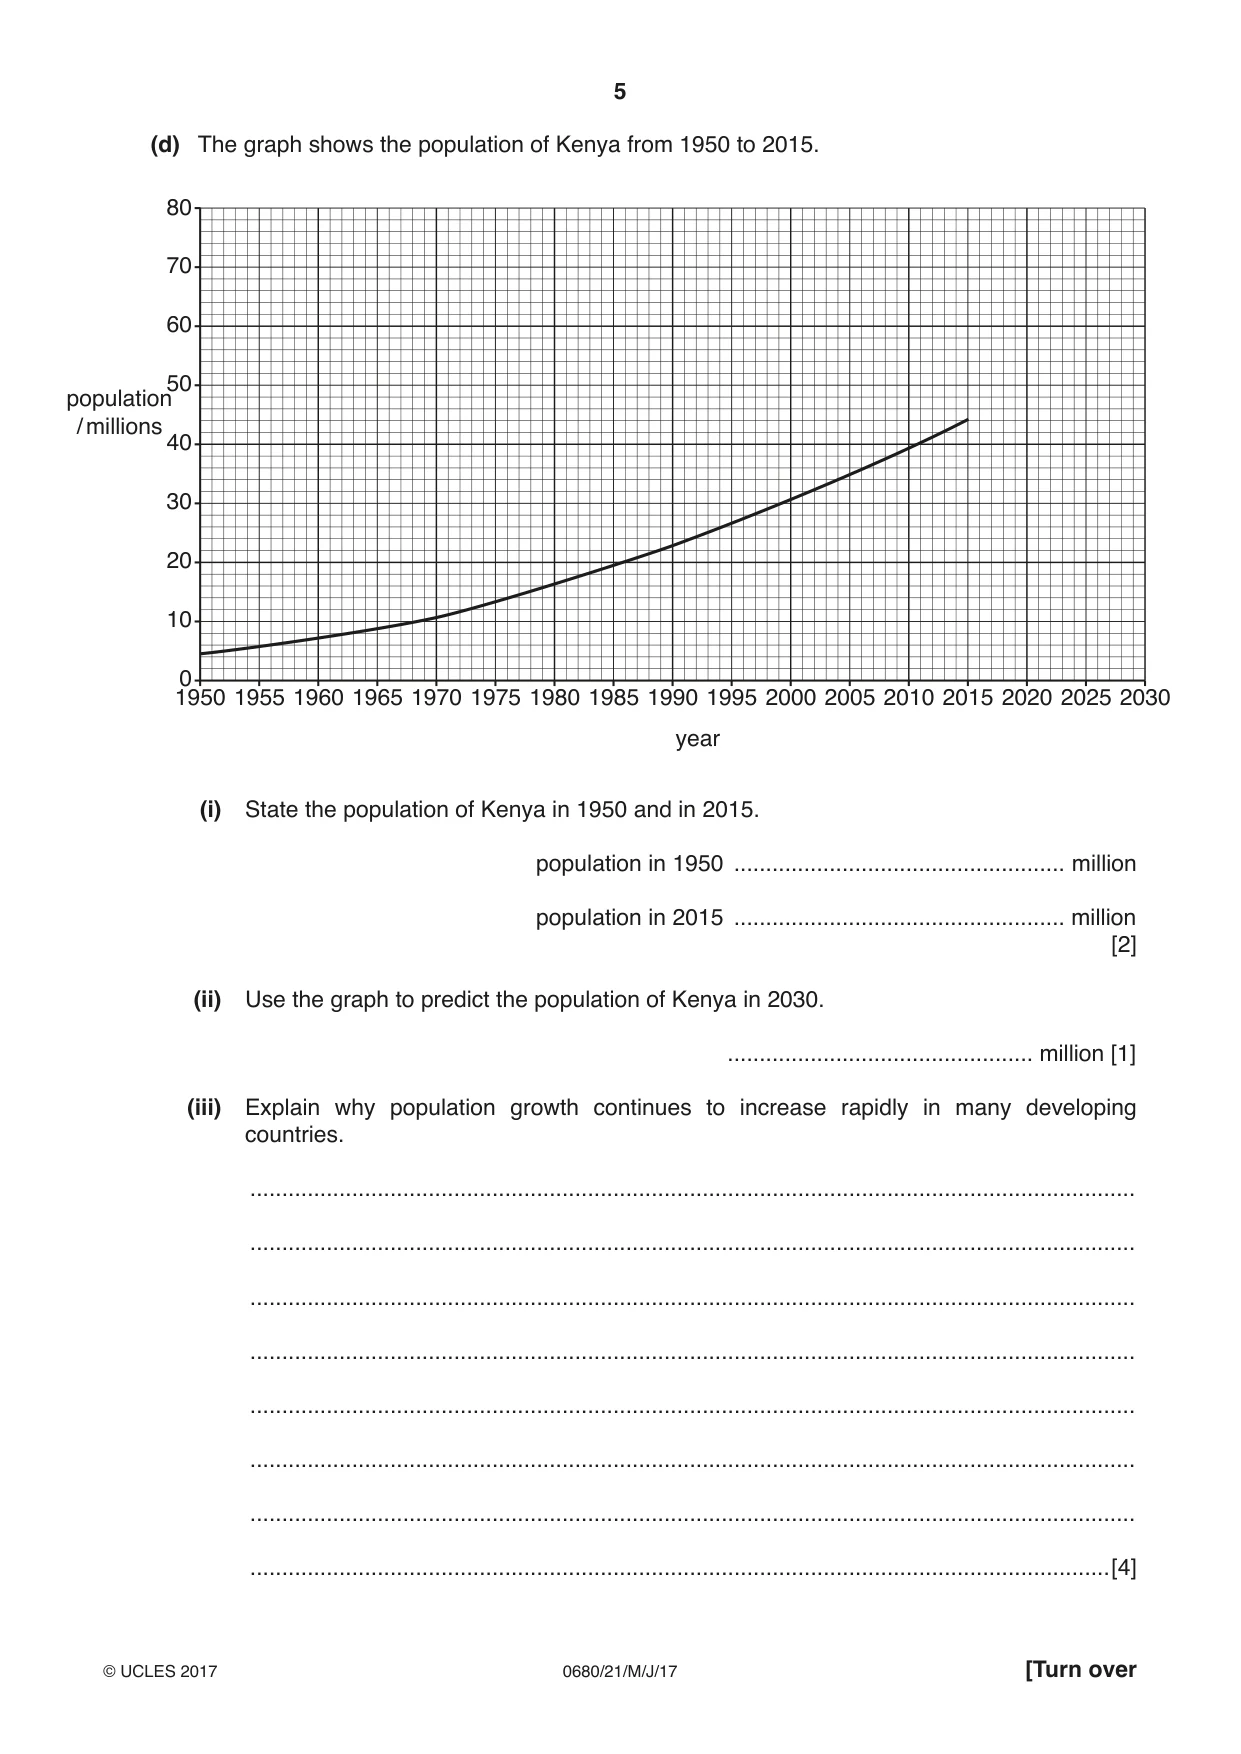
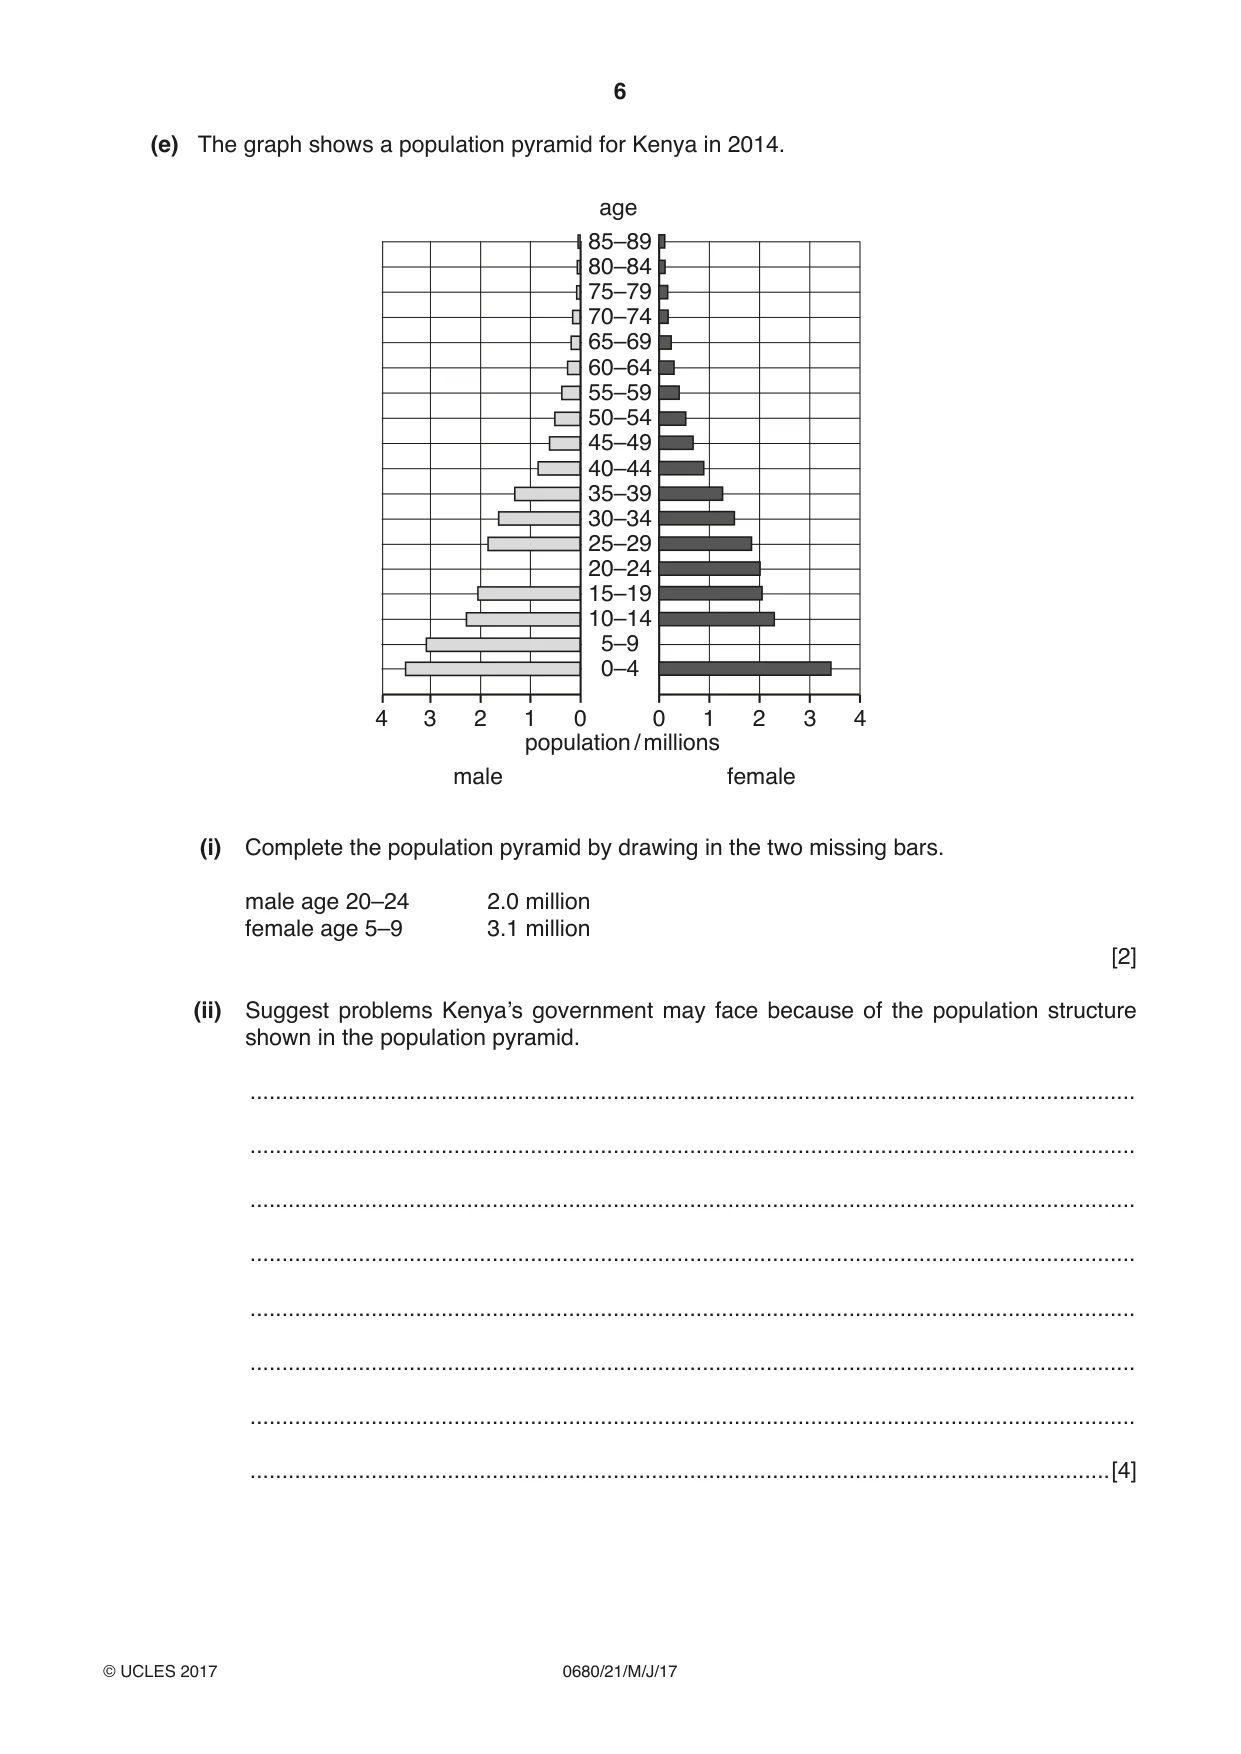
1 (a) State a weather instrument used to measure: temperature ................................................... wind speed ................................................... atmospheric pressure ................................................... rainfall. ................................................... [4] (b) The climate graph shows data for a weather station in a savanna climate. 35 350 30 300 average 25 250 average temperature rainfall / °C 20 200 / mm 15 150 10 100 5 50 0 0 J F M A M J J A S O N D month (i) State the highest monthly rainfall and the month in which it occurs. rainfall ................................................... mm month .......................................................... [2] (ii) In the dry season monthly rainfall is less than 30 mm. State the length of the dry season for this weather station. .............................................. months [1] (iii) Describe the temperature pattern during the year. ........................................................................................................................................... ........................................................................................................................................... ........................................................................................................................................... ........................................................................................................................................... ........................................................................................................................................... .......................................................................................................................................[3] (c) The photograph shows a giraffe grazing on savanna vegetation in the dry season. (i) Describe the vegetation shown in the photograph. ........................................................................................................................................... ........................................................................................................................................... ........................................................................................................................................... ........................................................................................................................................... ........................................................................................................................................... .......................................................................................................................................[3] (ii) Suggest how the vegetation will change in the wet season. ........................................................................................................................................... ........................................................................................................................................... ........................................................................................................................................... .......................................................................................................................................[2] (iii) The photograph shows producers and a consumer. Define both these terms. producer ............................................................................................................................ ........................................................................................................................................... consumer .......................................................................................................................... ........................................................................................................................................... [2] (iv) Parts of the savanna are increasingly being grazed by goats and cattle. Suggest how this will affect the ecosystem shown in the photograph. ........................................................................................................................................... ........................................................................................................................................... ........................................................................................................................................... ........................................................................................................................................... ........................................................................................................................................... ........................................................................................................................................... ........................................................................................................................................... .......................................................................................................................................[4] (d) The graph shows the population of Kenya from 1950 to 2015. 80 70 60 50population / millions 40 30 20 10 0 1950 1955 1960 1965 1970 1975 1980 1985 1990 1995 2000 2005 2010 2015 2020 2025 2030 year (i) State the population of Kenya in 1950 and in 2015. population in 1950 .................................................... million population in 2015 .................................................... million [2] (ii) Use the graph to predict the population of Kenya in 2030. ................................................ million [1] (iii) Explain why population growth continues to increase rapidly in many developing countries. ........................................................................................................................................... ........................................................................................................................................... ........................................................................................................................................... ........................................................................................................................................... ........................................................................................................................................... ........................................................................................................................................... ........................................................................................................................................... .......................................................................................................................................[4] (e) The graph shows a population pyramid for Kenya in 2014. age 85–89 80–84 75–79 70–74 65–69 60–64 55–59 50–54 45–49 40–44 35–39 30–34 25–29 20–24 15–19 10–14 5–9 0–4 4 3 2 1 0 0 1 2 3 4 population / millions male female (i) Complete the population pyramid by drawing in the two missing bars. male age 20–24 2.0 million female age 5–9 3.1 million [2] (ii) Suggest problems Kenya’s government may face because of the population structure shown in the population pyramid. ........................................................................................................................................... ........................................................................................................................................... ........................................................................................................................................... ........................................................................................................................................... ........................................................................................................................................... ........................................................................................................................................... ........................................................................................................................................... .......................................................................................................................................[4] (f) ‘Reducing the world’s population growth is the best way to solve environmental problems.’ How far do you agree with this statement? Give reasons for your answer. ................................................................................................................................................... ................................................................................................................................................... ................................................................................................................................................... ................................................................................................................................................... ................................................................................................................................................... ................................................................................................................................................... ................................................................................................................................................... ................................................................................................................................................... ................................................................................................................................................... ................................................................................................................................................... ................................................................................................................................................... ...............................................................................................................................................[6]
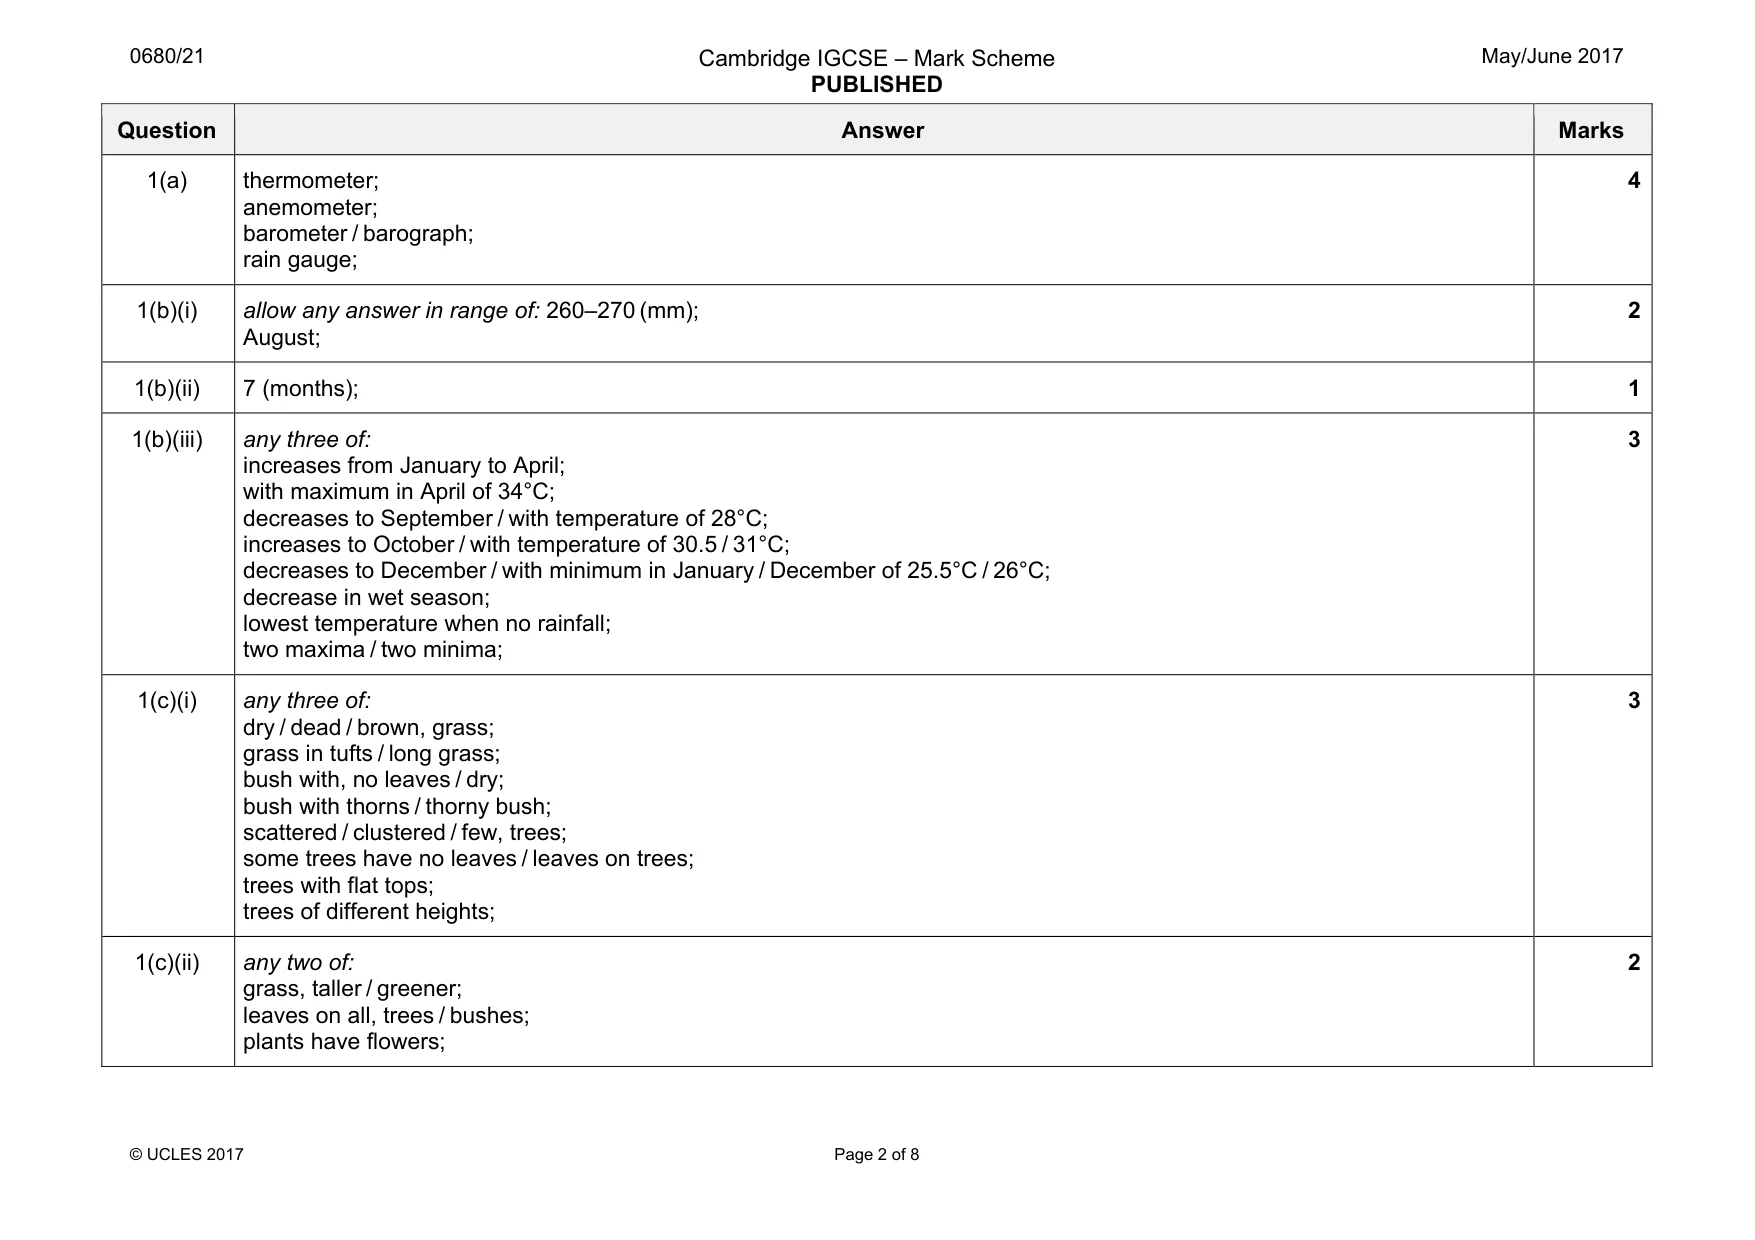
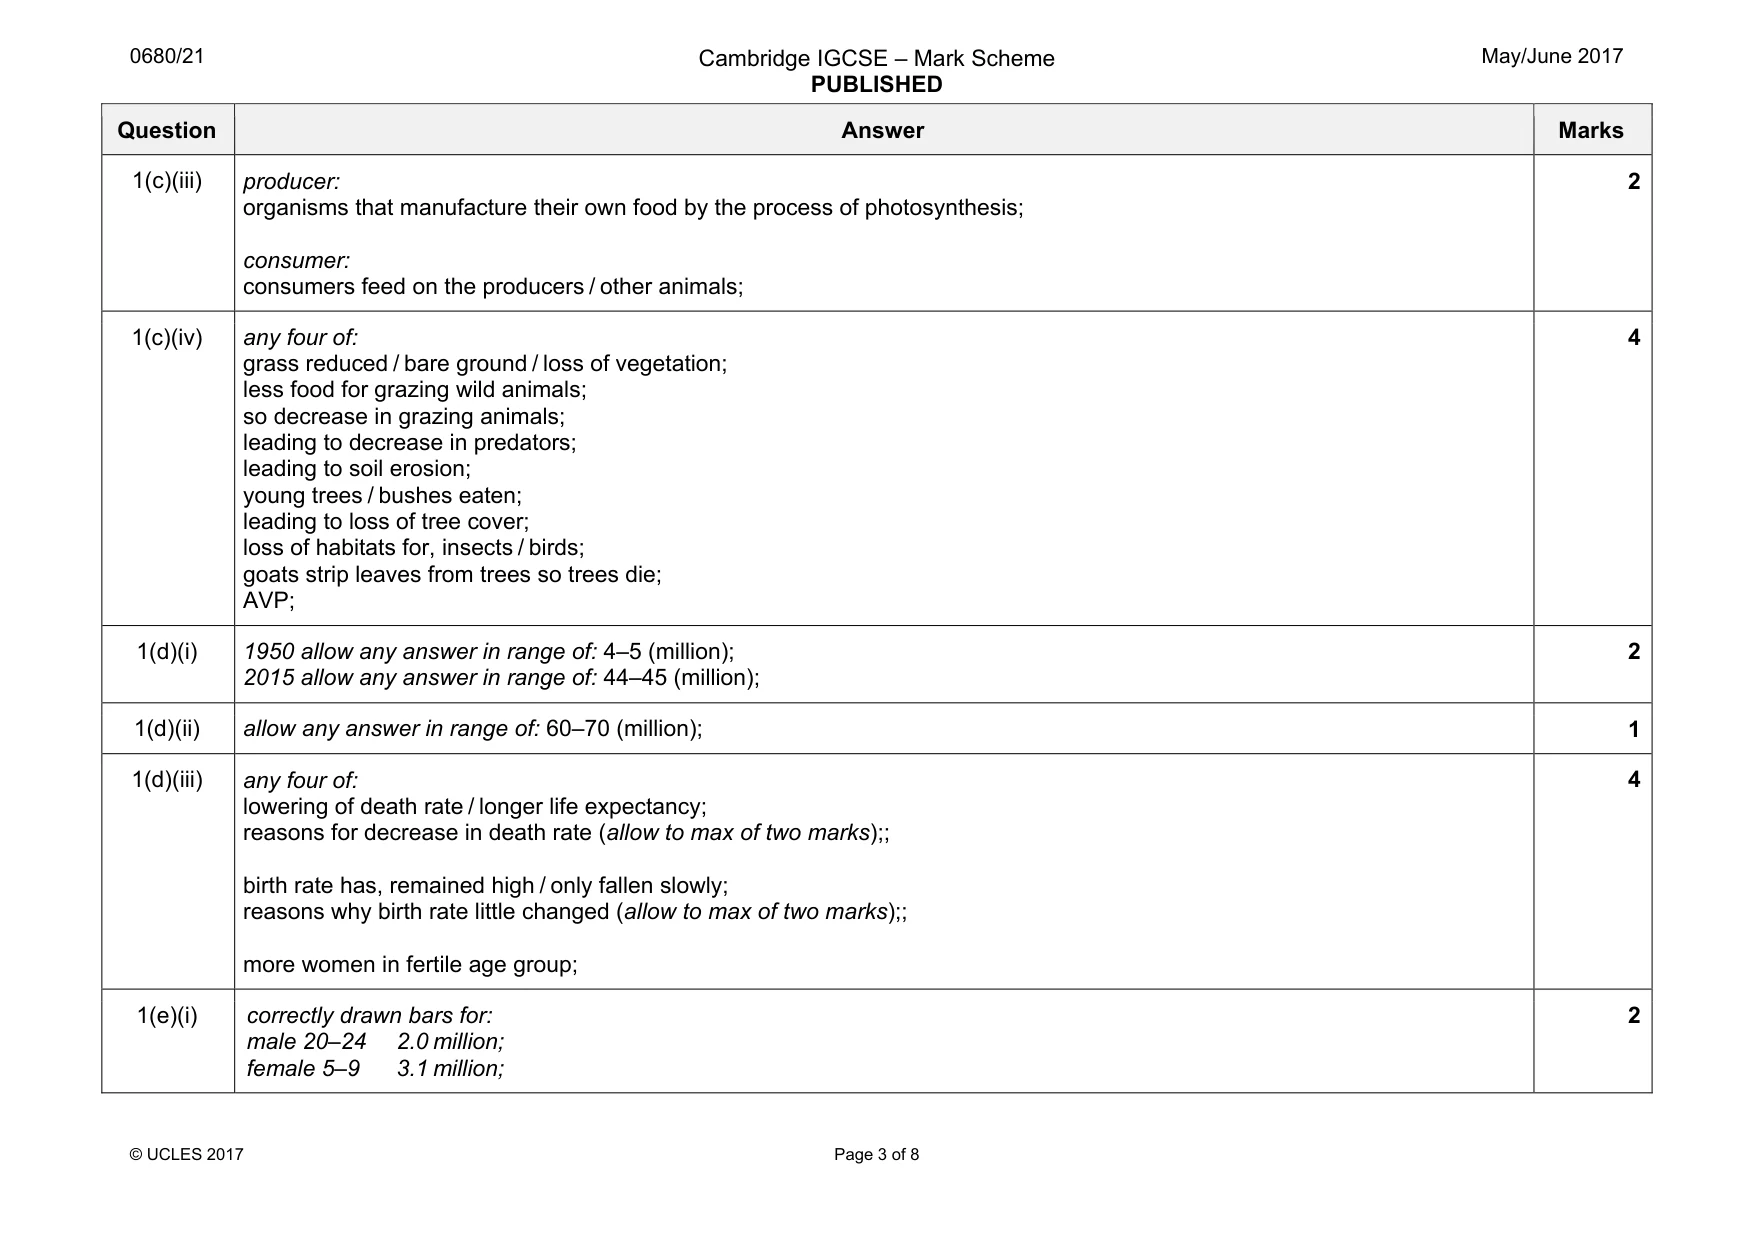
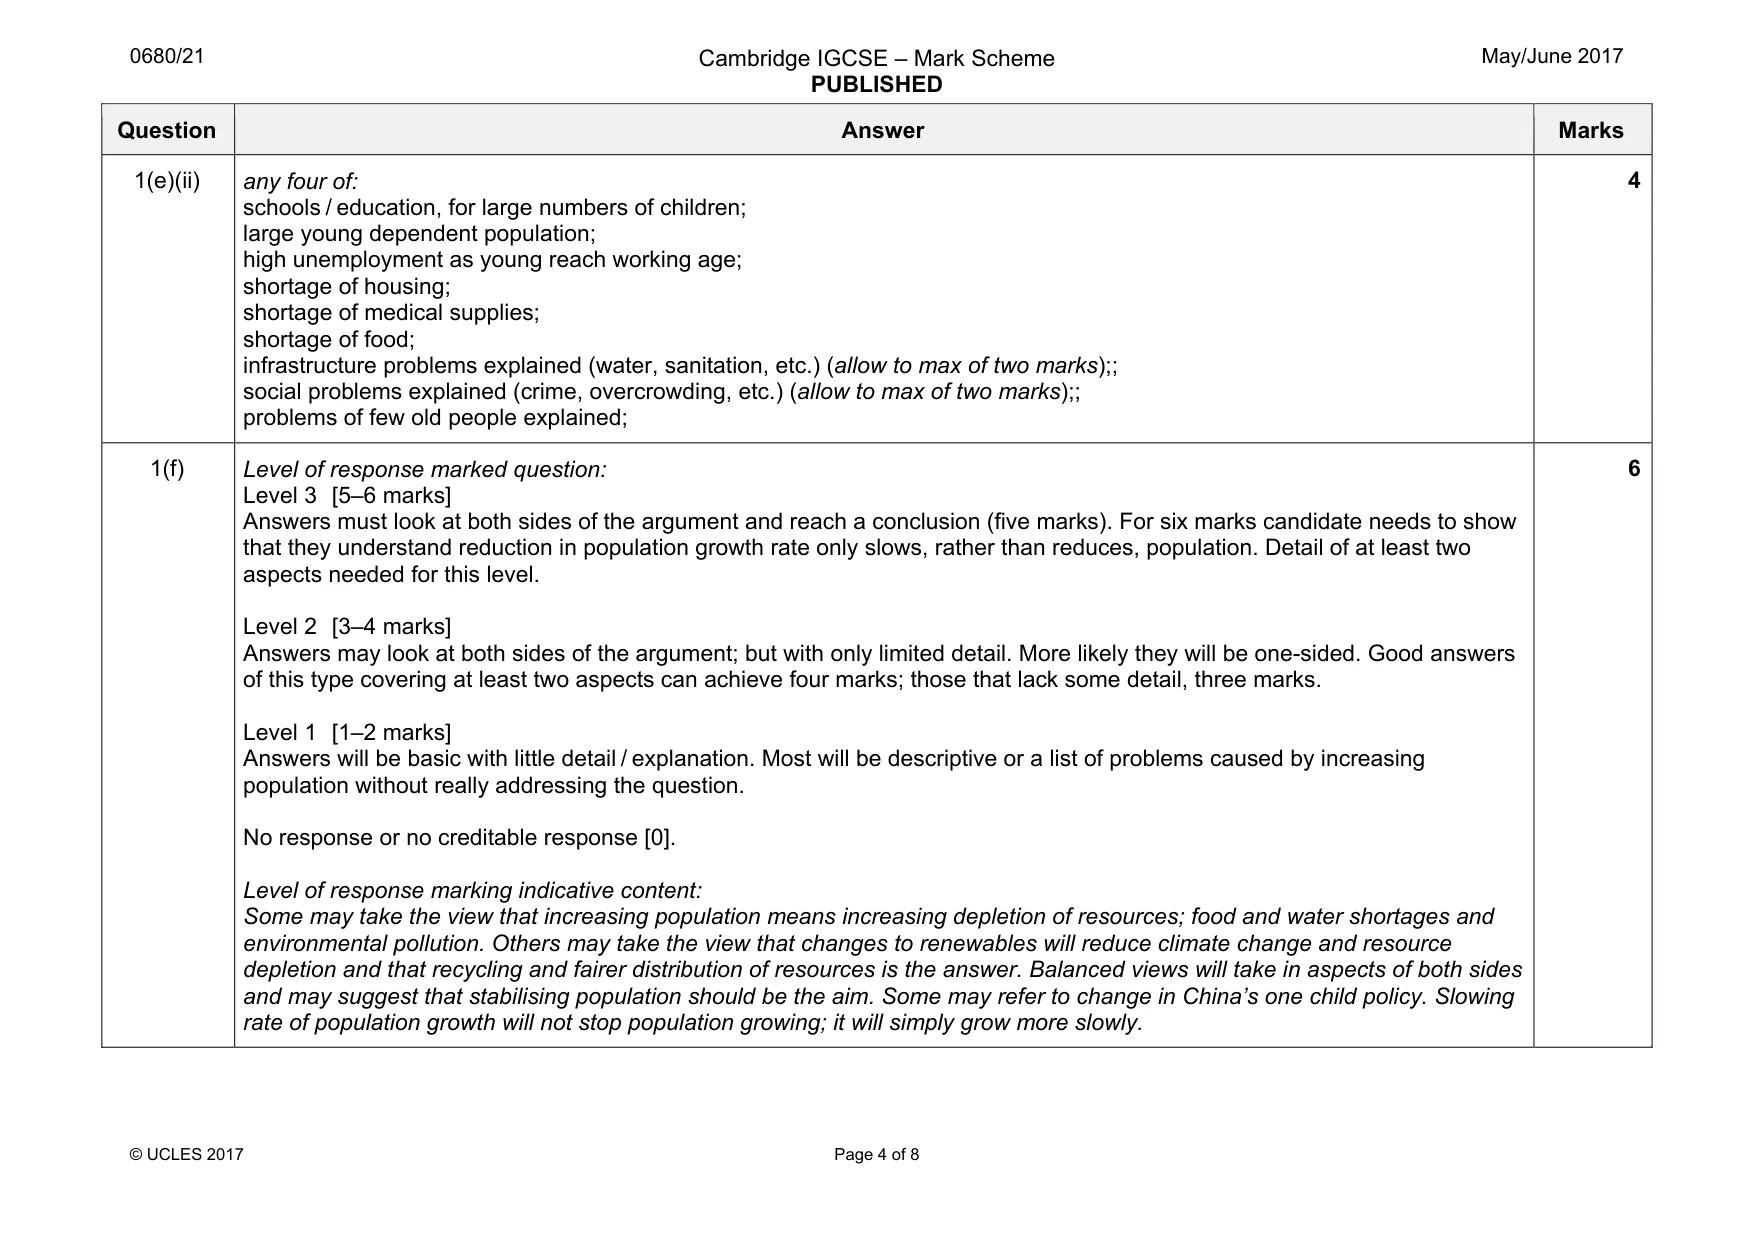
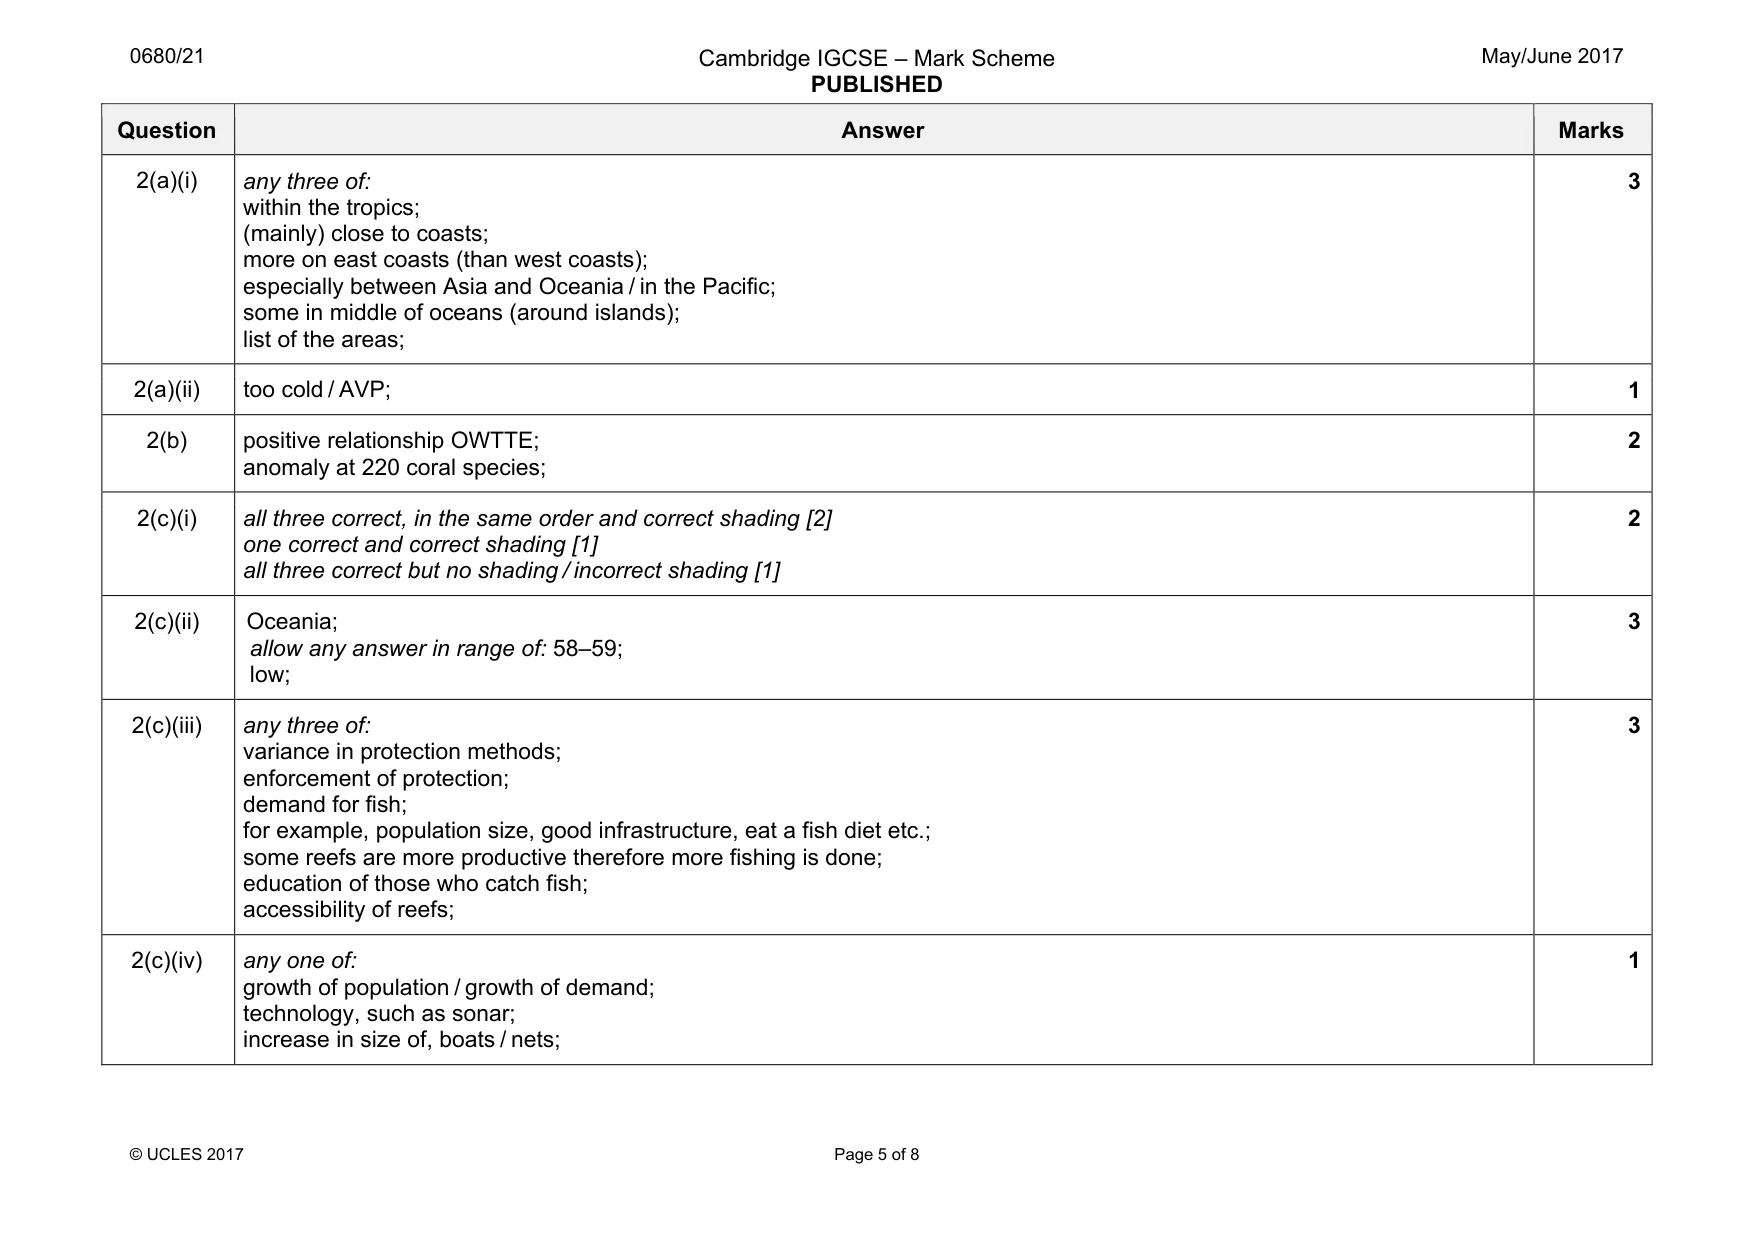
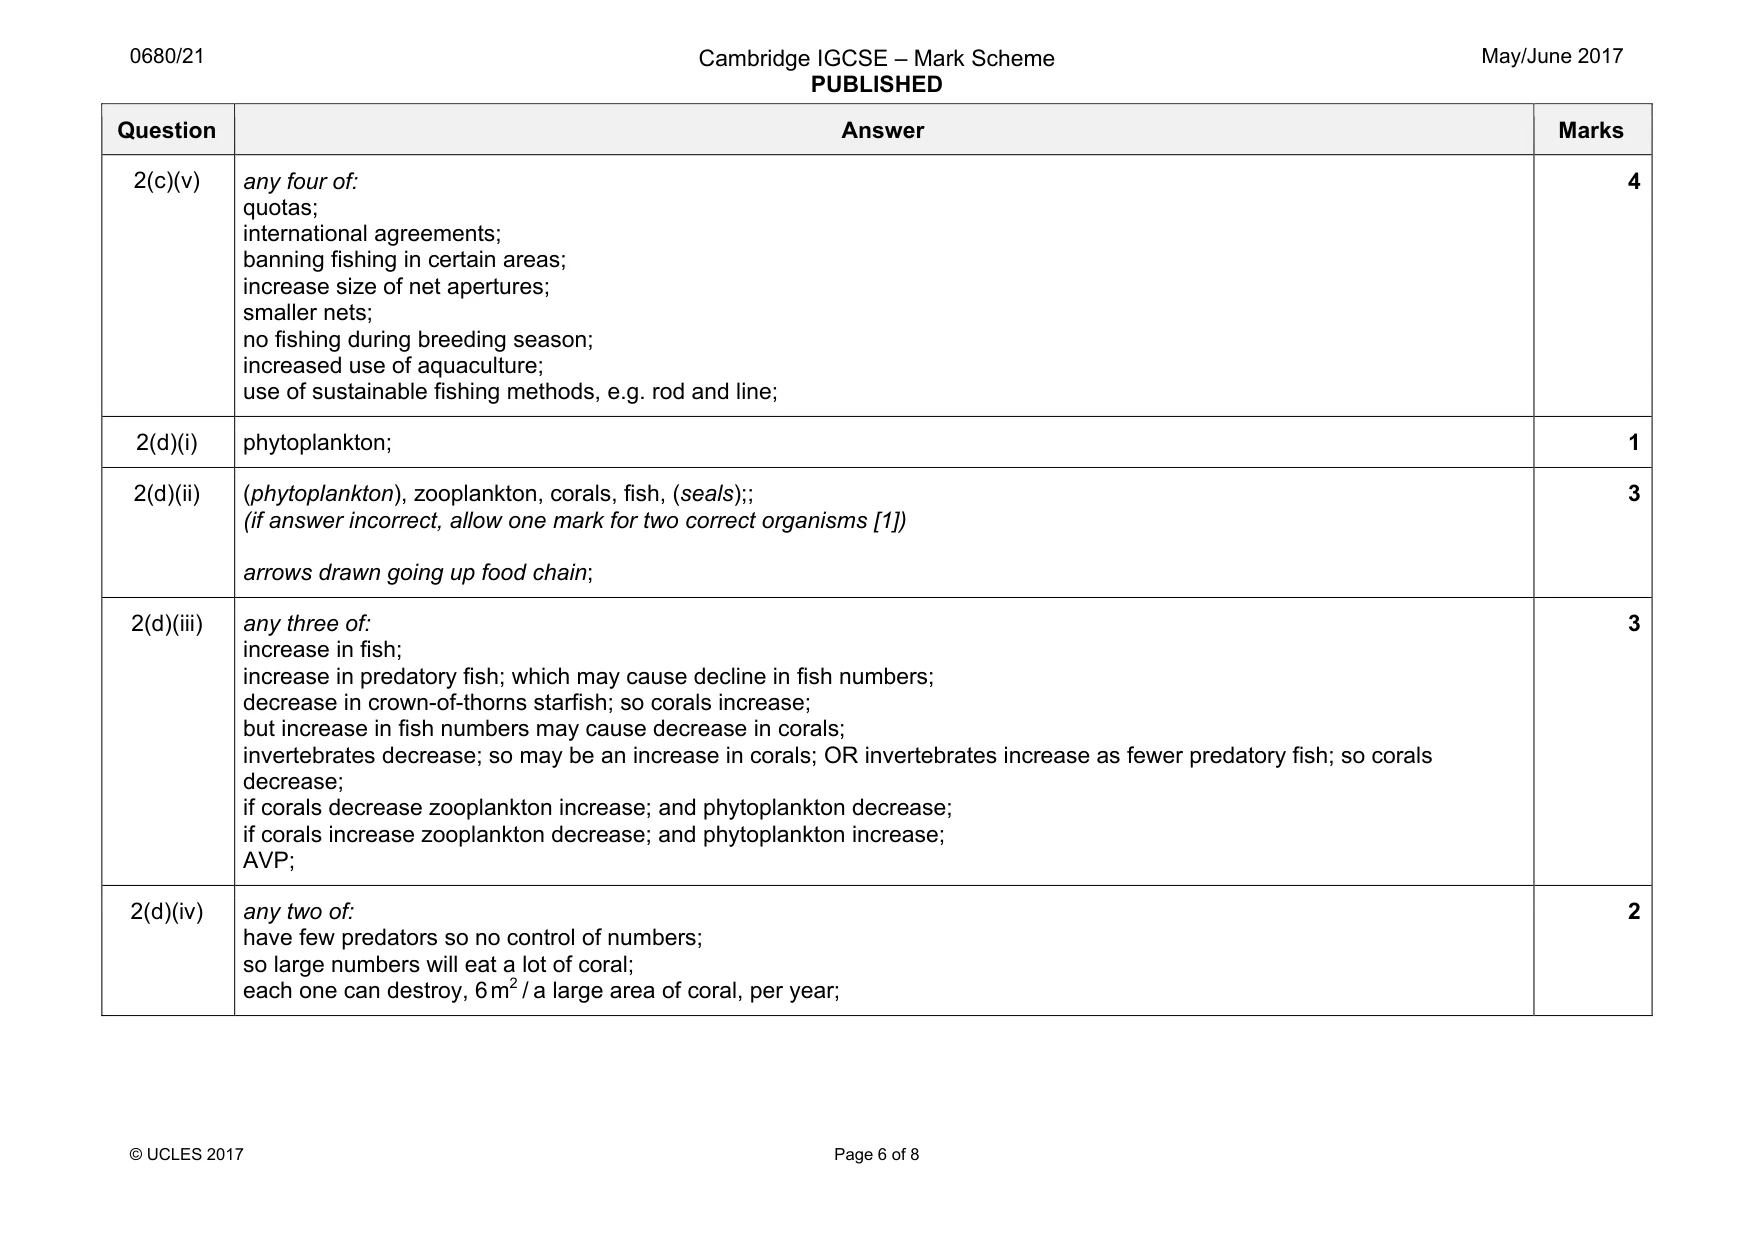
Mark scheme: 1(a) thermometer; anemometer; barometer / barograph; rain gauge; 4 1(b)(i) allow any answer in range of: 260–270 (mm); August; 2 1(b)(ii) 7 (months); 1 1(b)(iii) any three of: increases from January to April; with maximum in April of 34°C; decreases to September / with temperature of 28°C; increases to October / with temperature of 30.5 / 31°C; decreases to December / with minimum in January / December of 25.5°C / 26°C; decrease in wet season; lowest temperature when no rainfall; two maxima / two minima; 3 1(c)(i) any three of: dry / dead / brown, grass; grass in tufts / long grass; bush with, no leaves / dry; bush with thorns / thorny bush; scattered / clustered / few, trees; some trees have no leaves / leaves on trees; trees with flat tops; trees of different heights; 3 1(c)(ii) any two of: grass, taller / greener; leaves on all, trees / bushes; plants have flowers; 2 Question Answer Marks 1(c)(iii) producer: organisms that manufacture their own food by the process of photosynthesis; consumer: consumers feed on the producers / other animals; 2 1(c)(iv) any four of: grass reduced / bare ground / loss of vegetation; less food for grazing wild animals; so decrease in grazing animals; leading to decrease in predators; leading to soil erosion; young trees / bushes eaten; leading to loss of tree cover; loss of habitats for, insects / birds; goats strip leaves from trees so trees die; AVP; 4 1(d)(i) 1950 allow any answer in range of: 4–5 (million); 2015 allow any answer in range of: 44–45 (million); 2 1(d)(ii) allow any answer in range of: 60–70 (million); 1 1(d)(iii) any four of: lowering of death rate / longer life expectancy; reasons for decrease in death rate (allow to max of two marks);; birth rate has, remained high / only fallen slowly; reasons why birth rate little changed (allow to max of two marks);; more women in fertile age group; 4 1(e)(i) correctly drawn bars for: male 20–24 2.0 million; female 5–9 3.1 million; 2 Question Answer Marks 1(e)(ii) any four of: schools / education, for large numbers of children; large young dependent population; high unemployment as young reach working age; shortage of housing; shortage of medical supplies; shortage of food; infrastructure problems explained (water, sanitation, etc.) (allow to max of two marks);; social problems explained (crime, overcrowding, etc.) (allow to max of two marks);; problems of few old people explained; 4 1(f) Level of response marked question: Level 3 [5–6 marks] Answers must look at both sides of the argument and reach a conclusion (five marks). For six marks candidate needs to show that they understand reduction in population growth rate only slows, rather than reduces, population. Detail of at least two aspects needed for this level. Level 2 [3–4 marks] Answers may look at both sides of the argument; but with only limited detail. More likely they will be one-sided. Good answers of this type covering at least two aspects can achieve four marks; those that lack some detail, three marks. Level 1 [1–2 marks] Answers will be basic with little detail / explanation. Most will be descriptive or a list of problems caused by increasing population without really addressing the question. No response or no creditable response [0]. Level of response marking indicative content: Some may take the view that increasing population means increasing depletion of resources; food and water shortages and environmental pollution. Others may take the view that changes to renewables will reduce climate change and resource depletion and that recycling and fairer distribution of resources is the answer. Balanced views will take in aspects of both sides and may suggest that stabilising population should be the aim. Some may refer to change in China’s one child policy. Slowing rate of population growth will not stop population growing; it will simply grow more slowly. 6
Q2 · The map shows the location of coral reefs
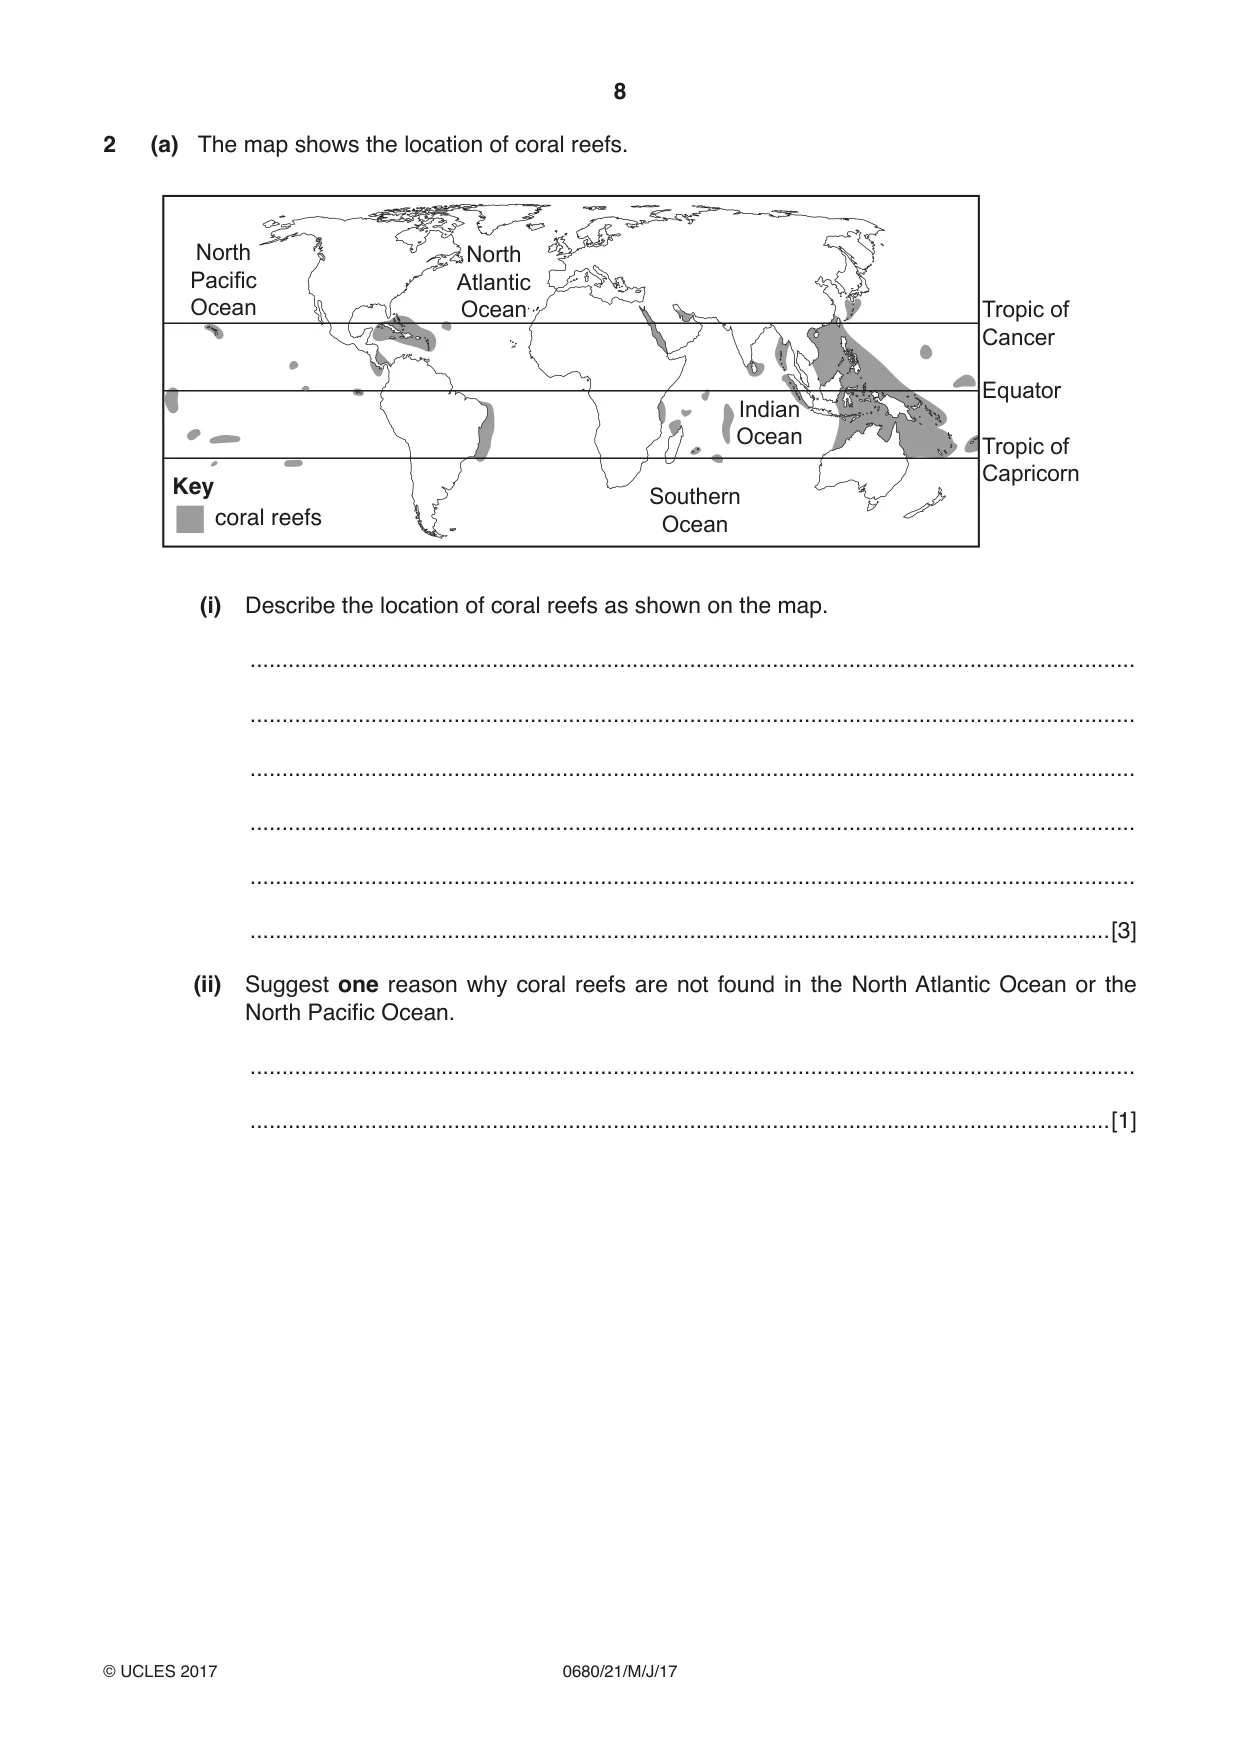
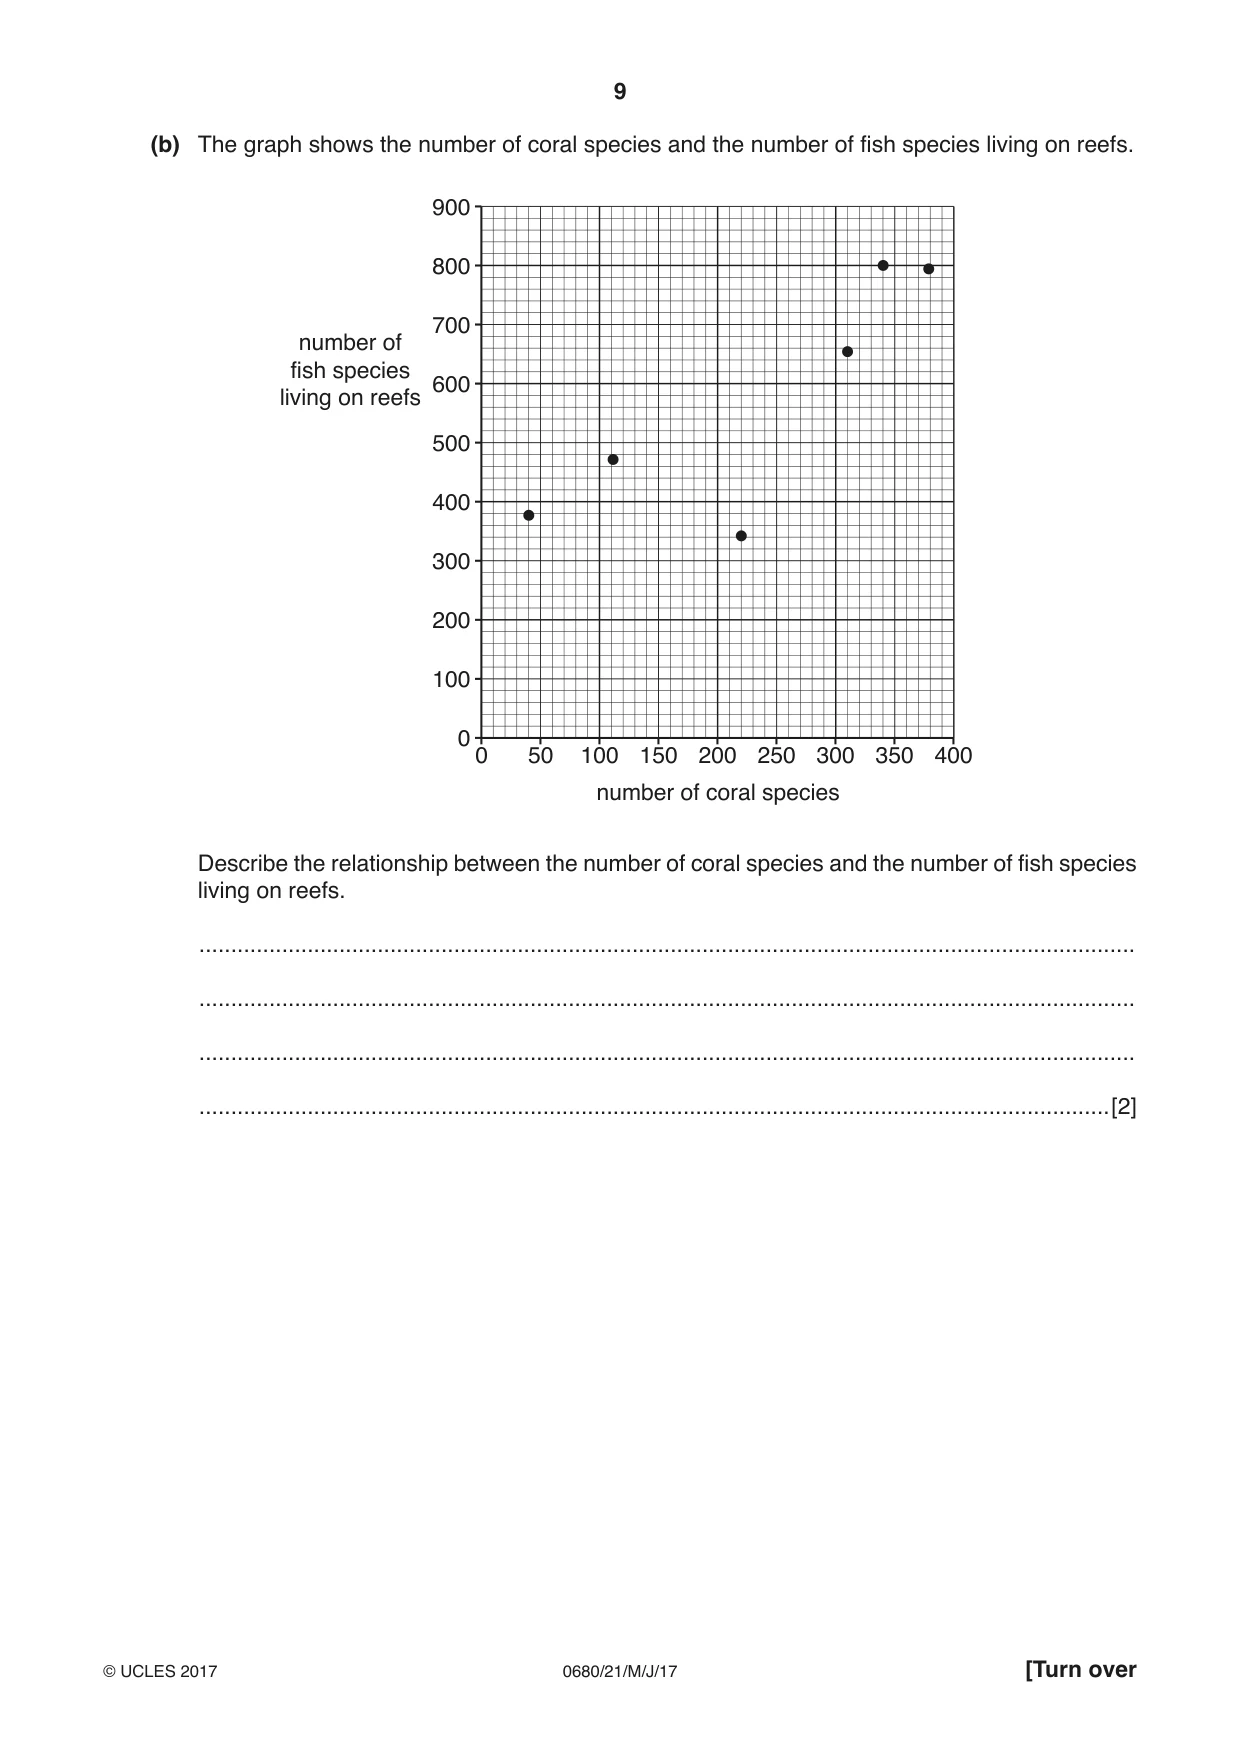
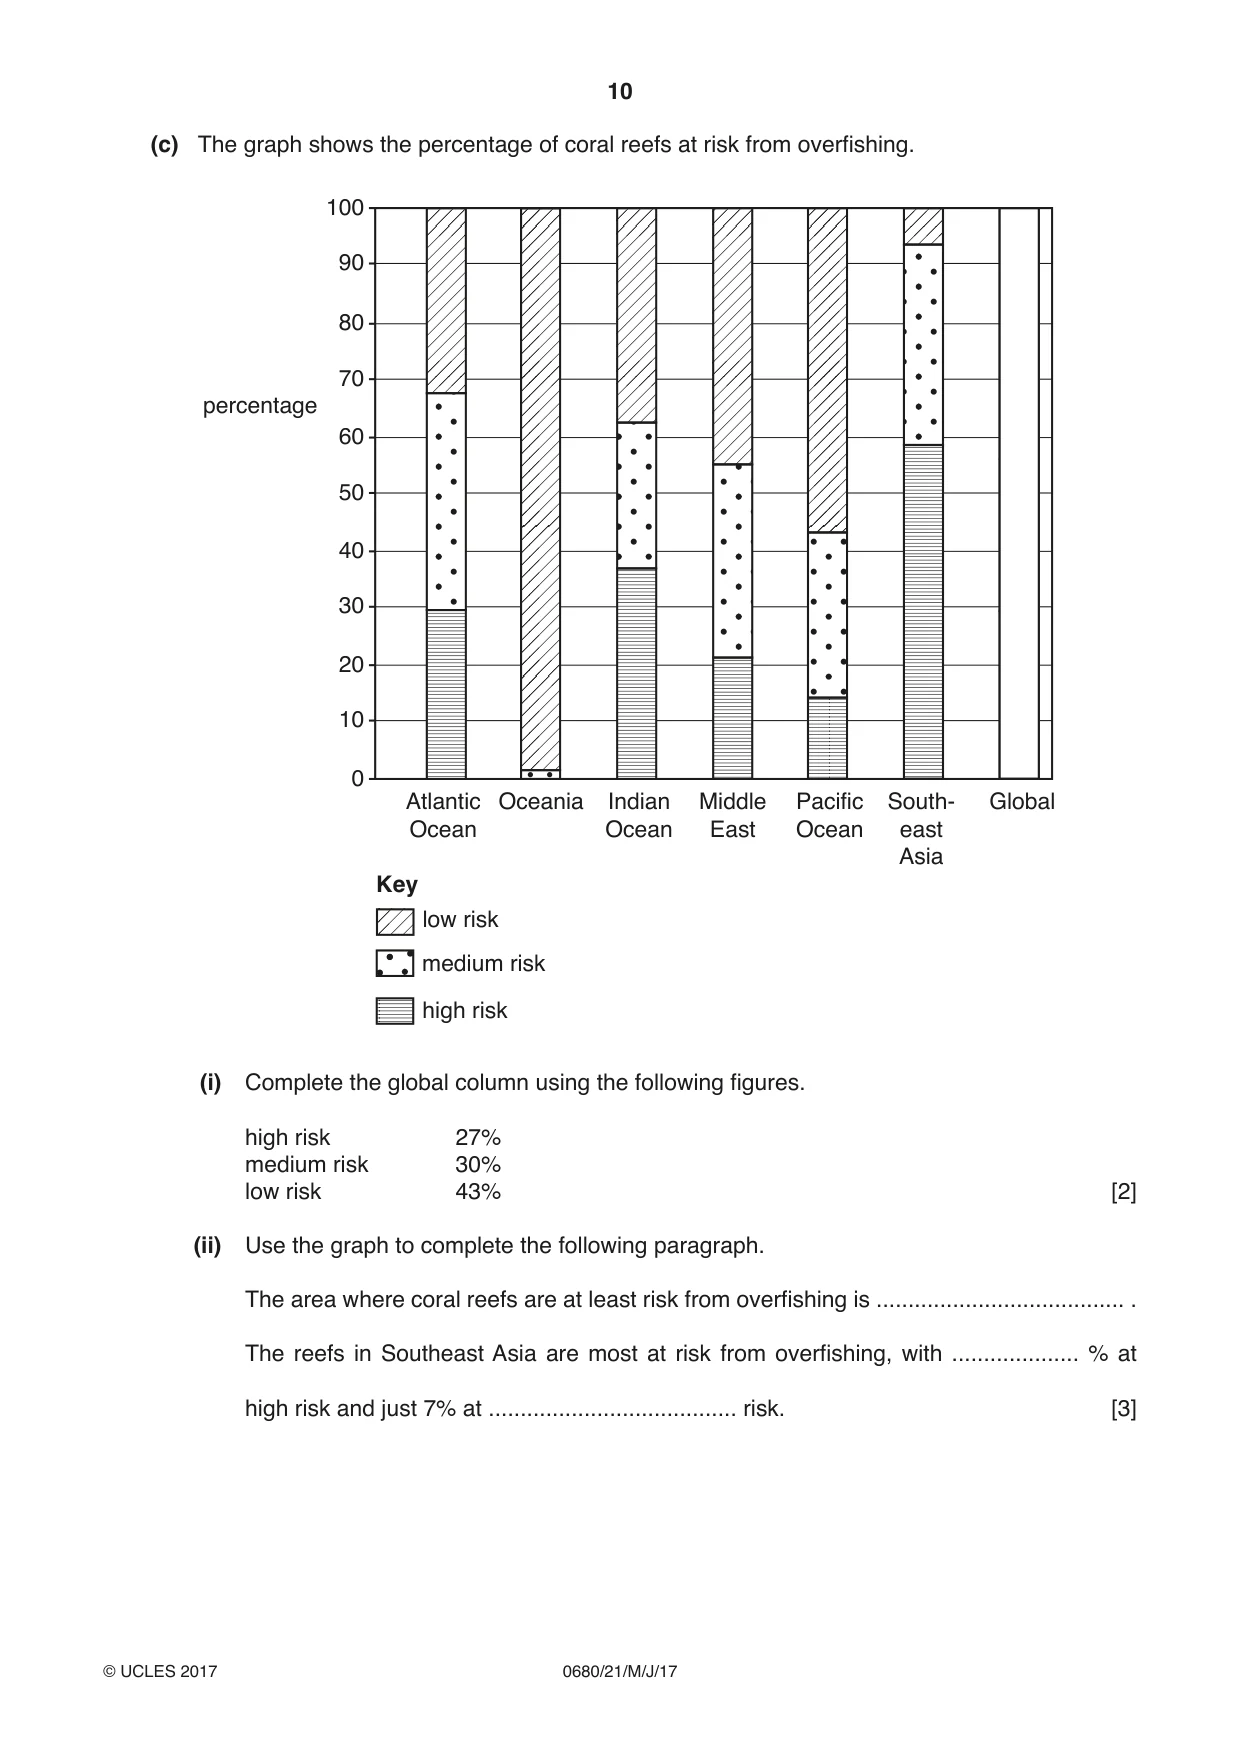
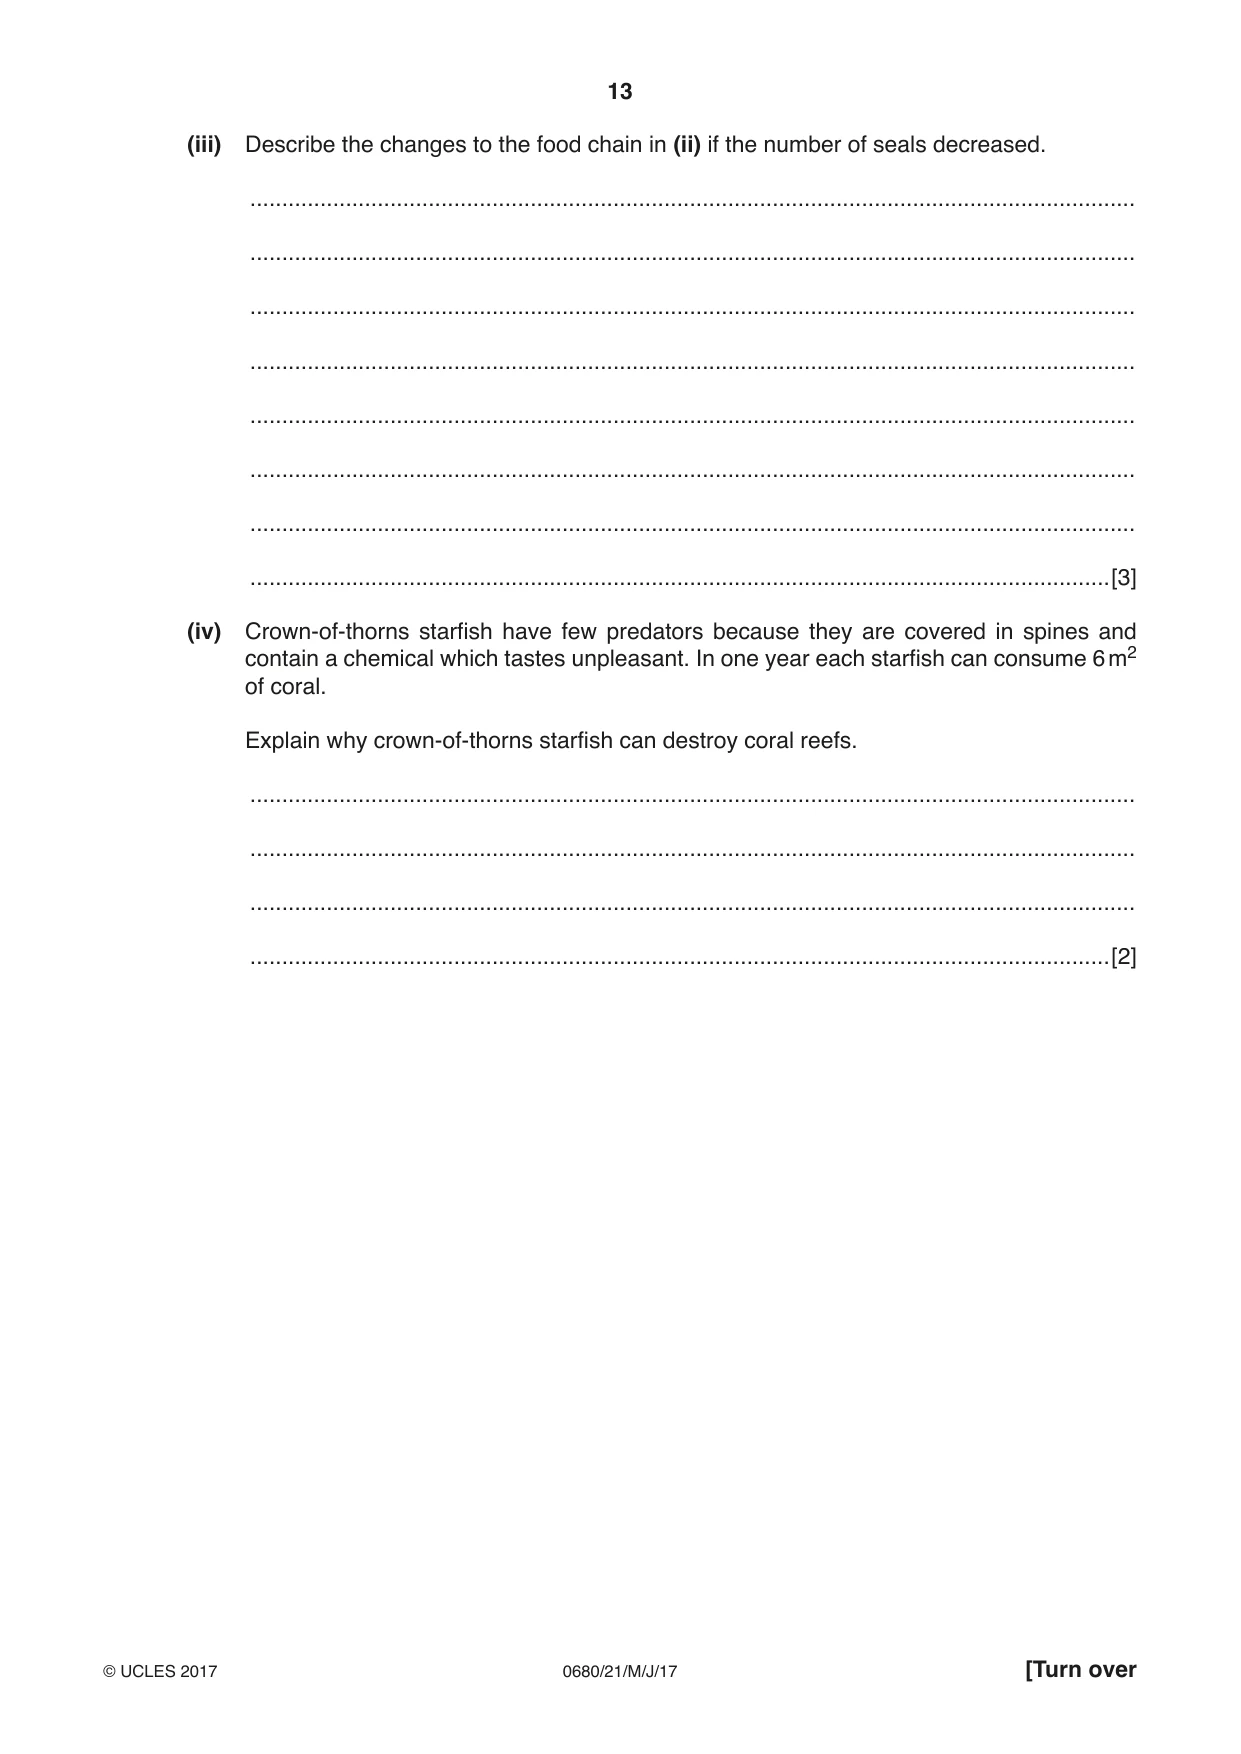
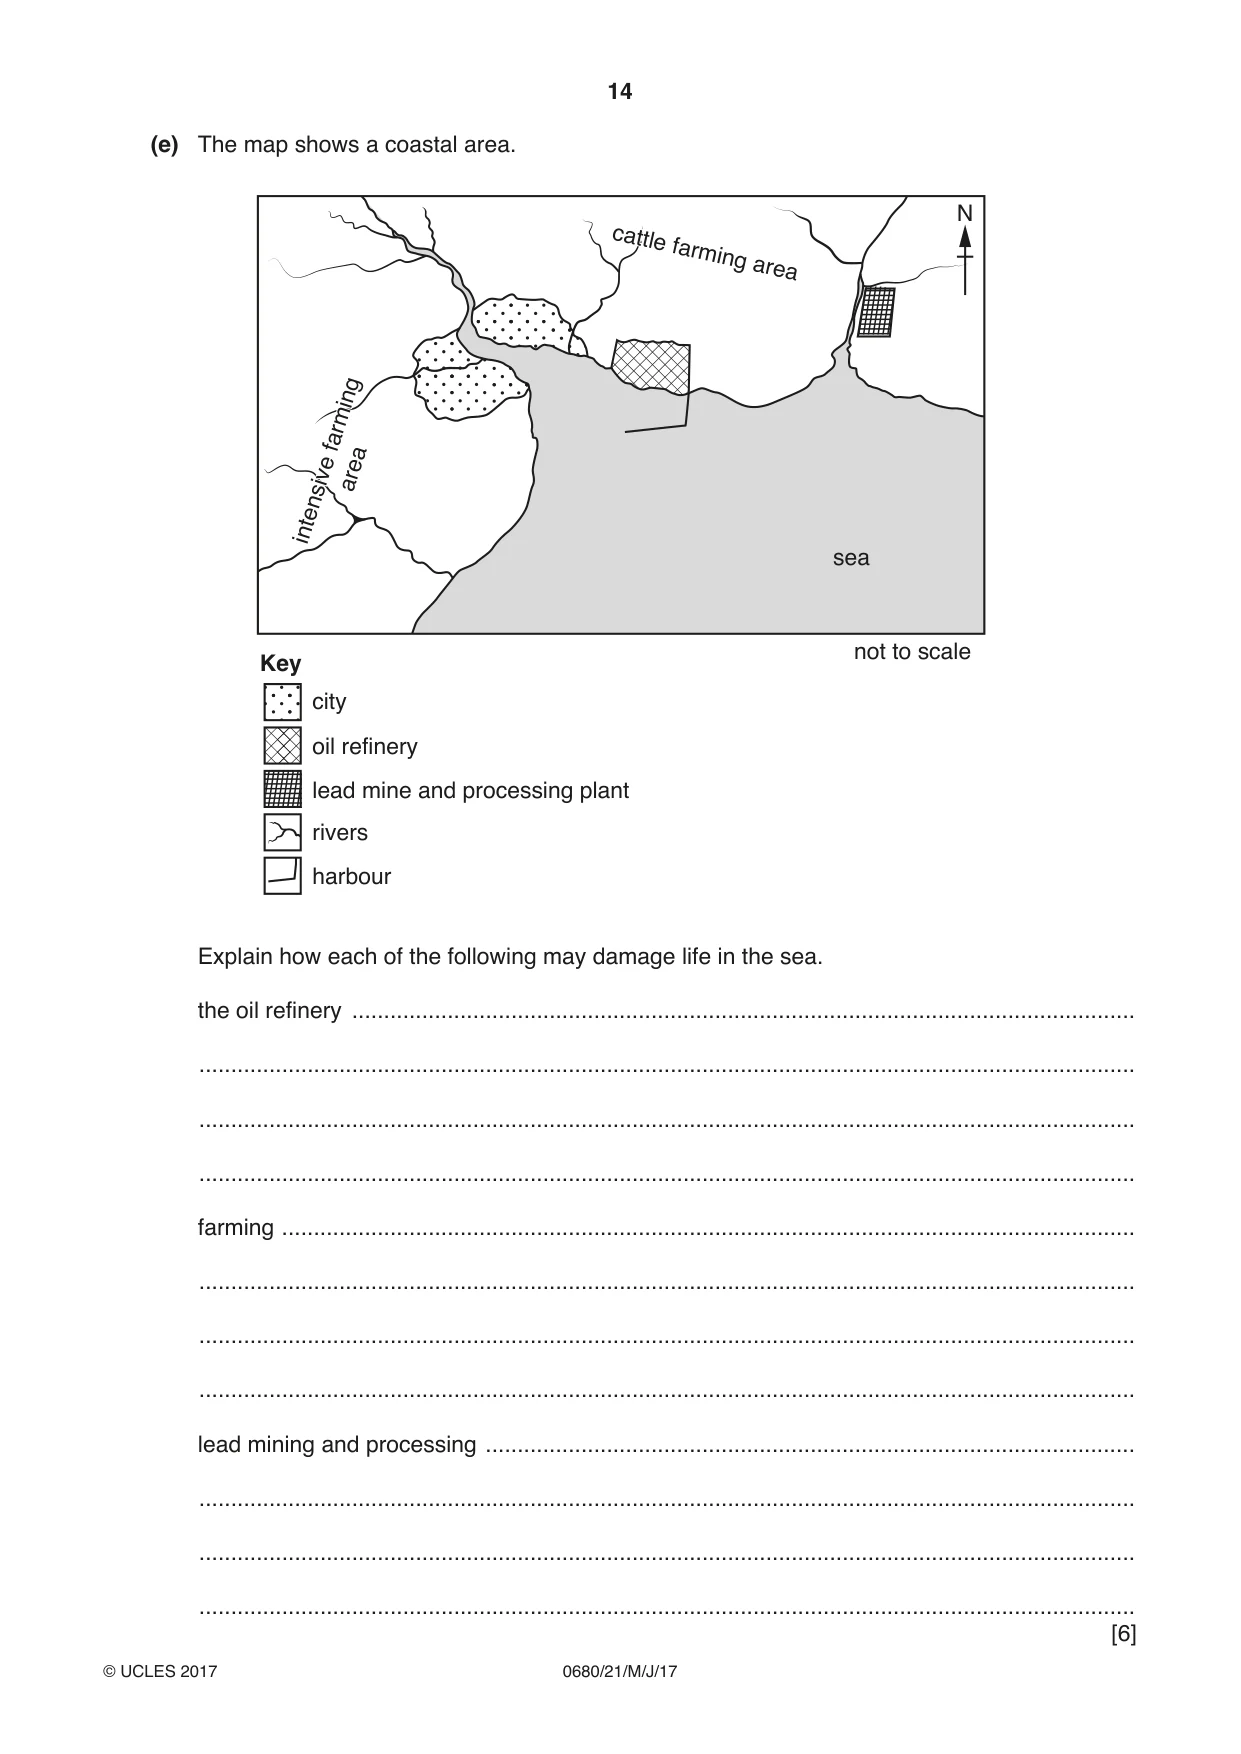
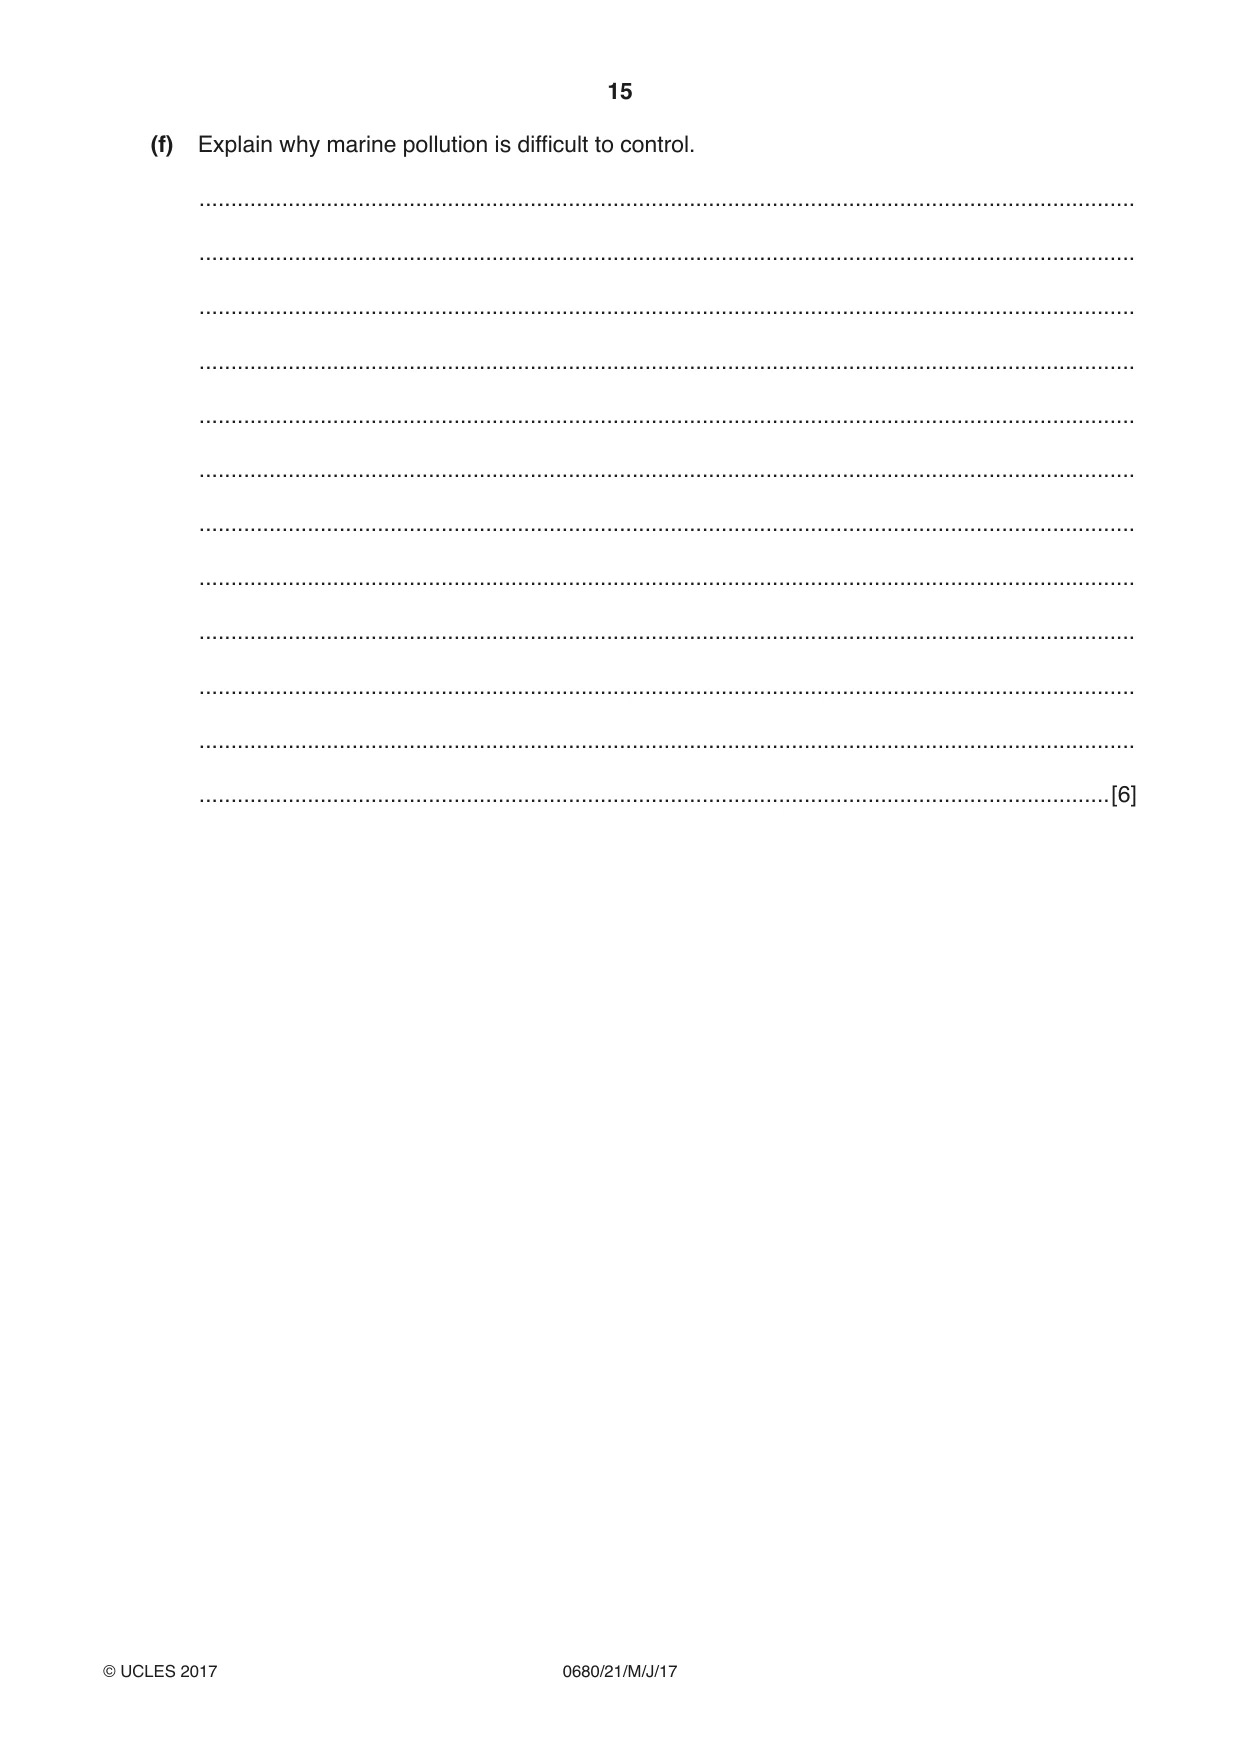
2 (a) The map shows the location of coral reefs. North North Pacific Atlantic Ocean Ocean Tropic of Cancer Equator Indian Ocean Tropic of Capricorn Key Southern coral reefs Ocean (i) Describe the location of coral reefs as shown on the map. ........................................................................................................................................... ........................................................................................................................................... ........................................................................................................................................... ........................................................................................................................................... ........................................................................................................................................... .......................................................................................................................................[3] (ii) Suggest one reason why coral reefs are not found in the North Atlantic Ocean or the North Pacific Ocean. ........................................................................................................................................... .......................................................................................................................................[1] (b) The graph shows the number of coral species and the number of fish species living on reefs. 900 800 700 number of fish species 600 living on reefs 500 400 300 200 100 0 0 50 100 150 200 250 300 350 400 number of coral species Describe the relationship between the number of coral species and the number of fish species living on reefs. ................................................................................................................................................... ................................................................................................................................................... ................................................................................................................................................... ...............................................................................................................................................[2] (c) The graph shows the percentage of coral reefs at risk from overfishing. 100 90 80 70 percentage 60 50 40 30 20 10 0 Atlantic Oceania Indian Middle Pacific South- Global Ocean Ocean East Ocean east Asia Key low risk medium risk high risk (i) Complete the global column using the following figures. high risk 27% medium risk 30% low risk 43% [2] (ii) Use the graph to complete the following paragraph. The area where coral reefs are at least risk from overfishing is ....................................... . The reefs in Southeast Asia are most at risk from overfishing, with .................... % at high risk and just 7% at ....................................... risk. [3]
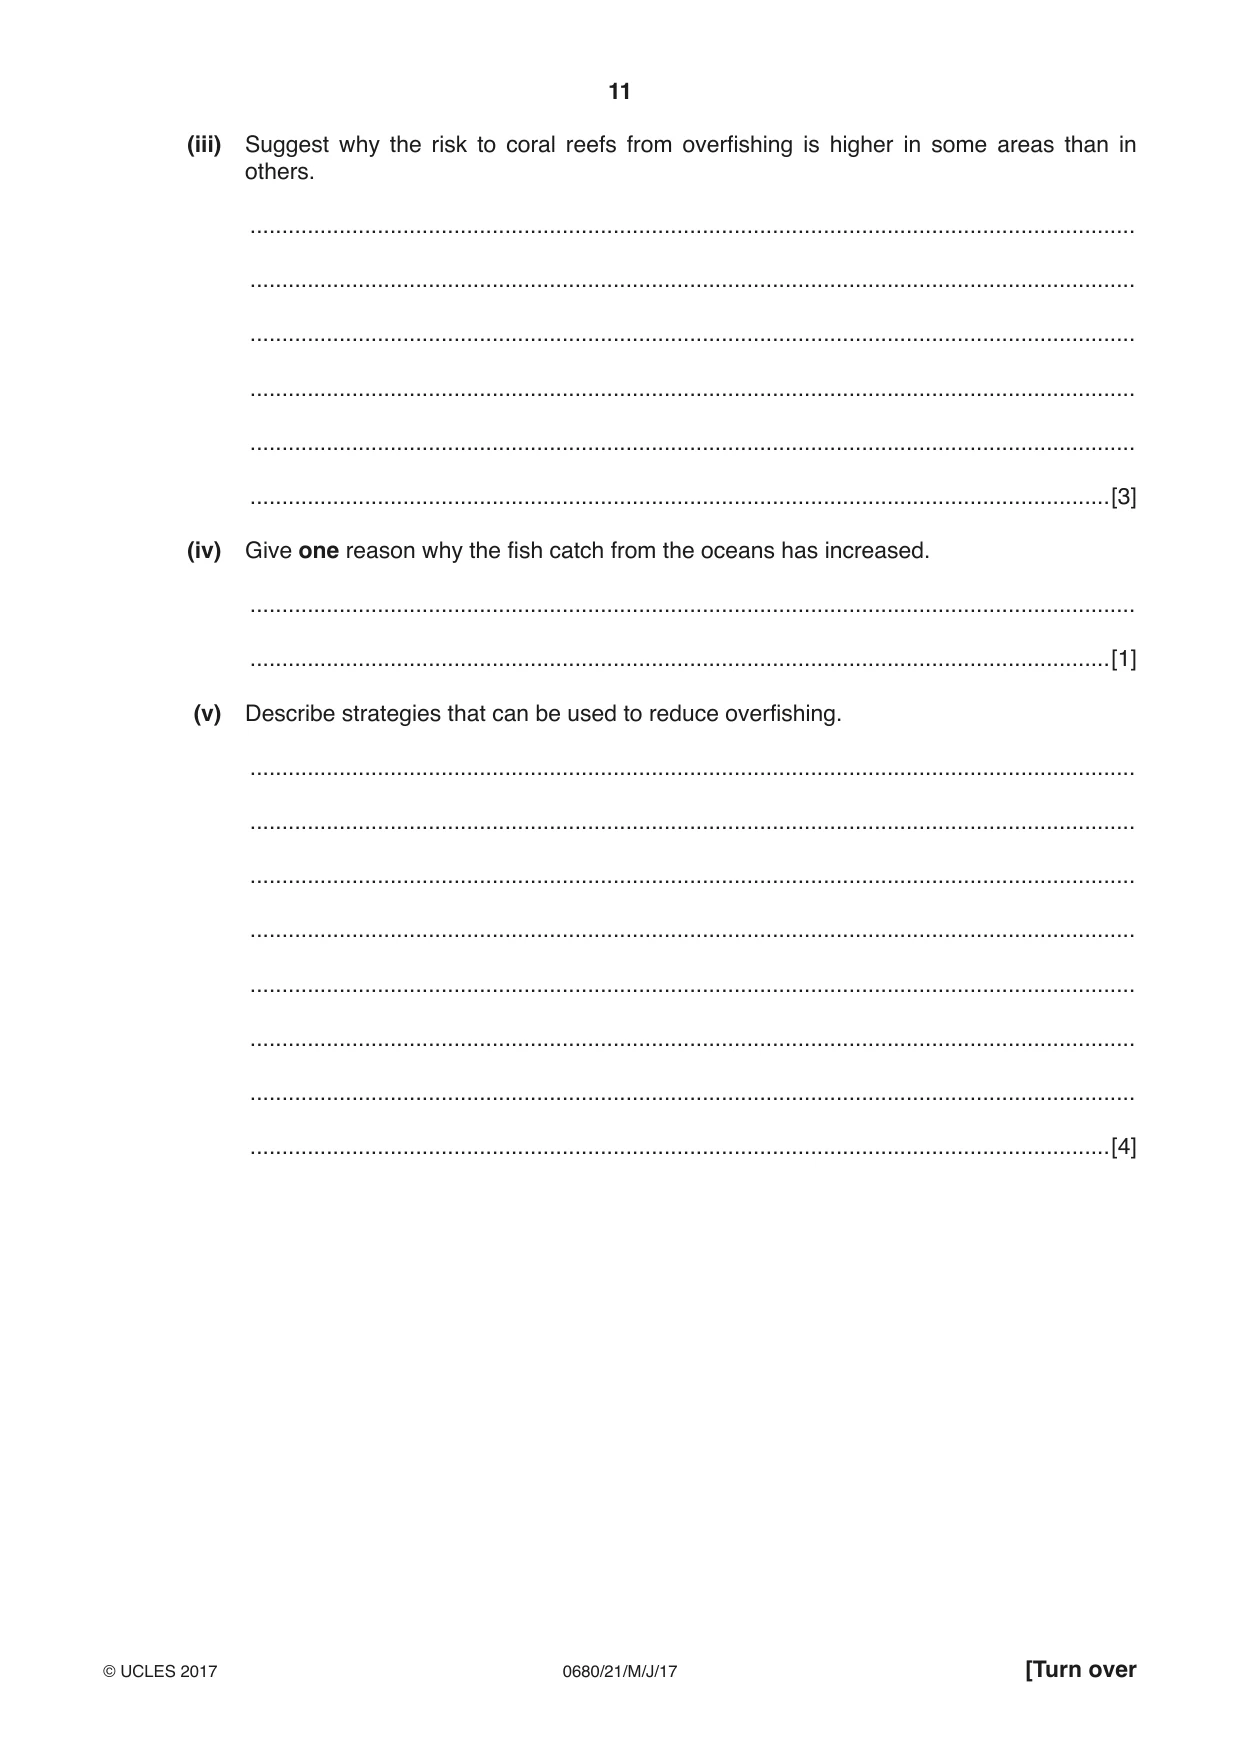
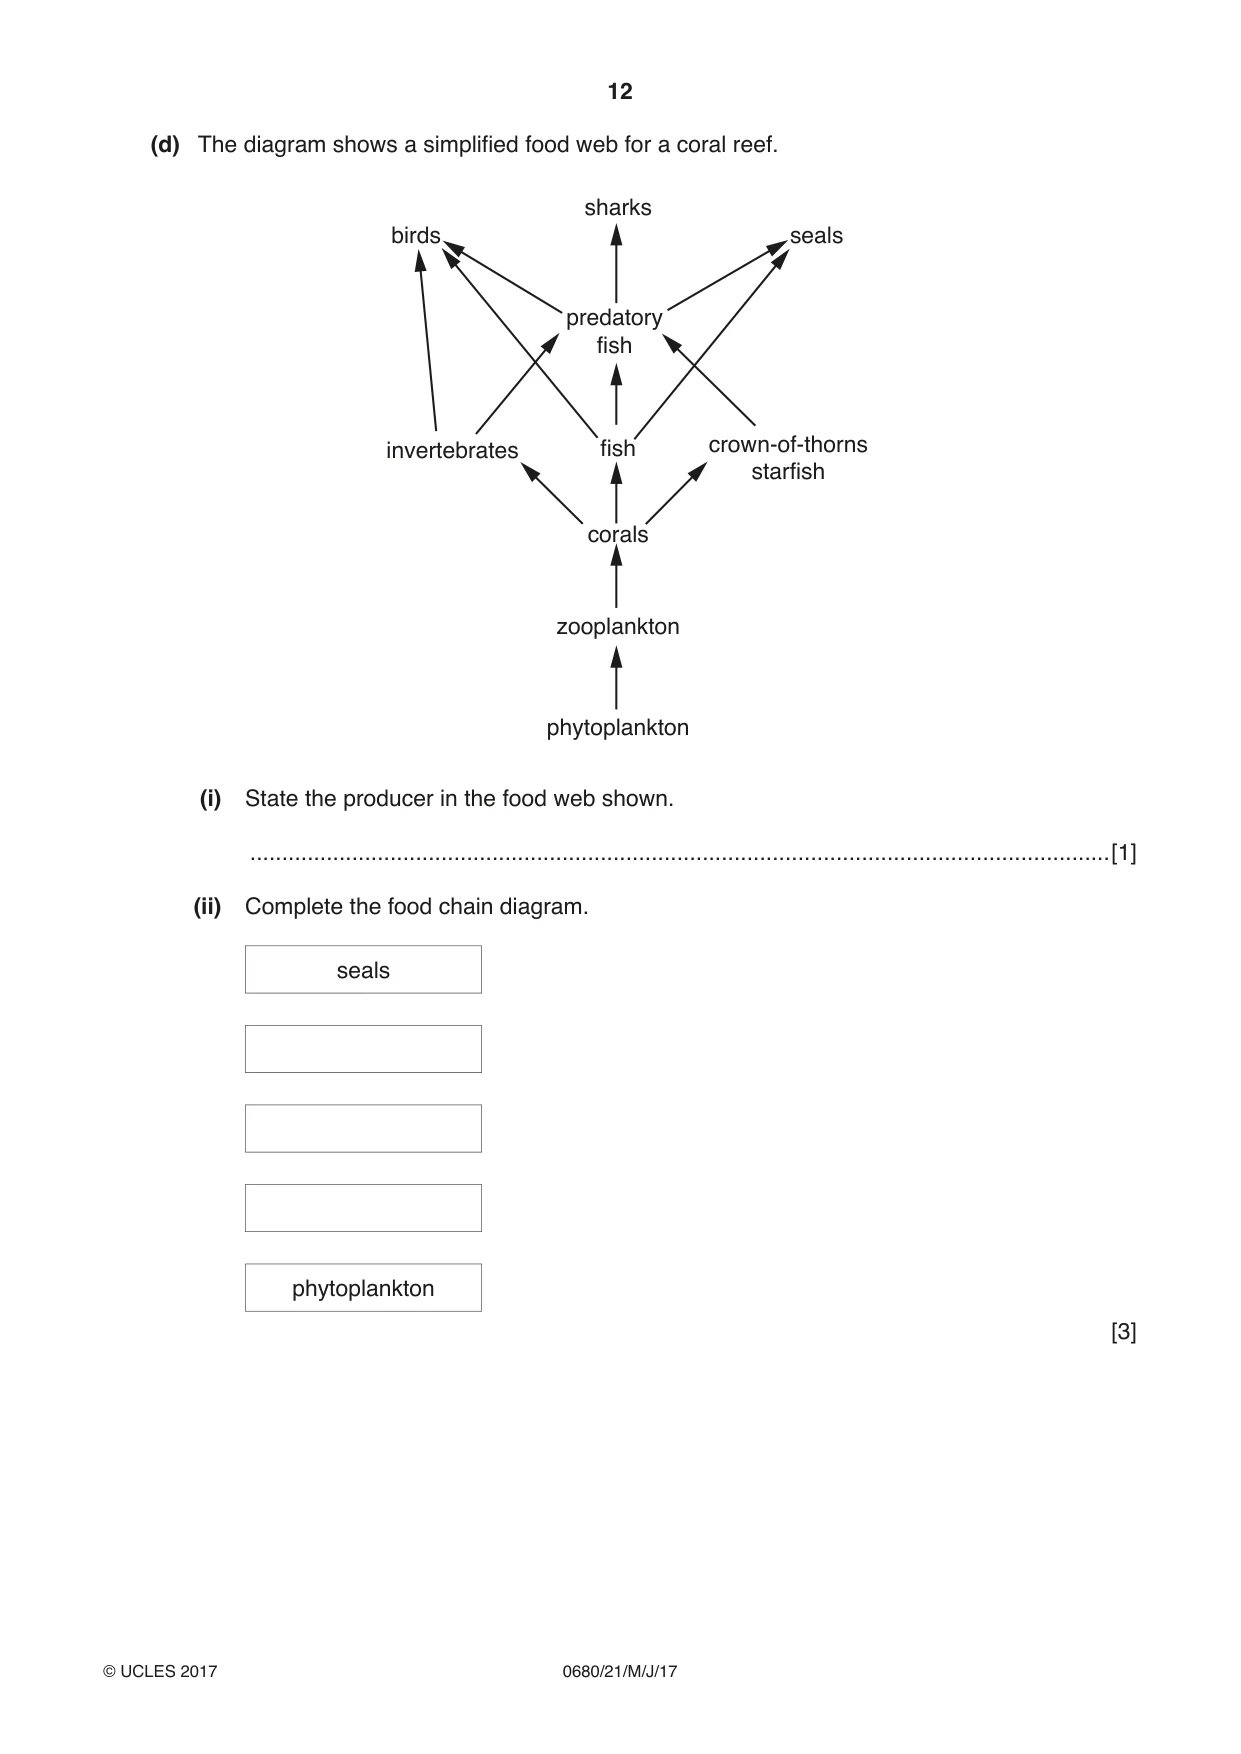
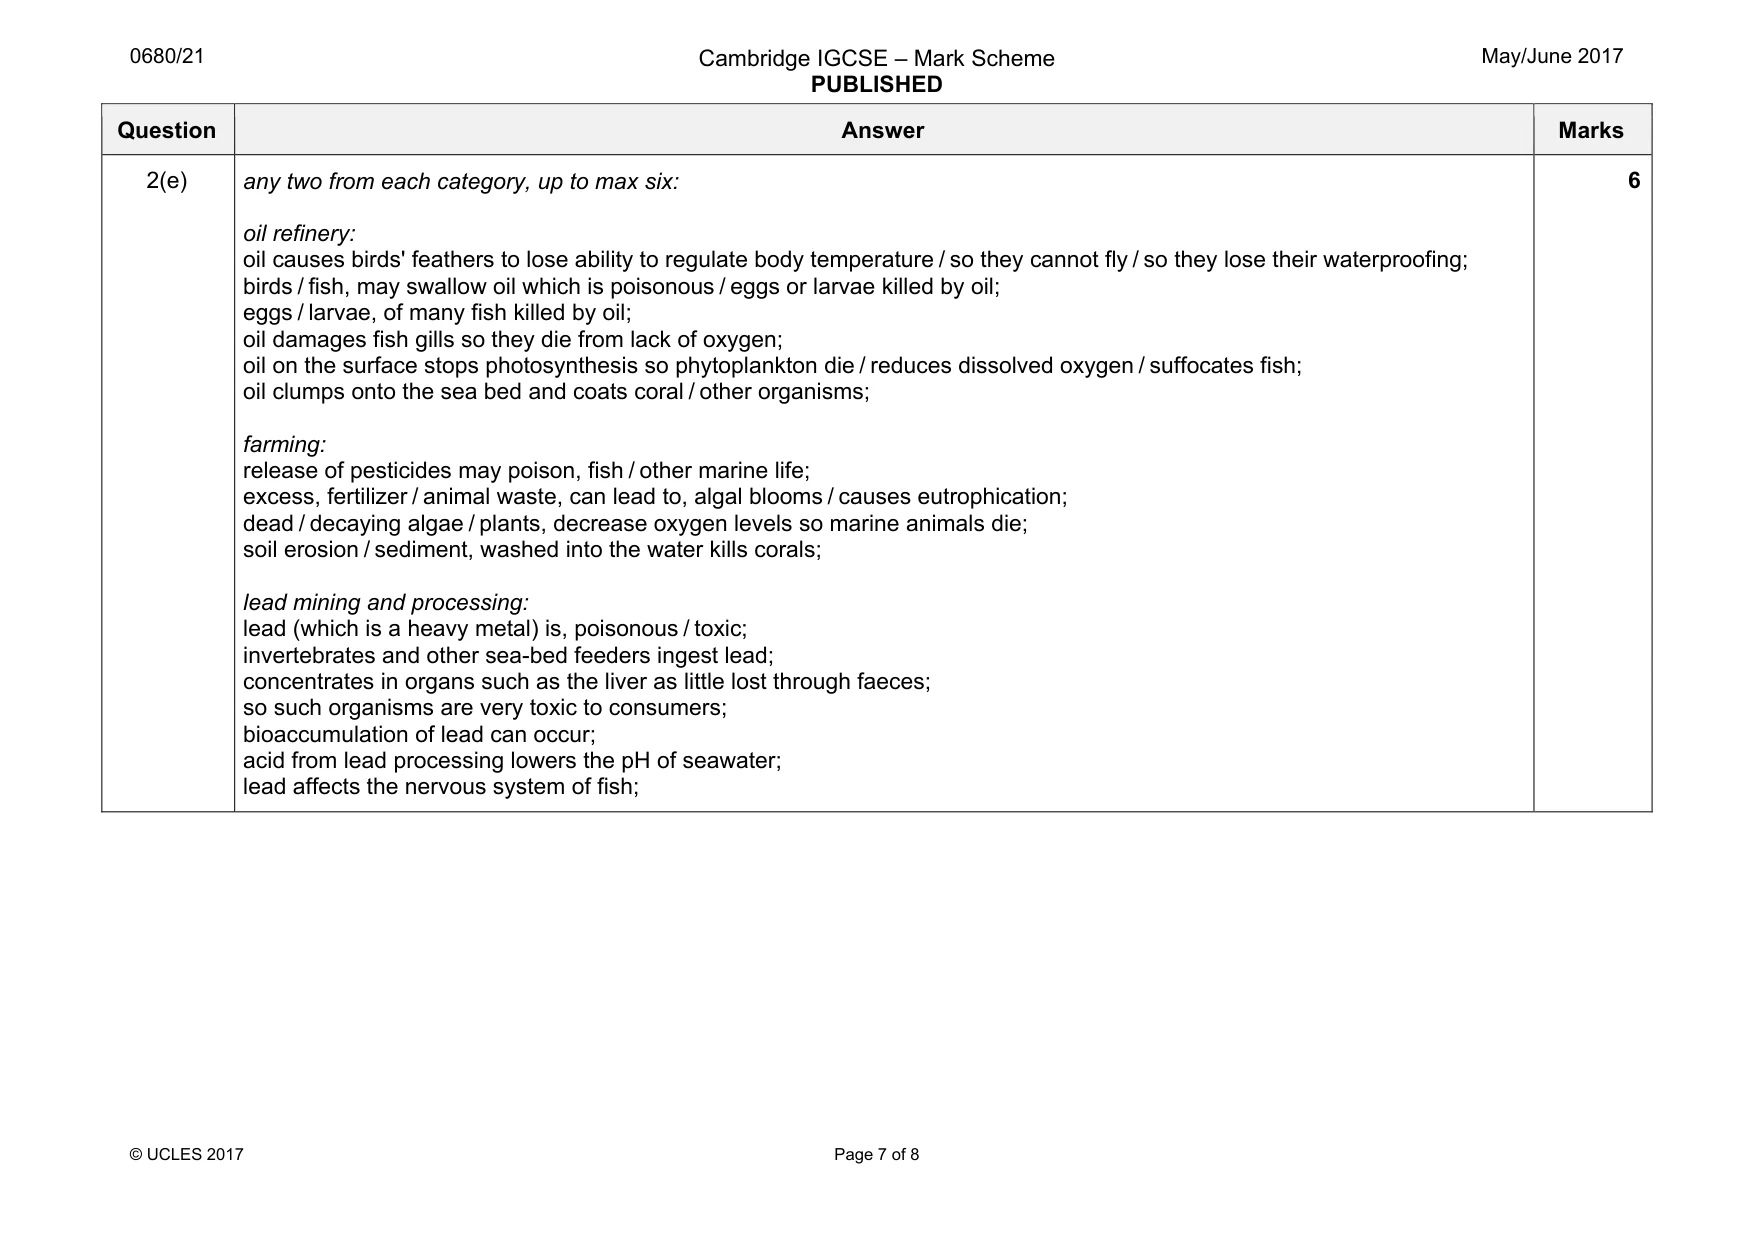
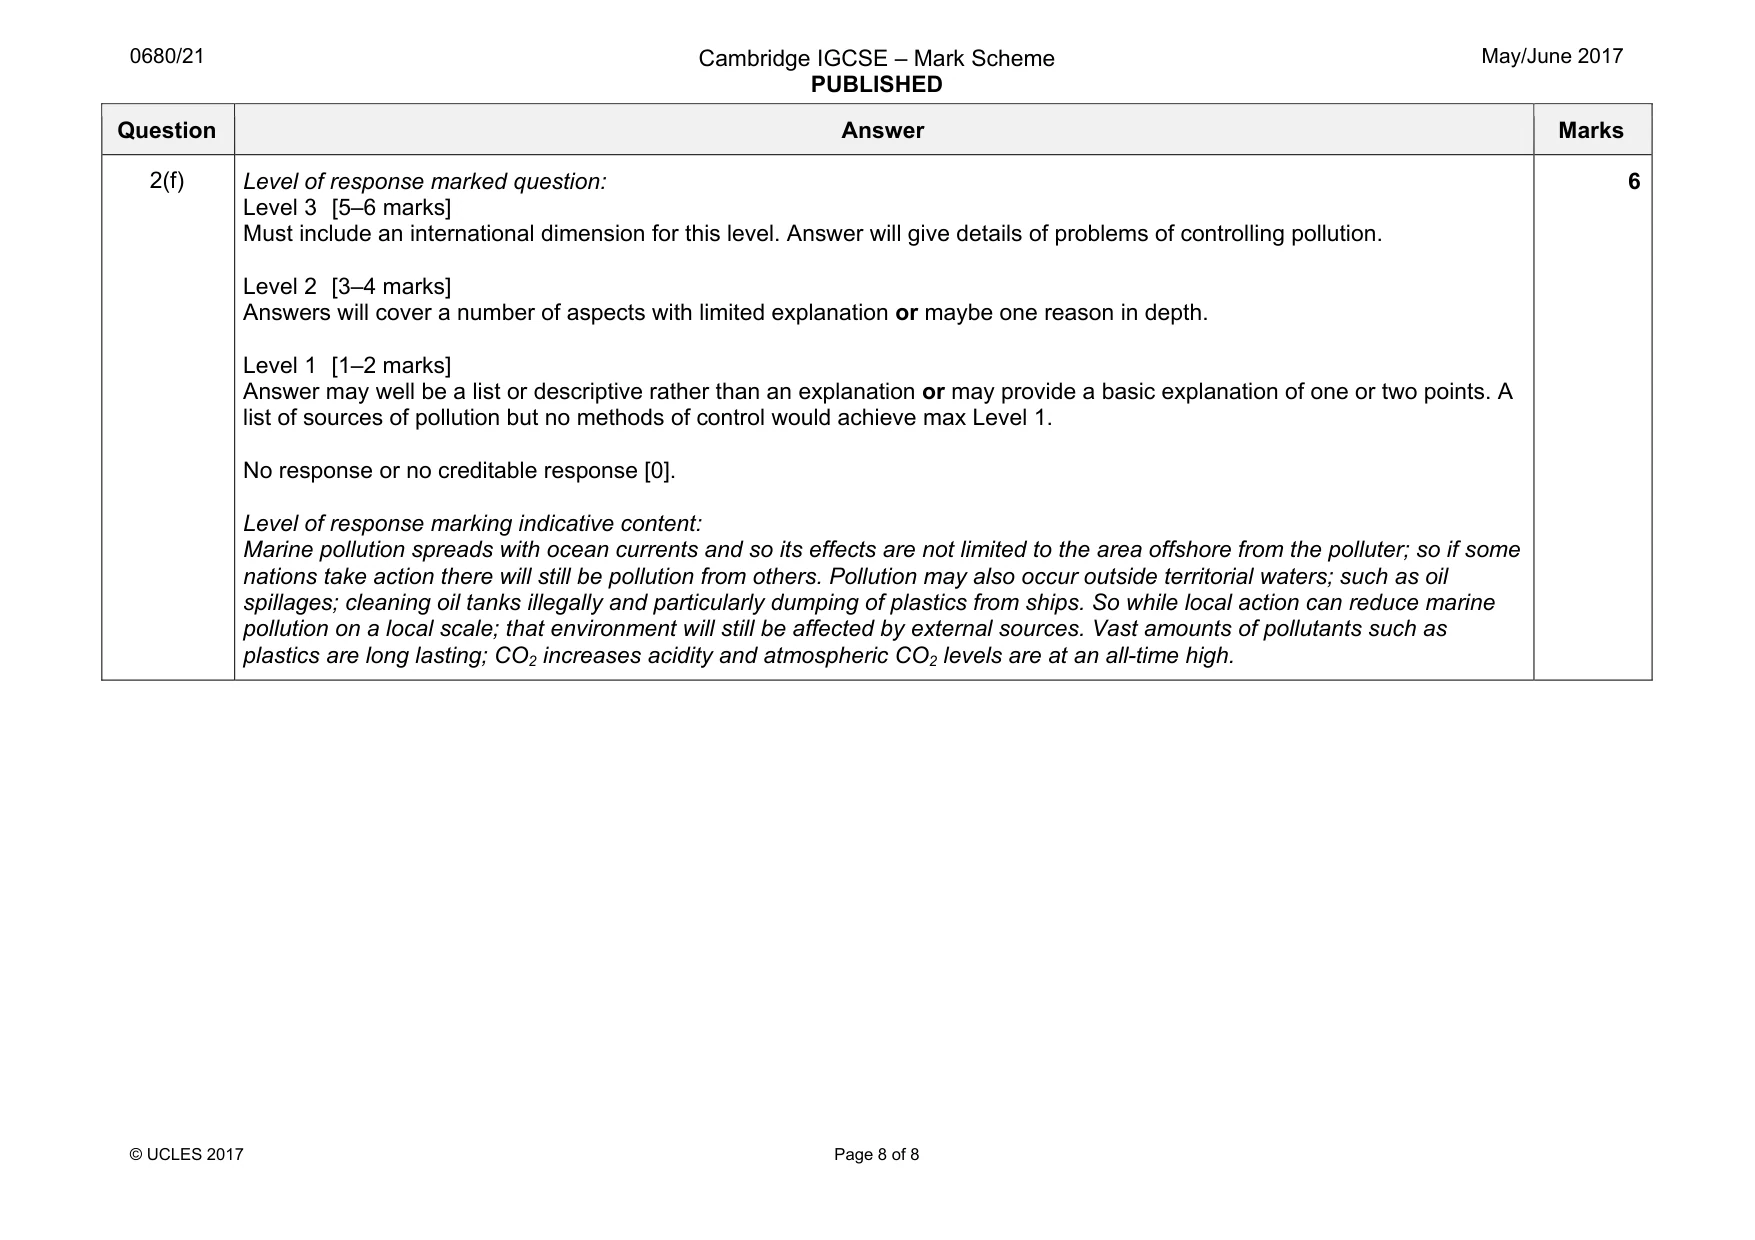
Mark scheme: 2(a)(i) any three of: within the tropics; (mainly) close to coasts; more on east coasts (than west coasts); especially between Asia and Oceania / in the Pacific; some in middle of oceans (around islands); list of the areas; 3 2(a)(ii) too cold / AVP; 1 2(b) positive relationship OWTTE; anomaly at 220 coral species; 2 2(c)(i) all three correct, in the same order and correct shading [2] one correct and correct shading [1] all three correct but no shading / incorrect shading [1] 2 2(c)(ii) Oceania; allow any answer in range of: 58–59; low; 3 2(c)(iii) any three of: variance in protection methods; enforcement of protection; demand for fish; for example, population size, good infrastructure, eat a fish diet etc.; some reefs are more productive therefore more fishing is done; education of those who catch fish; accessibility of reefs; 3 2(c)(iv) any one of: growth of population / growth of demand; technology, such as sonar; increase in size of, boats / nets; 1 Question Answer Marks 2(c)(v) any four of: quotas; international agreements; banning fishing in certain areas; increase size of net apertures; smaller nets; no fishing during breeding season; increased use of aquaculture; use of sustainable fishing methods, e.g. rod and line; 4 2(d)(i) phytoplankton; 1 2(d)(ii) (phytoplankton), zooplankton, corals, fish, (seals);; (if answer incorrect, allow one mark for two correct organisms [1]) arrows drawn going up food chain; 3 2(d)(iii) any three of: increase in fish; increase in predatory fish; which may cause decline in fish numbers; decrease in crown-of-thorns starfish; so corals increase; but increase in fish numbers may cause decrease in corals; invertebrates decrease; so may be an increase in corals; OR invertebrates increase as fewer predatory fish; so corals decrease; if corals decrease zooplankton increase; and phytoplankton decrease; if corals increase zooplankton decrease; and phytoplankton increase; AVP; 3 2(d)(iv) any two of: have few predators so no control of numbers; so large numbers will eat a lot of coral; each one can destroy, 6 m2 / a large area of coral, per year; 2 Question Answer Marks 2(e) any two from each category, up to max six: oil refinery: oil causes birds' feathers to lose ability to regulate body temperature / so they cannot fly / so they lose their waterproofing; birds / fish, may swallow oil which is poisonous / eggs or larvae killed by oil; eggs / larvae, of many fish killed by oil; oil damages fish gills so they die from lack of oxygen; oil on the surface stops photosynthesis so phytoplankton die / reduces dissolved oxygen / suffocates fish; oil clumps onto the sea bed and coats coral / other organisms; farming: release of pesticides may poison, fish / other marine life; excess, fertilizer / animal waste, can lead to, algal blooms / causes eutrophication; dead / decaying algae / plants, decrease oxygen levels so marine animals die; soil erosion / sediment, washed into the water kills corals; lead mining and processing: lead (which is a heavy metal) is, poisonous / toxic; invertebrates and other sea-bed feeders ingest lead; concentrates in organs such as the liver as little lost through faeces; so such organisms are very toxic to consumers; bioaccumulation of lead can occur; acid from lead processing lowers the pH of seawater; lead affects the nervous system of fish; 6 Question Answer Marks 2(f) Level of response marked question: Level 3 [5–6 marks] Must include an international dimension for this level. Answer will give details of problems of controlling pollution. Level 2 [3–4 marks] Answers will cover a number of aspects with limited explanation or maybe one reason in depth. Level 1 [1–2 marks] Answer may well be a list or descriptive rather than an explanation or may provide a basic explanation of one or two points. A list of sources of pollution but no methods of control would achieve max Level 1. No response or no creditable response [0]. Level of response marking indicative content: Marine pollution spreads with ocean currents and so its effects are not limited to the area offshore from the polluter; so if some nations take action there will still be pollution from others. Pollution may also occur outside territorial waters; such as oil spillages; cleaning oil tanks illegally and particularly dumping of plastics from ships. So while local action can reduce marine pollution on a local scale; that environment will still be affected by external sources. Vast amounts of pollutants such as plastics are long lasting; CO2 increases acidity and atmospheric CO2 levels are at an all-time high. 6
What was in this paper
The subtopics covered by these 2 questions, and how many questions each got. Open one in a new tab to see every Cambridge question on it.
What you needed in this session
Cambridge’s own grade thresholds for 2017 May/June, Paper 2 · Variant 1. A higher threshold means an easier paper — the bar moves with how the cohort did.