Cambridge IGCSE Environmental Management 0680 — 2016 Oct/Nov Paper 4 · Variant 2
0680/42/O/N/16 · 60 marks · ≈68 min
The question paper and its mark scheme, free to read here and free to download. This is Cambridge’s own paper, exactly as it was sat.
Question paper16 pages


Mark scheme5 pages
Answers below. Sit the paper first if you are practising.
Paper as text
Question paper, page 1
This document consists of 14 printed pages and 2 blank pages. DC (CW/SW) 114932/5 © UCLES 2016 [Turn over Cambridge International Examinations Cambridge International General Certificate of Secondary Education * 7 9 4 8 5 8 8 5 8 2 * ENVIRONMENTAL MANAGEMENT 0680/42 Paper 4 October/November 2016 1 hour 30 minutes Candidates answer on the Question Paper. No Additional Materials are required. READ THESE INSTRUCTIONS FIRST Write your Centre number, candidate number and name on all the work you hand in. Write in dark blue or black pen. You may use an HB pencil for any diagrams or graphs. Do not use staples, paper clips, glue or correction fluid. DO NOT WRITE IN ANY BARCODES. Answer all questions. Electronic calculators may be used. You may lose marks if you do not show your working or if you do not use appropriate units. Study the appropriate source materials before you start to write your answers. Credit will be given for appropriate selection and use of data in your answers and for relevant interpretation of these data. Suggestions for data sources are given in some questions. You may use the source data to draw diagrams and graphs or to do calculations to illustrate your answers. At the end of the examination, fasten all your work securely together. The number of marks is given in brackets [ ] at the end of each question or part question.
Question paper, page 2
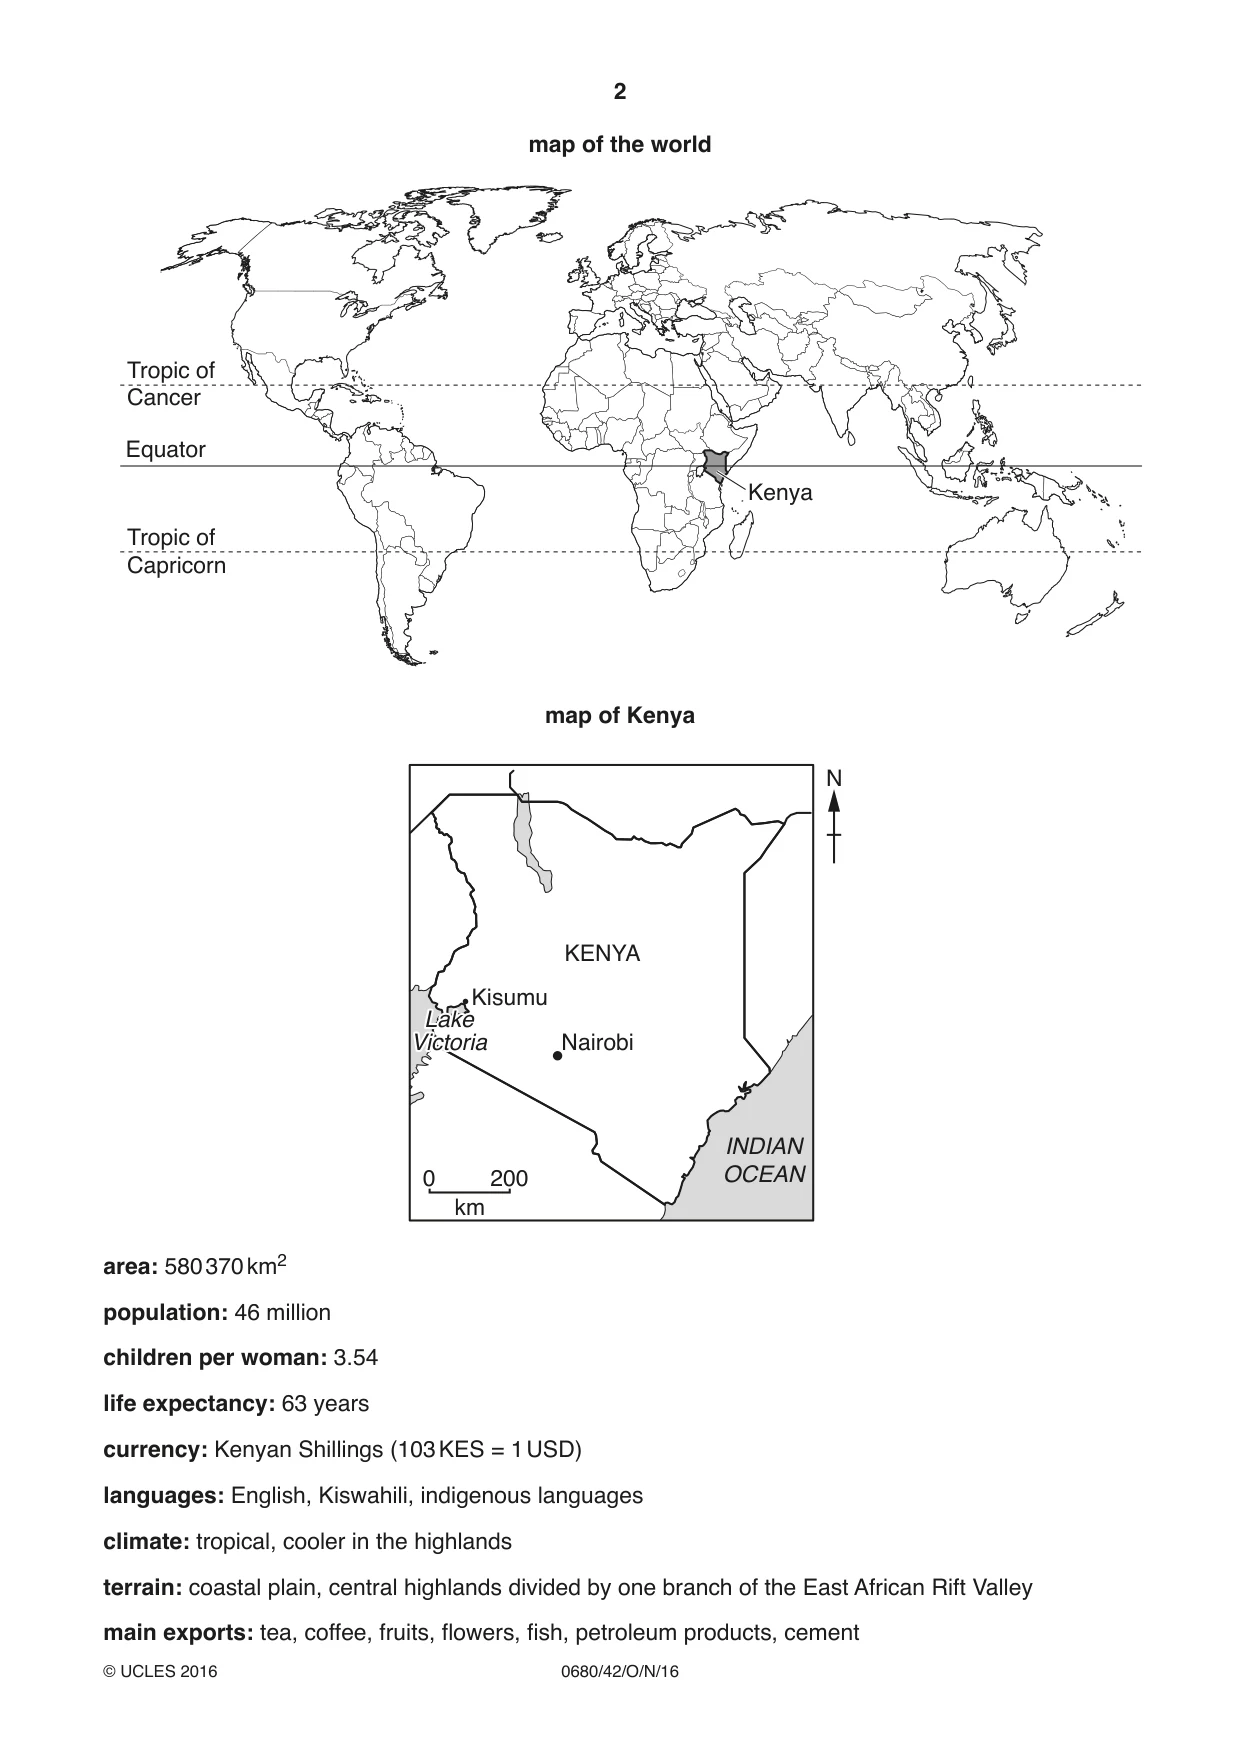
2 0680/42/O/N/16 © UCLES 2016 map of the world Equator Tropic of Capricorn Tropic of Cancer Kenya map of Kenya 0 200 INDIAN OCEAN km Lake Victoria Kisumu Nairobi KENYA N area: 580 370 km2 population: 46 million children per woman: 3.54 life expectancy: 63 years currency: Kenyan Shillings (103 KES = 1 USD) languages: English, Kiswahili, indigenous languages climate: tropical, cooler in the highlands terrain: coastal plain, central highlands divided by one branch of the East African Rift Valley main exports: tea, coffee, fruits, flowers, fish, petroleum products, cement
Question paper, page 3
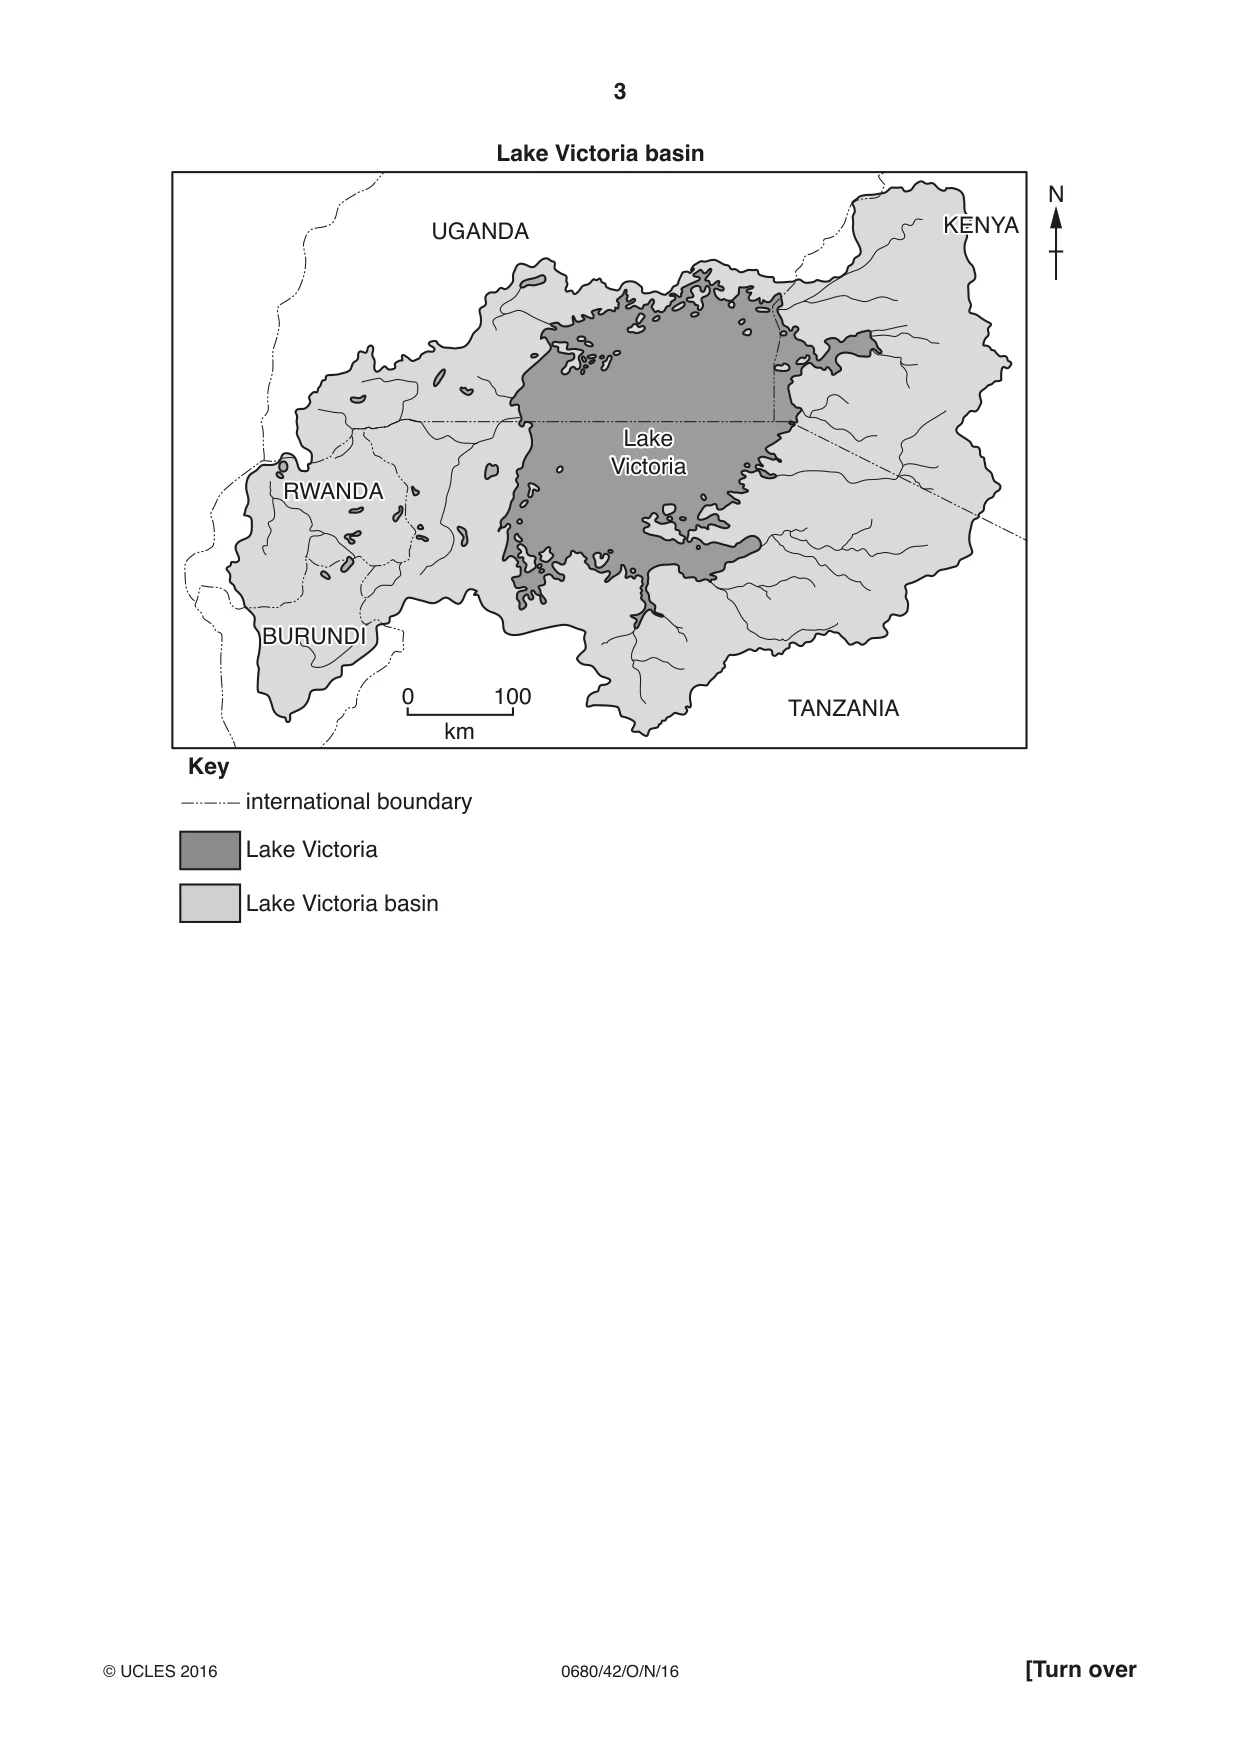
3 0680/42/O/N/16 © UCLES 2016 [Turn over international boundary Lake Victoria Lake Victoria basin Key Lake Victoria basin TANZANIA Lake Victoria UGANDA KENYA RWANDA BURUNDI 0 100 km N
Question paper, page 4
4 0680/42/O/N/16 © UCLES 2016 1 Kenya shares access to Lake Victoria with other countries. The lake is a valuable source of fish. The wetlands surrounding Lake Victoria have high biodiversity and productive farmland. About 75% of the workforce are employed in agriculture. Tourism also makes an important contribution to the economy. (a) What is meant by the term biodiversity ? … … … …[2] (b) Look at the map showing the Lake Victoria basin. (i) Name the country with the largest share of Lake Victoria. … [1] (ii) Name two countries that are part of the drainage basin but do not have a share of the lake. … and … [2] (c) Kisumu is a town on the Trans-African Highway. Road transport services provide jobs for people in this area. A scientist noticed that several beaches by Lake Victoria, near Kisumu, were being used by vehicle-washing businesses. To find out if vehicle washing was having any impact on the lake the following method was used. 1. Select five sites: • three sites used for vehicle washing • one site not used for vehicle washing but at a sewage outlet site • one control site, not used for vehicle washing or at a sewage outlet site. 2. Take water samples from each site at 18.00 once a week for six weeks. 3. Ask a student to record all the vehicles washed on six separate days for each of the three vehicle-washing sites. (i) Suggest why the scientist took water samples at 18.00. …[1]
Question paper, page 5
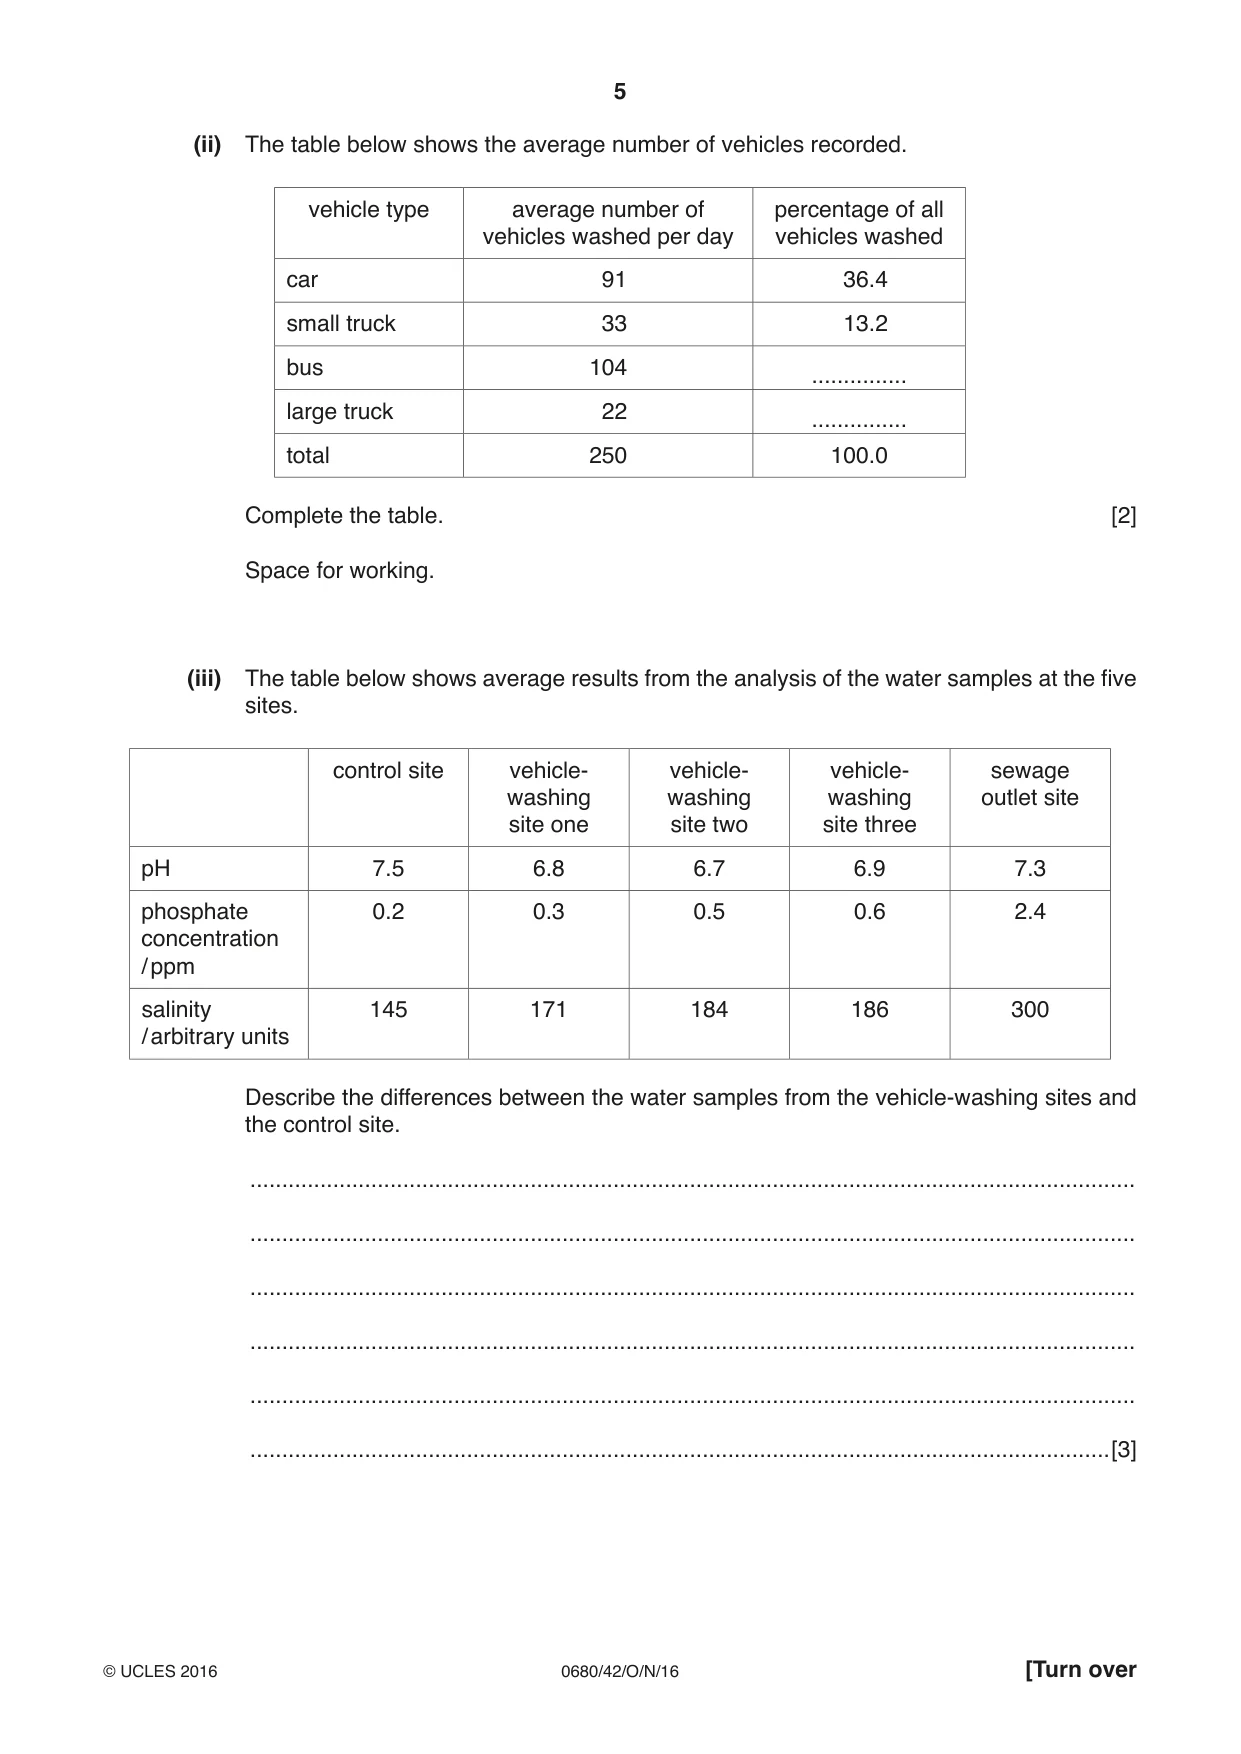
5 0680/42/O/N/16 © UCLES 2016 [Turn over (ii) The table below shows the average number of vehicles recorded. vehicle type average number of vehicles washed per day percentage of all vehicles washed car 91 36.4 small truck 33 13.2 bus 104 … large truck 22 … total 250 100.0 Complete the table. [2] Space for working. (iii) The table below shows average results from the analysis of the water samples at the five sites. control site vehicle- washing site one vehicle- washing site two vehicle- washing site three sewage outlet site pH 7.5 6.8 6.7 6.9 7.3 phosphate concentration / ppm 0.2 0.3 0.5 0.6 2.4 salinity / arbitrary units 145 171 184 186 300 Describe the differences between the water samples from the vehicle-washing sites and the control site. … … … … … …[3]
Question paper, page 6
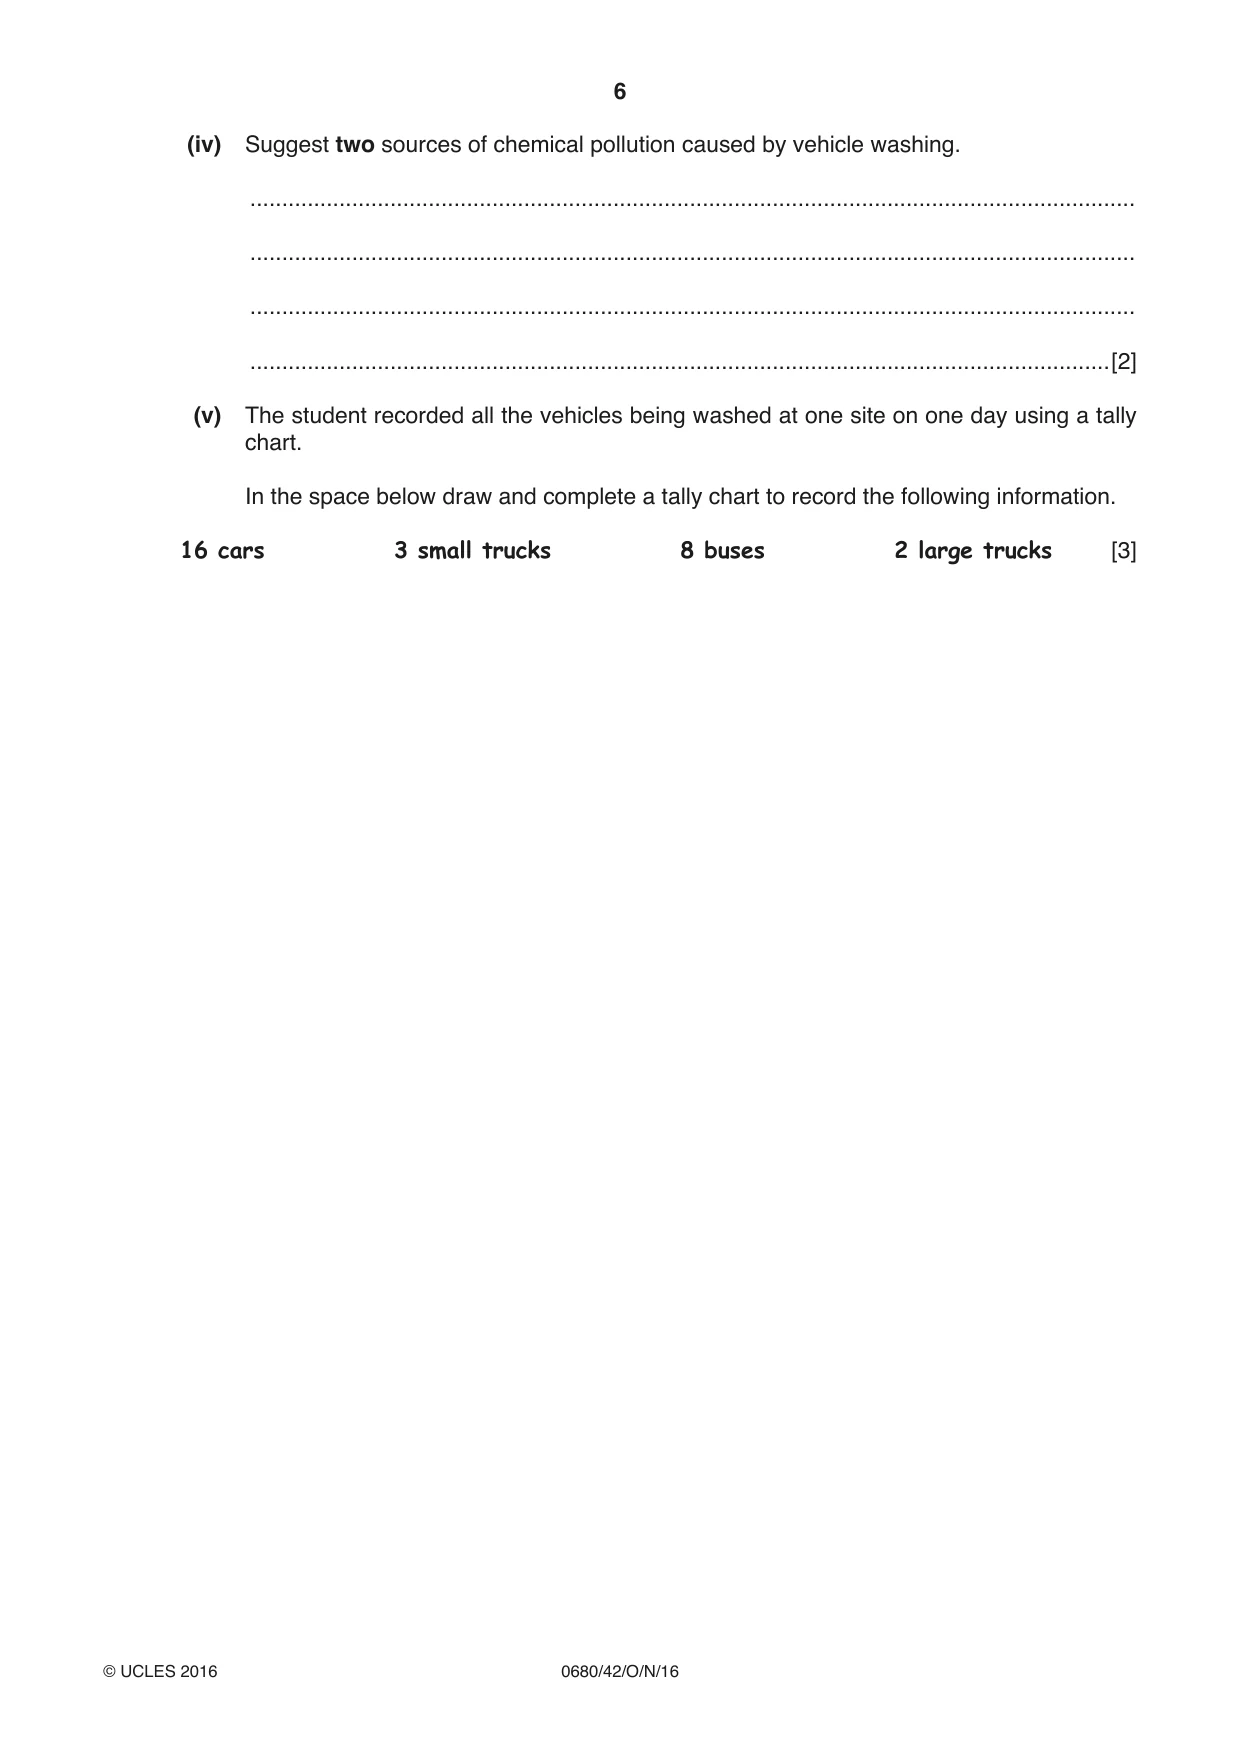
6 0680/42/O/N/16 © UCLES 2016 (iv) Suggest two sources of chemical pollution caused by vehicle washing. … … … …[2] (v) The student recorded all the vehicles being washed at one site on one day using a tally chart. In the space below draw and complete a tally chart to record the following information. 16 cars 3 small trucks 8 buses 2 large trucks [3]
Question paper, page 7
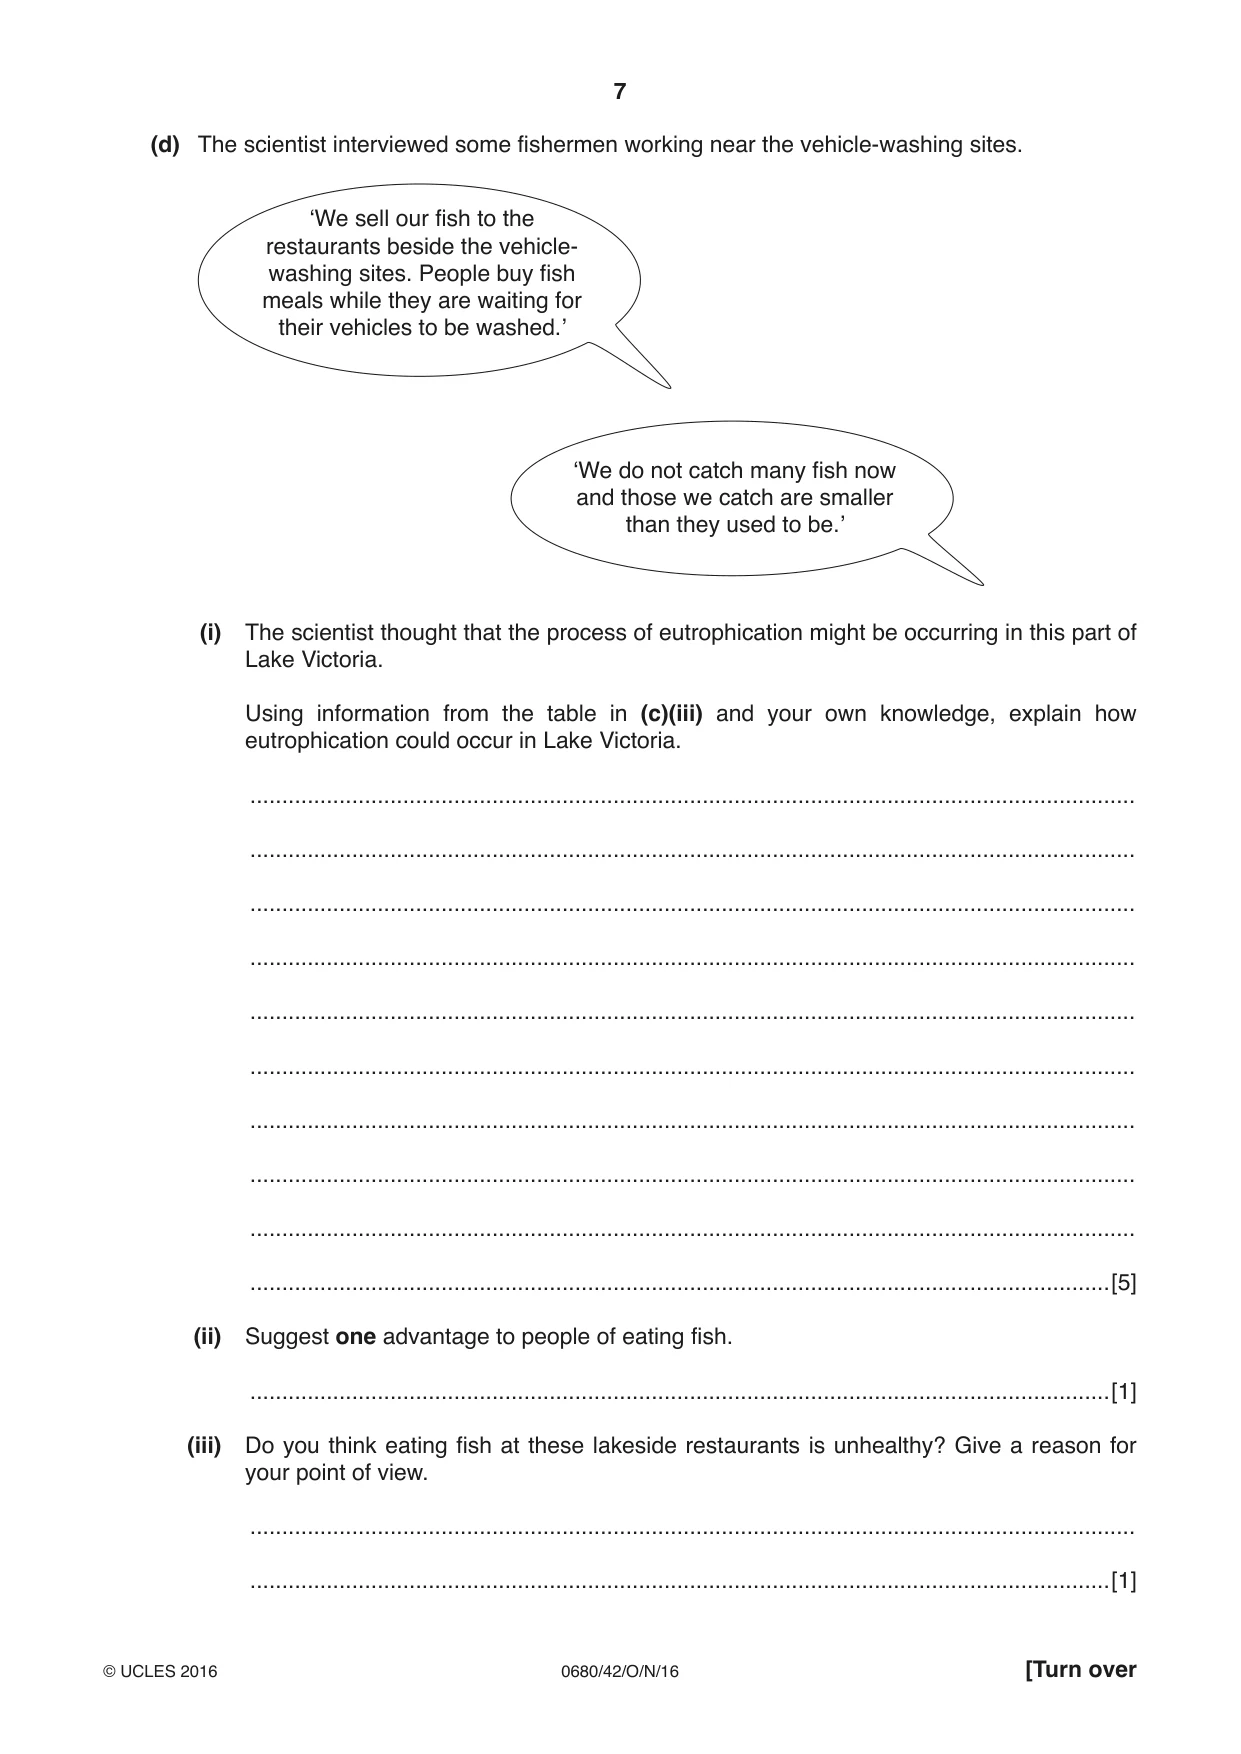
7 0680/42/O/N/16 © UCLES 2016 [Turn over (d) The scientist interviewed some fishermen working near the vehicle-washing sites. ‘We sell our fish to the restaurants beside the vehicle- washing sites. People buy fish meals while they are waiting for their vehicles to be washed.’ ‘We do not catch many fish now and those we catch are smaller than they used to be.’ (i) The scientist thought that the process of eutrophication might be occurring in this part of Lake Victoria. Using information from the table in (c)(iii) and your own knowledge, explain how eutrophication could occur in Lake Victoria. … … … … … … … … … …[5] (ii) Suggest one advantage to people of eating fish. …[1] (iii) Do you think eating fish at these lakeside restaurants is unhealthy? Give a reason for your point of view. … …[1]
Question paper, page 8
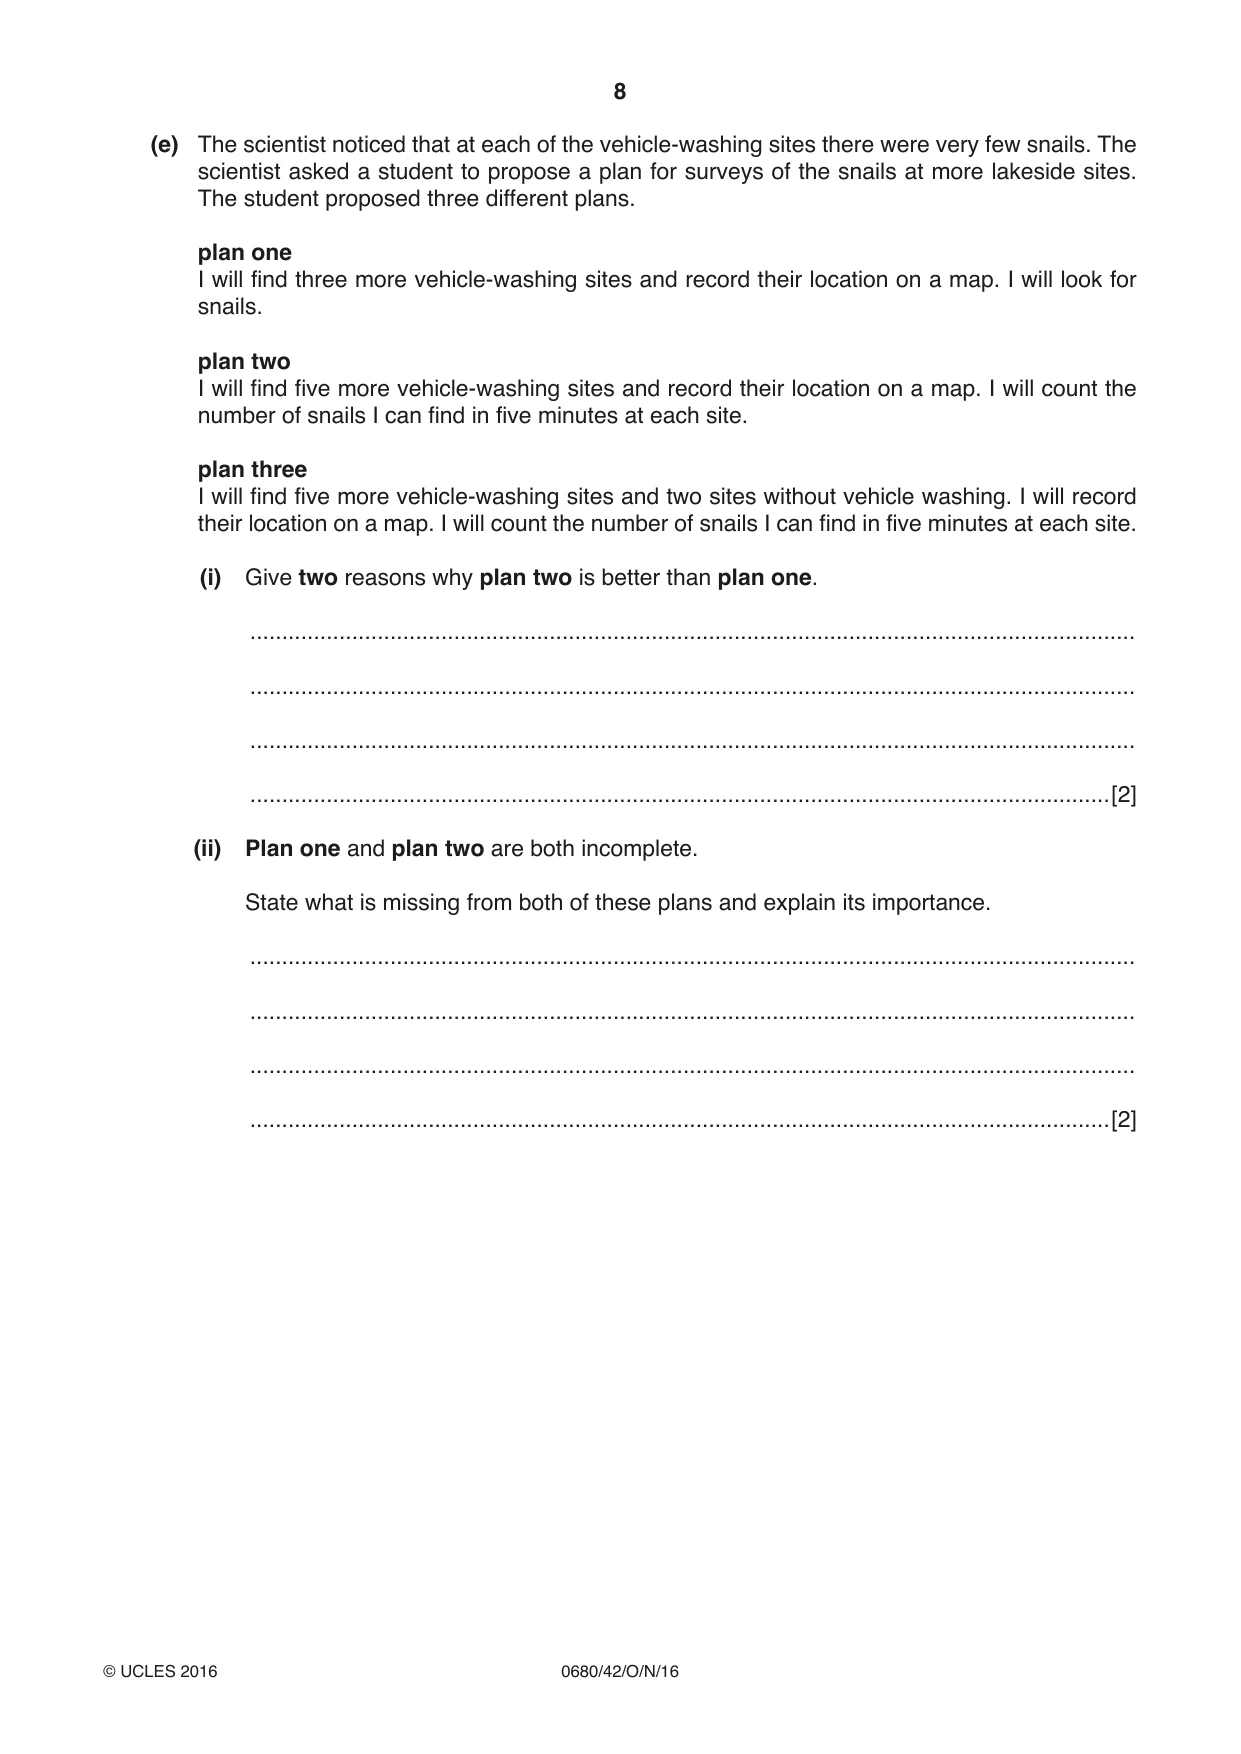
8 0680/42/O/N/16 © UCLES 2016 (e) The scientist noticed that at each of the vehicle-washing sites there were very few snails. The scientist asked a student to propose a plan for surveys of the snails at more lakeside sites. The student proposed three different plans. plan one I will find three more vehicle-washing sites and record their location on a map. I will look for snails. plan two I will find five more vehicle-washing sites and record their location on a map. I will count the number of snails I can find in five minutes at each site. plan three I will find five more vehicle-washing sites and two sites without vehicle washing. I will record their location on a map. I will count the number of snails I can find in five minutes at each site. (i) Give two reasons why plan two is better than plan one. … … … …[2] (ii) Plan one and plan two are both incomplete. State what is missing from both of these plans and explain its importance. … … … …[2]
Question paper, page 9
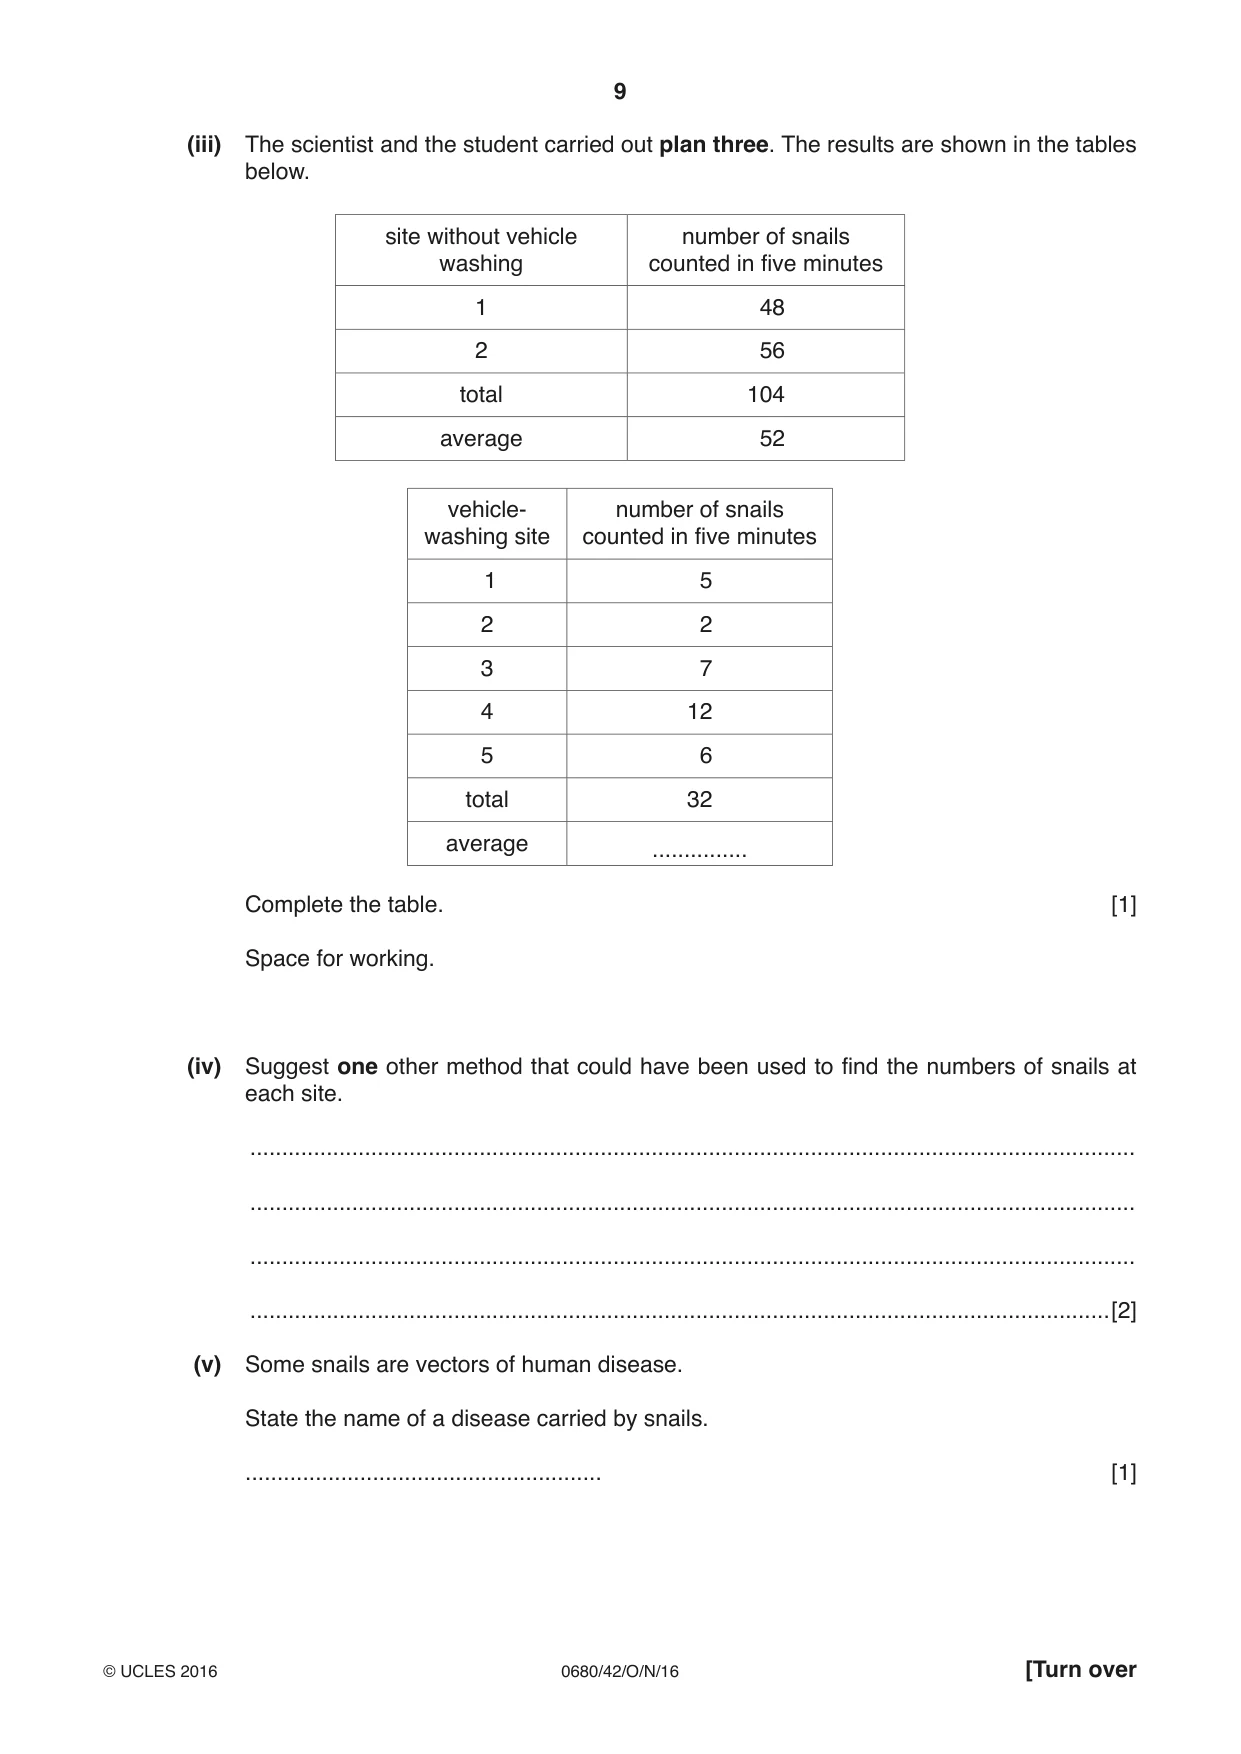
9 0680/42/O/N/16 © UCLES 2016 [Turn over (iii) The scientist and the student carried out plan three. The results are shown in the tables below. site without vehicle washing number of snails counted in five minutes 1 48 2 56 total 104 average 52 vehicle- washing site number of snails counted in five minutes 1 5 2 2 3 7 4 12 5 6 total 32 average … Complete the table. [1] Space for working. (iv) Suggest one other method that could have been used to find the numbers of snails at each site. … … … …[2] (v) Some snails are vectors of human disease. State the name of a disease carried by snails. … [1]
Question paper, page 10
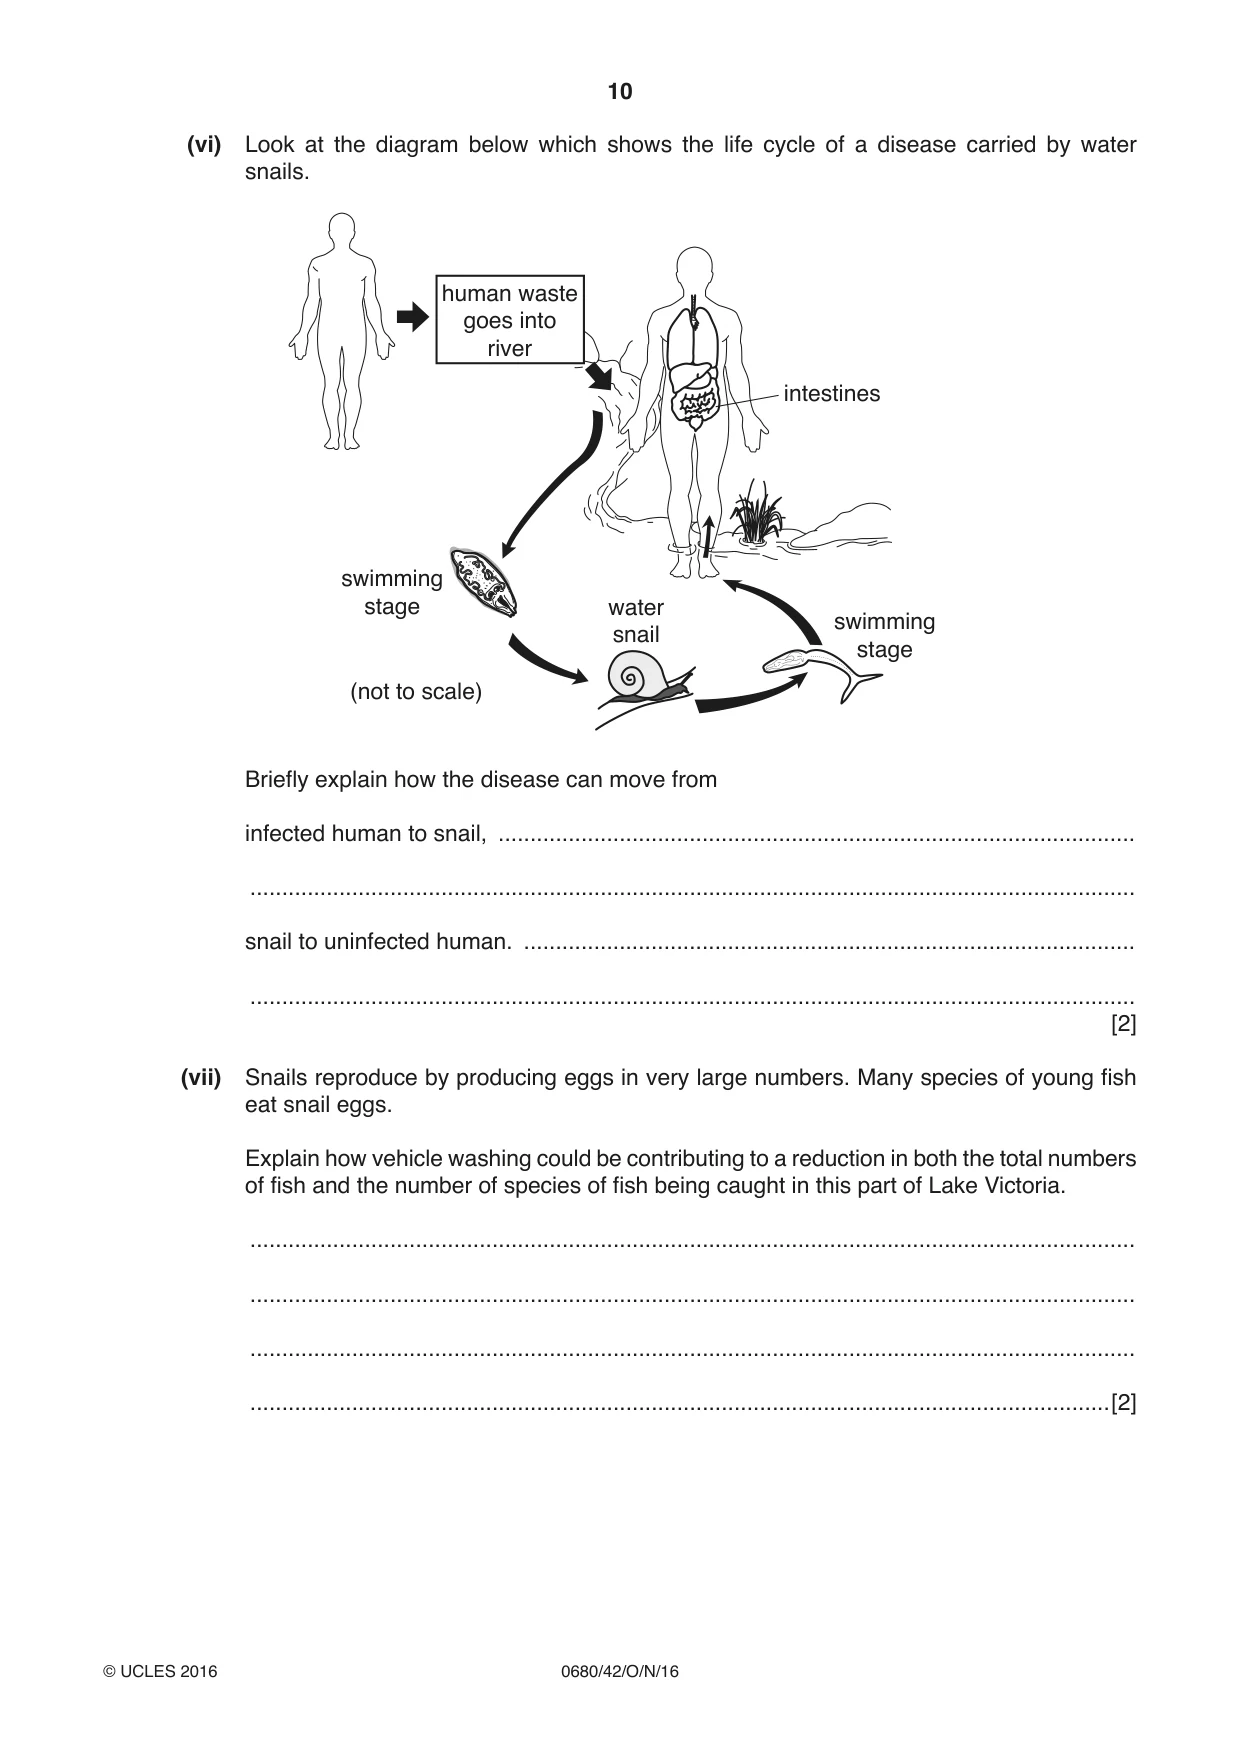
10 0680/42/O/N/16 © UCLES 2016 (vi) Look at the diagram below which shows the life cycle of a disease carried by water snails. intestines human waste goes into river swimming stage water snail swimming stage (not to scale) Briefly explain how the disease can move from infected human to snail, … … snail to uninfected human. … … [2] (vii) Snails reproduce by producing eggs in very large numbers. Many species of young fish eat snail eggs. Explain how vehicle washing could be contributing to a reduction in both the total numbers of fish and the number of species of fish being caught in this part of Lake Victoria. … … … …[2]
Question paper, page 11
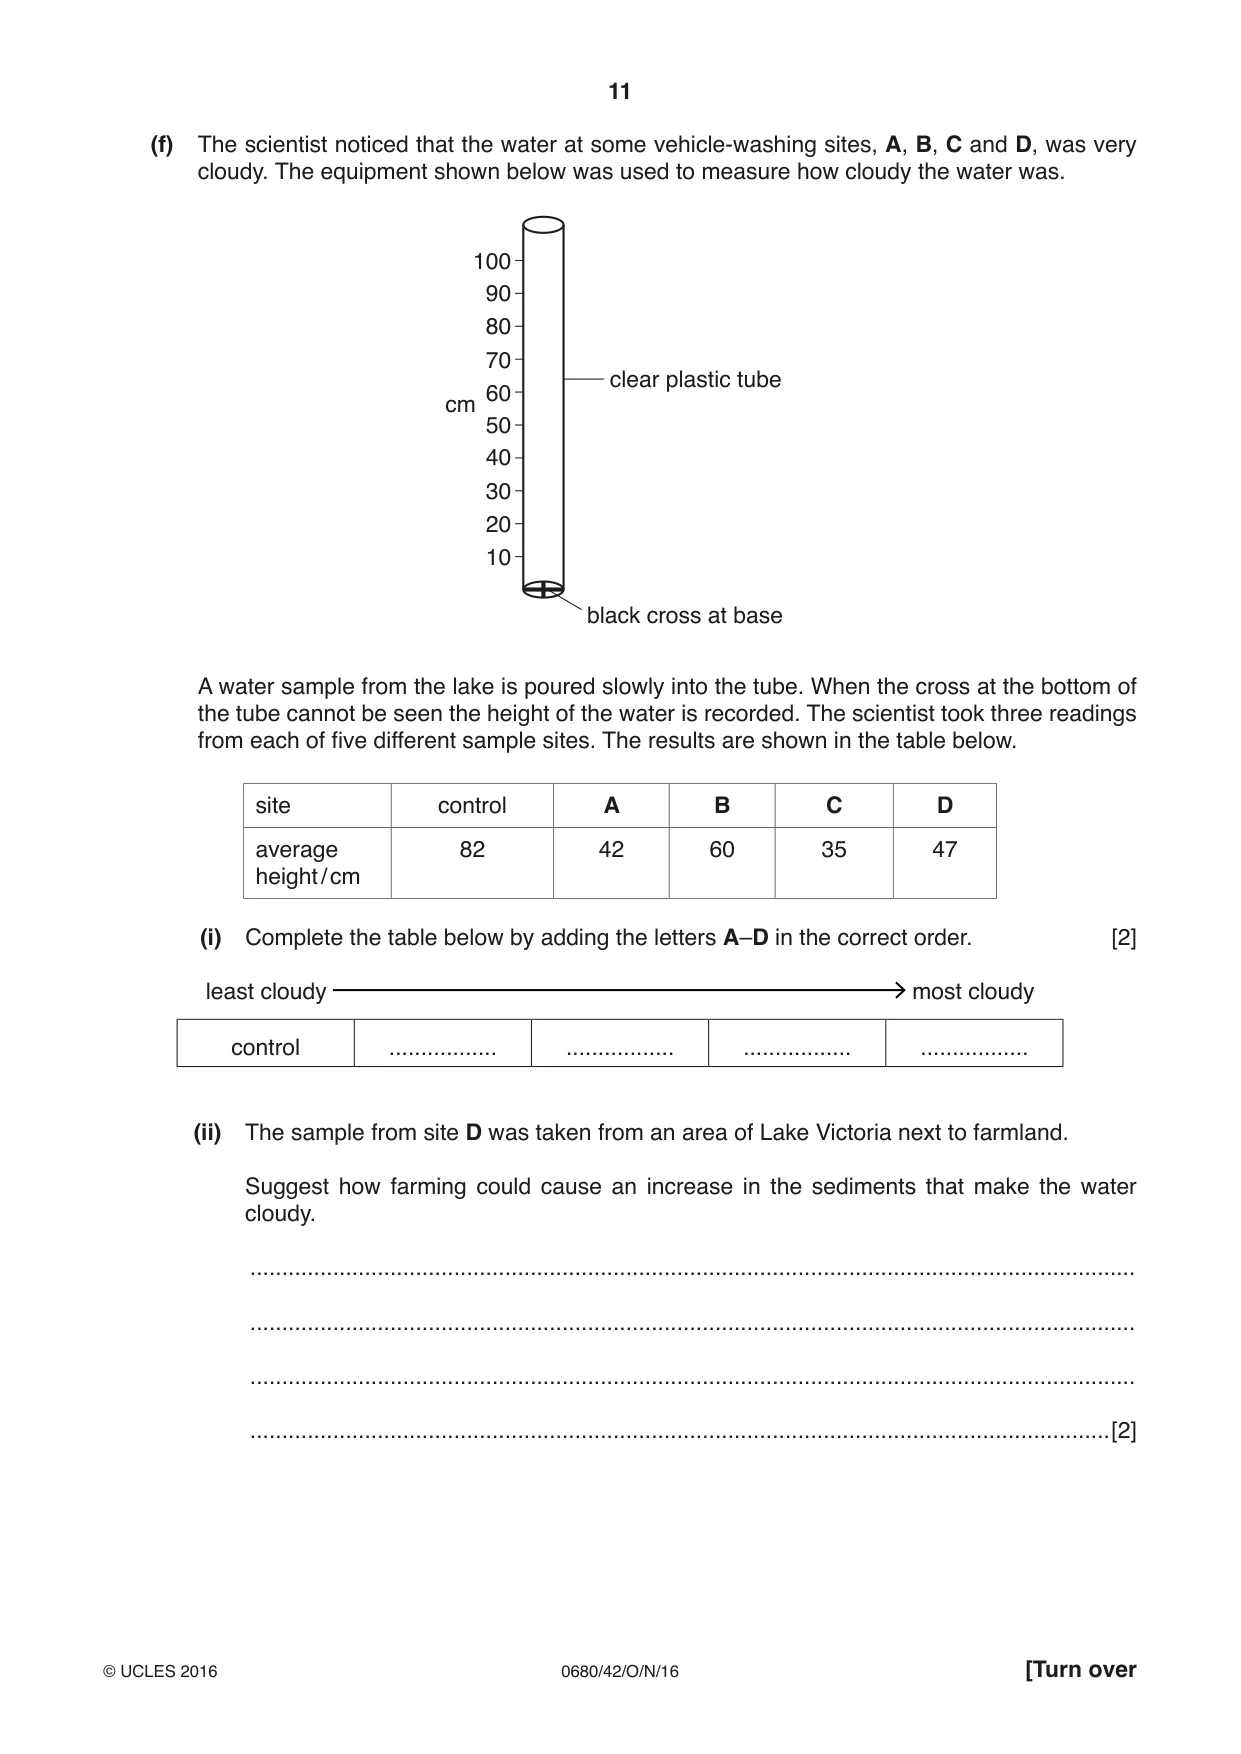
11 0680/42/O/N/16 © UCLES 2016 [Turn over (f) The scientist noticed that the water at some vehicle-washing sites, A, B, C and D, was very cloudy. The equipment shown below was used to measure how cloudy the water was. 100 90 80 70 60 50 clear plastic tube cm black cross at base 40 30 20 10 A water sample from the lake is poured slowly into the tube. When the cross at the bottom of the tube cannot be seen the height of the water is recorded. The scientist took three readings from each of five different sample sites. The results are shown in the table below. site control A B C D average height / cm 82 42 60 35 47 (i) Complete the table below by adding the letters A–D in the correct order. [2] least cloudy most cloudy control … … … … (ii) The sample from site D was taken from an area of Lake Victoria next to farmland. Suggest how farming could cause an increase in the sediments that make the water cloudy. … … … …[2]
Question paper, page 12
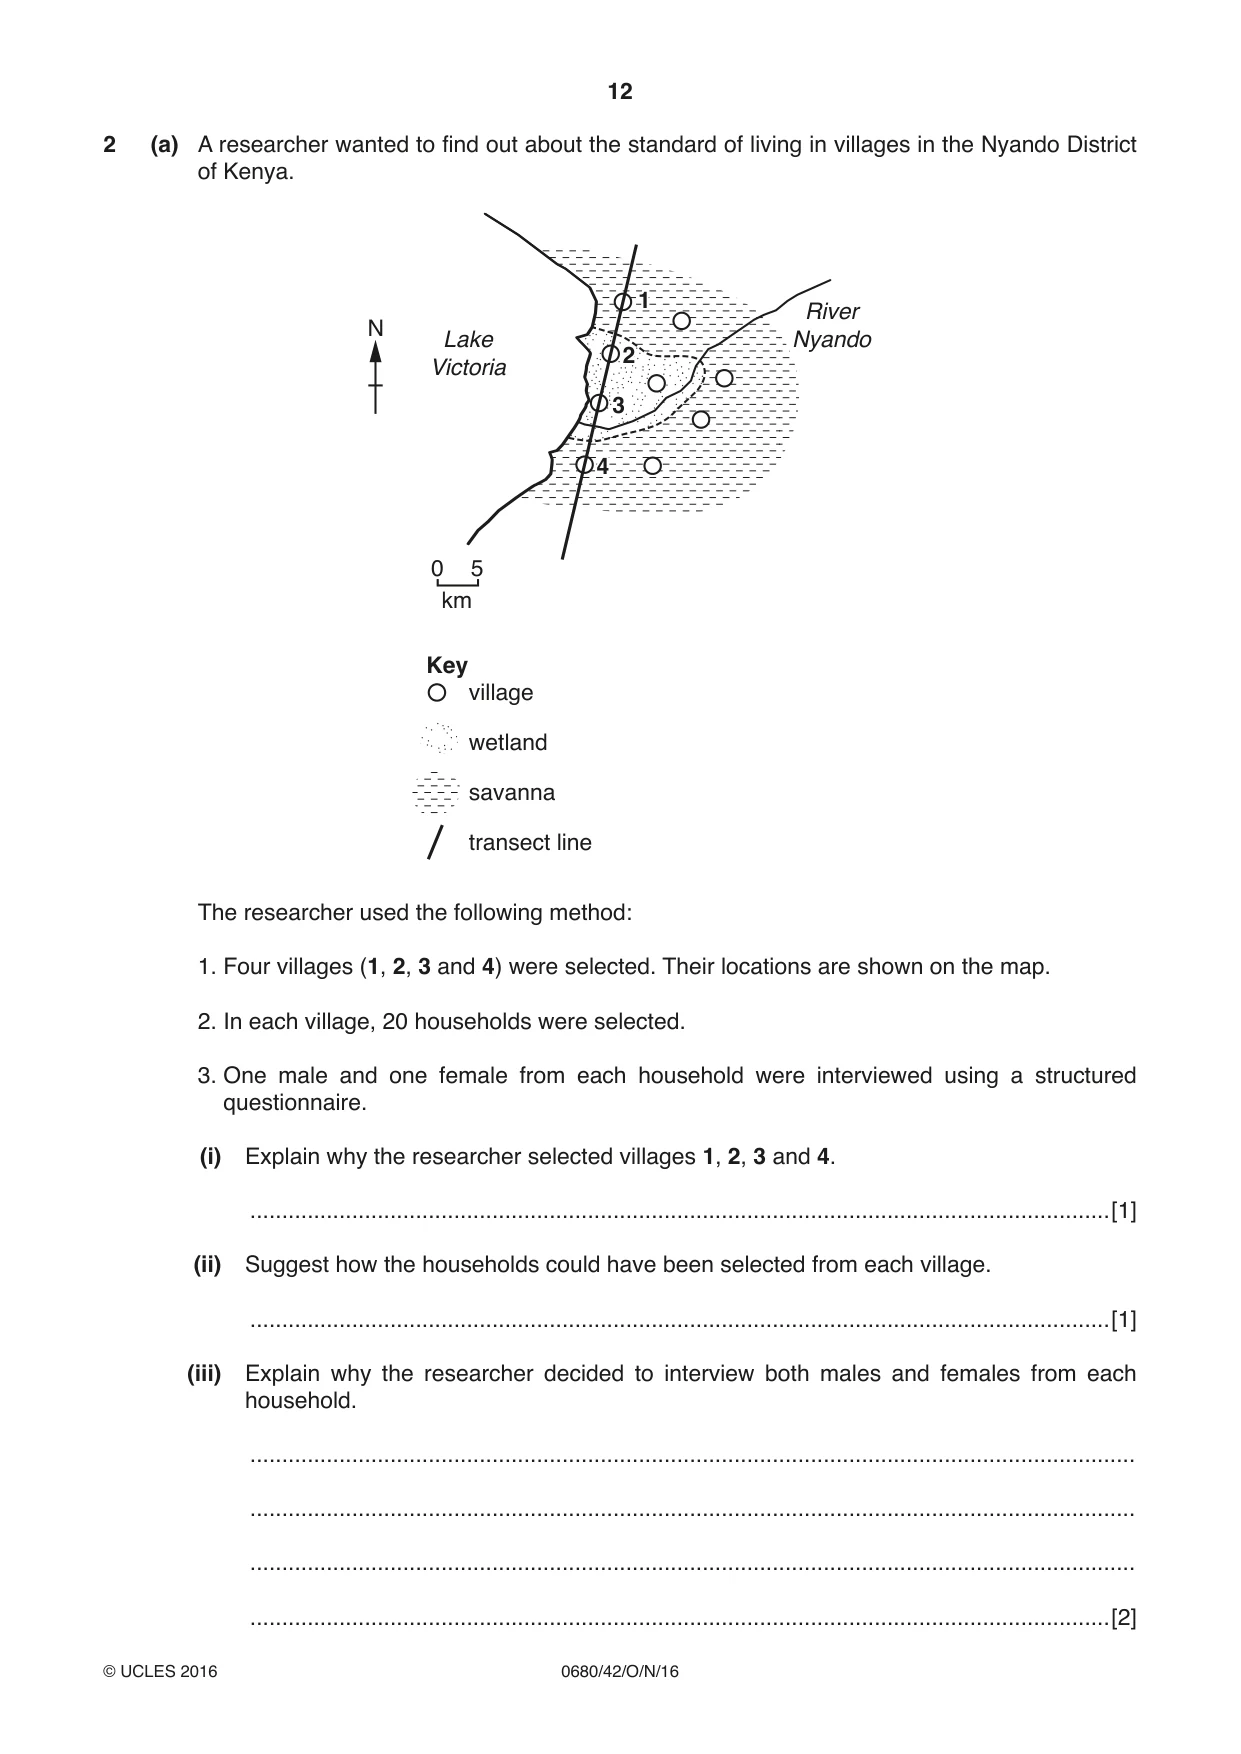
12 0680/42/O/N/16 © UCLES 2016 2 (a) A researcher wanted to find out about the standard of living in villages in the Nyando District of Kenya. 1 2 3 4 0 5 km village wetland savanna transect line Key Lake Victoria River Nyando N The researcher used the following method: 1. Four villages (1, 2, 3 and 4) were selected. Their locations are shown on the map. 2. In each village, 20 households were selected. 3. One male and one female from each household were interviewed using a structured questionnaire. (i) Explain why the researcher selected villages 1, 2, 3 and 4. …[1] (ii) Suggest how the households could have been selected from each village. …[1] (iii) Explain why the researcher decided to interview both males and females from each household. … … … …[2]
Question paper, page 13
13 0680/42/O/N/16 © UCLES 2016 [Turn over (iv) Suggest two reasons why the researcher used a structured questionnaire. … … … …[2] (b) Some results of the questionnaire are shown in the table below. household asset percentage of wetland households percentage of savanna households mobile/cellphone 75 80 radio 85 88 bank account 5 6 improved cooking stove 52 55 separate building for farm animals 47 55 (i) Draw a bar graph on the grid below to show the information from the table. Complete the key. [4] Key wetland savanna
Question paper, page 14
14 0680/42/O/N/16 © UCLES 2016 (ii) The researcher decided that wetland and savanna households had a similar standard of living. Use information from the graph to explain this decision. … … … … … …[3] (iii) Many households in the savanna villages suffer from food shortages in March, April and May. Explain why the price of food in local markets is always high in April and May. … … … …[2] (iv) Suggest two questions that the researcher could have asked about crop-growing in the savanna area. 1. … 2. … [2] (c) Describe ways in which the government could encourage a sustainable way of life in the Nyando District. … … … … … … … …[4]
Question paper, page 15
15 0680/42/O/N/16 © UCLES 2016 BLANK PAGE
Question paper, page 16
16 0680/42/O/N/16 © UCLES 2016 BLANK PAGE Permission to reproduce items where third-party owned material protected by copyright is included has been sought and cleared where possible. Every reasonable effort has been made by the publisher (UCLES) to trace copyright holders, but if any items requiring clearance have unwittingly been included, the publisher will be pleased to make amends at the earliest possible opportunity. To avoid the issue of disclosure of answer-related information to candidates, all copyright acknowledgements are reproduced online in the Cambridge International Examinations Copyright Acknowledgements Booklet. This is produced for each series of examinations and is freely available to download at www.cie.org.uk after the live examination series. Cambridge International Examinations is part of the Cambridge Assessment Group. Cambridge Assessment is the brand name of University of Cambridge Local Examinations Syndicate (UCLES), which is itself a department of the University of Cambridge.
Mark scheme, page 1
® IGCSE is the registered trademark of Cambridge International Examinations. This document consists of 5 printed pages. © UCLES 2016 [Turn over Cambridge International Examinations Cambridge International General Certificate of Secondary Education ENVIRONMENTAL MANAGEMENT 0680/42 Paper 4 Alternative to Coursework October/November 2016 MARK SCHEME Maximum Mark: 60 Published This mark scheme is published as an aid to teachers and candidates, to indicate the requirements of the examination. It shows the basis on which Examiners were instructed to award marks. It does not indicate the details of the discussions that took place at an Examiners’ meeting before marking began, which would have considered the acceptability of alternative answers. Mark schemes should be read in conjunction with the question paper and the Principal Examiner Report for Teachers. Cambridge will not enter into discussions about these mark schemes. Cambridge is publishing the mark schemes for the October/November 2016 series for most Cambridge IGCSE®, Cambridge International A and AS Level components and some Cambridge O Level components.
Mark scheme, page 2
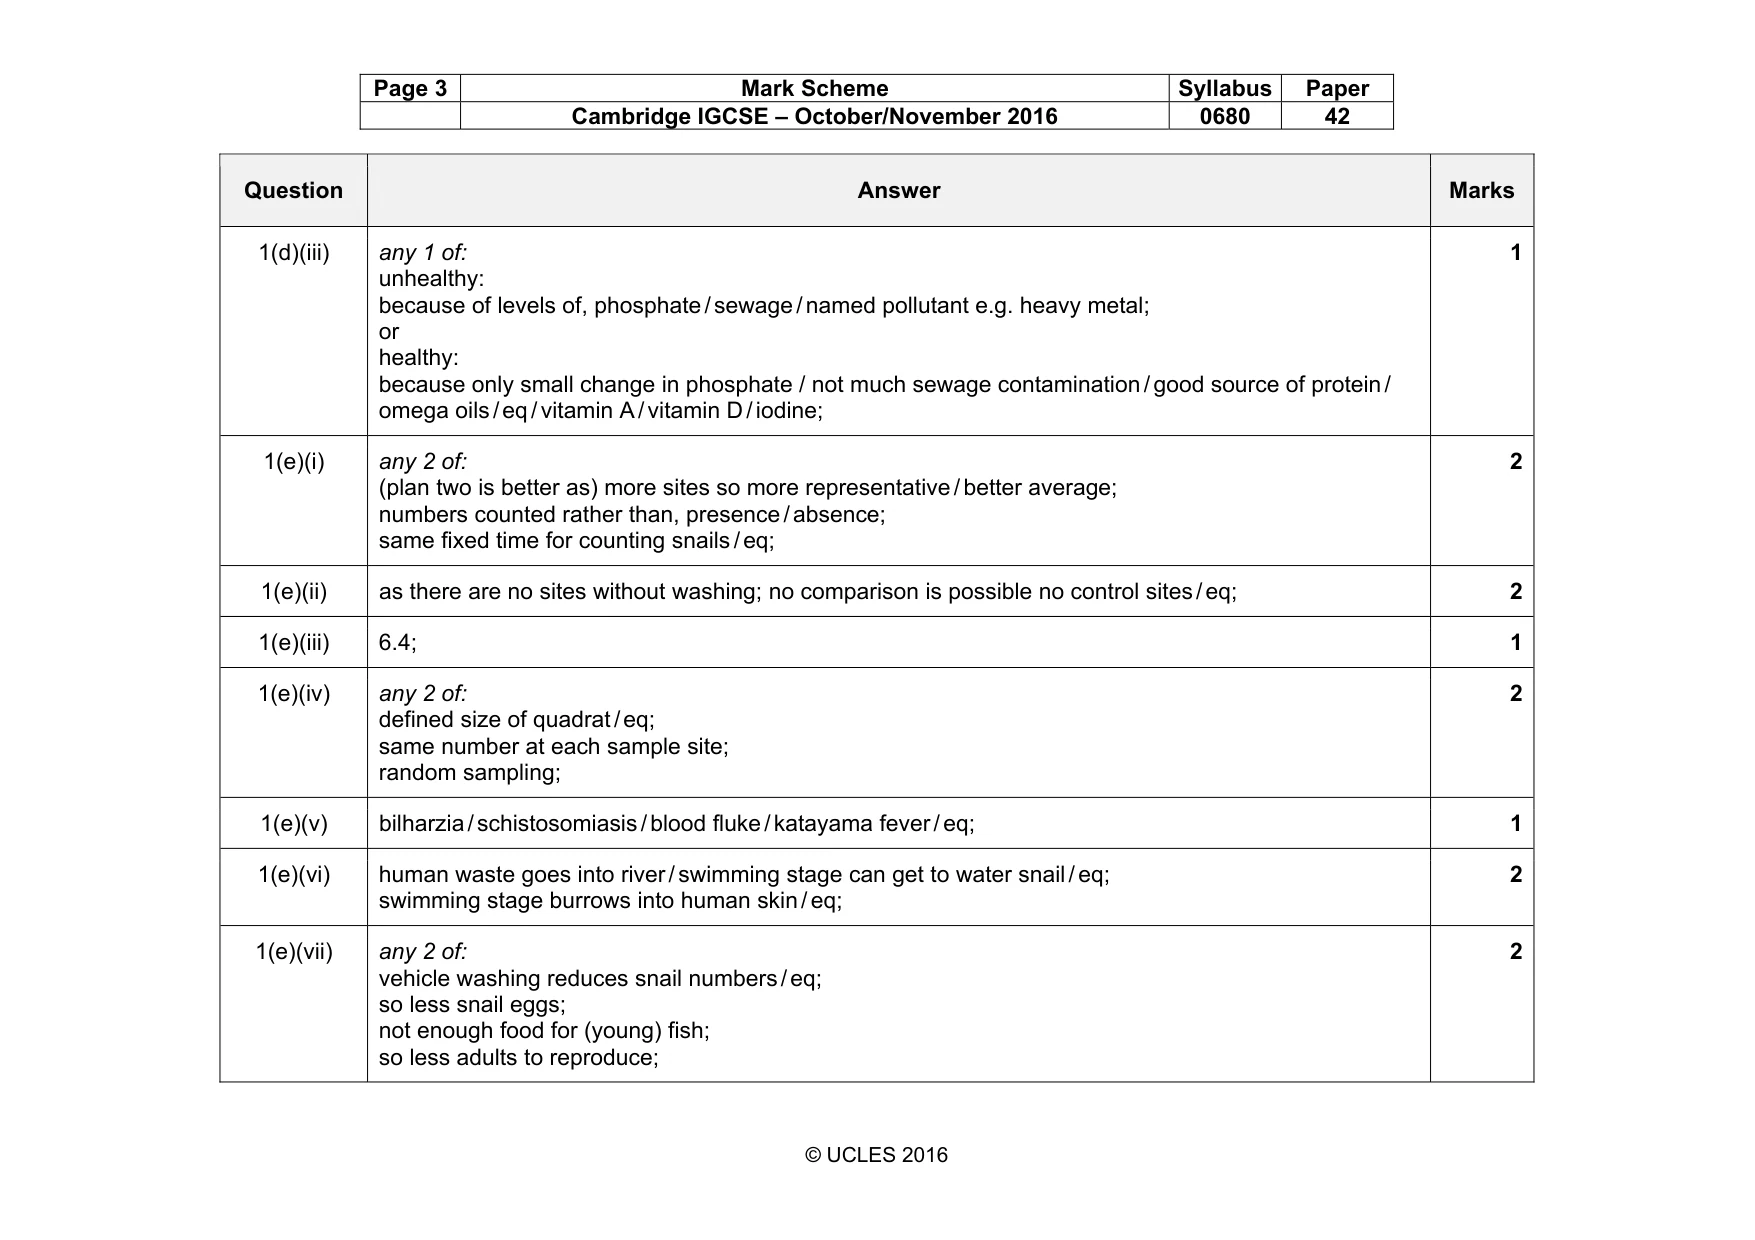
Page 2 Mark Scheme Syllabus Paper Cambridge IGCSE – October/November 2016 0680 42 © UCLES 2016 Question Answer Marks 1(a) it is the numbers / variety / eq; of different types / species / biological groups of living organisms / living things / plants and animals; 2 1(b)(i) Tanzania; 1 1(b)(ii) Rwanda; Burundi; 2 1(c)(i) water would be contaminated after vehicle washing all day / eq / as a control / to compare results; 1 1(c)(ii) 41.6; 8.8; 2 1(c)(iii) any 3 of: pH lower in all washing sites; phosphate higher; salinity higher; use of figures to support; ORA 3 1(c)(iv) any 2 of: oil; petrol / eq; diesel; brake fluid; battery acid; shampoo / cleaning agents; 2 1(c)(v) table drawn; headings; all data filled in a tally form; 3 1(d)(i) any 5 of: fertiliser / phosphates / nitrates encourage algal growth / bloom; light cannot penetrate; so plants do not photosynthesise; algae / plants die; decomposed by microbes / eq; bacteria increase; oxygen used up / high BOD; (some) fish die / fish populations decrease; 5 1(d)(ii) any 1 of: good source of, protein / omega oils / eq / vitamin A / vitamin D / iodine; helps children grow; maintains / boosts, immune system; 1
Mark scheme, page 3
Page 3 Mark Scheme Syllabus Paper Cambridge IGCSE – October/November 2016 0680 42 © UCLES 2016 Question Answer Marks 1(d)(iii) any 1 of: unhealthy: because of levels of, phosphate / sewage / named pollutant e.g. heavy metal; or healthy: because only small change in phosphate / not much sewage contamination / good source of protein / omega oils / eq / vitamin A / vitamin D / iodine; 1 1(e)(i) any 2 of: (plan two is better as) more sites so more representative / better average; numbers counted rather than, presence / absence; same fixed time for counting snails / eq; 2 1(e)(ii) as there are no sites without washing; no comparison is possible no control sites / eq; 2 1(e)(iii) 6.4; 1 1(e)(iv) any 2 of: defined size of quadrat / eq; same number at each sample site; random sampling; 2 1(e)(v) bilharzia / schistosomiasis / blood fluke / katayama fever / eq; 1 1(e)(vi) human waste goes into river / swimming stage can get to water snail / eq; swimming stage burrows into human skin / eq; 2 1(e)(vii) any 2 of: vehicle washing reduces snail numbers / eq; so less snail eggs; not enough food for (young) fish; so less adults to reproduce; 2
Mark scheme, page 4
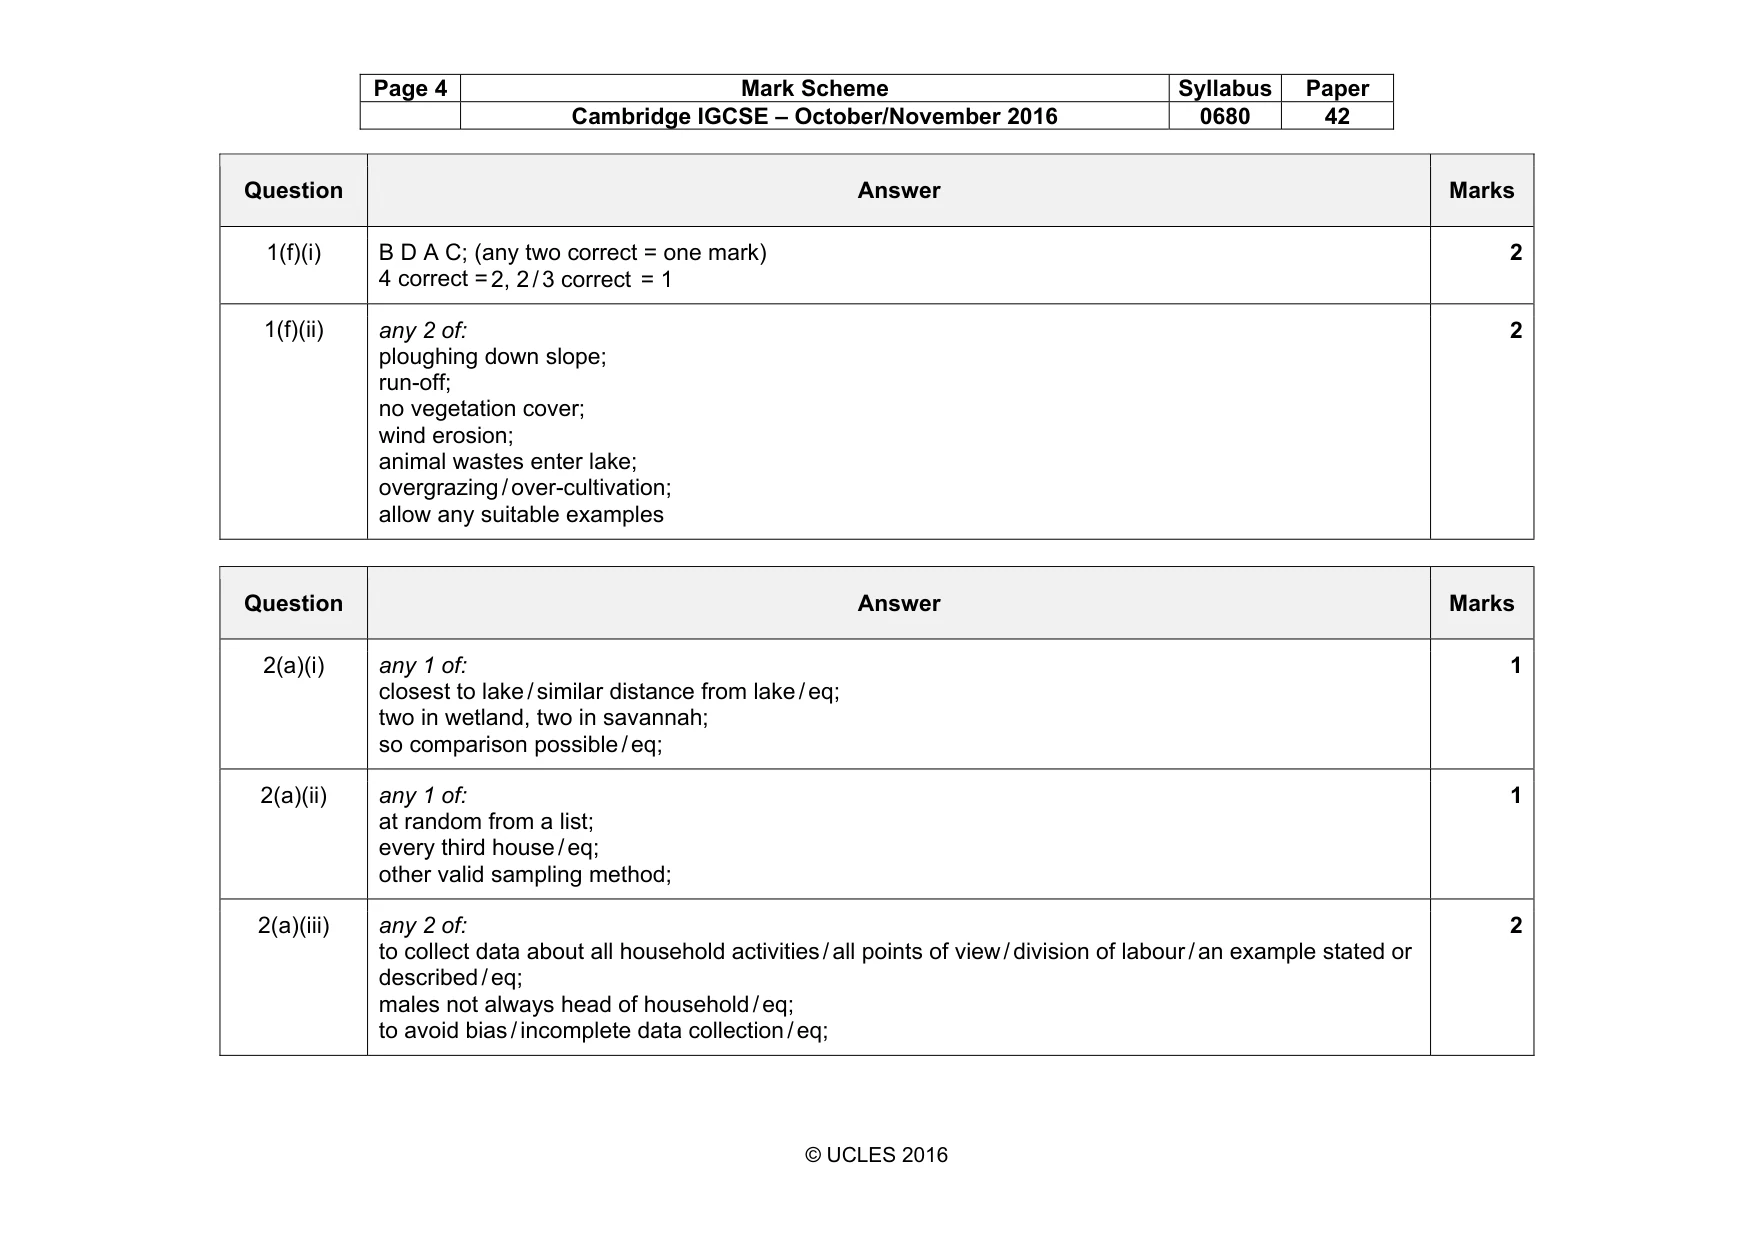
Page 4 Mark Scheme Syllabus Paper Cambridge IGCSE – October/November 2016 0680 42 © UCLES 2016 Question Answer Marks 1(f)(i) B D A C; (any two correct = one mark) 4 correct = 2, 2 / 3 correct = 1 2 1(f)(ii) any 2 of: ploughing down slope; run-off; no vegetation cover; wind erosion; animal wastes enter lake; overgrazing / over-cultivation; allow any suitable examples 2 Question Answer Marks 2(a)(i) any 1 of: closest to lake / similar distance from lake / eq; two in wetland, two in savannah; so comparison possible / eq; 1 2(a)(ii) any 1 of: at random from a list; every third house / eq; other valid sampling method; 1 2(a)(iii) any 2 of: to collect data about all household activities / all points of view / division of labour / an example stated or described / eq; males not always head of household / eq; to avoid bias / incomplete data collection / eq; 2
Mark scheme, page 5
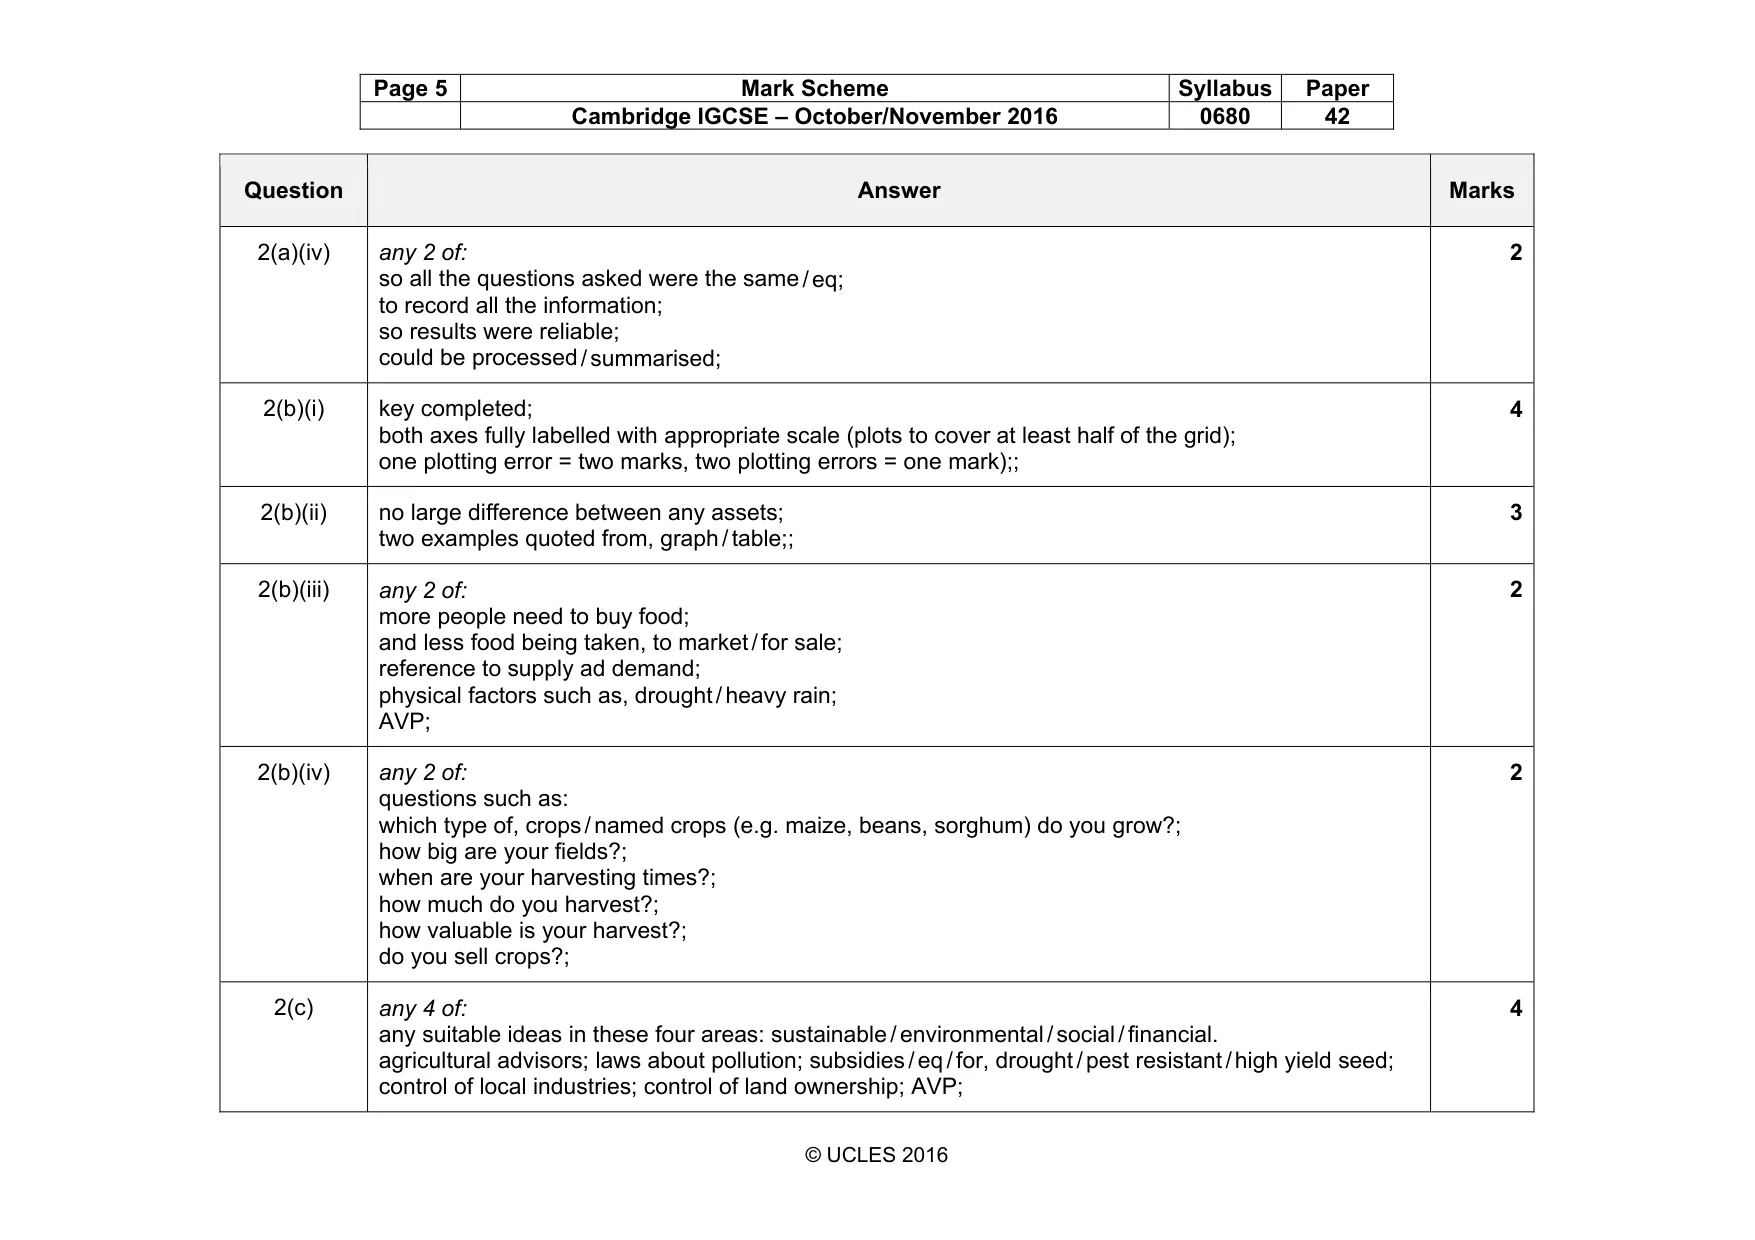
Page 5 Mark Scheme Syllabus Paper Cambridge IGCSE – October/November 2016 0680 42 © UCLES 2016 Question Answer Marks 2(a)(iv) any 2 of: so all the questions asked were the same / eq; to record all the information; so results were reliable; could be processed / summarised; 2 2(b)(i) key completed; both axes fully labelled with appropriate scale (plots to cover at least half of the grid); one plotting error = two marks, two plotting errors = one mark);; 4 2(b)(ii) no large difference between any assets; two examples quoted from, graph / table;; 3 2(b)(iii) any 2 of: more people need to buy food; and less food being taken, to market / for sale; reference to supply ad demand; physical factors such as, drought / heavy rain; AVP; 2 2(b)(iv) any 2 of: questions such as: which type of, crops / named crops (e.g. maize, beans, sorghum) do you grow?; how big are your fields?; when are your harvesting times?; how much do you harvest?; how valuable is your harvest?; do you sell crops?; 2 2(c) any 4 of: any suitable ideas in these four areas: sustainable / environmental / social / financial. agricultural advisors; laws about pollution; subsidies / eq / for, drought / pest resistant / high yield seed; control of local industries; control of land ownership; AVP; 4
What you needed in this session
Cambridge’s own grade thresholds for 2016 Oct/Nov, Paper 4 · Variant 2. A higher threshold means an easier paper — the bar moves with how the cohort did.