Cambridge IGCSE Environmental Management 0680 — 2017 Feb/March Paper 4 · Variant 2
0680/42/F/M/17 · 3 questions · 60 marks · ≈68 min
The question paper and its mark scheme, free to read here and free to download. This is Cambridge’s own paper, exactly as it was sat.
Question paper16 pages
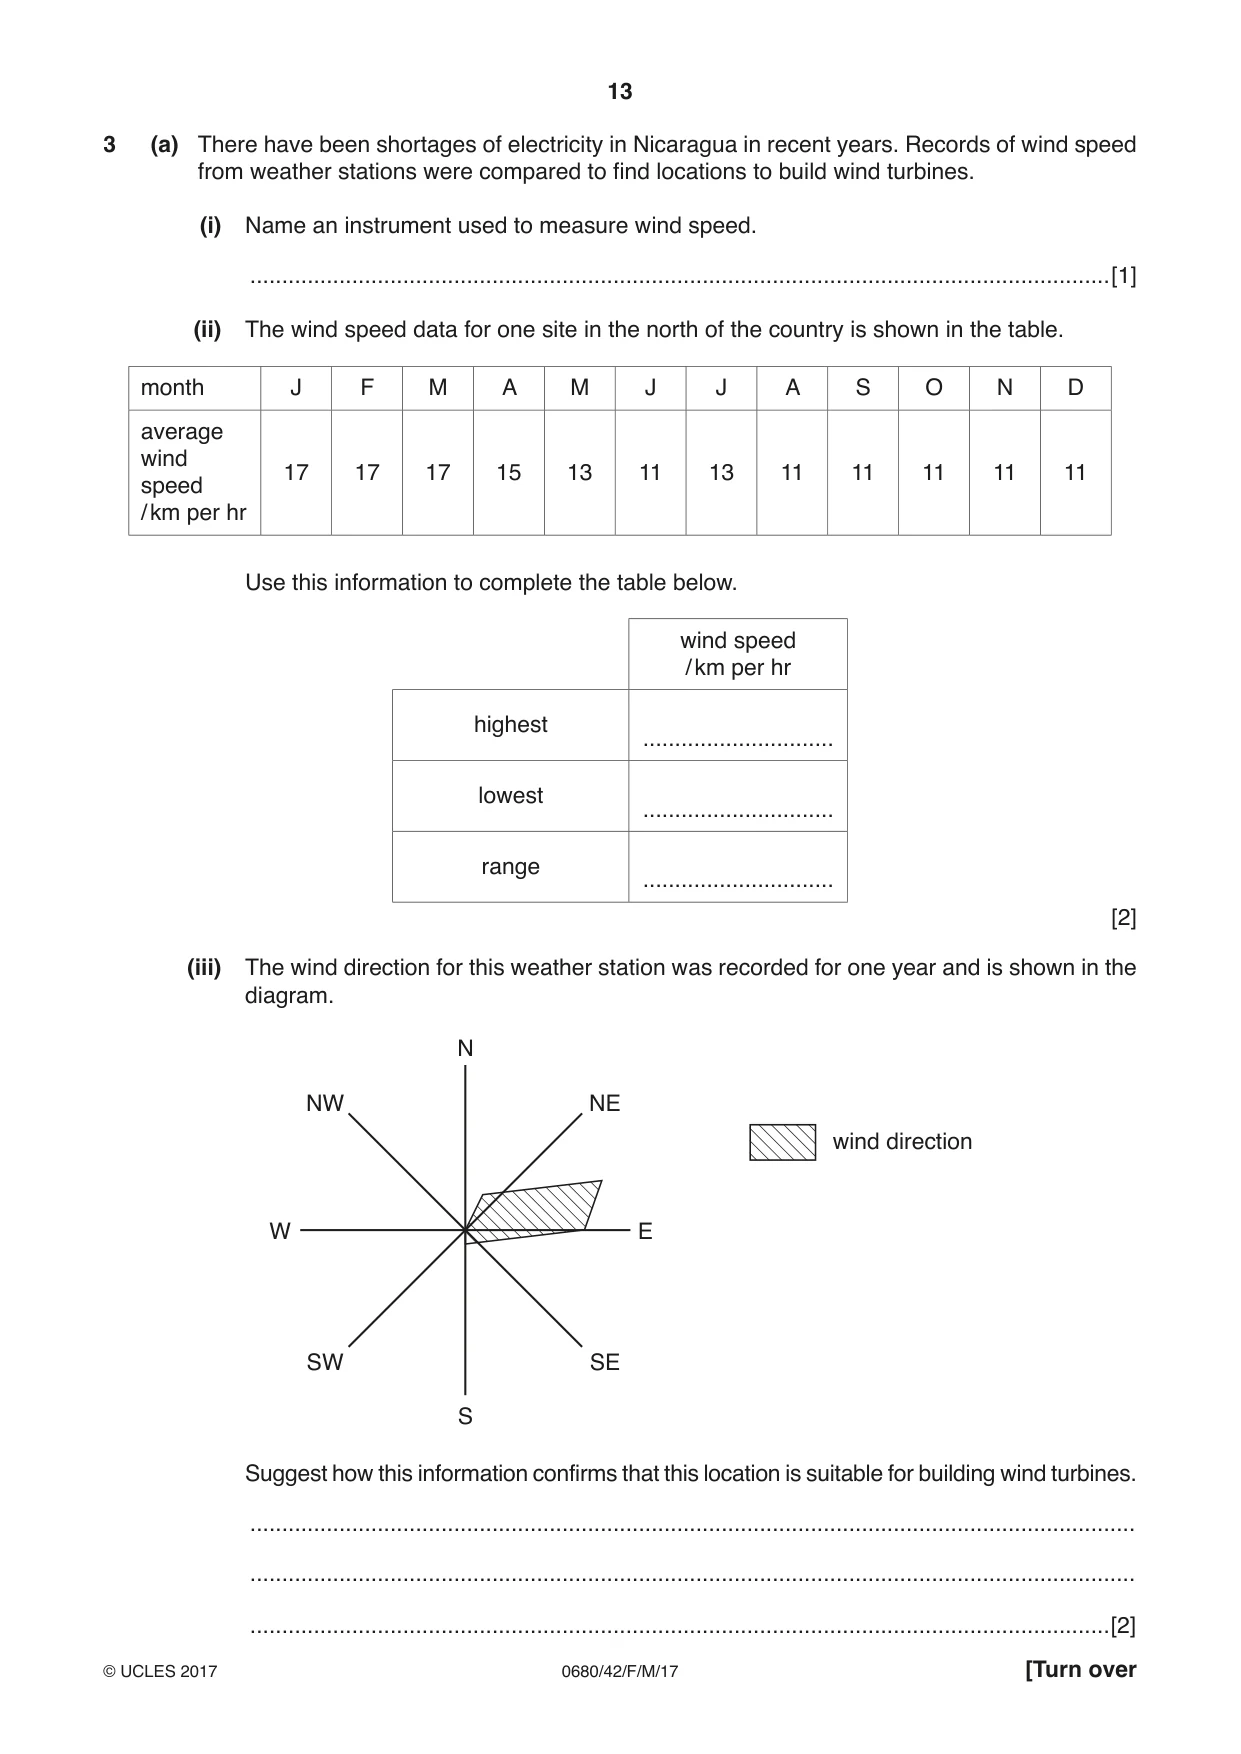
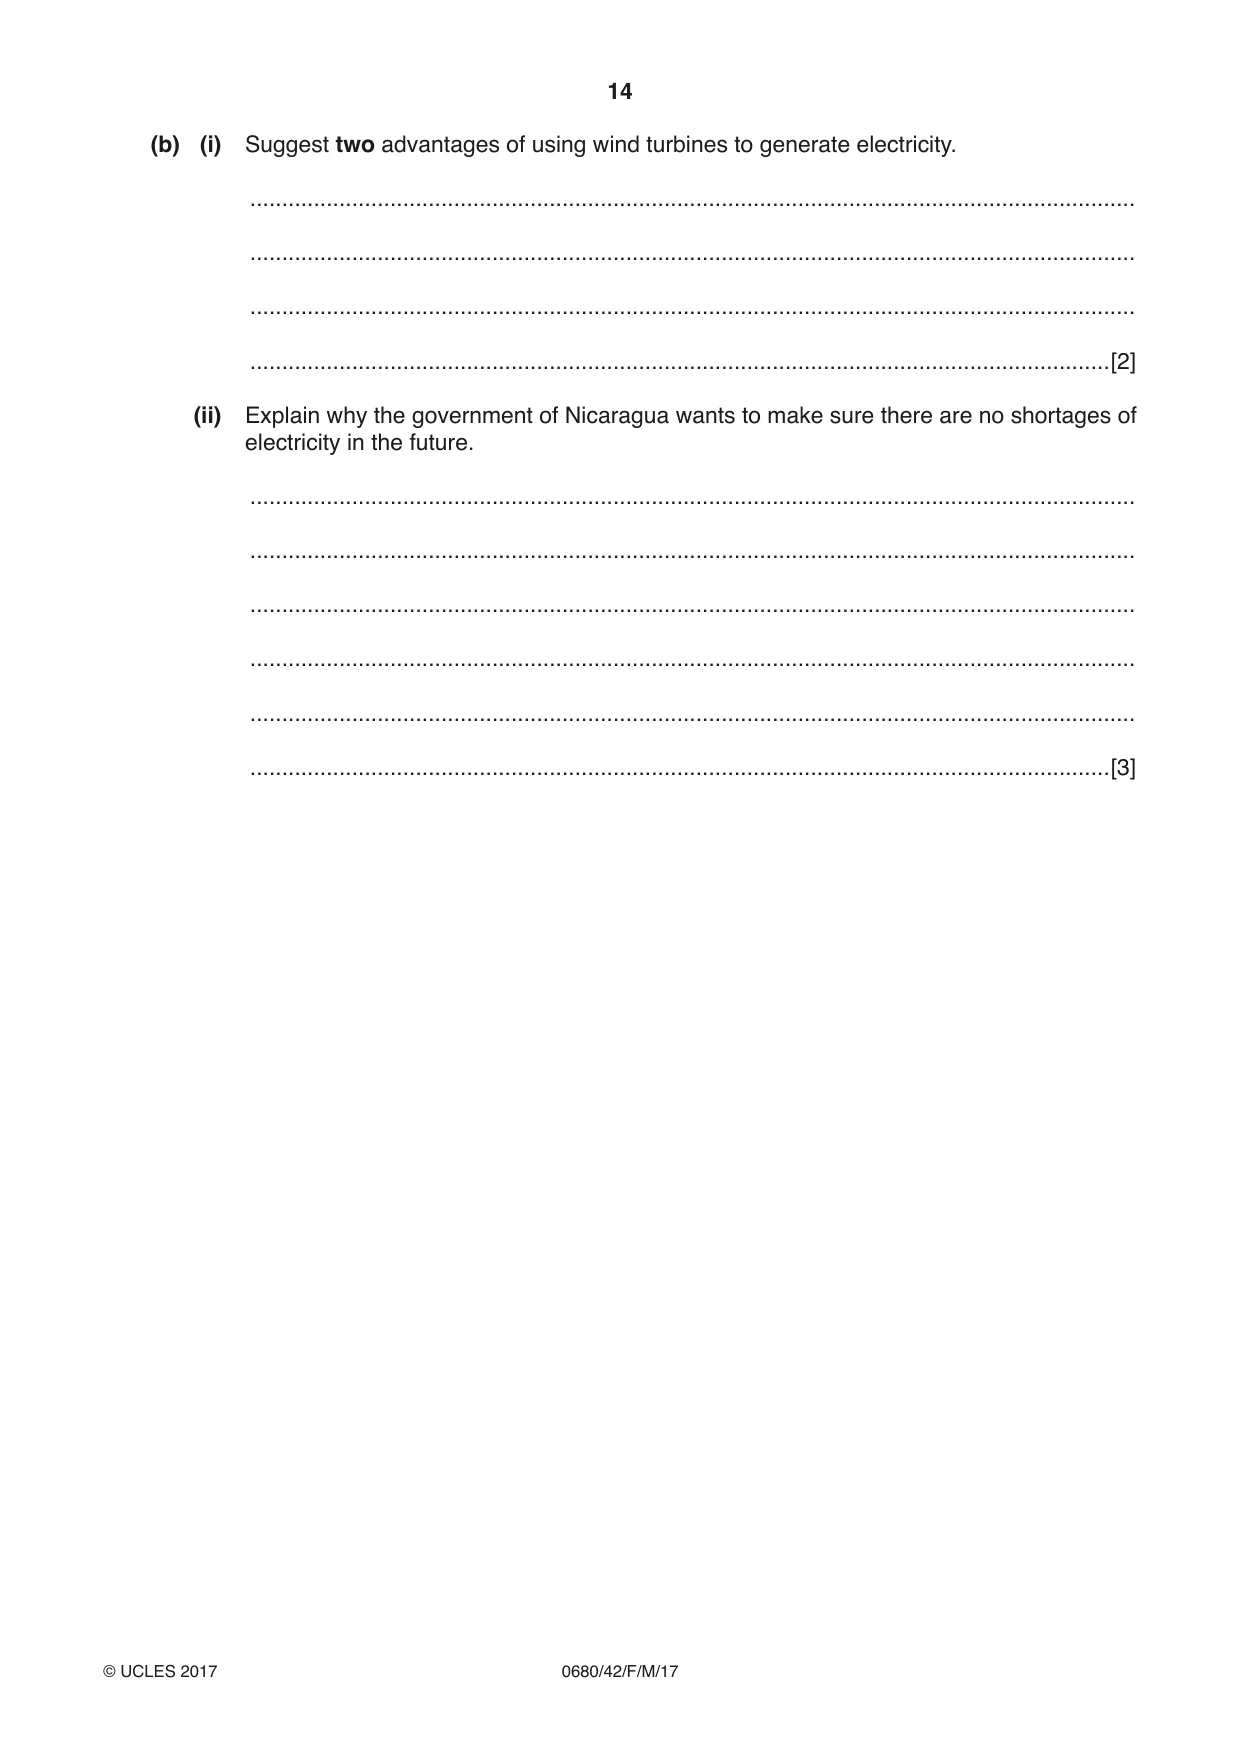


Mark scheme7 pages
Answers below. Sit the paper first if you are practising.
Questions as text
Q1 · Nicaragua has the lowest population density of any Central American country
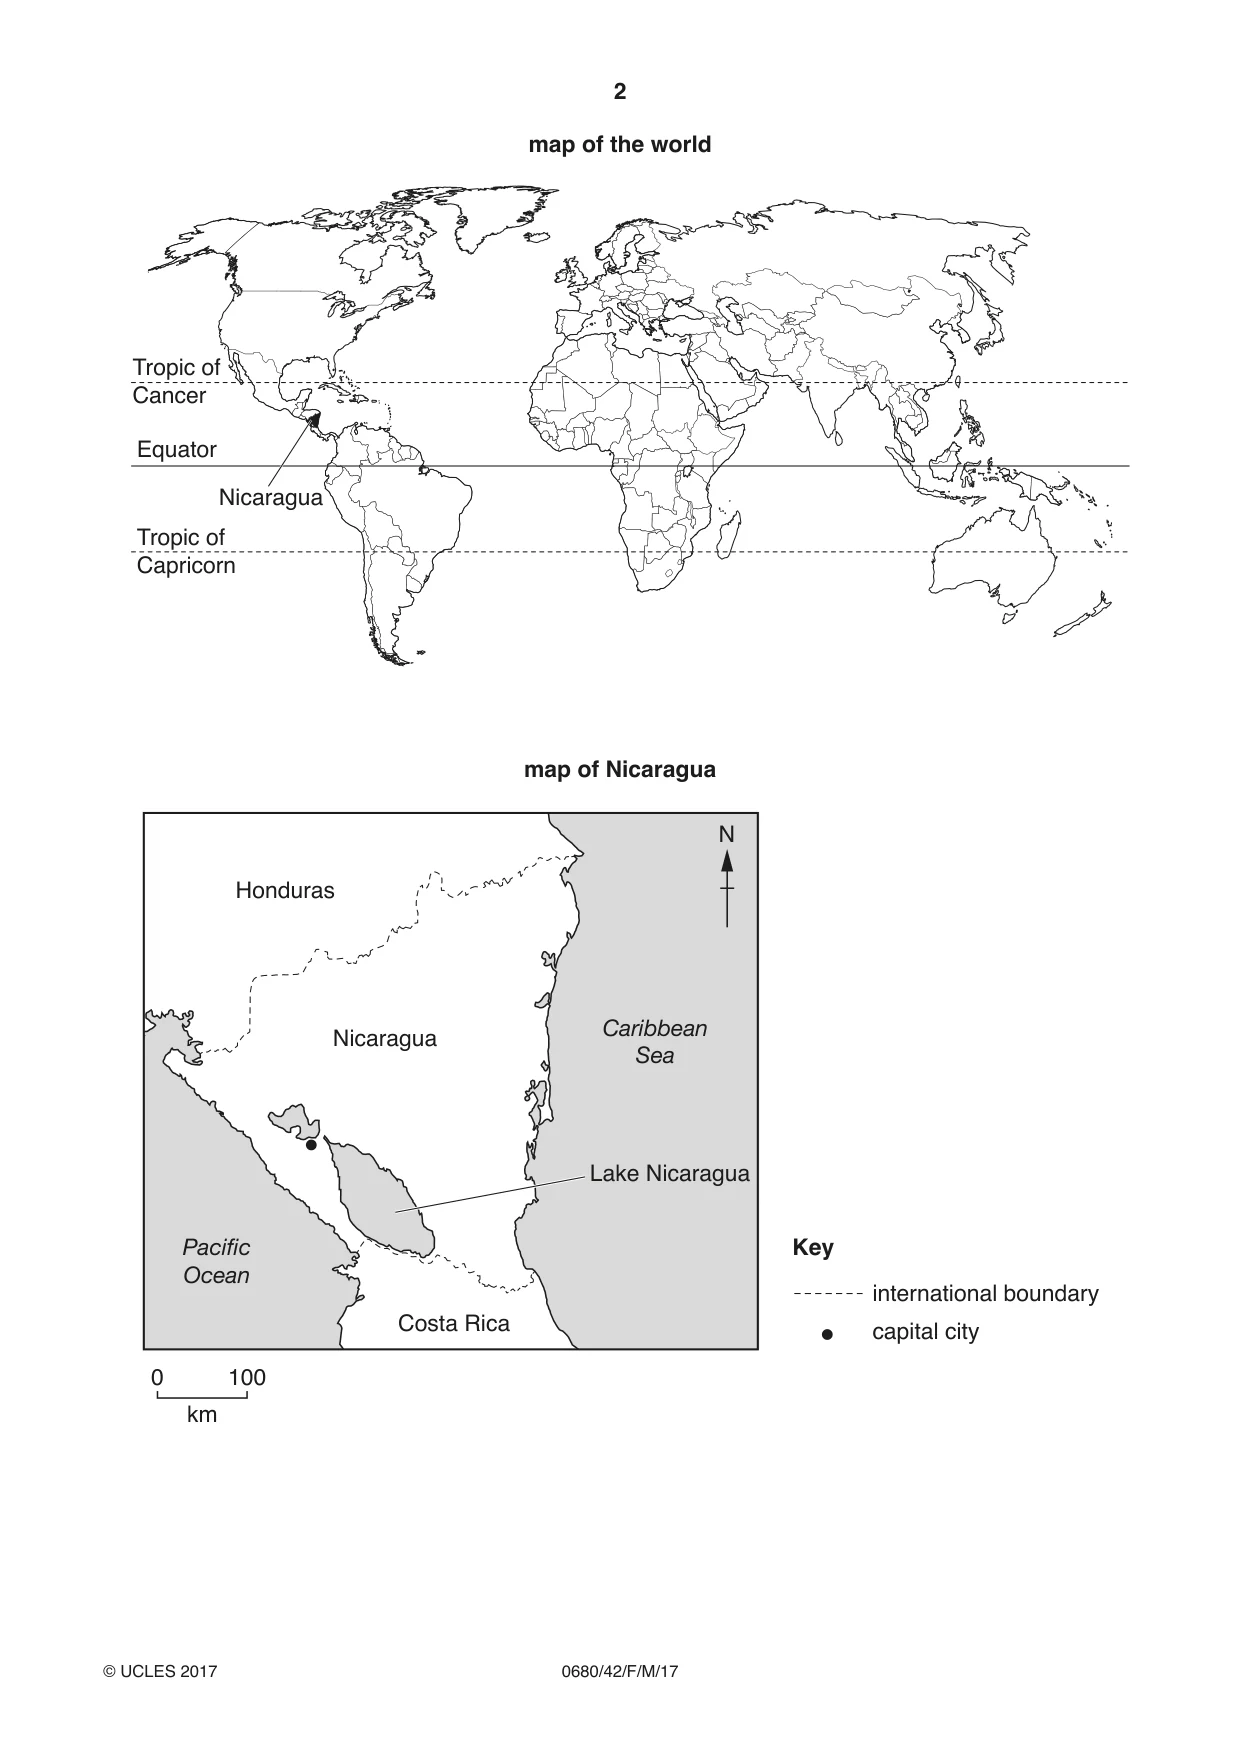
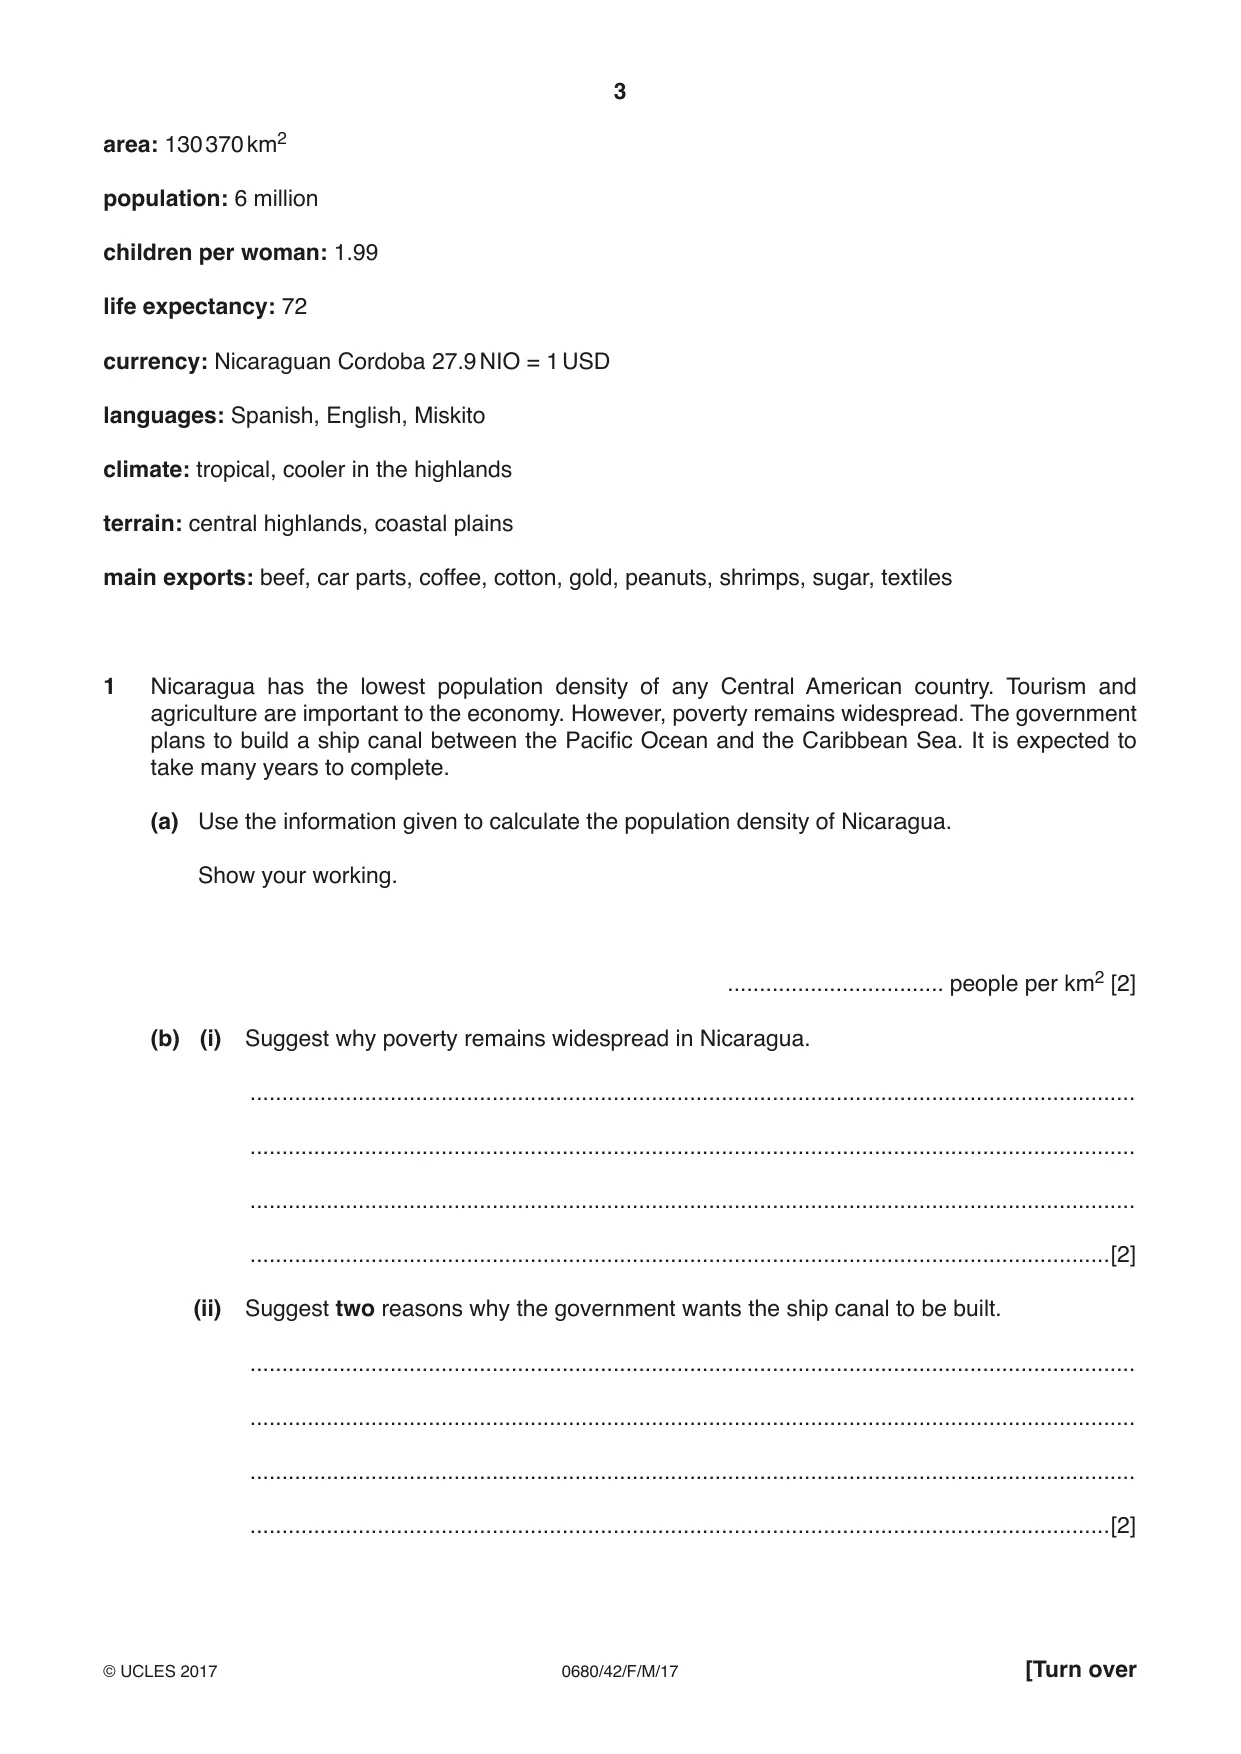
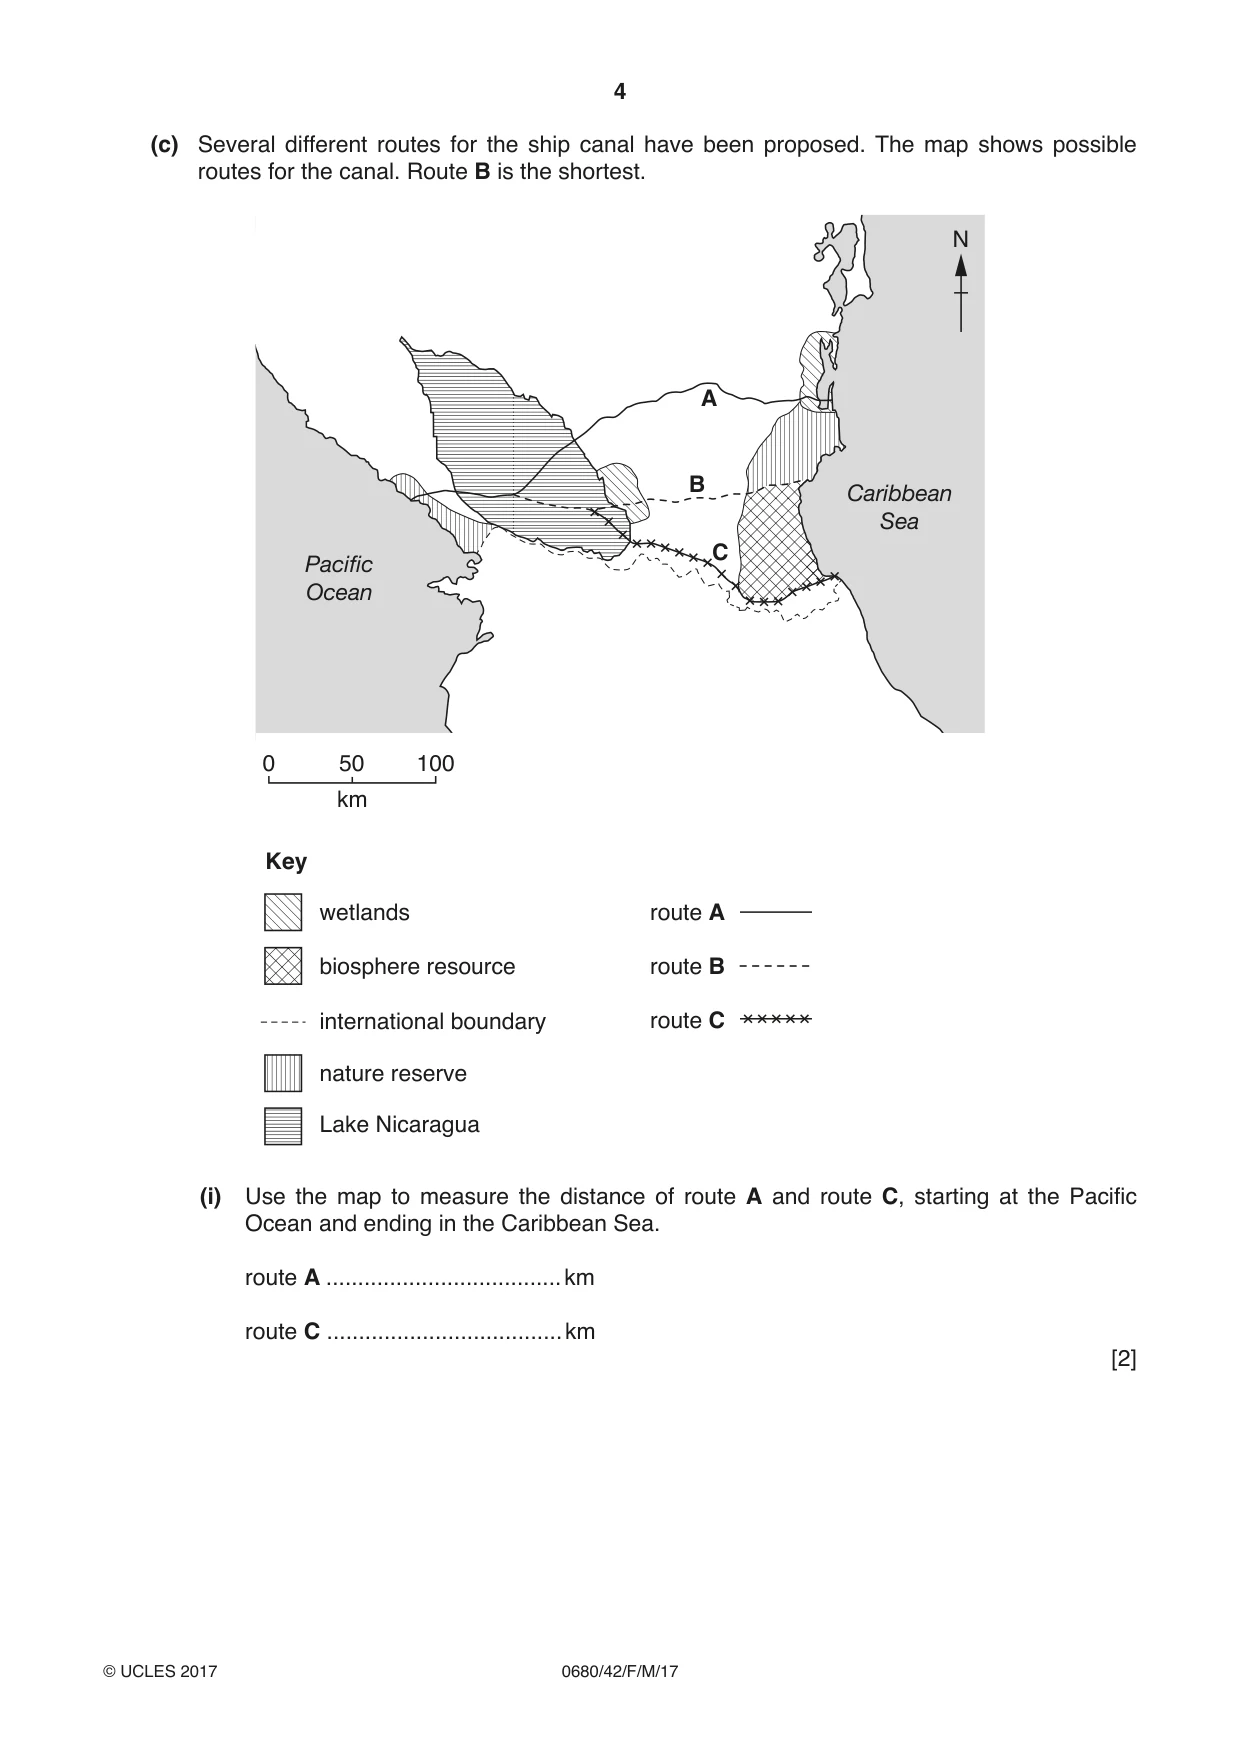
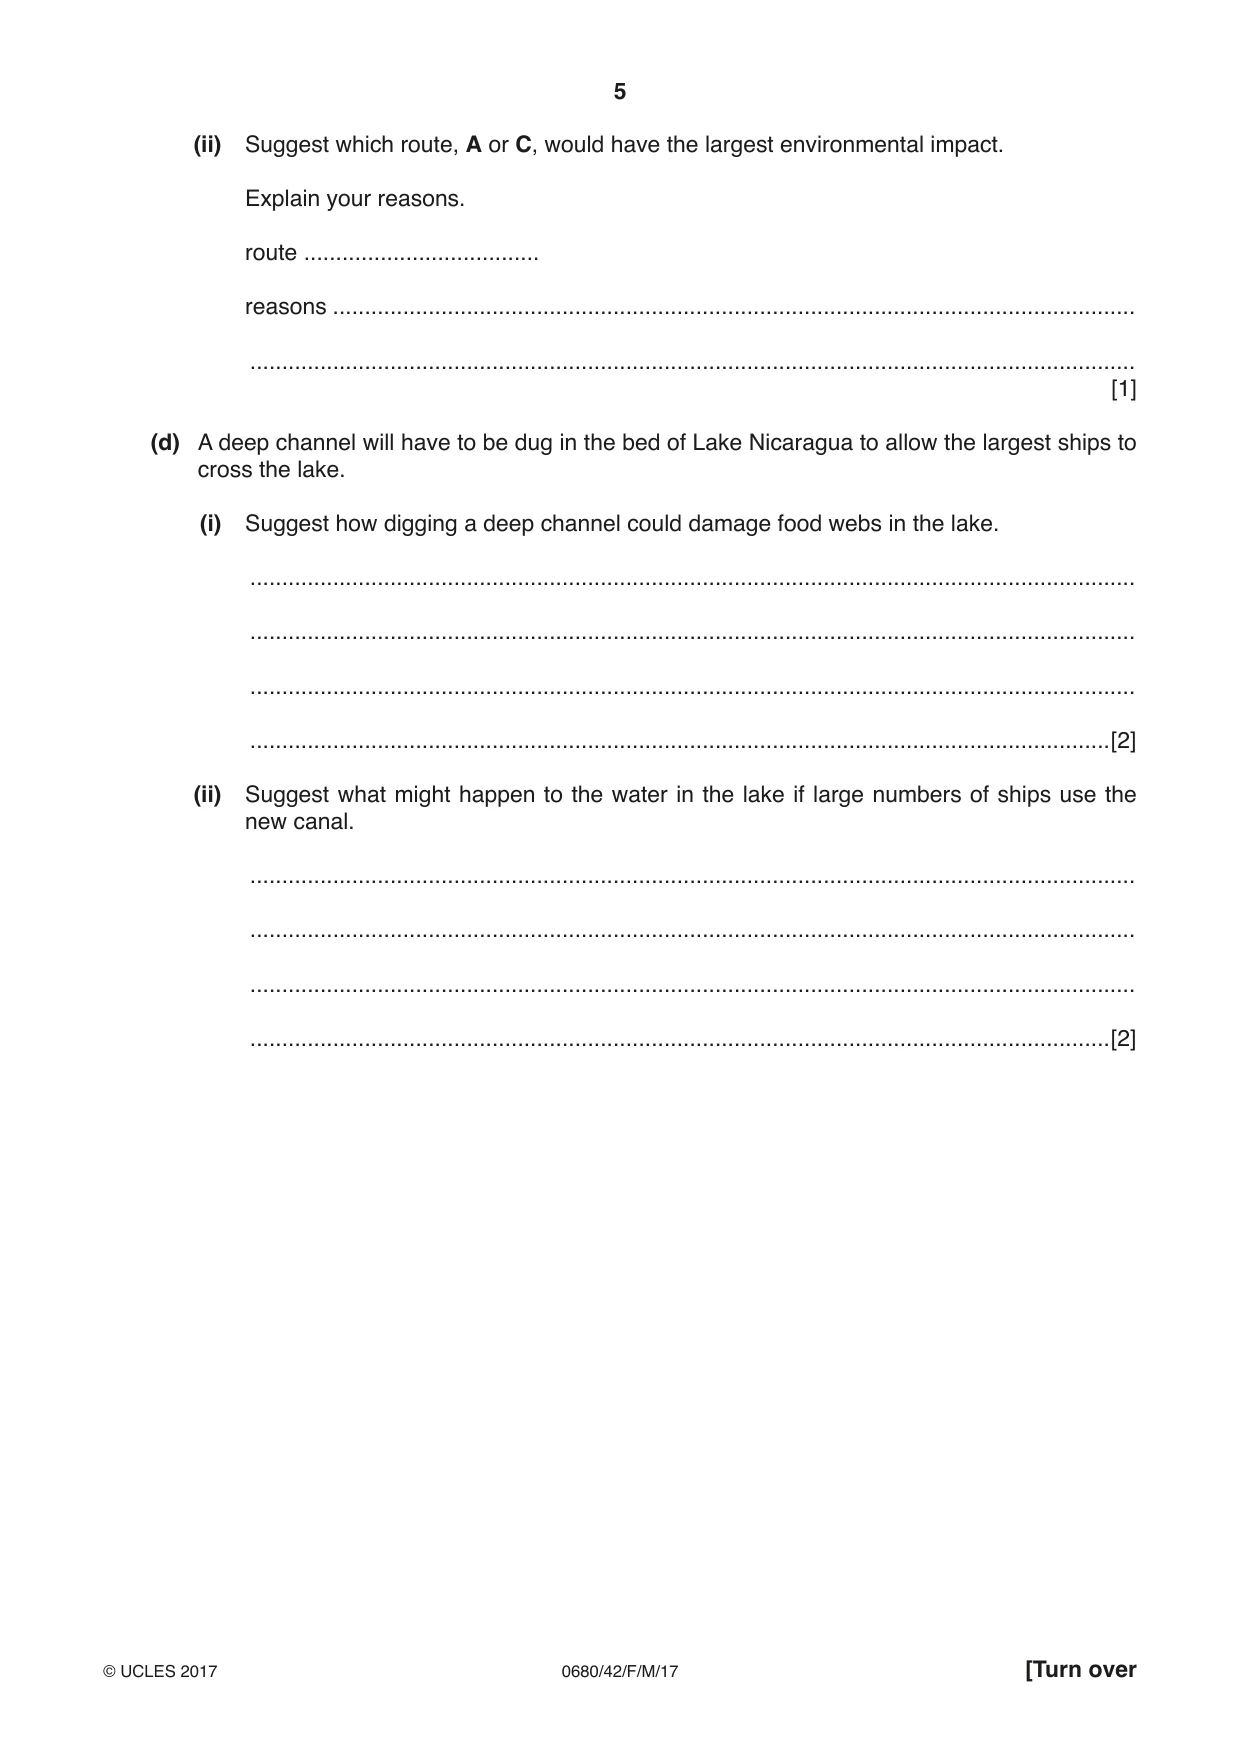
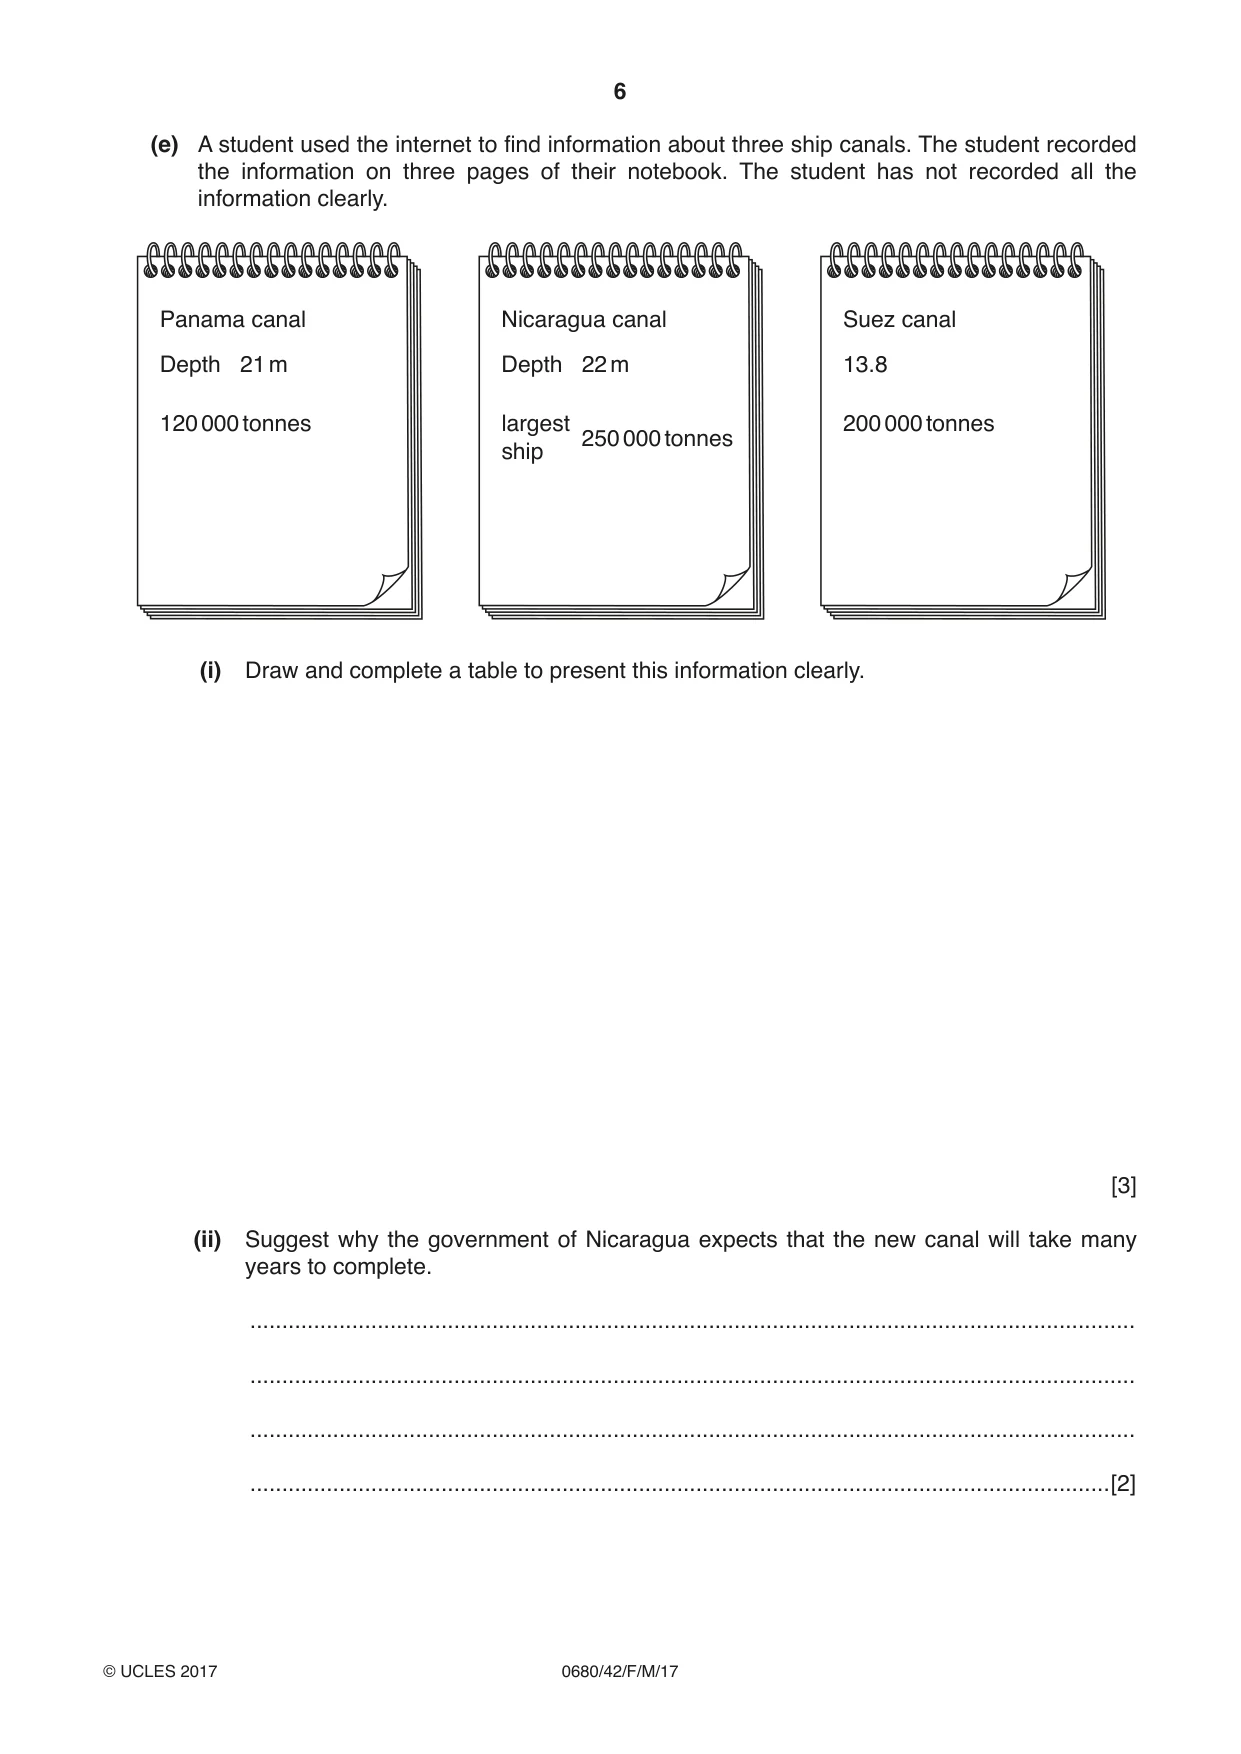
1 Nicaragua has the lowest population density of any Central American country. Tourism and agriculture are important to the economy. However, poverty remains widespread. The government plans to build a ship canal between the Pacific Ocean and the Caribbean Sea. It is expected to take many years to complete. (a) Use the information given to calculate the population density of Nicaragua. Show your working. .................................. people per km2 [2] (b) (i) Suggest why poverty remains widespread in Nicaragua. ........................................................................................................................................... ........................................................................................................................................... ........................................................................................................................................... .......................................................................................................................................[2] (ii) Suggest two reasons why the government wants the ship canal to be built. ........................................................................................................................................... ........................................................................................................................................... ........................................................................................................................................... .......................................................................................................................................[2] (c) Several different routes for the ship canal have been proposed. The map shows possible routes for the canal. Route B is the shortest. N A B Caribbean Sea C Pacific Ocean 0 50 100 km Key wetlands route A biosphere resource route B international boundary route C nature reserve Lake Nicaragua (i) Use the map to measure the distance of route A and route C, starting at the Pacific Ocean and ending in the Caribbean Sea. route A ..................................... km route C ..................................... km [2] (ii) Suggest which route, A or C, would have the largest environmental impact. Explain your reasons. route ..................................... reasons .............................................................................................................................. ........................................................................................................................................... [1] (d) A deep channel will have to be dug in the bed of Lake Nicaragua to allow the largest ships to cross the lake. (i) Suggest how digging a deep channel could damage food webs in the lake. ........................................................................................................................................... ........................................................................................................................................... ........................................................................................................................................... .......................................................................................................................................[2] (ii) Suggest what might happen to the water in the lake if large numbers of ships use the new canal. ........................................................................................................................................... ........................................................................................................................................... ........................................................................................................................................... .......................................................................................................................................[2] (e) A student used the internet to find information about three ship canals. The student recorded the information on three pages of their notebook. The student has not recorded all the information clearly. Panama canal Nicaragua canal Suez canal Depth 21 m Depth 22 m 13.8 120 000 tonnes largest 200 000 tonnes 250 000 tonnes ship (i) Draw and complete a table to present this information clearly. [3] (ii) Suggest why the government of Nicaragua expects that the new canal will take many years to complete. ........................................................................................................................................... ........................................................................................................................................... ........................................................................................................................................... .......................................................................................................................................[2]
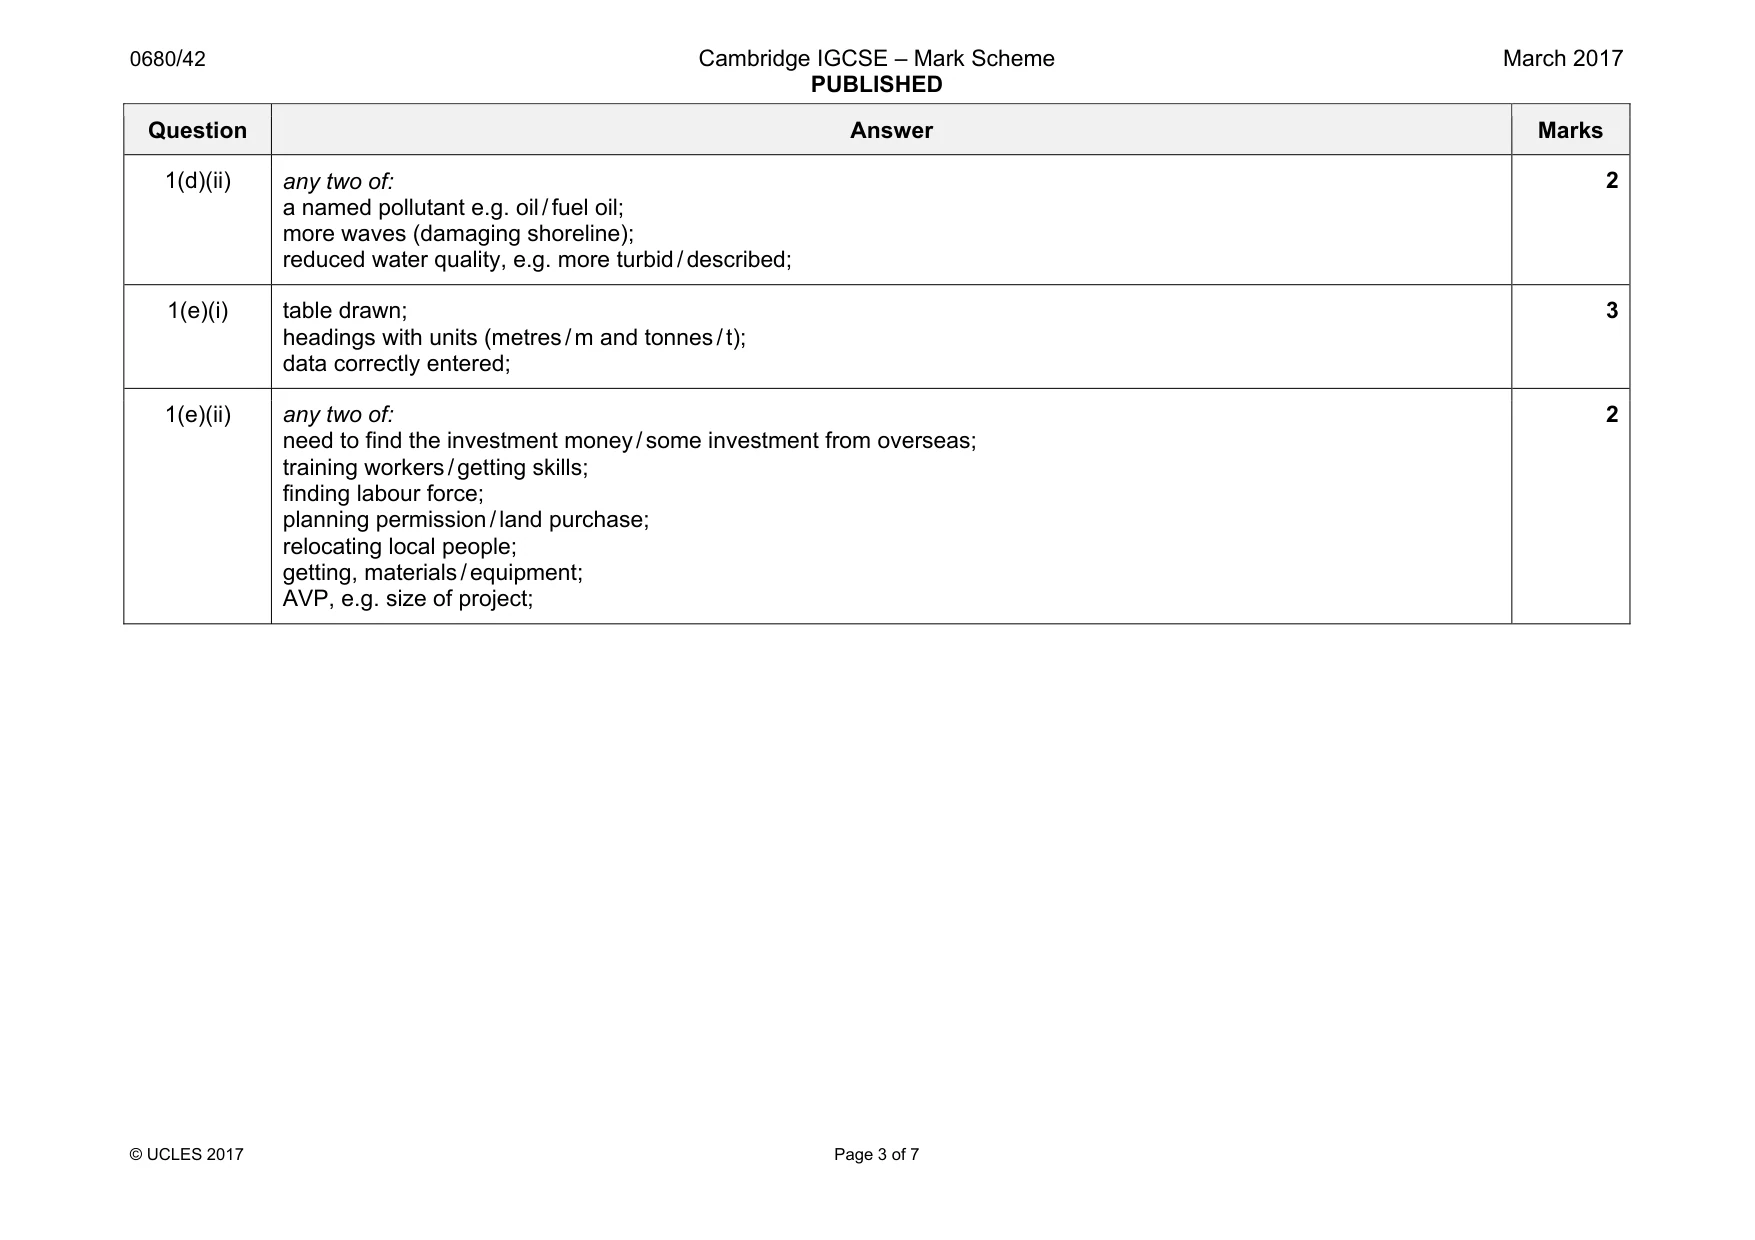
Mark scheme: 1(a) 46 / 46.0 / 46.02 / 46.023 / 46.0228 / 46.0229;; (if answer incorrect, allow one mark for correct method, e.g. 6 million ÷ 130 370 [1]) 2 1(b)(i) any two of: mostly rely on subsistence farming; only, part time / seasonal work in tourism; no industrial jobs; no highly paid jobs; high unemployment / eq; lack of health care / presence for serious disease; lack of land to grow food; AVP, e.g. rely only on tourism and farming; 2 1(b)(ii) any two of: to earn money from canal charges; to attract investment; create jobs in, construction / canal management; improve the economy (of the country) / more, imports / exports / trade; AVP; 2 1(c)(i) A 274; C 274; (allow answer within the range of 260–290 for each measurement) 2 1(c)(ii) (route) A and (reasons) destruction of wetlands; or (route) C and (reasons) destruction of biosphere resource; 1 1(d)(i) any two of: (more) sediment reduces photosynthesis; kills, plants / producers; reduced biodiversity / so some species, reduced / die out; food chains altered / described; 2 Question Answer Marks 1(d)(ii) any two of: a named pollutant e.g. oil / fuel oil; more waves (damaging shoreline); reduced water quality, e.g. more turbid / described; 2 1(e)(i) table drawn; headings with units (metres / m and tonnes / t); data correctly entered; 3 1(e)(ii) any two of: need to find the investment money / some investment from overseas; training workers / getting skills; finding labour force; planning permission / land purchase; relocating local people; getting, materials / equipment; AVP, e.g. size of project; 2
Q2 · In 2014, Nicaragua suffered its worst drought for 30 years
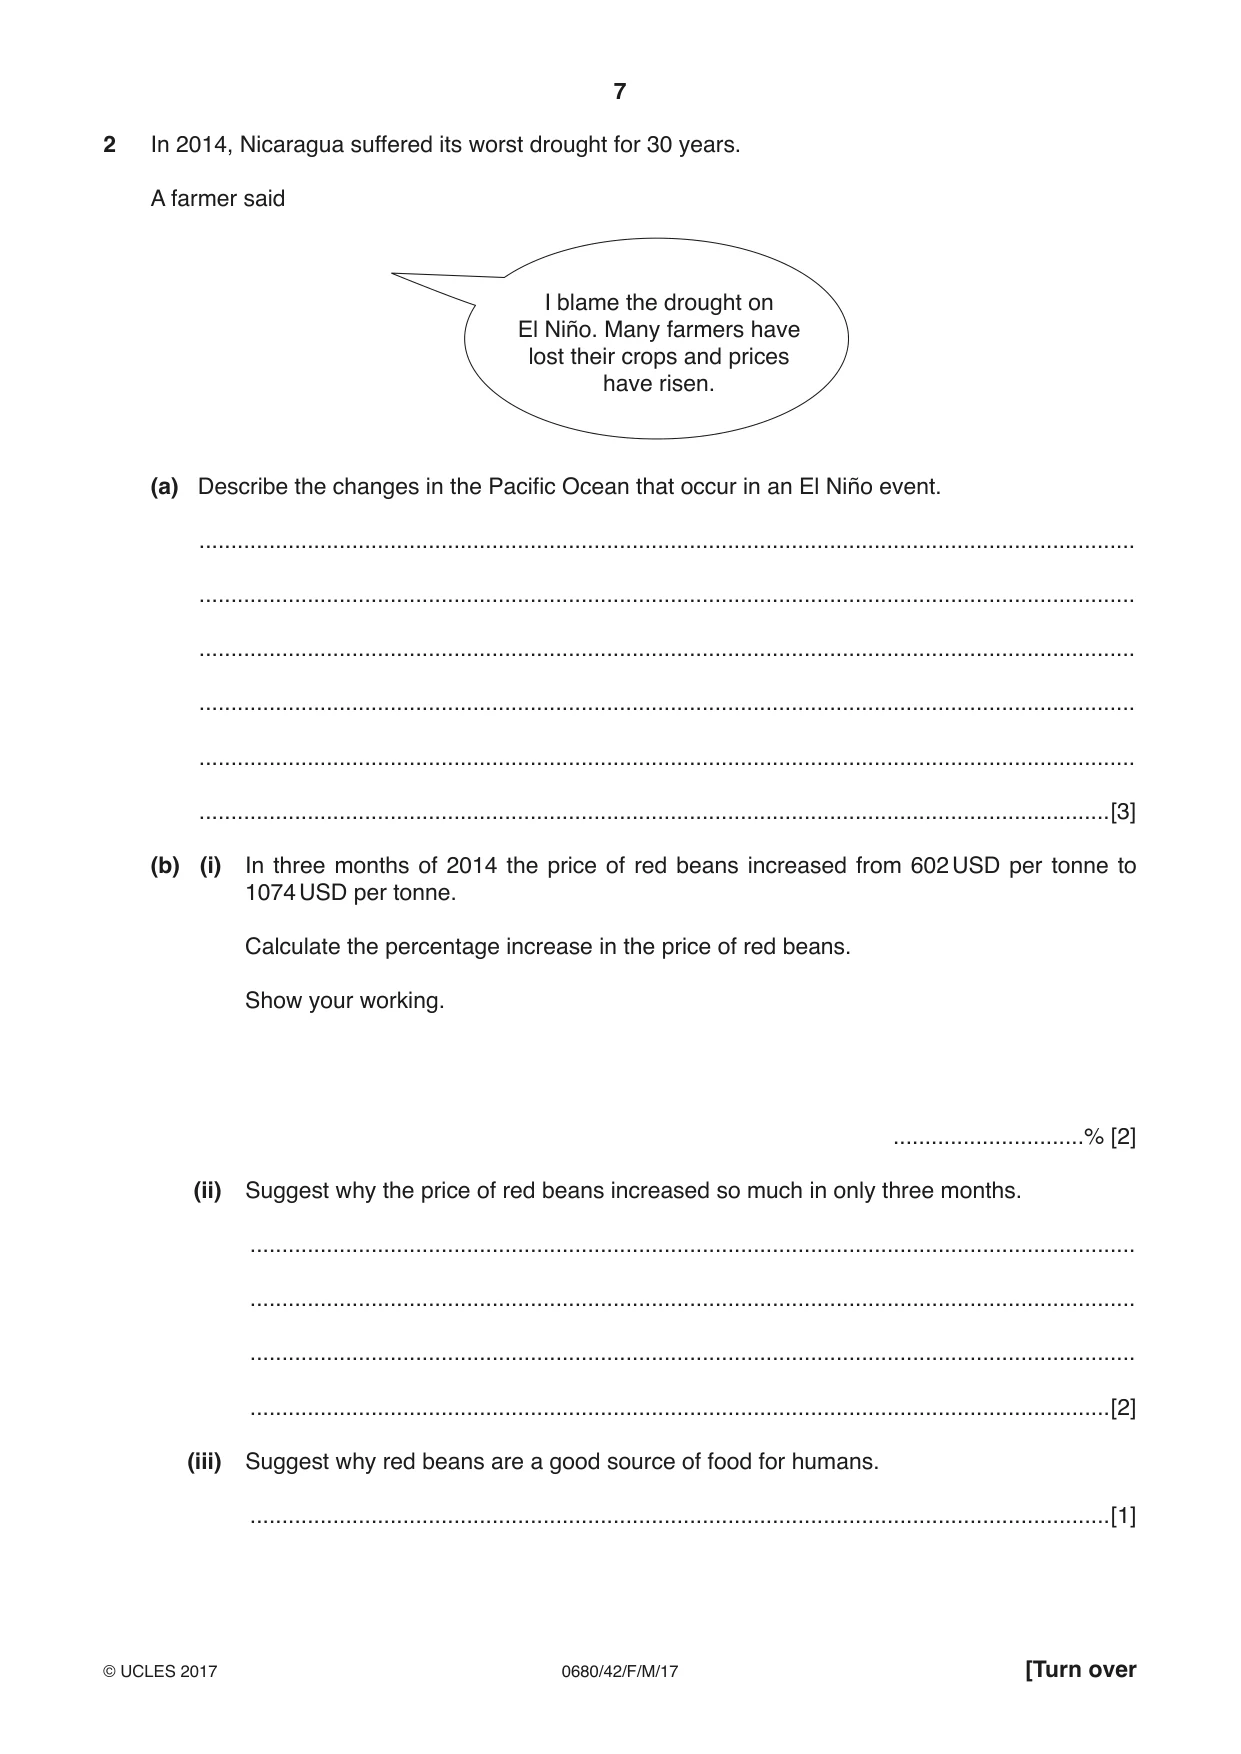
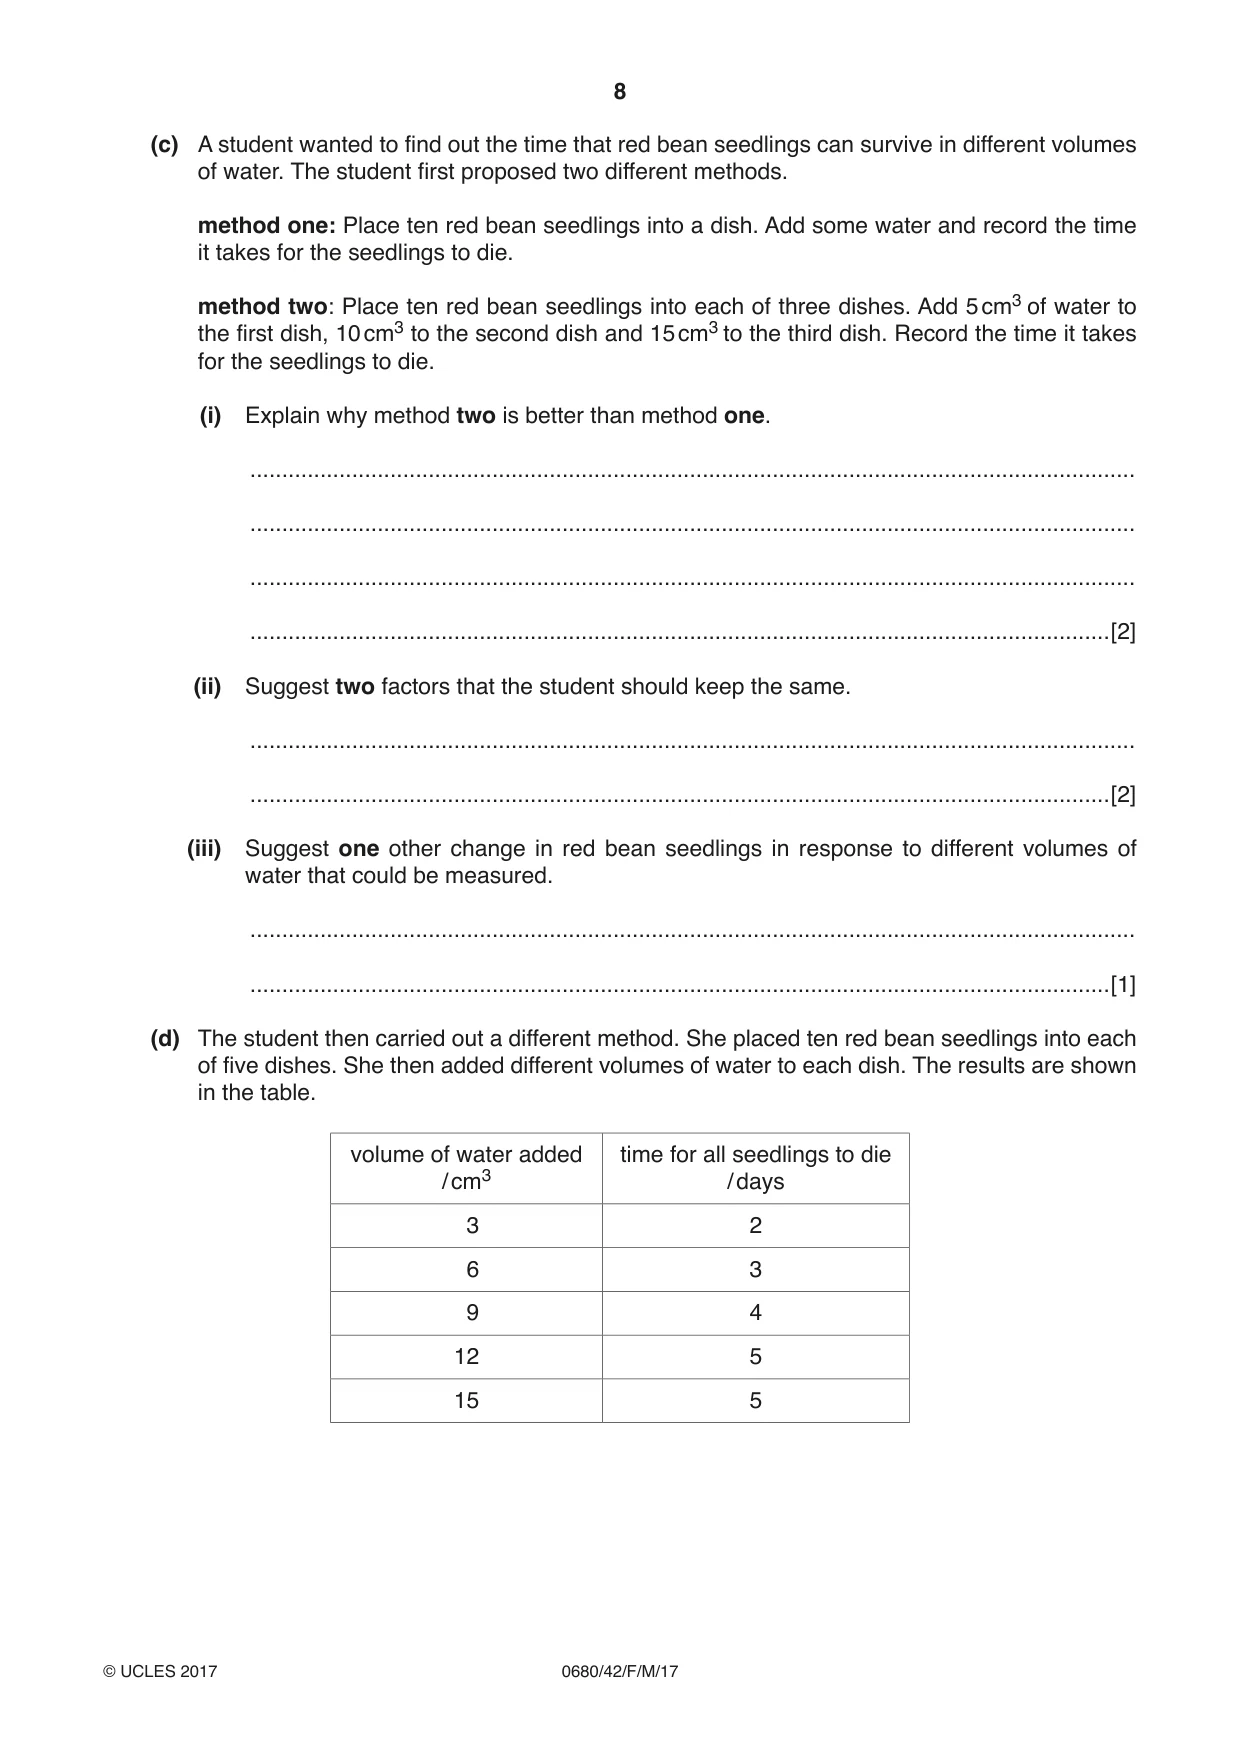
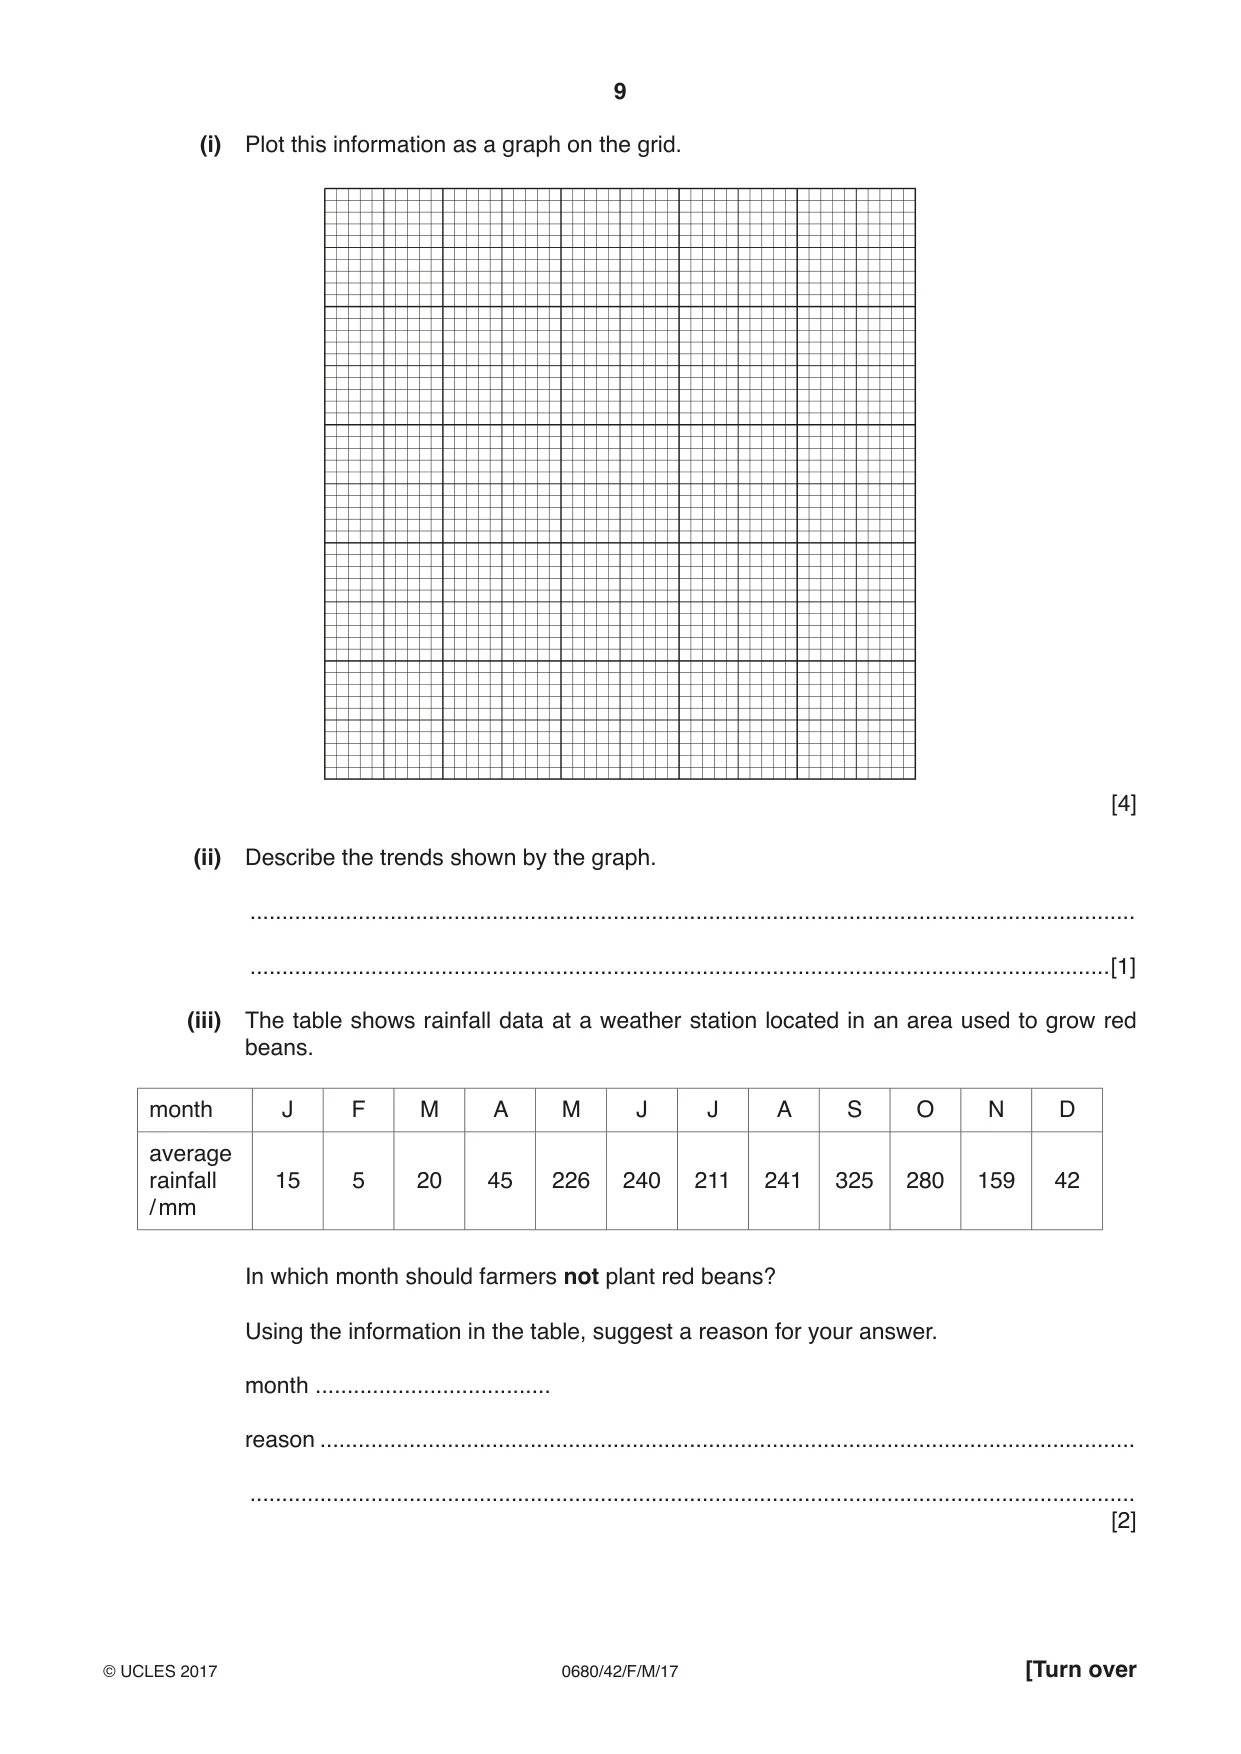
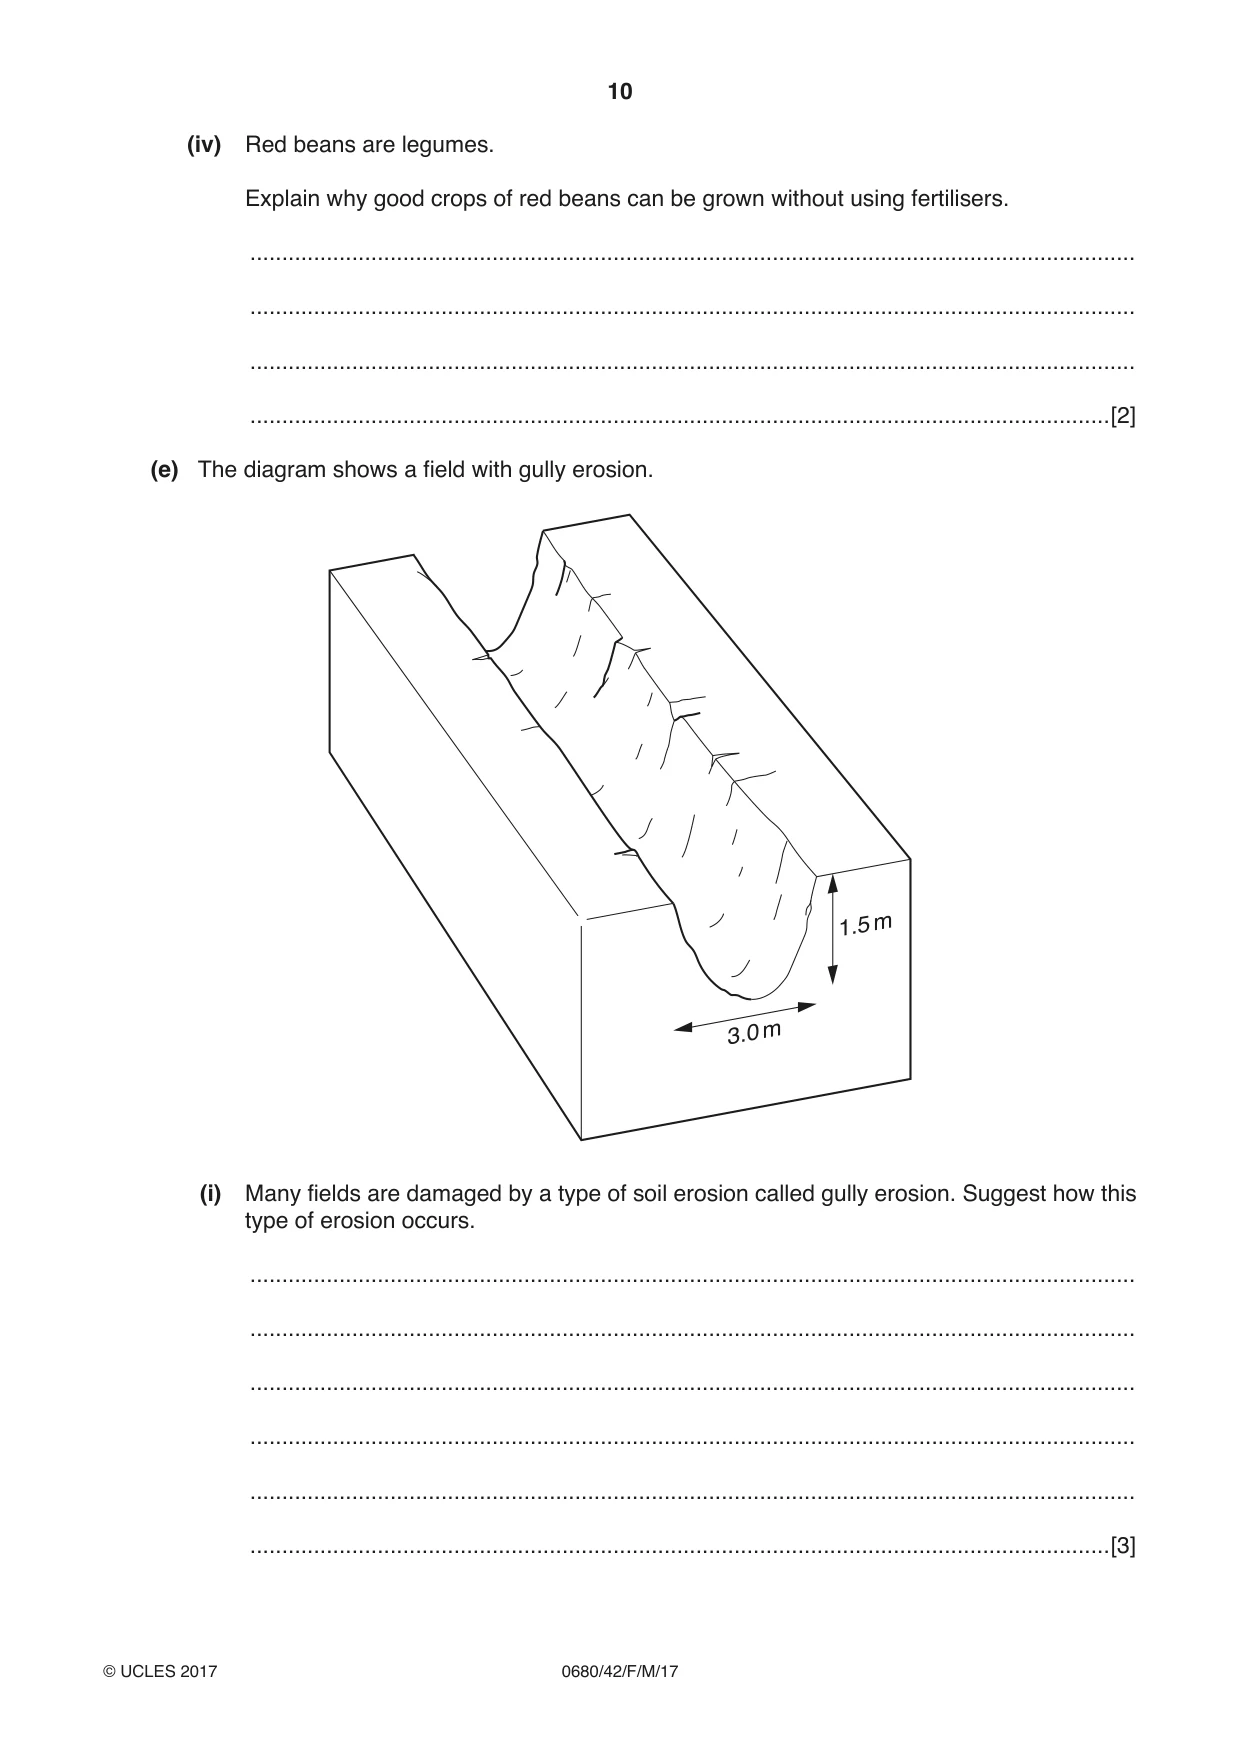
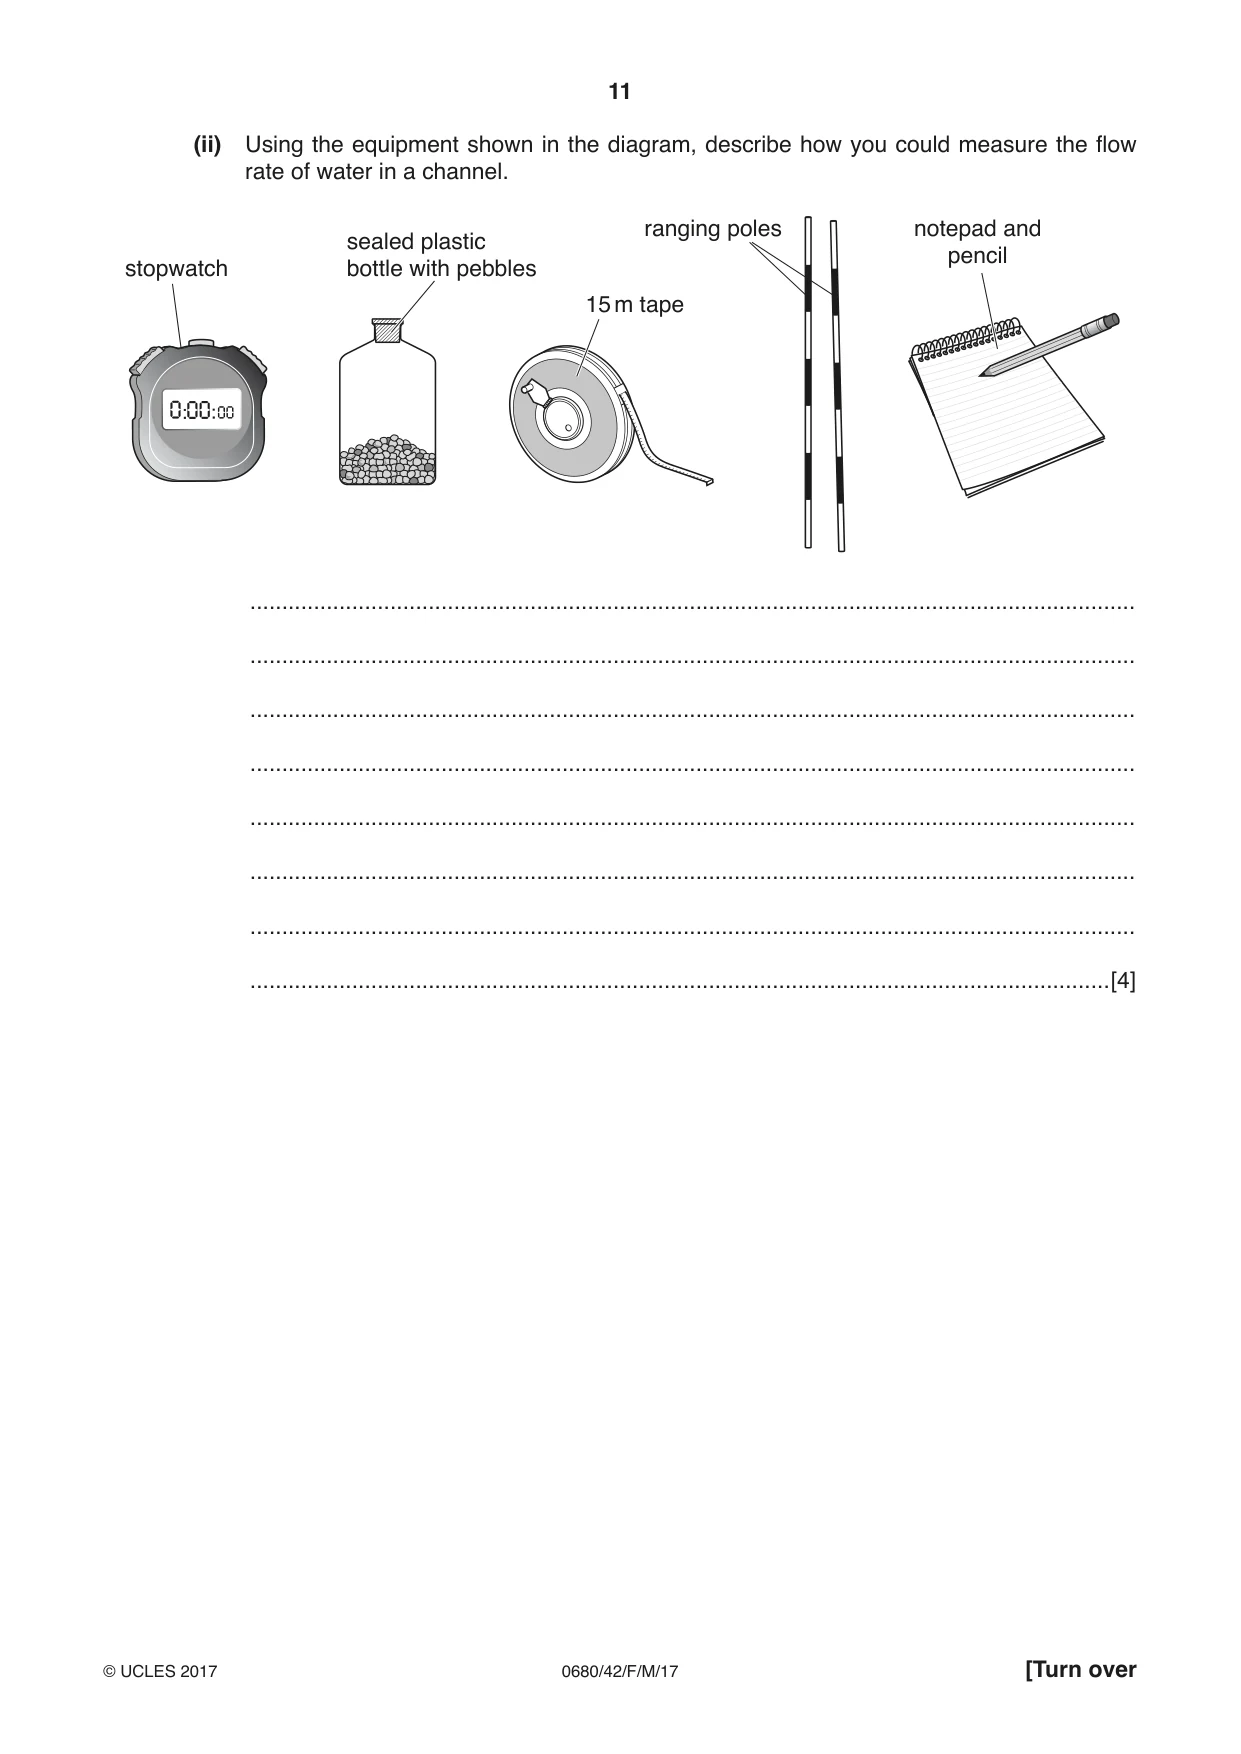
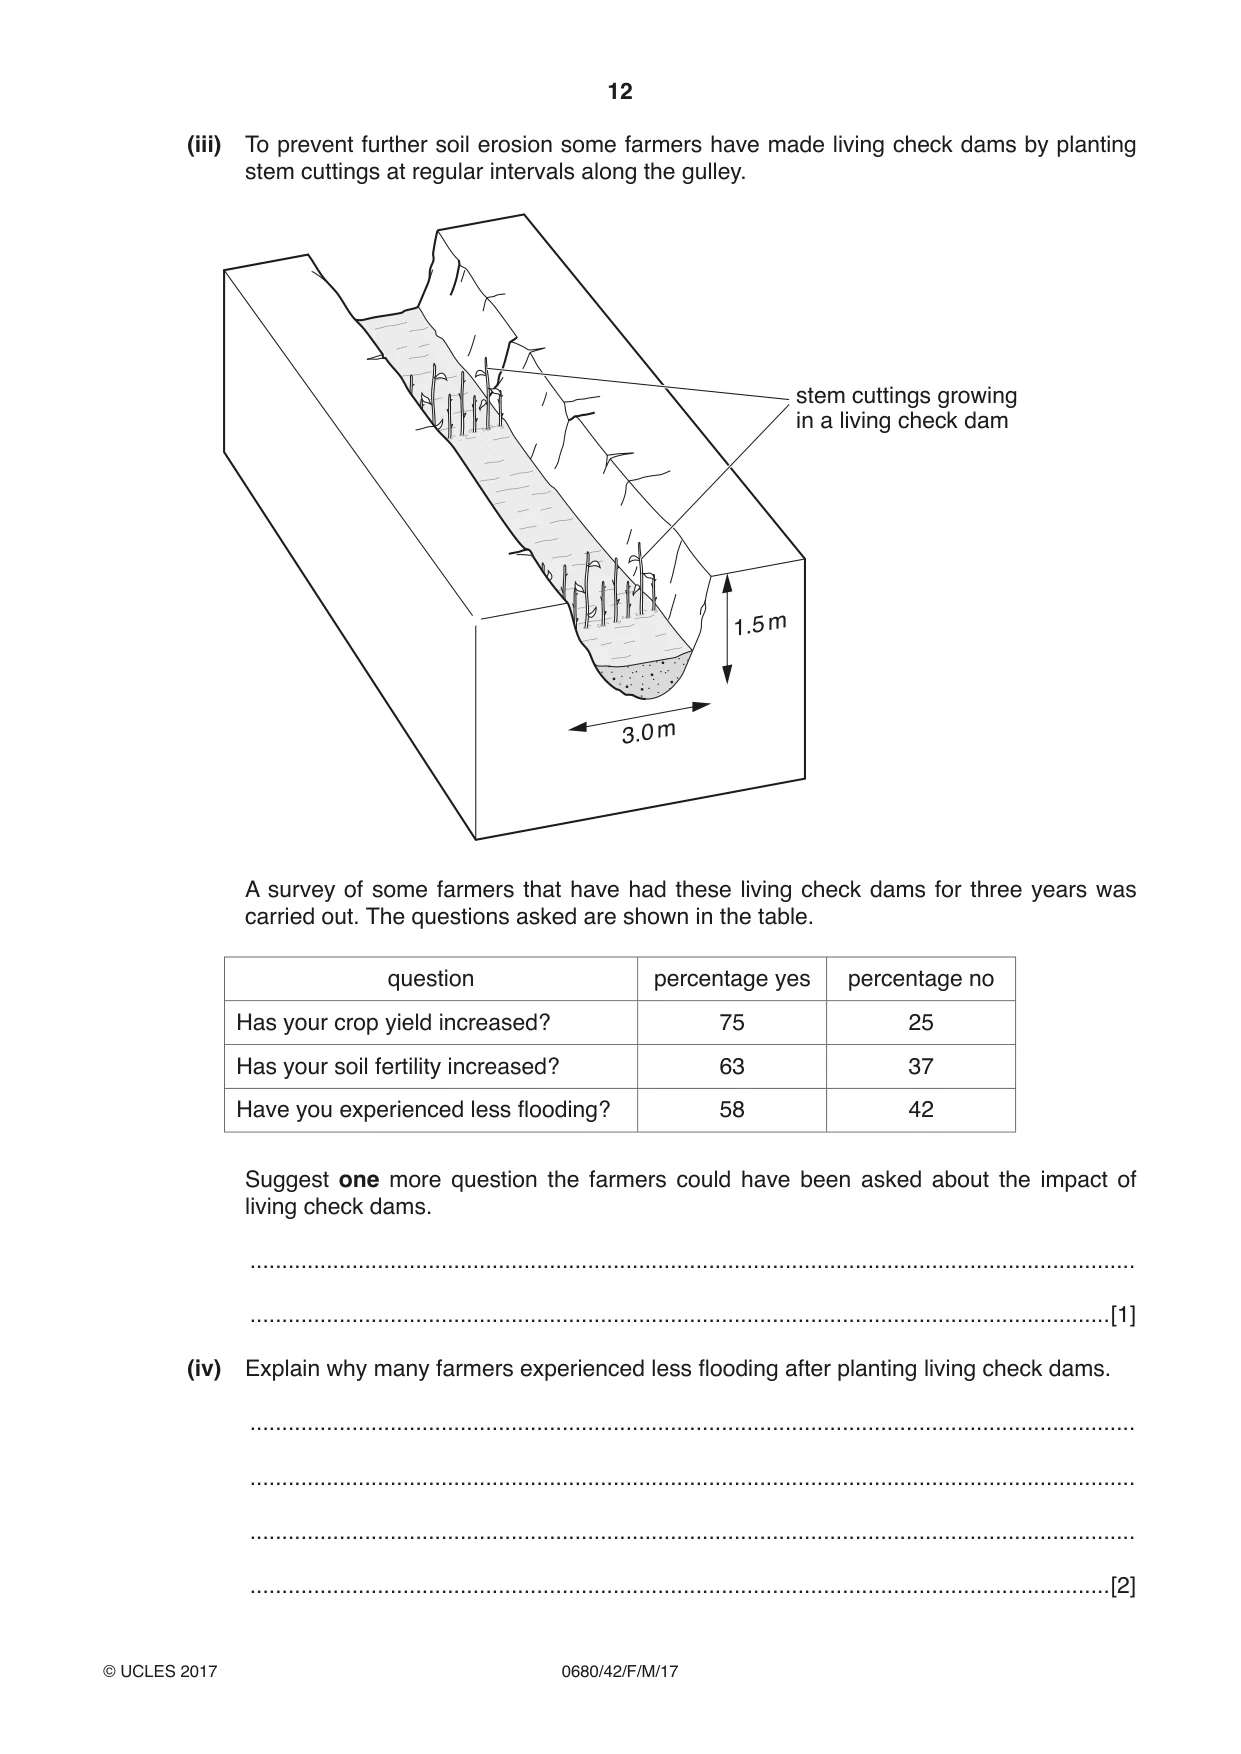
2 In 2014, Nicaragua suffered its worst drought for 30 years. A farmer said I blame the drought on El Niño. Many farmers have lost their crops and prices have risen. (a) Describe the changes in the Pacific Ocean that occur in an El Niño event. ................................................................................................................................................... ................................................................................................................................................... ................................................................................................................................................... ................................................................................................................................................... ................................................................................................................................................... ...............................................................................................................................................[3] (b) (i) In three months of 2014 the price of red beans increased from 602 USD per tonne to 1074 USD per tonne. Calculate the percentage increase in the price of red beans. Show your working. ..............................% [2] (ii) Suggest why the price of red beans increased so much in only three months. ........................................................................................................................................... ........................................................................................................................................... ........................................................................................................................................... .......................................................................................................................................[2] (iii) Suggest why red beans are a good source of food for humans. .......................................................................................................................................[1] (c) A student wanted to find out the time that red bean seedlings can survive in different volumes of water. The student first proposed two different methods. method one: Place ten red bean seedlings into a dish. Add some water and record the time it takes for the seedlings to die. method two: Place ten red bean seedlings into each of three dishes. Add 5 cm3 of water to the first dish, 10 cm3 to the second dish and 15 cm3 to the third dish. Record the time it takes for the seedlings to die. (i) Explain why method two is better than method one. ........................................................................................................................................... ........................................................................................................................................... ........................................................................................................................................... .......................................................................................................................................[2] (ii) Suggest two factors that the student should keep the same. ........................................................................................................................................... .......................................................................................................................................[2] (iii) Suggest one other change in red bean seedlings in response to different volumes of water that could be measured. ........................................................................................................................................... .......................................................................................................................................[1] (d) The student then carried out a different method. She placed ten red bean seedlings into each of five dishes. She then added different volumes of water to each dish. The results are shown in the table. volume of water added time for all seedlings to die / cm3 / days 3 2 6 3 9 4 12 5 15 5 (i) Plot this information as a graph on the grid. [4] (ii) Describe the trends shown by the graph. ........................................................................................................................................... .......................................................................................................................................[1] (iii) The table shows rainfall data at a weather station located in an area used to grow red beans. month J F M A M J J A S O N D average rainfall 15 5 20 45 226 240 211 241 325 280 159 42 / mm In which month should farmers not plant red beans? Using the information in the table, suggest a reason for your answer. month ..................................... reason ................................................................................................................................ ........................................................................................................................................... [2] (iv) Red beans are legumes. Explain why good crops of red beans can be grown without using fertilisers. ........................................................................................................................................... ........................................................................................................................................... ........................................................................................................................................... .......................................................................................................................................[2] (e) The diagram shows a field with gully erosion. 1.5 m 3.0 m (i) Many fields are damaged by a type of soil erosion called gully erosion. Suggest how this type of erosion occurs. ........................................................................................................................................... ........................................................................................................................................... ........................................................................................................................................... ........................................................................................................................................... ........................................................................................................................................... .......................................................................................................................................[3] (ii) Using the equipment shown in the diagram, describe how you could measure the flow rate of water in a channel. ranging poles notepad and sealed plastic pencilstopwatch bottle with pebbles 15 m tape ........................................................................................................................................... ........................................................................................................................................... ........................................................................................................................................... ........................................................................................................................................... ........................................................................................................................................... ........................................................................................................................................... ........................................................................................................................................... .......................................................................................................................................[4] (iii) To prevent further soil erosion some farmers have made living check dams by planting stem cuttings at regular intervals along the gulley. stem cuttings growing in a living check dam 1.5 m 3.0 m A survey of some farmers that have had these living check dams for three years was carried out. The questions asked are shown in the table. question percentage yes percentage no Has your crop yield increased? 75 25 Has your soil fertility increased? 63 37 Have you experienced less flooding? 58 42 Suggest one more question the farmers could have been asked about the impact of living check dams. ........................................................................................................................................... .......................................................................................................................................[1] (iv) Explain why many farmers experienced less flooding after planting living check dams. ........................................................................................................................................... ........................................................................................................................................... ........................................................................................................................................... .......................................................................................................................................[2]
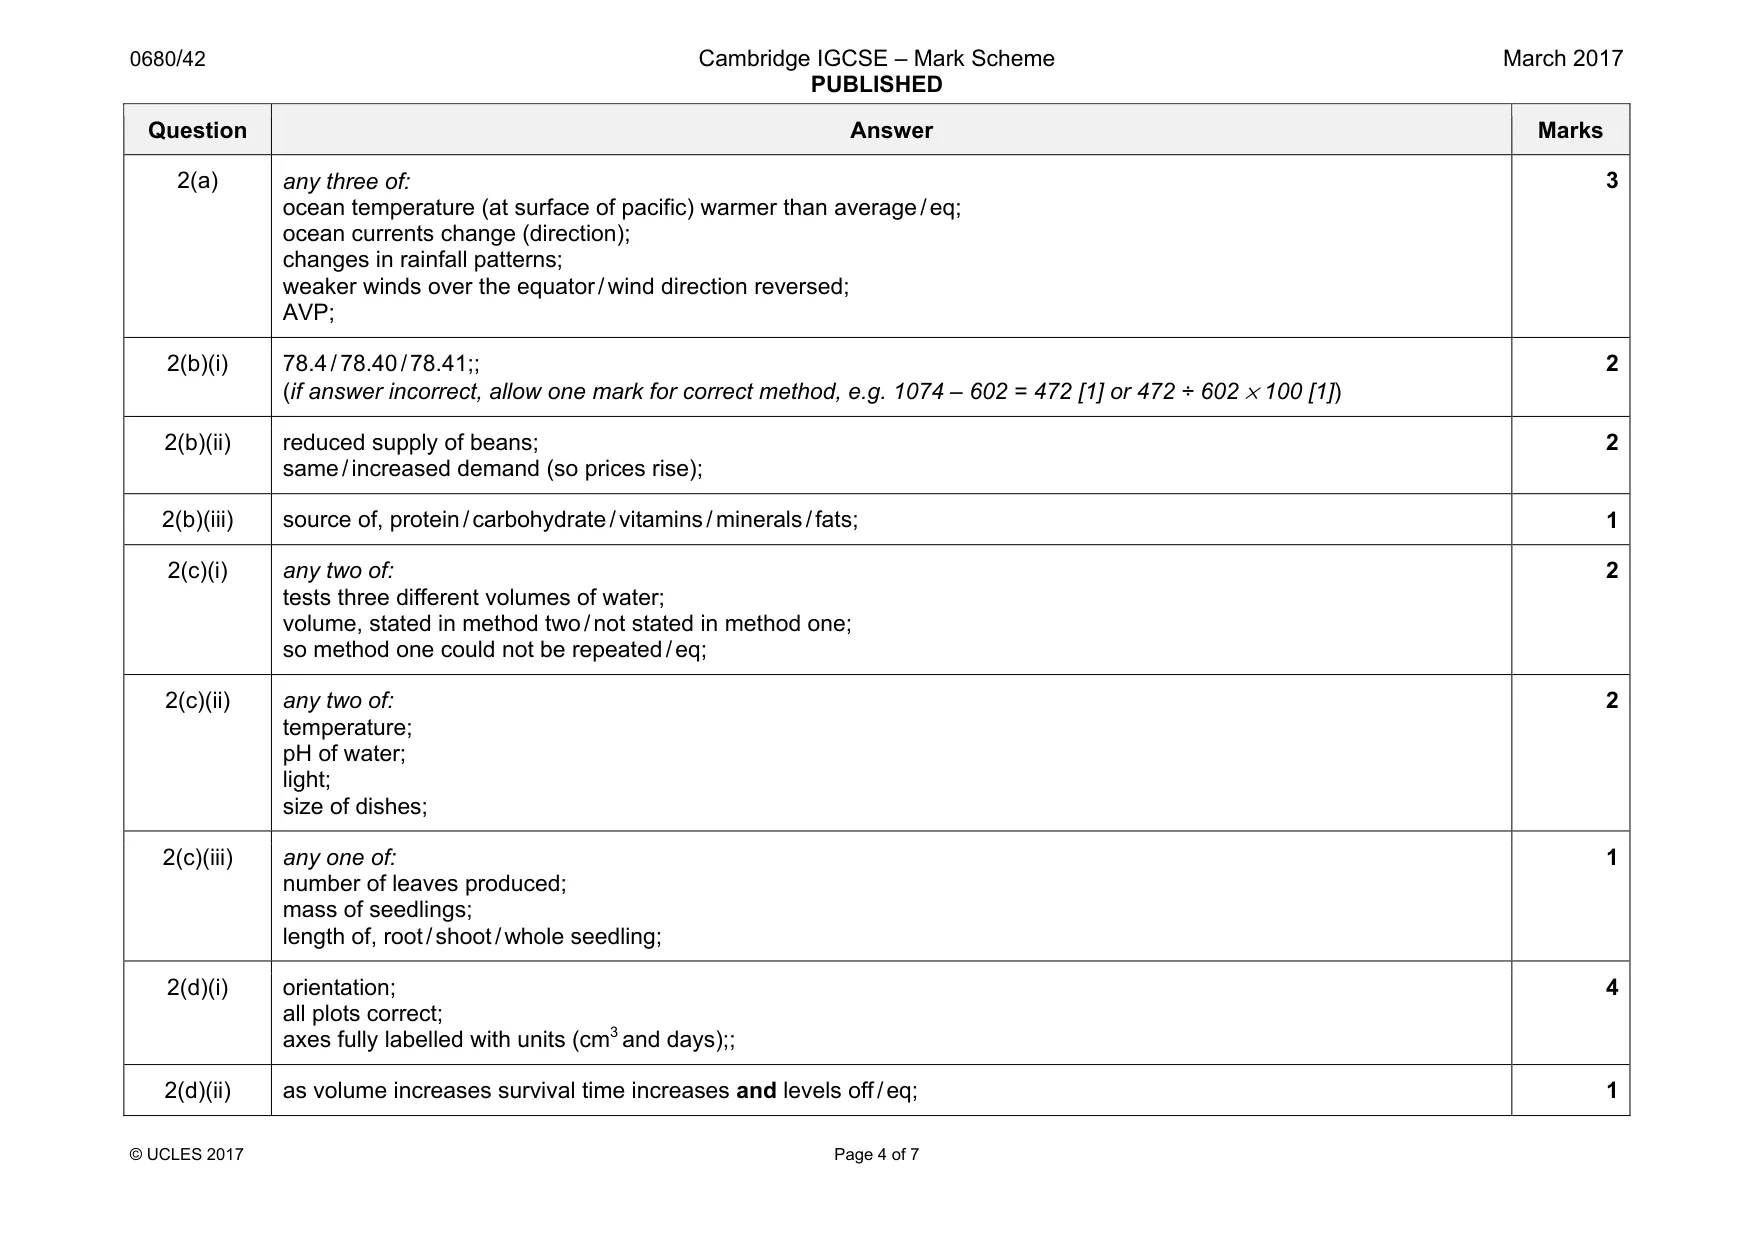
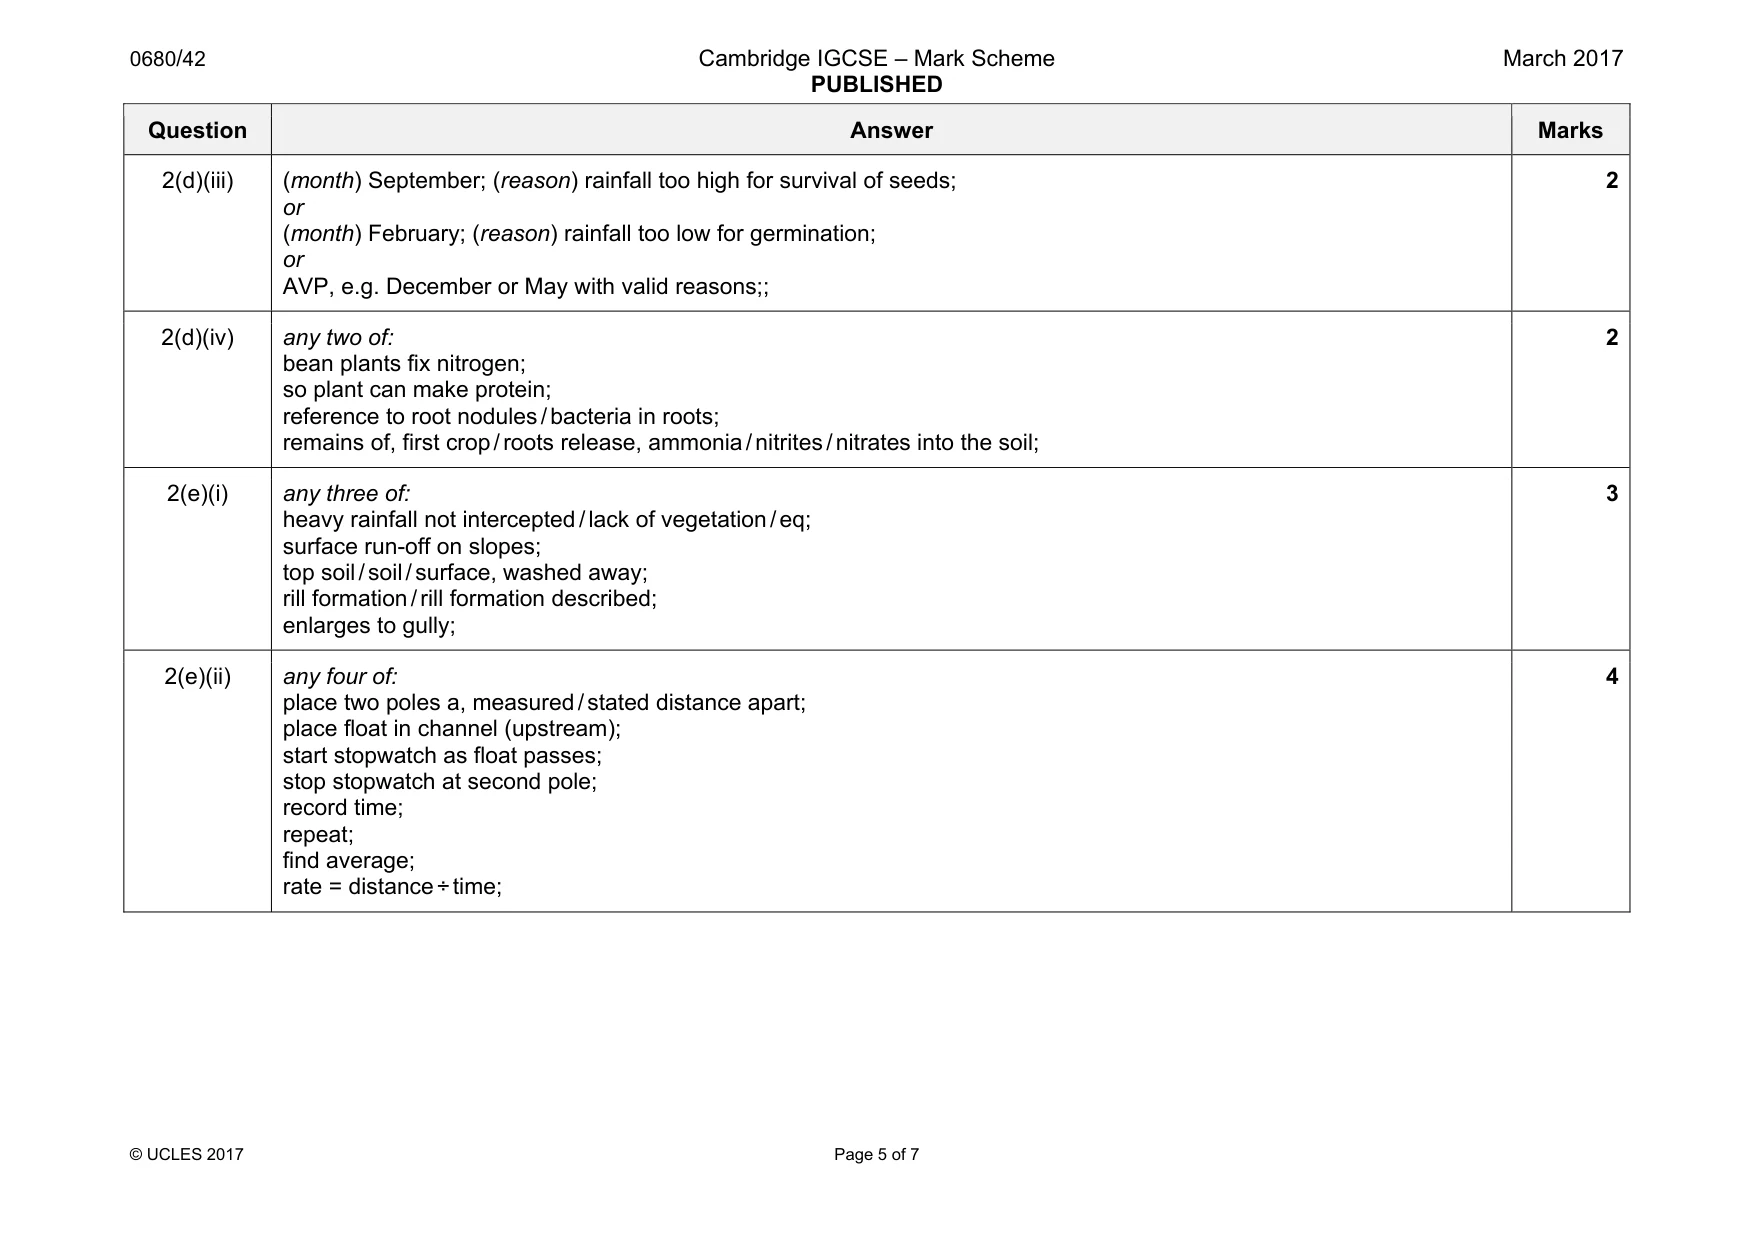
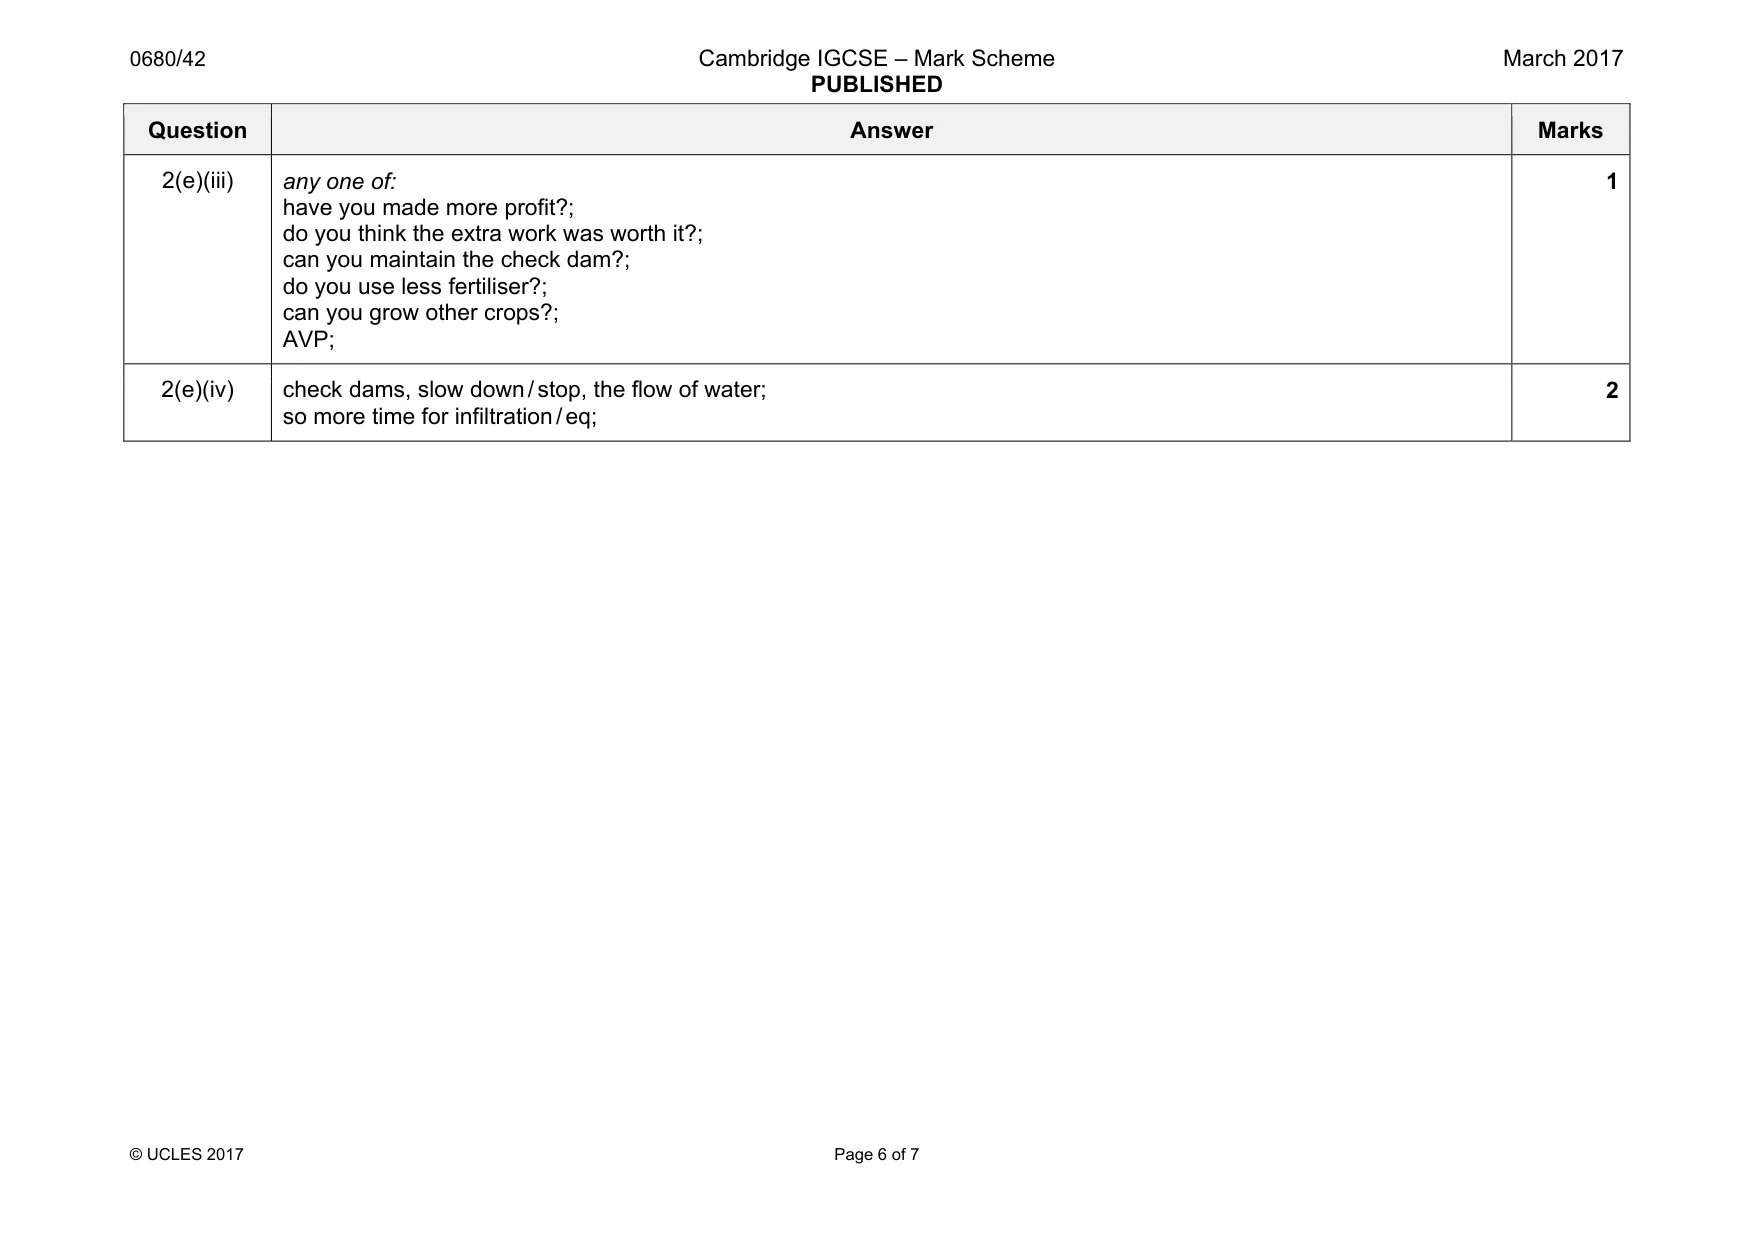
Mark scheme: 2(a) any three of: ocean temperature (at surface of pacific) warmer than average / eq; ocean currents change (direction); changes in rainfall patterns; weaker winds over the equator / wind direction reversed; AVP; 3 2(b)(i) 78.4 / 78.40 / 78.41;; (if answer incorrect, allow one mark for correct method, e.g. 1074 – 602 = 472 [1] or 472 ÷ 602 × 100 [1]) 2 2(b)(ii) reduced supply of beans; same / increased demand (so prices rise); 2 2(b)(iii) source of, protein / carbohydrate / vitamins / minerals / fats; 1 2(c)(i) any two of: tests three different volumes of water; volume, stated in method two / not stated in method one; so method one could not be repeated / eq; 2 2(c)(ii) any two of: temperature; pH of water; light; size of dishes; 2 2(c)(iii) any one of: number of leaves produced; mass of seedlings; length of, root / shoot / whole seedling; 1 2(d)(i) orientation; all plots correct; axes fully labelled with units (cm3 and days);; 4 2(d)(ii) as volume increases survival time increases and levels off / eq; 1 Question Answer Marks 2(d)(iii) (month) September; (reason) rainfall too high for survival of seeds; or (month) February; (reason) rainfall too low for germination; or AVP, e.g. December or May with valid reasons;; 2 2(d)(iv) any two of: bean plants fix nitrogen; so plant can make protein; reference to root nodules / bacteria in roots; remains of, first crop / roots release, ammonia / nitrites / nitrates into the soil; 2 2(e)(i) any three of: heavy rainfall not intercepted / lack of vegetation / eq; surface run-off on slopes; top soil / soil / surface, washed away; rill formation / rill formation described; enlarges to gully; 3 2(e)(ii) any four of: place two poles a, measured / stated distance apart; place float in channel (upstream); start stopwatch as float passes; stop stopwatch at second pole; record time; repeat; find average; rate = distance ÷ time; 4 Question Answer Marks 2(e)(iii) any one of: have you made more profit?; do you think the extra work was worth it?; can you maintain the check dam?; do you use less fertiliser?; can you grow other crops?; AVP; 1 2(e)(iv) check dams, slow down / stop, the flow of water; so more time for infiltration / eq; 2
Q3 · There have been shortages of electricity in Nicaragua in recent years
3 (a) There have been shortages of electricity in Nicaragua in recent years. Records of wind speed from weather stations were compared to find locations to build wind turbines. (i) Name an instrument used to measure wind speed. .......................................................................................................................................[1] (ii) The wind speed data for one site in the north of the country is shown in the table. month J F M A M J J A S O N D average wind 17 17 17 15 13 11 13 11 11 11 11 11 speed / km per hr Use this information to complete the table below. wind speed / km per hr highest .............................. lowest .............................. range .............................. [2] (iii) The wind direction for this weather station was recorded for one year and is shown in the diagram. N NW NE wind direction W E SW SE S Suggest how this information confirms that this location is suitable for building wind turbines. ........................................................................................................................................... ........................................................................................................................................... .......................................................................................................................................[2] (b) (i) Suggest two advantages of using wind turbines to generate electricity. ........................................................................................................................................... ........................................................................................................................................... ........................................................................................................................................... .......................................................................................................................................[2] (ii) Explain why the government of Nicaragua wants to make sure there are no shortages of electricity in the future. ........................................................................................................................................... ........................................................................................................................................... ........................................................................................................................................... ........................................................................................................................................... ........................................................................................................................................... .......................................................................................................................................[3]
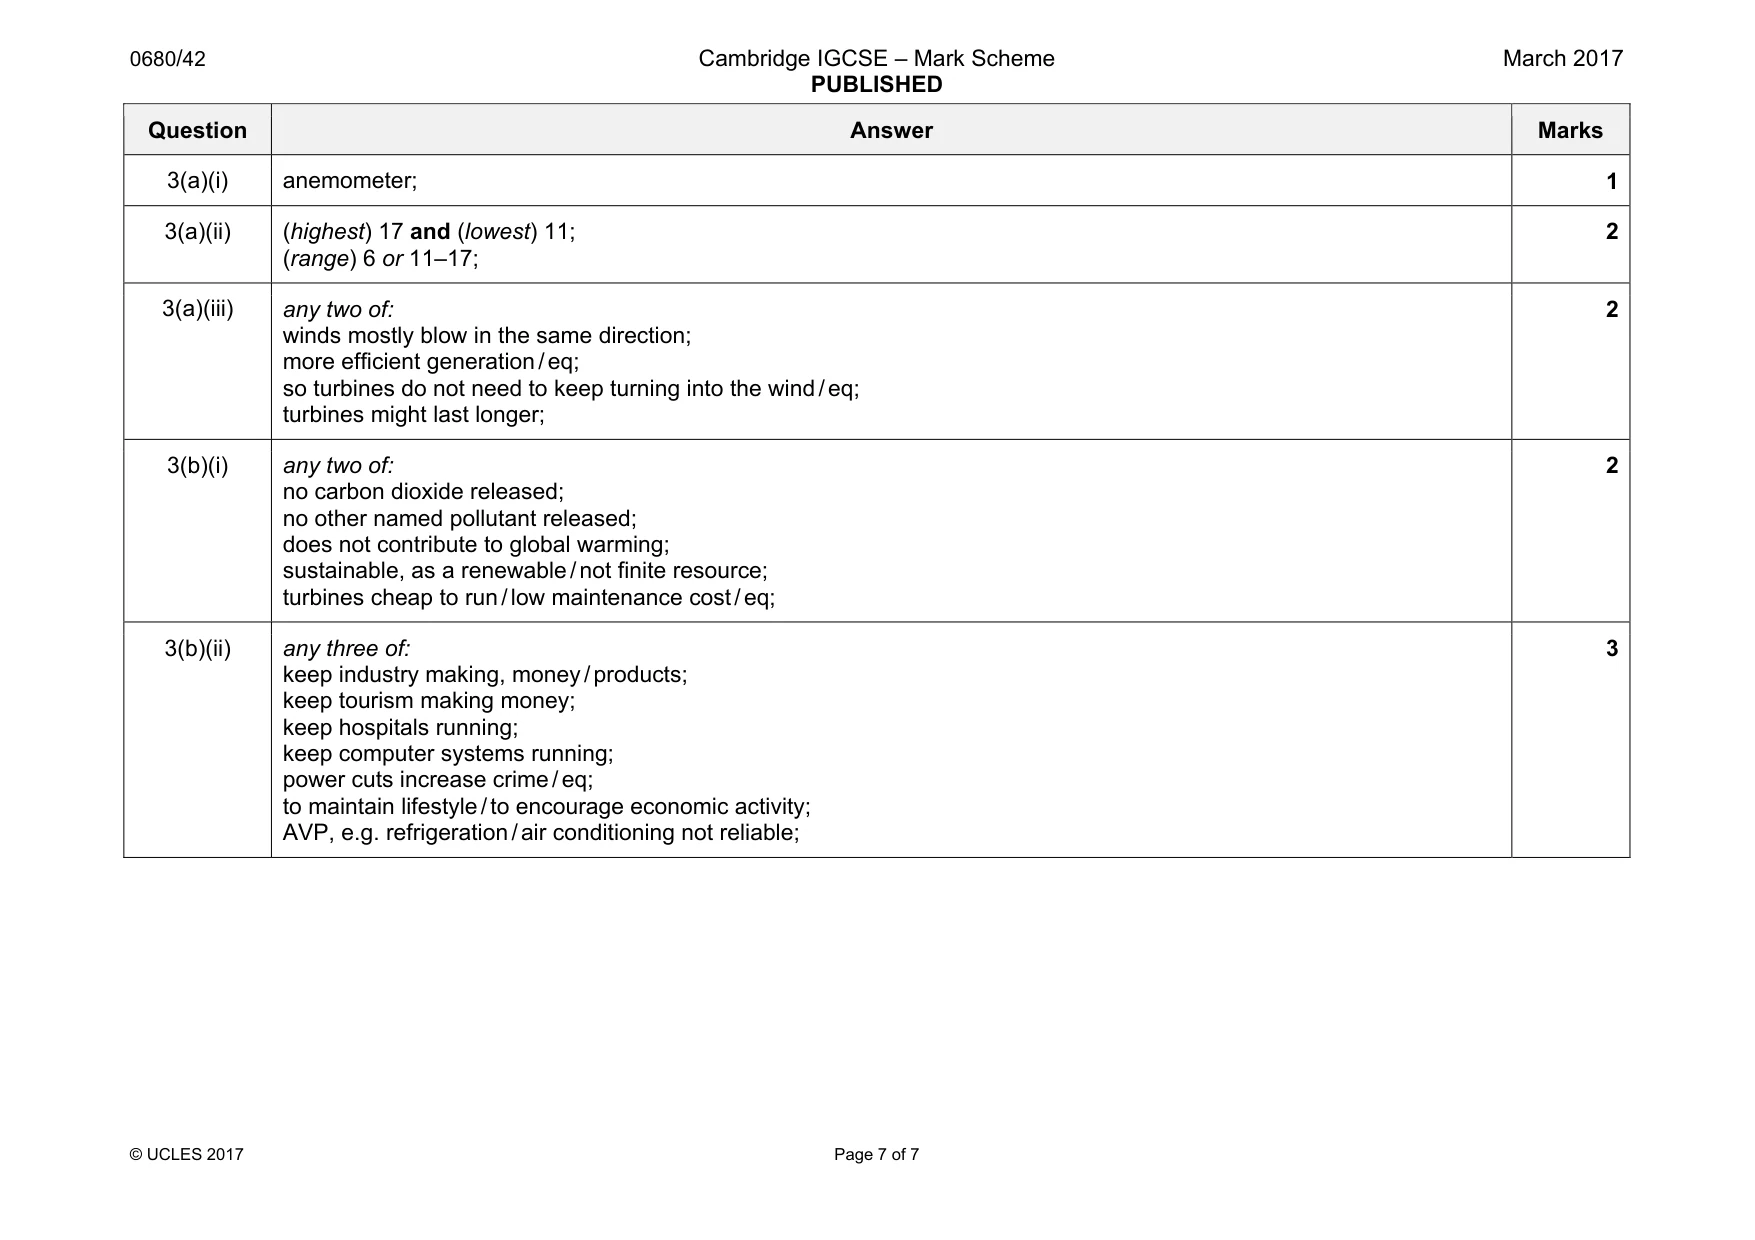
Mark scheme: 3(a)(i) anemometer; 1 3(a)(ii) (highest) 17 and (lowest) 11; (range) 6 or 11–17; 2 3(a)(iii) any two of: winds mostly blow in the same direction; more efficient generation / eq; so turbines do not need to keep turning into the wind / eq; turbines might last longer; 2 3(b)(i) any two of: no carbon dioxide released; no other named pollutant released; does not contribute to global warming; sustainable, as a renewable / not finite resource; turbines cheap to run / low maintenance cost / eq; 2 3(b)(ii) any three of: keep industry making, money / products; keep tourism making money; keep hospitals running; keep computer systems running; power cuts increase crime / eq; to maintain lifestyle / to encourage economic activity; AVP, e.g. refrigeration / air conditioning not reliable; 3
What was in this paper
The subtopics covered by these 3 questions, and how many questions each got. Open one in a new tab to see every Cambridge question on it.
What you needed in this session
Cambridge’s own grade thresholds for 2017 Feb/March, Paper 4 · Variant 2. A higher threshold means an easier paper — the bar moves with how the cohort did.