Cambridge IGCSE Environmental Management 0680 — 2016 Feb/March Paper 4 · Variant 2
0680/42/F/M/16 · 60 marks · ≈68 min
The question paper and its mark scheme, free to read here and free to download. This is Cambridge’s own paper, exactly as it was sat.
Question paper16 pages




Mark scheme6 pages
Answers below. Sit the paper first if you are practising.
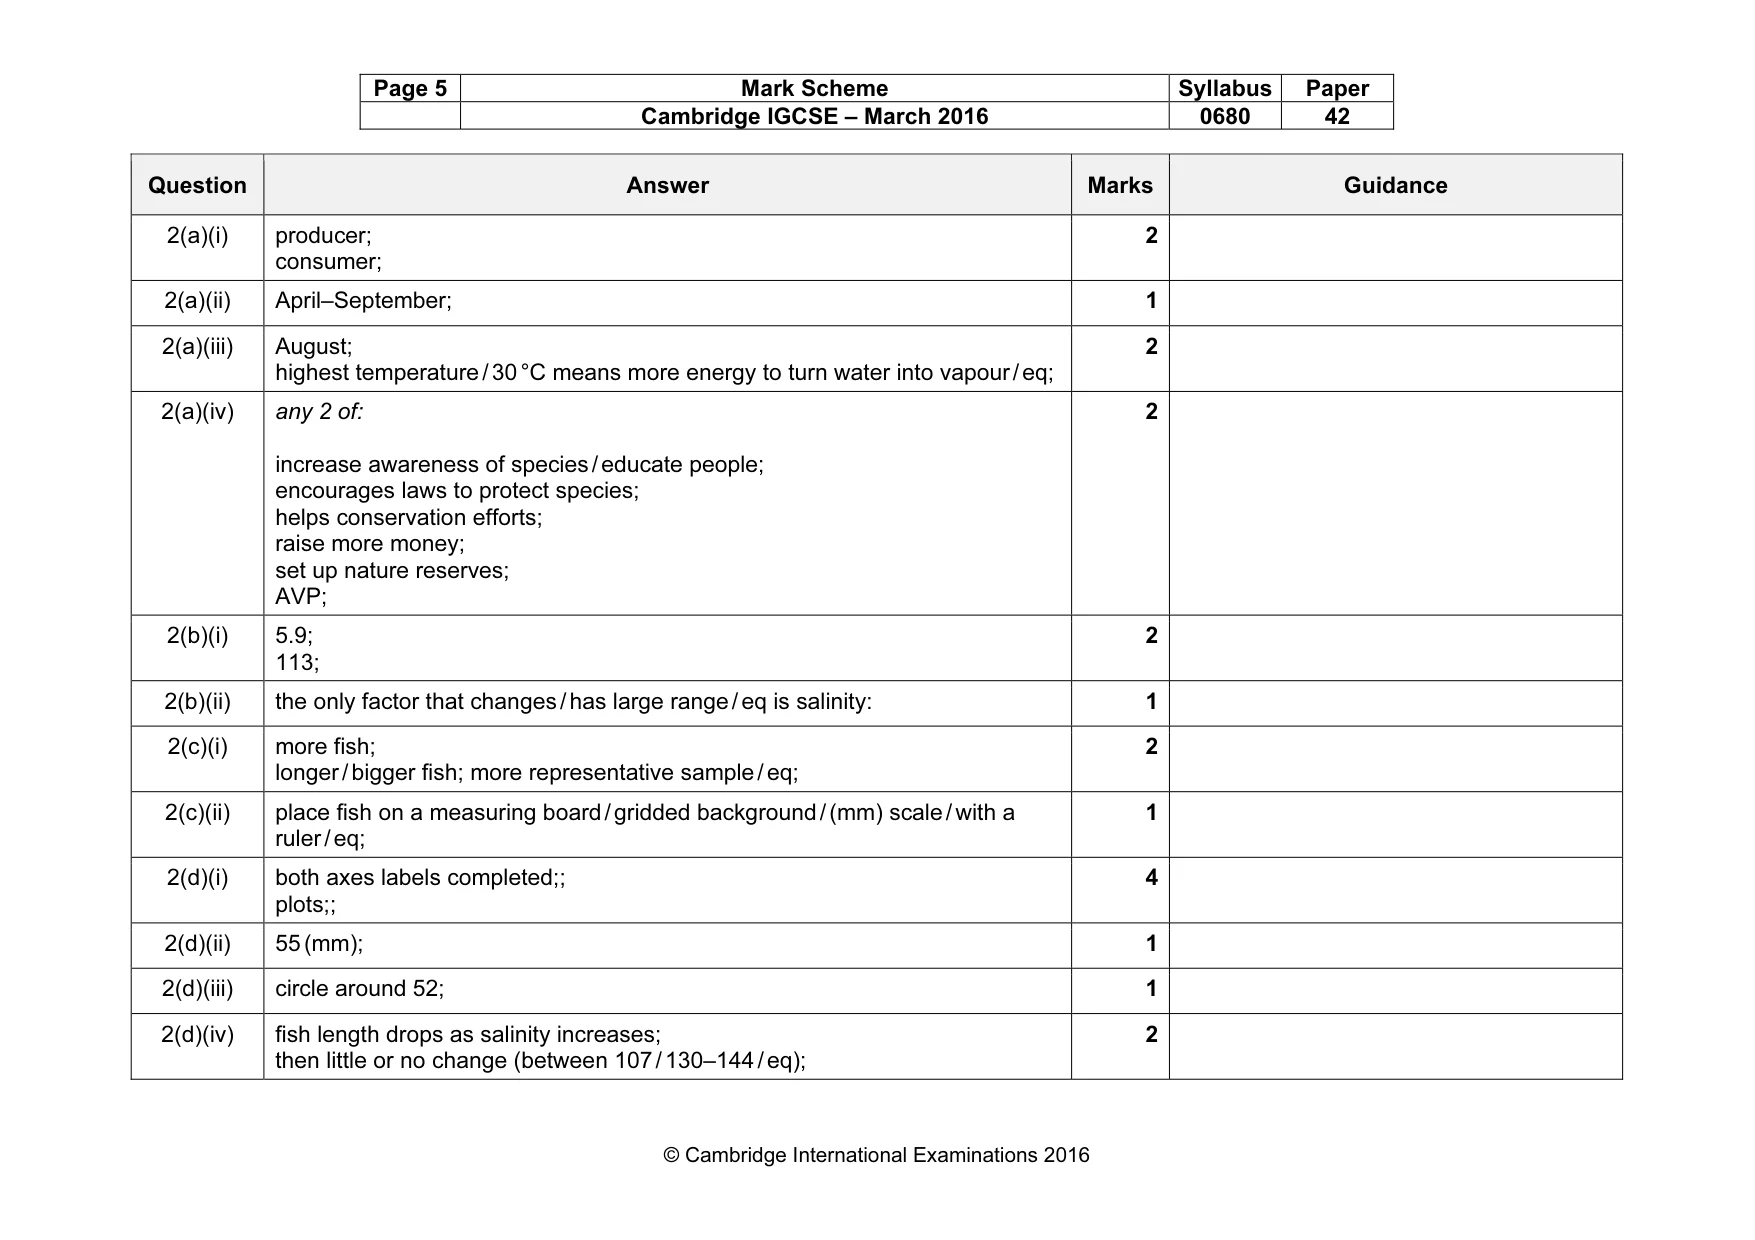
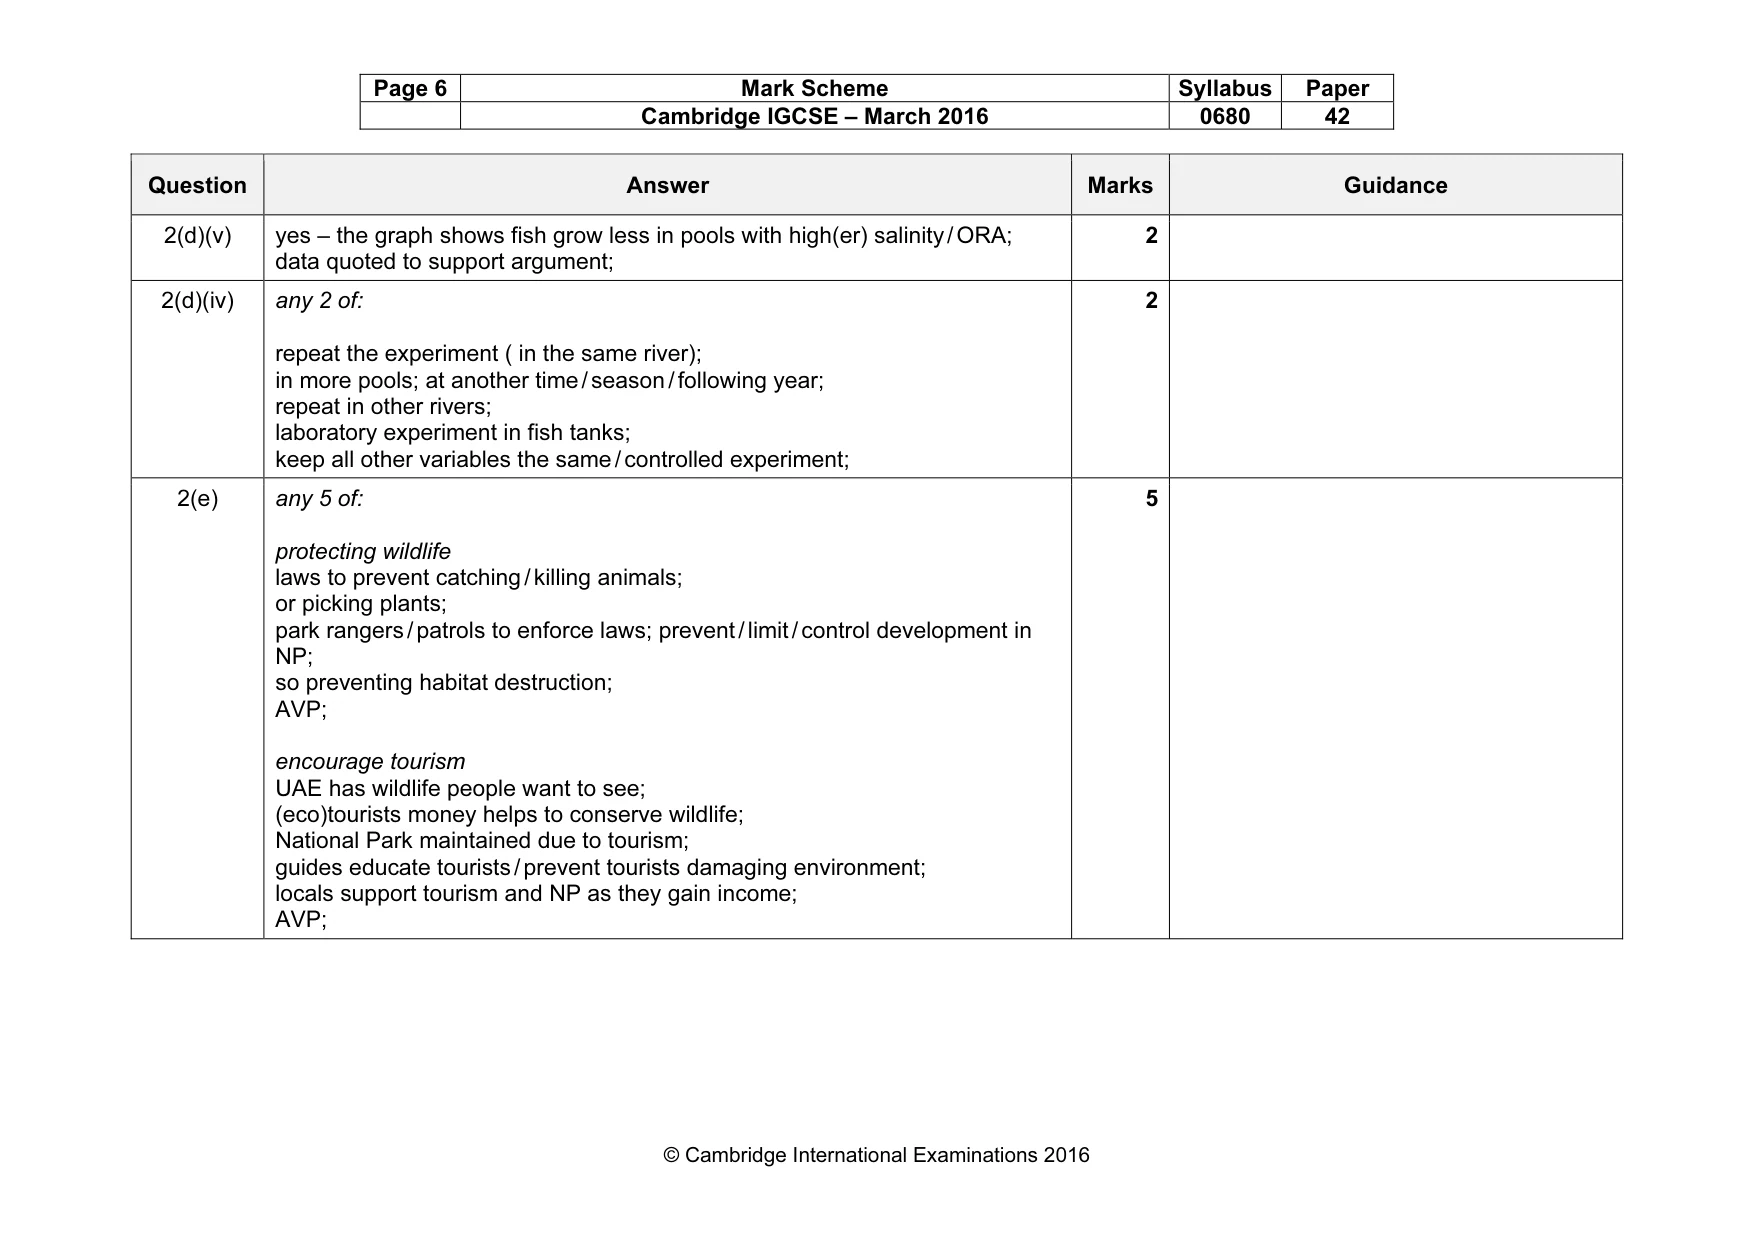
Paper as text
Question paper, page 1
This document consists of 12 printed pages and 4 blank pages. DC (ST/SW) 106681/7 © UCLES 2016 [Turn over Cambridge International Examinations Cambridge International General Certificate of Secondary Education * 0 8 1 0 2 6 8 1 3 7 * ENVIRONMENTAL MANAGEMENT 0680/42 Alternative to Coursework February/March 2016 1 hour 30 minutes Candidates answer on the Question Paper. No Additional Materials are required. READ THESE INSTRUCTIONS FIRST Write your Centre number, candidate number and name on all the work you hand in. Write in dark blue or black pen. You may use an HB pencil for any diagrams or graphs. Do not use staples, paper clips, glue or correction fluid. DO NOT WRITE IN ANY BARCODES. Answer all questions. Electronic calculators may be used. You may lose marks if you do not show your working or if you do not use appropriate units. Study the appropriate source materials before you start to write your answers. Credit will be given for appropriate selection and use of data in your answers and for relevant interpretation of these data. Suggestions for data sources are given in some questions. You may use the source data to draw diagrams and graphs or to do calculations to illustrate your answers. At the end of the examination, fasten all your work securely together. The number of marks is given in brackets [ ] at the end of each question or part question.
Question paper, page 2
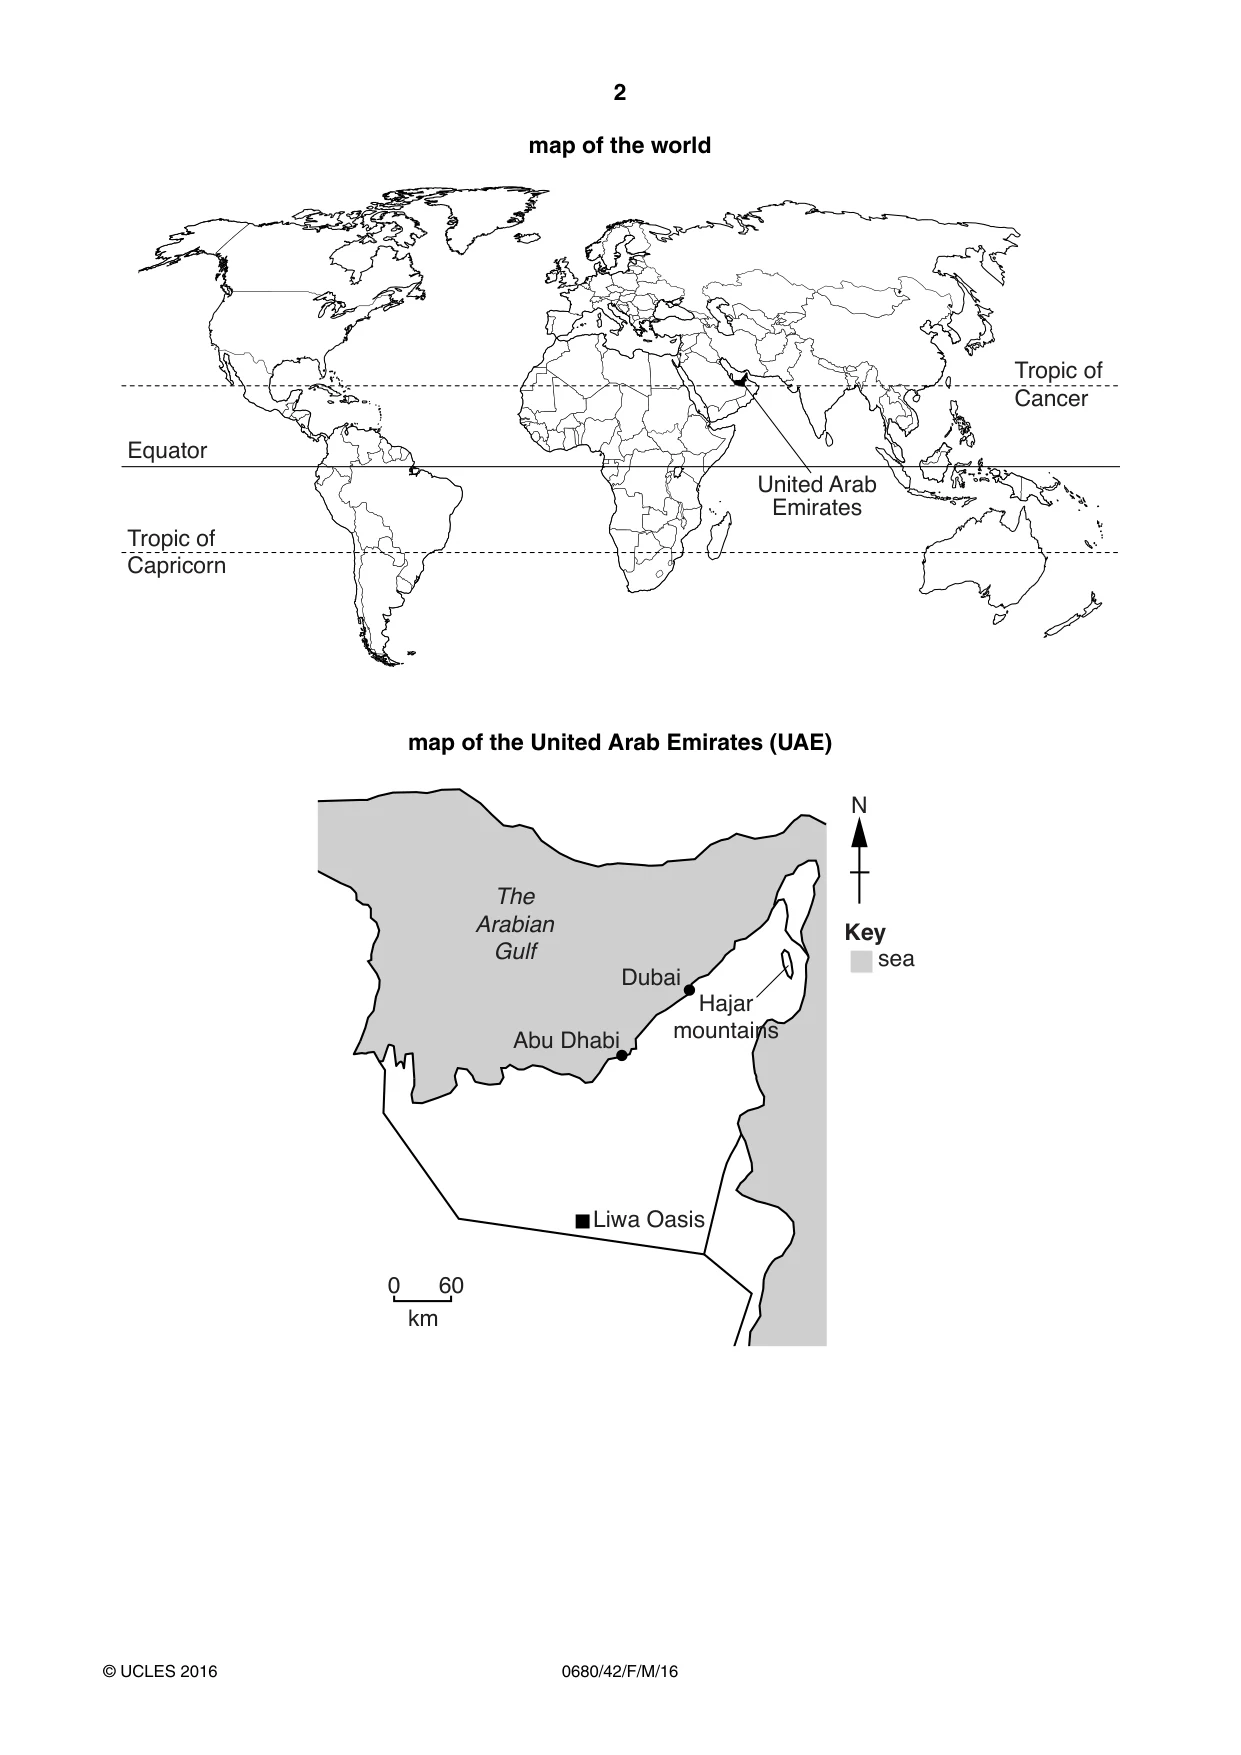
2 0680/42/F/M/16 © UCLES 2016 map of the world Equator Tropic of Capricorn Tropic of Cancer United Arab Emirates map of the United Arab Emirates (UAE) 0 60 km N Dubai Abu Dhabi The Arabian Gulf Hajar mountains Liwa Oasis sea Key
Question paper, page 3
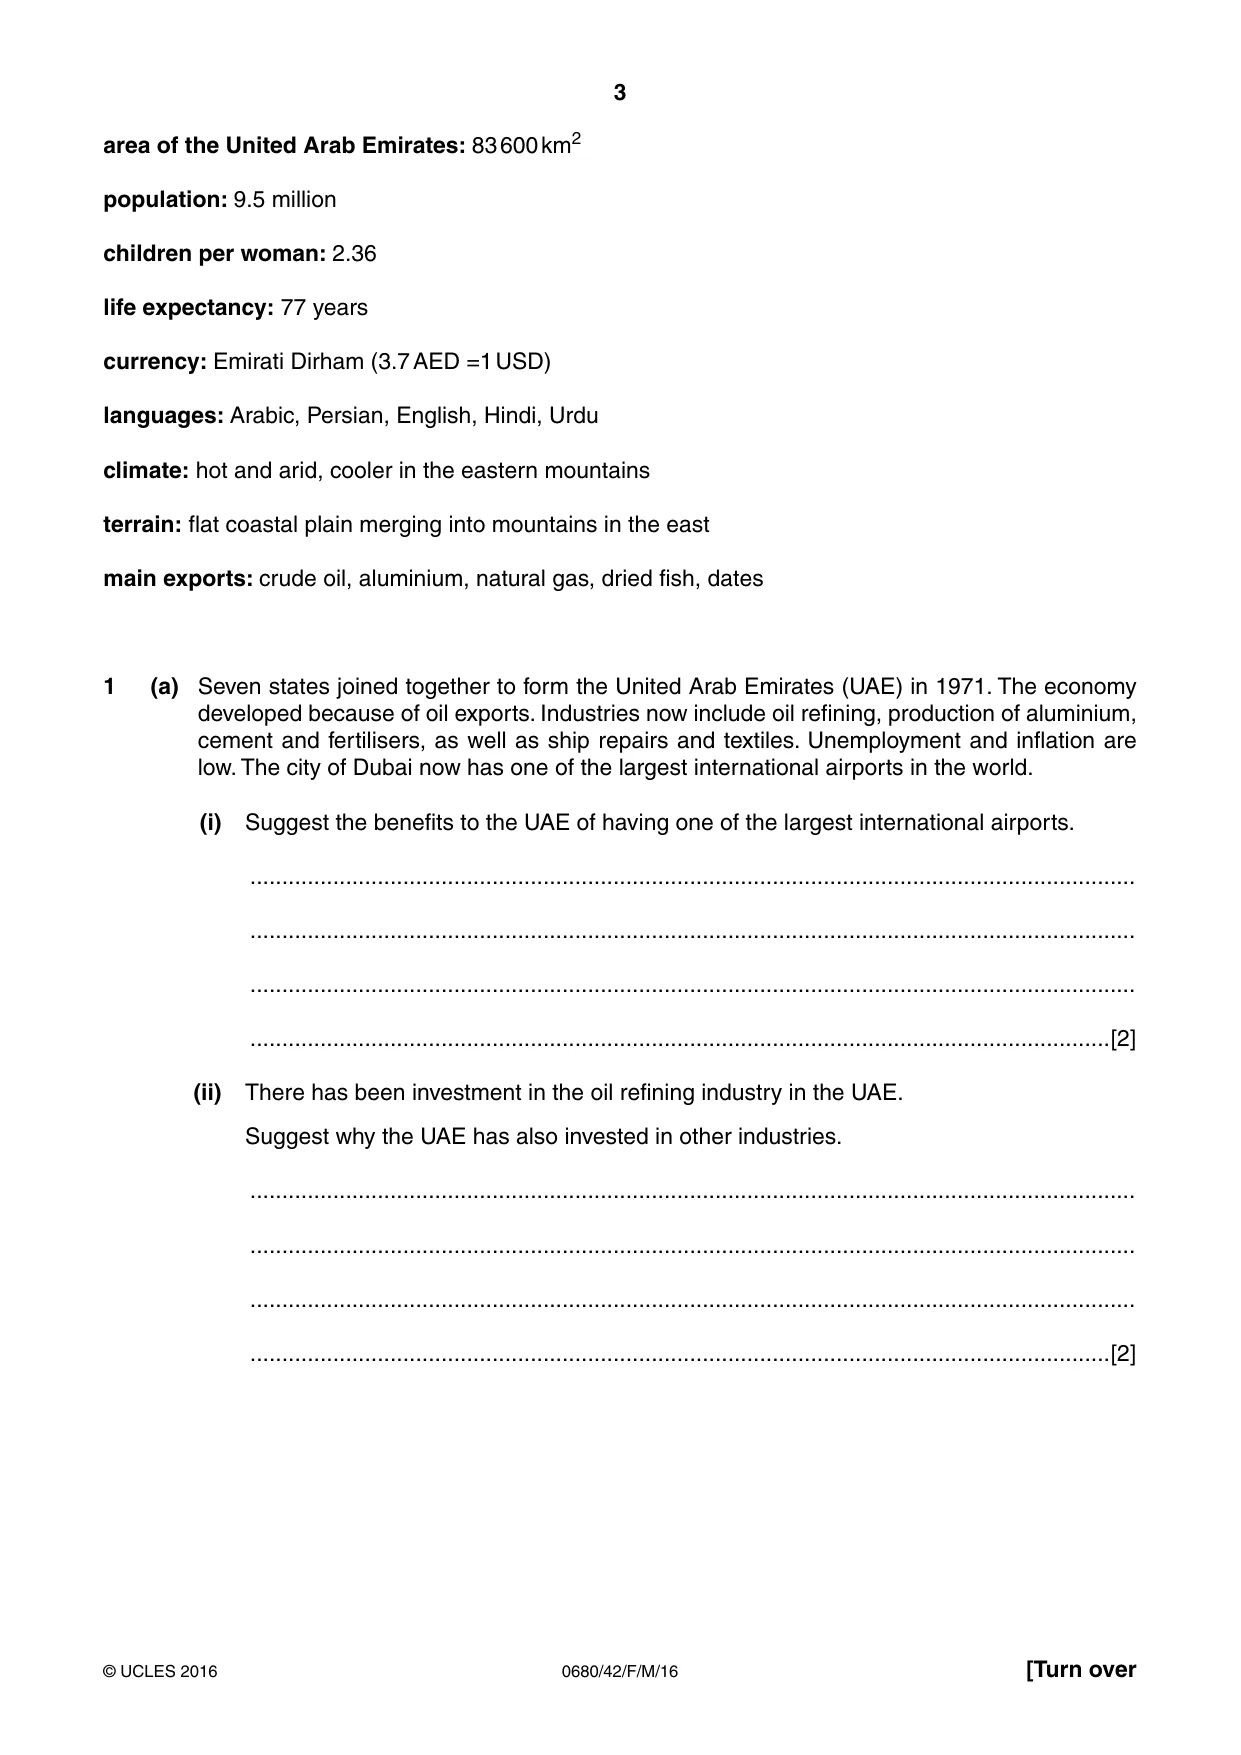
3 0680/42/F/M/16 © UCLES 2016 [Turn over area of the United Arab Emirates: 83 600 km2 population: 9.5 million children per woman: 2.36 life expectancy: 77 years currency: Emirati Dirham (3.7 AED =1 USD) languages: Arabic, Persian, English, Hindi, Urdu climate: hot and arid, cooler in the eastern mountains terrain: flat coastal plain merging into mountains in the east main exports: crude oil, aluminium, natural gas, dried fish, dates 1 (a) Seven states joined together to form the United Arab Emirates (UAE) in 1971. The economy developed because of oil exports. Industries now include oil refining, production of aluminium, cement and fertilisers, as well as ship repairs and textiles. Unemployment and inflation are low. The city of Dubai now has one of the largest international airports in the world. (i) Suggest the benefits to the UAE of having one of the largest international airports. … … … …[2] (ii) There has been investment in the oil refining industry in the UAE. Suggest why the UAE has also invested in other industries. … … … …[2]
Question paper, page 4
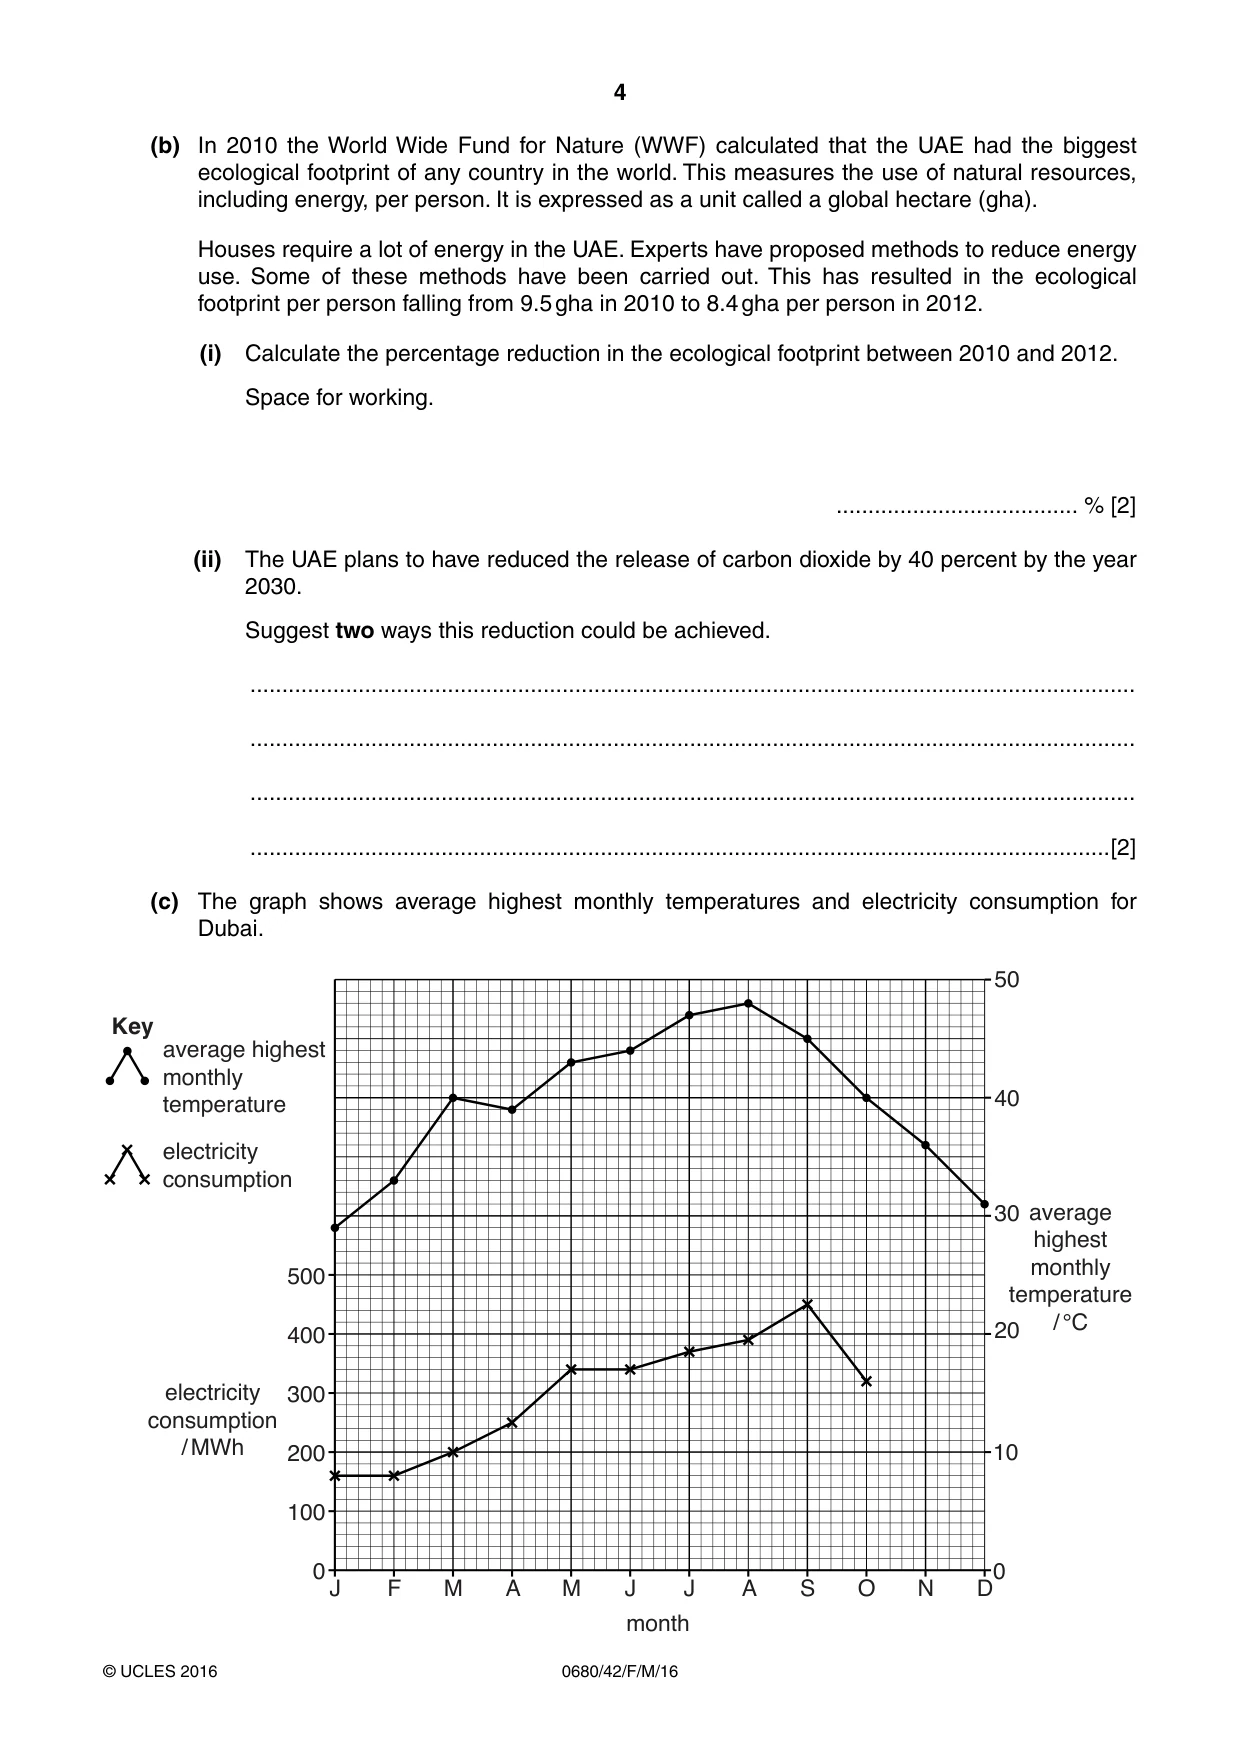
4 0680/42/F/M/16 © UCLES 2016 (b) In 2010 the World Wide Fund for Nature (WWF) calculated that the UAE had the biggest ecological footprint of any country in the world. This measures the use of natural resources, including energy, per person. It is expressed as a unit called a global hectare (gha). Houses require a lot of energy in the UAE. Experts have proposed methods to reduce energy use. Some of these methods have been carried out. This has resulted in the ecological footprint per person falling from 9.5 gha in 2010 to 8.4 gha per person in 2012. (i) Calculate the percentage reduction in the ecological footprint between 2010 and 2012. Space for working. … % [2] (ii) The UAE plans to have reduced the release of carbon dioxide by 40 percent by the year 2030. Suggest two ways this reduction could be achieved. … … … …[2] (c) The graph shows average highest monthly temperatures and electricity consumption for Dubai. J 0 0 10 20 30 40 average highest monthly temperature / °C month electricity consumption / MWh average highest monthly temperature Key electricity consumption 50 100 200 300 400 500 F M A M J J A S O N D
Question paper, page 5
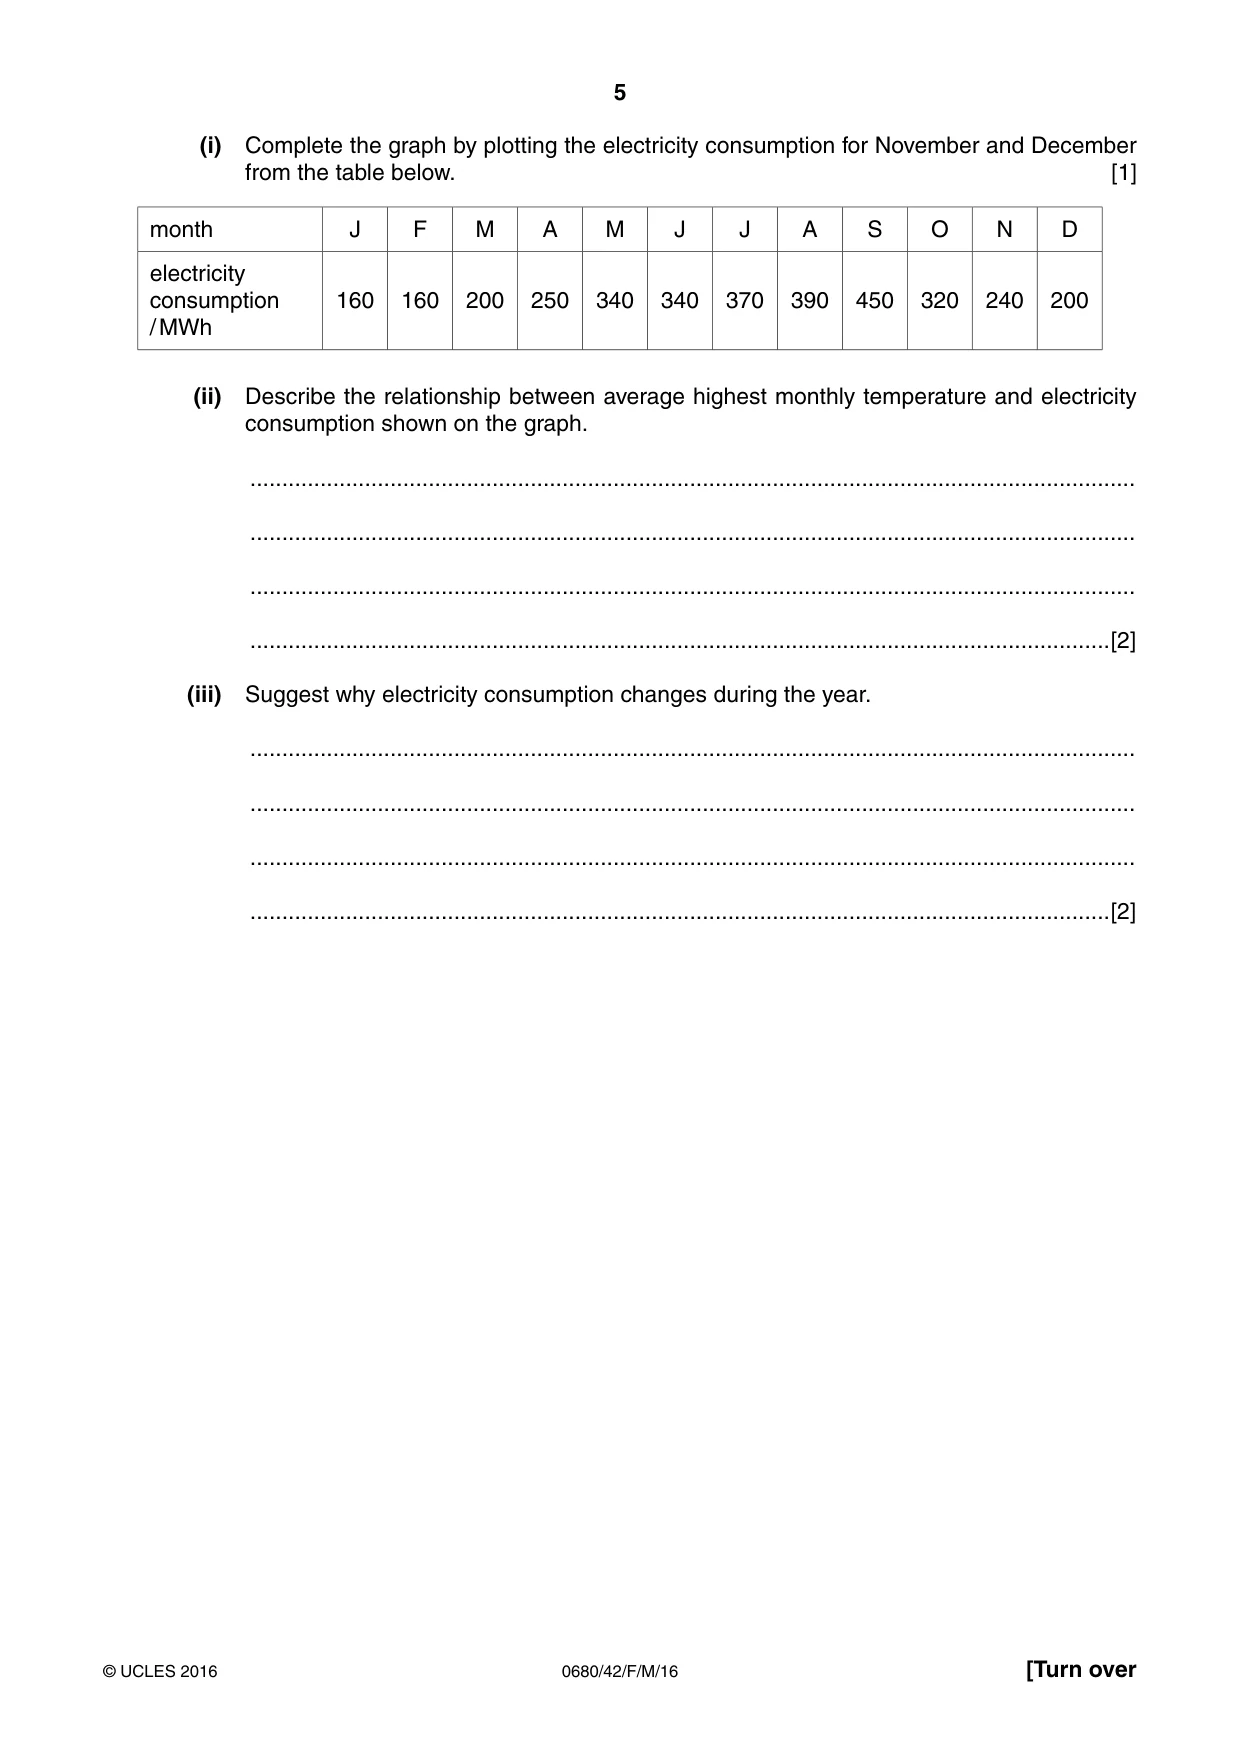
5 0680/42/F/M/16 © UCLES 2016 [Turn over (i) Complete the graph by plotting the electricity consumption for November and December from the table below. [1] month J F M A M J J A S O N D electricity consumption / MWh 160 160 200 250 340 340 370 390 450 320 240 200 (ii) Describe the relationship between average highest monthly temperature and electricity consumption shown on the graph. … … … …[2] (iii) Suggest why electricity consumption changes during the year. … … … …[2]
Question paper, page 6
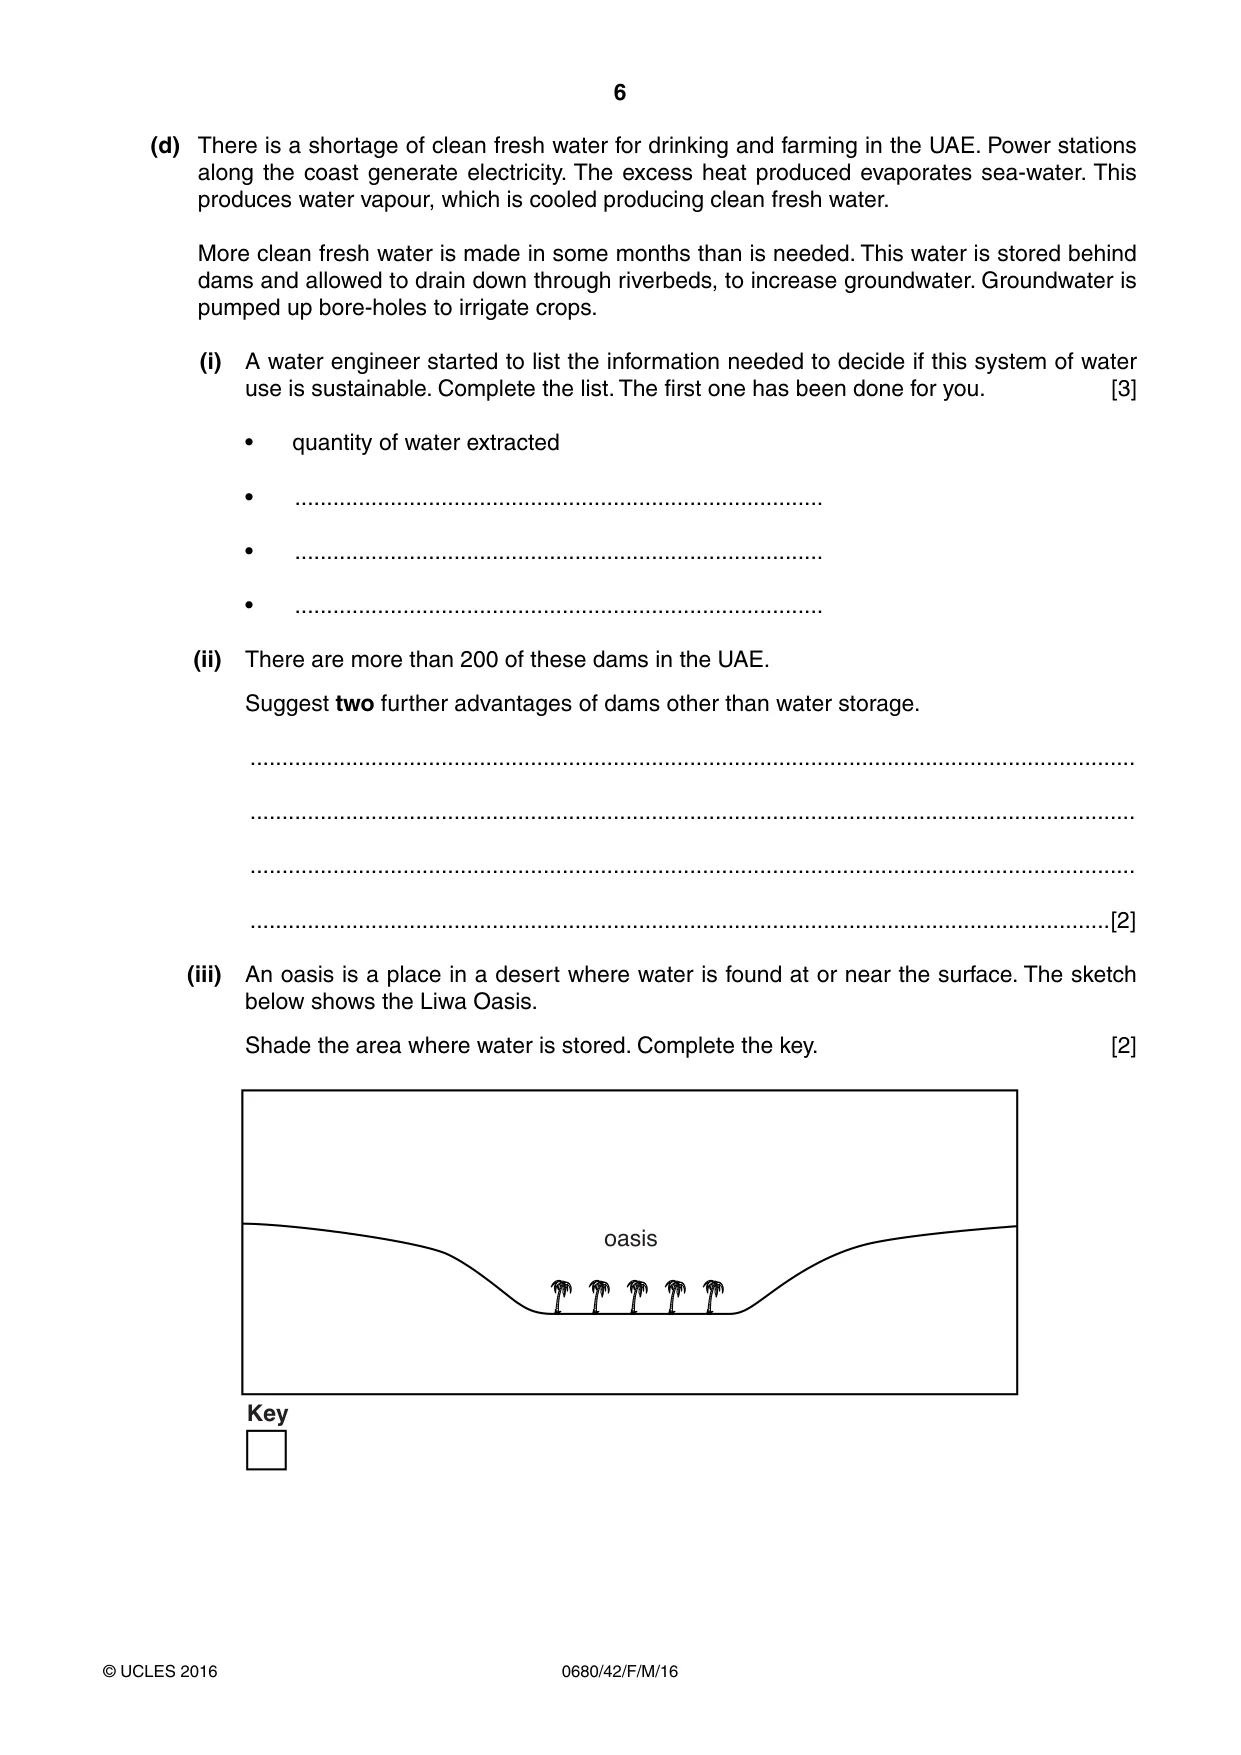
6 0680/42/F/M/16 © UCLES 2016 (d) There is a shortage of clean fresh water for drinking and farming in the UAE. Power stations along the coast generate electricity. The excess heat produced evaporates sea-water. This produces water vapour, which is cooled producing clean fresh water. More clean fresh water is made in some months than is needed. This water is stored behind dams and allowed to drain down through riverbeds, to increase groundwater. Groundwater is pumped up bore-holes to irrigate crops. (i) A water engineer started to list the information needed to decide if this system of water use is sustainable. Complete the list. The first one has been done for you. [3] • quantity of water extracted • … • … • … (ii) There are more than 200 of these dams in the UAE. Suggest two further advantages of dams other than water storage. … … … …[2] (iii) An oasis is a place in a desert where water is found at or near the surface. The sketch below shows the Liwa Oasis. Shade the area where water is stored. Complete the key. [2] oasis Key
Question paper, page 7
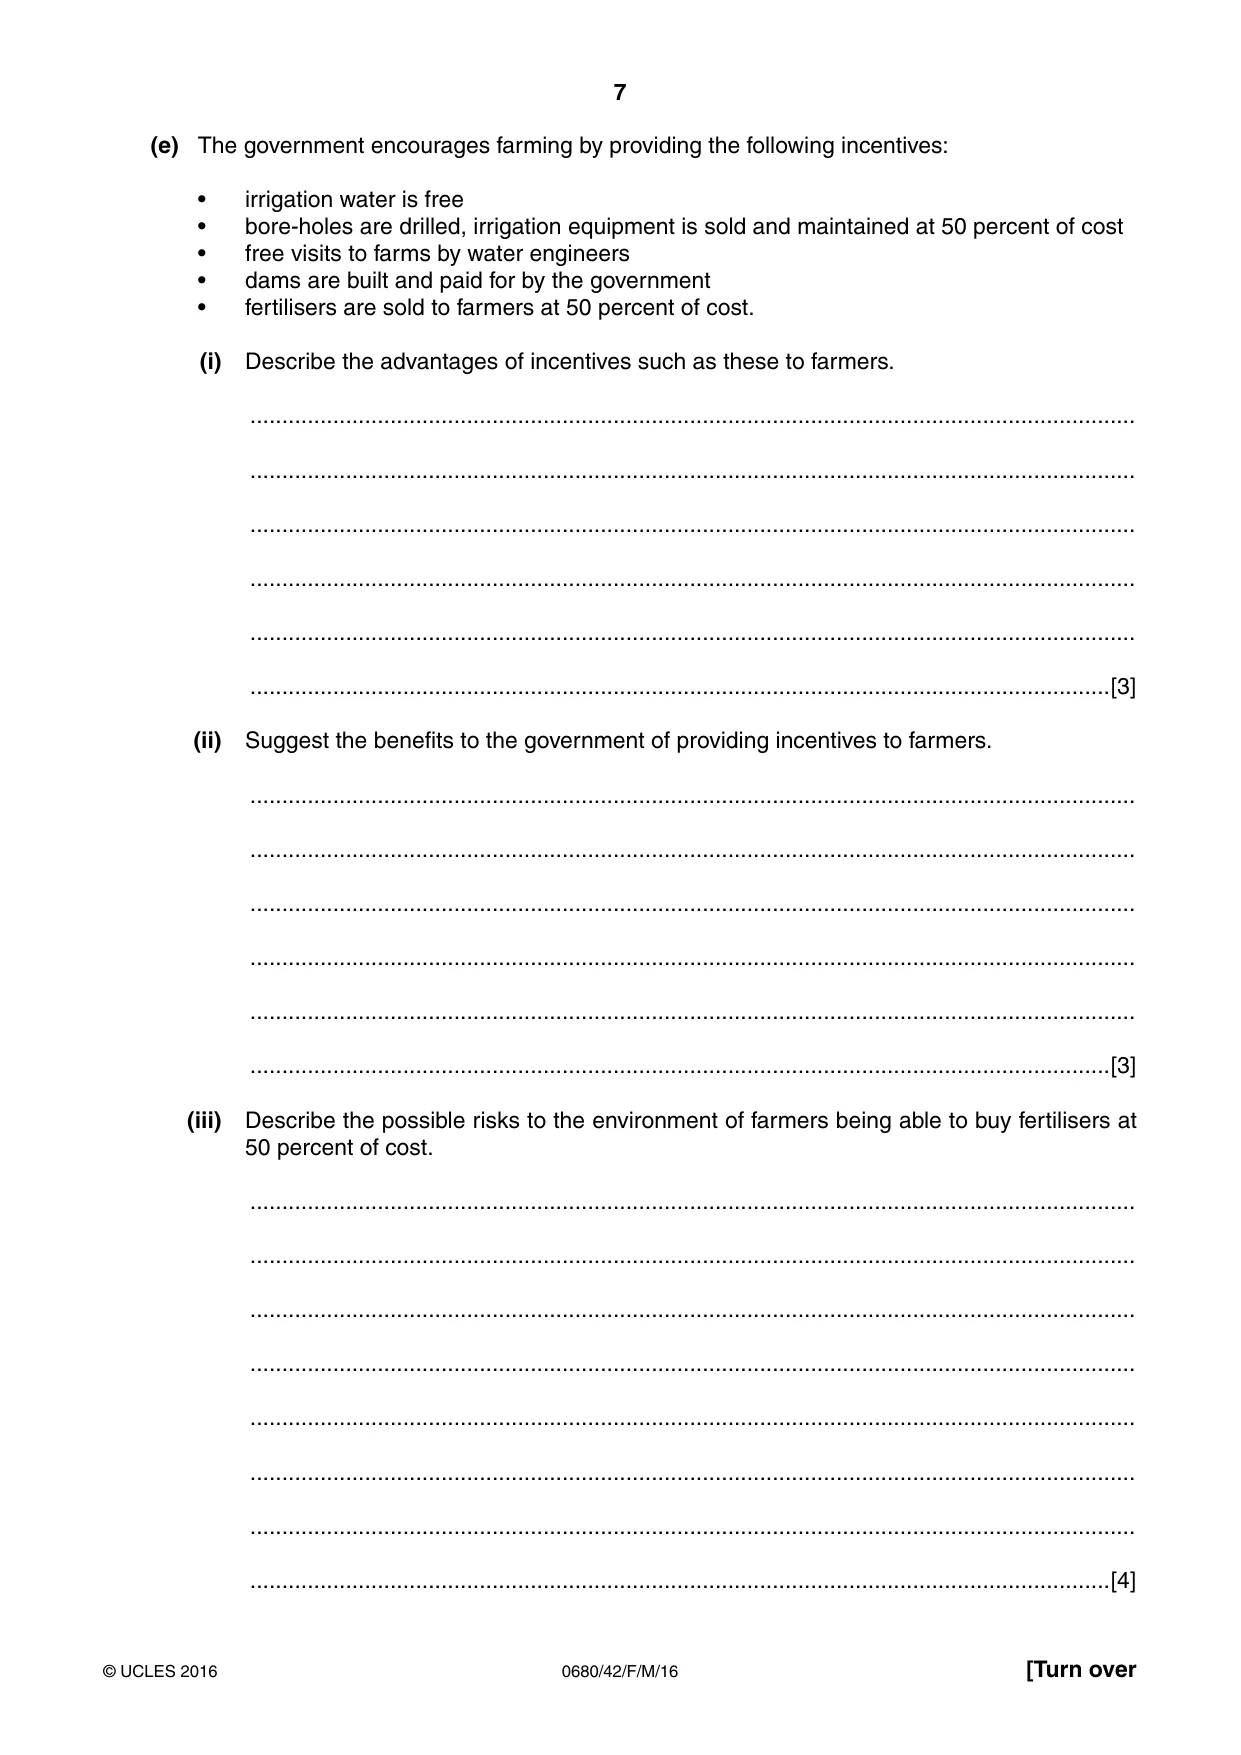
7 0680/42/F/M/16 © UCLES 2016 [Turn over (e) The government encourages farming by providing the following incentives: • irrigation water is free • bore-holes are drilled, irrigation equipment is sold and maintained at 50 percent of cost • free visits to farms by water engineers • dams are built and paid for by the government • fertilisers are sold to farmers at 50 percent of cost. (i) Describe the advantages of incentives such as these to farmers. … … … … … …[3] (ii) Suggest the benefits to the government of providing incentives to farmers. … … … … … …[3] (iii) Describe the possible risks to the environment of farmers being able to buy fertilisers at 50 percent of cost. … … … … … … … …[4]
Question paper, page 8
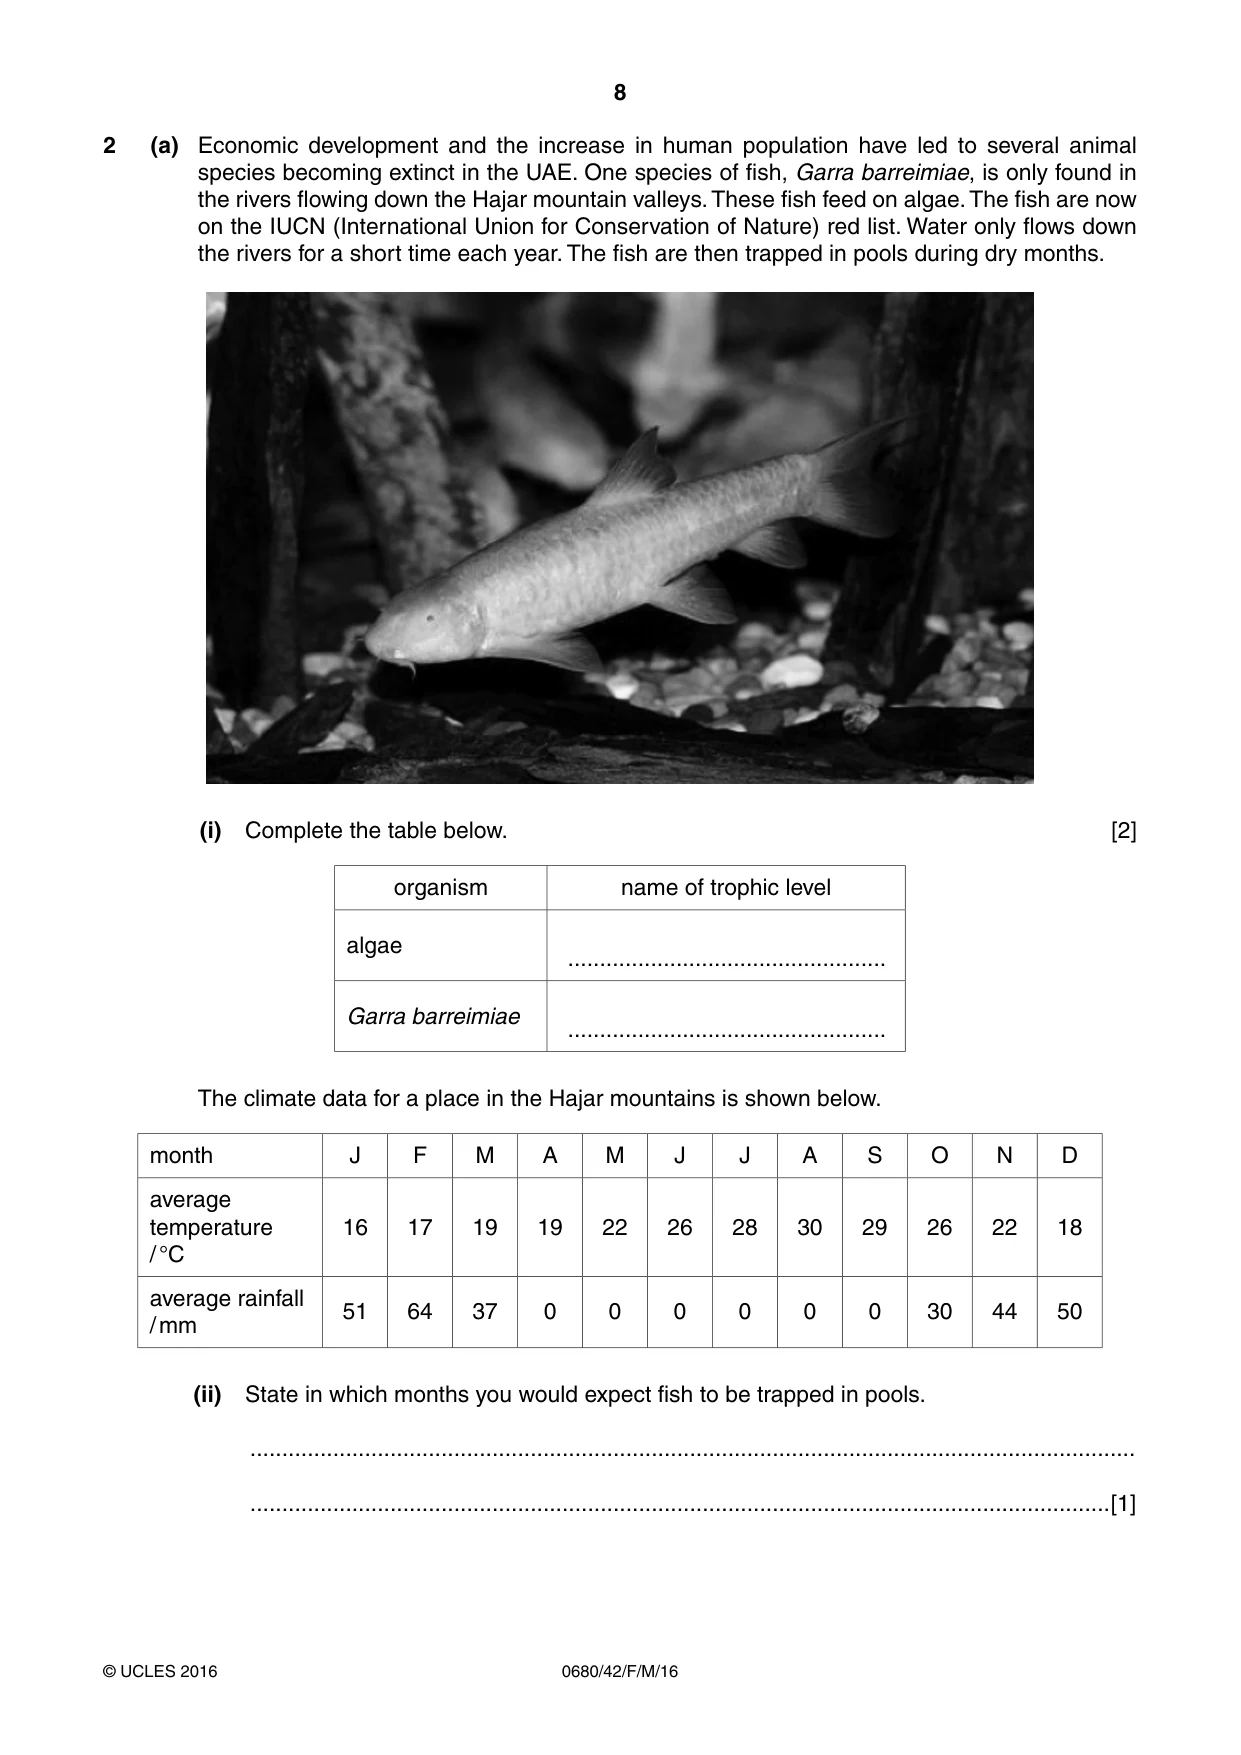
8 0680/42/F/M/16 © UCLES 2016 2 (a) Economic development and the increase in human population have led to several animal species becoming extinct in the UAE. One species of fish, Garra barreimiae, is only found in the rivers flowing down the Hajar mountain valleys. These fish feed on algae. The fish are now on the IUCN (International Union for Conservation of Nature) red list. Water only flows down the rivers for a short time each year. The fish are then trapped in pools during dry months. (i) Complete the table below. [2] organism name of trophic level algae … Garra barreimiae … The climate data for a place in the Hajar mountains is shown below. month J F M A M J J A S O N D average temperature / °C 16 17 19 19 22 26 28 30 29 26 22 18 average rainfall / mm 51 64 37 0 0 0 0 0 0 30 44 50 (ii) State in which months you would expect fish to be trapped in pools. … …[1]
Question paper, page 9
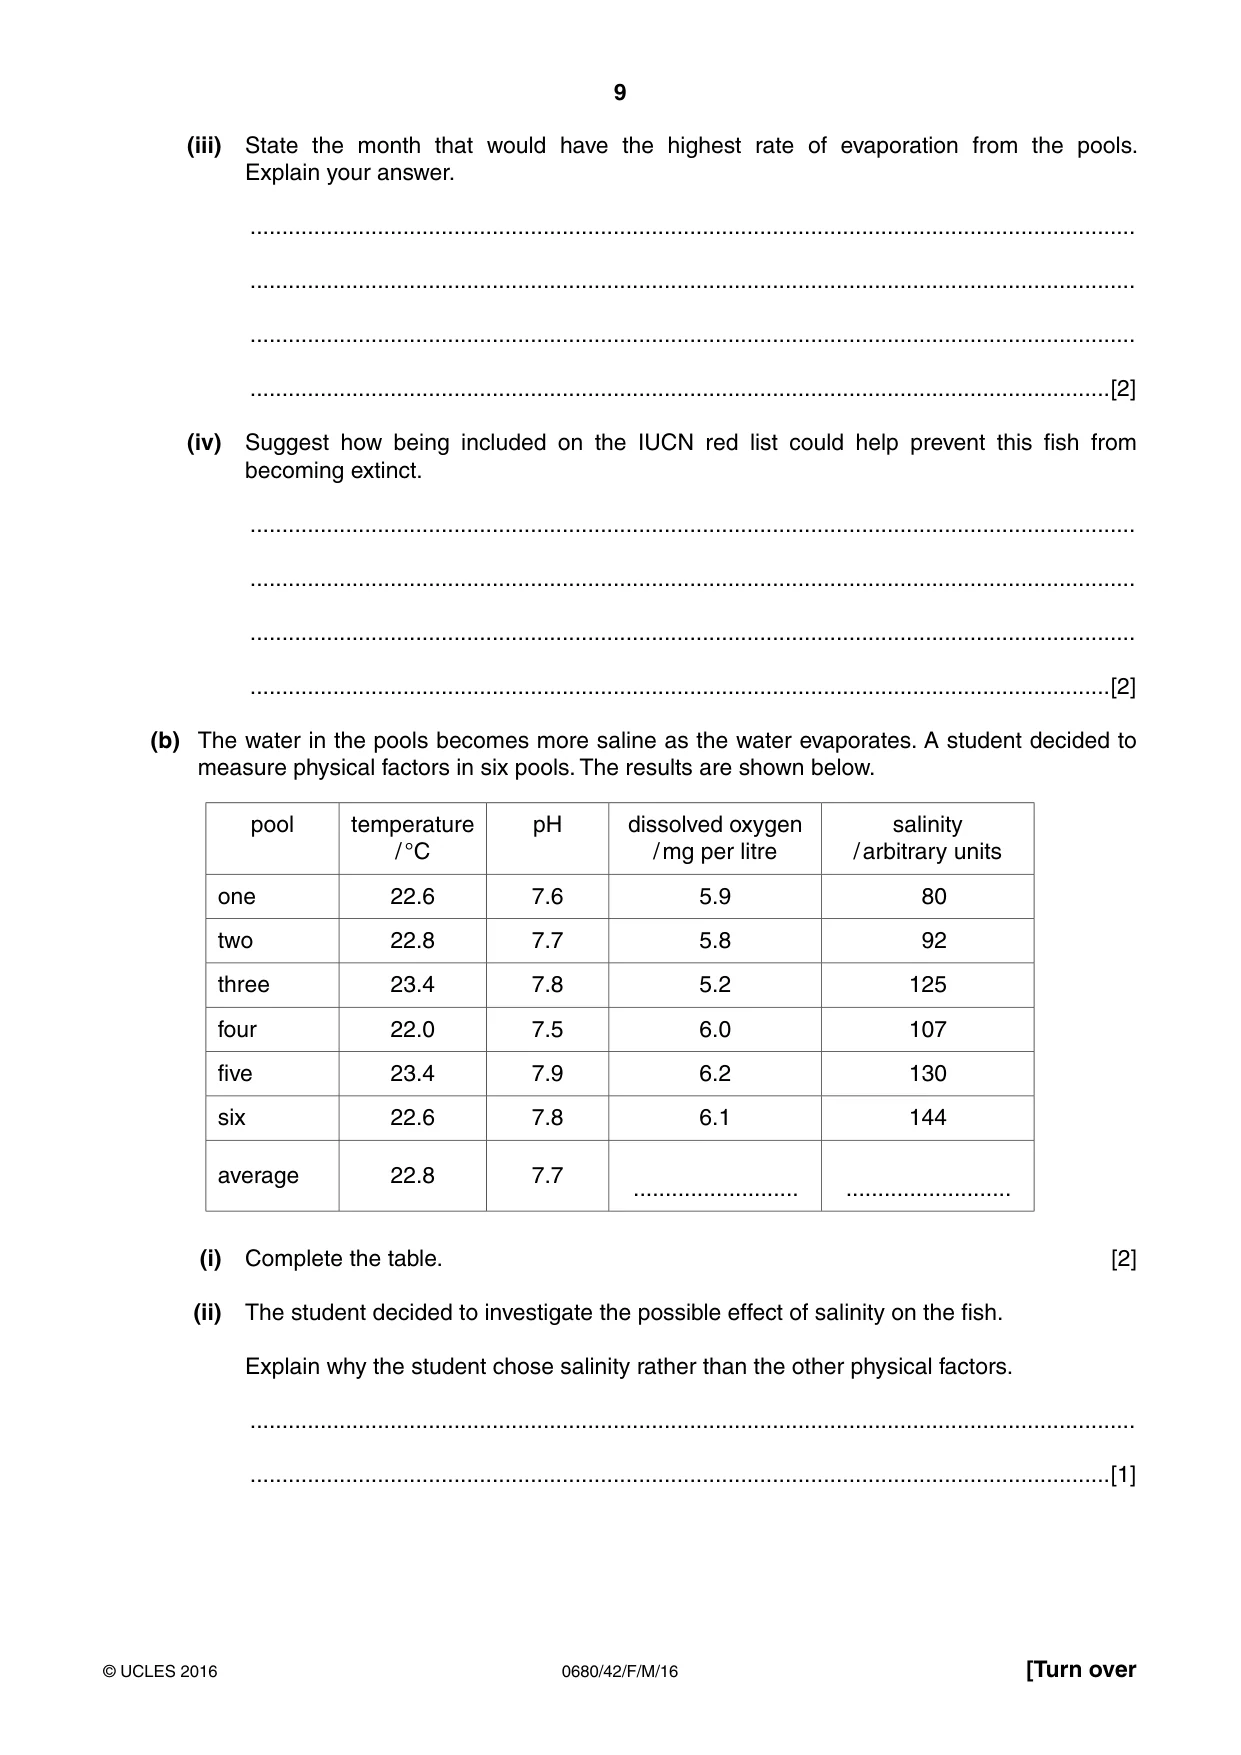
9 0680/42/F/M/16 © UCLES 2016 [Turn over (iii) State the month that would have the highest rate of evaporation from the pools. Explain your answer. … … … …[2] (iv) Suggest how being included on the IUCN red list could help prevent this fish from becoming extinct. … … … …[2] (b) The water in the pools becomes more saline as the water evaporates. A student decided to measure physical factors in six pools. The results are shown below. pool temperature / °C pH dissolved oxygen / mg per litre salinity / arbitrary units one 22.6 7.6 5.9 80 two 22.8 7.7 5.8 92 three 23.4 7.8 5.2 125 four 22.0 7.5 6.0 107 five 23.4 7.9 6.2 130 six 22.6 7.8 6.1 144 average 22.8 7.7 … … (i) Complete the table. [2] (ii) The student decided to investigate the possible effect of salinity on the fish. Explain why the student chose salinity rather than the other physical factors. … …[1]
Question paper, page 10
10 0680/42/F/M/16 © UCLES 2016 BLANK PAGE
Question paper, page 11
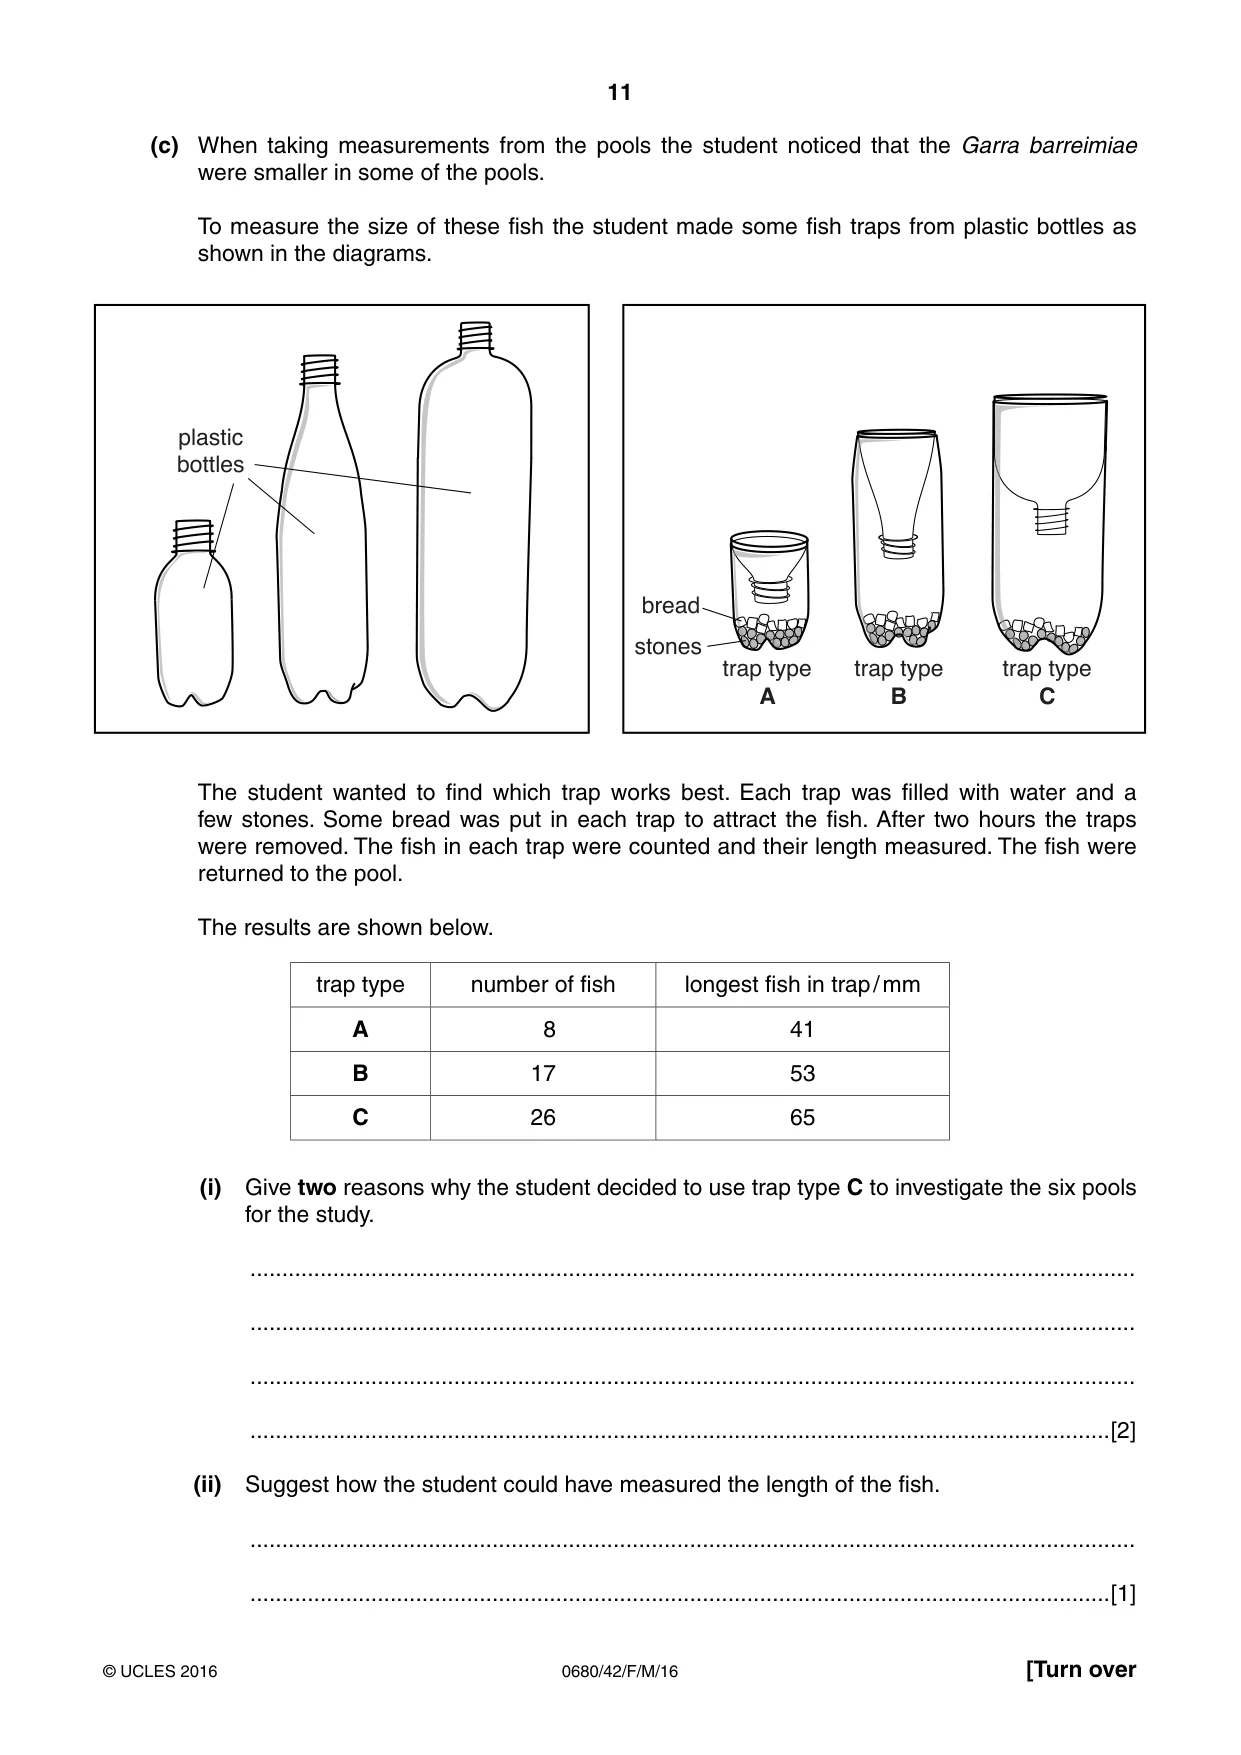
11 0680/42/F/M/16 © UCLES 2016 [Turn over (c) When taking measurements from the pools the student noticed that the Garra barreimiae were smaller in some of the pools. To measure the size of these fish the student made some fish traps from plastic bottles as shown in the diagrams. stones bread plastic bottles trap type A trap type B trap type C The student wanted to find which trap works best. Each trap was filled with water and a few stones. Some bread was put in each trap to attract the fish. After two hours the traps were removed. The fish in each trap were counted and their length measured. The fish were returned to the pool. The results are shown below. trap type number of fish longest fish in trap / mm A 8 41 B 17 53 C 26 65 (i) Give two reasons why the student decided to use trap type C to investigate the six pools for the study. … … … …[2] (ii) Suggest how the student could have measured the length of the fish. … …[1]
Question paper, page 12
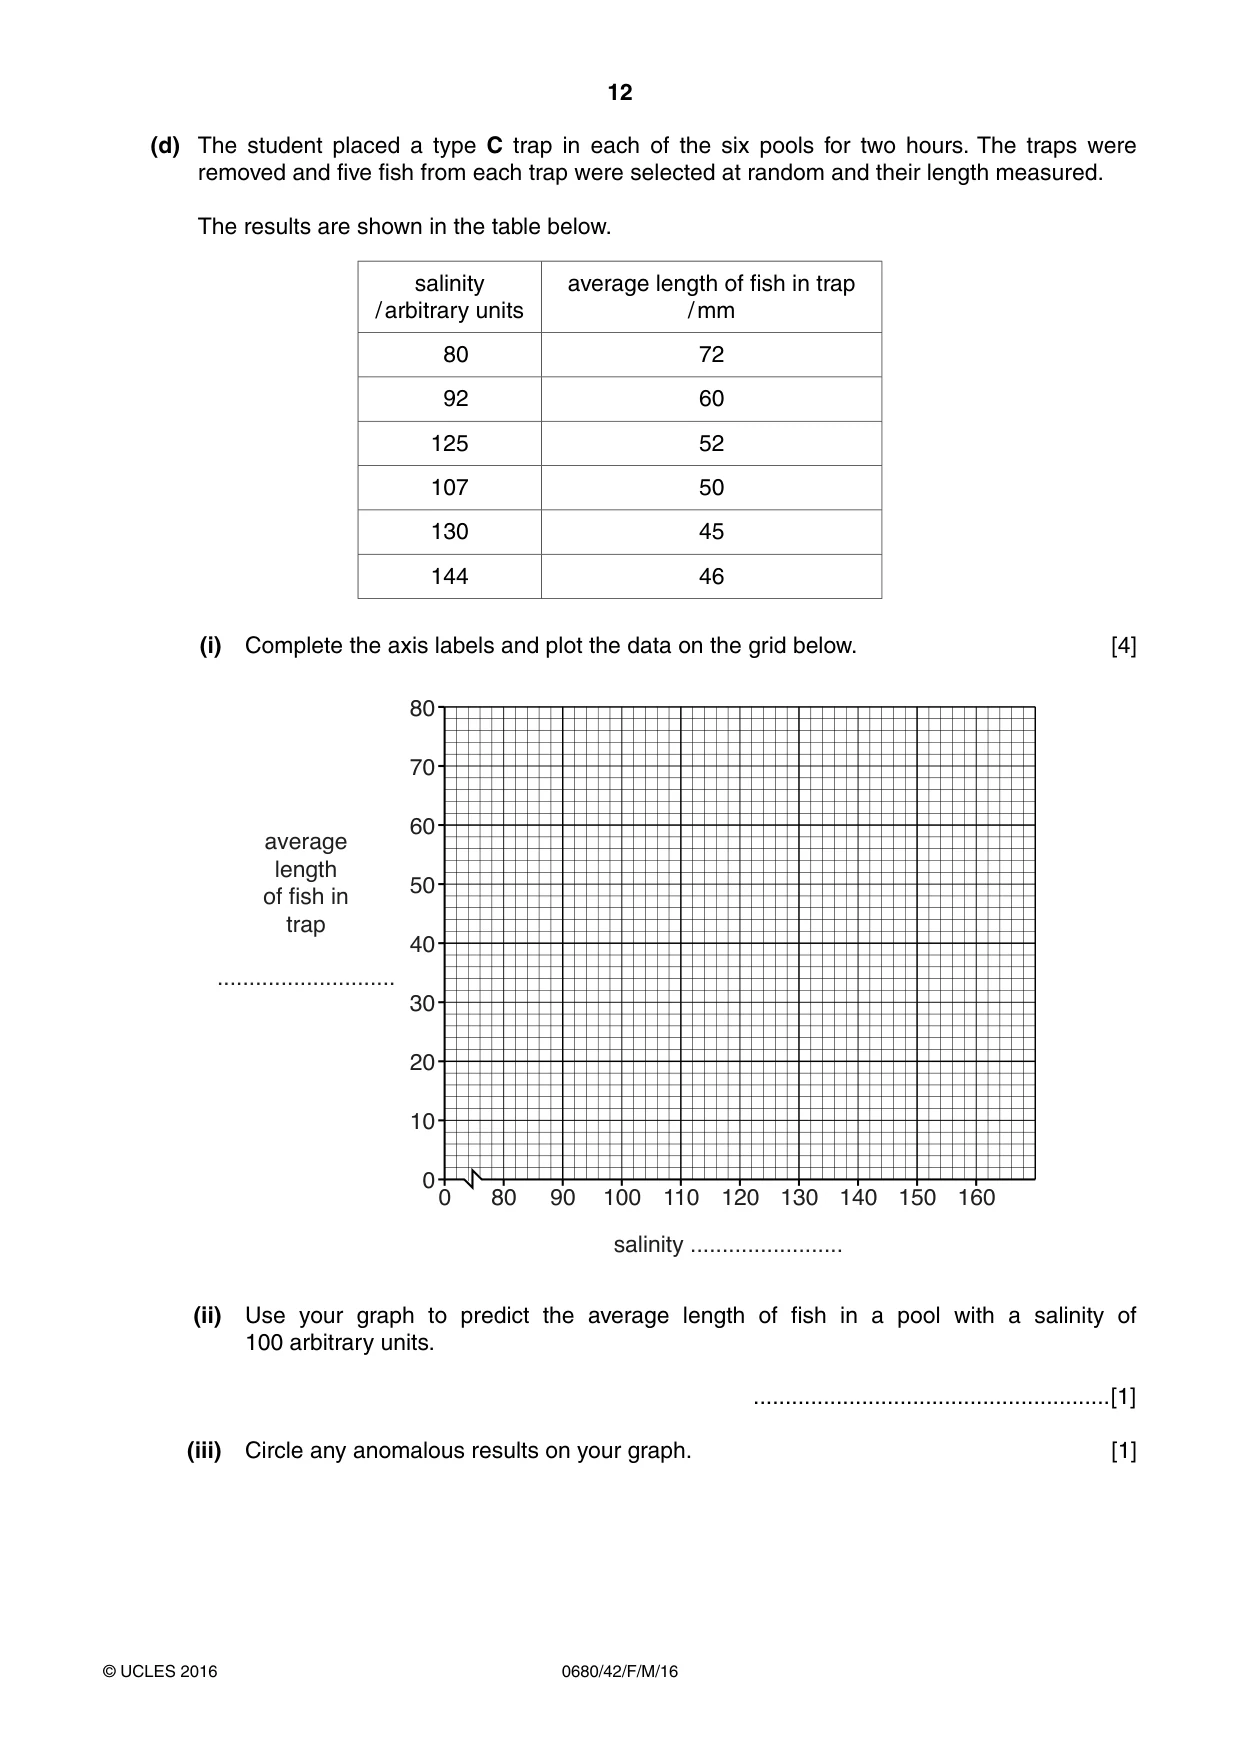
12 0680/42/F/M/16 © UCLES 2016 (d) The student placed a type C trap in each of the six pools for two hours. The traps were removed and five fish from each trap were selected at random and their length measured. The results are shown in the table below. salinity / arbitrary units average length of fish in trap / mm 80 72 92 60 125 52 107 50 130 45 144 46 (i) Complete the axis labels and plot the data on the grid below. [4] 0 0 10 20 30 40 50 60 70 80 80 90 100 110 120 130 140 150 160 average length of fish in trap salinity … … (ii) Use your graph to predict the average length of fish in a pool with a salinity of 100 arbitrary units. …[1] (iii) Circle any anomalous results on your graph. [1]
Question paper, page 13
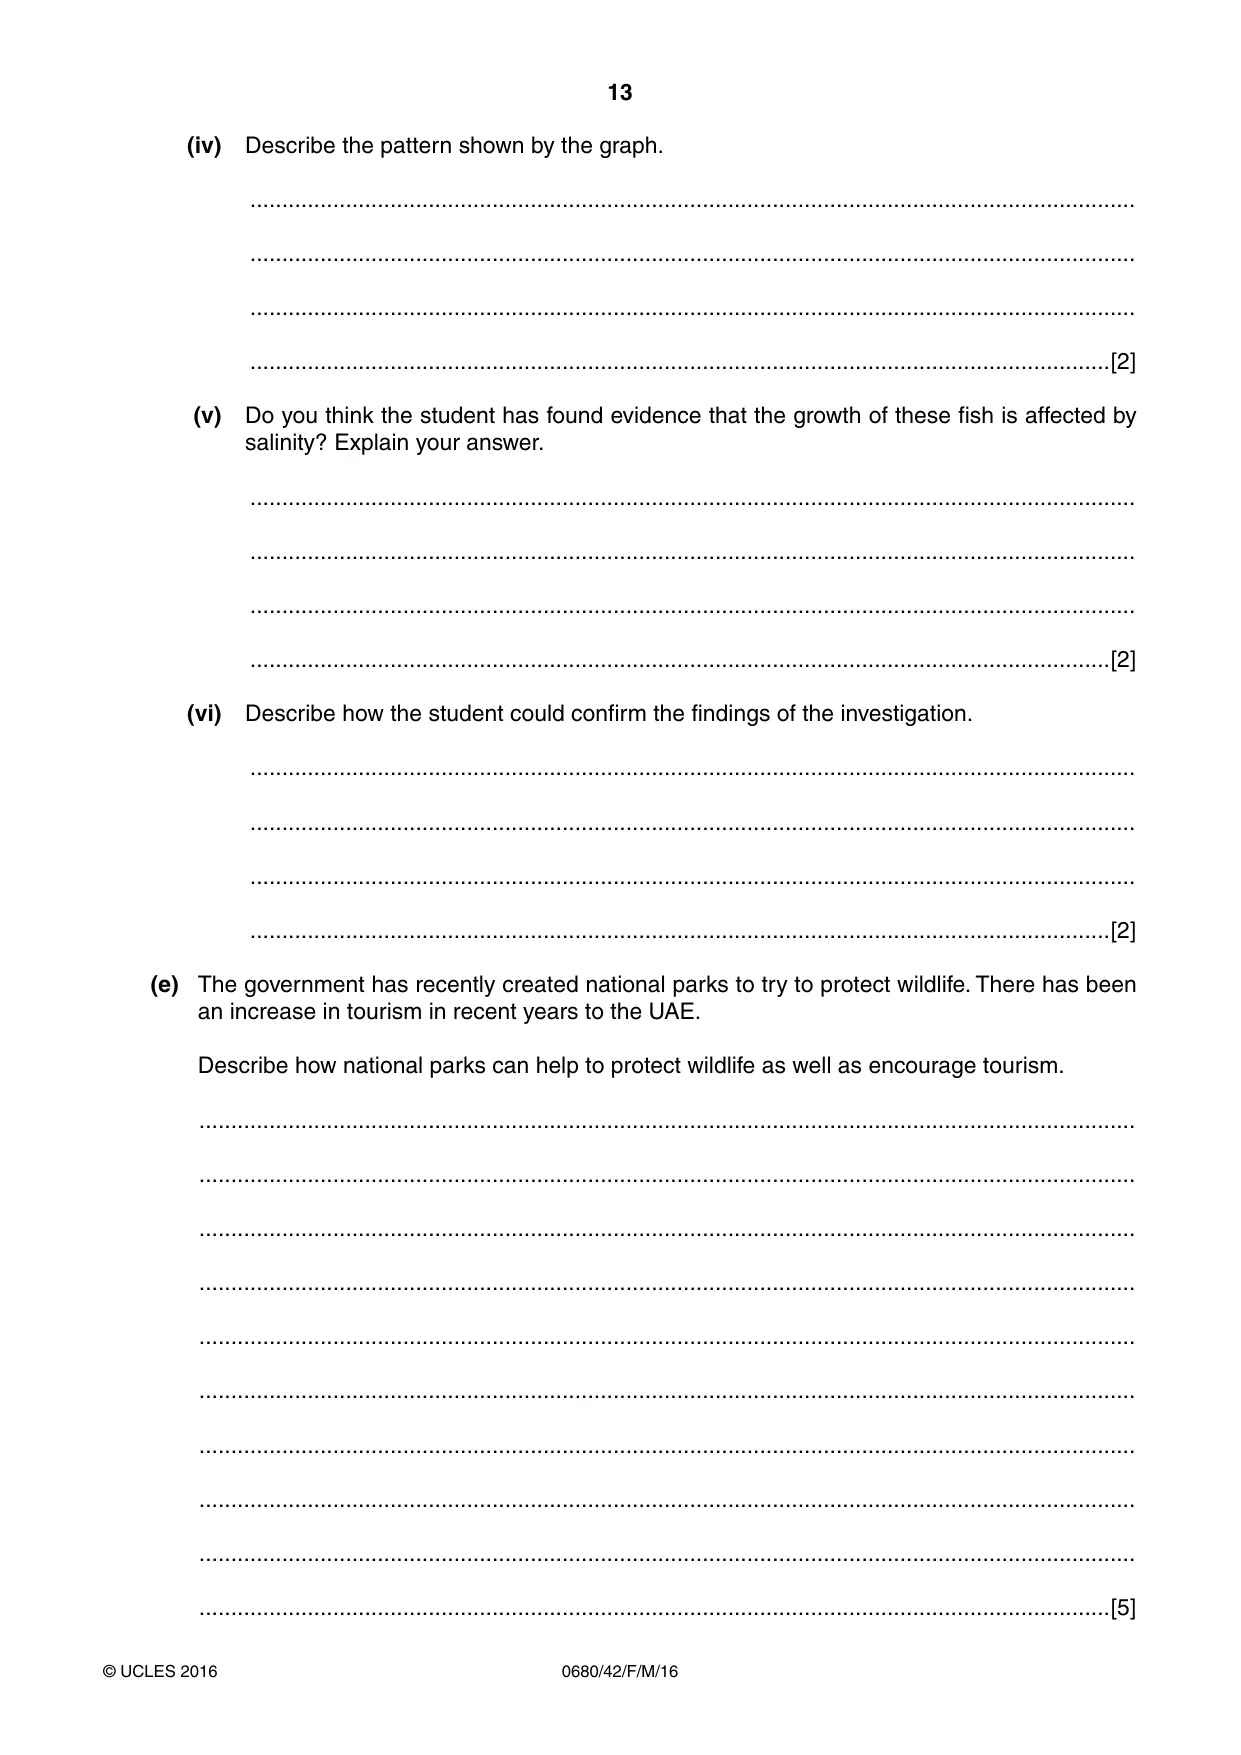
13 0680/42/F/M/16 © UCLES 2016 (iv) Describe the pattern shown by the graph. … … … …[2] (v) Do you think the student has found evidence that the growth of these fish is affected by salinity? Explain your answer. … … … …[2] (vi) Describe how the student could confirm the findings of the investigation. … … … …[2] (e) The government has recently created national parks to try to protect wildlife. There has been an increase in tourism in recent years to the UAE. Describe how national parks can help to protect wildlife as well as encourage tourism. … … … … … … … … … …[5]
Question paper, page 14
14 0680/42/F/M/16 © UCLES 2016 BLANK PAGE
Question paper, page 15
15 0680/42/F/M/16 © UCLES 2016 BLANK PAGE
Question paper, page 16
16 0680/42/F/M/16 © UCLES 2016 BLANK PAGE Permission to reproduce items where third-party owned material protected by copyright is included has been sought and cleared where possible. Every reasonable effort has been made by the publisher (UCLES) to trace copyright holders, but if any items requiring clearance have unwittingly been included, the publisher will be pleased to make amends at the earliest possible opportunity. To avoid the issue of disclosure of answer-related information to candidates, all copyright acknowledgements are reproduced online in the Cambridge International Examinations Copyright Acknowledgements Booklet. This is produced for each series of examinations and is freely available to download at www.cie.org.uk after the live examination series. Cambridge International Examinations is part of the Cambridge Assessment Group. Cambridge Assessment is the brand name of University of Cambridge Local Examinations Syndicate (UCLES), which is itself a department of the University of Cambridge.
Mark scheme, page 1
® IGCSE is the registered trademark of Cambridge International Examinations. CAMBRIDGE INTERNATIONAL EXAMINATIONS Cambridge International General Certificate of Secondary Education MARK SCHEME for the March 2016 series 0680 ENVIRONMENTAL MANAGEMENT 0680/42 Paper 4 (Alternative to Coursework), maximum raw mark 60 This mark scheme is published as an aid to teachers and candidates, to indicate the requirements of the examination. It shows the basis on which Examiners were instructed to award marks. It does not indicate the details of the discussions that took place at an Examiners’ meeting before marking began, which would have considered the acceptability of alternative answers. Mark schemes should be read in conjunction with the question paper and the Principal Examiner Report for Teachers. Cambridge will not enter into discussions about these mark schemes. Cambridge is publishing the mark schemes for the March 2016 series for most Cambridge IGCSE® and Cambridge International A and AS Level components.
Mark scheme, page 2
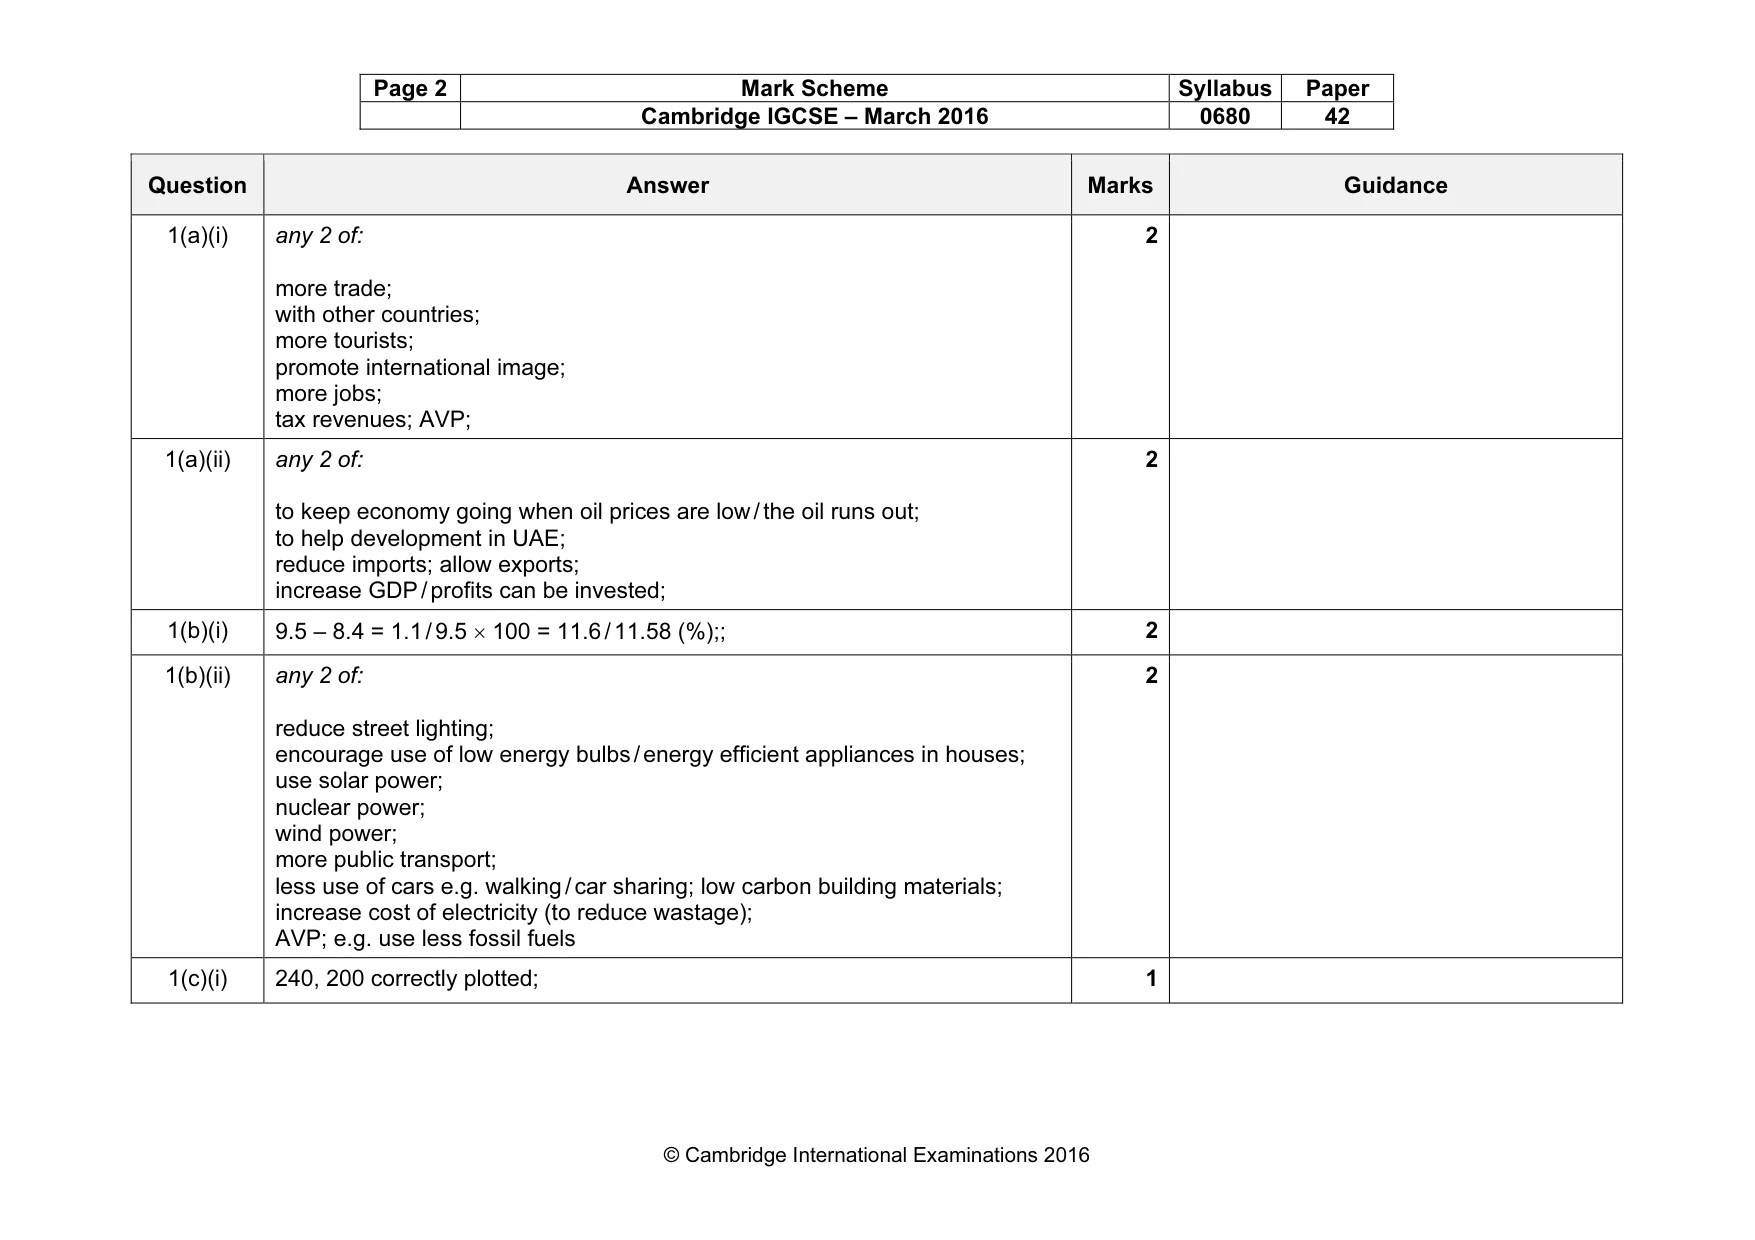
Page 2 Mark Scheme Syllabus Paper Cambridge IGCSE – March 2016 0680 42 © Cambridge International Examinations 2016 Question Answer Marks Guidance 1(a)(i) any 2 of: more trade; with other countries; more tourists; promote international image; more jobs; tax revenues; AVP; 2 1(a)(ii) any 2 of: to keep economy going when oil prices are low / the oil runs out; to help development in UAE; reduce imports; allow exports; increase GDP / profits can be invested; 2 1(b)(i) 9.5 – 8.4 = 1.1 / 9.5 × 100 = 11.6 / 11.58 (%);; 2 1(b)(ii) any 2 of: reduce street lighting; encourage use of low energy bulbs / energy efficient appliances in houses; use solar power; nuclear power; wind power; more public transport; less use of cars e.g. walking / car sharing; low carbon building materials; increase cost of electricity (to reduce wastage); AVP; e.g. use less fossil fuels 2 1(c)(i) 240, 200 correctly plotted; 1
Mark scheme, page 3
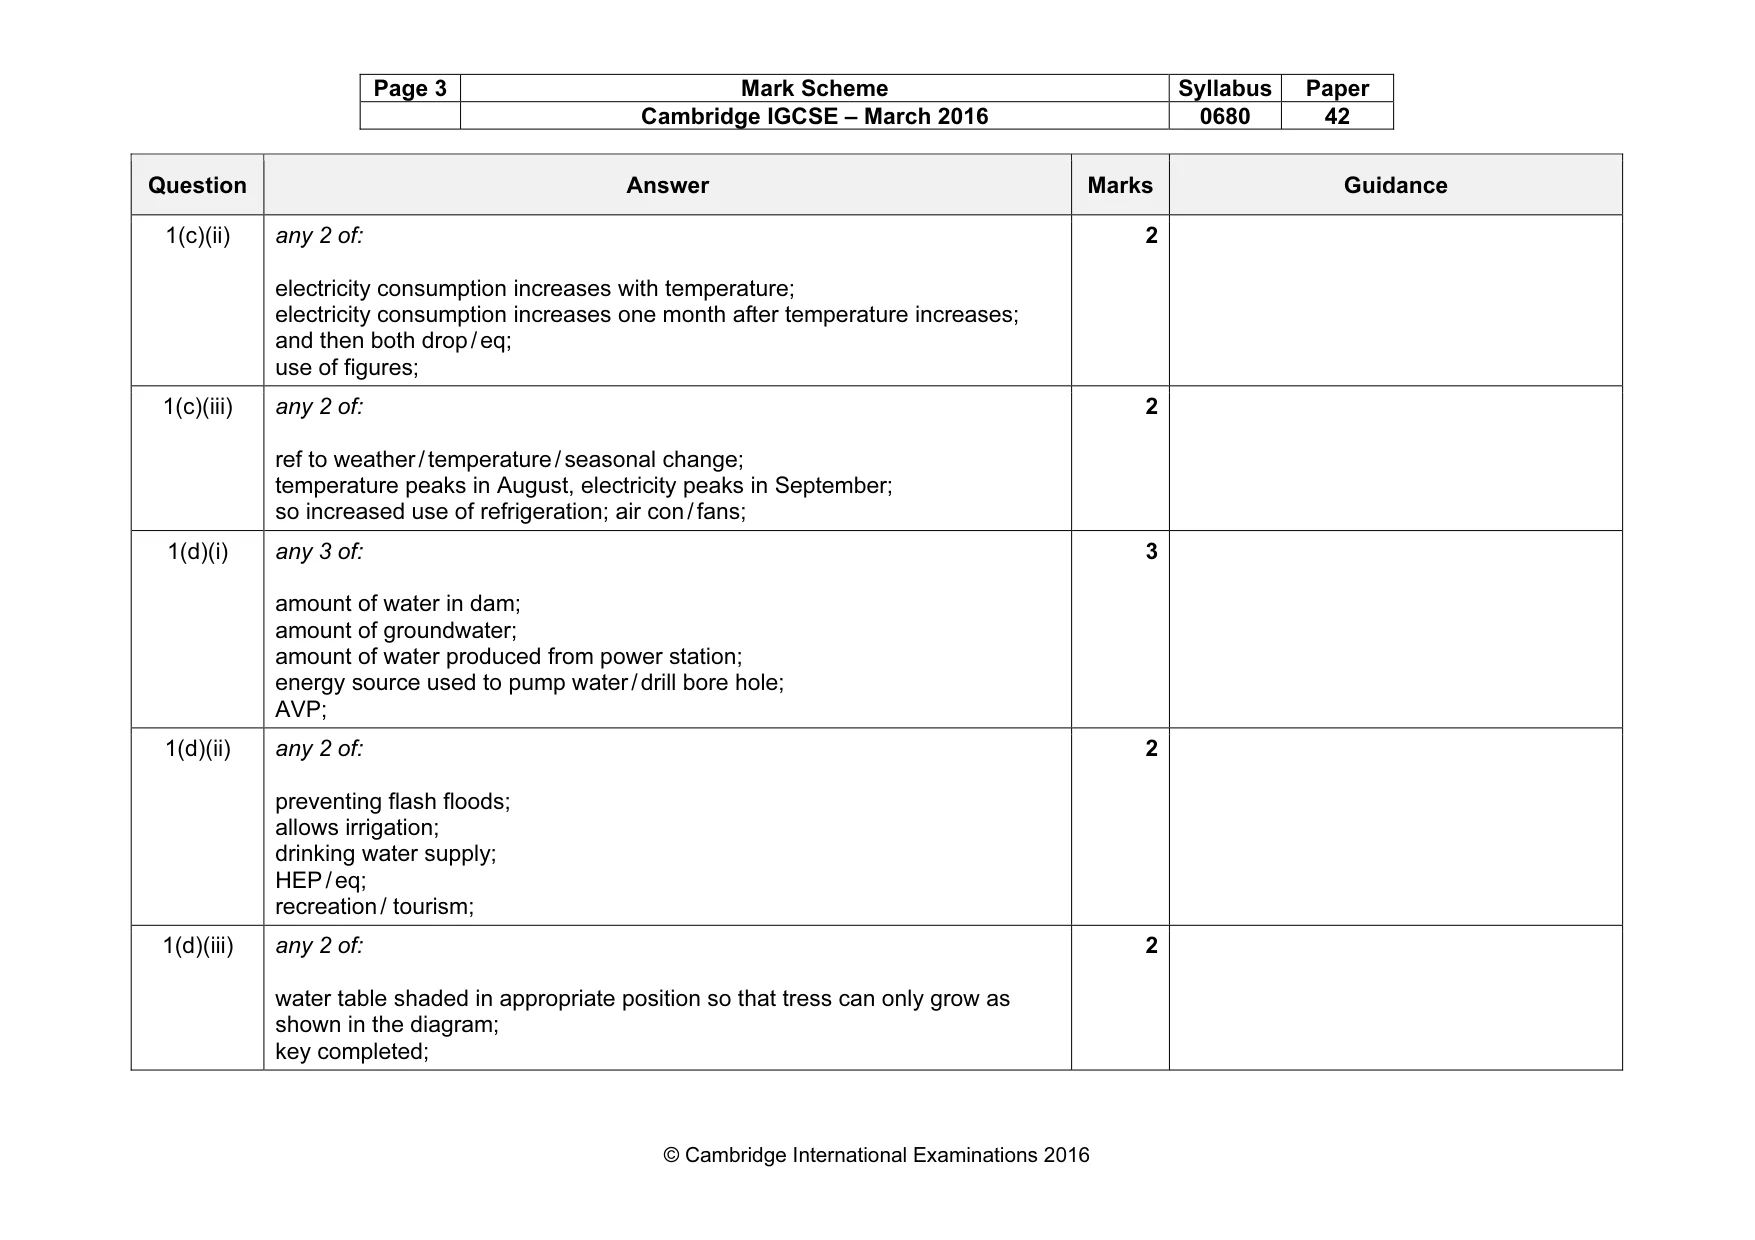
Page 3 Mark Scheme Syllabus Paper Cambridge IGCSE – March 2016 0680 42 © Cambridge International Examinations 2016 Question Answer Marks Guidance 1(c)(ii) any 2 of: electricity consumption increases with temperature; electricity consumption increases one month after temperature increases; and then both drop / eq; use of figures; 2 1(c)(iii) any 2 of: ref to weather / temperature / seasonal change; temperature peaks in August, electricity peaks in September; so increased use of refrigeration; air con / fans; 2 1(d)(i) any 3 of: amount of water in dam; amount of groundwater; amount of water produced from power station; energy source used to pump water / drill bore hole; AVP; 3 1(d)(ii) any 2 of: preventing flash floods; allows irrigation; drinking water supply; HEP / eq; recreation / tourism; 2 1(d)(iii) any 2 of: water table shaded in appropriate position so that tress can only grow as shown in the diagram; key completed; 2
Mark scheme, page 4
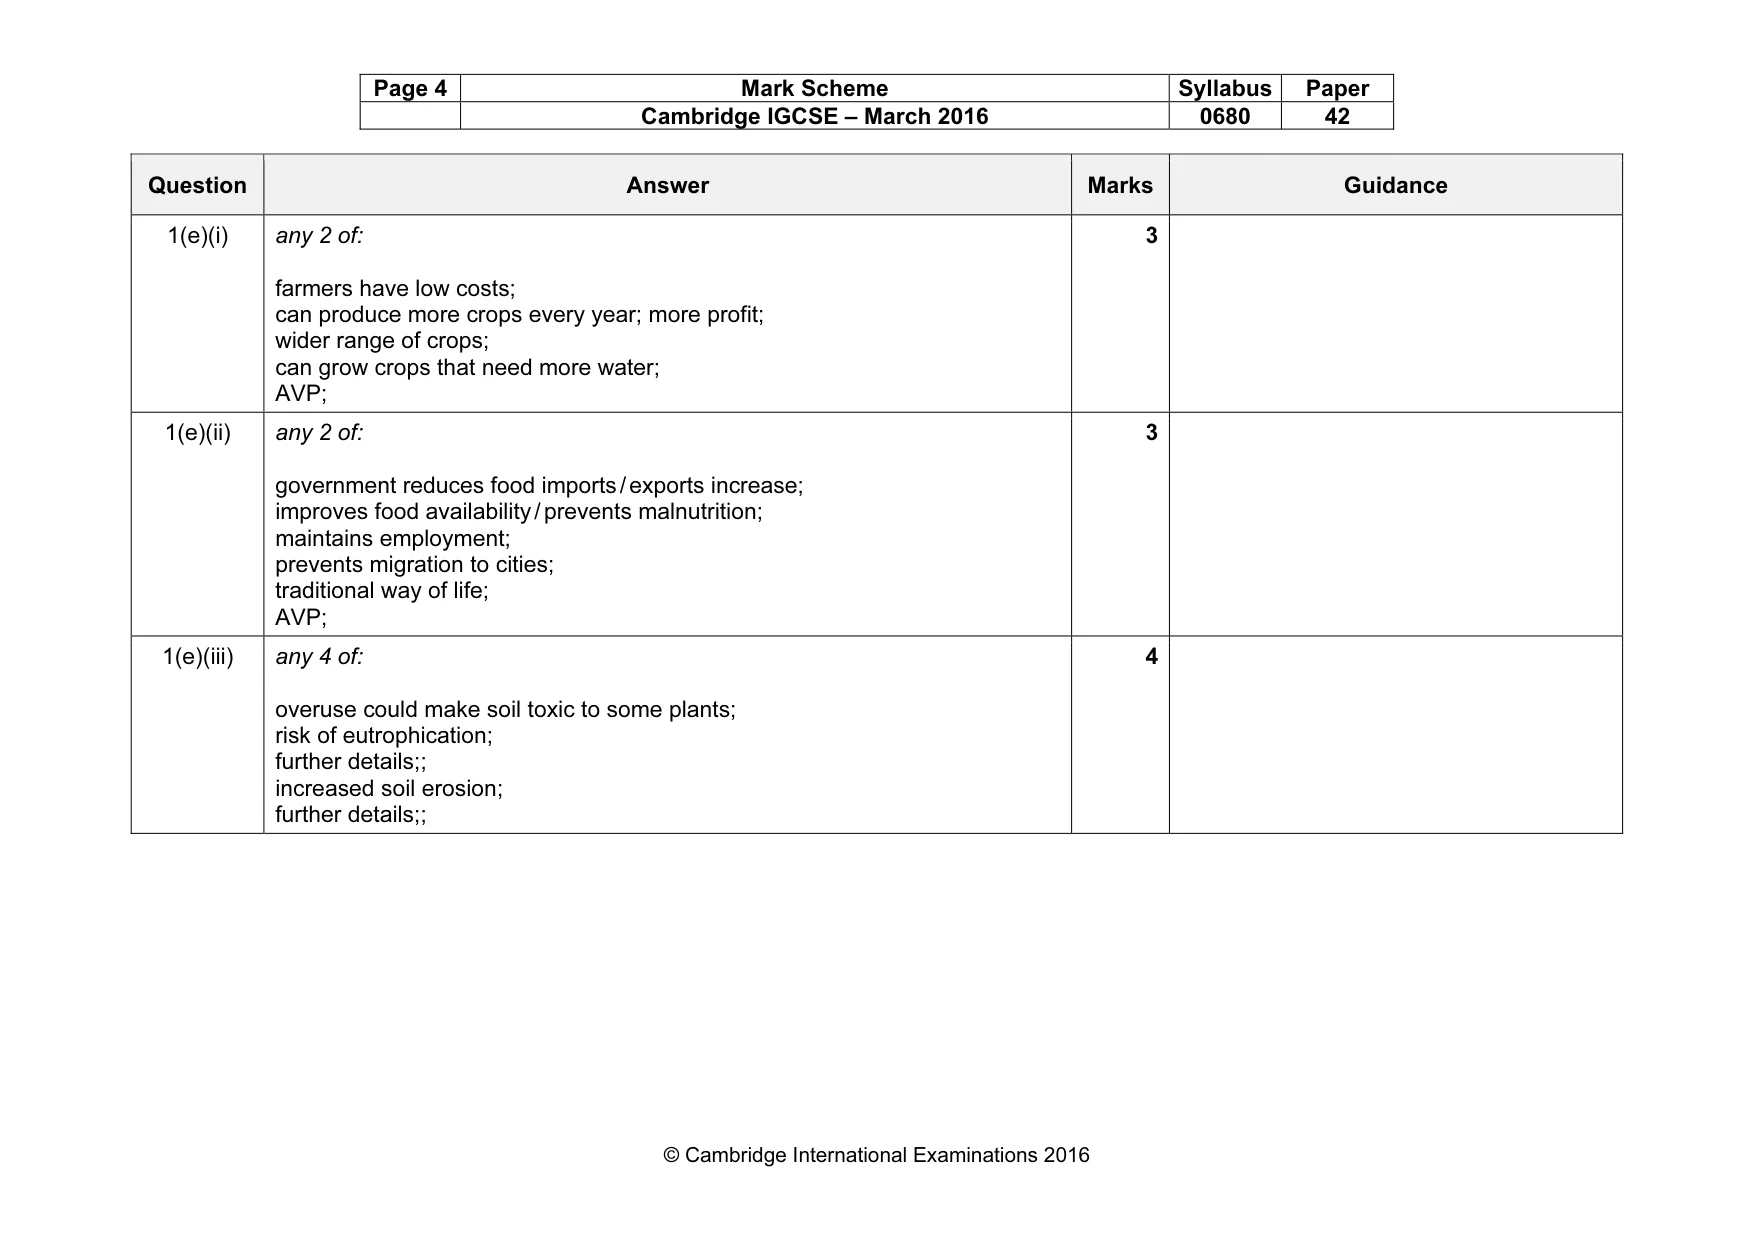
Page 4 Mark Scheme Syllabus Paper Cambridge IGCSE – March 2016 0680 42 © Cambridge International Examinations 2016 Question Answer Marks Guidance 1(e)(i) any 2 of: farmers have low costs; can produce more crops every year; more profit; wider range of crops; can grow crops that need more water; AVP; 3 1(e)(ii) any 2 of: government reduces food imports / exports increase; improves food availability / prevents malnutrition; maintains employment; prevents migration to cities; traditional way of life; AVP; 3 1(e)(iii) any 4 of: overuse could make soil toxic to some plants; risk of eutrophication; further details;; increased soil erosion; further details;; 4
Mark scheme, page 5
Page 5 Mark Scheme Syllabus Paper Cambridge IGCSE – March 2016 0680 42 © Cambridge International Examinations 2016 Question Answer Marks Guidance 2(a)(i) producer; consumer; 2 2(a)(ii) April–September; 1 2(a)(iii) August; highest temperature / 30 °C means more energy to turn water into vapour / eq; 2 2(a)(iv) any 2 of: increase awareness of species / educate people; encourages laws to protect species; helps conservation efforts; raise more money; set up nature reserves; AVP; 2 2(b)(i) 5.9; 113; 2 2(b)(ii) the only factor that changes / has large range / eq is salinity: 1 2(c)(i) more fish; longer / bigger fish; more representative sample / eq; 2 2(c)(ii) place fish on a measuring board / gridded background / (mm) scale / with a ruler / eq; 1 2(d)(i) both axes labels completed;; plots;; 4 2(d)(ii) 55 (mm); 1 2(d)(iii) circle around 52; 1 2(d)(iv) fish length drops as salinity increases; then little or no change (between 107 / 130–144 / eq); 2
Mark scheme, page 6
Page 6 Mark Scheme Syllabus Paper Cambridge IGCSE – March 2016 0680 42 © Cambridge International Examinations 2016 Question Answer Marks Guidance 2(d)(v) yes – the graph shows fish grow less in pools with high(er) salinity / ORA; data quoted to support argument; 2 2(d)(iv) any 2 of: repeat the experiment ( in the same river); in more pools; at another time / season / following year; repeat in other rivers; laboratory experiment in fish tanks; keep all other variables the same / controlled experiment; 2 2(e) any 5 of: protecting wildlife laws to prevent catching / killing animals; or picking plants; park rangers / patrols to enforce laws; prevent / limit / control development in NP; so preventing habitat destruction; AVP; encourage tourism UAE has wildlife people want to see; (eco)tourists money helps to conserve wildlife; National Park maintained due to tourism; guides educate tourists / prevent tourists damaging environment; locals support tourism and NP as they gain income; AVP; 5
What you needed in this session
Cambridge’s own grade thresholds for 2016 Feb/March, Paper 4 · Variant 2. A higher threshold means an easier paper — the bar moves with how the cohort did.