Cambridge IGCSE Environmental Management 0680 — 2016 Oct/Nov Paper 4 · Variant 1
0680/41/O/N/16 · 60 marks · ≈68 min
The question paper and its mark scheme, free to read here and free to download. This is Cambridge’s own paper, exactly as it was sat.
Question paper16 pages



Mark scheme6 pages
Answers below. Sit the paper first if you are practising.
Paper as text
Question paper, page 1
This document consists of 14 printed pages and 2 blank pages. DC (LK/FD) 133519 © UCLES 2016 [Turn over Cambridge International Examinations Cambridge International General Certificate of Secondary Education * 7 4 8 6 7 2 1 7 7 9 * ENVIRONMENTAL MANAGEMENT 0680/41 Paper 4 October/November 2016 1 hour 30 minutes Candidates answer on the Question Paper. No Additional Materials are required. READ THESE INSTRUCTIONS FIRST Write your Centre number, candidate number and name on all the work you hand in. Write in dark blue or black pen. You may use an HB pencil for any diagrams or graphs. Do not use staples, paper clips, glue or correction fluid. DO NOT WRITE IN ANY BARCODES. Answer all questions. Electronic calculators may be used. You may lose marks if you do not show your working or if you do not use appropriate units. Study the appropriate source materials before you start to write your answers. Credit will be given for appropriate selection and use of data in your answers and for relevant interpretation of these data. Suggestions for data sources are given in some questions. You may use the source data to draw diagrams and graphs or to do calculations to illustrate your answers. At the end of the examination, fasten all your work securely together. The number of marks is given in brackets [ ] at the end of each question or part question.
Question paper, page 2
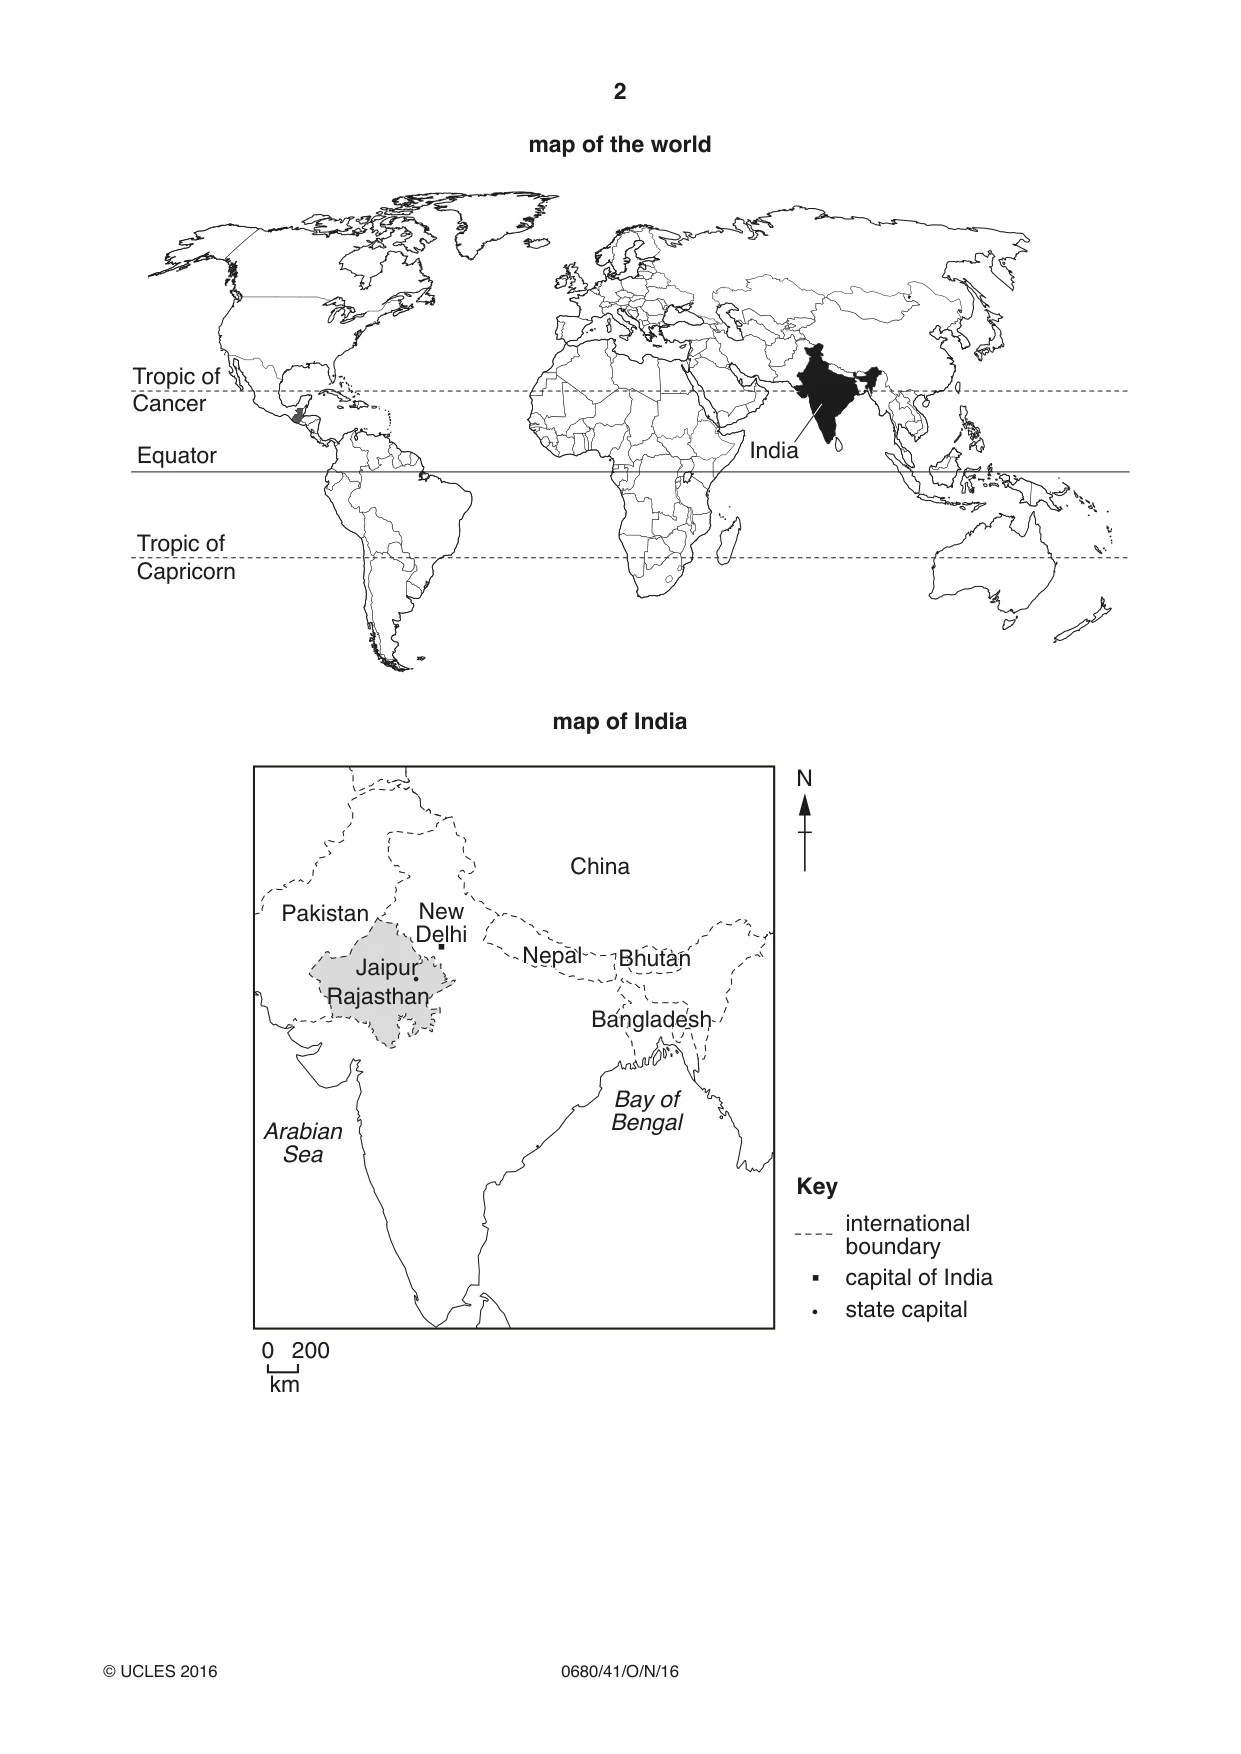
2 0680/41/O/N/16 © UCLES 2016 map of the world Equator Tropic of Capricorn Tropic of Cancer India map of India international boundary Key capital of India state capital N Bay of Bengal Arabian Sea Pakistan China Nepal Nepal Bhutan Bhutan Bangladesh Bangladesh Rajasthan Rajasthan Jaipur New Delhi New Delhi 0 200 km
Question paper, page 3
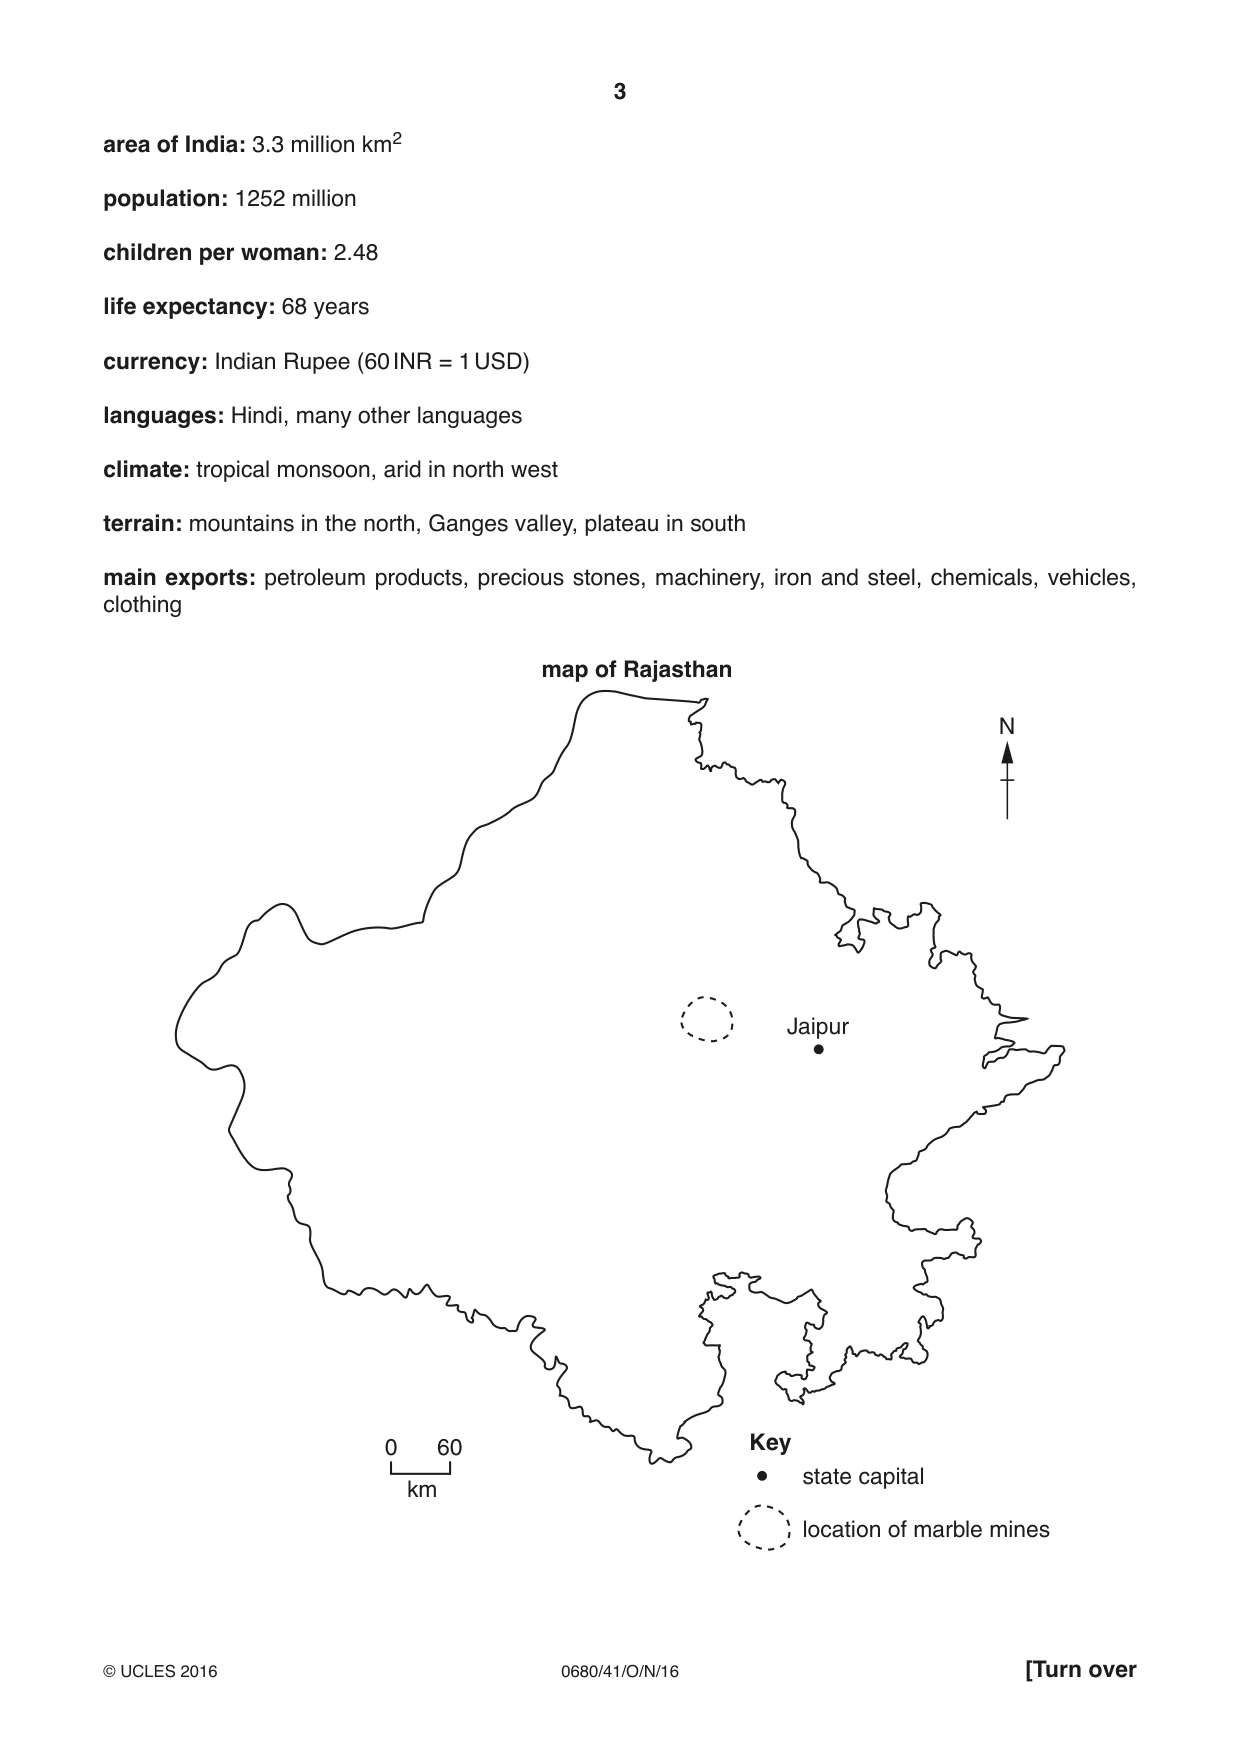
3 0680/41/O/N/16 © UCLES 2016 [Turn over area of India: 3.3 million km2 population: 1252 million children per woman: 2.48 life expectancy: 68 years currency: Indian Rupee (60 INR = 1 USD) languages: Hindi, many other languages climate: tropical monsoon, arid in north west terrain: mountains in the north, Ganges valley, plateau in south main exports: petroleum products, precious stones, machinery, iron and steel, chemicals, vehicles, clothing 0 60 km Jaipur state capital Key map of Rajasthan location of marble mines N
Question paper, page 4
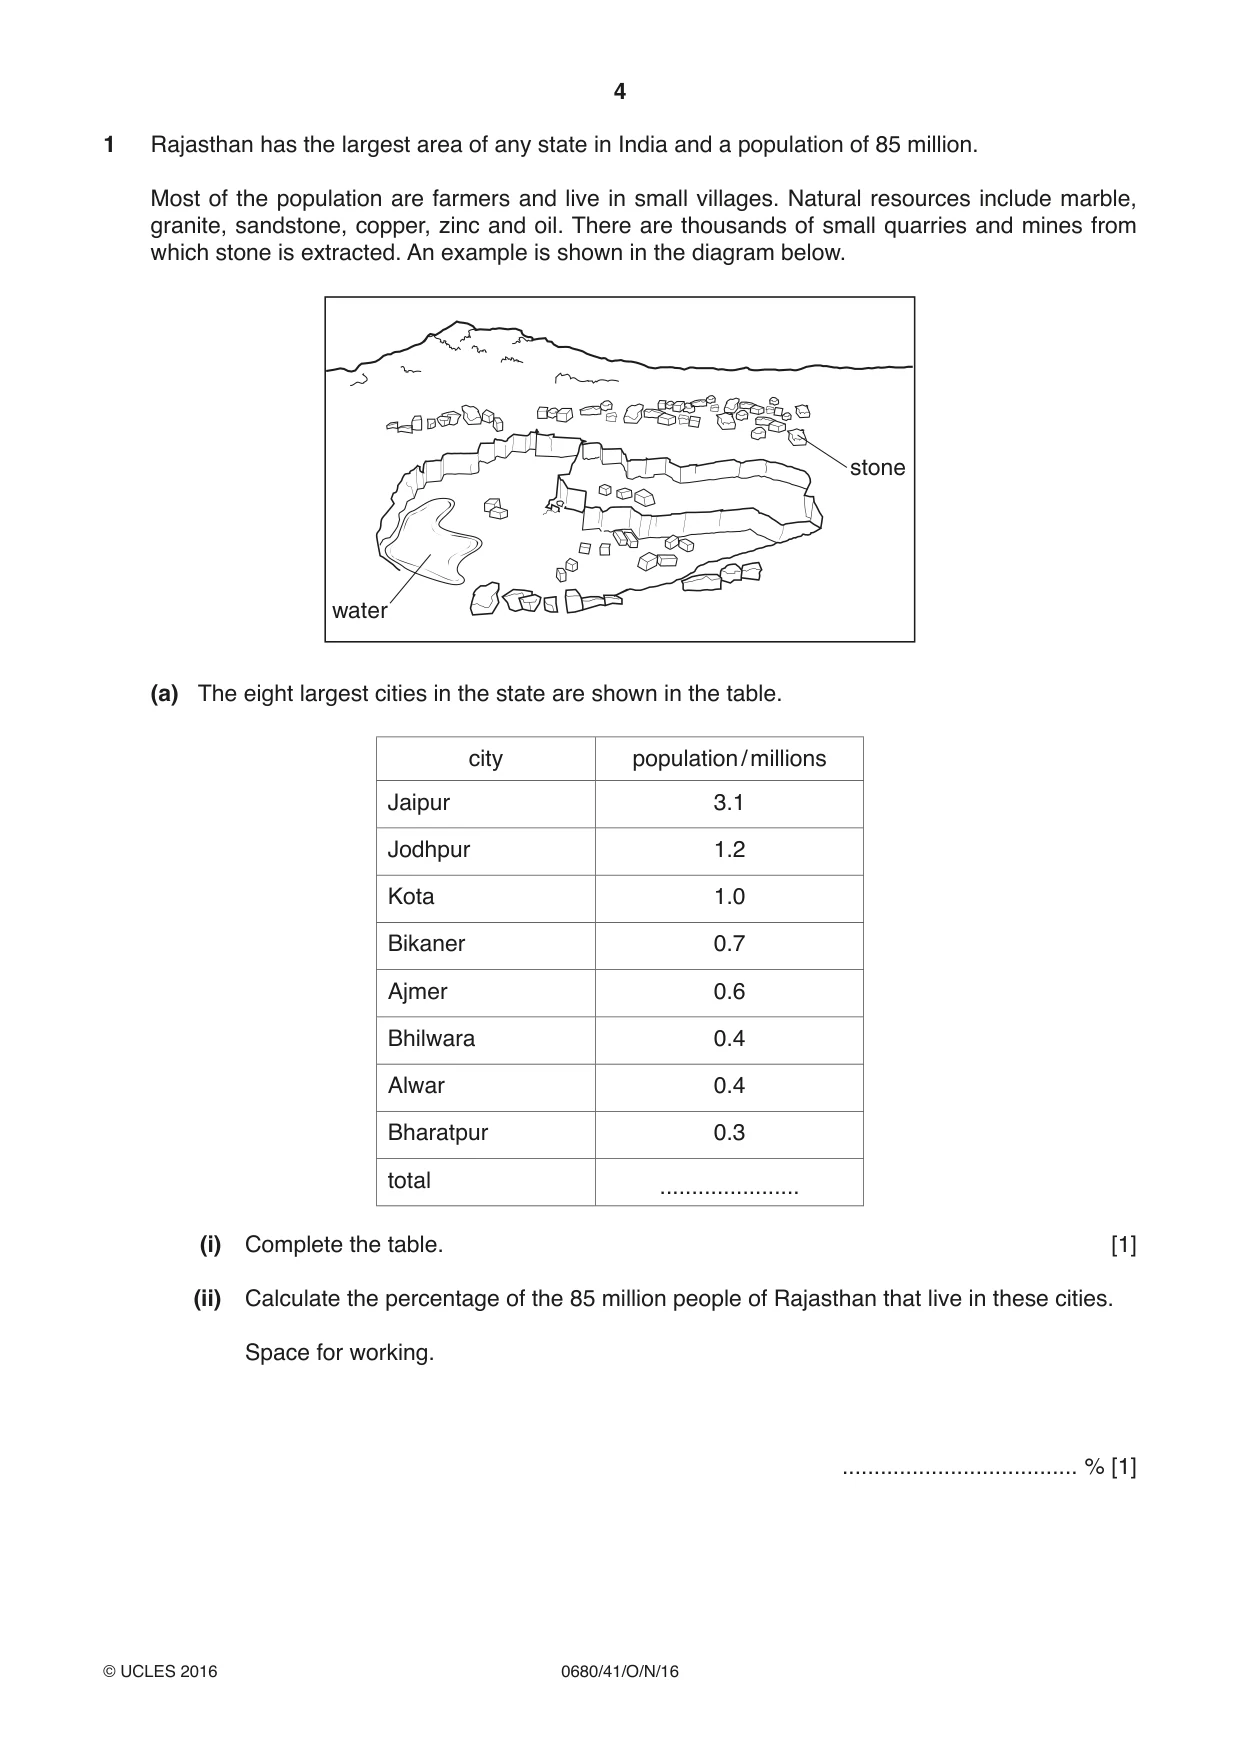
4 0680/41/O/N/16 © UCLES 2016 1 Rajasthan has the largest area of any state in India and a population of 85 million. Most of the population are farmers and live in small villages. Natural resources include marble, granite, sandstone, copper, zinc and oil. There are thousands of small quarries and mines from which stone is extracted. An example is shown in the diagram below. stone water (a) The eight largest cities in the state are shown in the table. city population / millions Jaipur 3.1 Jodhpur 1.2 Kota 1.0 Bikaner 0.7 Ajmer 0.6 Bhilwara 0.4 Alwar 0.4 Bharatpur 0.3 total … (i) Complete the table. [1] (ii) Calculate the percentage of the 85 million people of Rajasthan that live in these cities. Space for working. … % [1]
Question paper, page 5
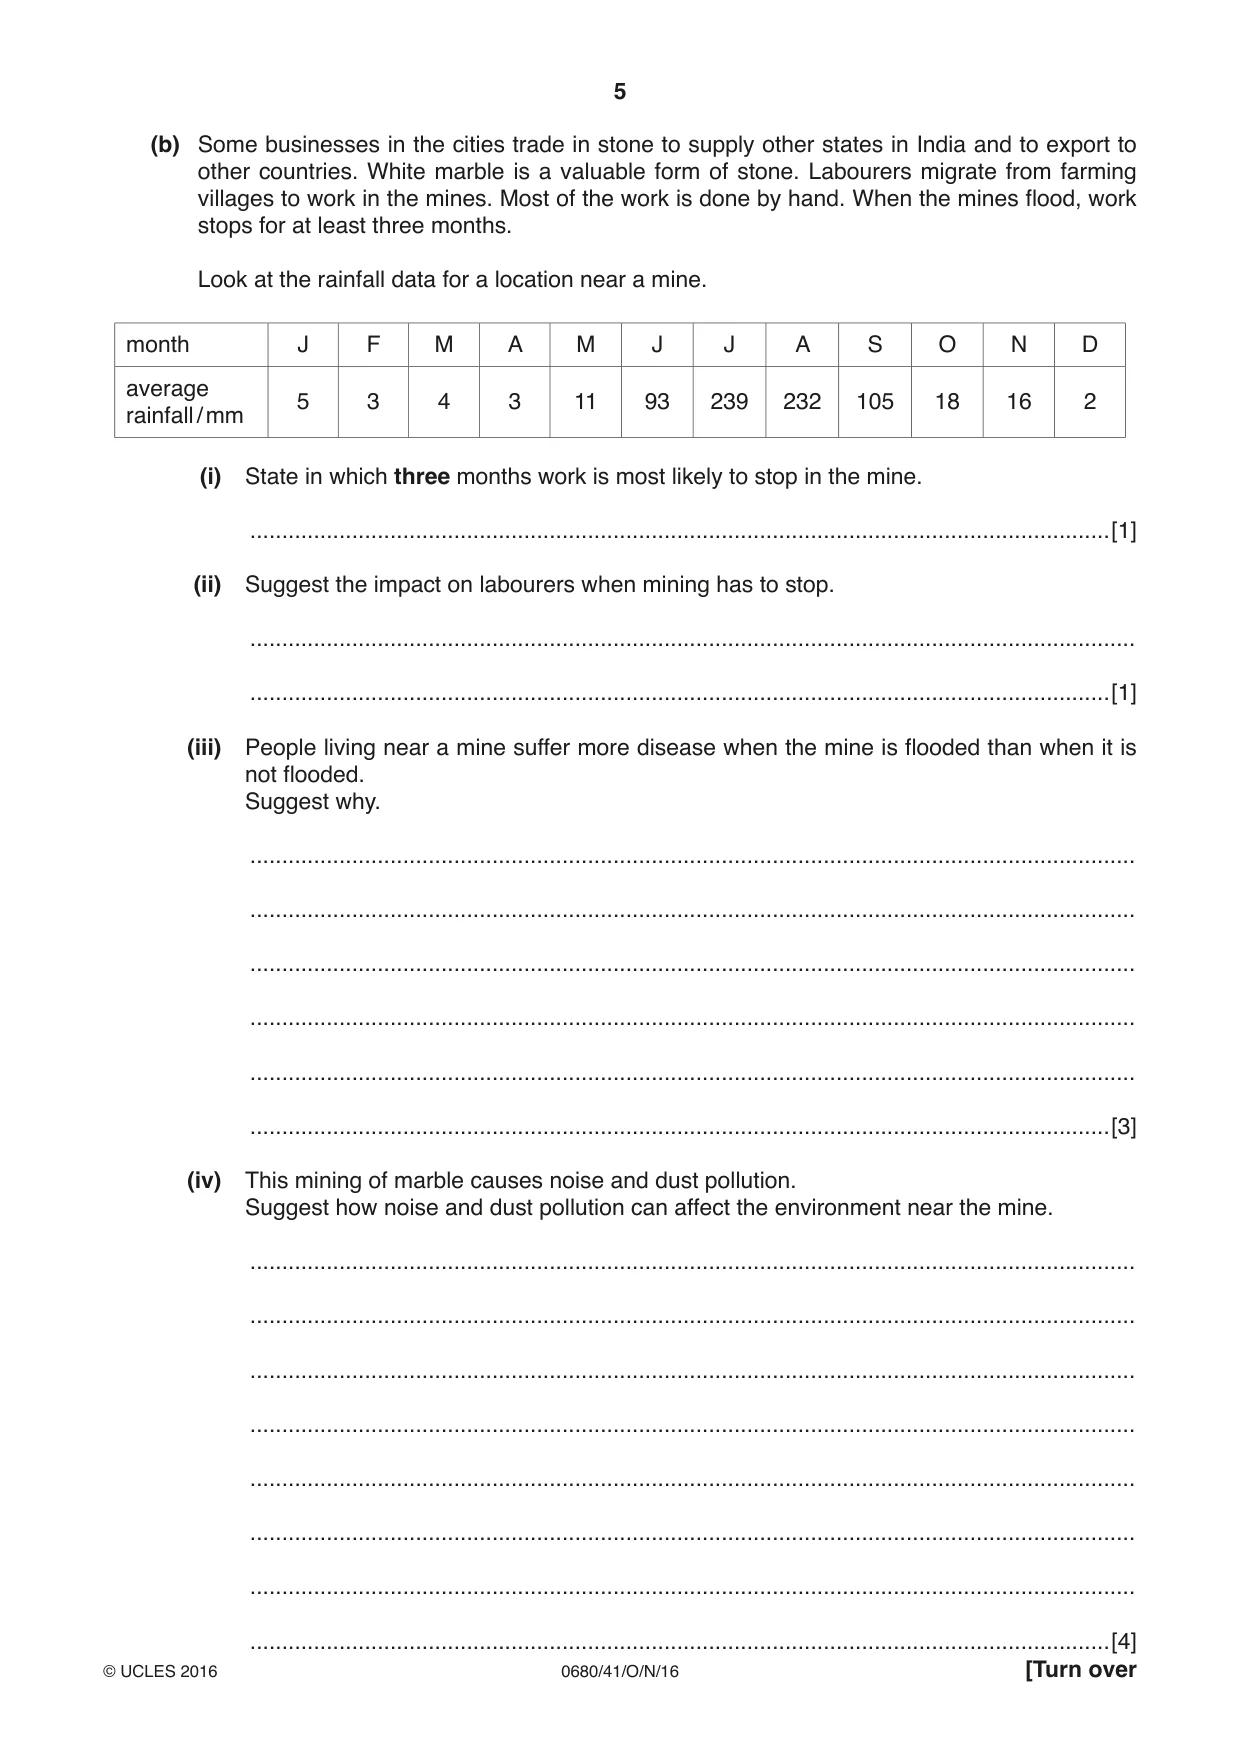
5 0680/41/O/N/16 © UCLES 2016 [Turn over (b) Some businesses in the cities trade in stone to supply other states in India and to export to other countries. White marble is a valuable form of stone. Labourers migrate from farming villages to work in the mines. Most of the work is done by hand. When the mines flood, work stops for at least three months. Look at the rainfall data for a location near a mine. month J F M A M J J A S O N D average rainfall / mm 5 3 4 3 11 93 239 232 105 18 16 2 (i) State in which three months work is most likely to stop in the mine. …[1] (ii) Suggest the impact on labourers when mining has to stop. … …[1] (iii) People living near a mine suffer more disease when the mine is flooded than when it is not flooded. Suggest why. … … … … … …[3] (iv) This mining of marble causes noise and dust pollution. Suggest how noise and dust pollution can affect the environment near the mine. … … … … … … … …[4]
Question paper, page 6
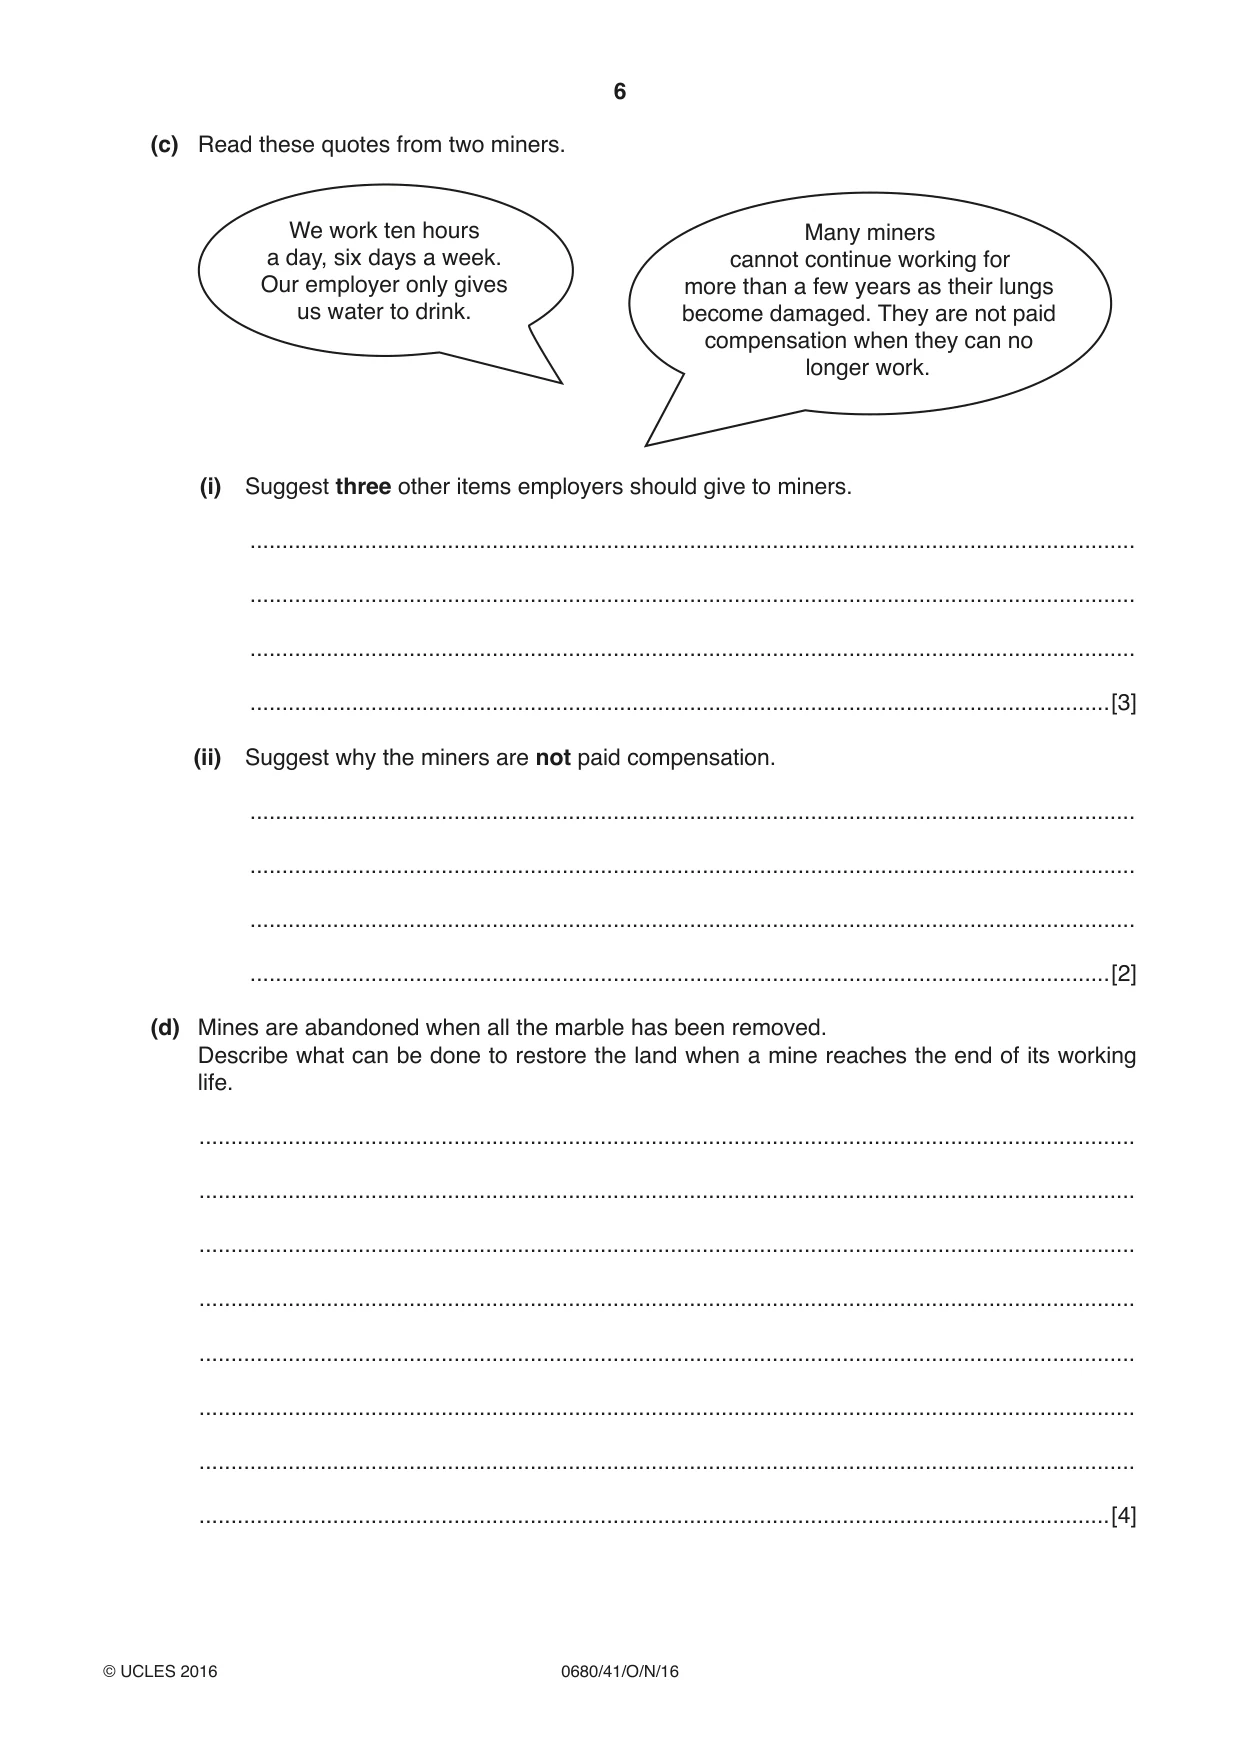
6 0680/41/O/N/16 © UCLES 2016 (c) Read these quotes from two miners. We work ten hours a day, six days a week. Our employer only gives us water to drink. Many miners cannot continue working for more than a few years as their lungs become damaged. They are not paid compensation when they can no longer work. (i) Suggest three other items employers should give to miners. … … … …[3] (ii) Suggest why the miners are not paid compensation. … … … …[2] (d) Mines are abandoned when all the marble has been removed. Describe what can be done to restore the land when a mine reaches the end of its working life. … … … … … … … …[4]
Question paper, page 7
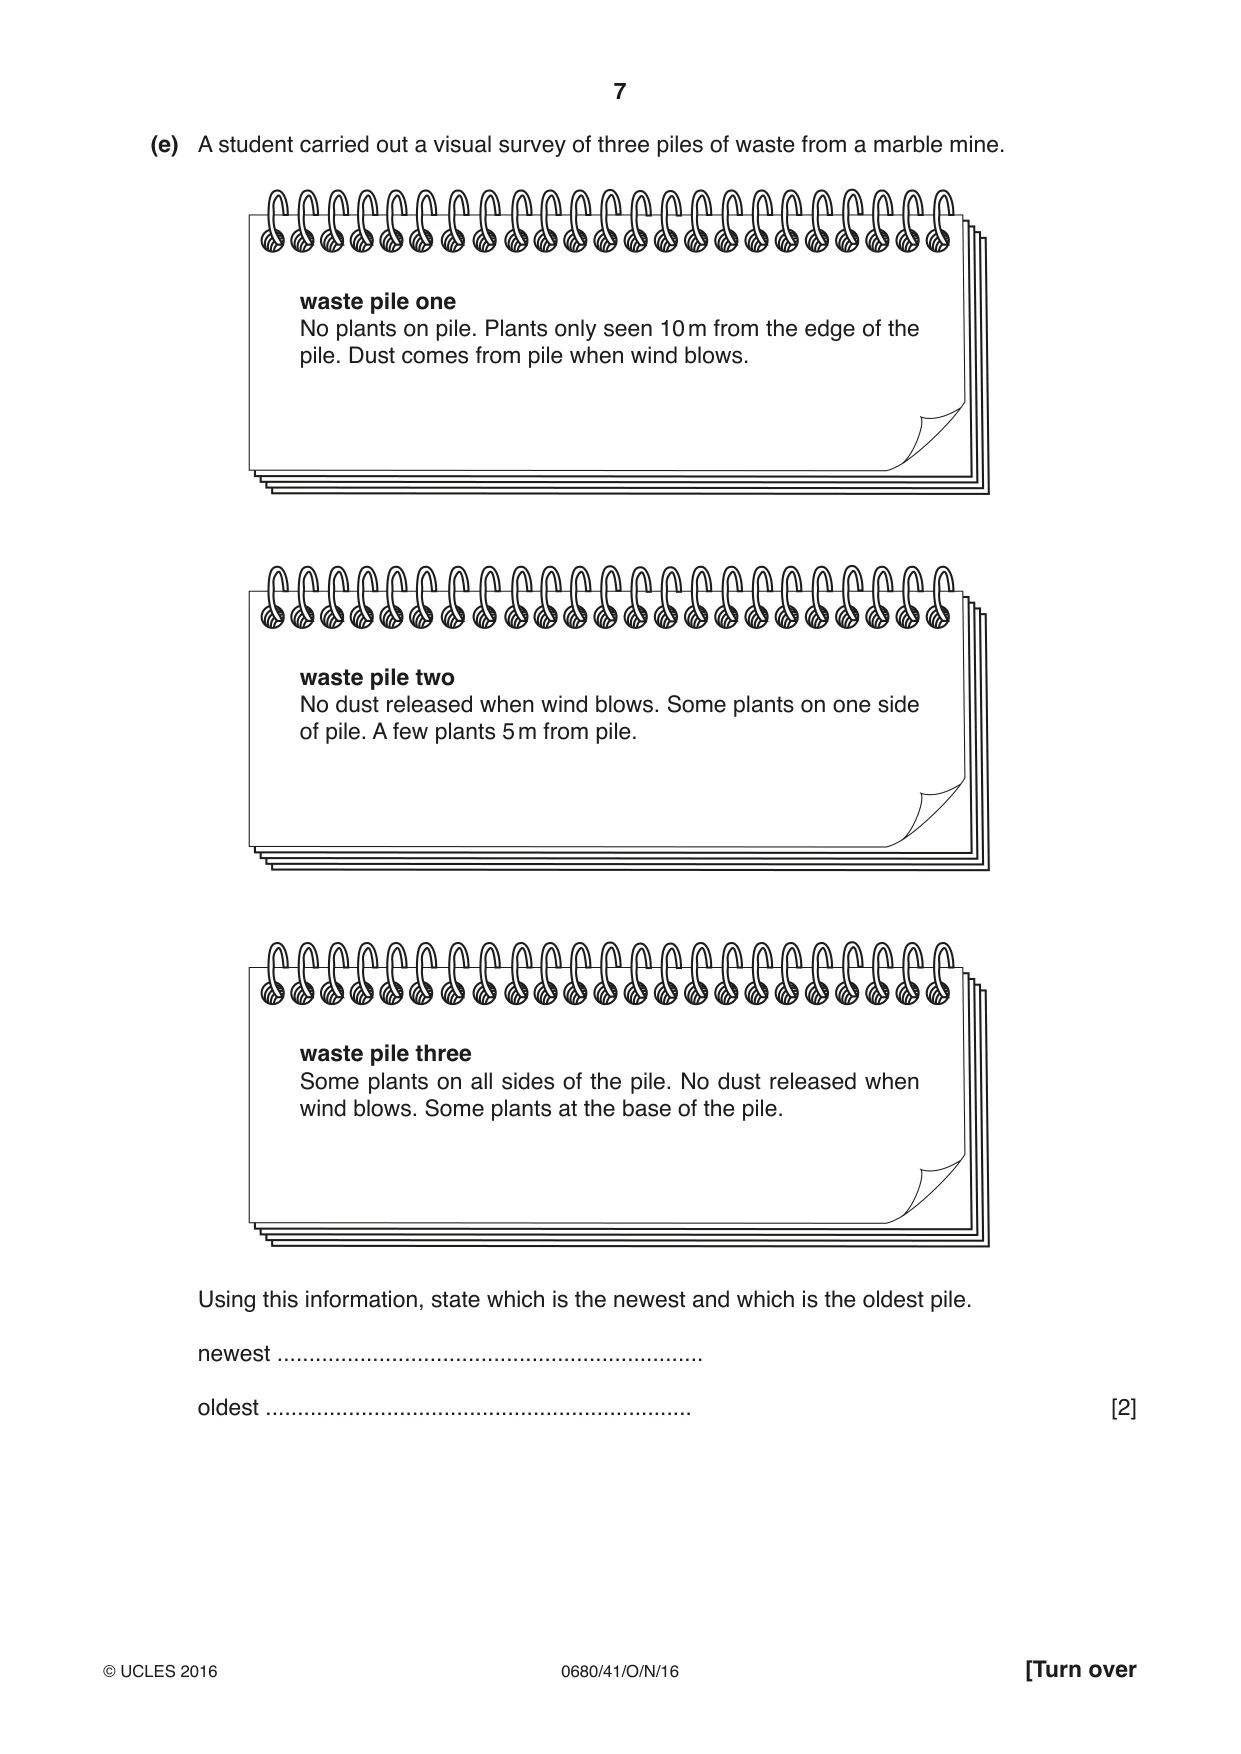
7 0680/41/O/N/16 © UCLES 2016 [Turn over (e) A student carried out a visual survey of three piles of waste from a marble mine. waste pile one No plants on pile. Plants only seen 10 m from the edge of the pile. Dust comes from pile when wind blows. waste pile two No dust released when wind blows. Some plants on one side of pile. A few plants 5 m from pile. waste pile three Some plants on all sides of the pile. No dust released when wind blows. Some plants at the base of the pile. Using this information, state which is the newest and which is the oldest pile. newest … oldest … [2]
Question paper, page 8
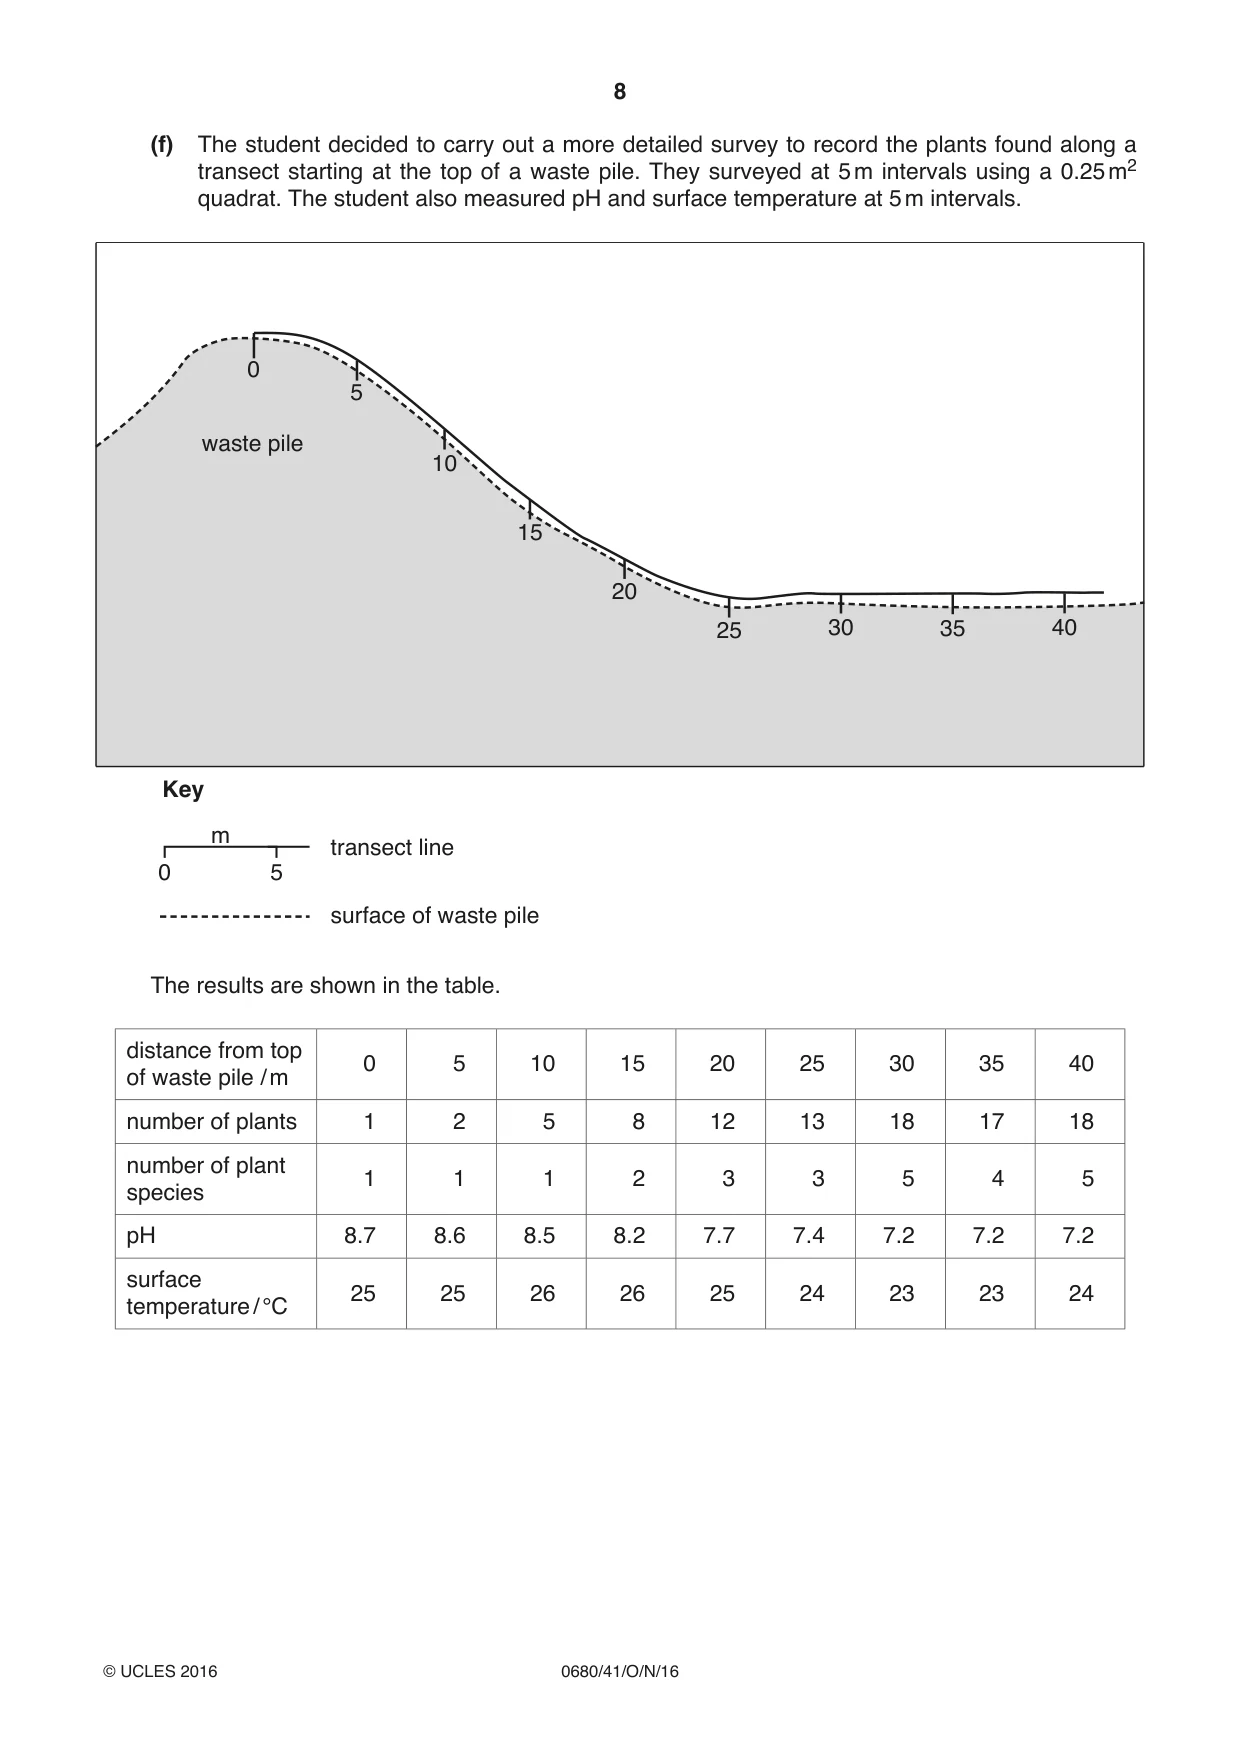
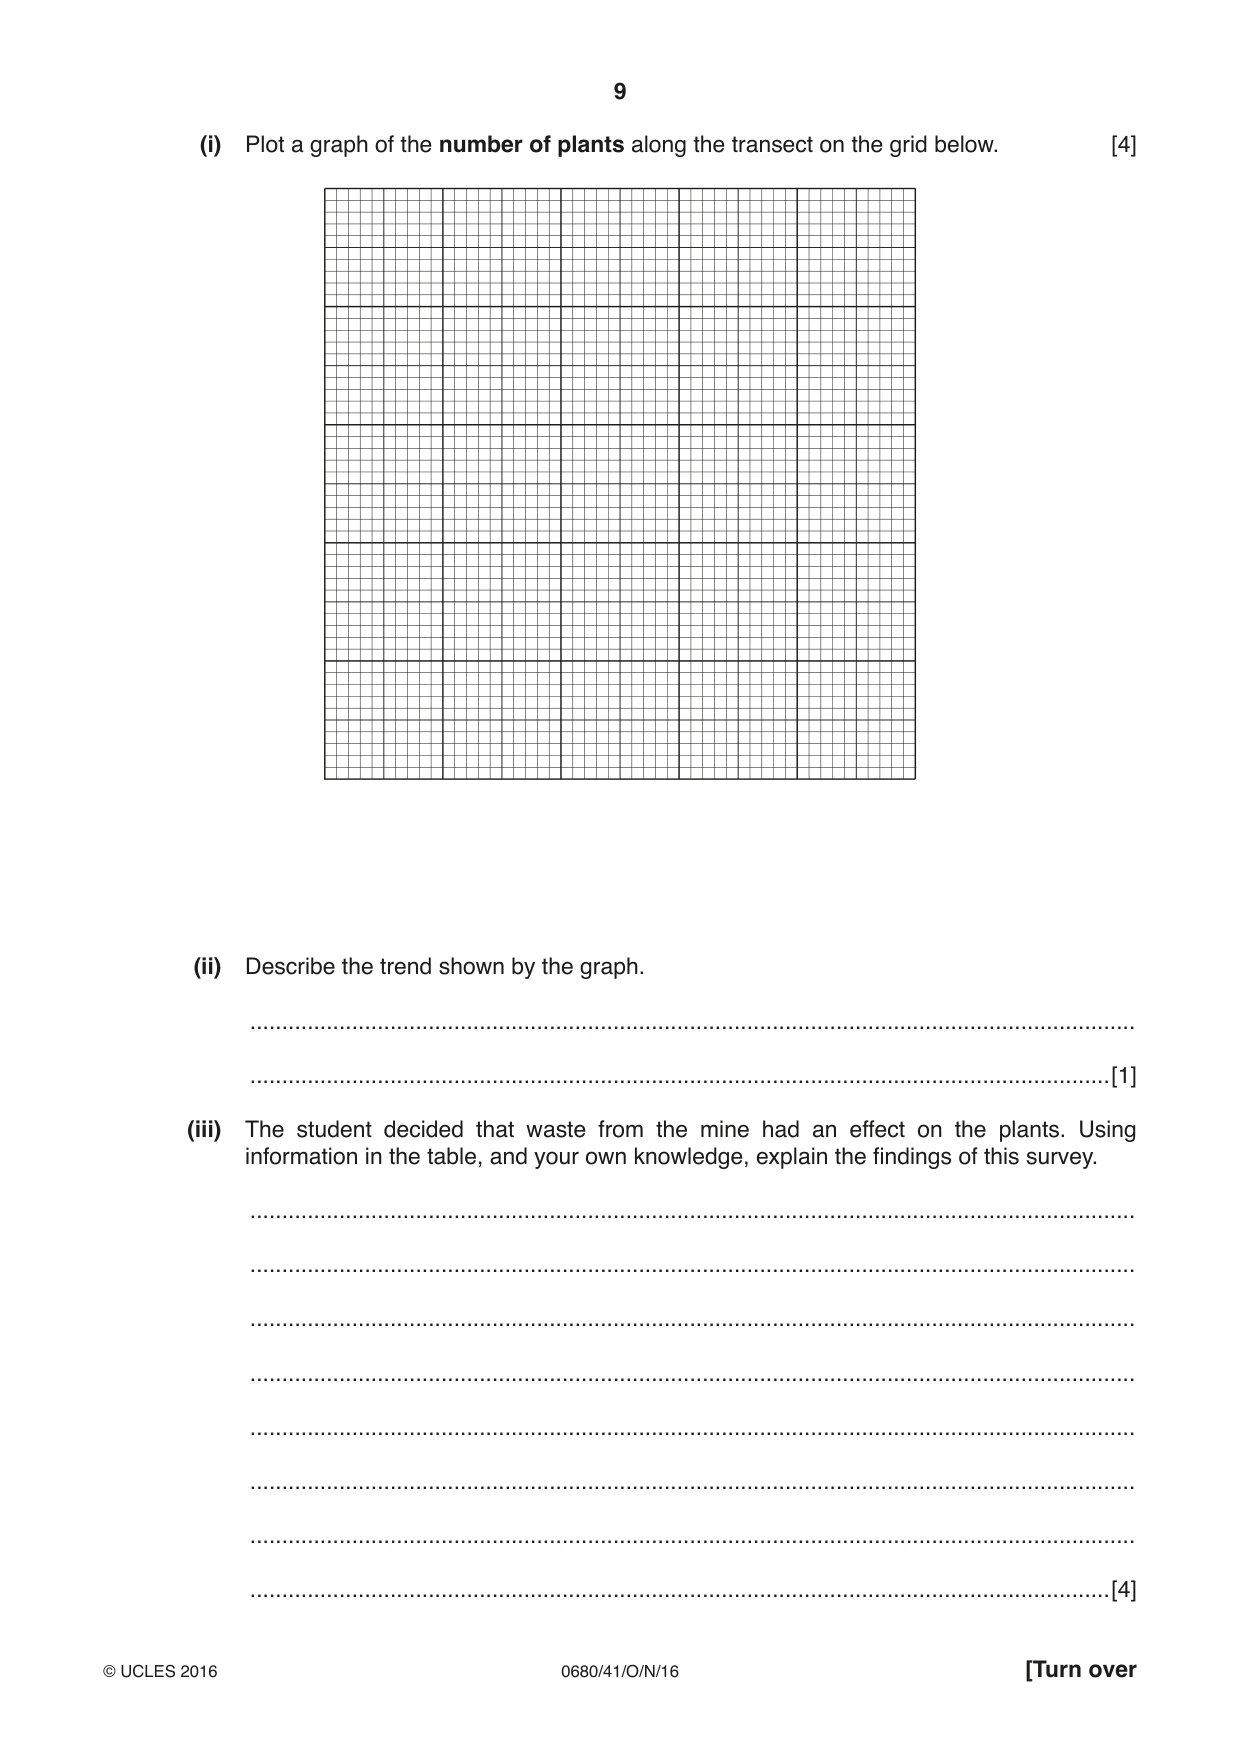
8 0680/41/O/N/16 © UCLES 2016 (f) The student decided to carry out a more detailed survey to record the plants found along a transect starting at the top of a waste pile. They surveyed at 5 m intervals using a 0.25 m2 quadrat. The student also measured pH and surface temperature at 5 m intervals. 0 5 10 15 20 25 30 35 40 0 5 transect line Key surface of waste pile waste pile m The results are shown in the table. distance from top of waste pile / m 0 5 10 15 20 25 30 35 40 number of plants 1 2 5 8 12 13 18 17 18 number of plant species 1 1 1 2 3 3 5 4 5 pH 8.7 8.6 8.5 8.2 7.7 7.4 7.2 7.2 7.2 surface temperature / °C 25 25 26 26 25 24 23 23 24
Question paper, page 9
9 0680/41/O/N/16 © UCLES 2016 [Turn over (i) Plot a graph of the number of plants along the transect on the grid below. [4] (ii) Describe the trend shown by the graph. … …[1] (iii) The student decided that waste from the mine had an effect on the plants. Using information in the table, and your own knowledge, explain the findings of this survey. … … … … … … … …[4]
Question paper, page 10
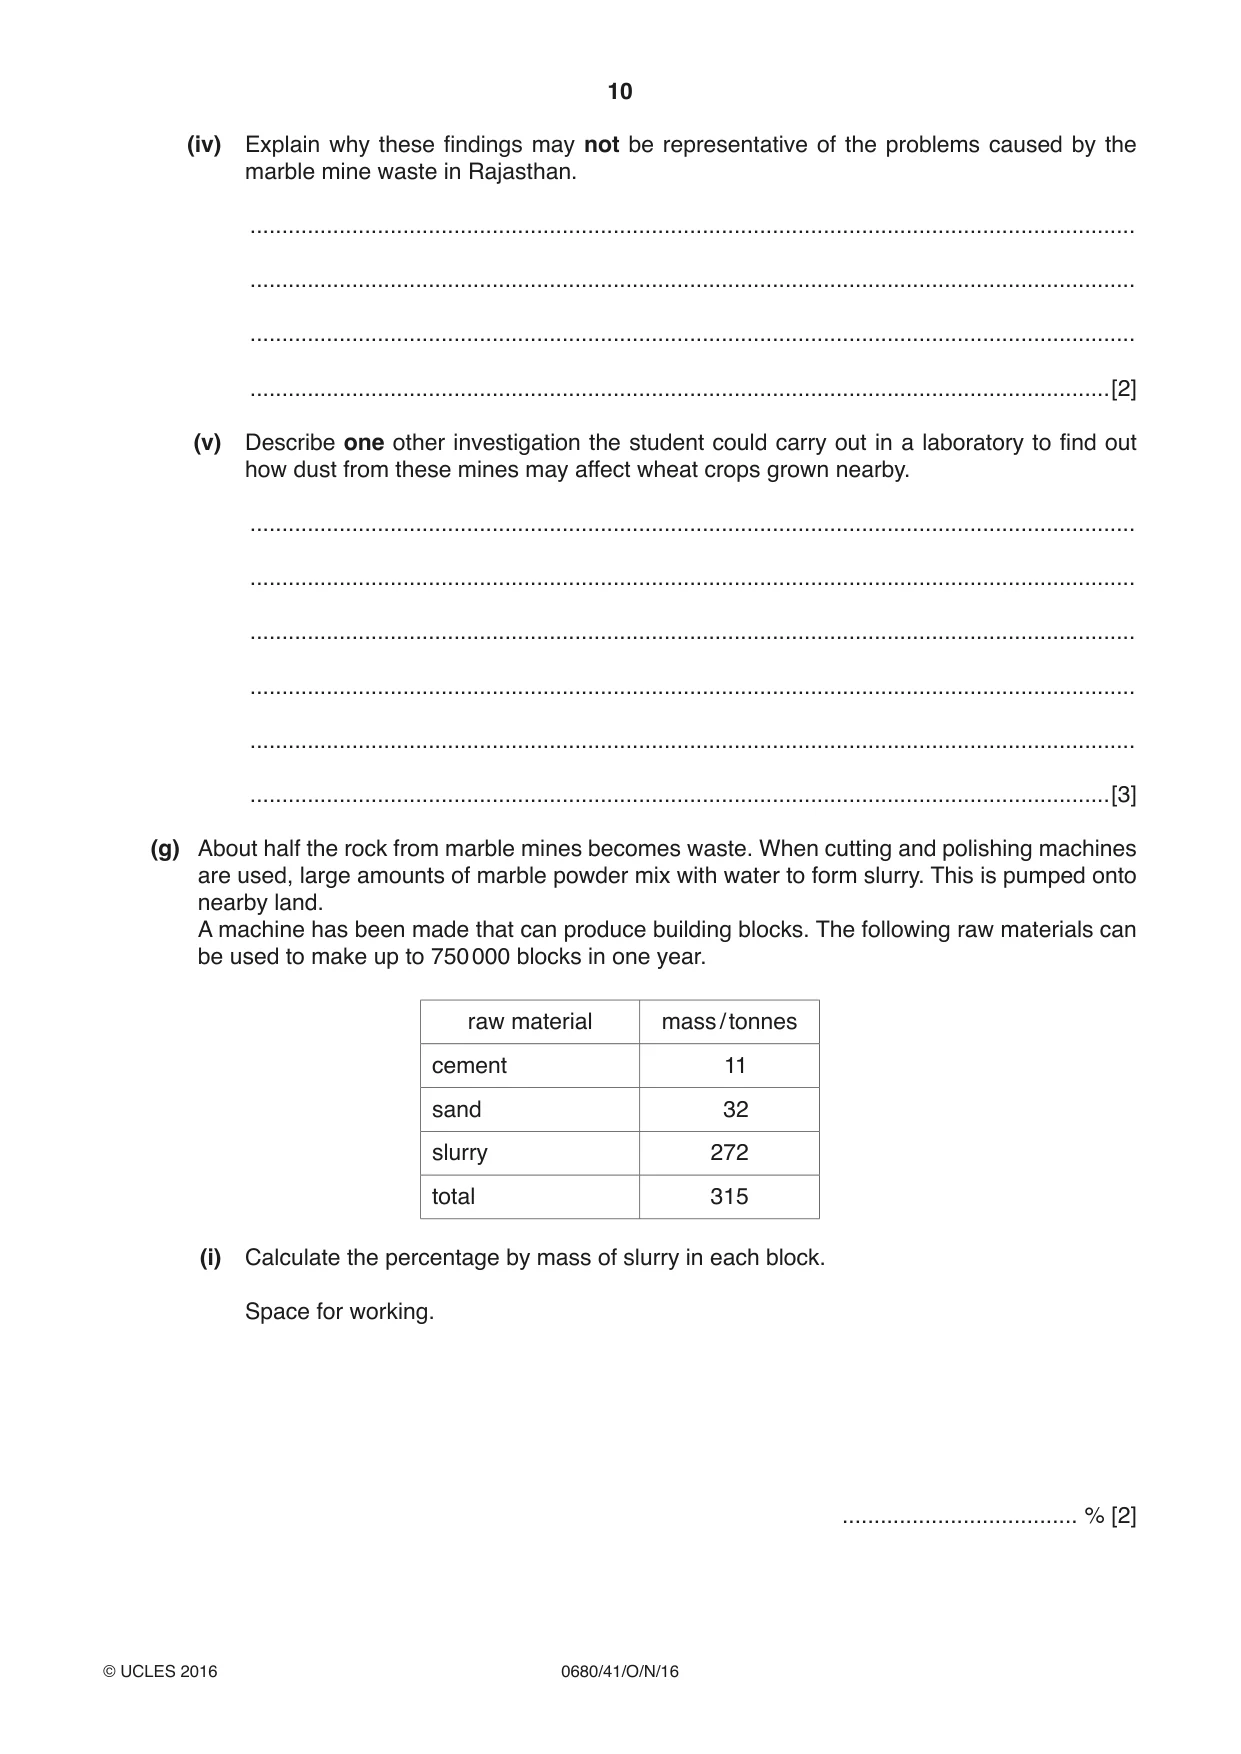
10 0680/41/O/N/16 © UCLES 2016 (iv) Explain why these findings may not be representative of the problems caused by the marble mine waste in Rajasthan. … … … …[2] (v) Describe one other investigation the student could carry out in a laboratory to find out how dust from these mines may affect wheat crops grown nearby. … … … … … …[3] (g) About half the rock from marble mines becomes waste. When cutting and polishing machines are used, large amounts of marble powder mix with water to form slurry. This is pumped onto nearby land. A machine has been made that can produce building blocks. The following raw materials can be used to make up to 750 000 blocks in one year. raw material mass / tonnes cement 11 sand 32 slurry 272 total 315 (i) Calculate the percentage by mass of slurry in each block. Space for working. … % [2]
Question paper, page 11
11 0680/41/O/N/16 © UCLES 2016 [Turn over (ii) Suggest advantages to block-makers and mine owners of using this machine. block-makers … … mine owners … … [3]
Question paper, page 12
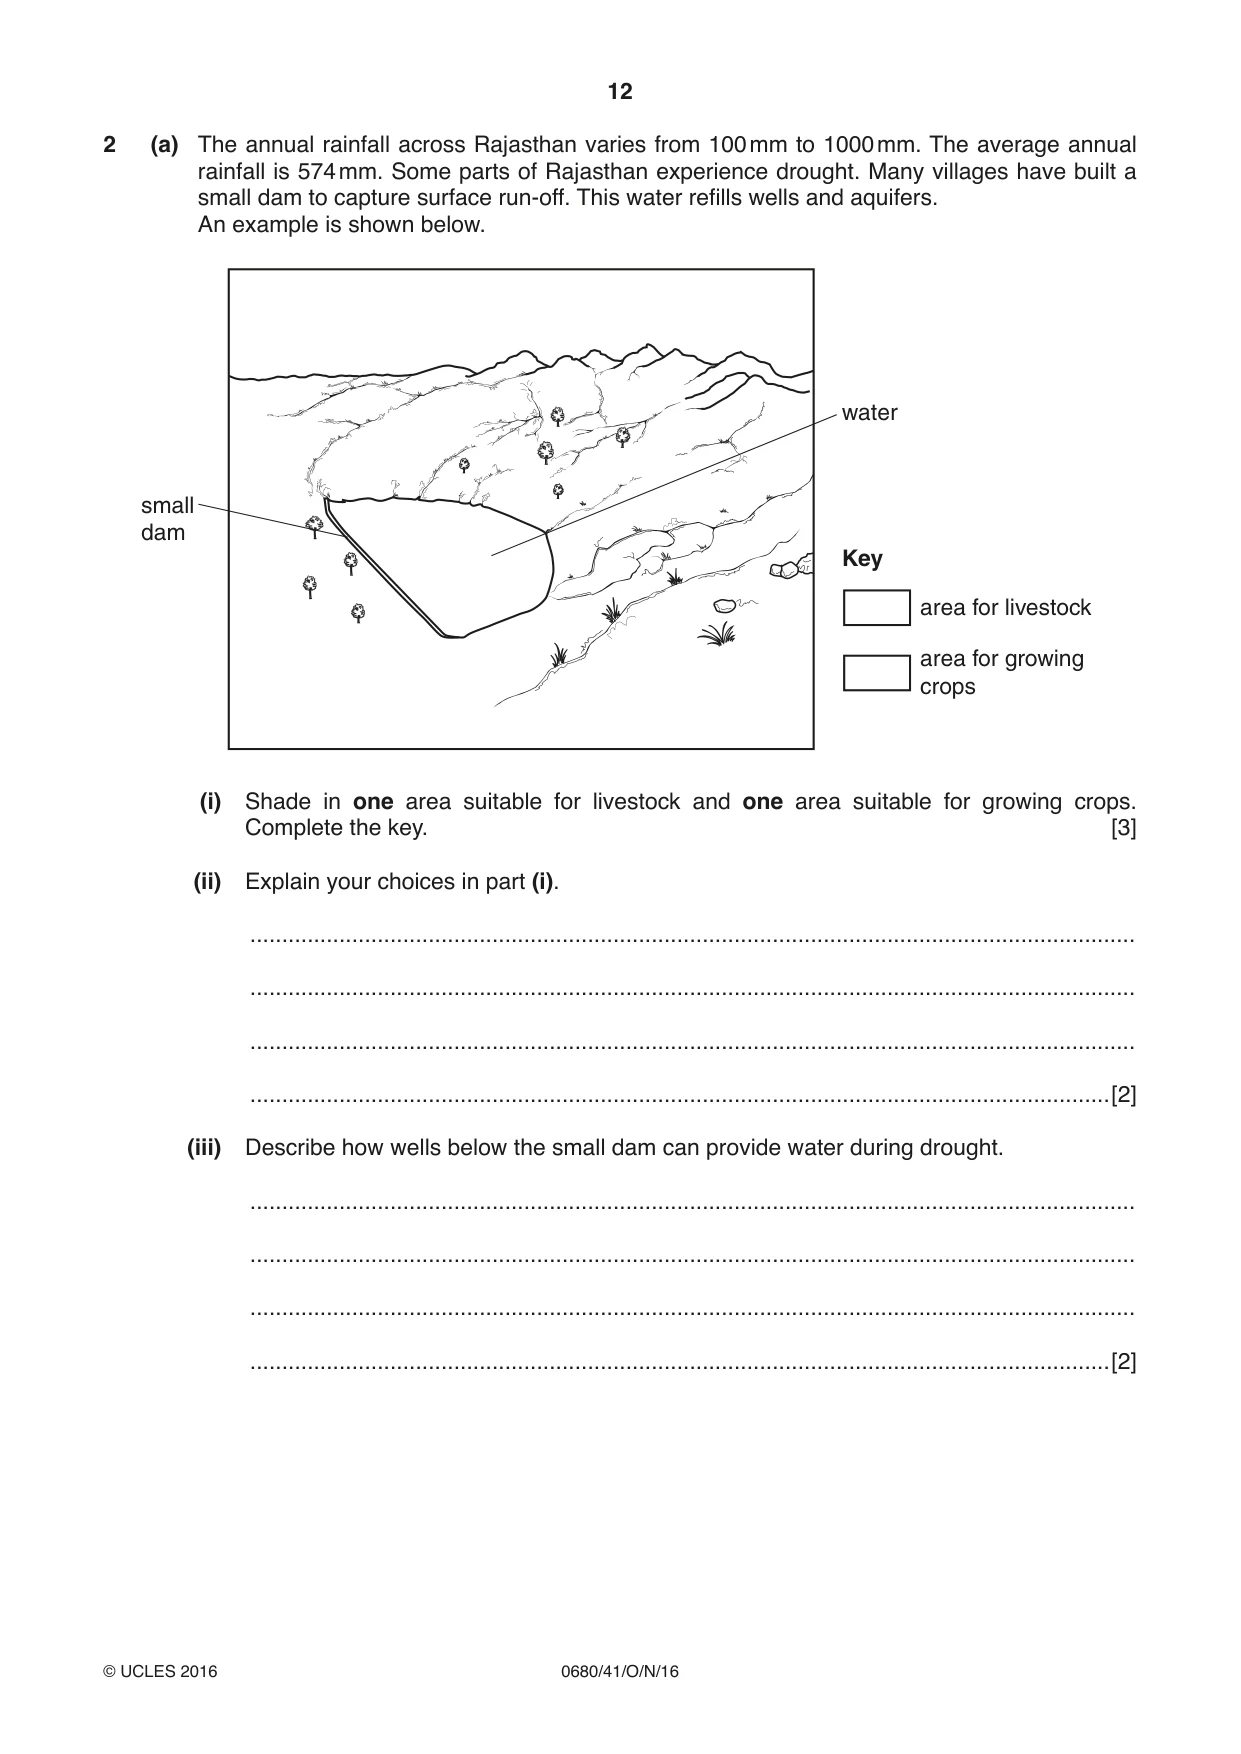
12 0680/41/O/N/16 © UCLES 2016 2 (a) The annual rainfall across Rajasthan varies from 100 mm to 1000 mm. The average annual rainfall is 574 mm. Some parts of Rajasthan experience drought. Many villages have built a small dam to capture surface run-off. This water refills wells and aquifers. An example is shown below. small dam water area for livestock Key area for growing crops (i) Shade in one area suitable for livestock and one area suitable for growing crops. Complete the key. [3] (ii) Explain your choices in part (i). … … … …[2] (iii) Describe how wells below the small dam can provide water during drought. … … … …[2]
Question paper, page 13
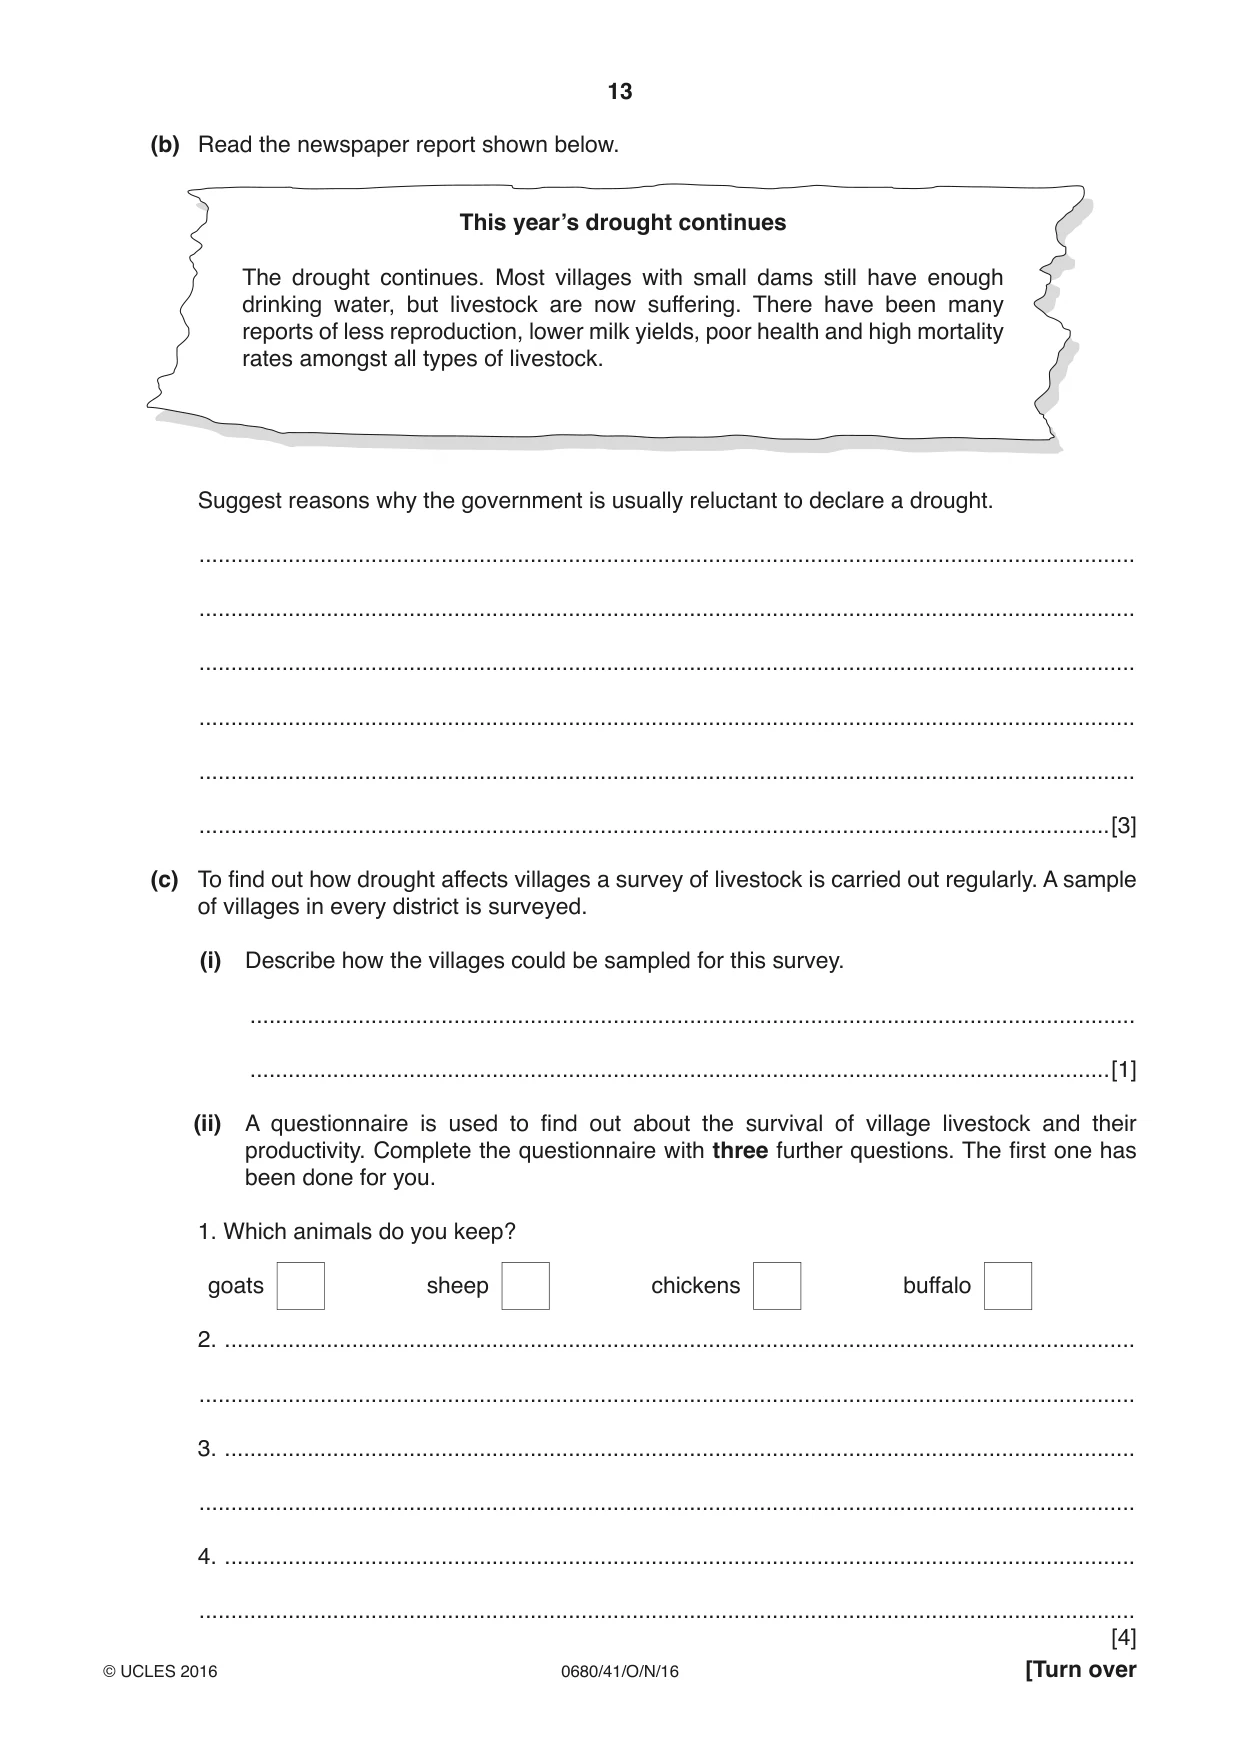
13 0680/41/O/N/16 © UCLES 2016 [Turn over (b) Read the newspaper report shown below. This year’s drought continues The drought continues. Most villages with small dams still have enough drinking water, but livestock are now suffering. There have been many reports of less reproduction, lower milk yields, poor health and high mortality rates amongst all types of livestock. Suggest reasons why the government is usually reluctant to declare a drought. … … … … … …[3] (c) To find out how drought affects villages a survey of livestock is carried out regularly. A sample of villages in every district is surveyed. (i) Describe how the villages could be sampled for this survey. … …[1] (ii) A questionnaire is used to find out about the survival of village livestock and their productivity. Complete the questionnaire with three further questions. The first one has been done for you. 1. Which animals do you keep? goats sheep chickens buffalo 2. … … 3. … … 4. … … [4]
Question paper, page 14
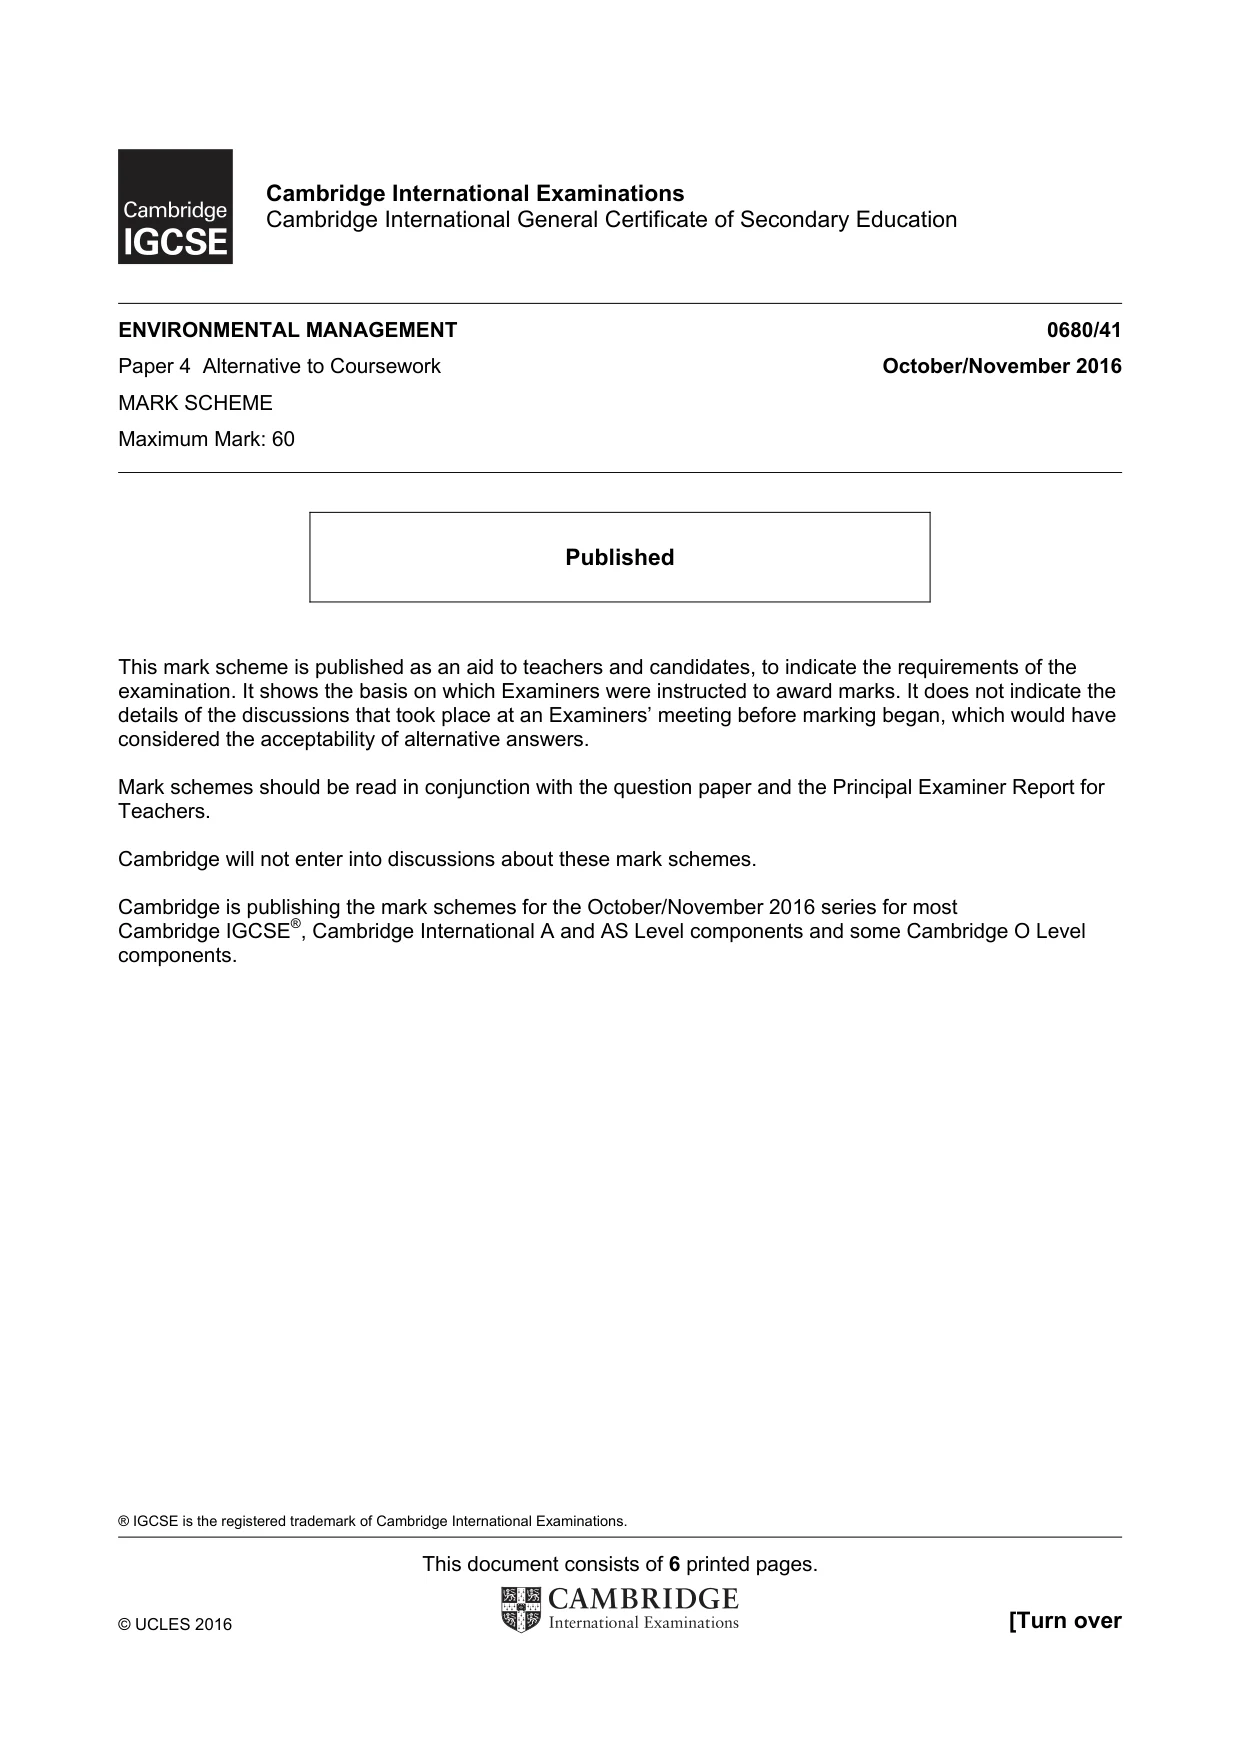
14 0680/41/O/N/16 © UCLES 2016 (iii) Some results for the survey of one village in a drought year are shown below. animal number before drought number after drought percentage decrease goats 110 101 8.2 sheep 150 98 34.7 chickens 200 155 22.5 buffalo 35 32 … Complete the table. [1] Space for working. (iv) Suggest reasons why some types of livestock are less affected by drought than others. … … … … … …[3]
Question paper, page 15
15 0680/41/O/N/16 © UCLES 2016 BLANK PAGE
Question paper, page 16
16 0680/41/O/N/16 © UCLES 2016 BLANK PAGE Permission to reproduce items where third-party owned material protected by copyright is included has been sought and cleared where possible. Every reasonable effort has been made by the publisher (UCLES) to trace copyright holders, but if any items requiring clearance have unwittingly been included, the publisher will be pleased to make amends at the earliest possible opportunity. To avoid the issue of disclosure of answer-related information to candidates, all copyright acknowledgements are reproduced online in the Cambridge International Examinations Copyright Acknowledgements Booklet. This is produced for each series of examinations and is freely available to download at www.cie.org.uk after the live examination series. Cambridge International Examinations is part of the Cambridge Assessment Group. Cambridge Assessment is the brand name of University of Cambridge Local Examinations Syndicate (UCLES), which is itself a department of the University of Cambridge.
Mark scheme, page 1
® IGCSE is the registered trademark of Cambridge International Examinations. This document consists of 6 printed pages. © UCLES 2016 [Turn over Cambridge International Examinations Cambridge International General Certificate of Secondary Education ENVIRONMENTAL MANAGEMENT 0680/41 Paper 4 Alternative to Coursework October/November 2016 MARK SCHEME Maximum Mark: 60 Published This mark scheme is published as an aid to teachers and candidates, to indicate the requirements of the examination. It shows the basis on which Examiners were instructed to award marks. It does not indicate the details of the discussions that took place at an Examiners’ meeting before marking began, which would have considered the acceptability of alternative answers. Mark schemes should be read in conjunction with the question paper and the Principal Examiner Report for Teachers. Cambridge will not enter into discussions about these mark schemes. Cambridge is publishing the mark schemes for the October/November 2016 series for most Cambridge IGCSE®, Cambridge International A and AS Level components and some Cambridge O Level components.
Mark scheme, page 2
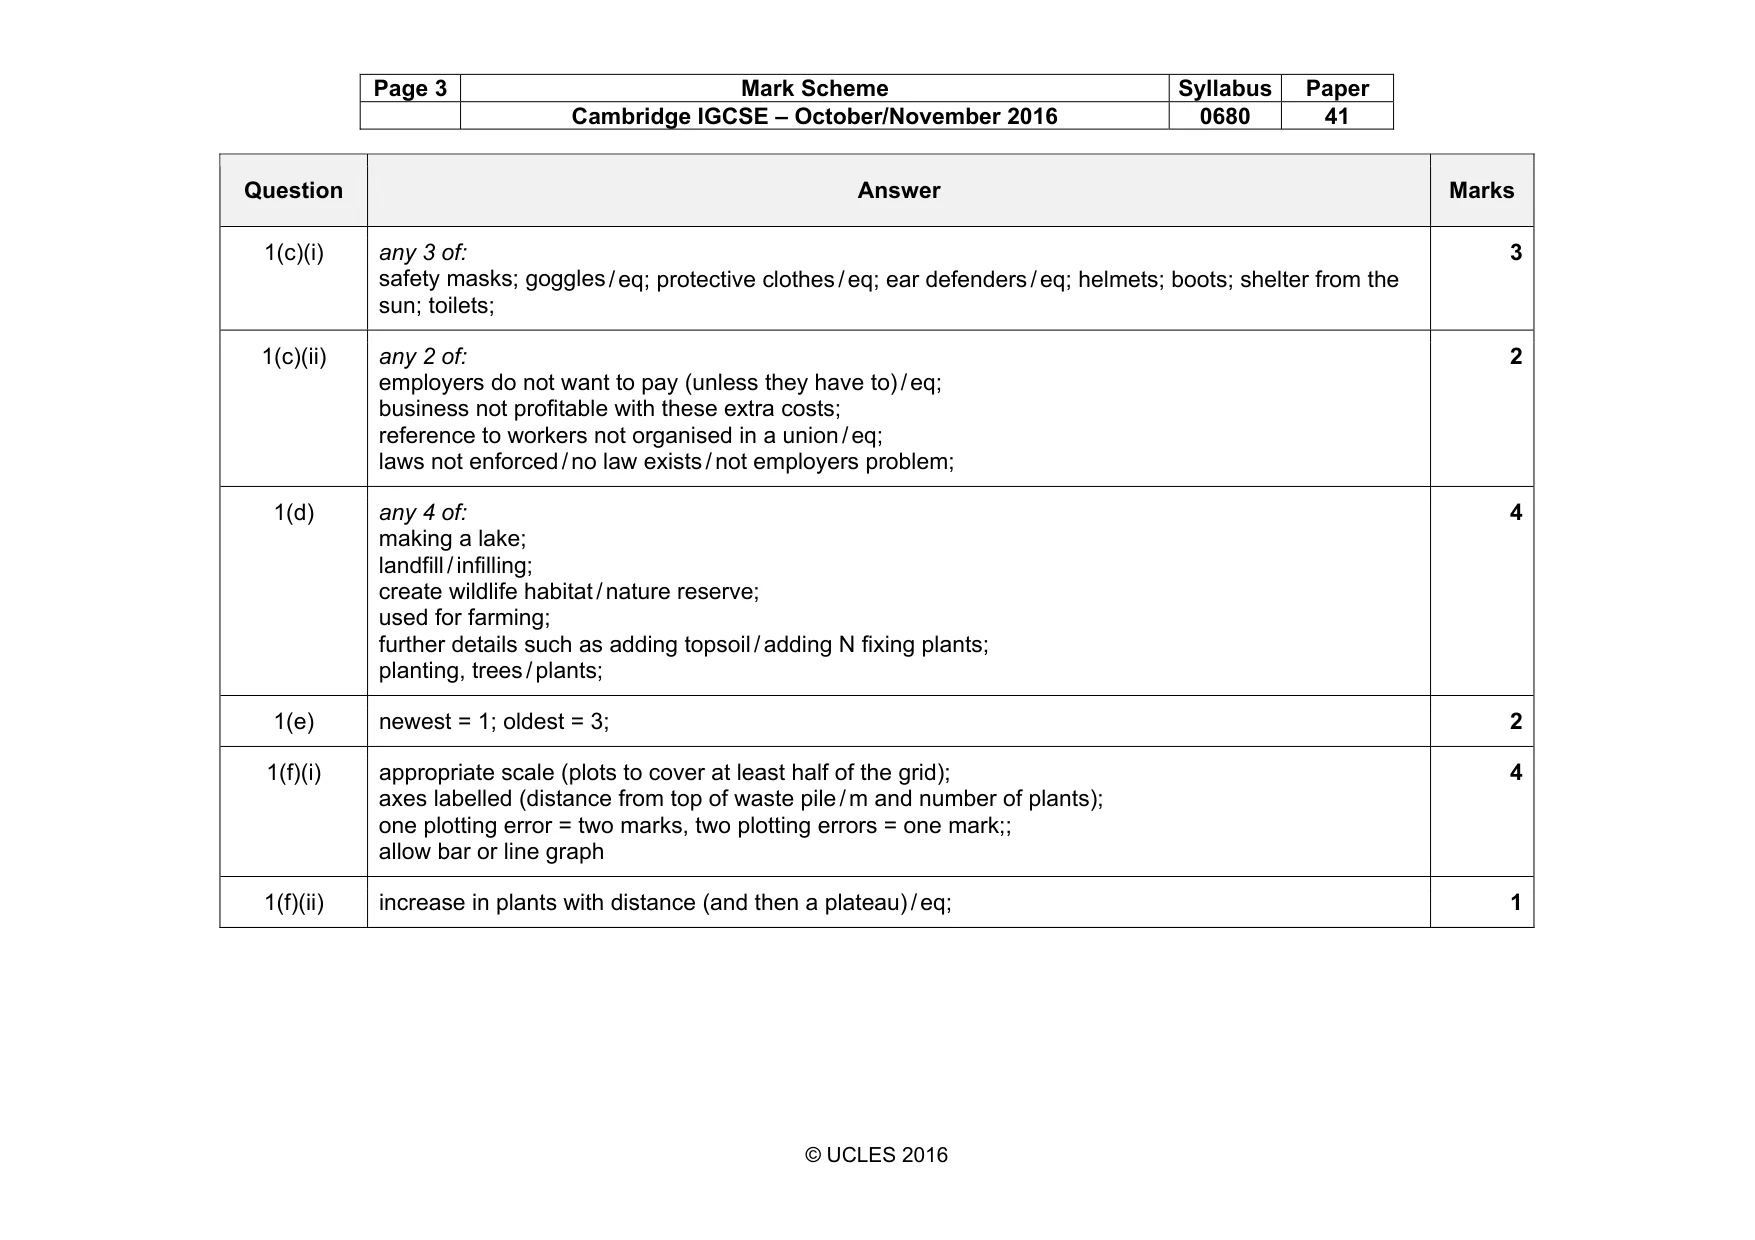
Page 2 Mark Scheme Syllabus Paper Cambridge IGCSE – October/November 2016 0680 41 © UCLES 2016 Question Answer Marks 1(a)(i) 7.7; 1 1(a)(ii) 9.058 / 9.06 / 9.1 (%); allow ecf from part (a)(i) 1 1(b)(i) July, August, September; 1 1(b)(ii) return to villages / work on land / loss of money / cannot buy food / cannot pay for, education / rent / medical treatment / eq; 1 1(b)(iii) any 3 of: mosquitoes breed in water; so (more) people bitten; so (more) malaria cases; yellow fever / dengue fever; drinking water more polluted; so cholera / dysentery / diarrhoea; no money to treat diseases; max 1 for named disease 3 1(b)(iv) noise drives away animals / stop them breeding / other effect on domesticated animals; reference to stress / annoyance / scared of noise; dust reduced plant growth / leaves covered / eq; less photosynthesis; causes breathing problems; causes, eye / ear problems / eq; reduced biodiversity (of plants / animals); max 2 for noise and max 2 for dust 4
Mark scheme, page 3
Page 3 Mark Scheme Syllabus Paper Cambridge IGCSE – October/November 2016 0680 41 © UCLES 2016 Question Answer Marks 1(c)(i) any 3 of: safety masks; goggles / eq; protective clothes / eq; ear defenders / eq; helmets; boots; shelter from the sun; toilets; 3 1(c)(ii) any 2 of: employers do not want to pay (unless they have to) / eq; business not profitable with these extra costs; reference to workers not organised in a union / eq; laws not enforced / no law exists / not employers problem; 2 1(d) any 4 of: making a lake; landfill / infilling; create wildlife habitat / nature reserve; used for farming; further details such as adding topsoil / adding N fixing plants; planting, trees / plants; 4 1(e) newest = 1; oldest = 3; 2 1(f)(i) appropriate scale (plots to cover at least half of the grid); axes labelled (distance from top of waste pile / m and number of plants); one plotting error = two marks, two plotting errors = one mark;; allow bar or line graph 4 1(f)(ii) increase in plants with distance (and then a plateau) / eq; 1
Mark scheme, page 4
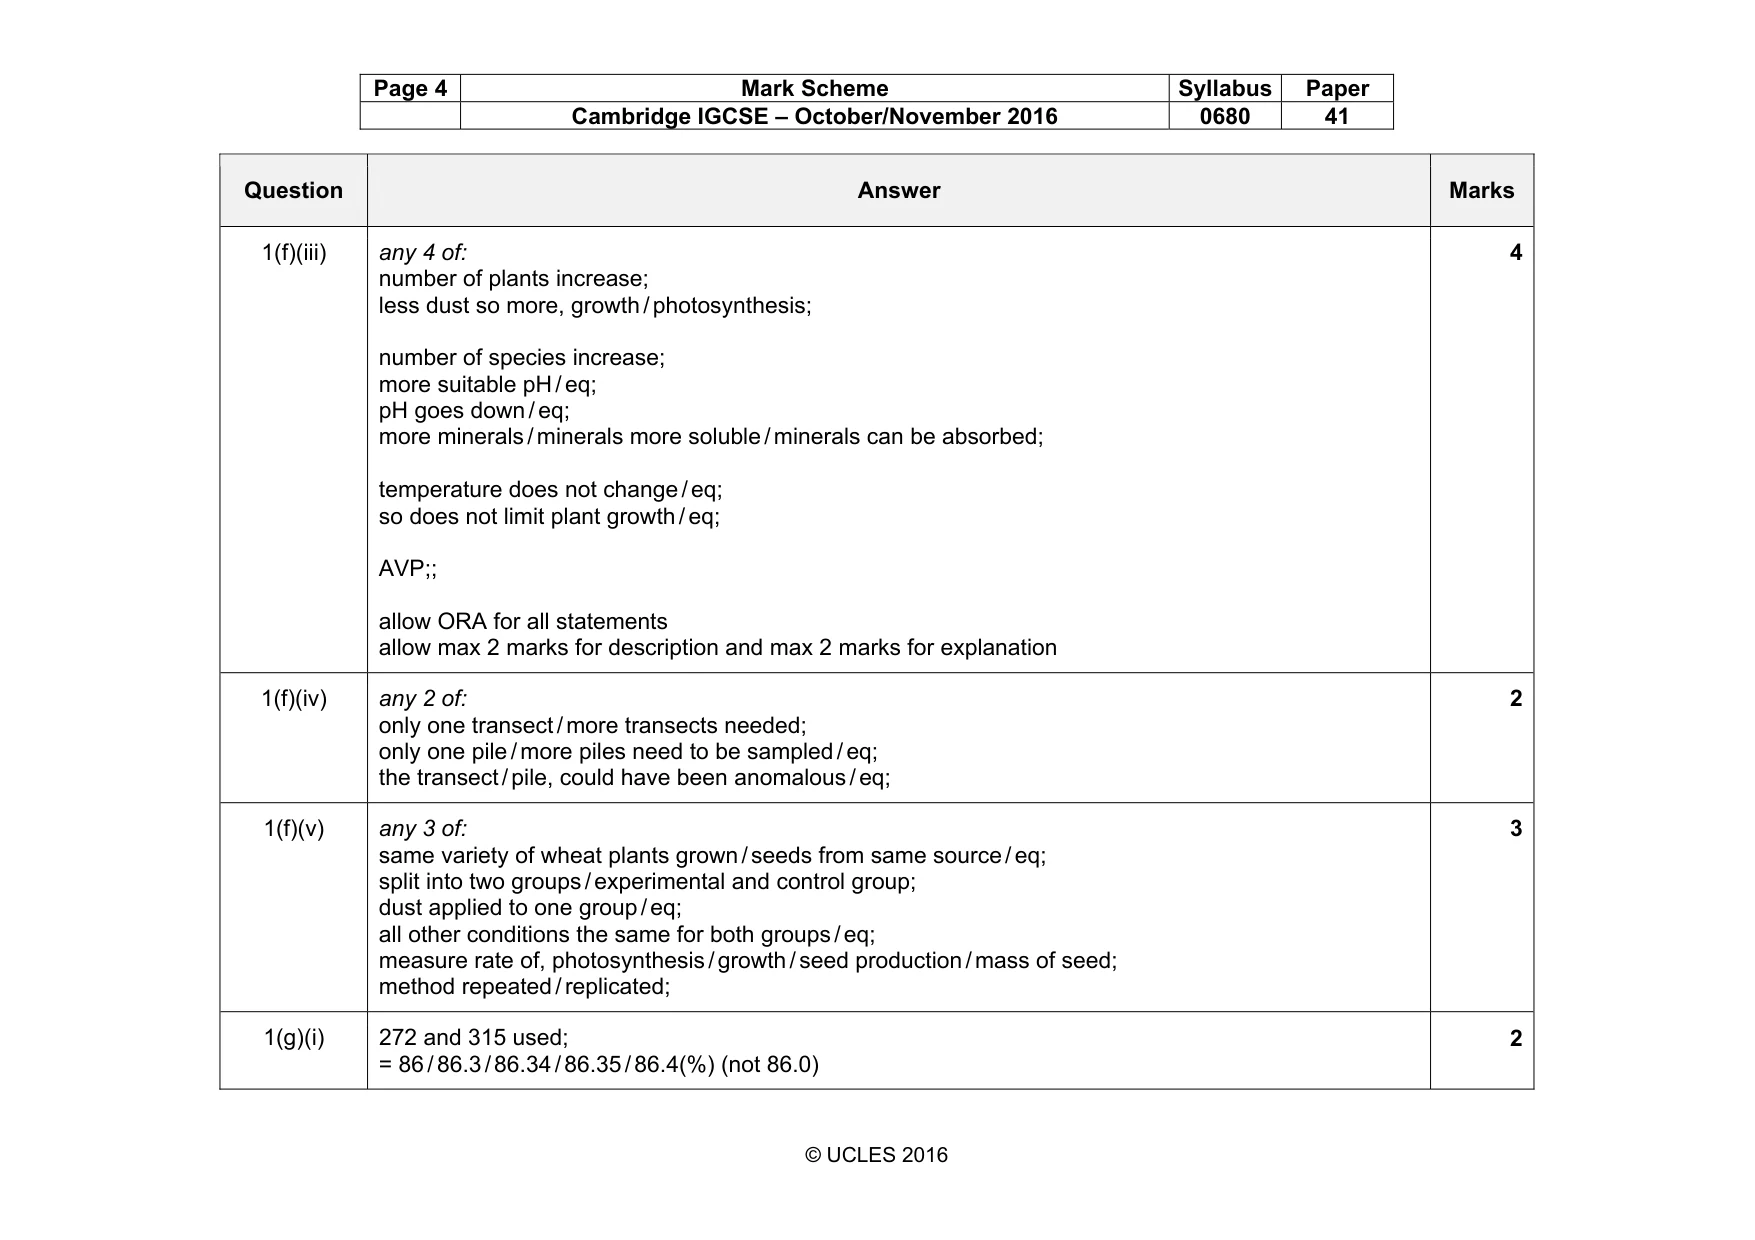
Page 4 Mark Scheme Syllabus Paper Cambridge IGCSE – October/November 2016 0680 41 © UCLES 2016 Question Answer Marks 1(f)(iii) any 4 of: number of plants increase; less dust so more, growth / photosynthesis; number of species increase; more suitable pH / eq; pH goes down / eq; more minerals / minerals more soluble / minerals can be absorbed; temperature does not change / eq; so does not limit plant growth / eq; AVP;; allow ORA for all statements allow max 2 marks for description and max 2 marks for explanation 4 1(f)(iv) any 2 of: only one transect / more transects needed; only one pile / more piles need to be sampled / eq; the transect / pile, could have been anomalous / eq; 2 1(f)(v) any 3 of: same variety of wheat plants grown / seeds from same source / eq; split into two groups / experimental and control group; dust applied to one group / eq; all other conditions the same for both groups / eq; measure rate of, photosynthesis / growth / seed production / mass of seed; method repeated / replicated; 3 1(g)(i) 272 and 315 used; = 86 / 86.3 / 86.34 / 86.35 / 86.4(%) (not 86.0) 2
Mark scheme, page 5
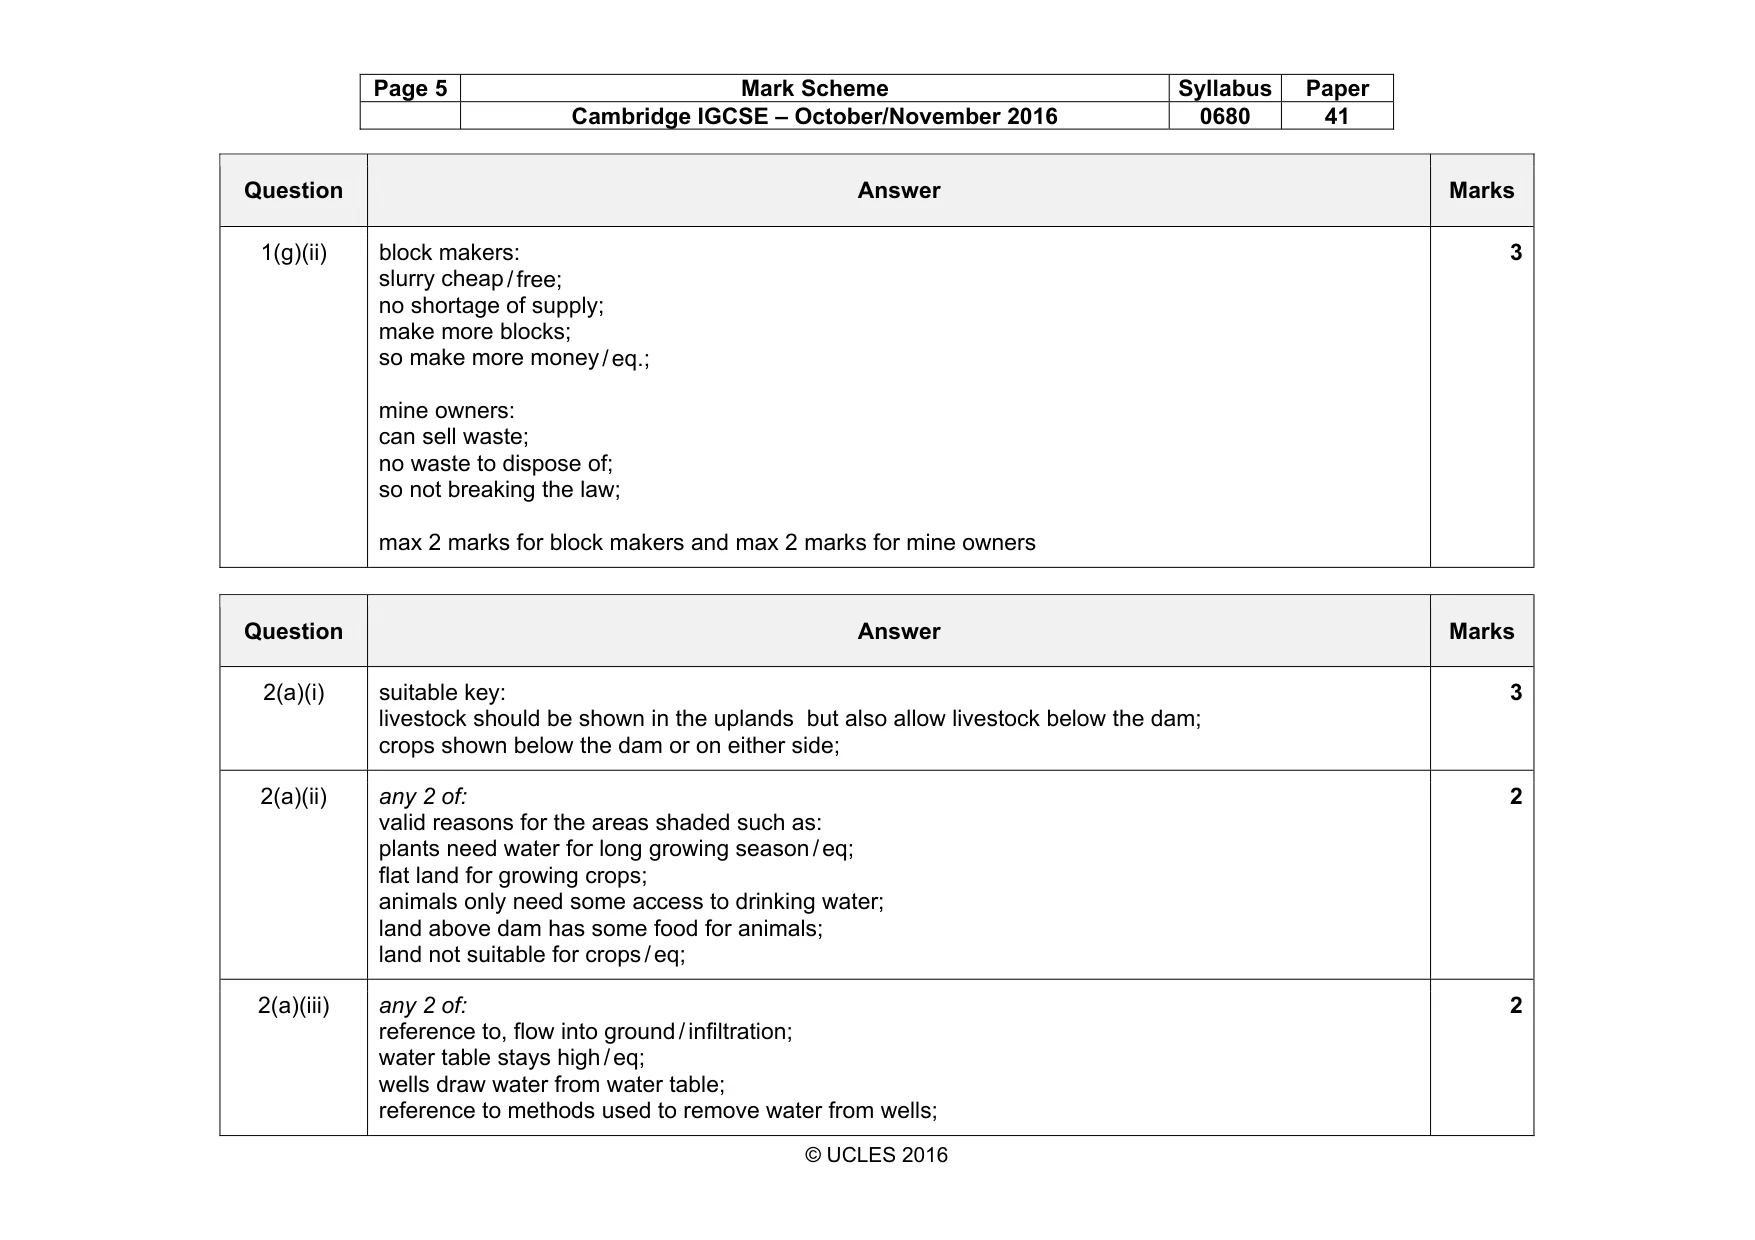
Page 5 Mark Scheme Syllabus Paper Cambridge IGCSE – October/November 2016 0680 41 © UCLES 2016 Question Answer Marks 1(g)(ii) block makers: slurry cheap / free; no shortage of supply; make more blocks; so make more money / eq.; mine owners: can sell waste; no waste to dispose of; so not breaking the law; max 2 marks for block makers and max 2 marks for mine owners 3 Question Answer Marks 2(a)(i) suitable key: livestock should be shown in the uplands but also allow livestock below the dam; crops shown below the dam or on either side; 3 2(a)(ii) any 2 of: valid reasons for the areas shaded such as: plants need water for long growing season / eq; flat land for growing crops; animals only need some access to drinking water; land above dam has some food for animals; land not suitable for crops / eq; 2 2(a)(iii) any 2 of: reference to, flow into ground / infiltration; water table stays high / eq; wells draw water from water table; reference to methods used to remove water from wells; 2
Mark scheme, page 6
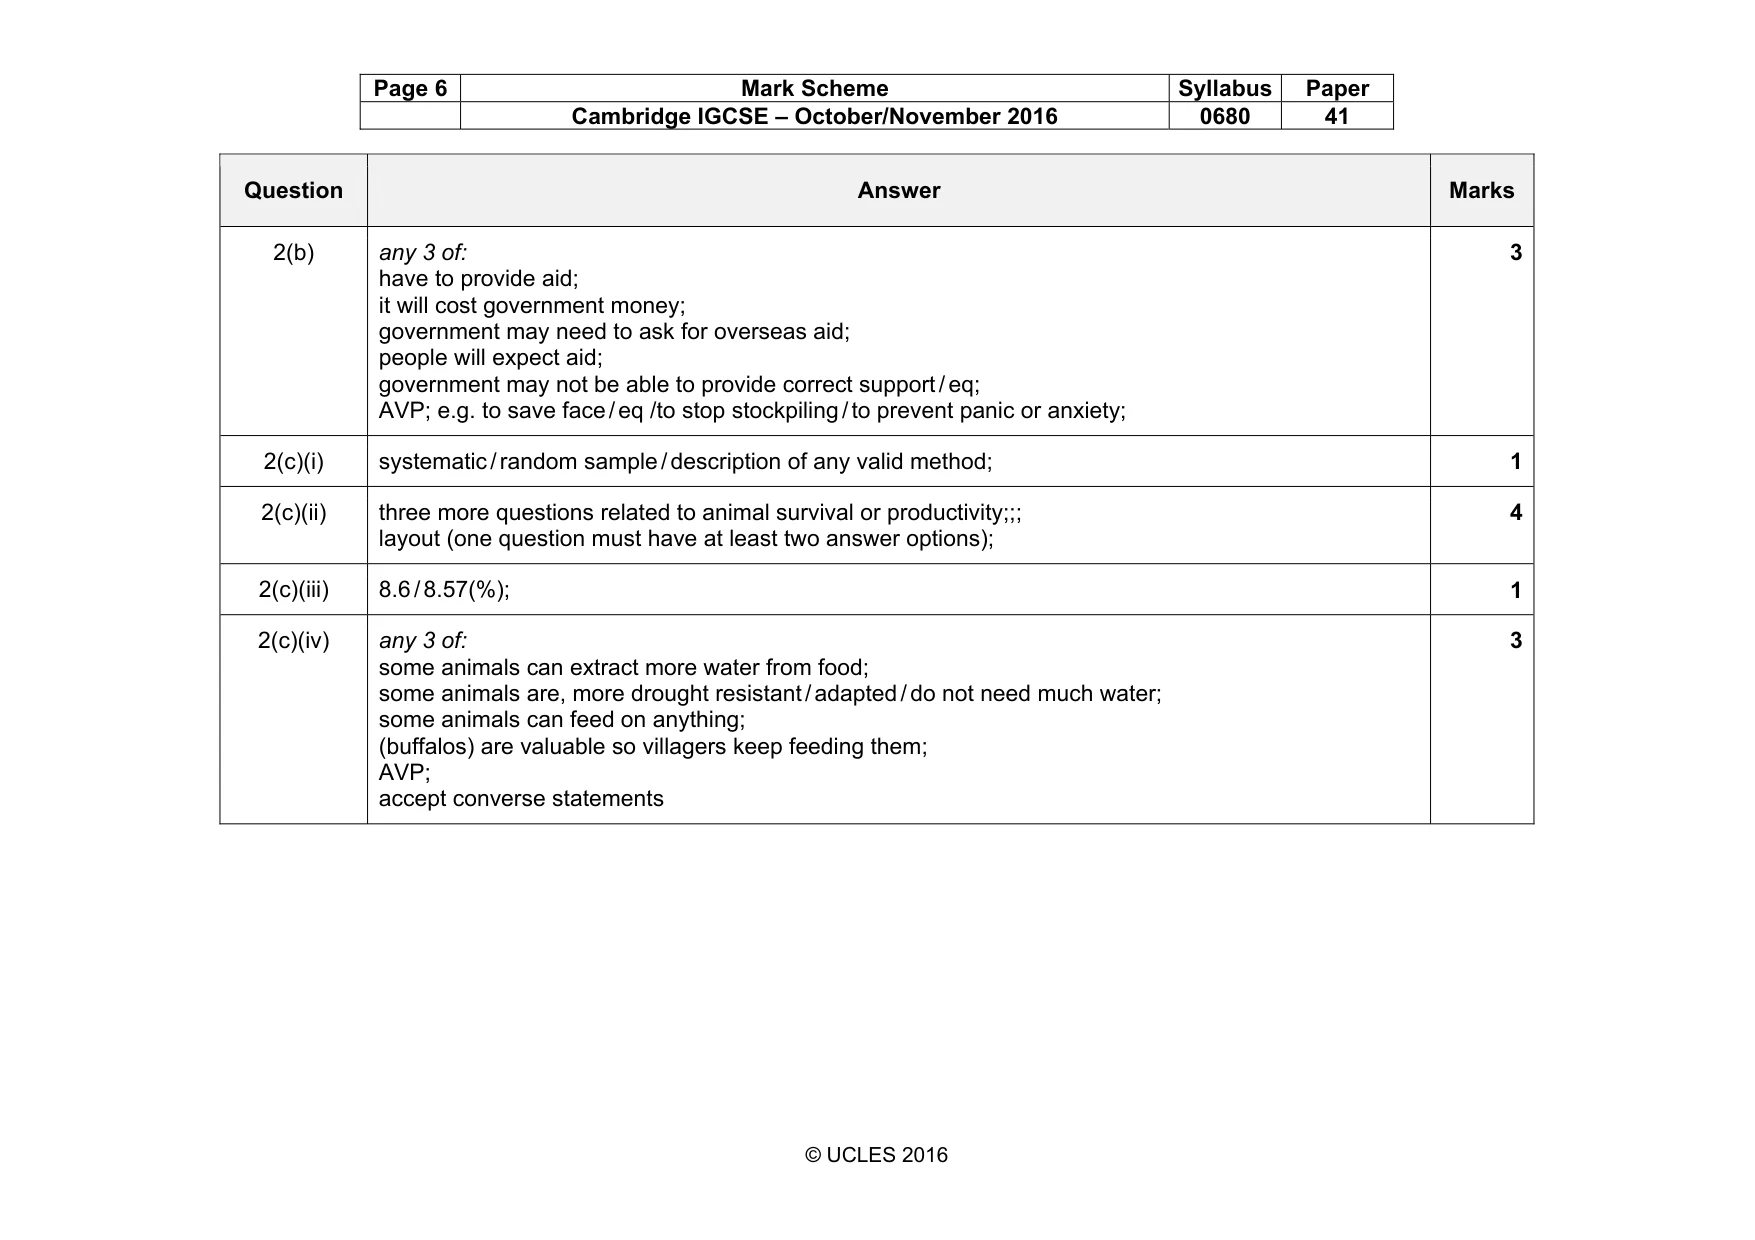
Page 6 Mark Scheme Syllabus Paper Cambridge IGCSE – October/November 2016 0680 41 © UCLES 2016 Question Answer Marks 2(b) any 3 of: have to provide aid; it will cost government money; government may need to ask for overseas aid; people will expect aid; government may not be able to provide correct support / eq; AVP; e.g. to save face / eq /to stop stockpiling / to prevent panic or anxiety; 3 2(c)(i) systematic / random sample / description of any valid method; 1 2(c)(ii) three more questions related to animal survival or productivity;;; layout (one question must have at least two answer options); 4 2(c)(iii) 8.6 / 8.57(%); 1 2(c)(iv) any 3 of: some animals can extract more water from food; some animals are, more drought resistant / adapted / do not need much water; some animals can feed on anything; (buffalos) are valuable so villagers keep feeding them; AVP; accept converse statements 3
What you needed in this session
Cambridge’s own grade thresholds for 2016 Oct/Nov, Paper 4 · Variant 1. A higher threshold means an easier paper — the bar moves with how the cohort did.