Cambridge IGCSE Environmental Management 0680 — 2017 May/June Paper 4 · Variant 1
0680/41/M/J/17 · 2 questions · 60 marks · ≈68 min
The question paper and its mark scheme, free to read here and free to download. This is Cambridge’s own paper, exactly as it was sat.
Question paper20 pages



Mark scheme6 pages
Answers below. Sit the paper first if you are practising.
Questions as text
Q1 · In Egypt most economic activity takes place near the River Nile
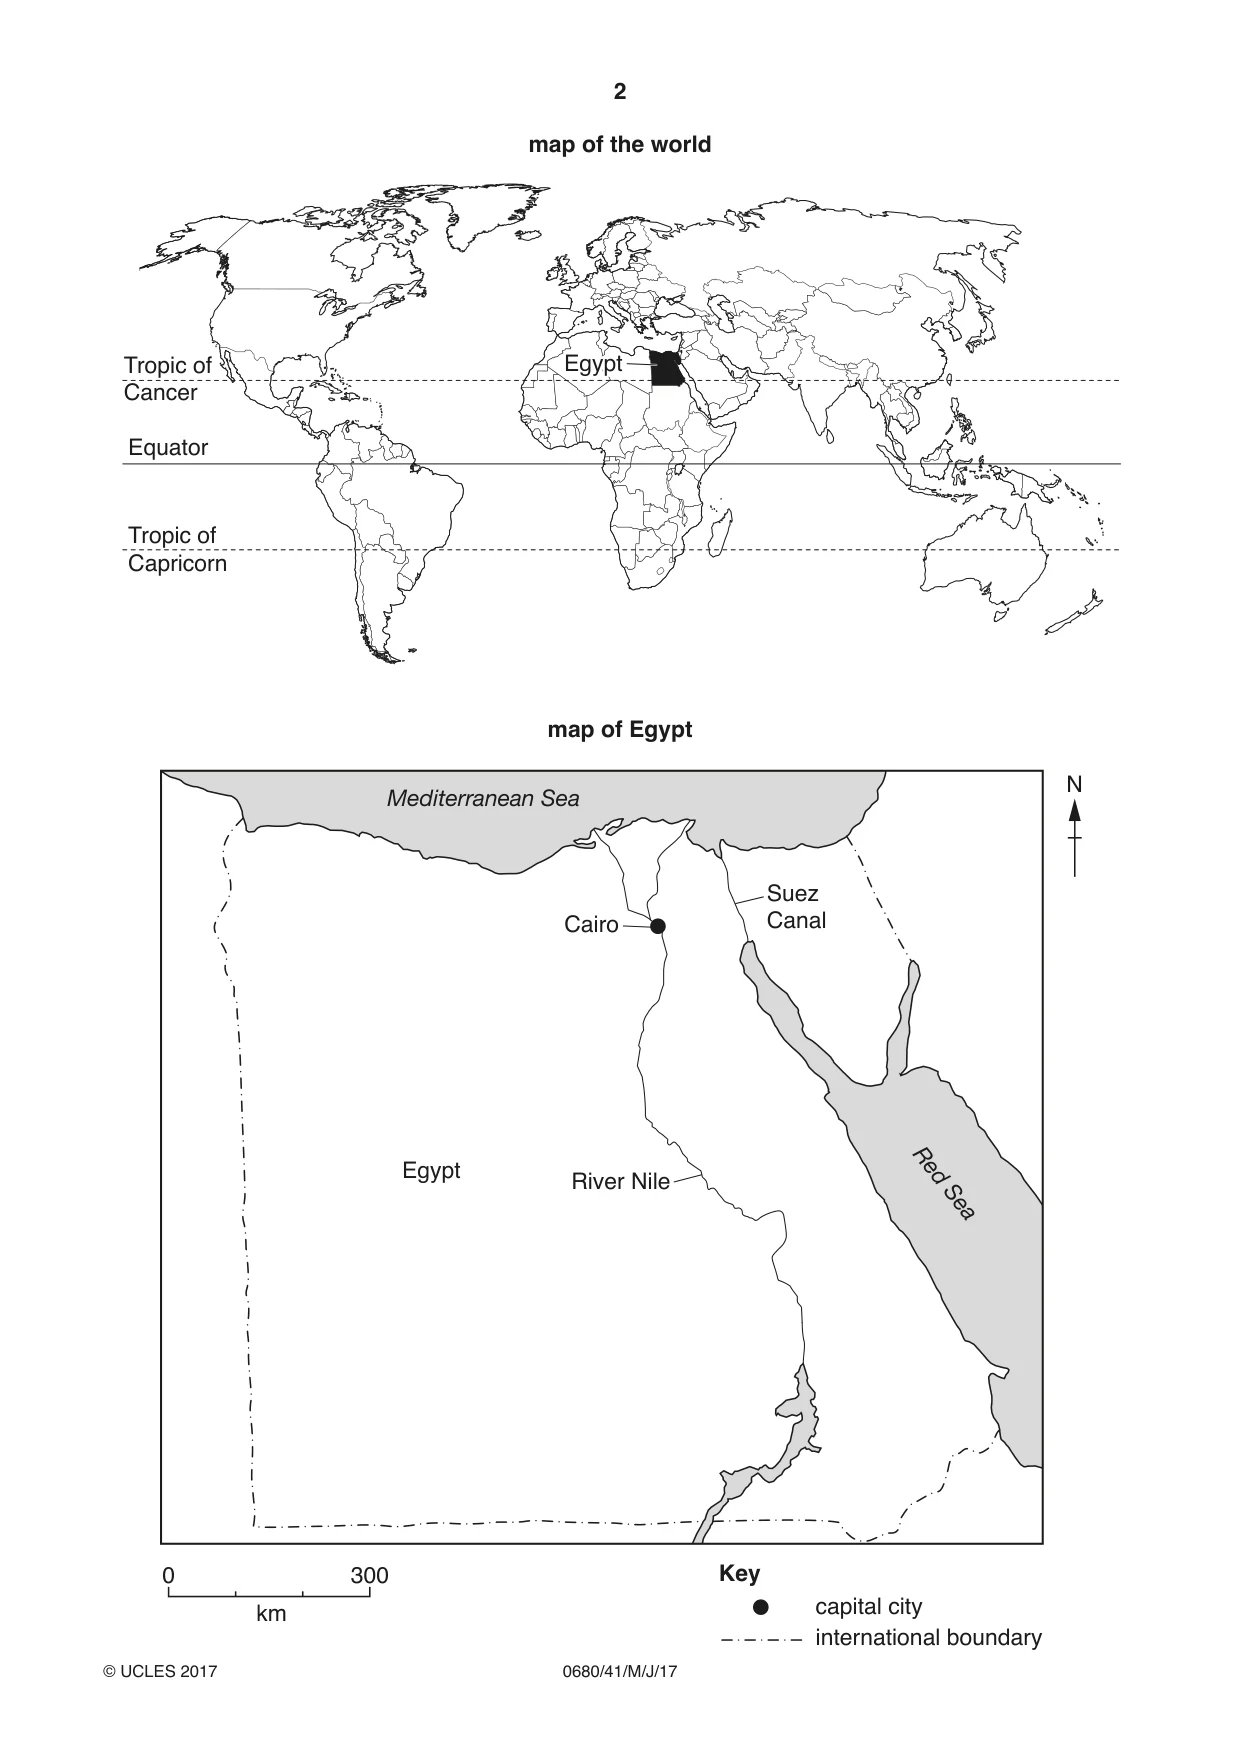
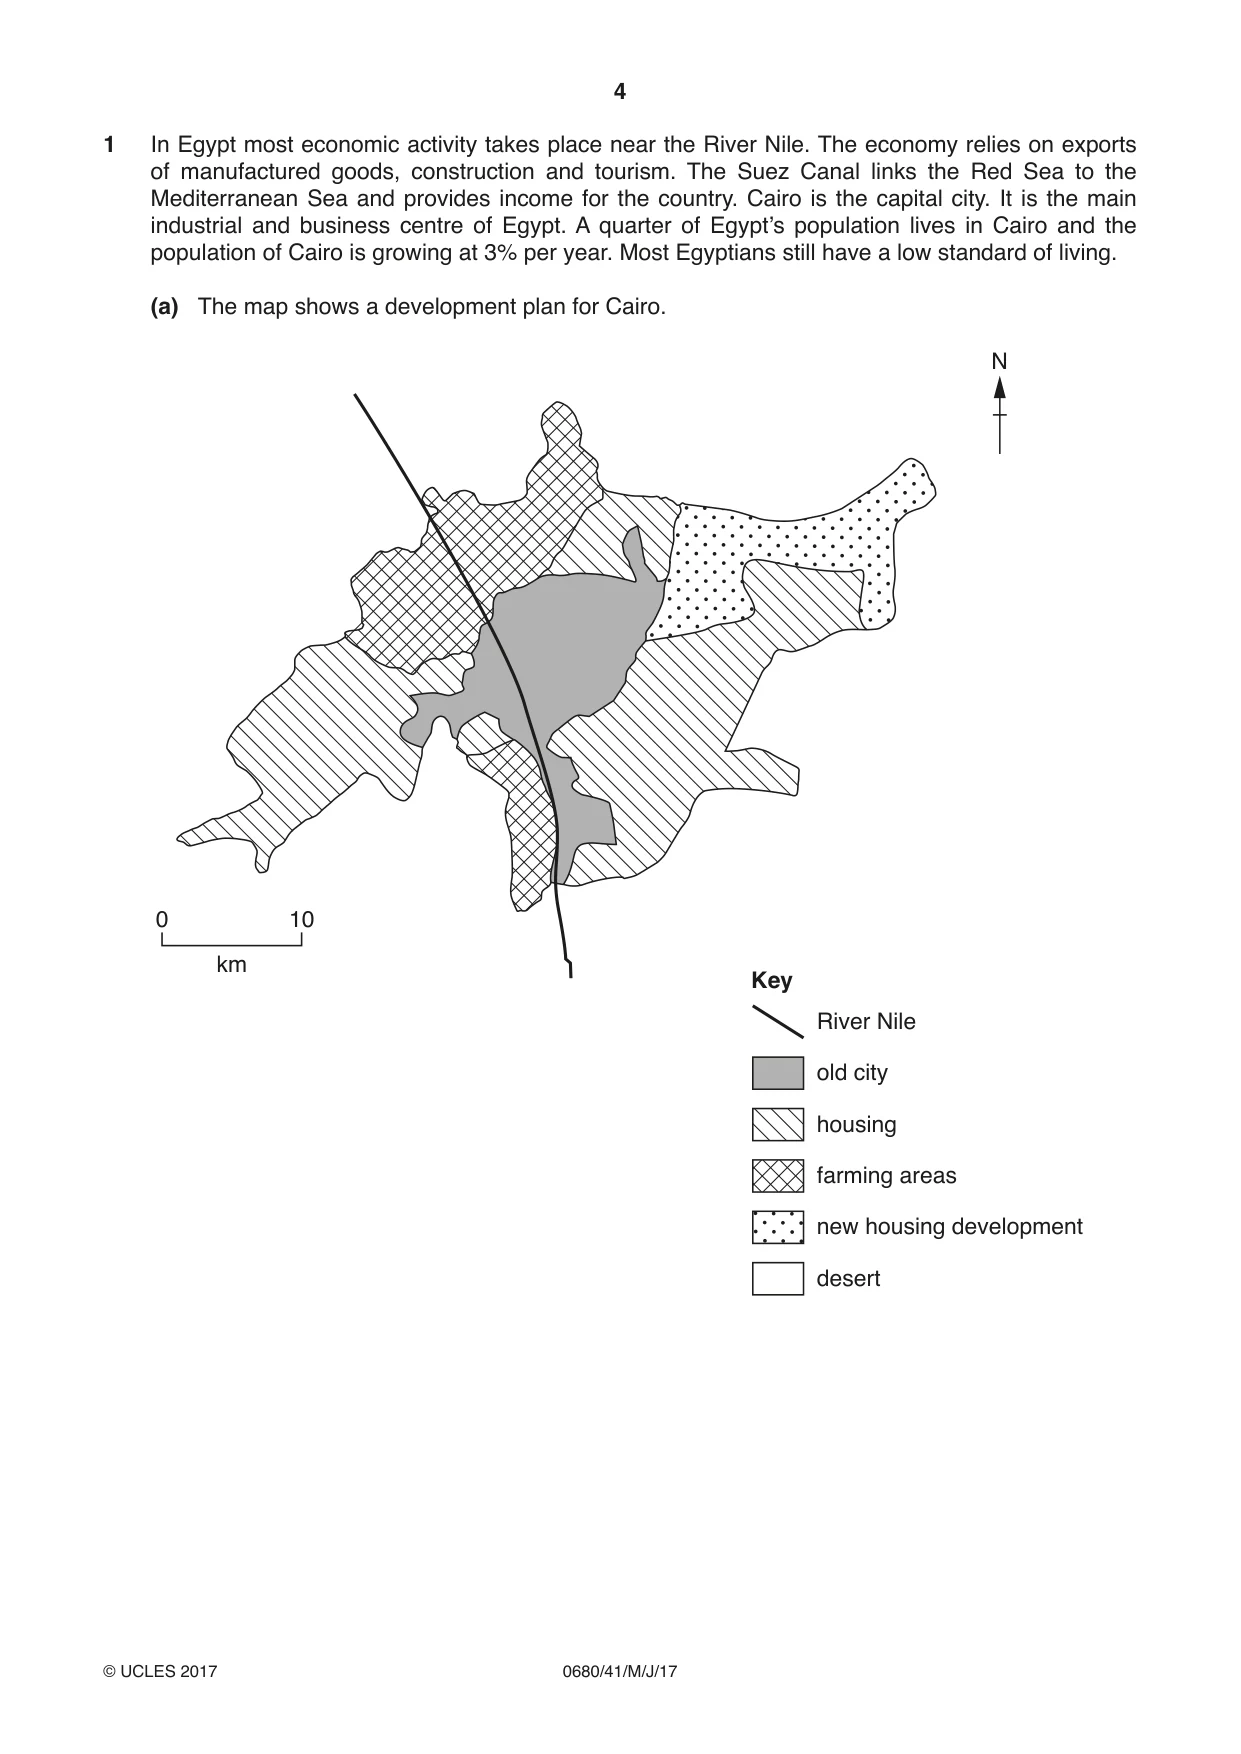
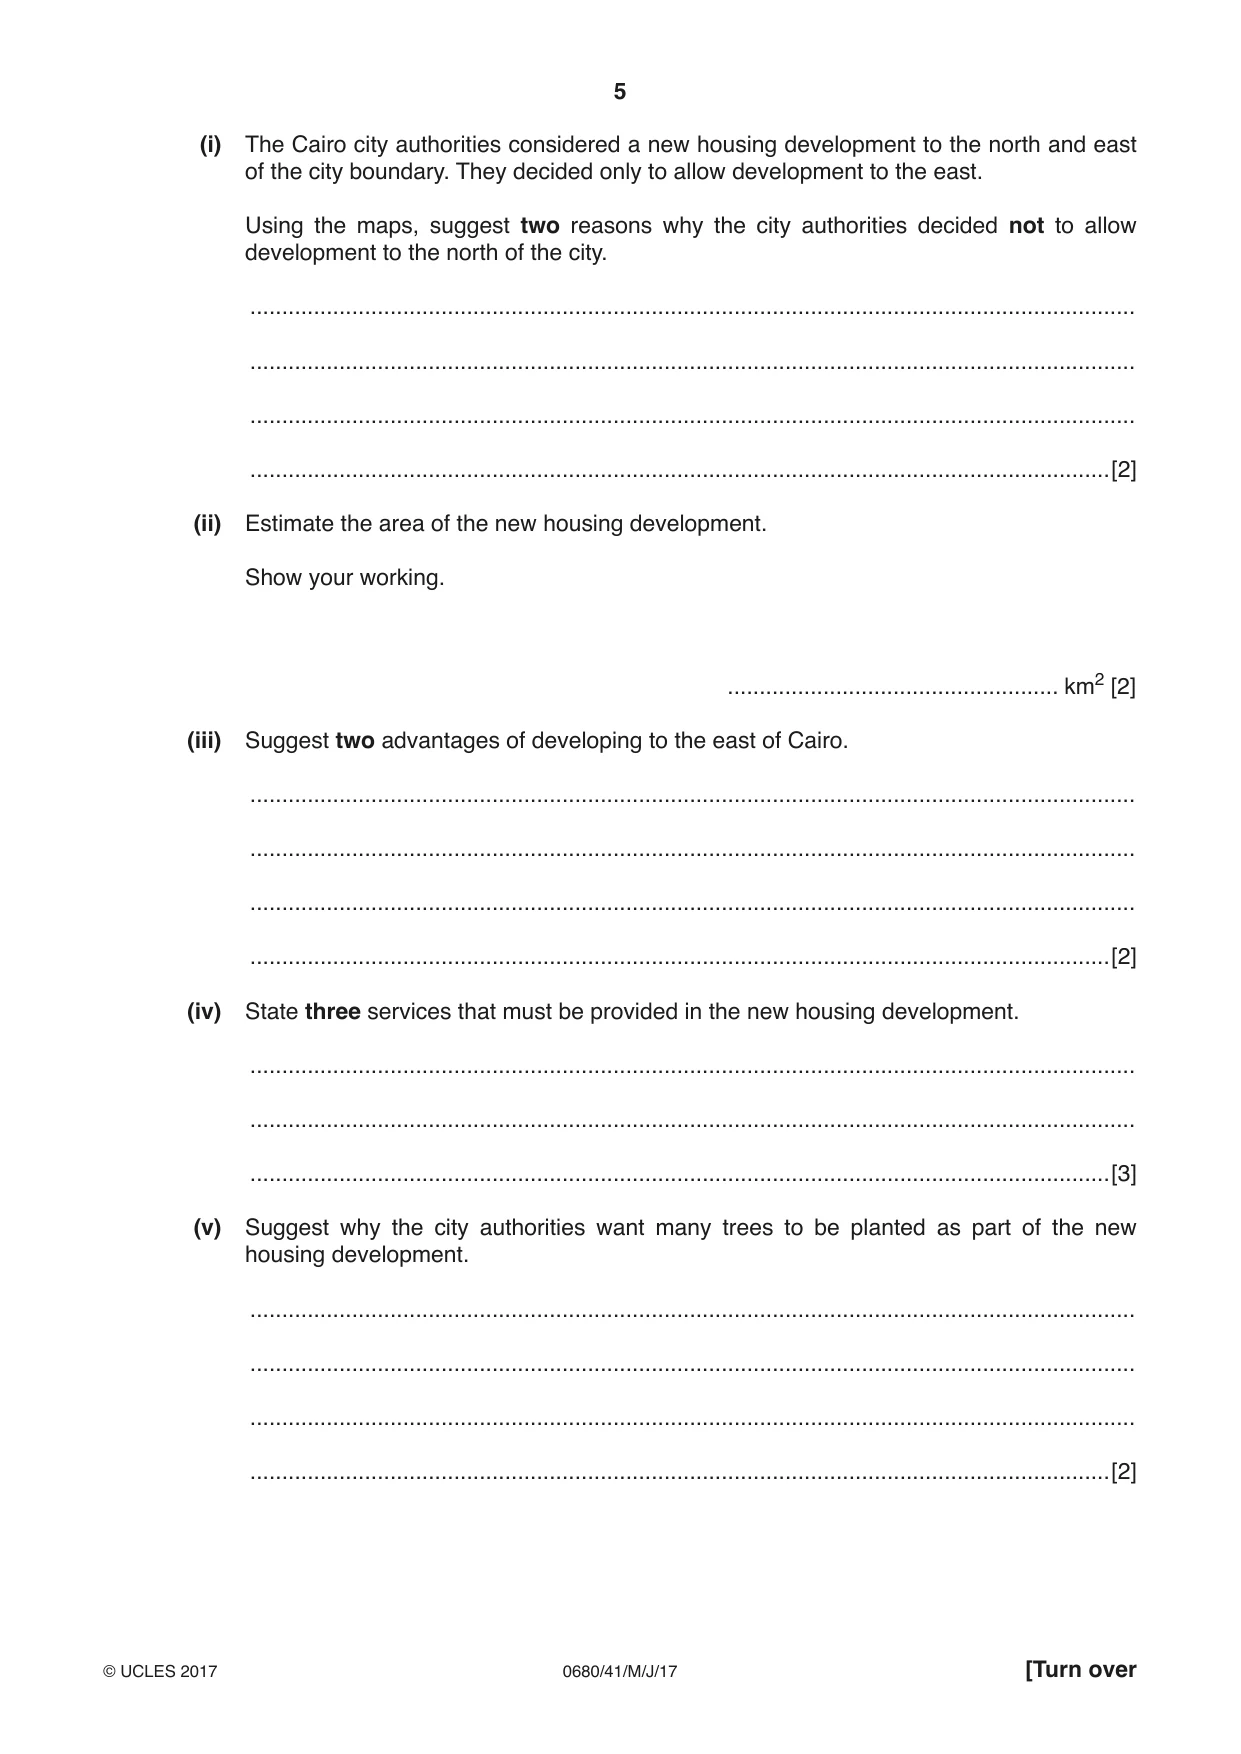
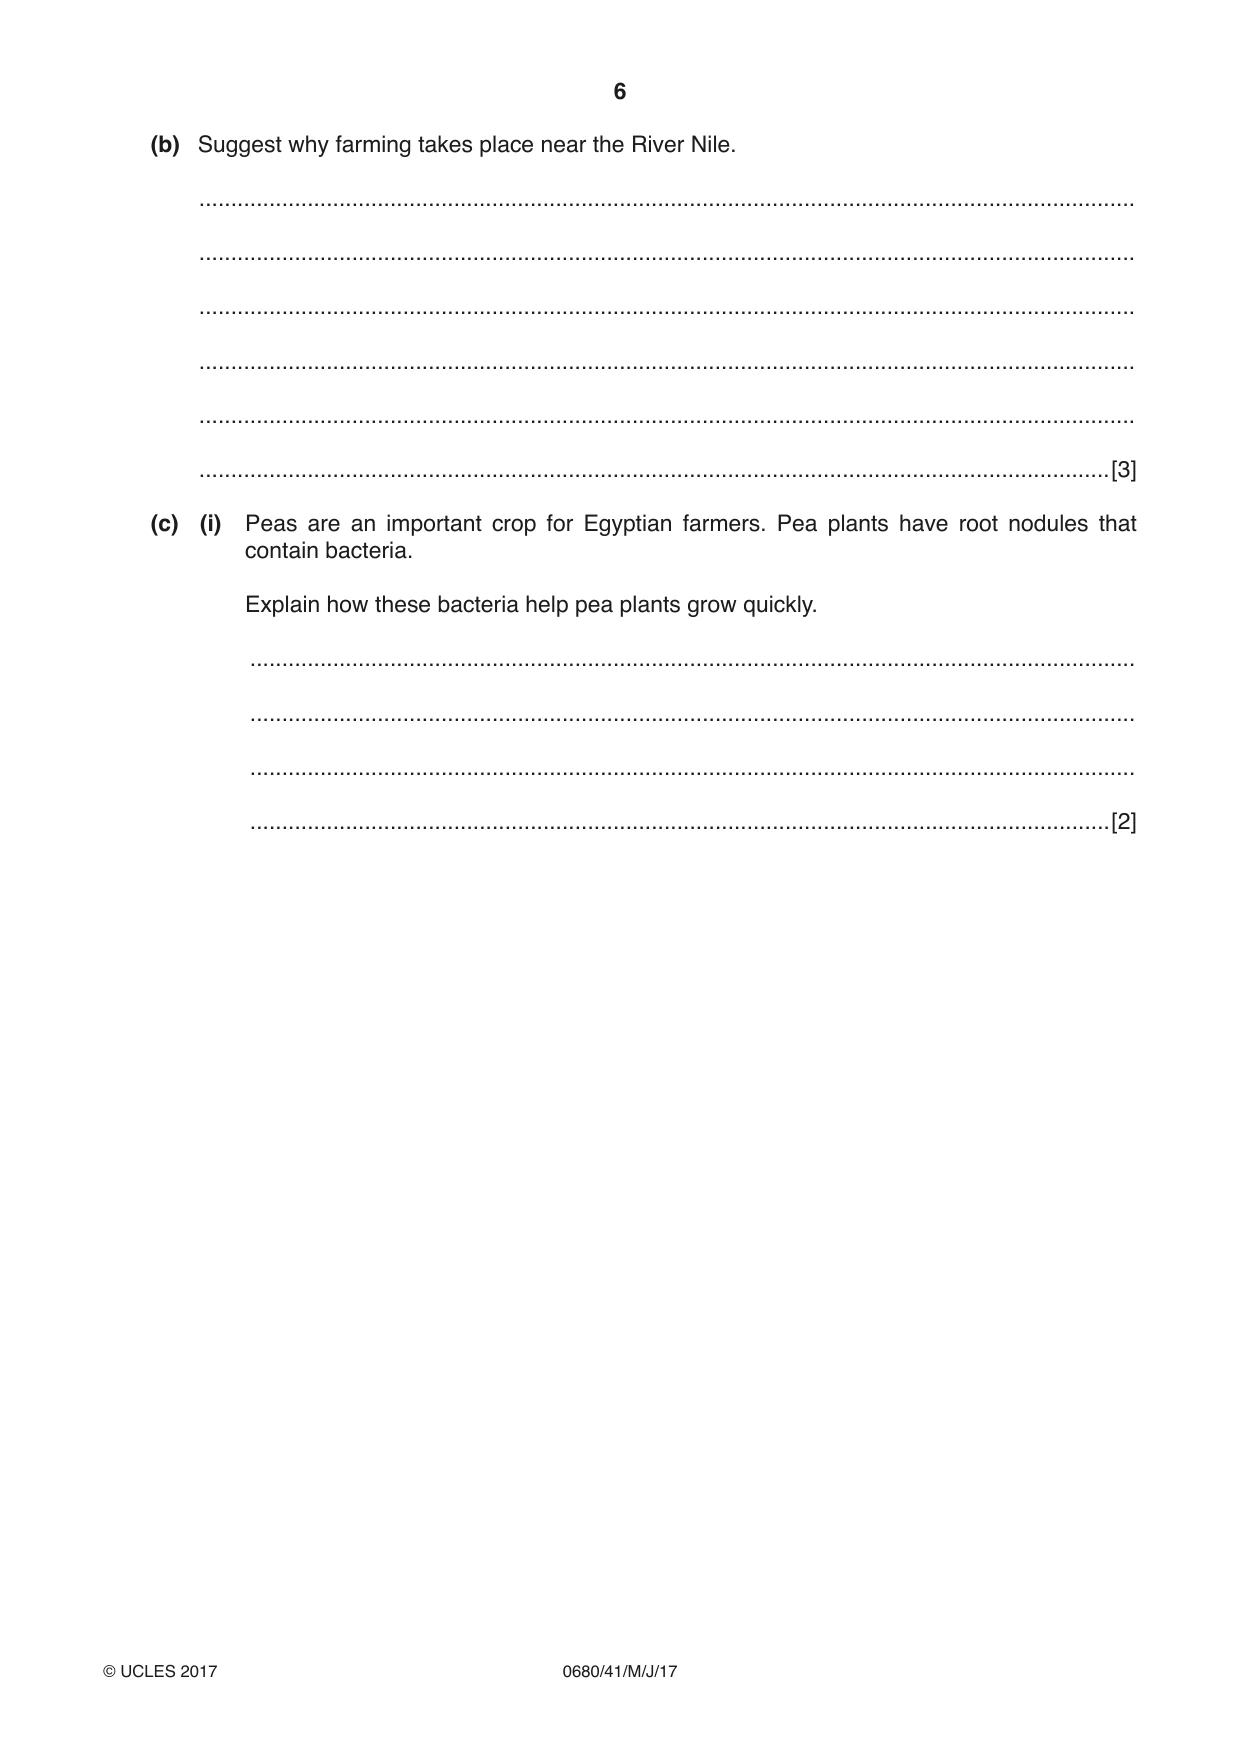
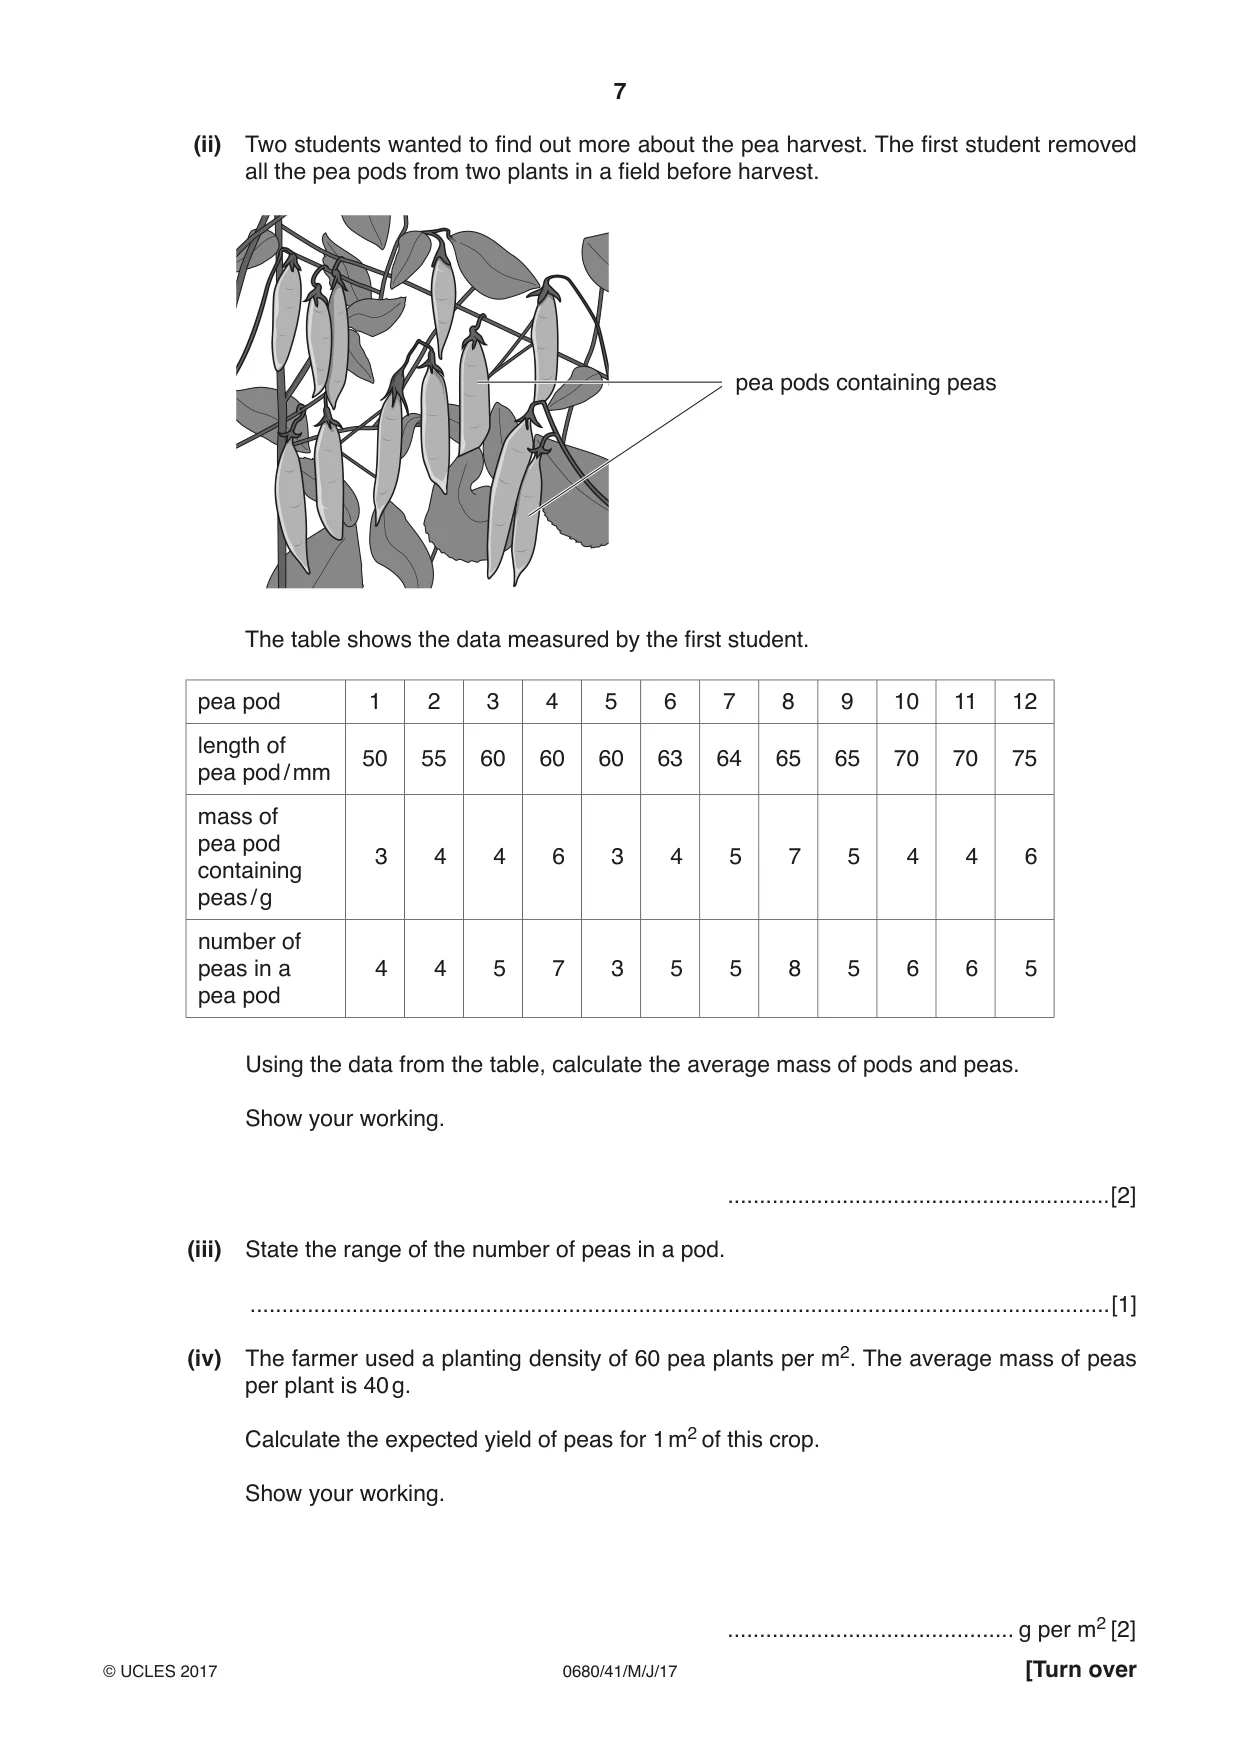
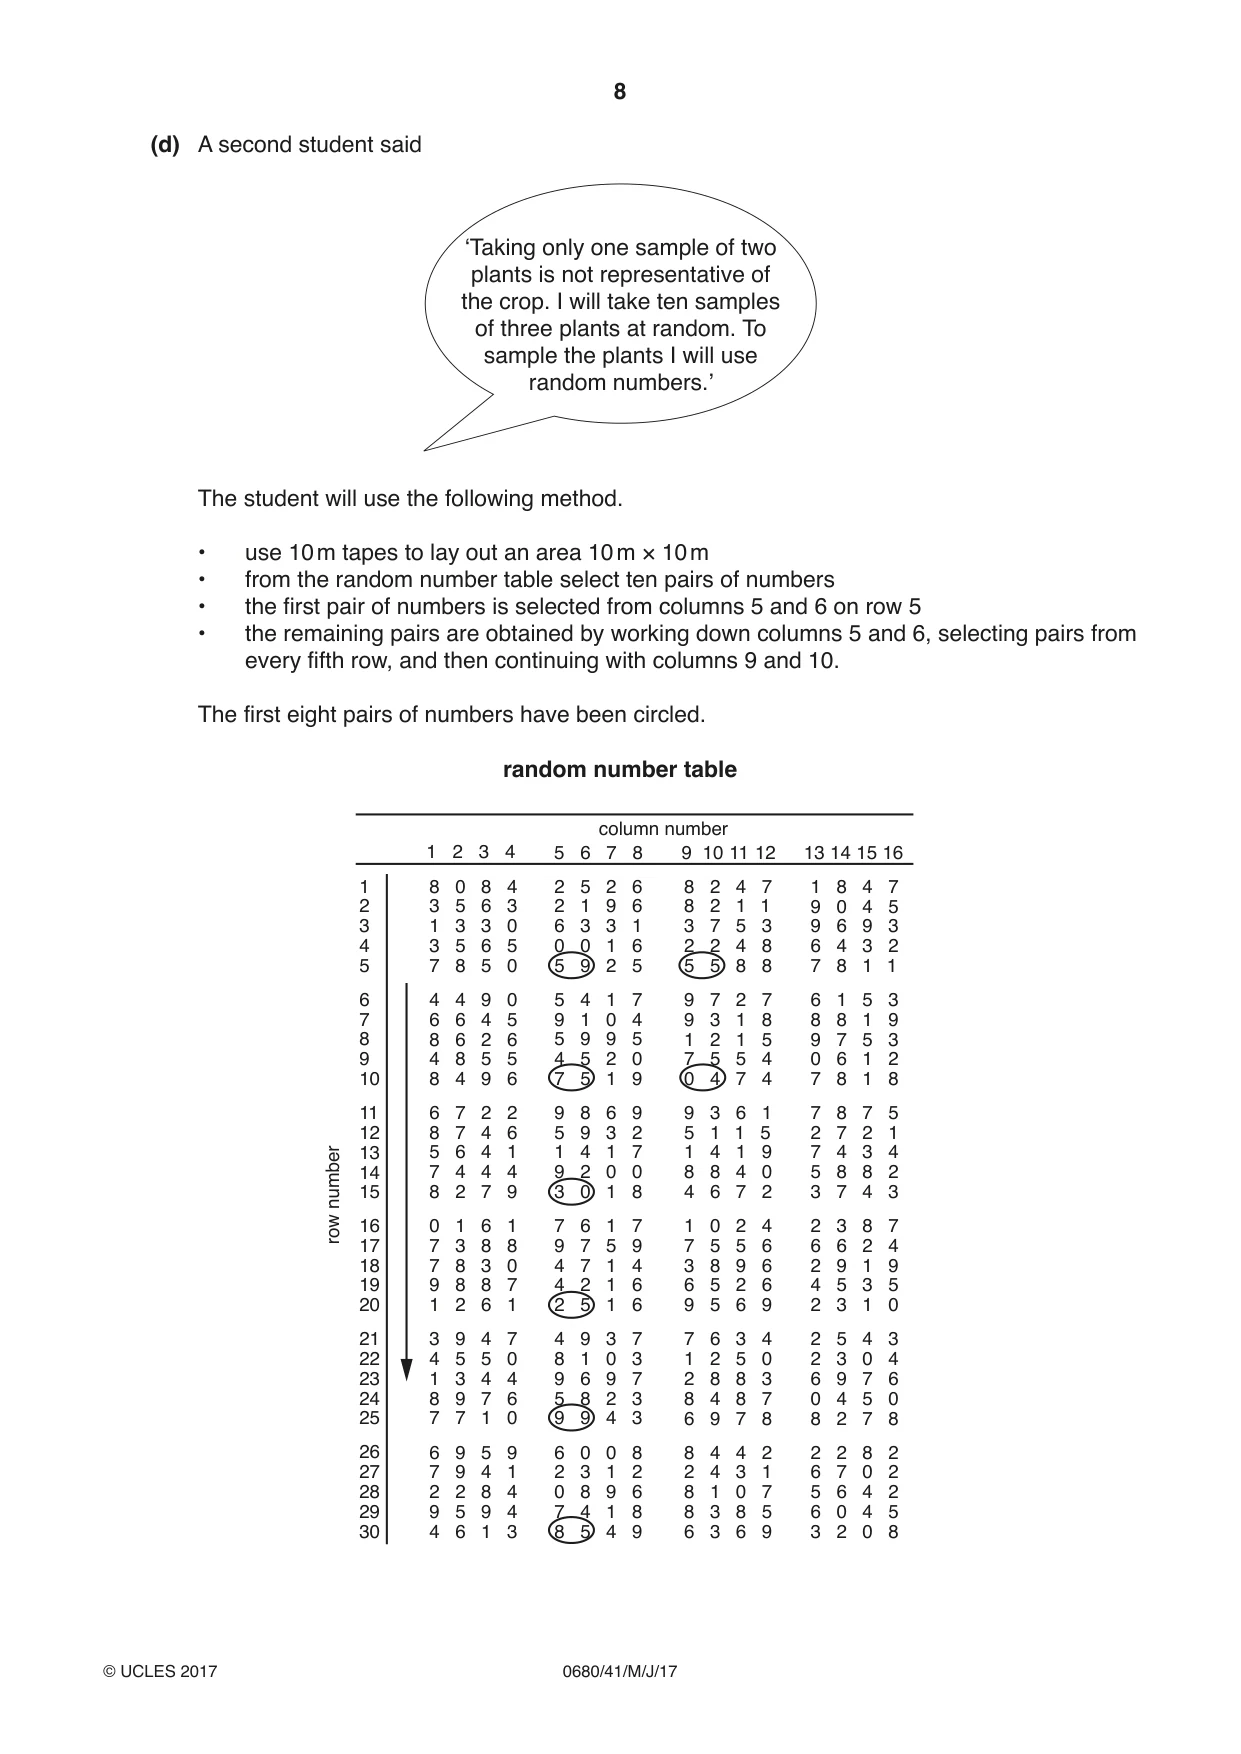
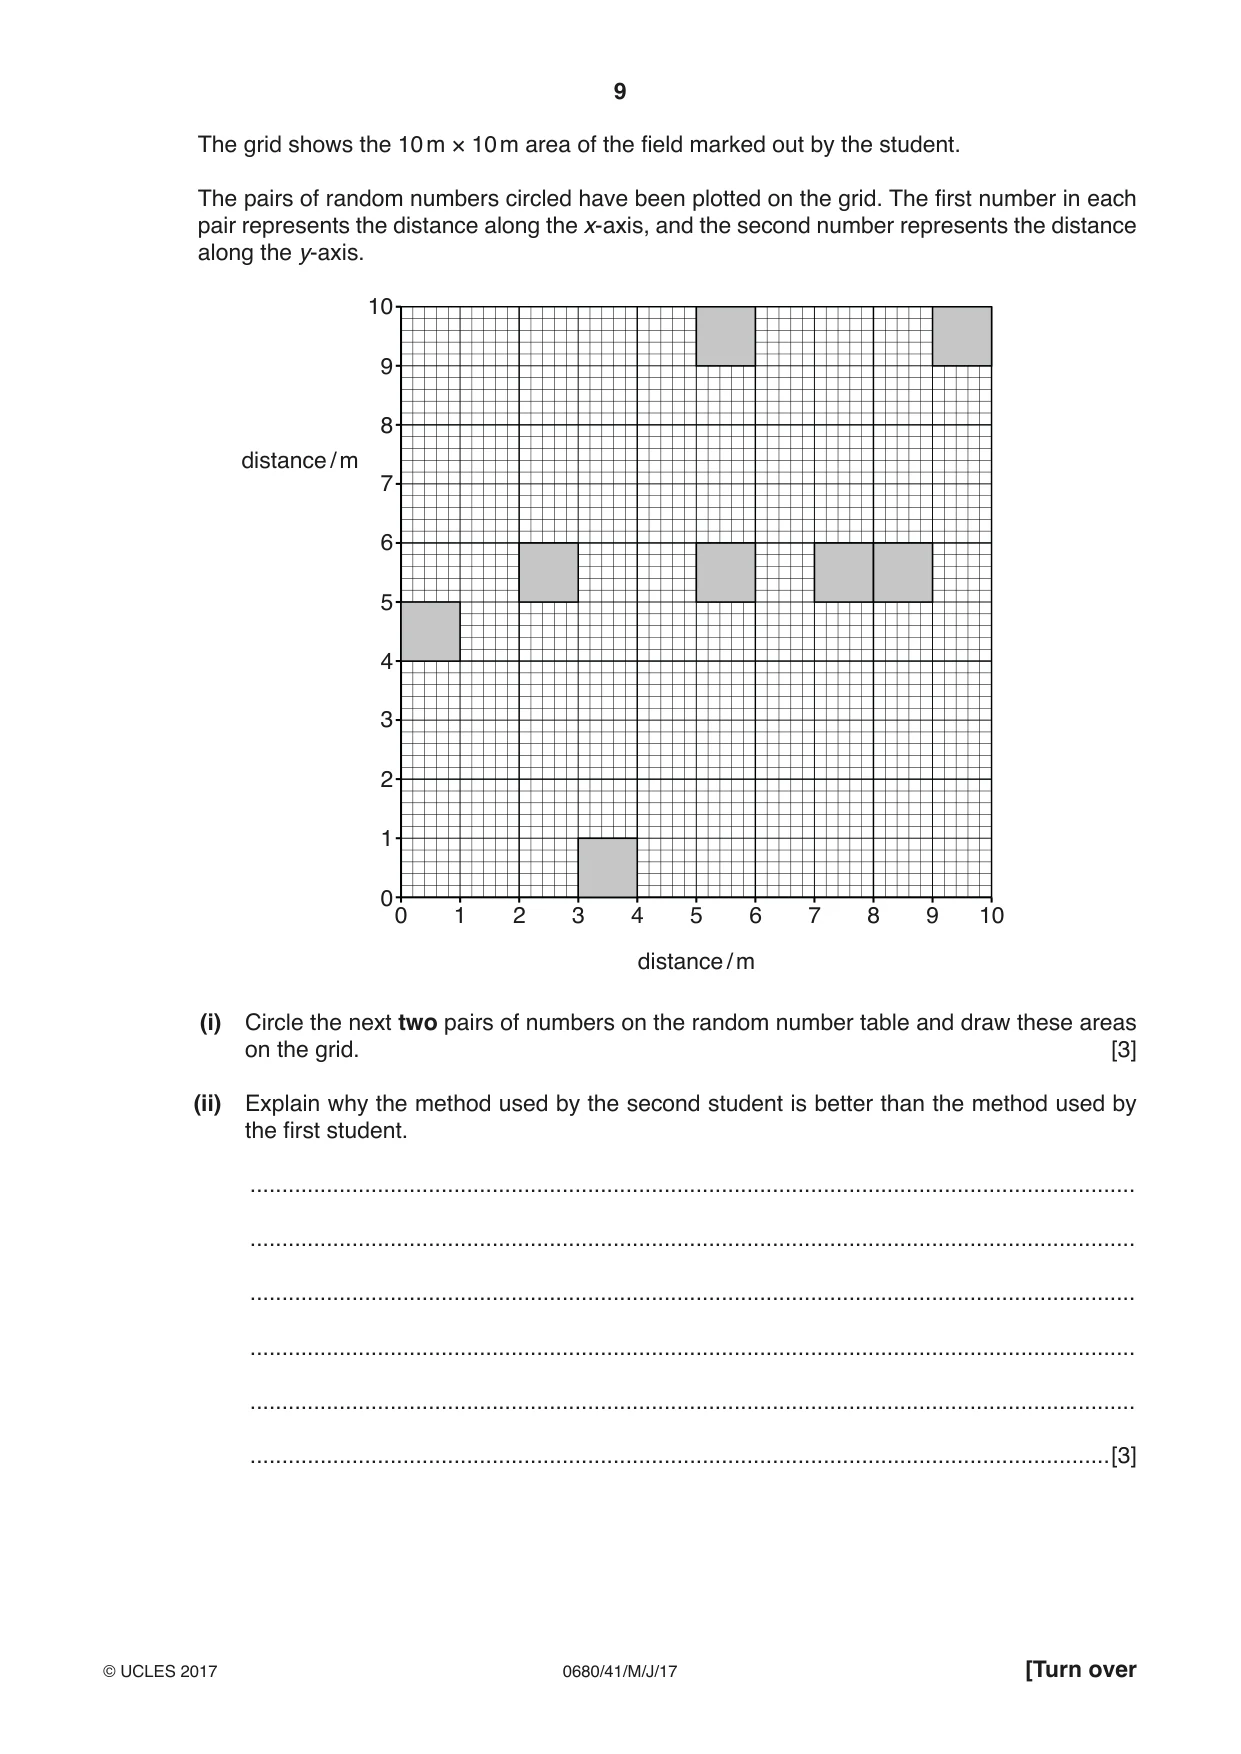
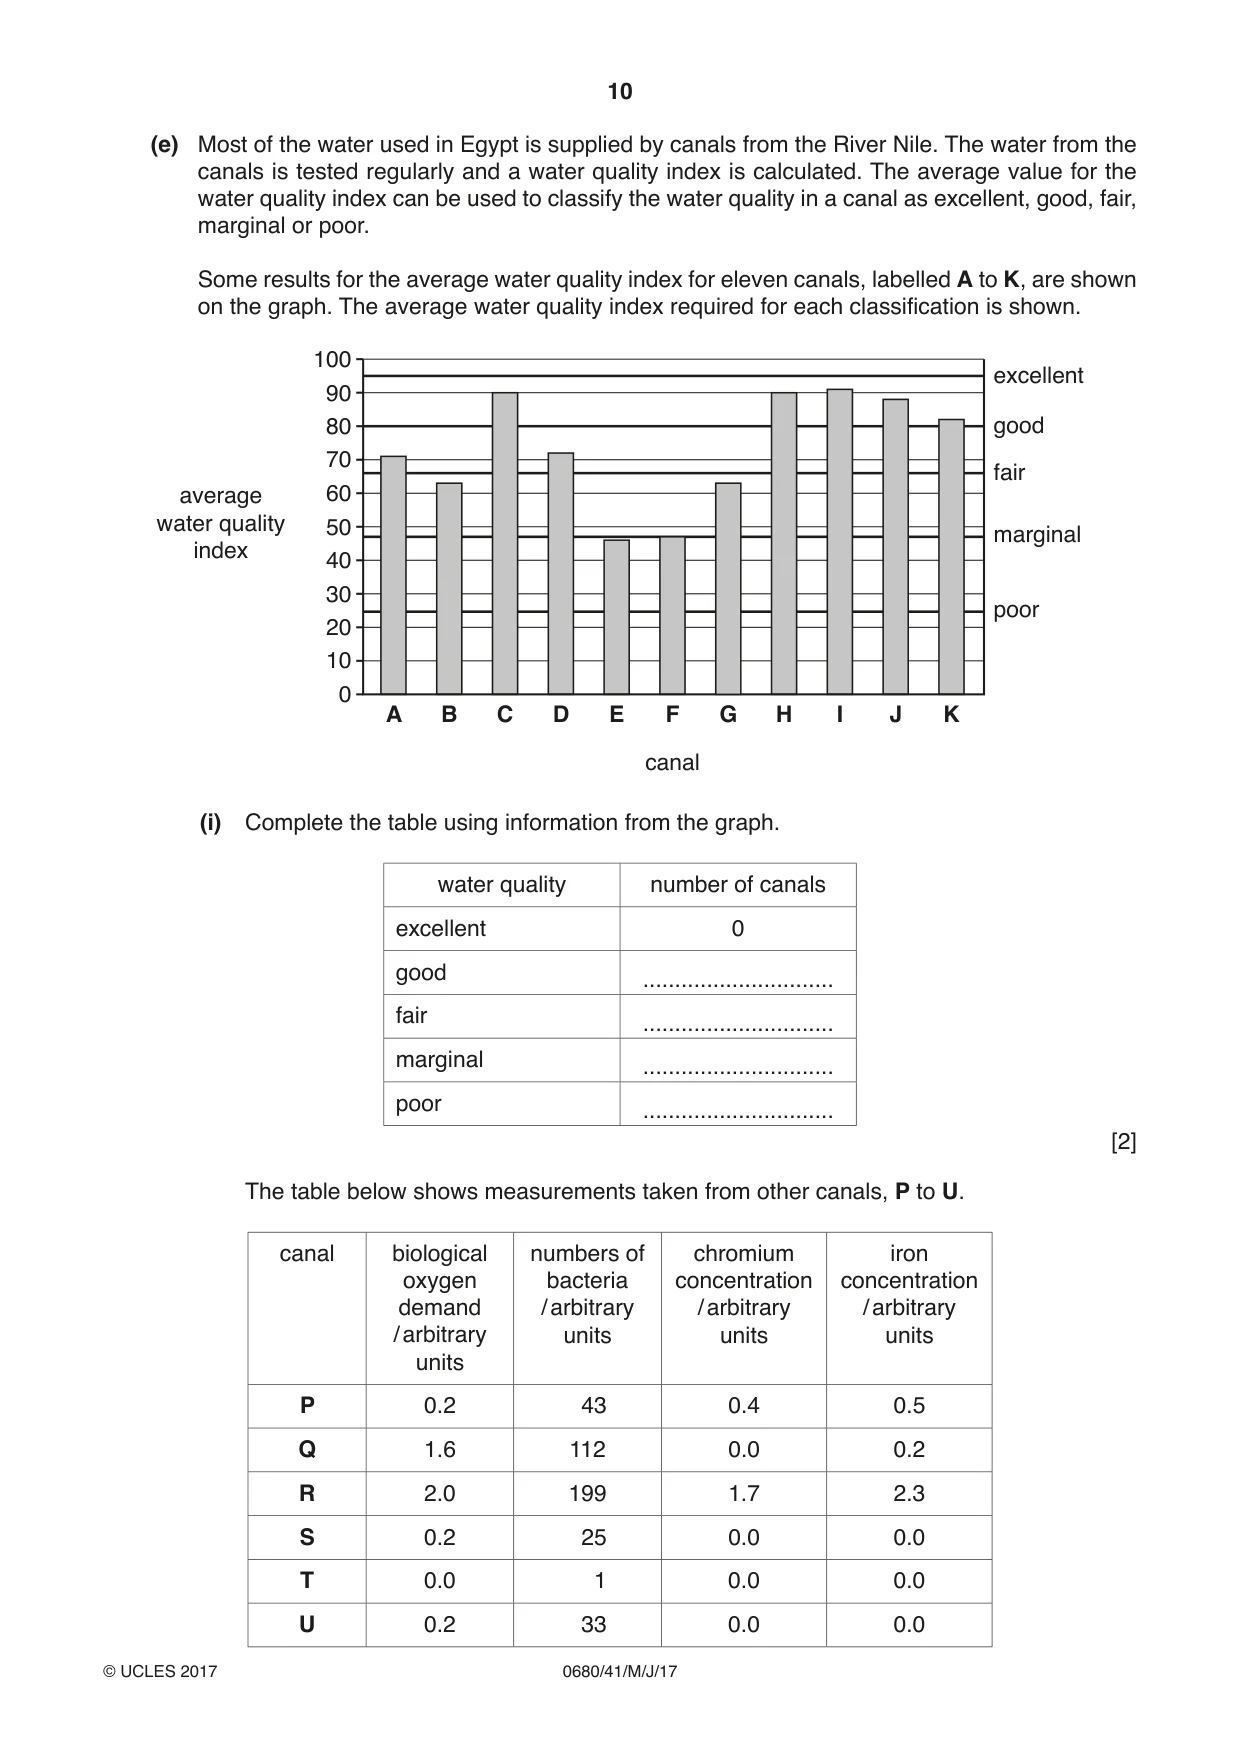
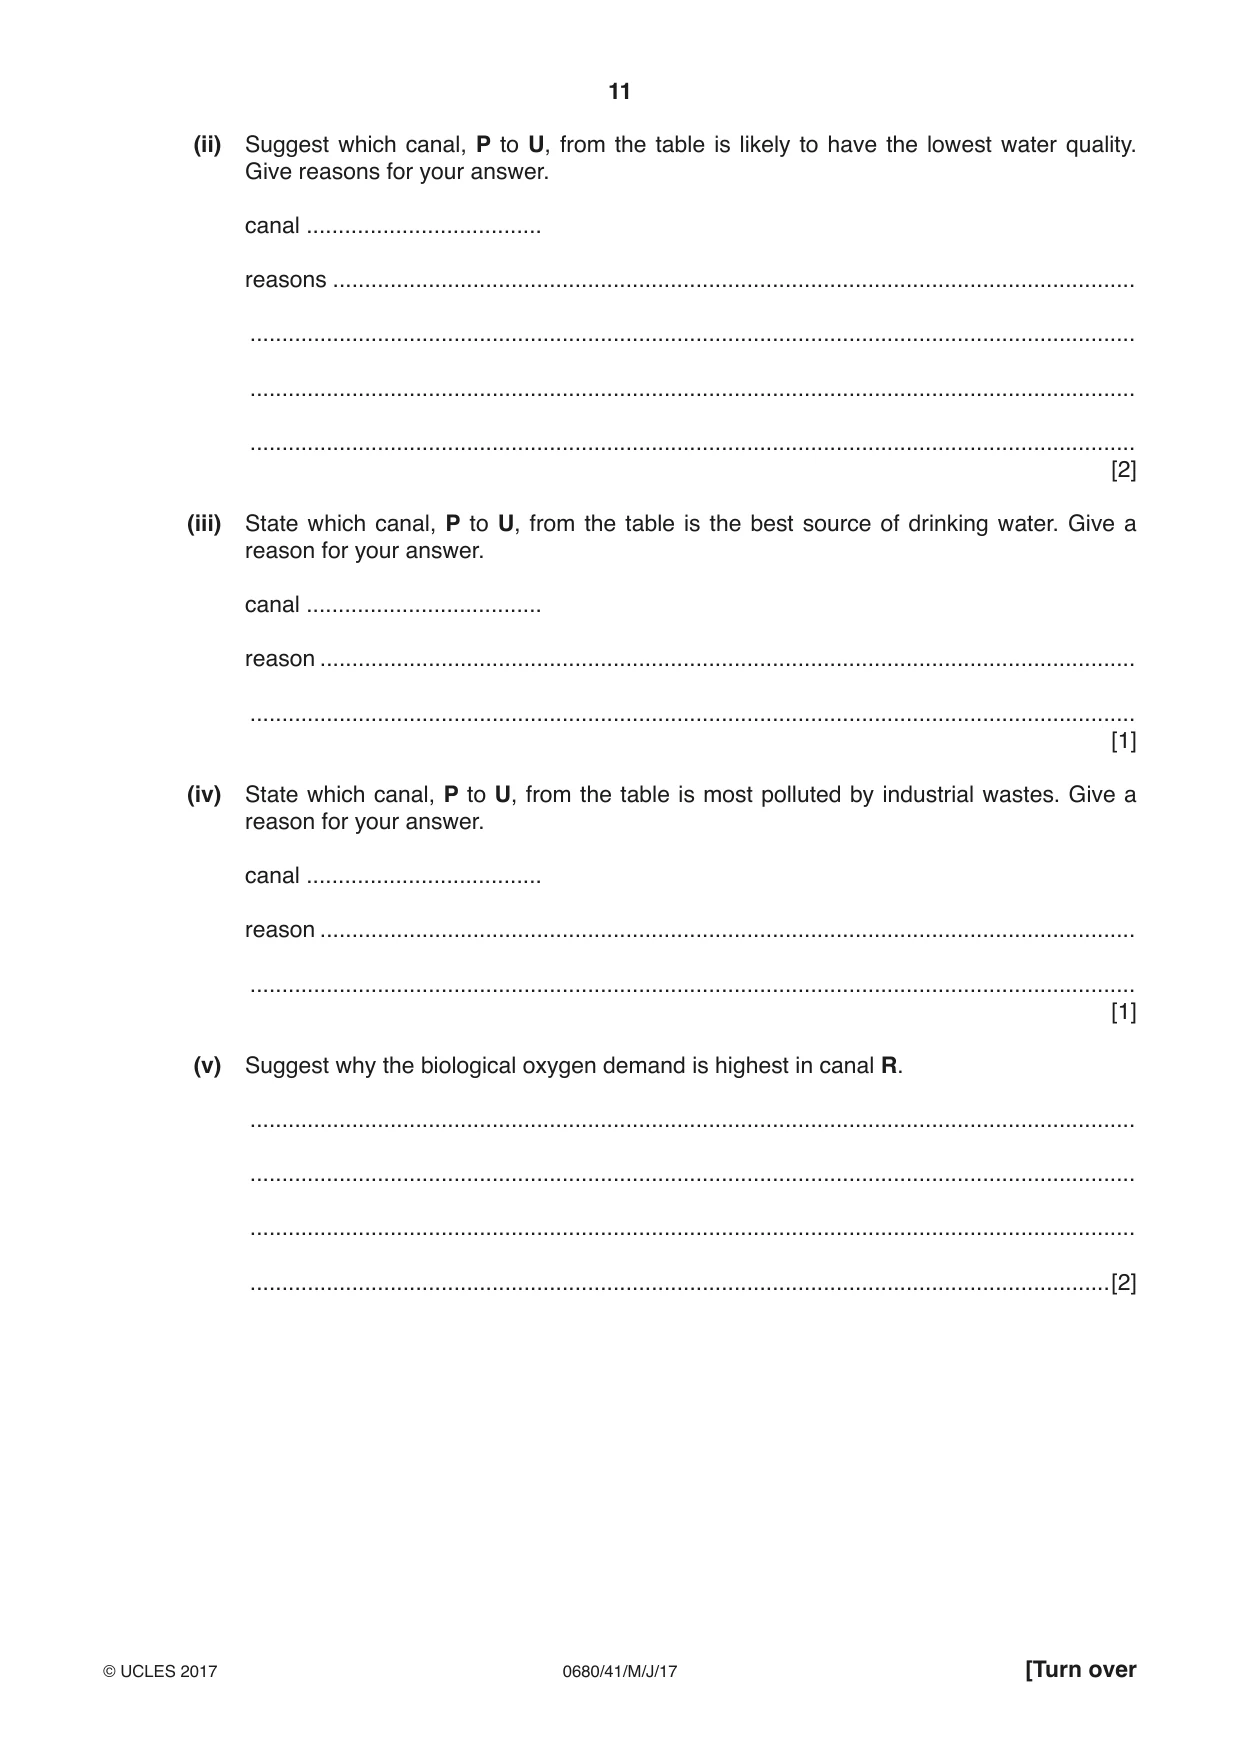
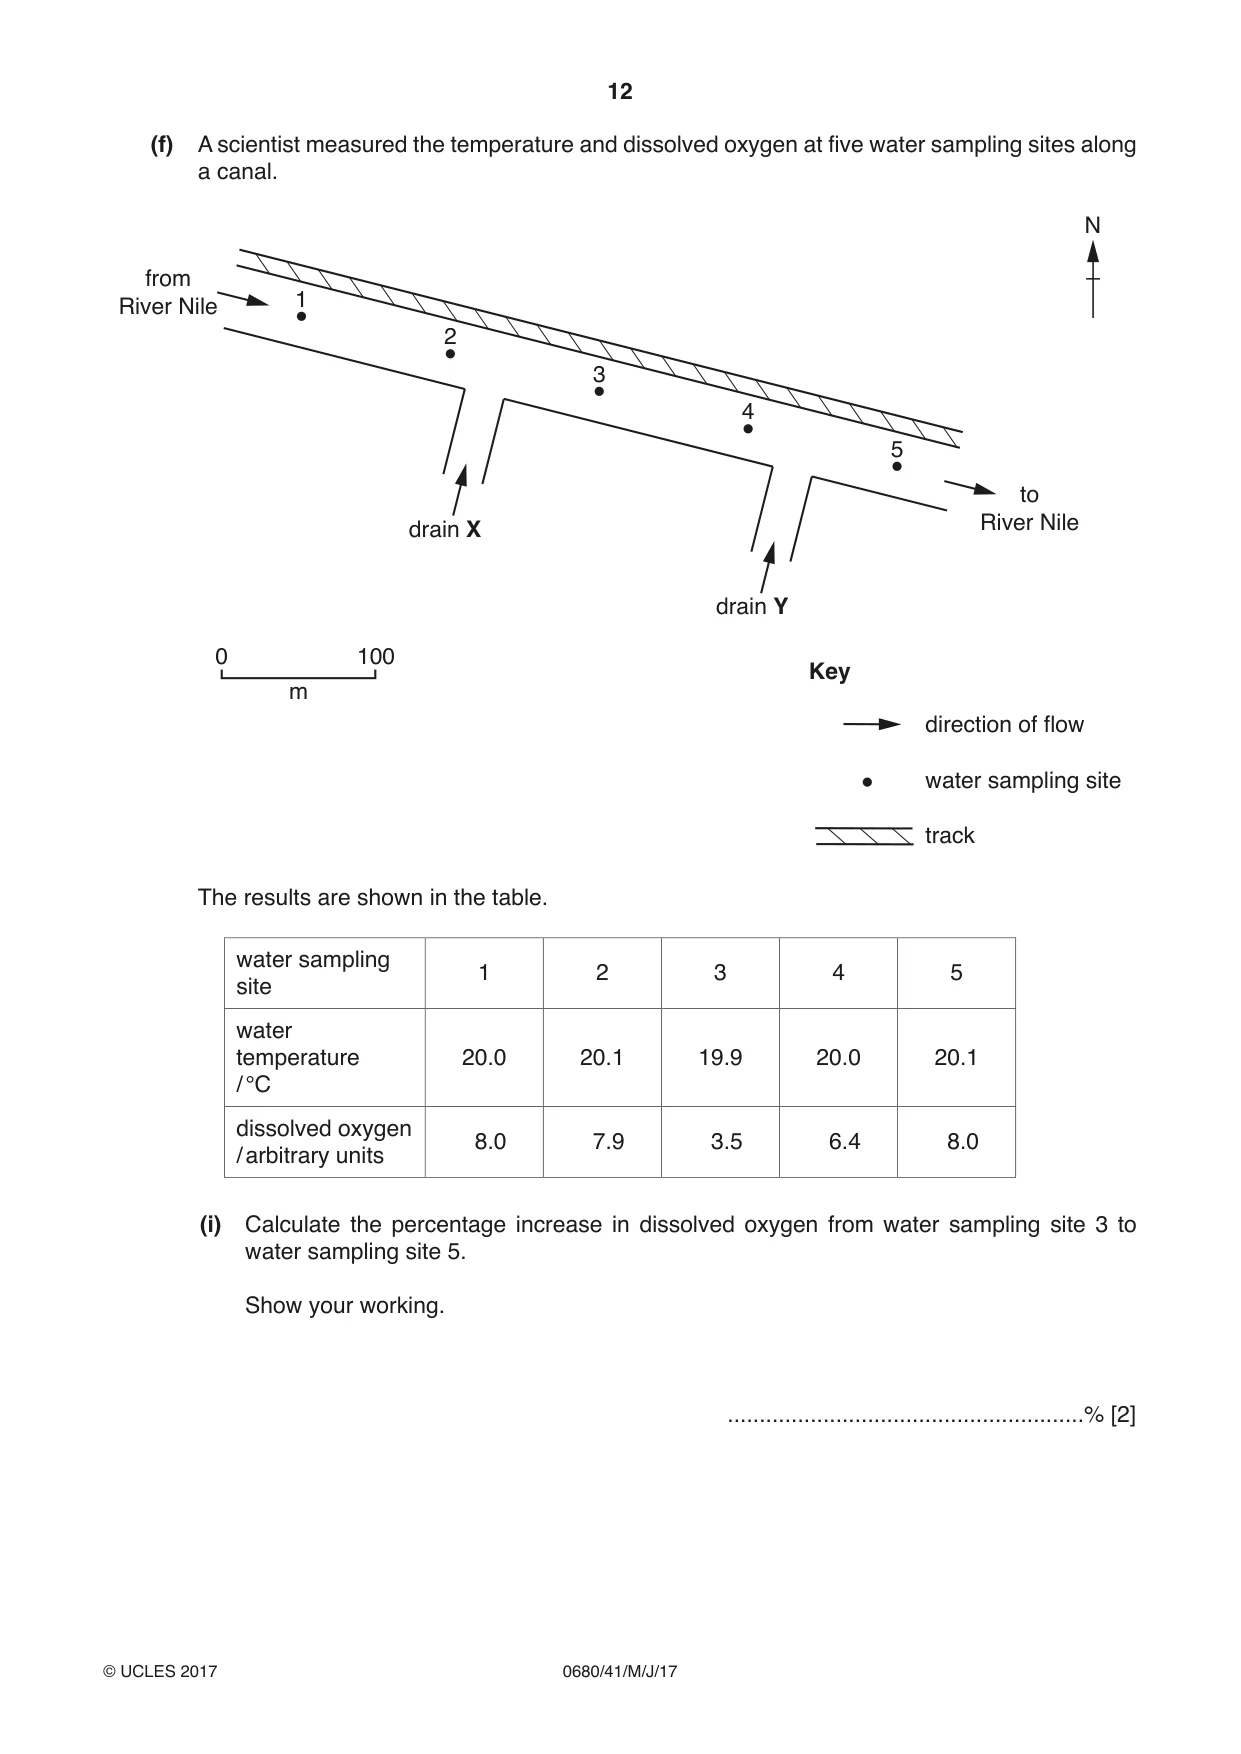
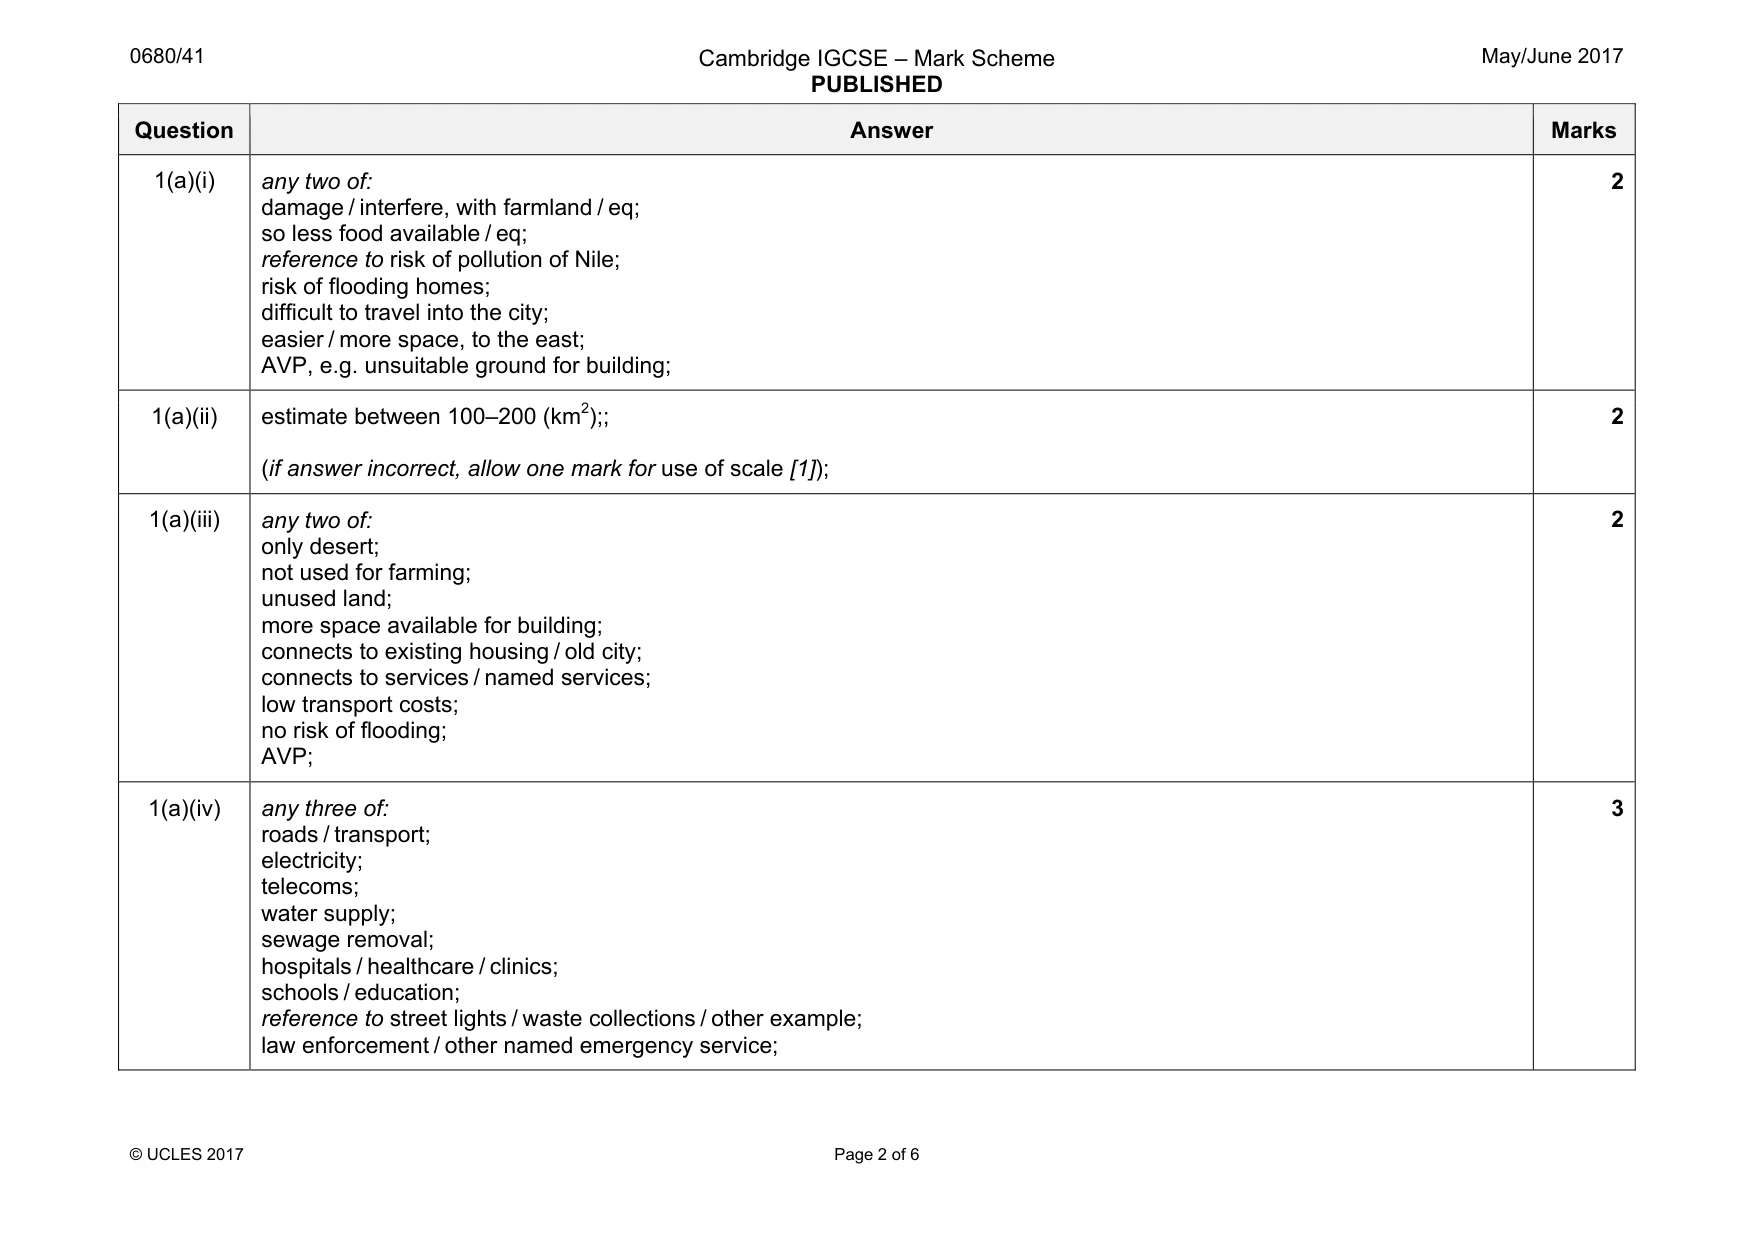
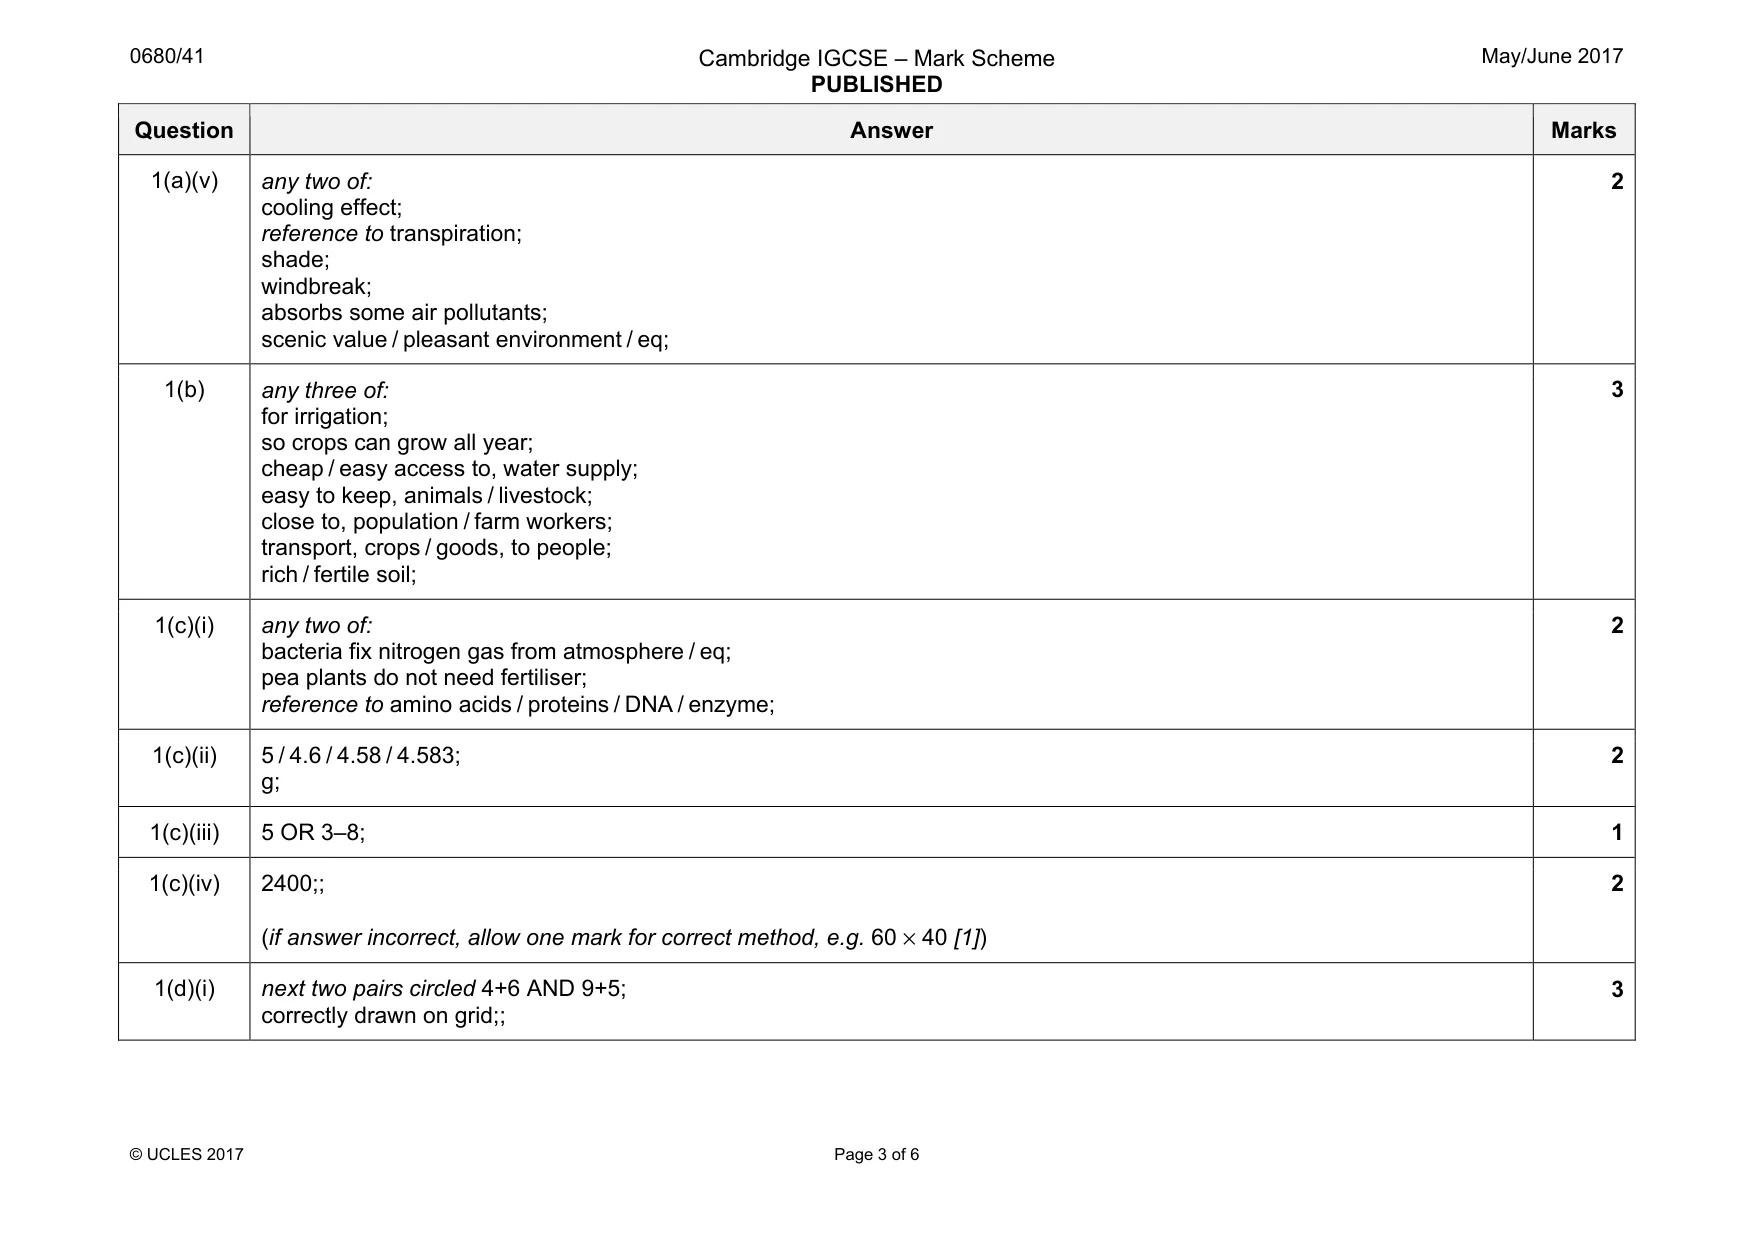
1 In Egypt most economic activity takes place near the River Nile. The economy relies on exports of manufactured goods, construction and tourism. The Suez Canal links the Red Sea to the Mediterranean Sea and provides income for the country. Cairo is the capital city. It is the main industrial and business centre of Egypt. A quarter of Egypt’s population lives in Cairo and the population of Cairo is growing at 3% per year. Most Egyptians still have a low standard of living. (a) The map shows a development plan for Cairo. N 0 10 km Key River Nile old city housing farming areas new housing development desert (i) The Cairo city authorities considered a new housing development to the north and east of the city boundary. They decided only to allow development to the east. Using the maps, suggest two reasons why the city authorities decided not to allow development to the north of the city. ........................................................................................................................................... ........................................................................................................................................... ........................................................................................................................................... .......................................................................................................................................[2] (ii) Estimate the area of the new housing development. Show your working. .................................................... km2 [2] (iii) Suggest two advantages of developing to the east of Cairo. ........................................................................................................................................... ........................................................................................................................................... ........................................................................................................................................... .......................................................................................................................................[2] (iv) State three services that must be provided in the new housing development. ........................................................................................................................................... ........................................................................................................................................... .......................................................................................................................................[3] (v) Suggest why the city authorities want many trees to be planted as part of the new housing development. ........................................................................................................................................... ........................................................................................................................................... ........................................................................................................................................... .......................................................................................................................................[2] (b) Suggest why farming takes place near the River Nile. ................................................................................................................................................... ................................................................................................................................................... ................................................................................................................................................... ................................................................................................................................................... ................................................................................................................................................... ...............................................................................................................................................[3] (c) (i) Peas are an important crop for Egyptian farmers. Pea plants have root nodules that contain bacteria. Explain how these bacteria help pea plants grow quickly. ........................................................................................................................................... ........................................................................................................................................... ........................................................................................................................................... .......................................................................................................................................[2] (ii) Two students wanted to find out more about the pea harvest. The first student removed all the pea pods from two plants in a field before harvest. pea pods containing peas The table shows the data measured by the first student. pea pod 1 2 3 4 5 6 7 8 9 10 11 12 length of 50 55 60 60 60 63 64 65 65 70 70 75 pea pod / mm mass of pea pod 3 4 4 6 3 4 5 7 5 4 4 6 containing peas / g number of peas in a 4 4 5 7 3 5 5 8 5 6 6 5 pea pod Using the data from the table, calculate the average mass of pods and peas. Show your working. ............................................................[2] (iii) State the range of the number of peas in a pod. .......................................................................................................................................[1] (iv) The farmer used a planting density of 60 pea plants per m2. The average mass of peas per plant is 40 g. Calculate the expected yield of peas for 1 m2 of this crop. Show your working. ............................................. g per m2 [2] (d) A second student said ‘Taking only one sample of two plants is not representative of the crop. I will take ten samples of three plants at random. To sample the plants I will use random numbers.’ The student will use the following method. • use 10 m tapes to lay out an area 10 m × 10 m • from the random number table select ten pairs of numbers • the first pair of numbers is selected from columns 5 and 6 on row 5 • the remaining pairs are obtained by working down columns 5 and 6, selecting pairs from every fifth row, and then continuing with columns 9 and 10. The first eight pairs of numbers have been circled. random number table column number 1 2 3 4 5 6 7 8 9 10 11 12 13 14 15 16 1 8 0 8 4 2 5 2 6 8 2 4 7 1 8 4 7 2 3 5 6 3 2 1 9 6 8 2 1 1 9 0 4 5 3 1 3 3 0 6 3 3 1 3 7 5 3 9 6 9 3 4 3 5 6 5 0 0 1 6 2 2 4 8 6 4 3 2 5 7 8 5 0 5 9 2 5 5 5 8 8 7 8 1 1 6 4 4 9 0 5 4 1 7 9 7 2 7 6 1 5 3 7 6 6 4 5 9 1 0 4 9 3 1 8 8 8 1 9 8 8 6 2 6 5 9 9 5 1 2 1 5 9 7 5 3 9 4 8 5 5 4 5 2 0 7 5 5 4 0 6 1 2 10 8 4 9 6 7 5 1 9 0 4 7 4 7 8 1 8 11 6 7 2 2 9 8 6 9 9 3 6 1 7 8 7 5 12 8 7 4 6 5 9 3 2 5 1 1 5 2 7 2 1 13 5 6 4 1 1 4 1 7 1 4 1 9 7 4 3 4 14 7 4 4 4 9 2 0 0 8 8 4 0 5 8 8 2 number 15 8 2 7 9 3 0 1 8 4 6 7 2 3 7 4 3 row 16 0 1 6 1 7 6 1 7 1 0 2 4 2 3 8 7 17 7 3 8 8 9 7 5 9 7 5 5 6 6 6 2 4 18 7 8 3 0 4 7 1 4 3 8 9 6 2 9 1 9 19 9 8 8 7 4 2 1 6 6 5 2 6 4 5 3 5 20 1 2 6 1 2 5 1 6 9 5 6 9 2 3 1 0 21 3 9 4 7 4 9 3 7 7 6 3 4 2 5 4 3 22 4 5 5 0 8 1 0 3 1 2 5 0 2 3 0 4 23 1 3 4 4 9 6 9 7 2 8 8 3 6 9 7 6 24 8 9 7 6 5 8 2 3 8 4 8 7 0 4 5 0 25 7 7 1 0 9 9 4 3 6 9 7 8 8 2 7 8 26 6 9 5 9 6 0 0 8 8 4 4 2 2 2 8 2 27 7 9 4 1 2 3 1 2 2 4 3 1 6 7 0 2 28 2 2 8 4 0 8 9 6 8 1 0 7 5 6 4 2 29 9 5 9 4 7 4 1 8 8 3 8 5 6 0 4 5 30 4 6 1 3 8 5 4 9 6 3 6 9 3 2 0 8 The grid shows the 10 m × 10 m area of the field marked out by the student. The pairs of random numbers circled have been plotted on the grid. The first number in each pair represents the distance along the x-axis, and the second number represents the distance along the y-axis. 10 9 8 distance / m 7 6 5 4 3 2 1 0 0 1 2 3 4 5 6 7 8 9 10 distance / m (i) Circle the next two pairs of numbers on the random number table and draw these areas on the grid. [3] (ii) Explain why the method used by the second student is better than the method used by the first student. ........................................................................................................................................... ........................................................................................................................................... ........................................................................................................................................... ........................................................................................................................................... ........................................................................................................................................... .......................................................................................................................................[3] (e) Most of the water used in Egypt is supplied by canals from the River Nile. The water from the canals is tested regularly and a water quality index is calculated. The average value for the water quality index can be used to classify the water quality in a canal as excellent, good, fair, marginal or poor. Some results for the average water quality index for eleven canals, labelled A to K, are shown on the graph. The average water quality index required for each classification is shown. 100 excellent 90 80 good 70 fair average 60 water quality 50 marginal index 40 30 poor 20 10 0 A B C D E F G H I J K canal (i) Complete the table using information from the graph. water quality number of canals excellent 0 good .............................. fair .............................. marginal .............................. poor .............................. [2] The table below shows measurements taken from other canals, P to U. canal biological numbers of chromium iron oxygen bacteria concentration concentration demand / arbitrary / arbitrary / arbitrary / arbitrary units units units units P 0.2 43 0.4 0.5 Q 1.6 112 0.0 0.2 R 2.0 199 1.7 2.3 S 0.2 25 0.0 0.0 T 0.0 1 0.0 0.0 U 0.2 33 0.0 0.0 (ii) Suggest which canal, P to U, from the table is likely to have the lowest water quality. Give reasons for your answer. canal ..................................... reasons .............................................................................................................................. ........................................................................................................................................... ........................................................................................................................................... ........................................................................................................................................... [2] (iii) State which canal, P to U, from the table is the best source of drinking water. Give a reason for your answer. canal ..................................... reason ................................................................................................................................ ........................................................................................................................................... [1] (iv) State which canal, P to U, from the table is most polluted by industrial wastes. Give a reason for your answer. canal ..................................... reason ................................................................................................................................ ........................................................................................................................................... [1] (v) Suggest why the biological oxygen demand is highest in canal R. ........................................................................................................................................... ........................................................................................................................................... ........................................................................................................................................... .......................................................................................................................................[2] (f) A scientist measured the temperature and dissolved oxygen at five water sampling sites along a canal. N from 1River Nile 2 3 4 5 to River Nile drain X drain Y 0 100 Key m direction of flow water sampling site track The results are shown in the table. water sampling 1 2 3 4 5 site water temperature 20.0 20.1 19.9 20.0 20.1 / °C dissolved oxygen 8.0 7.9 3.5 6.4 8.0 / arbitrary units (i) Calculate the percentage increase in dissolved oxygen from water sampling site 3 to water sampling site 5. Show your working. ........................................................% [2] (ii) Suggest why the scientist measured the water temperature at each sampling site. ........................................................................................................................................... .......................................................................................................................................[1] (iii) The scientist decided that drain X was a source of pollution for the canal. Explain why. ........................................................................................................................................... ........................................................................................................................................... ........................................................................................................................................... .......................................................................................................................................[2] (g) The demand for water in Egypt is predicted to increase to 88 billion cubic metres by 2017. Suggest ways in which the quality of water supplies can be maintained in Egypt. ................................................................................................................................................... ................................................................................................................................................... ................................................................................................................................................... ................................................................................................................................................... ................................................................................................................................................... ...............................................................................................................................................[3]
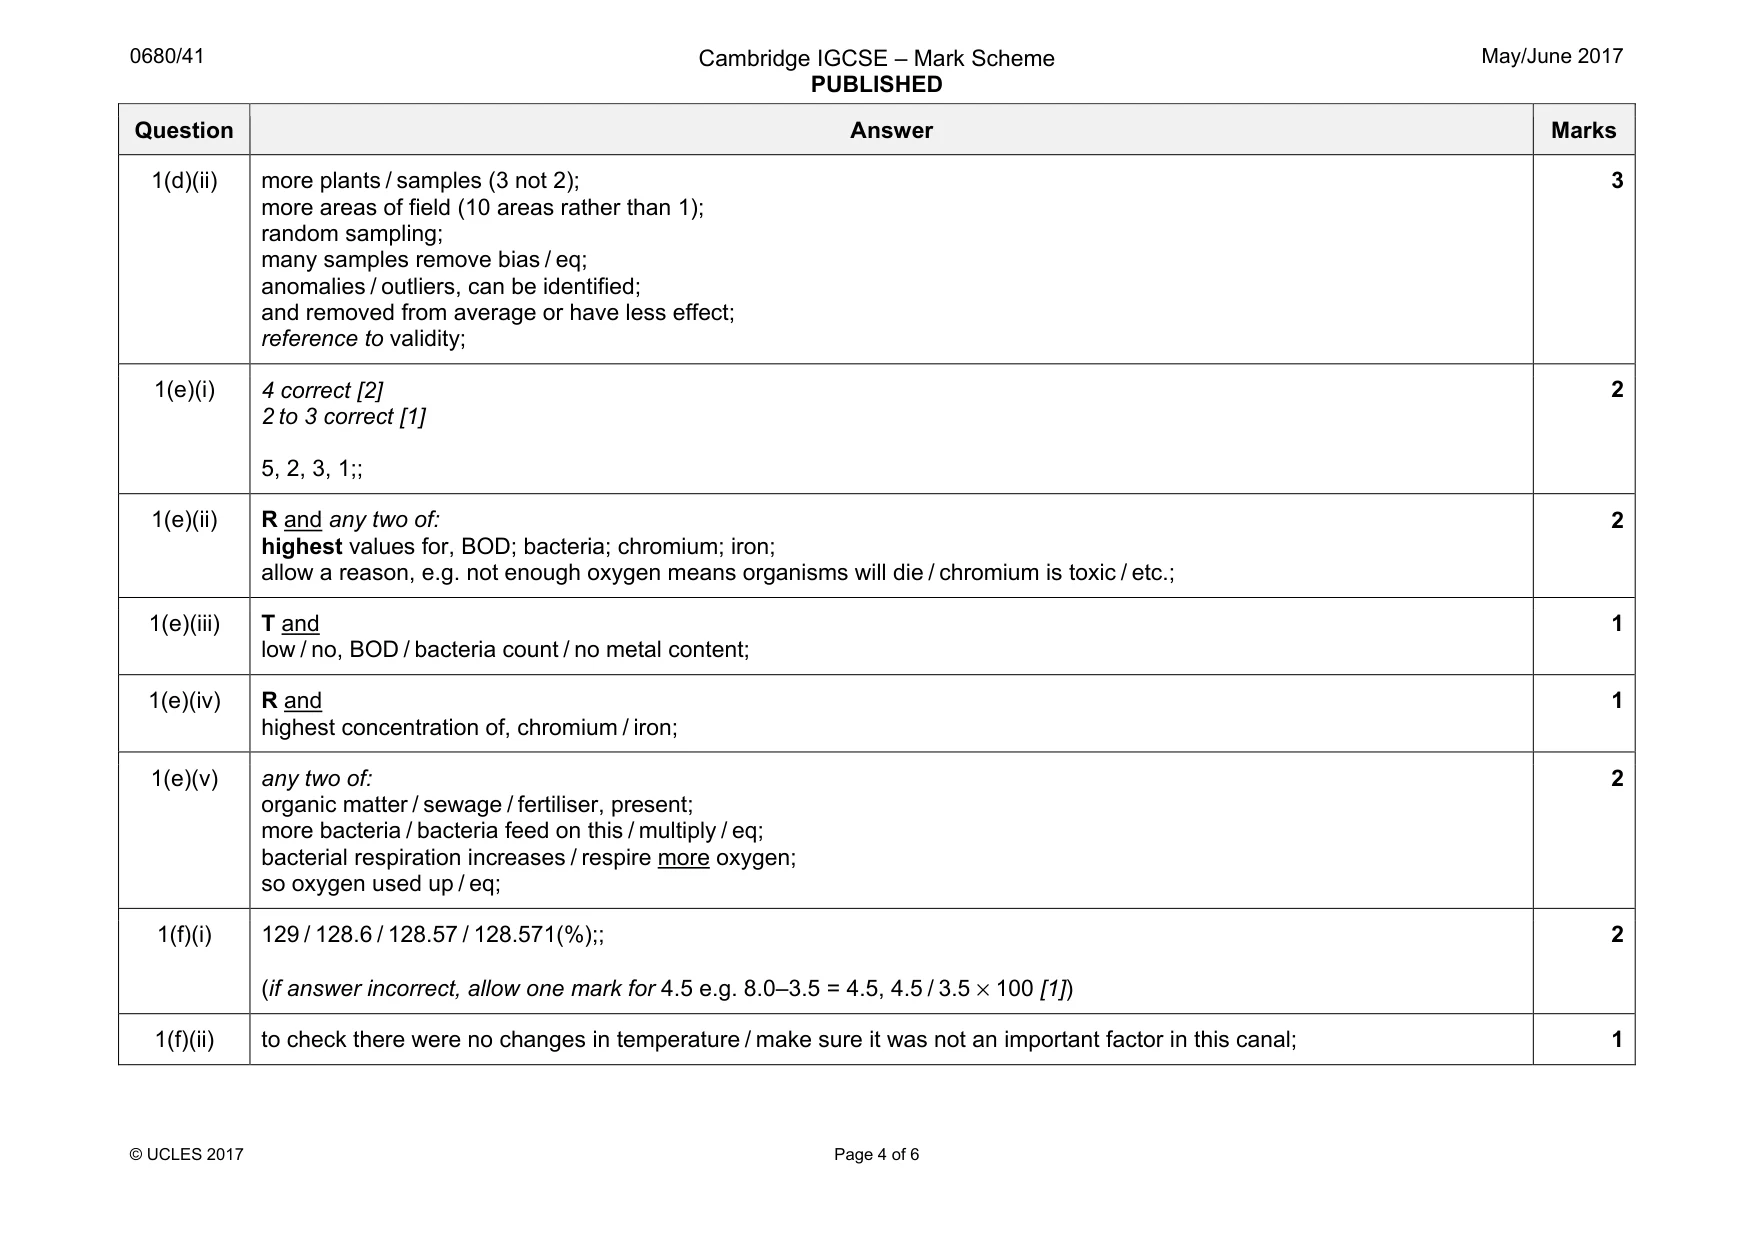
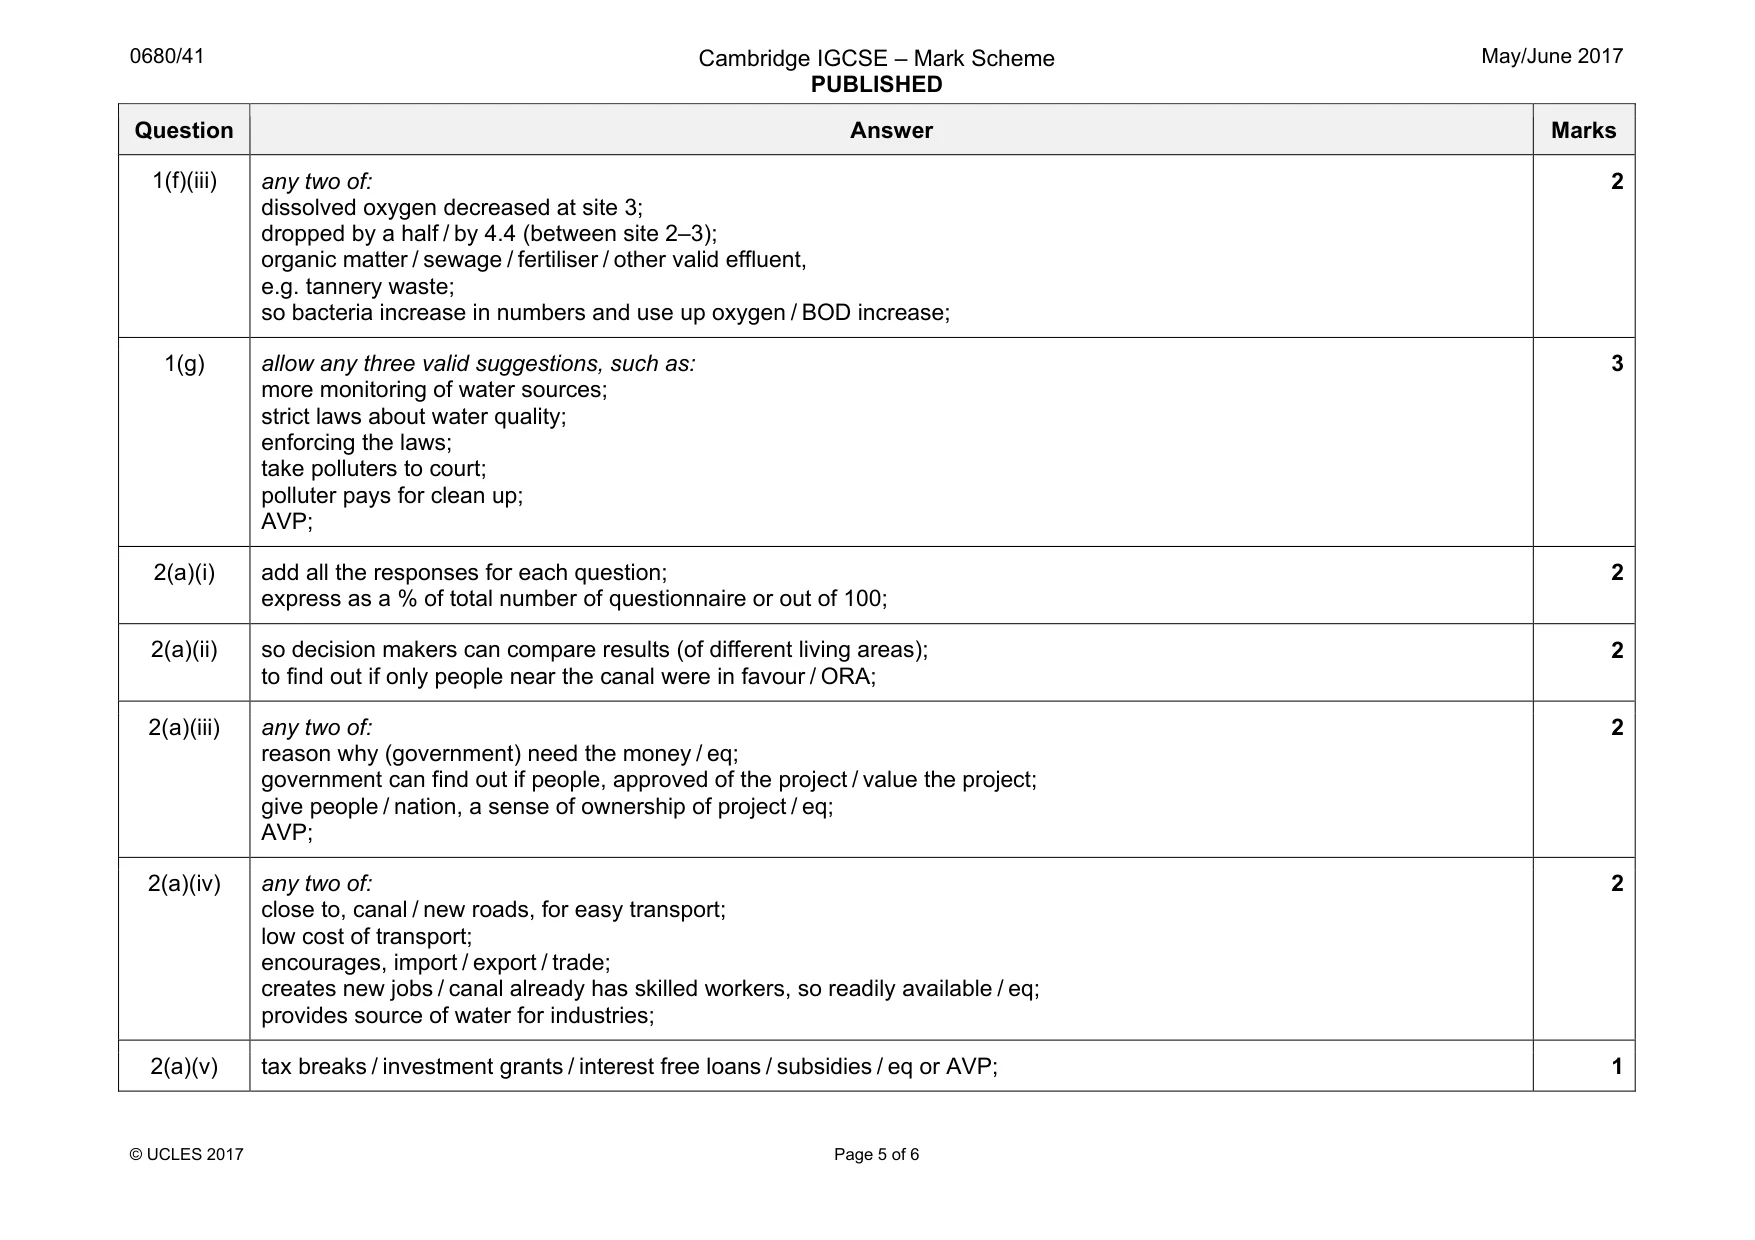
Mark scheme: 1(a)(i) any two of: damage / interfere, with farmland / eq; so less food available / eq; reference to risk of pollution of Nile; risk of flooding homes; difficult to travel into the city; easier / more space, to the east; AVP, e.g. unsuitable ground for building; 2 1(a)(ii) estimate between 100–200 (km2);; (if answer incorrect, allow one mark for use of scale [1]); 2 1(a)(iii) any two of: only desert; not used for farming; unused land; more space available for building; connects to existing housing / old city; connects to services / named services; low transport costs; no risk of flooding; AVP; 2 1(a)(iv) any three of: roads / transport; electricity; telecoms; water supply; sewage removal; hospitals / healthcare / clinics; schools / education; reference to street lights / waste collections / other example; law enforcement / other named emergency service; 3 Question Answer Marks 1(a)(v) any two of: cooling effect; reference to transpiration; shade; windbreak; absorbs some air pollutants; scenic value / pleasant environment / eq; 2 1(b) any three of: for irrigation; so crops can grow all year; cheap / easy access to, water supply; easy to keep, animals / livestock; close to, population / farm workers; transport, crops / goods, to people; rich / fertile soil; 3 1(c)(i) any two of: bacteria fix nitrogen gas from atmosphere / eq; pea plants do not need fertiliser; reference to amino acids / proteins / DNA / enzyme; 2 1(c)(ii) 5 / 4.6 / 4.58 / 4.583; g; 2 1(c)(iii) 5 OR 3–8; 1 1(c)(iv) 2400;; (if answer incorrect, allow one mark for correct method, e.g. 60 × 40 [1]) 2 1(d)(i) next two pairs circled 4+6 AND 9+5; correctly drawn on grid;; 3 Question Answer Marks 1(d)(ii) more plants / samples (3 not 2); more areas of field (10 areas rather than 1); random sampling; many samples remove bias / eq; anomalies / outliers, can be identified; and removed from average or have less effect; reference to validity; 3 1(e)(i) 4 correct [2] 2 to 3 correct [1] 5, 2, 3, 1;; 2 1(e)(ii) R and any two of: highest values for, BOD; bacteria; chromium; iron; allow a reason, e.g. not enough oxygen means organisms will die / chromium is toxic / etc.; 2 1(e)(iii) T and low / no, BOD / bacteria count / no metal content; 1 1(e)(iv) R and highest concentration of, chromium / iron; 1 1(e)(v) any two of: organic matter / sewage / fertiliser, present; more bacteria / bacteria feed on this / multiply / eq; bacterial respiration increases / respire more oxygen; so oxygen used up / eq; 2 1(f)(i) 129 / 128.6 / 128.57 / 128.571(%);; (if answer incorrect, allow one mark for 4.5 e.g. 8.0–3.5 = 4.5, 4.5 / 3.5 × 100 [1]) 2 1(f)(ii) to check there were no changes in temperature / make sure it was not an important factor in this canal; 1 Question Answer Marks 1(f)(iii) any two of: dissolved oxygen decreased at site 3; dropped by a half / by 4.4 (between site 2–3); organic matter / sewage / fertiliser / other valid effluent, e.g. tannery waste; so bacteria increase in numbers and use up oxygen / BOD increase; 2 1(g) allow any three valid suggestions, such as: more monitoring of water sources; strict laws about water quality; enforcing the laws; take polluters to court; polluter pays for clean up; AVP; 3
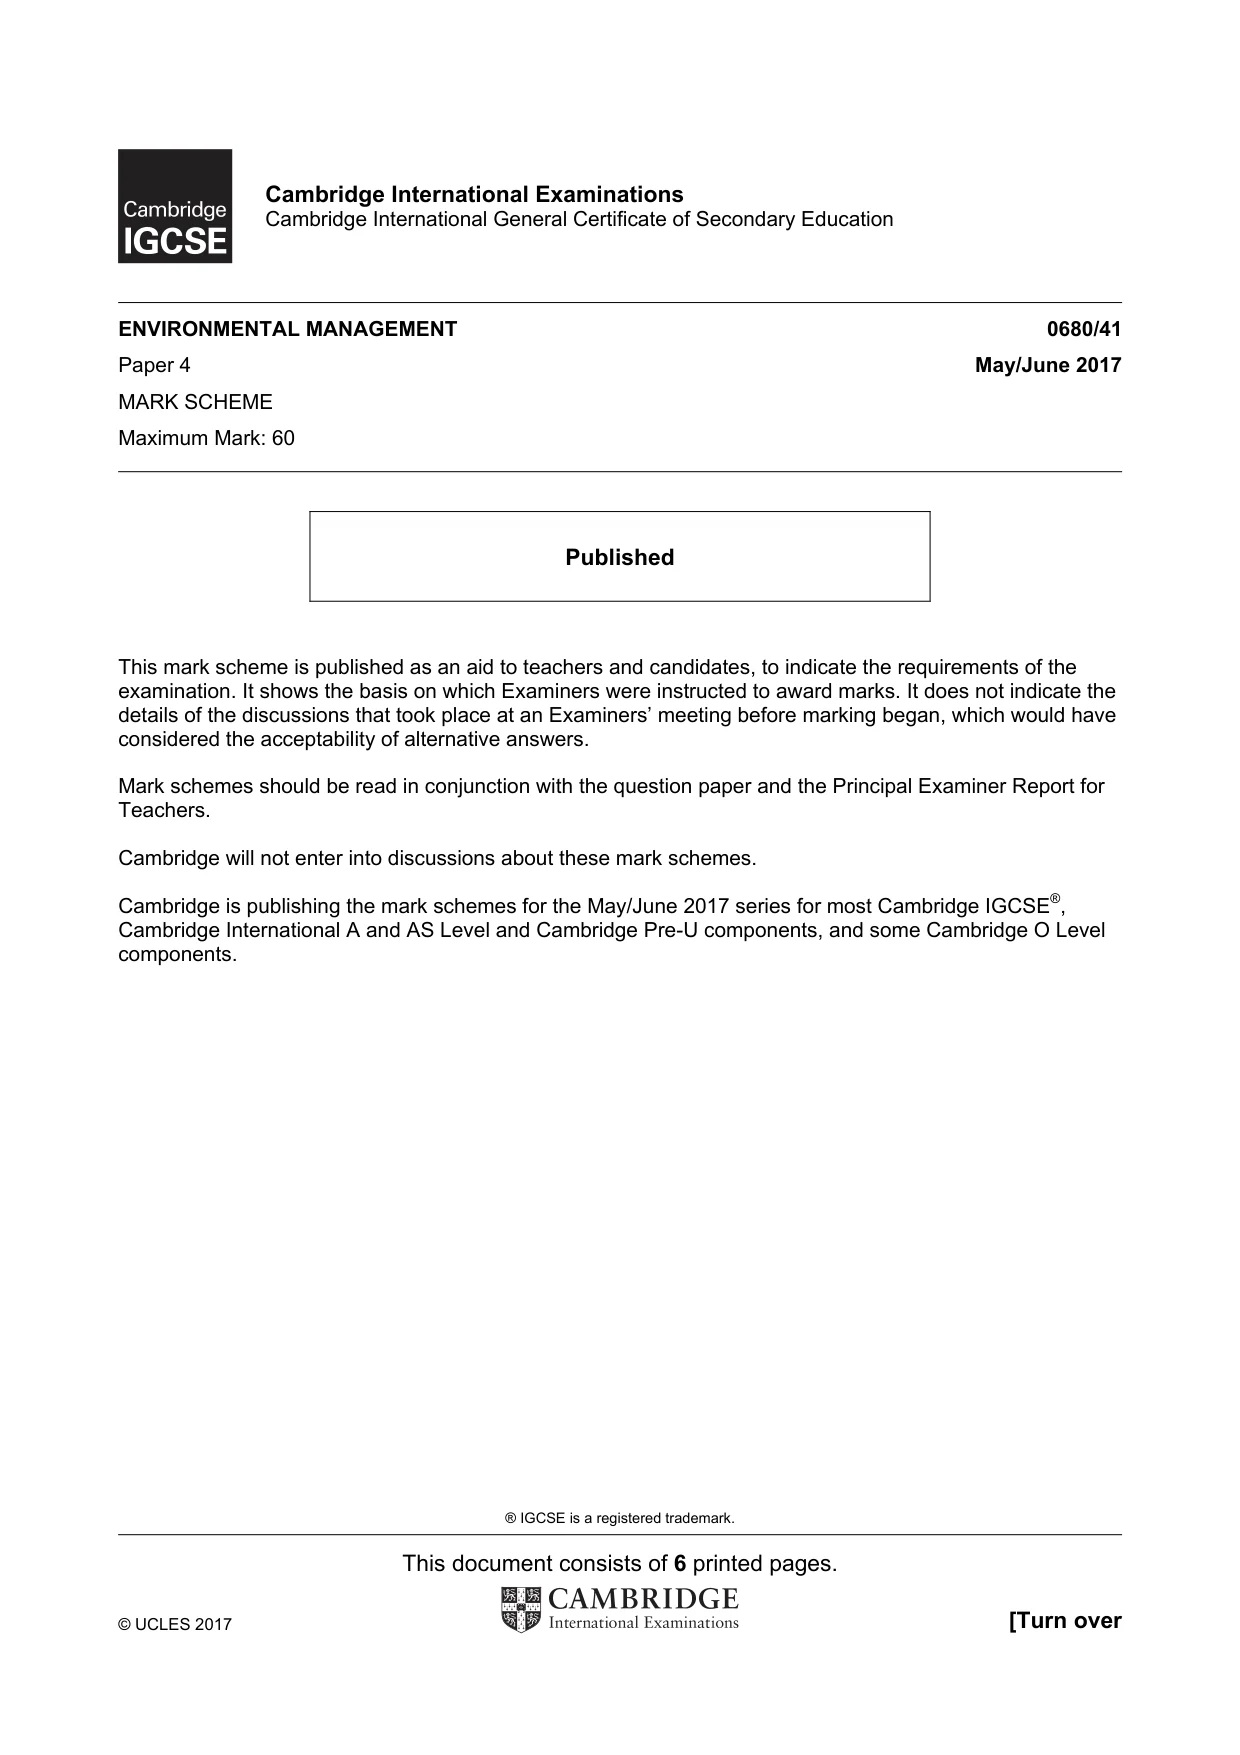
Q2 · The Suez canal is an important source of income for the Egyptian government
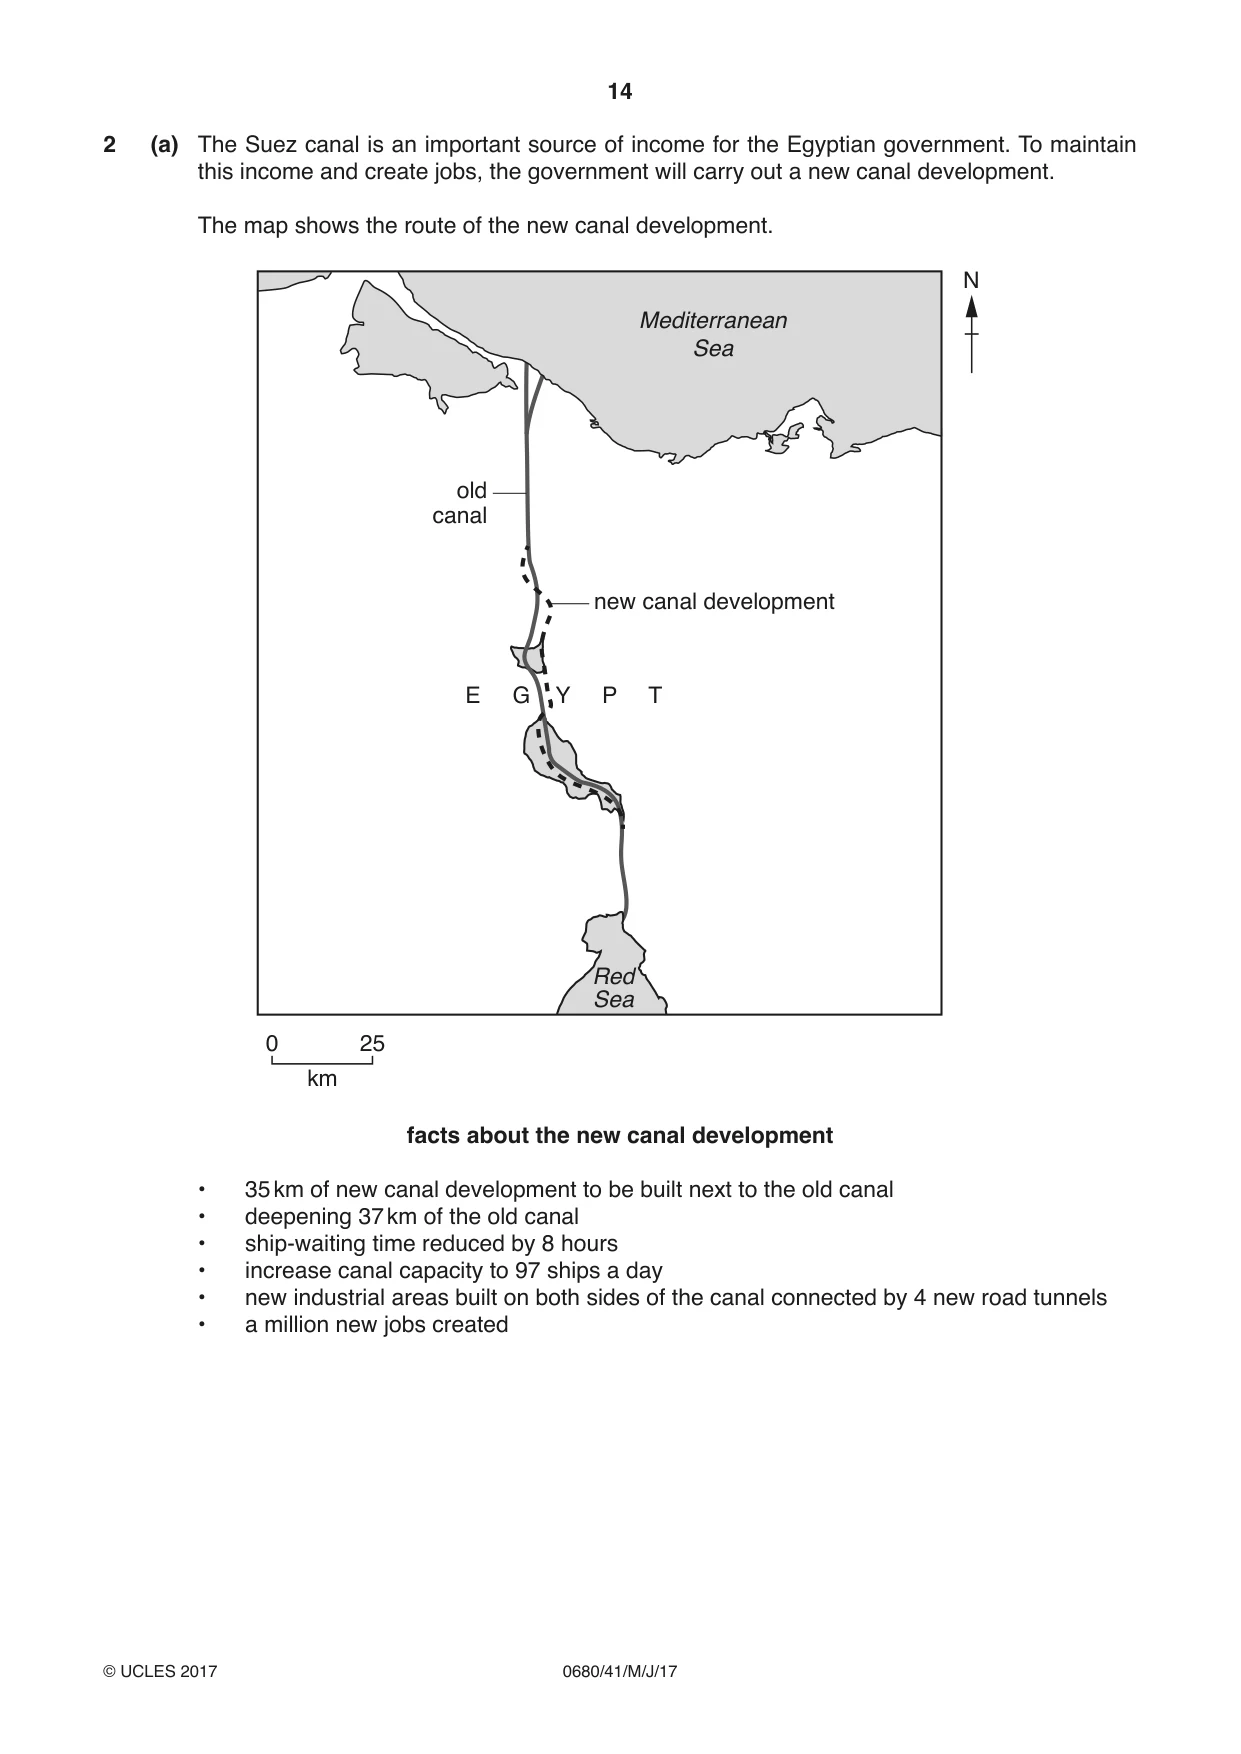
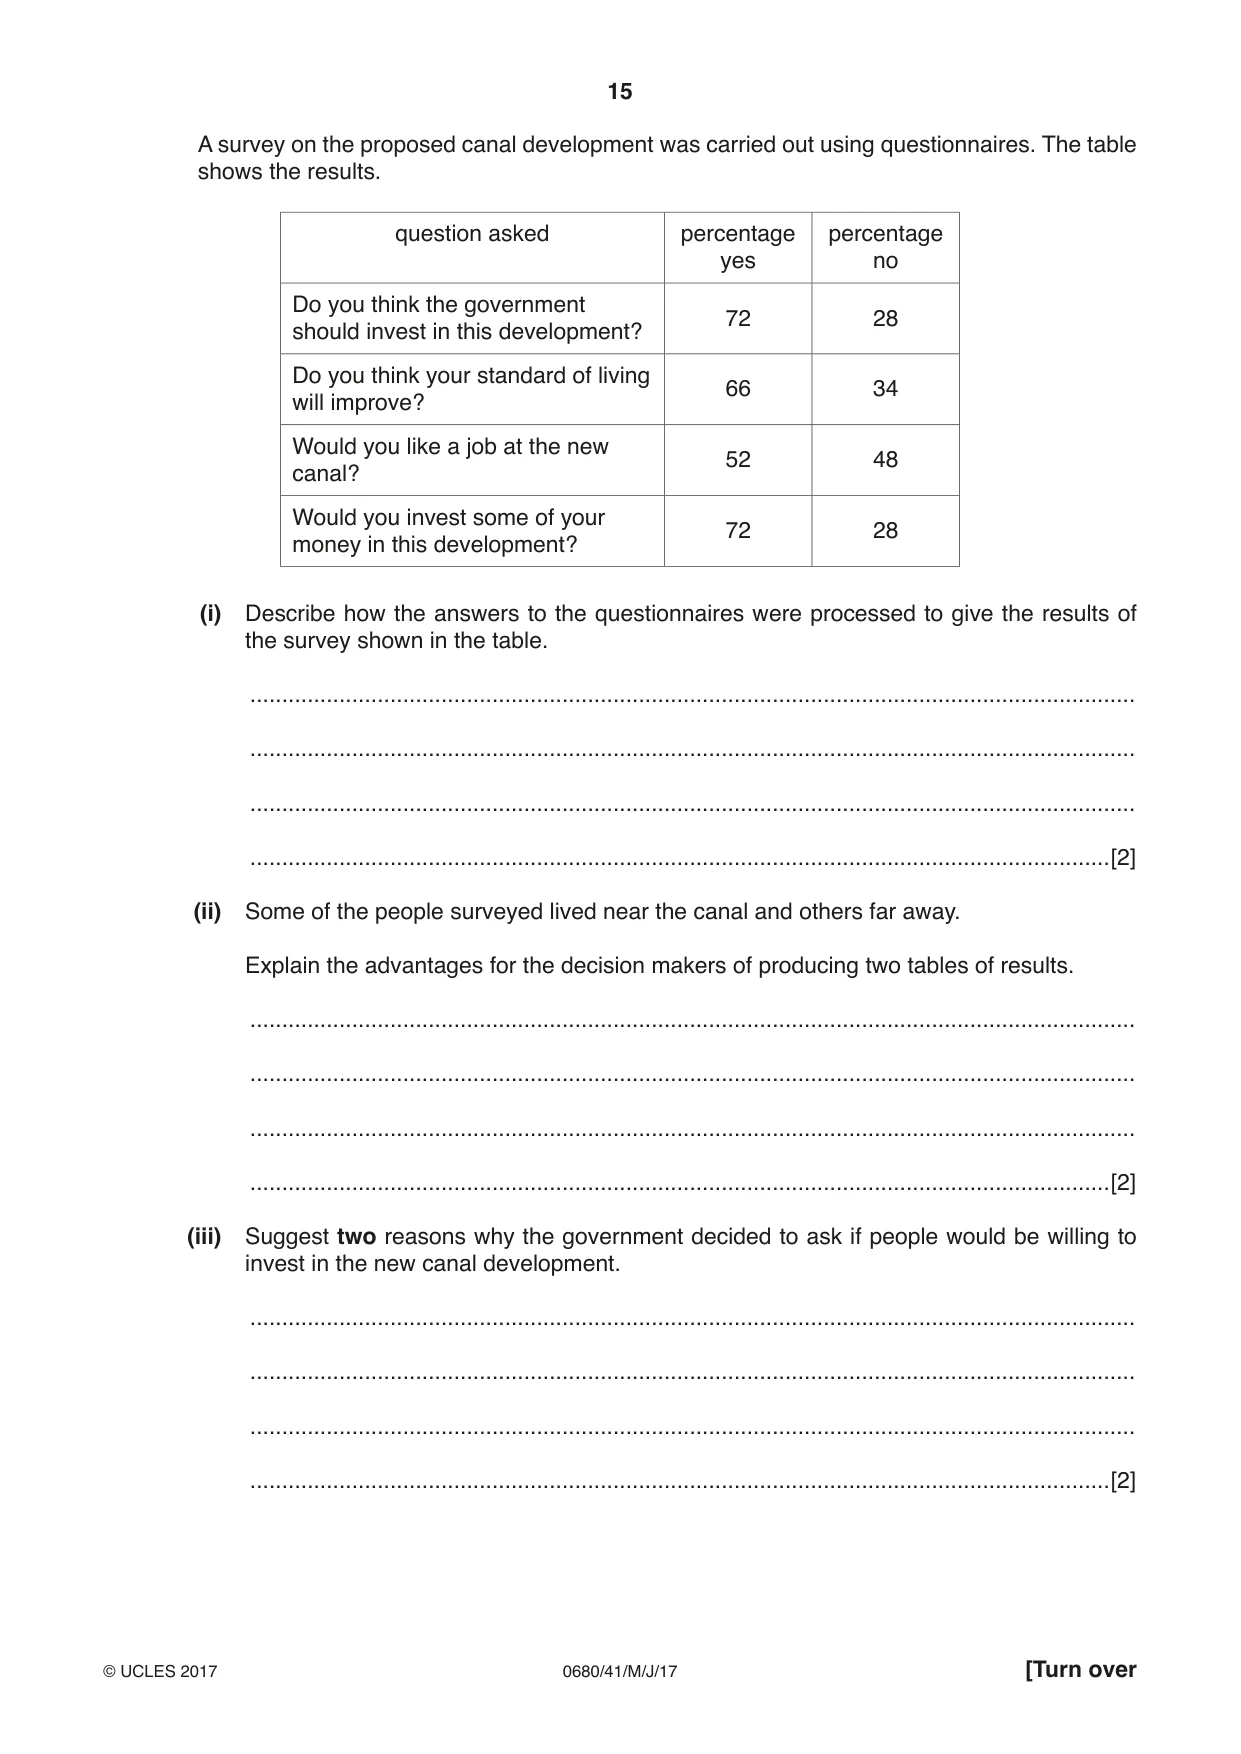
2 (a) The Suez canal is an important source of income for the Egyptian government. To maintain this income and create jobs, the government will carry out a new canal development. The map shows the route of the new canal development. N Mediterranean Sea old canal new canal development E G Y P T Red Sea 0 25 km facts about the new canal development • 35 km of new canal development to be built next to the old canal • deepening 37 km of the old canal • ship-waiting time reduced by 8 hours • increase canal capacity to 97 ships a day • new industrial areas built on both sides of the canal connected by 4 new road tunnels • a million new jobs created A survey on the proposed canal development was carried out using questionnaires. The table shows the results. question asked percentage percentage yes no Do you think the government 72 28 should invest in this development? Do you think your standard of living 66 34 will improve? Would you like a job at the new 52 48 canal? Would you invest some of your 72 28 money in this development? (i) Describe how the answers to the questionnaires were processed to give the results of the survey shown in the table. ........................................................................................................................................... ........................................................................................................................................... ........................................................................................................................................... .......................................................................................................................................[2] (ii) Some of the people surveyed lived near the canal and others far away. Explain the advantages for the decision makers of producing two tables of results. ........................................................................................................................................... ........................................................................................................................................... ........................................................................................................................................... .......................................................................................................................................[2] (iii) Suggest two reasons why the government decided to ask if people would be willing to invest in the new canal development. ........................................................................................................................................... ........................................................................................................................................... ........................................................................................................................................... .......................................................................................................................................[2] (iv) Suggest benefits of building new industrial areas near the canal. ........................................................................................................................................... ........................................................................................................................................... ........................................................................................................................................... .......................................................................................................................................[2] (v) Describe how the government could encourage businesses to start up in the new industrial area. ........................................................................................................................................... .......................................................................................................................................[1] (vi) Some government advisers think that reducing ship-waiting time will increase income from the canal. Other advisers think this will not increase income from the canal. State your point of view and give reasons for your answer. ........................................................................................................................................... ........................................................................................................................................... ........................................................................................................................................... ........................................................................................................................................... ........................................................................................................................................... .......................................................................................................................................[3]
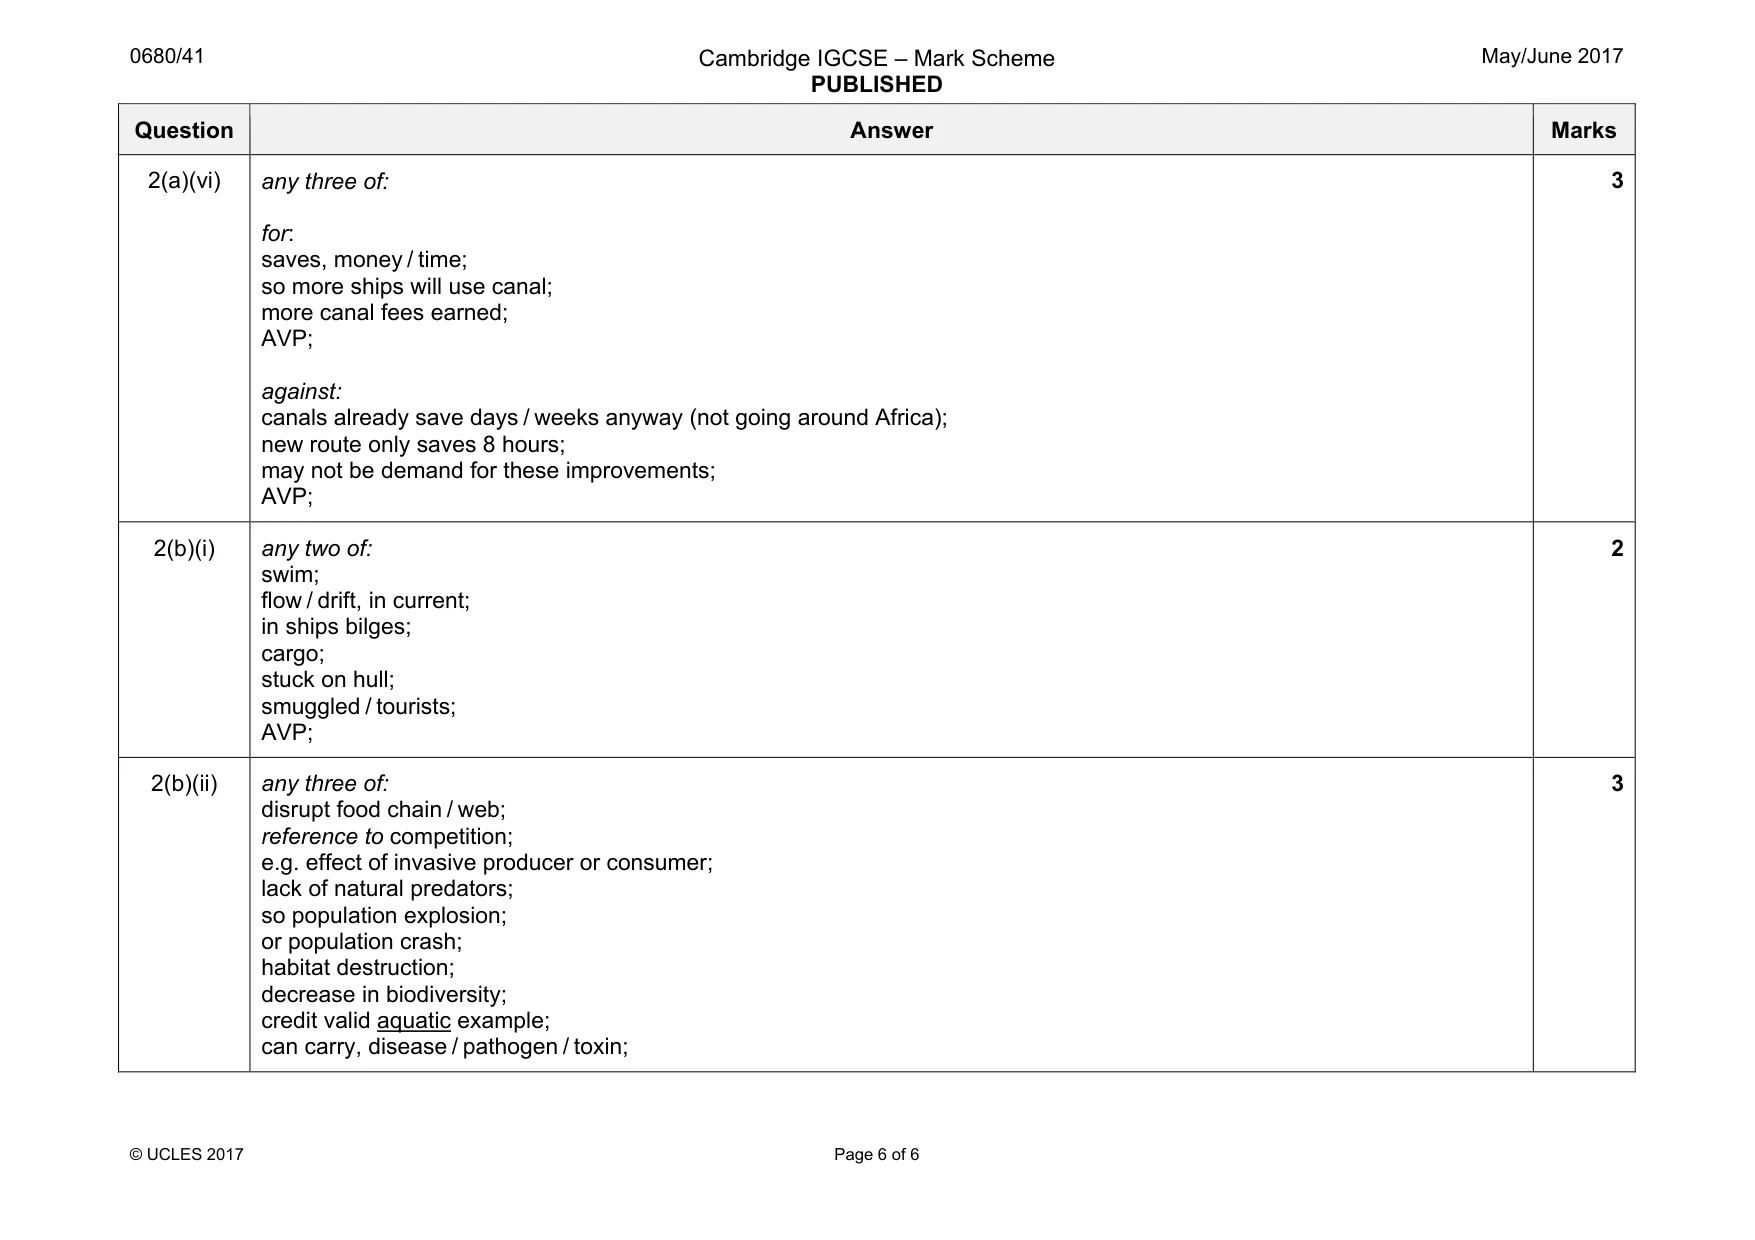
Mark scheme: 2(a)(i) add all the responses for each question; express as a % of total number of questionnaire or out of 100; 2 2(a)(ii) so decision makers can compare results (of different living areas); to find out if only people near the canal were in favour / ORA; 2 2(a)(iii) any two of: reason why (government) need the money / eq; government can find out if people, approved of the project / value the project; give people / nation, a sense of ownership of project / eq; AVP; 2 2(a)(iv) any two of: close to, canal / new roads, for easy transport; low cost of transport; encourages, import / export / trade; creates new jobs / canal already has skilled workers, so readily available / eq; provides source of water for industries; 2 2(a)(v) tax breaks / investment grants / interest free loans / subsidies / eq or AVP; 1 Question Answer Marks 2(a)(vi) any three of: for: saves, money / time; so more ships will use canal; more canal fees earned; AVP; against: canals already save days / weeks anyway (not going around Africa); new route only saves 8 hours; may not be demand for these improvements; AVP; 3 2(b)(i) any two of: swim; flow / drift, in current; in ships bilges; cargo; stuck on hull; smuggled / tourists; AVP; 2 2(b)(ii) any three of: disrupt food chain / web; reference to competition; e.g. effect of invasive producer or consumer; lack of natural predators; so population explosion; or population crash; habitat destruction; decrease in biodiversity; credit valid aquatic example; can carry, disease / pathogen / toxin; 3
What was in this paper
The subtopics covered by these 2 questions, and how many questions each got. Open one in a new tab to see every Cambridge question on it.
What you needed in this session
Cambridge’s own grade thresholds for 2017 May/June, Paper 4 · Variant 1. A higher threshold means an easier paper — the bar moves with how the cohort did.