Cambridge IGCSE Environmental Management 0680 — 2014 May/June Paper 2 · Variant 3
0680/23/M/J/14 · 80 marks · ≈90 min
The question paper and its mark scheme, free to read here and free to download. This is Cambridge’s own paper, exactly as it was sat.
Question paper16 pages



Mark scheme8 pages
Answers below. Sit the paper first if you are practising.
Paper as text
Question paper, page 1
This document consists of 15 printed pages and 1 blank page. DC (NF/SW) 81080/4 © UCLES 2014 [Turn over Cambridge International Examinations Cambridge International General Certificate of Secondary Education * 9 5 4 8 3 7 3 7 9 5 * ENVIRONMENTAL MANAGEMENT 0680/23 Paper 2 May/June 2014 1 hour 45 minutes Candidates answer on the Question Paper. Additional Materials: Ruler READ THESE INSTRUCTIONS FIRST Write your Centre number, candidate number and name on all the work you hand in. Write in dark blue or black pen. You may use an HB pencil for any diagrams or graphs. Do not use staples, paper clips, glue or correction fluid. DO NOT WRITE IN ANY BARCODES. Answer both questions. Electronic calculators may be used. You may lose marks if you do not show your working or if you do not use appropriate units. At the end of the examination, fasten all your work securely together. The number of marks is given in brackets [ ] at the end of each question or part question.
Question paper, page 2
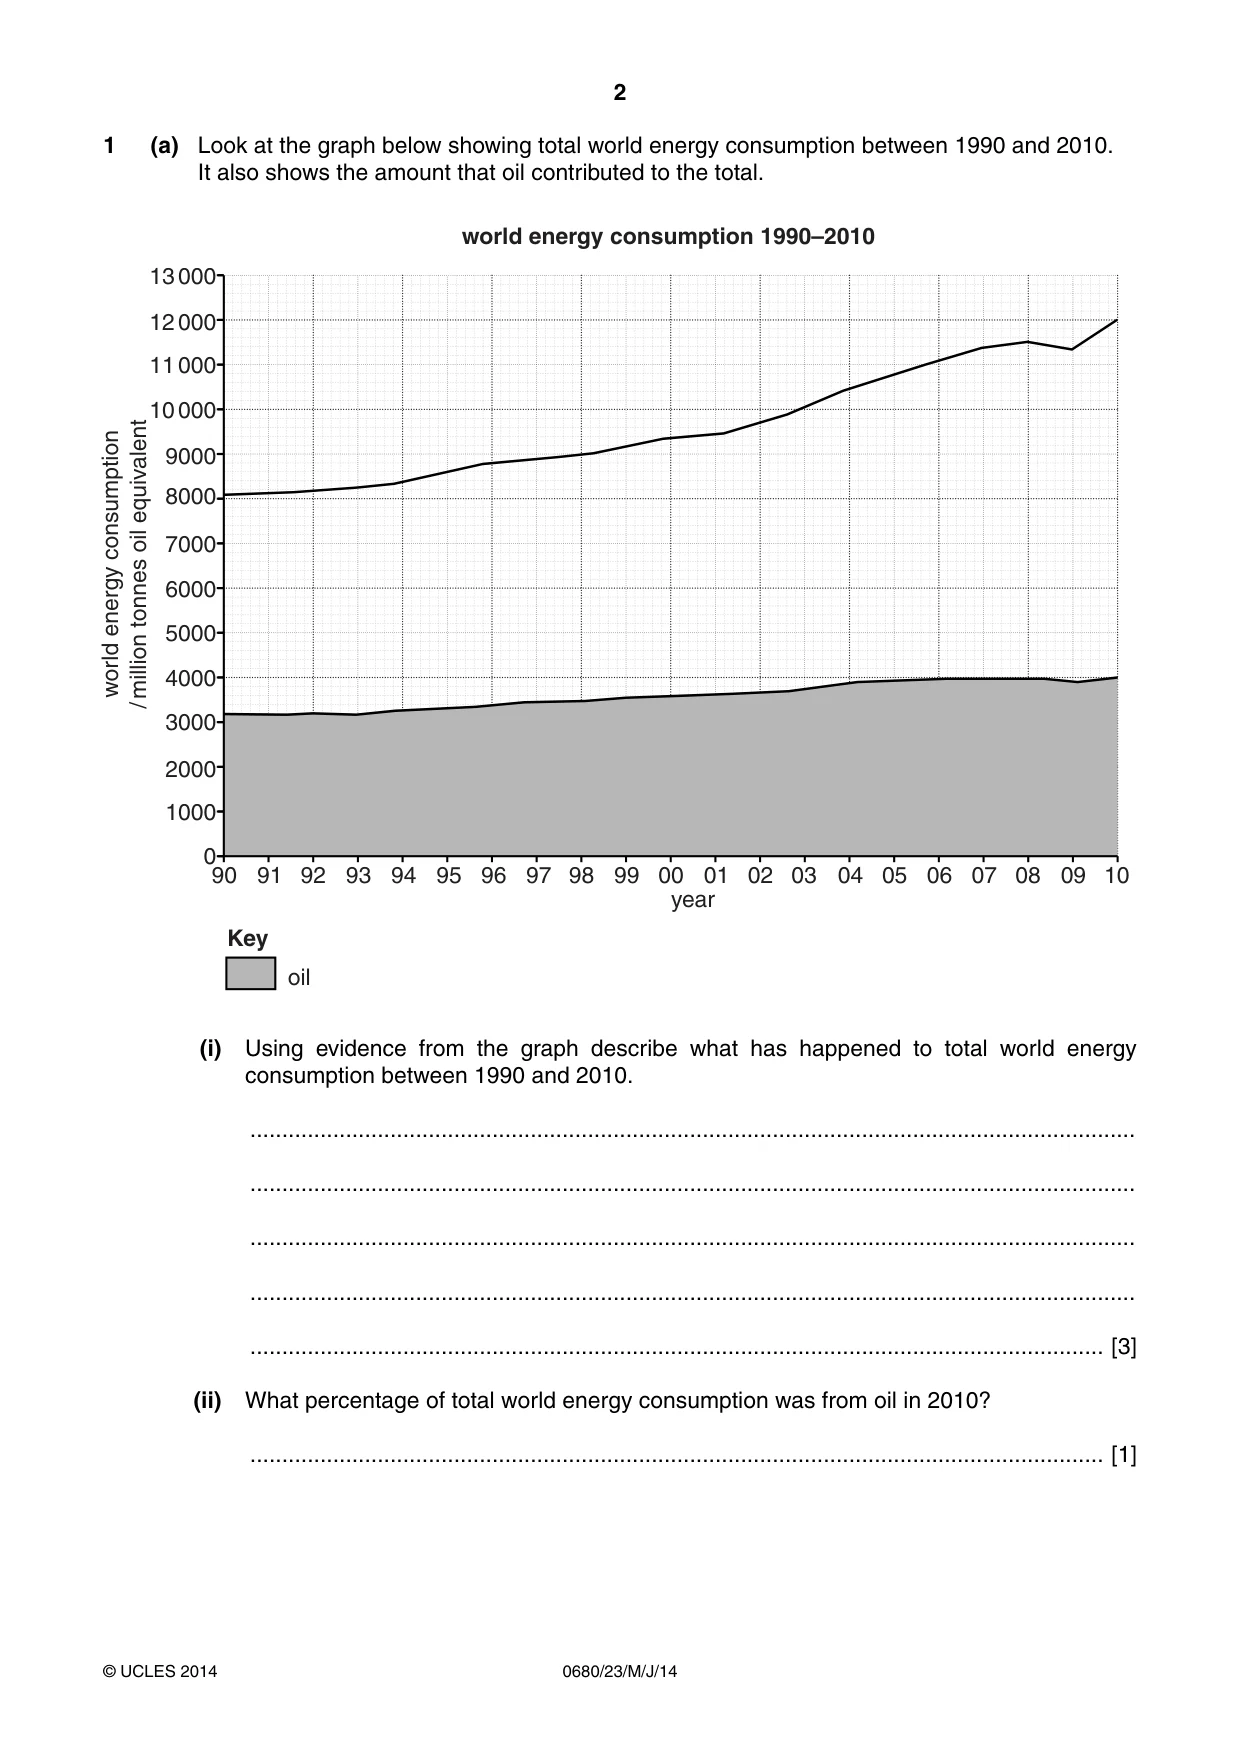
2 0680/23/M/J/14 © UCLES 2014 1 (a) Look at the graph below showing total world energy consumption between 1990 and 2010. It also shows the amount that oil contributed to the total. 0 1000 2000 3000 4000 5000 6000 7000 8000 9000 10 000 11 000 12 000 13 000 90 91 92 93 94 95 96 97 98 99 00 year world energy consumption / million tonnes oil equivalent 01 02 03 04 05 06 07 08 09 10 Key oil world energy consumption 1990–2010 (i) Using evidence from the graph describe what has happened to total world energy consumption between 1990 and 2010. … … … … … [3] (ii) What percentage of total world energy consumption was from oil in 2010? … [1]
Question paper, page 3
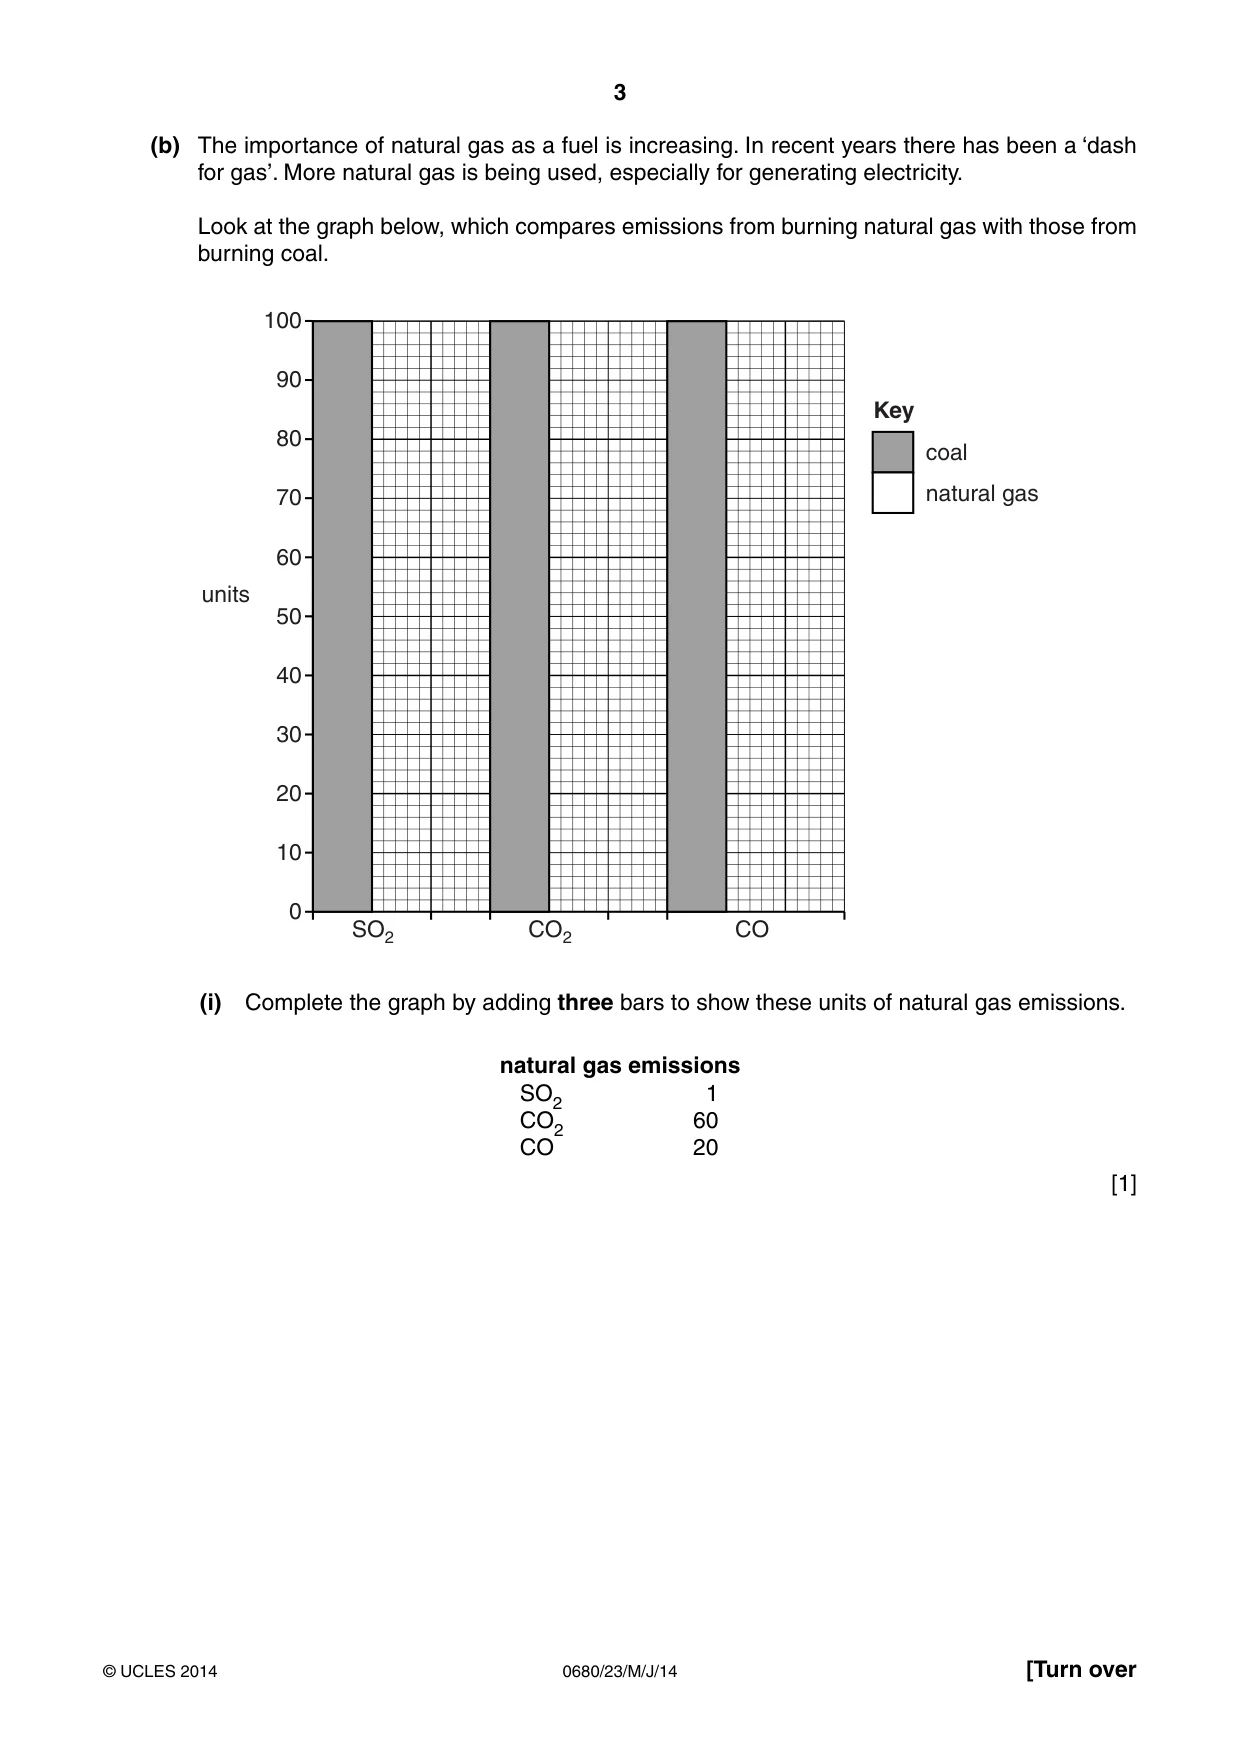
3 0680/23/M/J/14 © UCLES 2014 [Turn over (b) The importance of natural gas as a fuel is increasing. In recent years there has been a ‘dash for gas’. More natural gas is being used, especially for generating electricity. Look at the graph below, which compares emissions from burning natural gas with those from burning coal. 0 20 40 60 units Key coal natural gas 80 100 10 30 50 70 90 SO2 CO2 CO (i) Complete the graph by adding three bars to show these units of natural gas emissions. natural gas emissions SO2 1 CO2 60 CO 20 [1]
Question paper, page 4
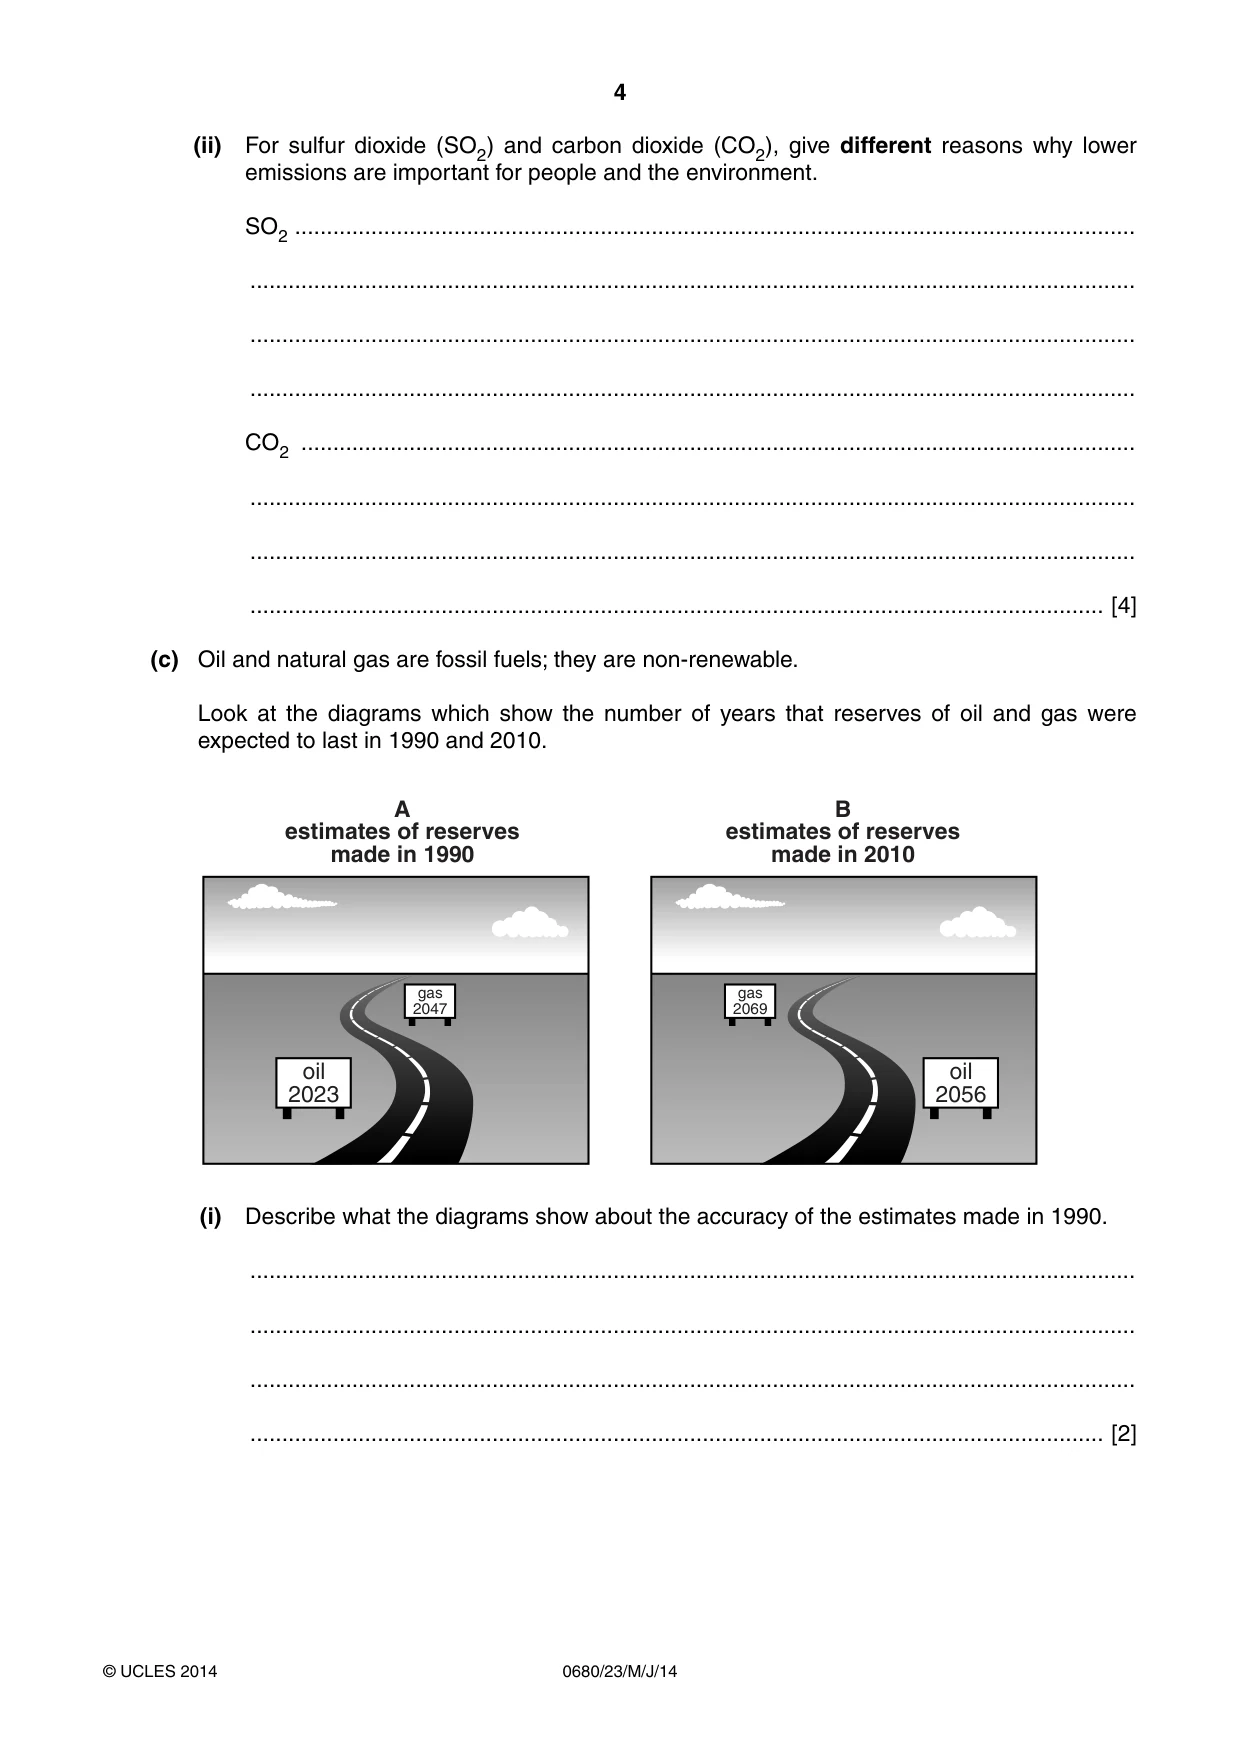
4 0680/23/M/J/14 © UCLES 2014 (ii) For sulfur dioxide (SO2) and carbon dioxide (CO2), give different reasons why lower emissions are important for people and the environment. SO2 … … … … CO2 … … … … [4] (c) Oil and natural gas are fossil fuels; they are non-renewable. Look at the diagrams which show the number of years that reserves of oil and gas were expected to last in 1990 and 2010. oil 2023 gas 2047 oil 2056 gas 2069 A estimates of reserves made in 1990 B estimates of reserves made in 2010 (i) Describe what the diagrams show about the accuracy of the estimates made in 1990. … … … … [2]
Question paper, page 5
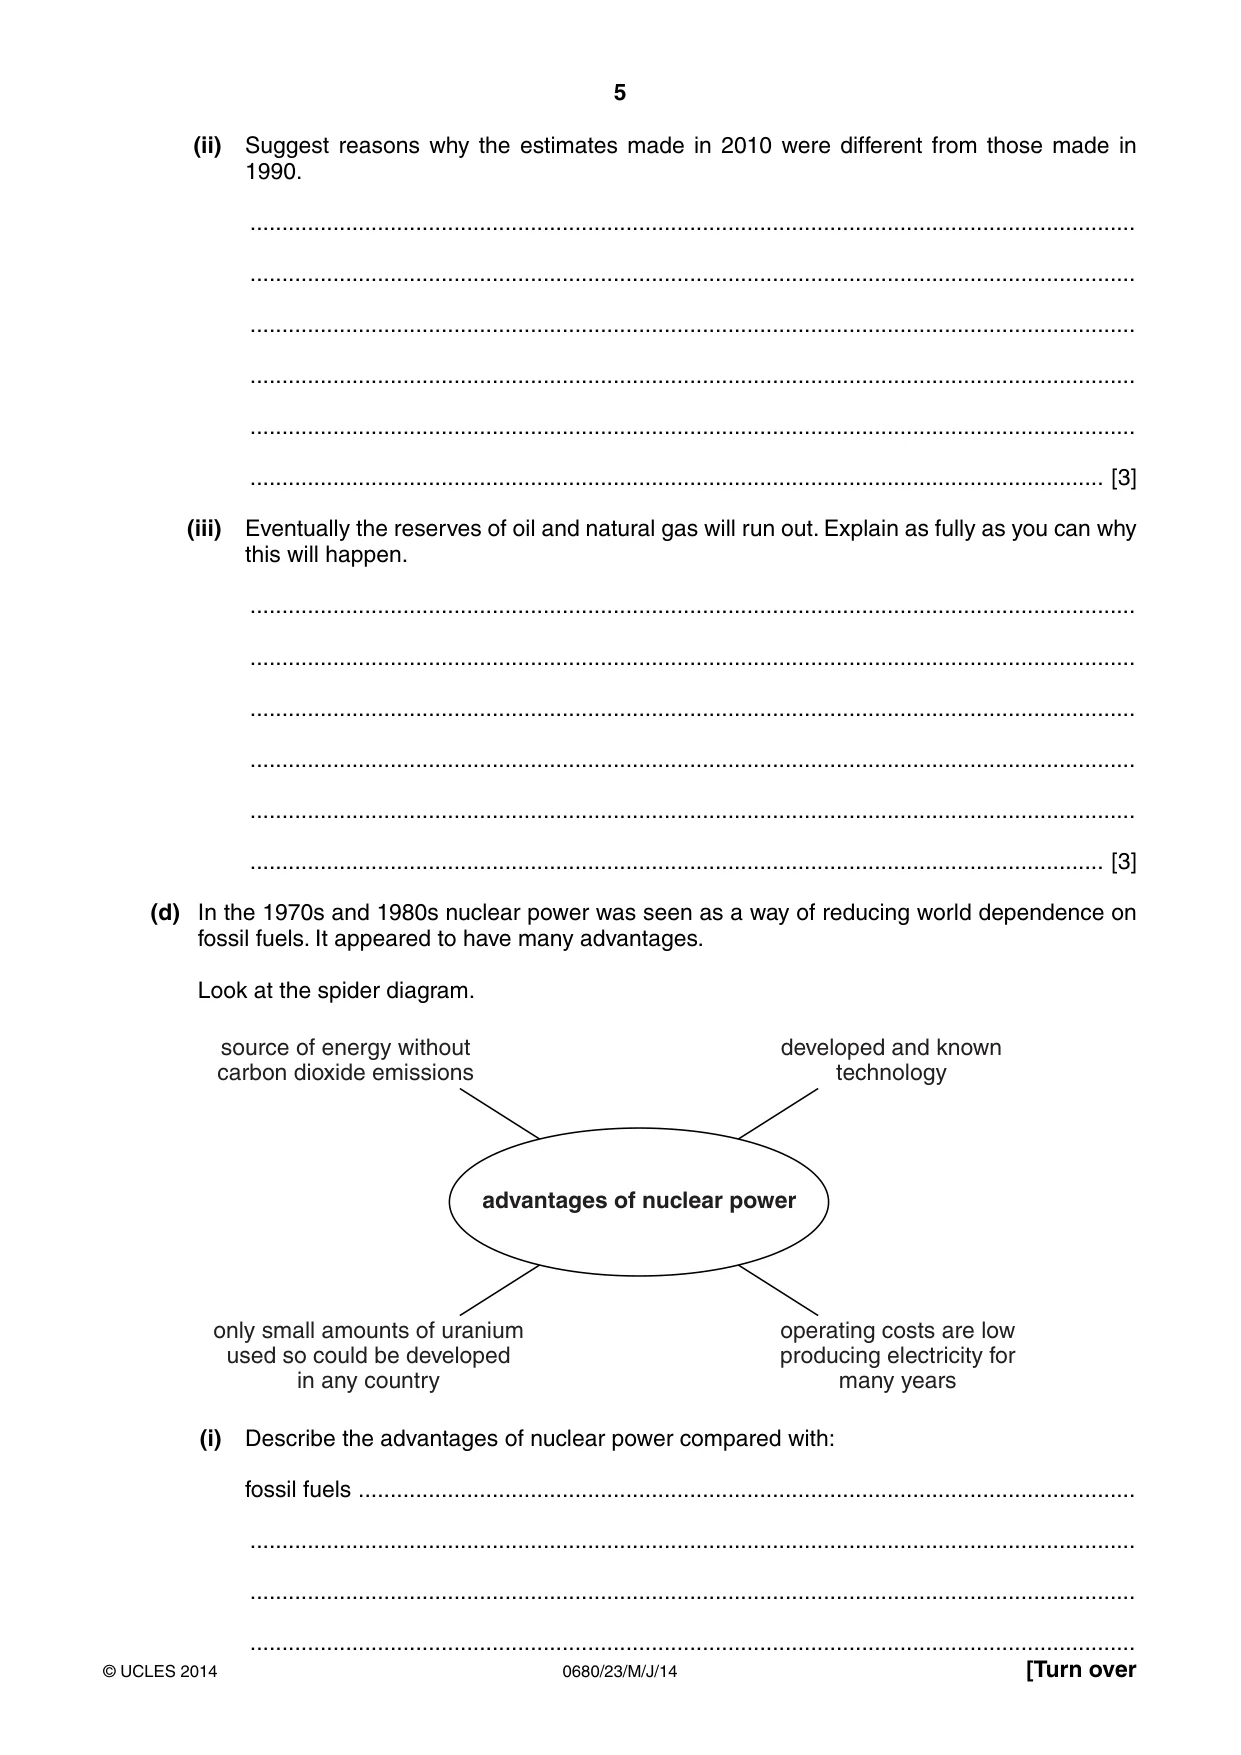
5 0680/23/M/J/14 © UCLES 2014 [Turn over (ii) Suggest reasons why the estimates made in 2010 were different from those made in 1990. … … … … … … [3] (iii) Eventually the reserves of oil and natural gas will run out. Explain as fully as you can why this will happen. … … … … … … [3] (d) In the 1970s and 1980s nuclear power was seen as a way of reducing world dependence on fossil fuels. It appeared to have many advantages. Look at the spider diagram. advantages of nuclear power source of energy without carbon dioxide emissions only small amounts of uranium used so could be developed in any country developed and known technology operating costs are low producing electricity for many years (i) Describe the advantages of nuclear power compared with: fossil fuels … … … …
Question paper, page 6
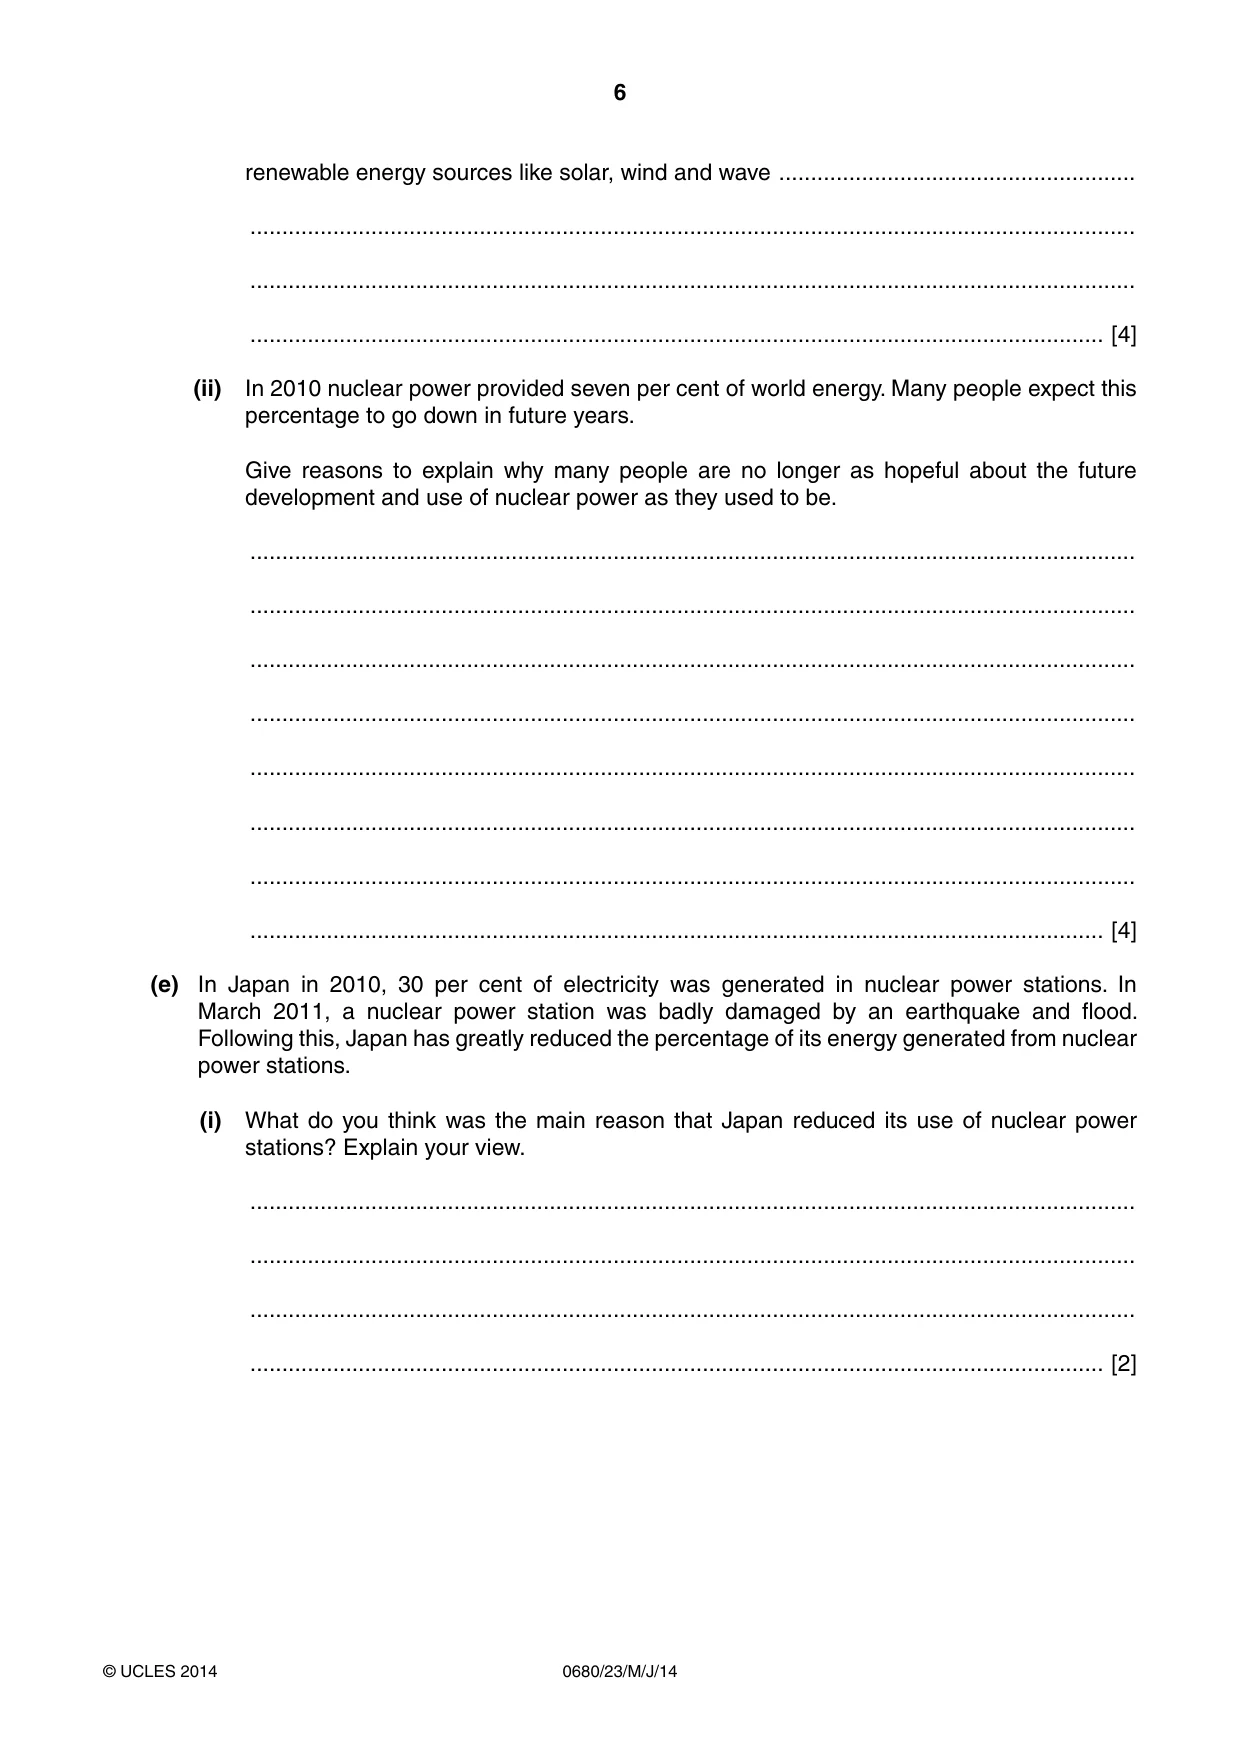
6 0680/23/M/J/14 © UCLES 2014 renewable energy sources like solar, wind and wave … … … … [4] (ii) In 2010 nuclear power provided seven per cent of world energy. Many people expect this percentage to go down in future years. Give reasons to explain why many people are no longer as hopeful about the future development and use of nuclear power as they used to be. … … … … … … … … [4] (e) In Japan in 2010, 30 per cent of electricity was generated in nuclear power stations. In March 2011, a nuclear power station was badly damaged by an earthquake and flood. Following this, Japan has greatly reduced the percentage of its energy generated from nuclear power stations. (i) What do you think was the main reason that Japan reduced its use of nuclear power stations? Explain your view. … … … … [2]
Question paper, page 7
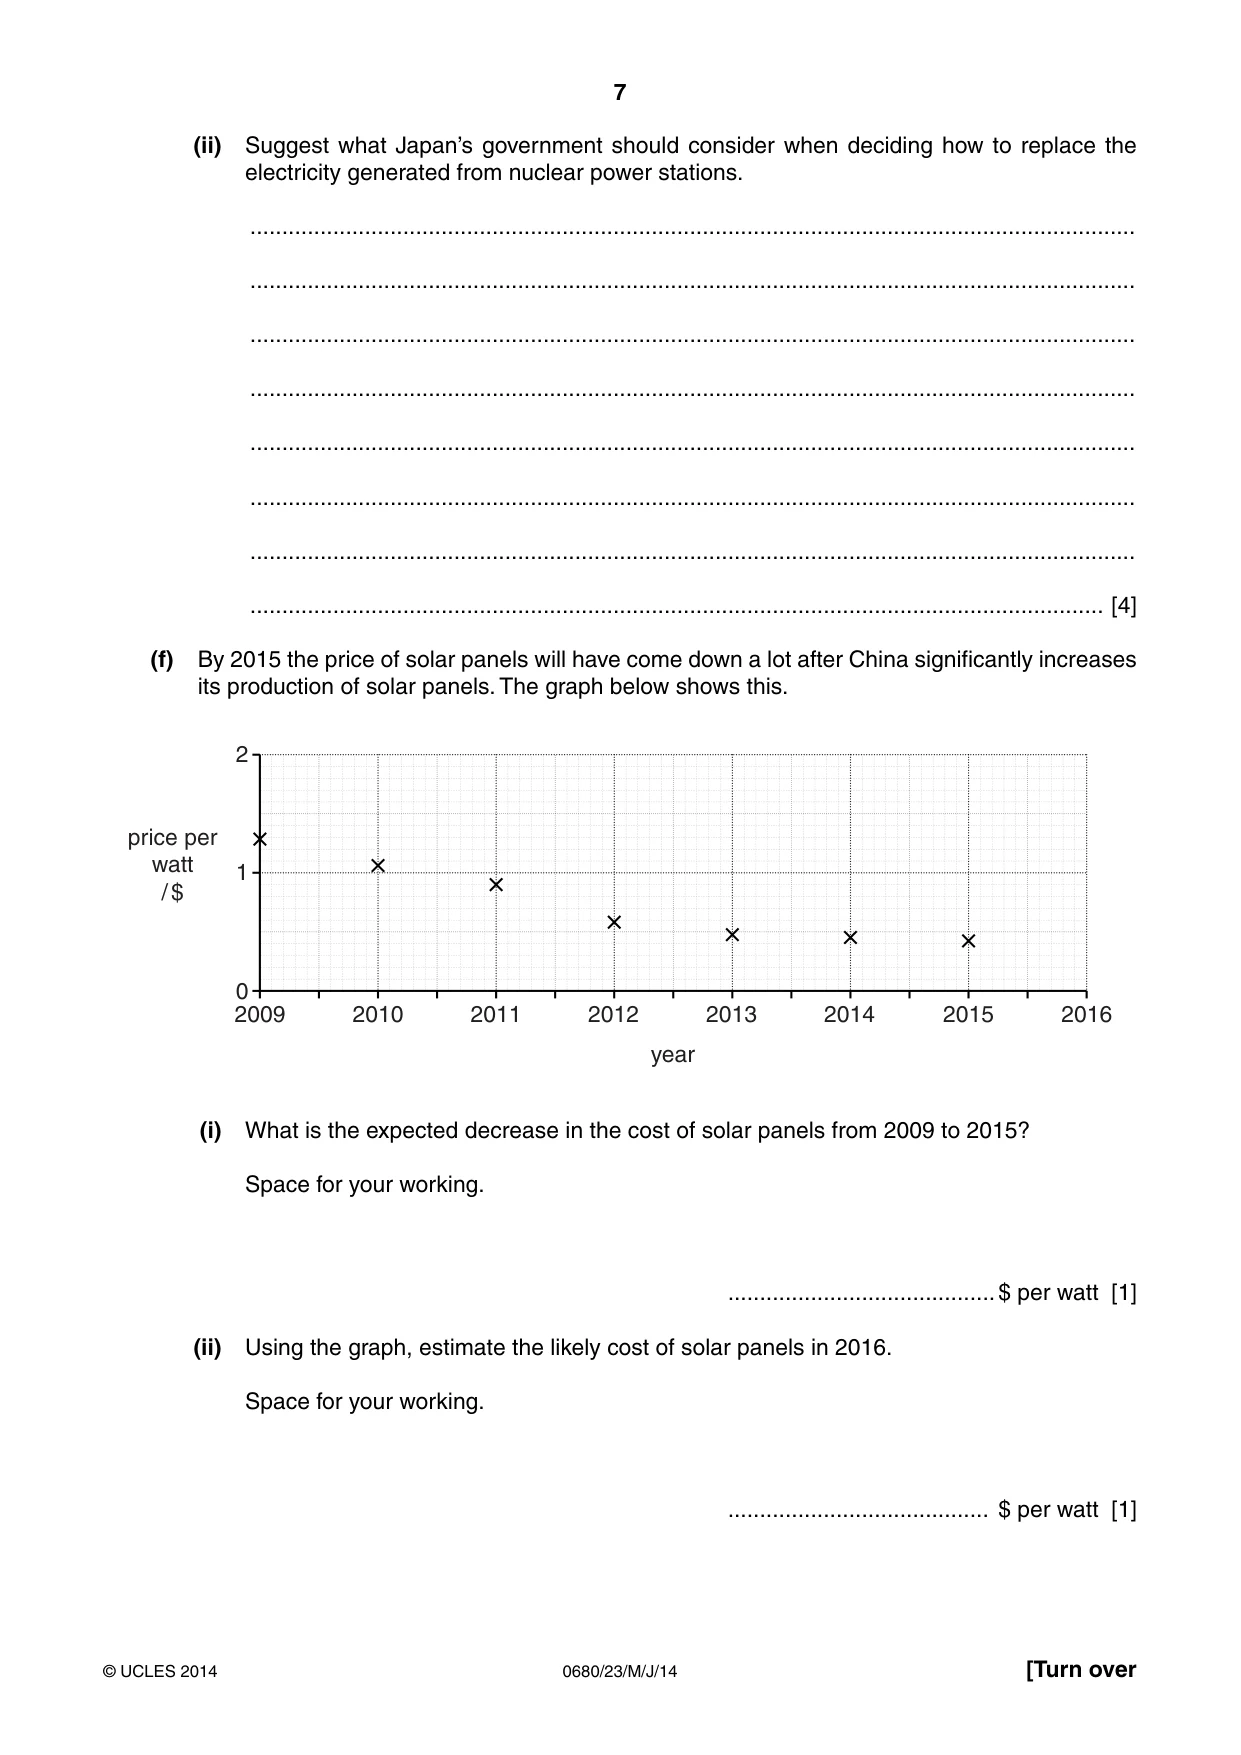
7 0680/23/M/J/14 © UCLES 2014 [Turn over (ii) Suggest what Japan’s government should consider when deciding how to replace the electricity generated from nuclear power stations. … … … … … … … … [4] (f) By 2015 the price of solar panels will have come down a lot after China significantly increases its production of solar panels. The graph below shows this. price per watt / $ year 2009 0 2 1 2010 2011 2012 2013 2014 2015 2016 (i) What is the expected decrease in the cost of solar panels from 2009 to 2015? Space for your working. …$ per watt [1] (ii) Using the graph, estimate the likely cost of solar panels in 2016. Space for your working. … $ per watt [1]
Question paper, page 8
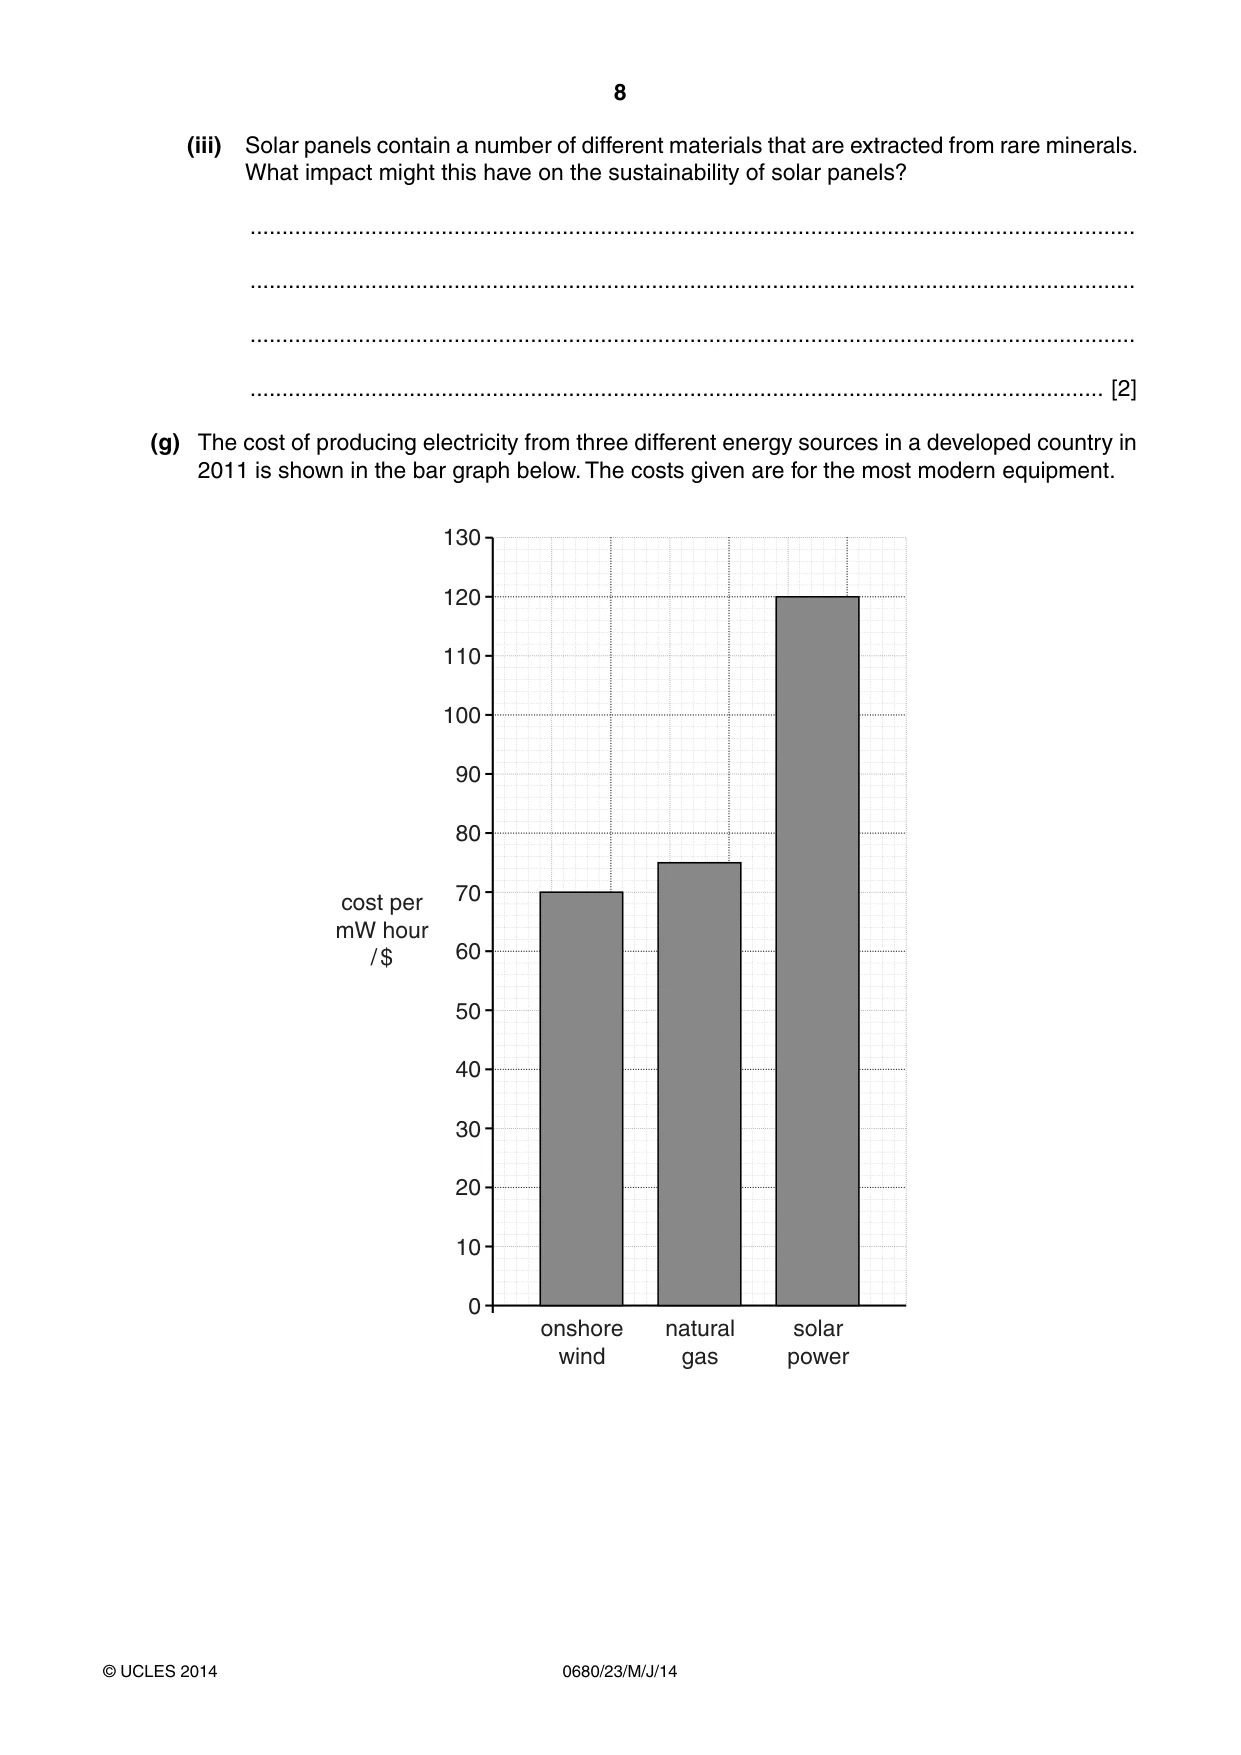
8 0680/23/M/J/14 © UCLES 2014 (iii) Solar panels contain a number of different materials that are extracted from rare minerals. What impact might this have on the sustainability of solar panels? … … … … [2] (g) The cost of producing electricity from three different energy sources in a developed country in 2011 is shown in the bar graph below. The costs given are for the most modern equipment. cost per mW hour / $ 0 10 20 30 40 onshore wind 50 60 70 80 90 100 110 120 130 natural gas solar power
Question paper, page 9
9 0680/23/M/J/14 © UCLES 2014 [Turn over Using the bar graph and your own knowledge, suggest what hope this gives for the greater use of renewable forms of energy in the future. Explain your answer. … … … … … … [3] (h) In a developing country there is a great need for electricity. The electricity that is generated often comes from fossil fuel power stations using out of date technologies. Suggest why people in developing countries want access to electricity. … … … … [2] [Total: 40]
Question paper, page 10
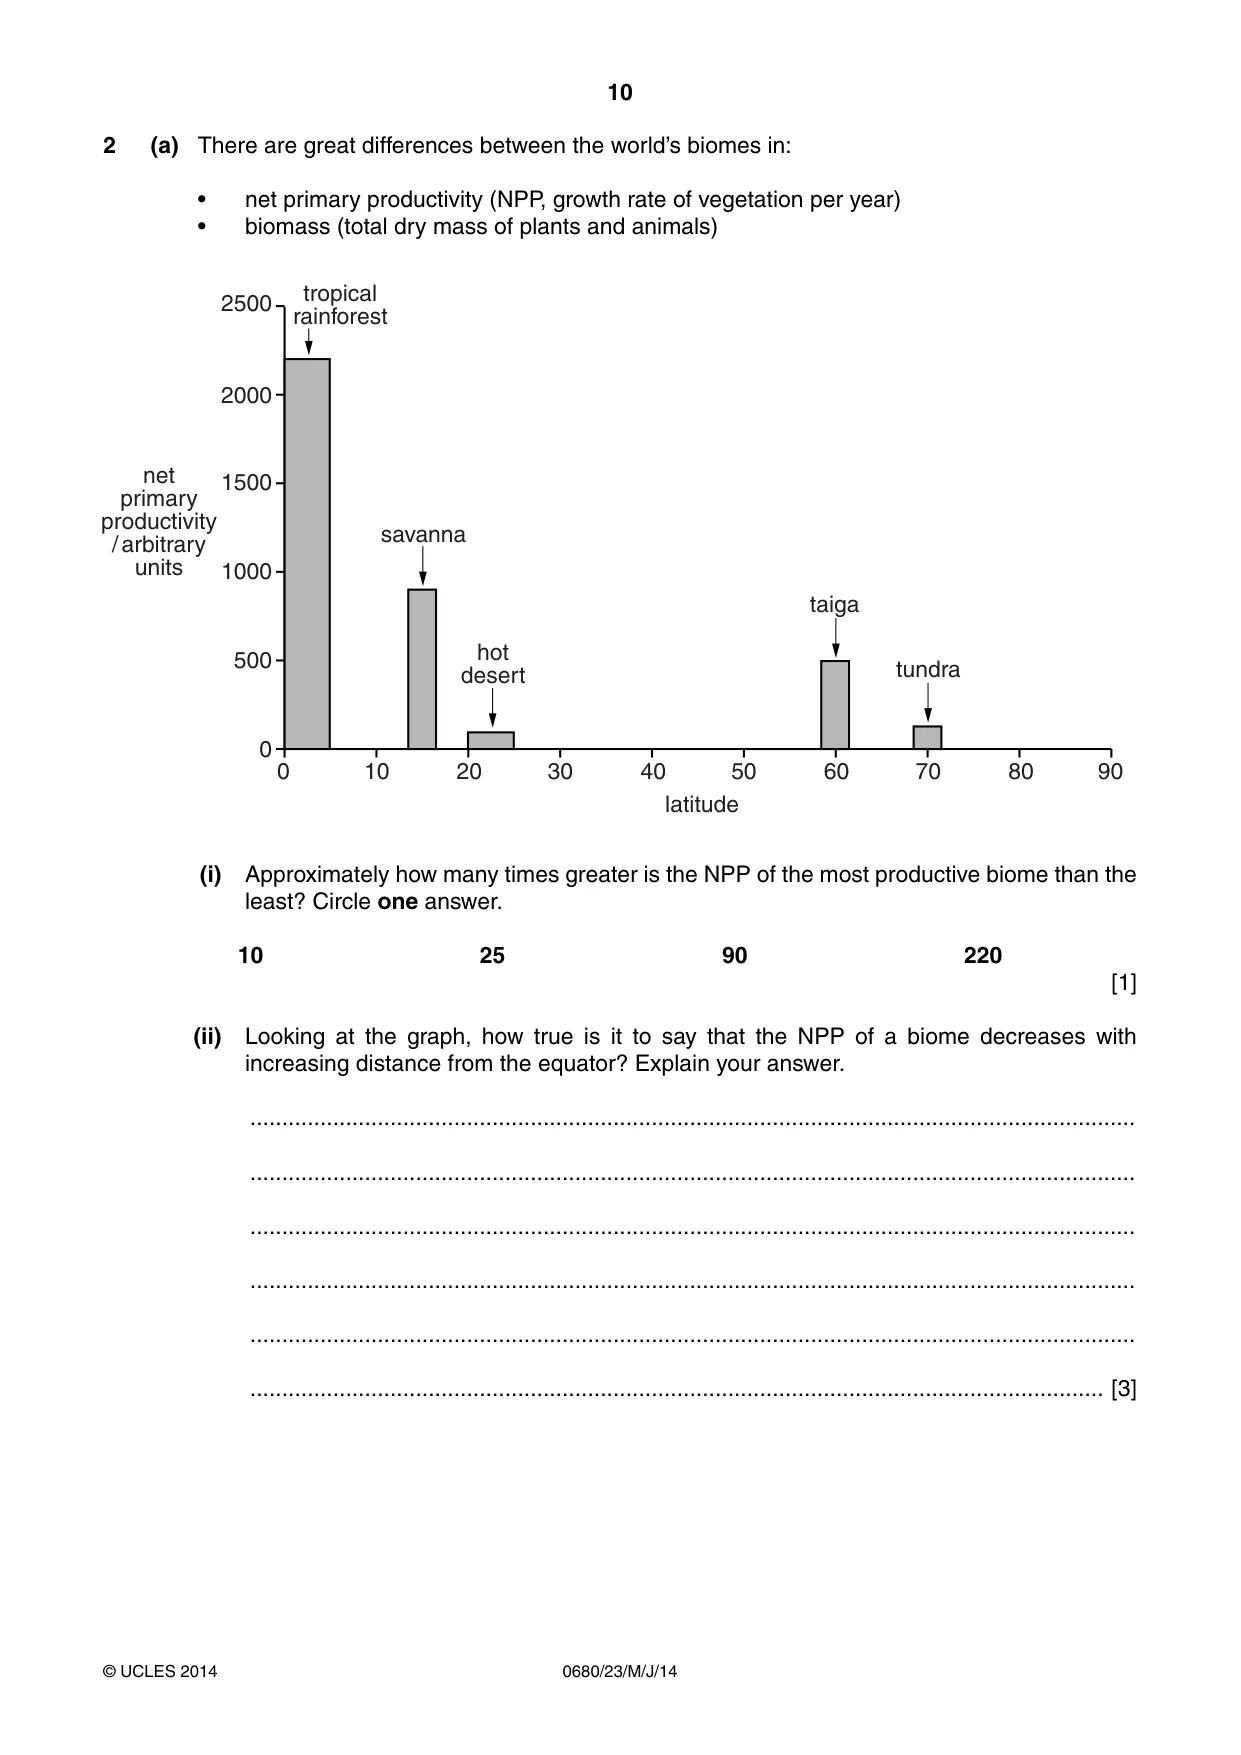
10 0680/23/M/J/14 © UCLES 2014 2 (a) There are great differences between the world’s biomes in: • net primary productivity (NPP, growth rate of vegetation per year) • biomass (total dry mass of plants and animals) 0 0 500 1000 1500 2000 2500 10 20 30 40 50 60 70 80 90 tropical rainforest savanna hot desert taiga tundra latitude net primary productivity / arbitrary units (i) Approximately how many times greater is the NPP of the most productive biome than the least? Circle one answer. 10 25 90 220 [1] (ii) Looking at the graph, how true is it to say that the NPP of a biome decreases with increasing distance from the equator? Explain your answer. … … … … … … [3]
Question paper, page 11
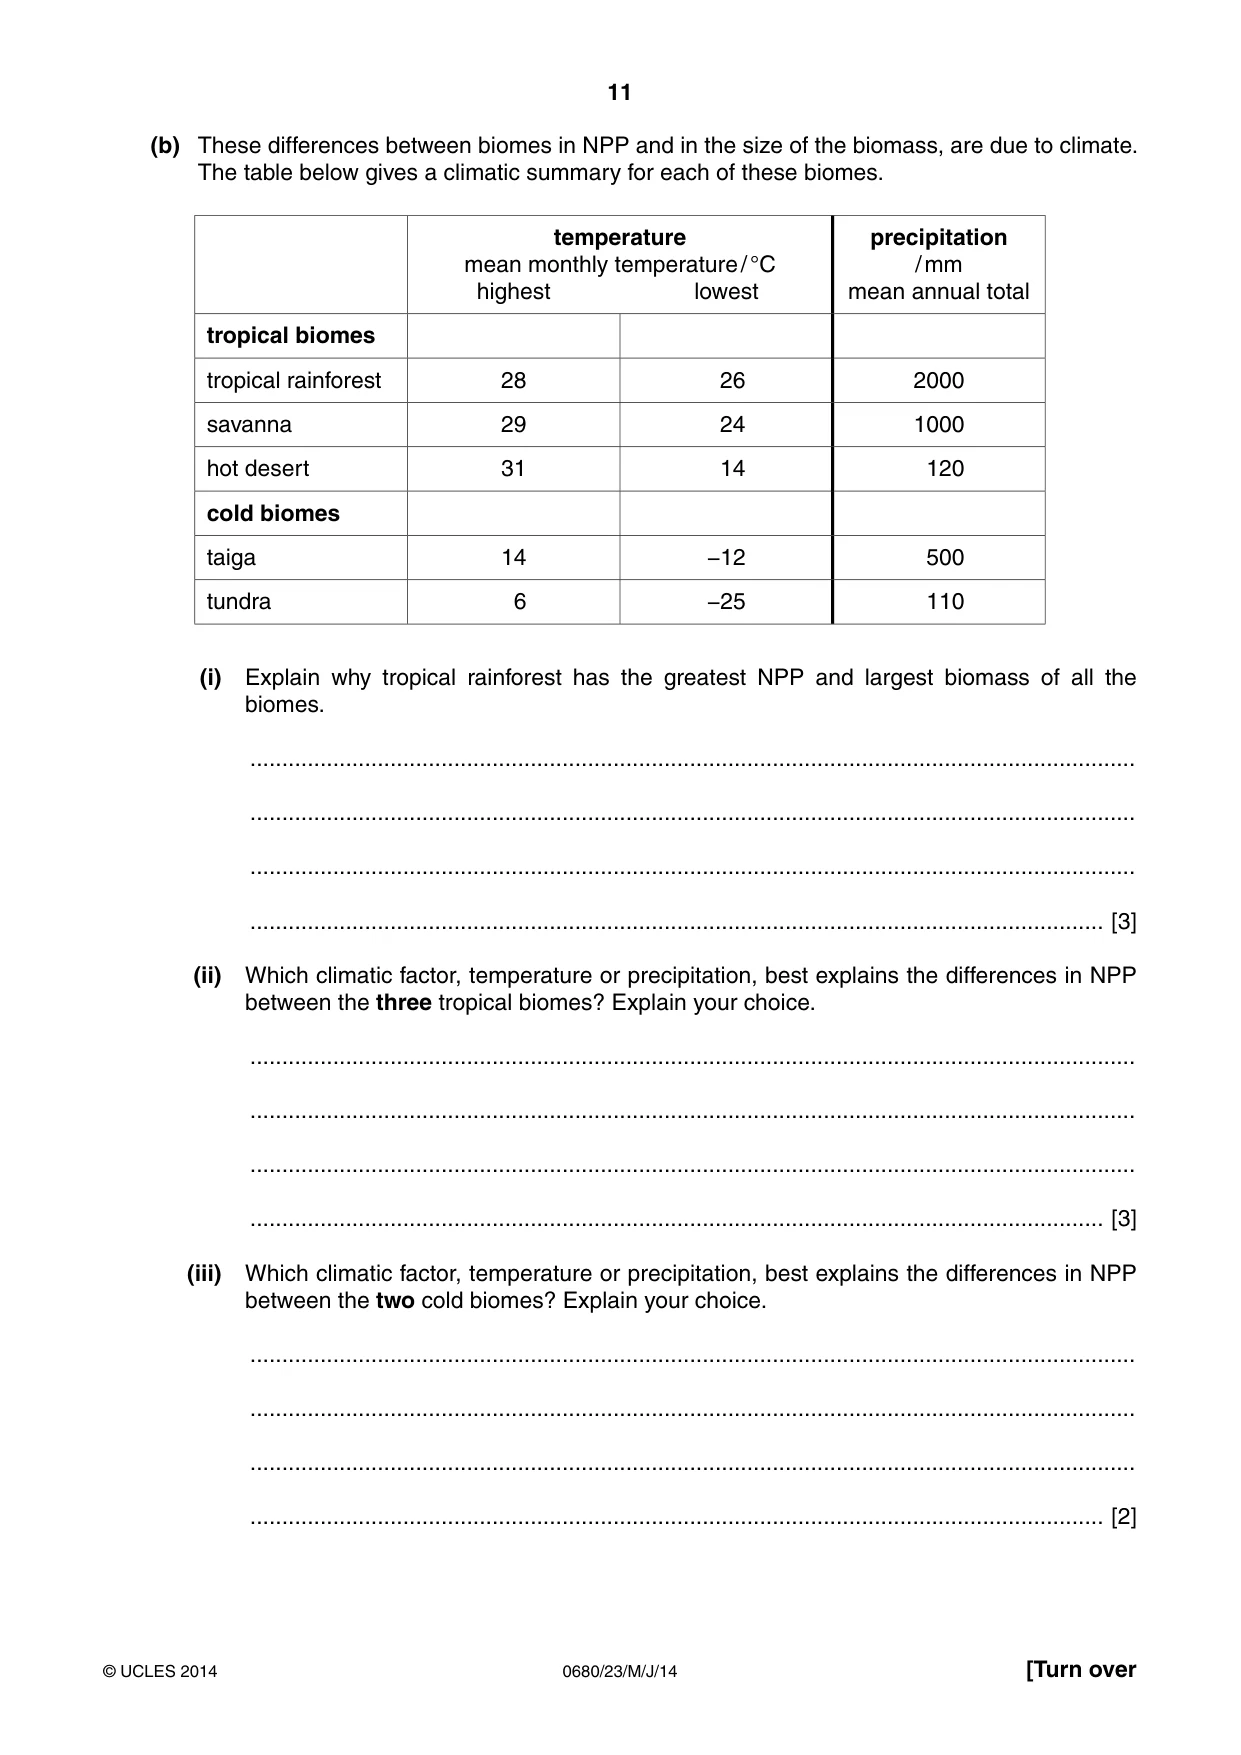
11 0680/23/M/J/14 © UCLES 2014 [Turn over (b) These differences between biomes in NPP and in the size of the biomass, are due to climate. The table below gives a climatic summary for each of these biomes. temperature mean monthly temperature / °C highest lowest precipitation / mm mean annual total tropical biomes tropical rainforest 28 26 2000 savanna 29 24 1000 hot desert 31 14 120 cold biomes taiga 14 −12 500 tundra 6 −25 110 (i) Explain why tropical rainforest has the greatest NPP and largest biomass of all the biomes. … … … … [3] (ii) Which climatic factor, temperature or precipitation, best explains the differences in NPP between the three tropical biomes? Explain your choice. … … … … [3] (iii) Which climatic factor, temperature or precipitation, best explains the differences in NPP between the two cold biomes? Explain your choice. … … … … [2]
Question paper, page 12
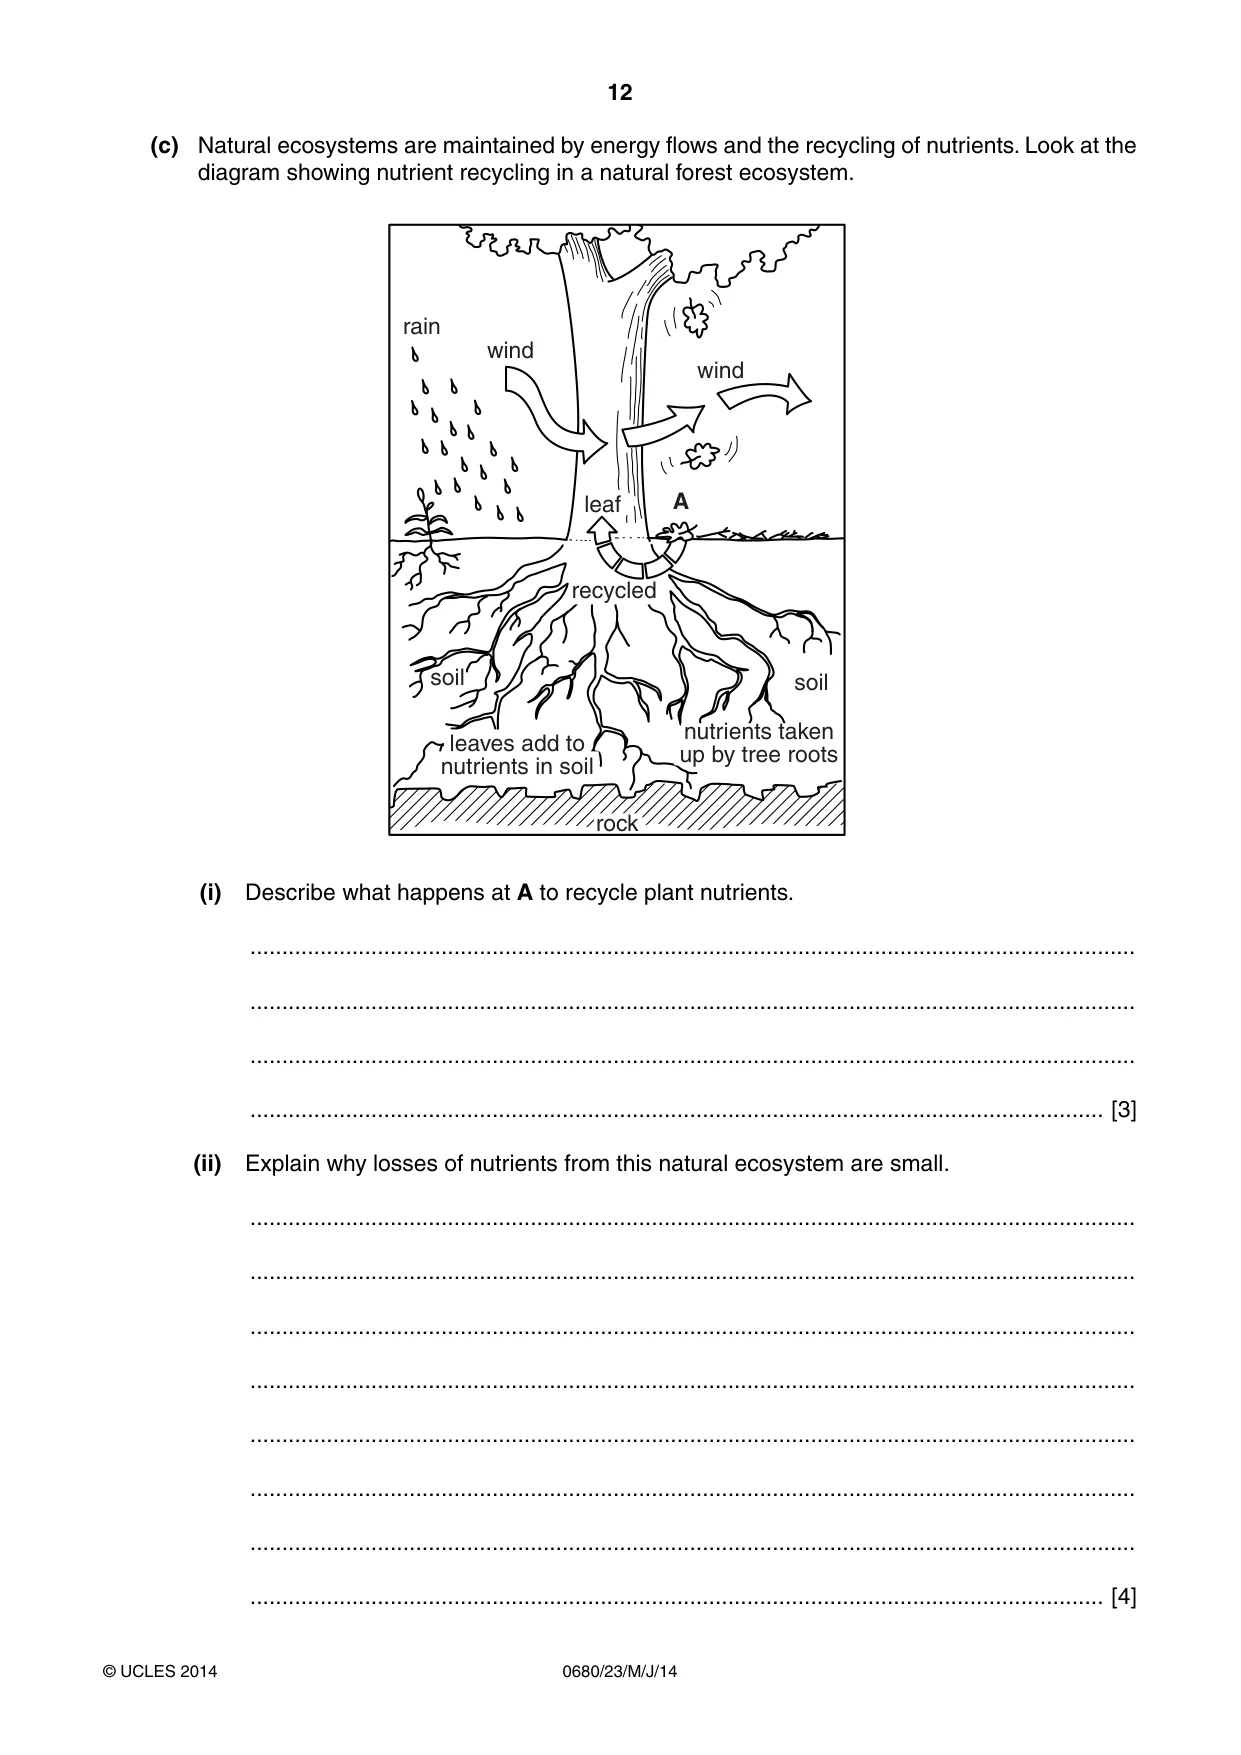
12 0680/23/M/J/14 © UCLES 2014 (c) Natural ecosystems are maintained by energy flows and the recycling of nutrients. Look at the diagram showing nutrient recycling in a natural forest ecosystem. rock soil soil leaf nutrients taken up by tree roots recycled leaves add to nutrients in soil wind wind A rain (i) Describe what happens at A to recycle plant nutrients. … … … … [3] (ii) Explain why losses of nutrients from this natural ecosystem are small. … … … … … … … … [4]
Question paper, page 13
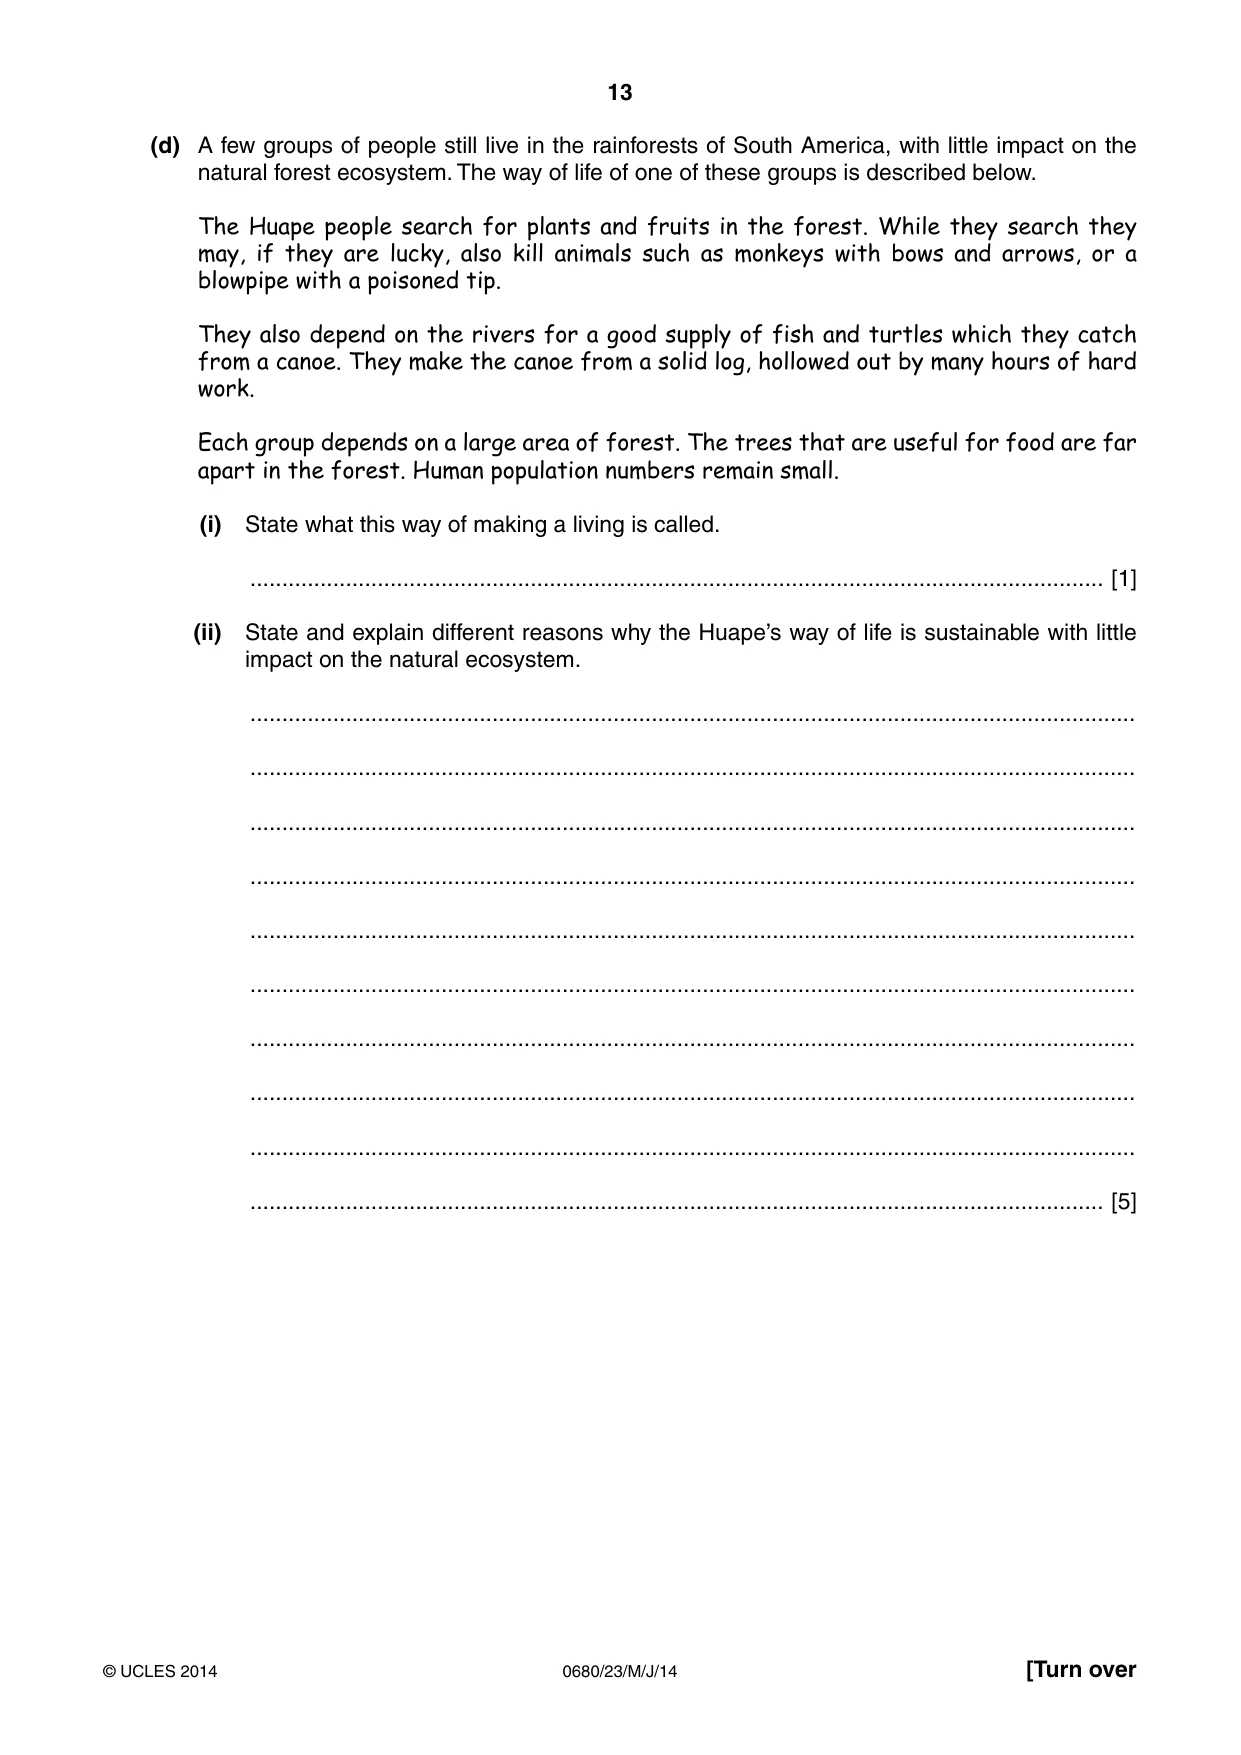
13 0680/23/M/J/14 © UCLES 2014 [Turn over (d) A few groups of people still live in the rainforests of South America, with little impact on the natural forest ecosystem. The way of life of one of these groups is described below. The Huape people search for plants and fruits in the forest. While they search they may, if they are lucky, also kill animals such as monkeys with bows and arrows, or a blowpipe with a poisoned tip. They also depend on the rivers for a good supply of fish and turtles which they catch from a canoe. They make the canoe from a solid log, hollowed out by many hours of hard work. Each group depends on a large area of forest. The trees that are useful for food are far apart in the forest. Human population numbers remain small. (i) State what this way of making a living is called. … [1] (ii) State and explain different reasons why the Huape’s way of life is sustainable with little impact on the natural ecosystem. … … … … … … … … … … [5]
Question paper, page 14
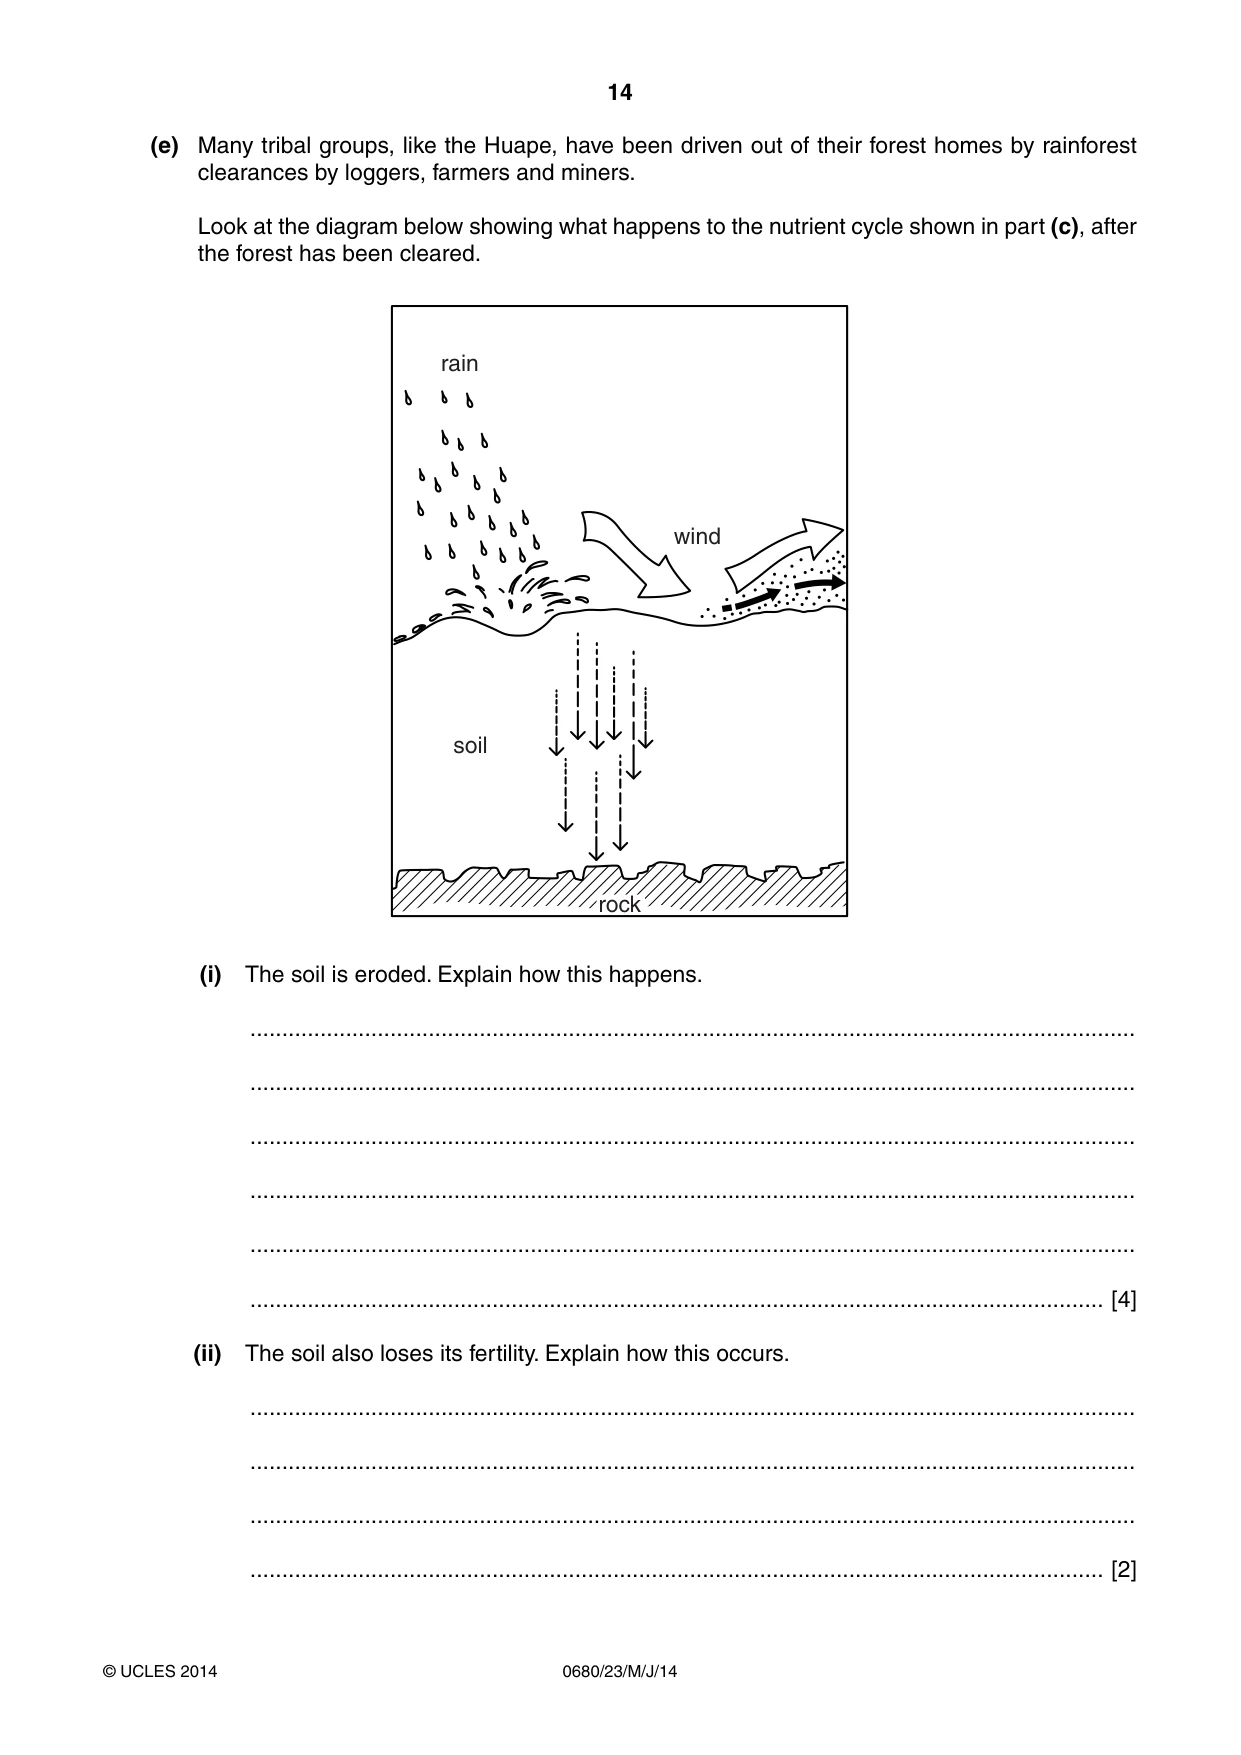
14 0680/23/M/J/14 © UCLES 2014 (e) Many tribal groups, like the Huape, have been driven out of their forest homes by rainforest clearances by loggers, farmers and miners. Look at the diagram below showing what happens to the nutrient cycle shown in part (c), after the forest has been cleared. rock soil rain wind (i) The soil is eroded. Explain how this happens. … … … … … … [4] (ii) The soil also loses its fertility. Explain how this occurs. … … … … [2]
Question paper, page 15
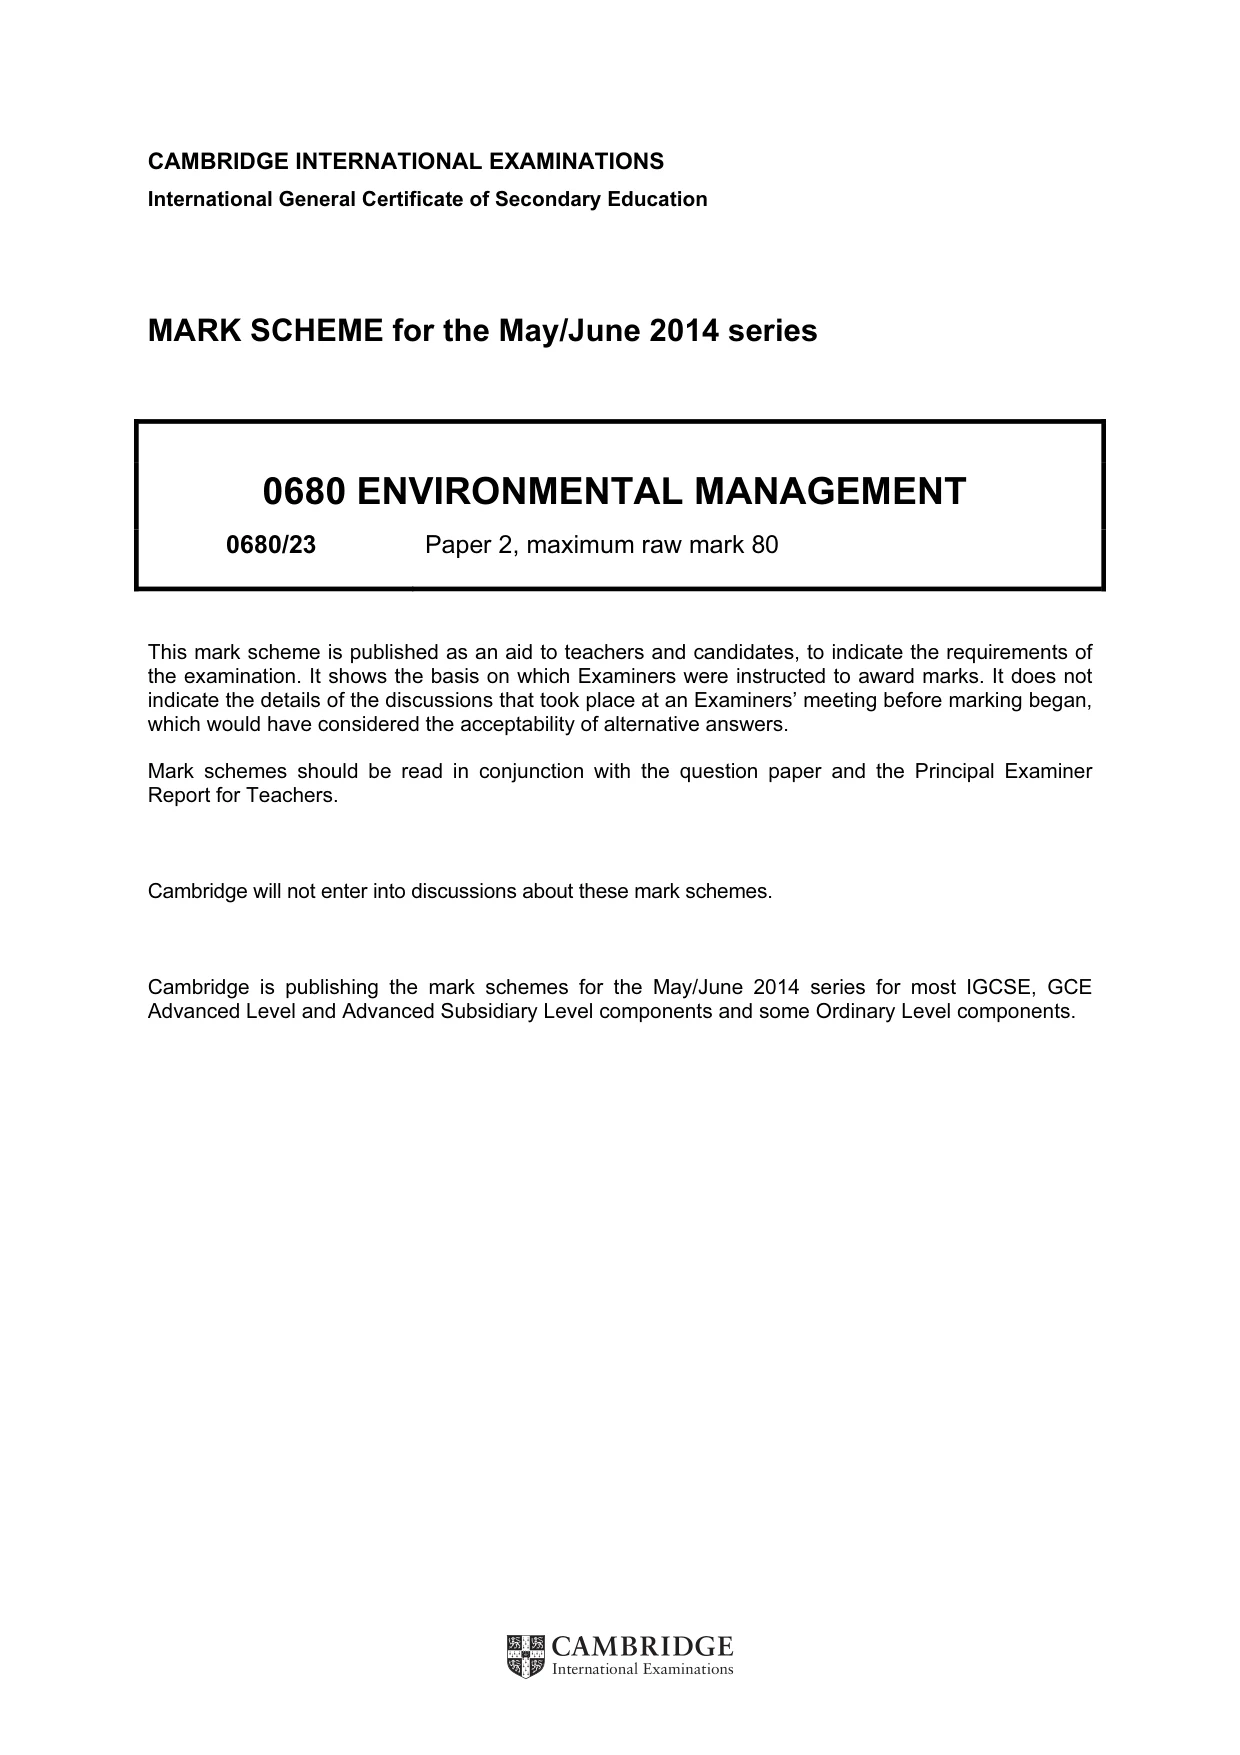
15 0680/23/M/J/14 © UCLES 2014 (f) Road building in the Amazon Basin of Brazil since the 1960s has led to many areas of rainforest being cleared. Look at the spider diagram, which gives the main economic uses of the land that has been cleared. dam building for hydro-electric power cattle ranching logging hardwoods cultivation of crops e.g. soy beans mining (iron ore, nickel, gold) main economic uses (i) Most of these economic uses would be described as unsustainable. Explain why. … … … … … … [4] (ii) Explain how it is possible to make economic activities such as tourism and forestry, as well as those in the spider diagram, more sustainable and less damaging to the environment. … … … … … … … … … … [5] [Total: 40]
Question paper, page 16
16 0680/23/M/J/14 © UCLES 2014 Permission to reproduce items where third-party owned material protected by copyright is included has been sought and cleared where possible. Every reasonable effort has been made by the publisher (UCLES) to trace copyright holders, but if any items requiring clearance have unwittingly been included, the publisher will be pleased to make amends at the earliest possible opportunity. Cambridge International Examinations is part of the Cambridge Assessment Group. Cambridge Assessment is the brand name of University of Cambridge Local Examinations Syndicate (UCLES), which is itself a department of the University of Cambridge. BLANK PAGE
Mark scheme, page 1
CAMBRIDGE INTERNATIONAL EXAMINATIONS International General Certificate of Secondary Education MARK SCHEME for the May/June 2014 series 0680 ENVIRONMENTAL MANAGEMENT 0680/23 Paper 2, maximum raw mark 80 This mark scheme is published as an aid to teachers and candidates, to indicate the requirements of the examination. It shows the basis on which Examiners were instructed to award marks. It does not indicate the details of the discussions that took place at an Examiners’ meeting before marking began, which would have considered the acceptability of alternative answers. Mark schemes should be read in conjunction with the question paper and the Principal Examiner Report for Teachers. Cambridge will not enter into discussions about these mark schemes. Cambridge is publishing the mark schemes for the May/June 2014 series for most IGCSE, GCE Advanced Level and Advanced Subsidiary Level components and some Ordinary Level components.
Mark scheme, page 2
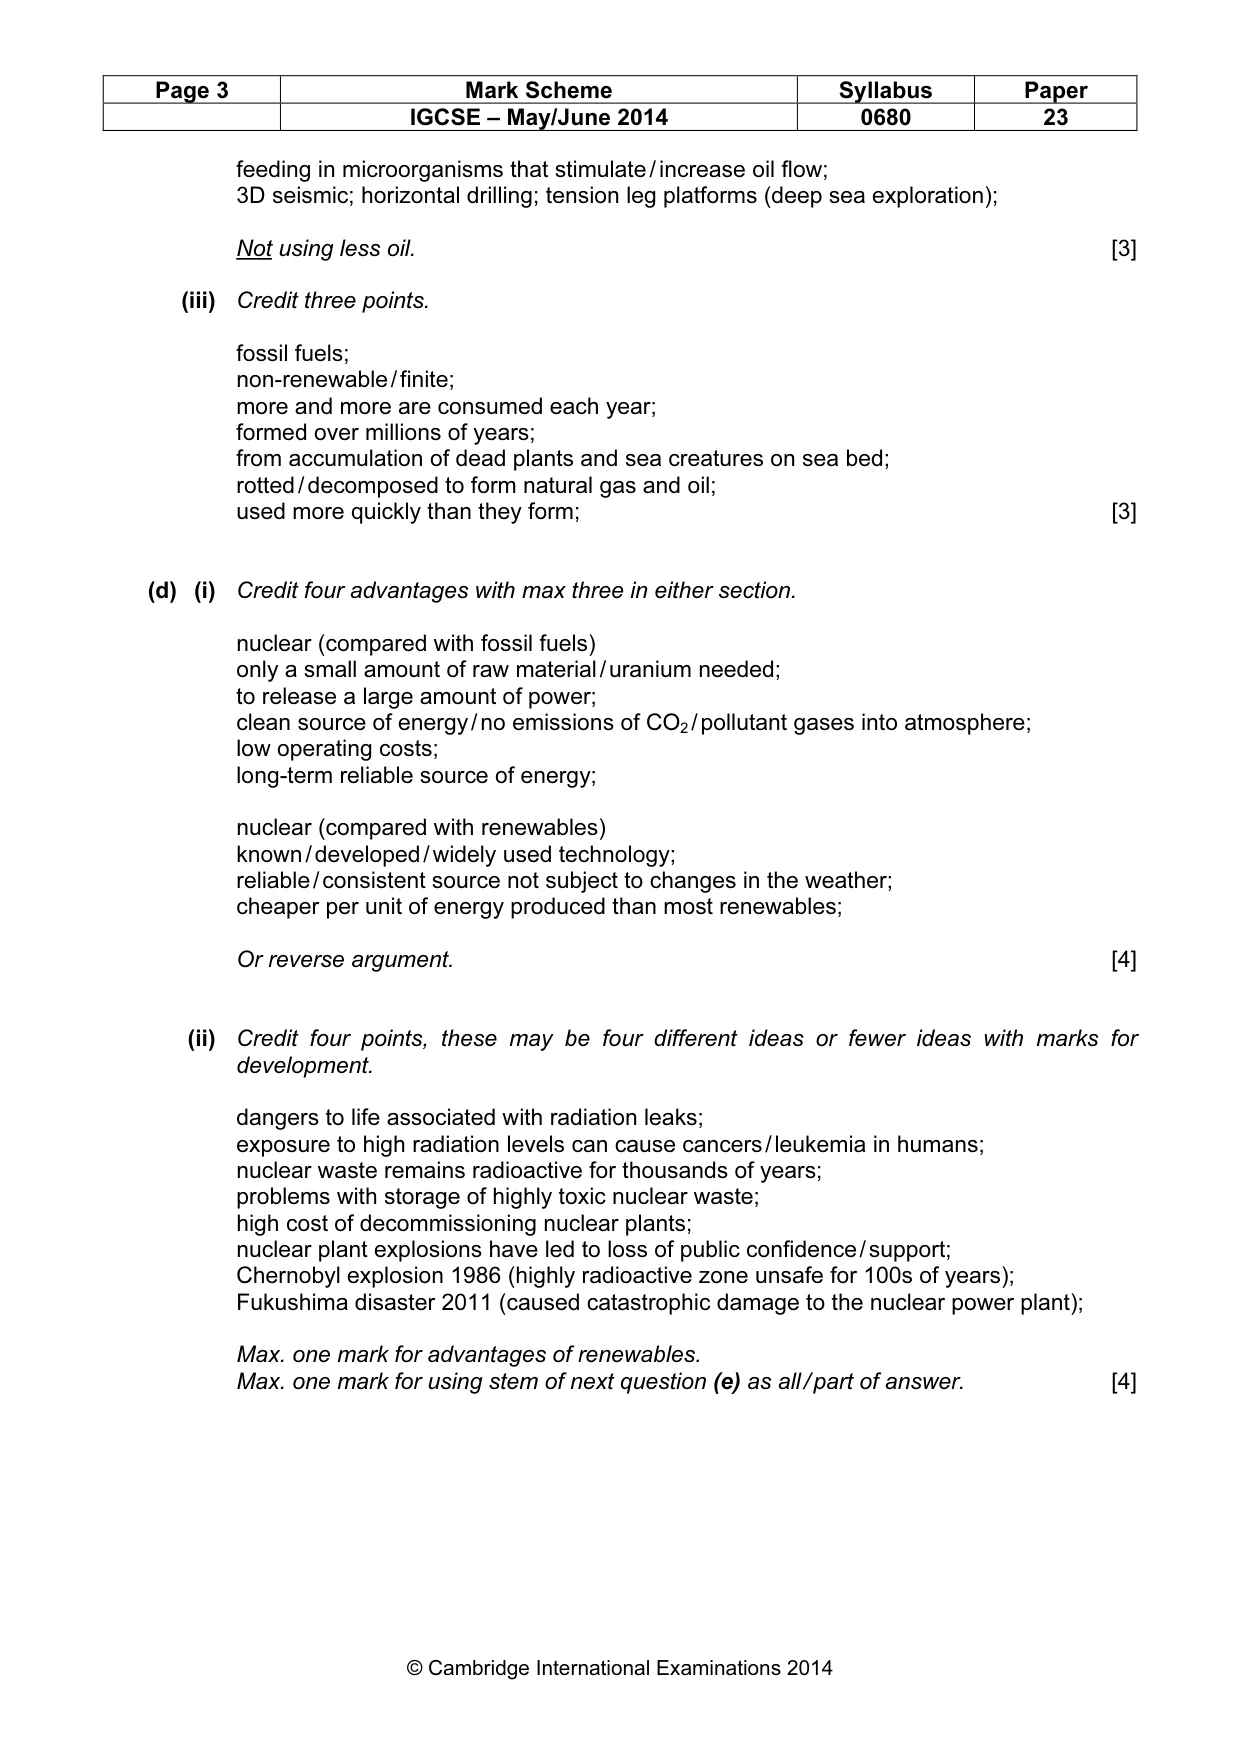
Page 2 Mark Scheme Syllabus Paper IGCSE – May/June 2014 0680 23 © Cambridge International Examinations 2014 1 (a) (i) Credit three descriptive points. Increased; by 50%; from 8000 in 1990 to 12 000 tonnes in 2010; credit accurate detail from graph, e.g. more rapid increase from 2003; decrease in 2009; rapid rise back up after 2009; [3] (ii) 33.3% but accept 33% Reject ‘one third’. [1] (b) (i) three accurate plots for CO2 60% CO 20% and SO2 1% ignore shading issues. [1] (ii) Award a max. of three marks on either SO2 or CO2. sulfur dioxide (SO2): one of the main gases causing acid rain; increases acidity levels in soils; trees die (leaves / needles fall, trees become less resistant to drought / frost disease); rivers and lakes acidified / pH lowered; causing deaths of fish and plant life; accelerates corrosion of buildings and monuments; causes respiratory problems / coughing / wheezing / shortness of breath / chest tightness; increased levels of bronchitis / lung cancer; carbon dioxide (CO2): is a greenhouse gas; one of the main causes of (enhanced) global warming; leading to more extreme weather events; rising sea levels; flooding; climate change; more CO2 more frequent / severe heat waves; more heat-related deaths; more CO2 increase in pollen allergies; asthma; smog pollution; infectious diseases; [4] (c) (i) Credit two descriptive points. not all that accurate / under-estimates / low; predictions have been extended by 2010; oil by 33 years and natural gas by 22 years; possibly accurate but new finds have extended time; [2] (ii) Credit three reasons or two reasons with at least one developed. new discoveries of oil / natural gas; in more remote / difficult areas such as the Arctic; in deeper water in the oceans; e.g. deep water drilling in Gulf of Mexico / off Brazil; new / improvements in technology; economics of costs benefits / demand; allows more oil / gas extraction from existing oil / natural gas reserves; fracking to extract oil and gas from oil / gas shales; fracturing / applying pressure to the rocks to stimulate the flow of trapped natural gas; injecting low salt water into a reservoir to push out oil trapped in rock pores; injecting carbon dioxide into wells;
Mark scheme, page 3
Page 3 Mark Scheme Syllabus Paper IGCSE – May/June 2014 0680 23 © Cambridge International Examinations 2014 feeding in microorganisms that stimulate / increase oil flow; 3D seismic; horizontal drilling; tension leg platforms (deep sea exploration); Not using less oil. [3] (iii) Credit three points. fossil fuels; non-renewable / finite; more and more are consumed each year; formed over millions of years; from accumulation of dead plants and sea creatures on sea bed; rotted / decomposed to form natural gas and oil; used more quickly than they form; [3] (d) (i) Credit four advantages with max three in either section. nuclear (compared with fossil fuels) only a small amount of raw material / uranium needed; to release a large amount of power; clean source of energy / no emissions of CO2 / pollutant gases into atmosphere; low operating costs; long-term reliable source of energy; nuclear (compared with renewables) known / developed / widely used technology; reliable / consistent source not subject to changes in the weather; cheaper per unit of energy produced than most renewables; Or reverse argument. [4] (ii) Credit four points, these may be four different ideas or fewer ideas with marks for development. dangers to life associated with radiation leaks; exposure to high radiation levels can cause cancers / leukemia in humans; nuclear waste remains radioactive for thousands of years; problems with storage of highly toxic nuclear waste; high cost of decommissioning nuclear plants; nuclear plant explosions have led to loss of public confidence / support; Chernobyl explosion 1986 (highly radioactive zone unsafe for 100s of years); Fukushima disaster 2011 (caused catastrophic damage to the nuclear power plant); Max. one mark for advantages of renewables. Max. one mark for using stem of next question (e) as all / part of answer. [4]
Mark scheme, page 4
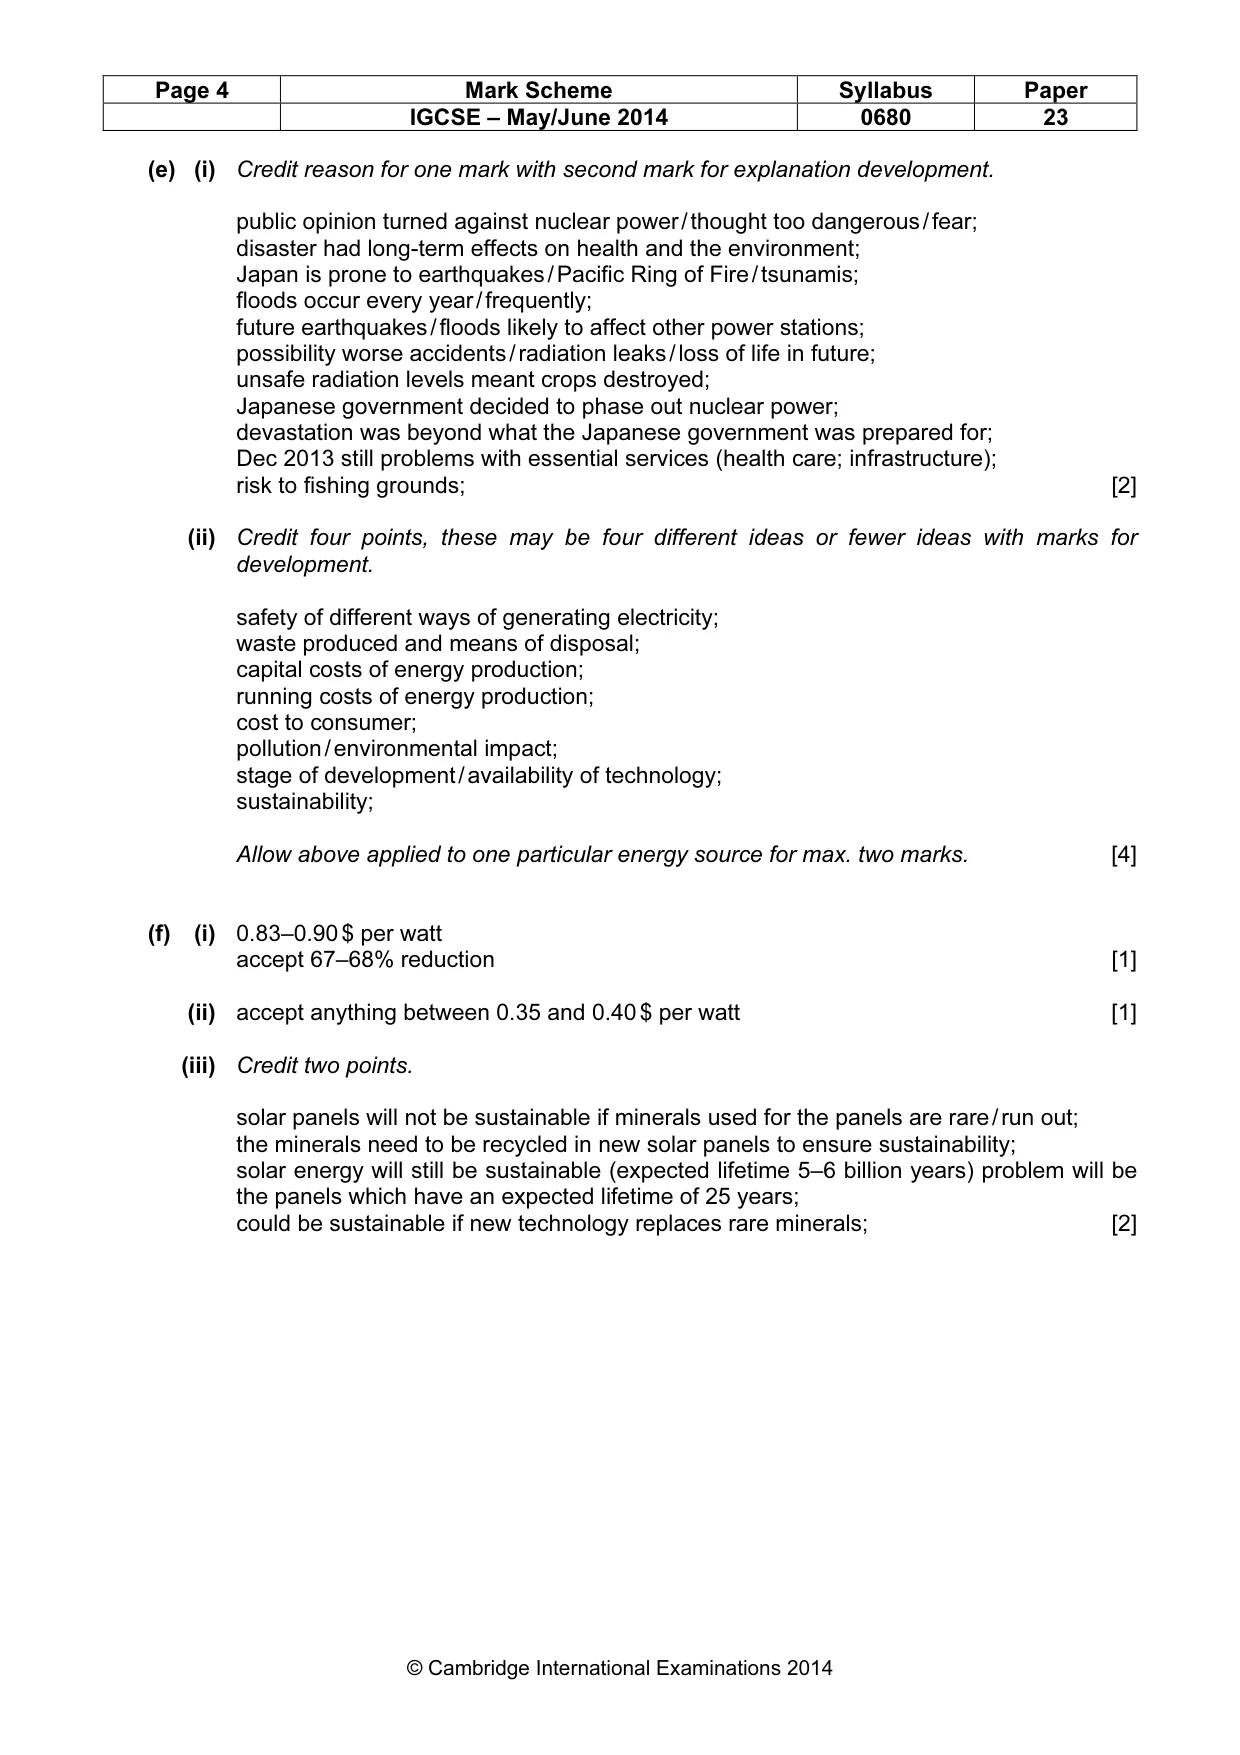
Page 4 Mark Scheme Syllabus Paper IGCSE – May/June 2014 0680 23 © Cambridge International Examinations 2014 (e) (i) Credit reason for one mark with second mark for explanation development. public opinion turned against nuclear power / thought too dangerous / fear; disaster had long-term effects on health and the environment; Japan is prone to earthquakes / Pacific Ring of Fire / tsunamis; floods occur every year / frequently; future earthquakes / floods likely to affect other power stations; possibility worse accidents / radiation leaks / loss of life in future; unsafe radiation levels meant crops destroyed; Japanese government decided to phase out nuclear power; devastation was beyond what the Japanese government was prepared for; Dec 2013 still problems with essential services (health care; infrastructure); risk to fishing grounds; [2] (ii) Credit four points, these may be four different ideas or fewer ideas with marks for development. safety of different ways of generating electricity; waste produced and means of disposal; capital costs of energy production; running costs of energy production; cost to consumer; pollution / environmental impact; stage of development / availability of technology; sustainability; Allow above applied to one particular energy source for max. two marks. [4] (f) (i) 0.83–0.90 $ per watt accept 67–68% reduction [1] (ii) accept anything between 0.35 and 0.40 $ per watt [1] (iii) Credit two points. solar panels will not be sustainable if minerals used for the panels are rare / run out; the minerals need to be recycled in new solar panels to ensure sustainability; solar energy will still be sustainable (expected lifetime 5–6 billion years) problem will be the panels which have an expected lifetime of 25 years; could be sustainable if new technology replaces rare minerals; [2]
Mark scheme, page 5
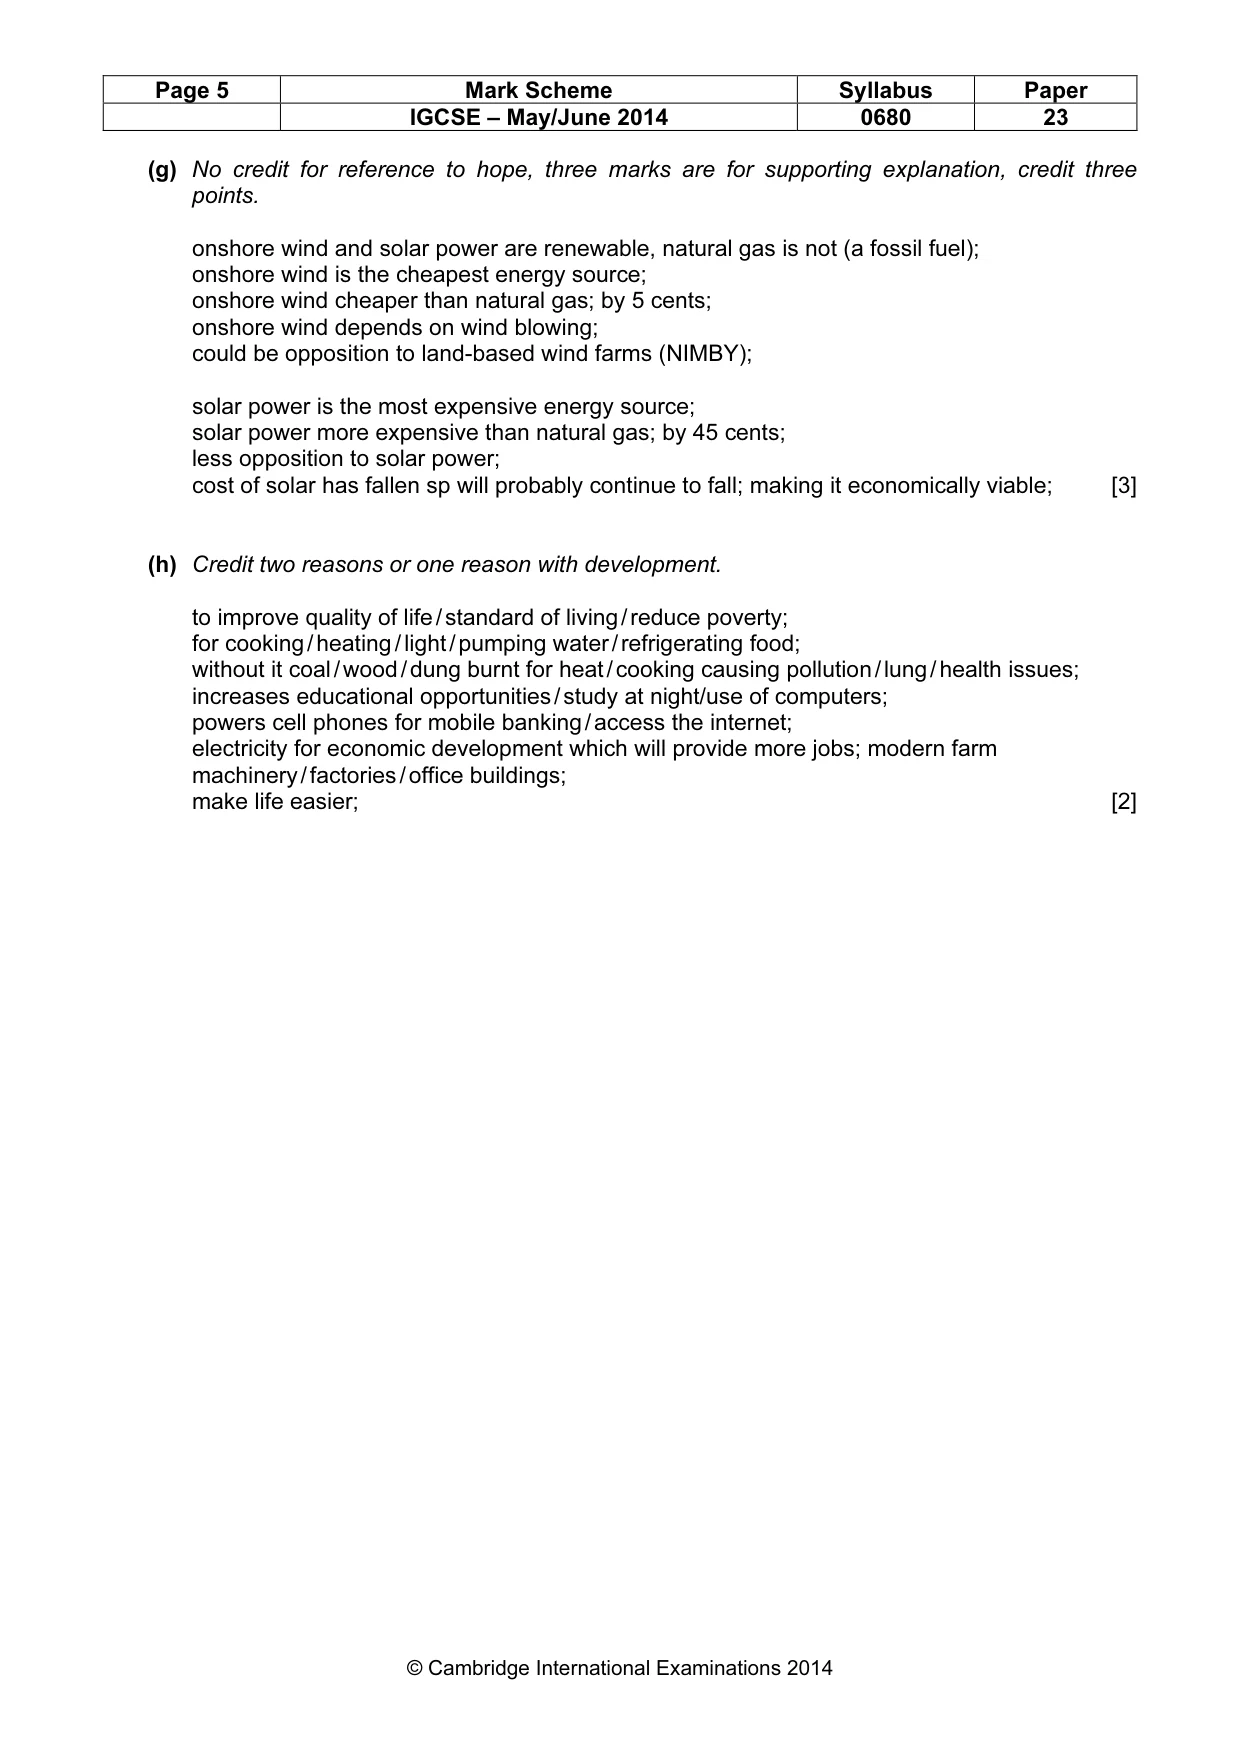
Page 5 Mark Scheme Syllabus Paper IGCSE – May/June 2014 0680 23 © Cambridge International Examinations 2014 (g) No credit for reference to hope, three marks are for supporting explanation, credit three points. onshore wind and solar power are renewable, natural gas is not (a fossil fuel); onshore wind is the cheapest energy source; onshore wind cheaper than natural gas; by 5 cents; onshore wind depends on wind blowing; could be opposition to land-based wind farms (NIMBY); solar power is the most expensive energy source; solar power more expensive than natural gas; by 45 cents; less opposition to solar power; cost of solar has fallen sp will probably continue to fall; making it economically viable; [3] (h) Credit two reasons or one reason with development. to improve quality of life / standard of living / reduce poverty; for cooking / heating / light / pumping water / refrigerating food; without it coal / wood / dung burnt for heat / cooking causing pollution / lung / health issues; increases educational opportunities / study at night/use of computers; powers cell phones for mobile banking / access the internet; electricity for economic development which will provide more jobs; modern farm machinery / factories / office buildings; make life easier; [2]
Mark scheme, page 6
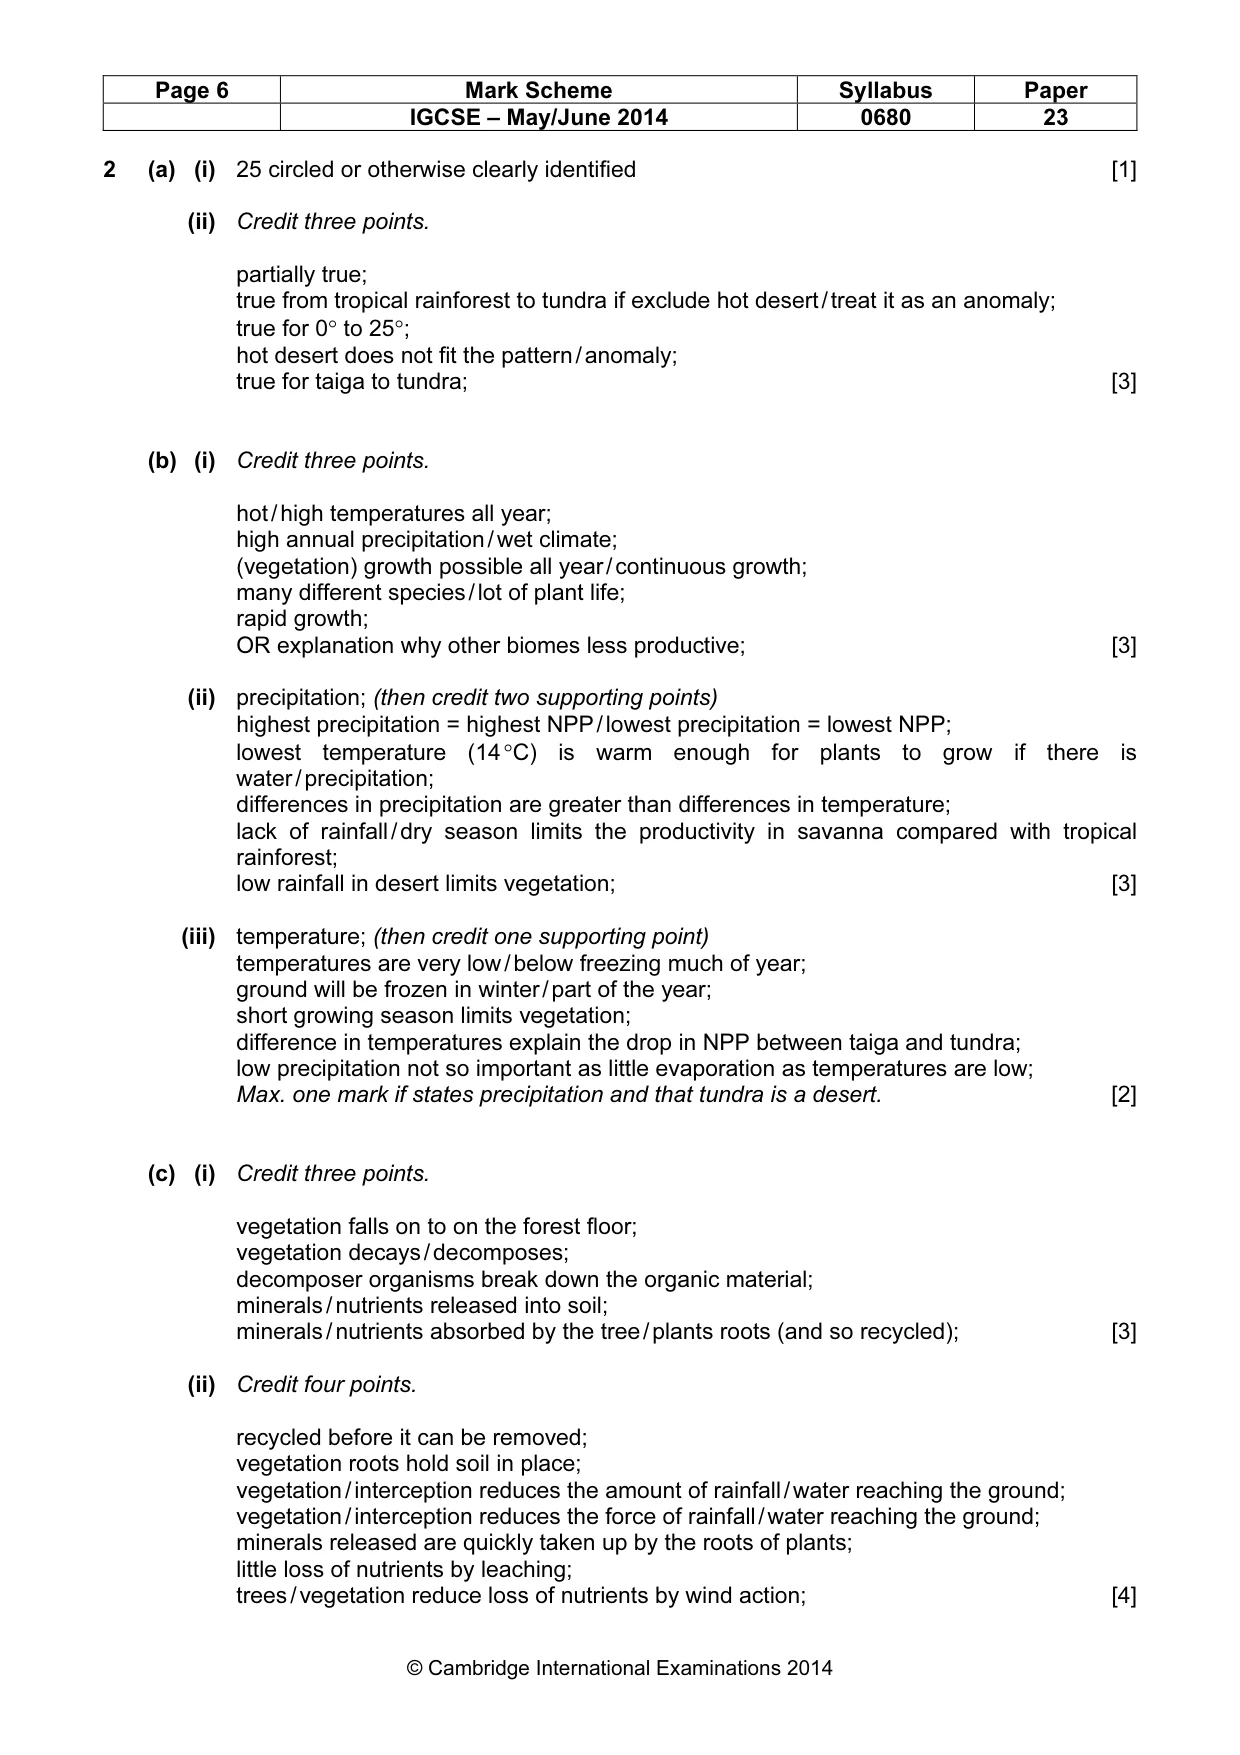
Page 6 Mark Scheme Syllabus Paper IGCSE – May/June 2014 0680 23 © Cambridge International Examinations 2014 2 (a) (i) 25 circled or otherwise clearly identified [1] (ii) Credit three points. partially true; true from tropical rainforest to tundra if exclude hot desert / treat it as an anomaly; true for 0° to 25°; hot desert does not fit the pattern / anomaly; true for taiga to tundra; [3] (b) (i) Credit three points. hot / high temperatures all year; high annual precipitation / wet climate; (vegetation) growth possible all year / continuous growth; many different species / lot of plant life; rapid growth; OR explanation why other biomes less productive; [3] (ii) precipitation; (then credit two supporting points) highest precipitation = highest NPP / lowest precipitation = lowest NPP; lowest temperature (14 °C) is warm enough for plants to grow if there is water / precipitation; differences in precipitation are greater than differences in temperature; lack of rainfall / dry season limits the productivity in savanna compared with tropical rainforest; low rainfall in desert limits vegetation; [3] (iii) temperature; (then credit one supporting point) temperatures are very low / below freezing much of year; ground will be frozen in winter / part of the year; short growing season limits vegetation; difference in temperatures explain the drop in NPP between taiga and tundra; low precipitation not so important as little evaporation as temperatures are low; Max. one mark if states precipitation and that tundra is a desert. [2] (c) (i) Credit three points. vegetation falls on to on the forest floor; vegetation decays / decomposes; decomposer organisms break down the organic material; minerals / nutrients released into soil; minerals / nutrients absorbed by the tree / plants roots (and so recycled); [3] (ii) Credit four points. recycled before it can be removed; vegetation roots hold soil in place; vegetation / interception reduces the amount of rainfall / water reaching the ground; vegetation / interception reduces the force of rainfall / water reaching the ground; minerals released are quickly taken up by the roots of plants; little loss of nutrients by leaching; trees / vegetation reduce loss of nutrients by wind action; [4]
Mark scheme, page 7
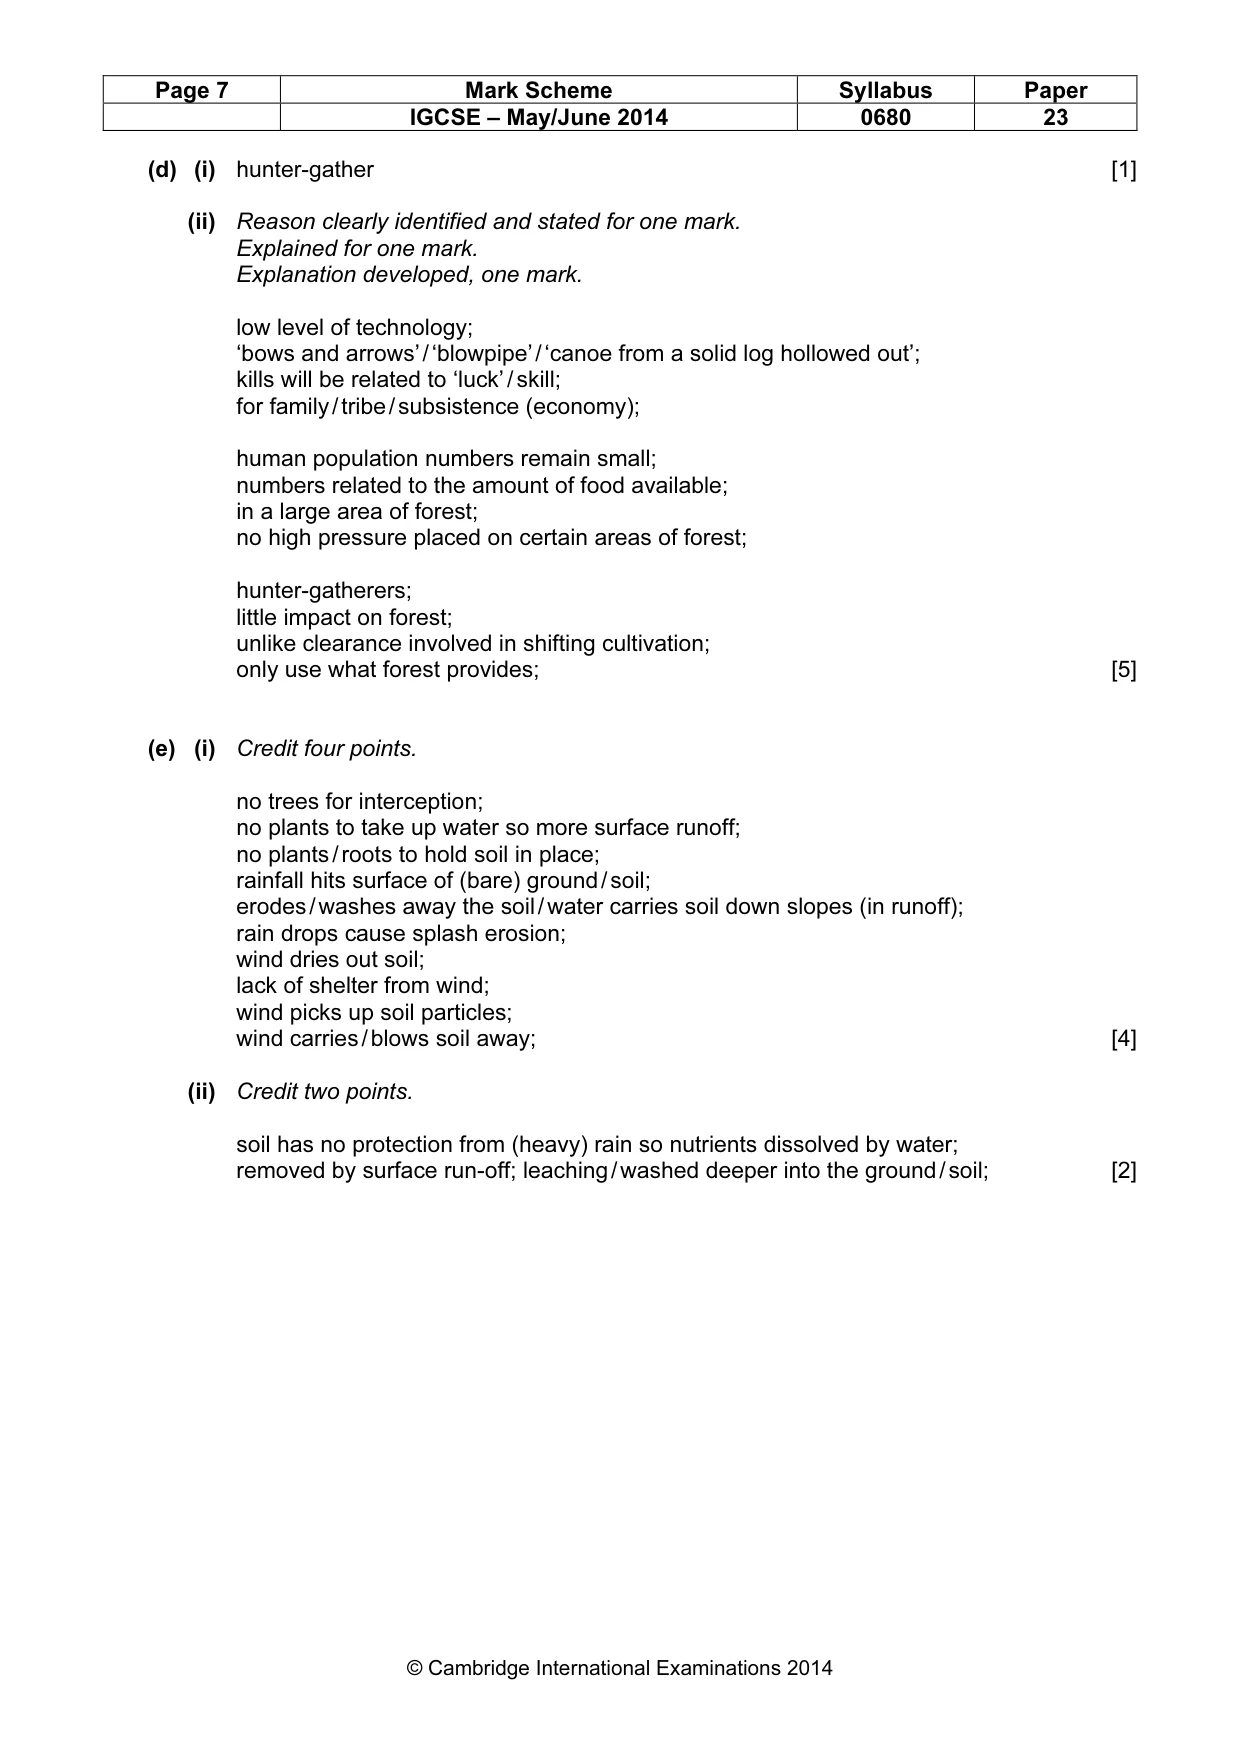
Page 7 Mark Scheme Syllabus Paper IGCSE – May/June 2014 0680 23 © Cambridge International Examinations 2014 (d) (i) hunter-gather [1] (ii) Reason clearly identified and stated for one mark. Explained for one mark. Explanation developed, one mark. low level of technology; ‘bows and arrows’ / ‘blowpipe’ / ‘canoe from a solid log hollowed out’; kills will be related to ‘luck’ / skill; for family / tribe / subsistence (economy); human population numbers remain small; numbers related to the amount of food available; in a large area of forest; no high pressure placed on certain areas of forest; hunter-gatherers; little impact on forest; unlike clearance involved in shifting cultivation; only use what forest provides; [5] (e) (i) Credit four points. no trees for interception; no plants to take up water so more surface runoff; no plants / roots to hold soil in place; rainfall hits surface of (bare) ground / soil; erodes / washes away the soil / water carries soil down slopes (in runoff); rain drops cause splash erosion; wind dries out soil; lack of shelter from wind; wind picks up soil particles; wind carries / blows soil away; [4] (ii) Credit two points. soil has no protection from (heavy) rain so nutrients dissolved by water; removed by surface run-off; leaching / washed deeper into the ground / soil; [2]
Mark scheme, page 8
Page 8 Mark Scheme Syllabus Paper IGCSE – May/June 2014 0680 23 © Cambridge International Examinations 2014 (f) (i) Credit four points. General points regarding unsustainability are acceptable and do not have to be related to particular land uses. dam building for HEP large areas flooded; rotting vegetation emits methane (a greenhouse gas); mining (iron nickel gold) surface layers removed and replaced by large open pits; toxic materials leak into rivers / groundwater; farming; cattle ranching and/or cultivation of crops, e.g. soy beans surface not always continuously covered; dangers of overgrazing / overcultivation damaging soil structure; logging hardwoods destruction of wider areas of forest; commercially useful trees are scattered over large areas; building the infrastructure of access routes, houses and support services increases areas cleared; puts remaining areas of forest more at risk; makes remaining forest easier to clear; [4] (ii) Credit five points these may be five different ideas or fewer ideas with marks for development. tourism encourage ecotourism; ecotourists observe / learn about the ecosystem; some of the money earned is used to protect the ecosystem; some of the money benefits local people economically; local traditions / cultures are respected; forestry protecting the rainforests by preserving blocks of forest in national parks / nature reserves; dam building for HEP instead of big HEP projects build smaller schemes closer to where power is needed; mining (iron nickel gold) reclaim the land after mining is finished; farming; cattle ranching and / or cultivation of crops, e.g. soy beans agroforestry; use forest crops (e.g. rubber) to provide shelter to the soil; plant fast growing trees for commercial use (e.g. eucalyptus); leave natural forest cover over a minimum percentage of the farm unit; logging hardwoods selective logging; of only mature trees; [5] [Total: 80 marks]
What you needed in this session
Cambridge’s own grade thresholds for 2014 May/June, Paper 2 · Variant 3. A higher threshold means an easier paper — the bar moves with how the cohort did.