Cambridge IGCSE Environmental Management 0680 — 2014 May/June Paper 2 · Variant 1
0680/21/M/J/14 · 80 marks · ≈90 min
The question paper and its mark scheme, free to read here and free to download. This is Cambridge’s own paper, exactly as it was sat.
Question paper16 pages



Mark scheme8 pages
Answers below. Sit the paper first if you are practising.
Paper as text
Question paper, page 1
This document consists of 15 printed pages, 1 blank page and 1 Insert. DC (RW/SW) 81701/3 © UCLES 2014 [Turn over Cambridge International Examinations Cambridge International General Certificate of Secondary Education * 6 3 4 2 0 4 5 6 6 9 * ENVIRONMENTAL MANAGEMENT 0680/21 Paper 2 May/June 2014 1 hour 45 minutes Candidates answer on the Question Paper. Additional Materials: Ruler Insert READ THESE INSTRUCTIONS FIRST Write your Centre number, candidate number and name on all the work you hand in. Write in dark blue or black pen. You may use an HB pencil for any diagrams or graphs. Do not use staples, paper clips, glue or correction fluid. DO NOT WRITE IN ANY BARCODES. Answer both questions. Electronic calculators may be used. You may lose marks if you do not show your working or if you do not use appropriate units. At the end of the examination, fasten all your work securely together. The number of marks is given in brackets [ ] at the end of each question or part question.
Question paper, page 2
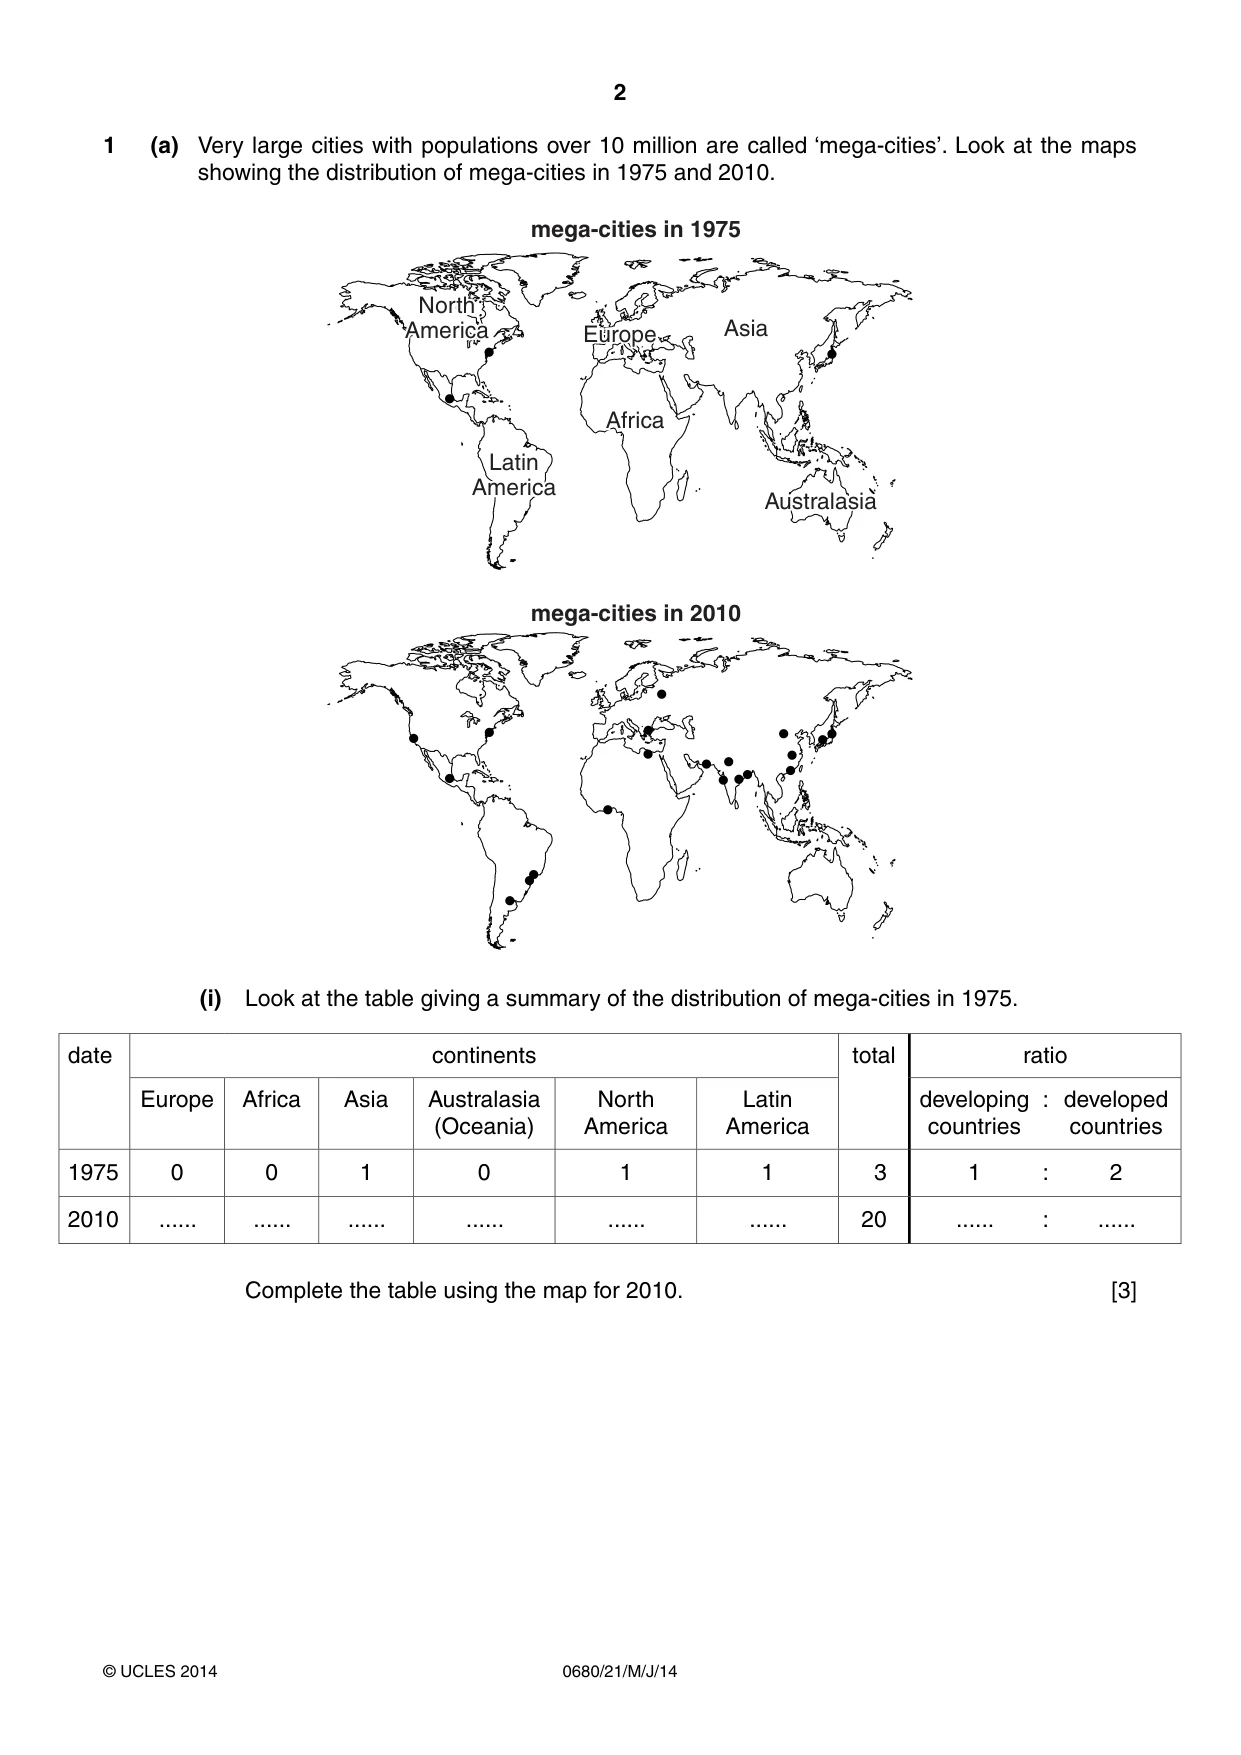
2 0680/21/M/J/14 © UCLES 2014 1 (a) Very large cities with populations over 10 million are called ‘mega-cities’. Look at the maps showing the distribution of mega-cities in 1975 and 2010. North America Latin America Asia Africa Europe Australasia mega-cities in 1975 mega-cities in 2010 (i) Look at the table giving a summary of the distribution of mega-cities in 1975. date continents total ratio Europe Africa Asia Australasia (Oceania) North America Latin America developing countries : developed countries 1975 0 0 1 0 1 1 3 1 : 2 2010 … … … … … … 20 … : … Complete the table using the map for 2010. [3]
Question paper, page 3
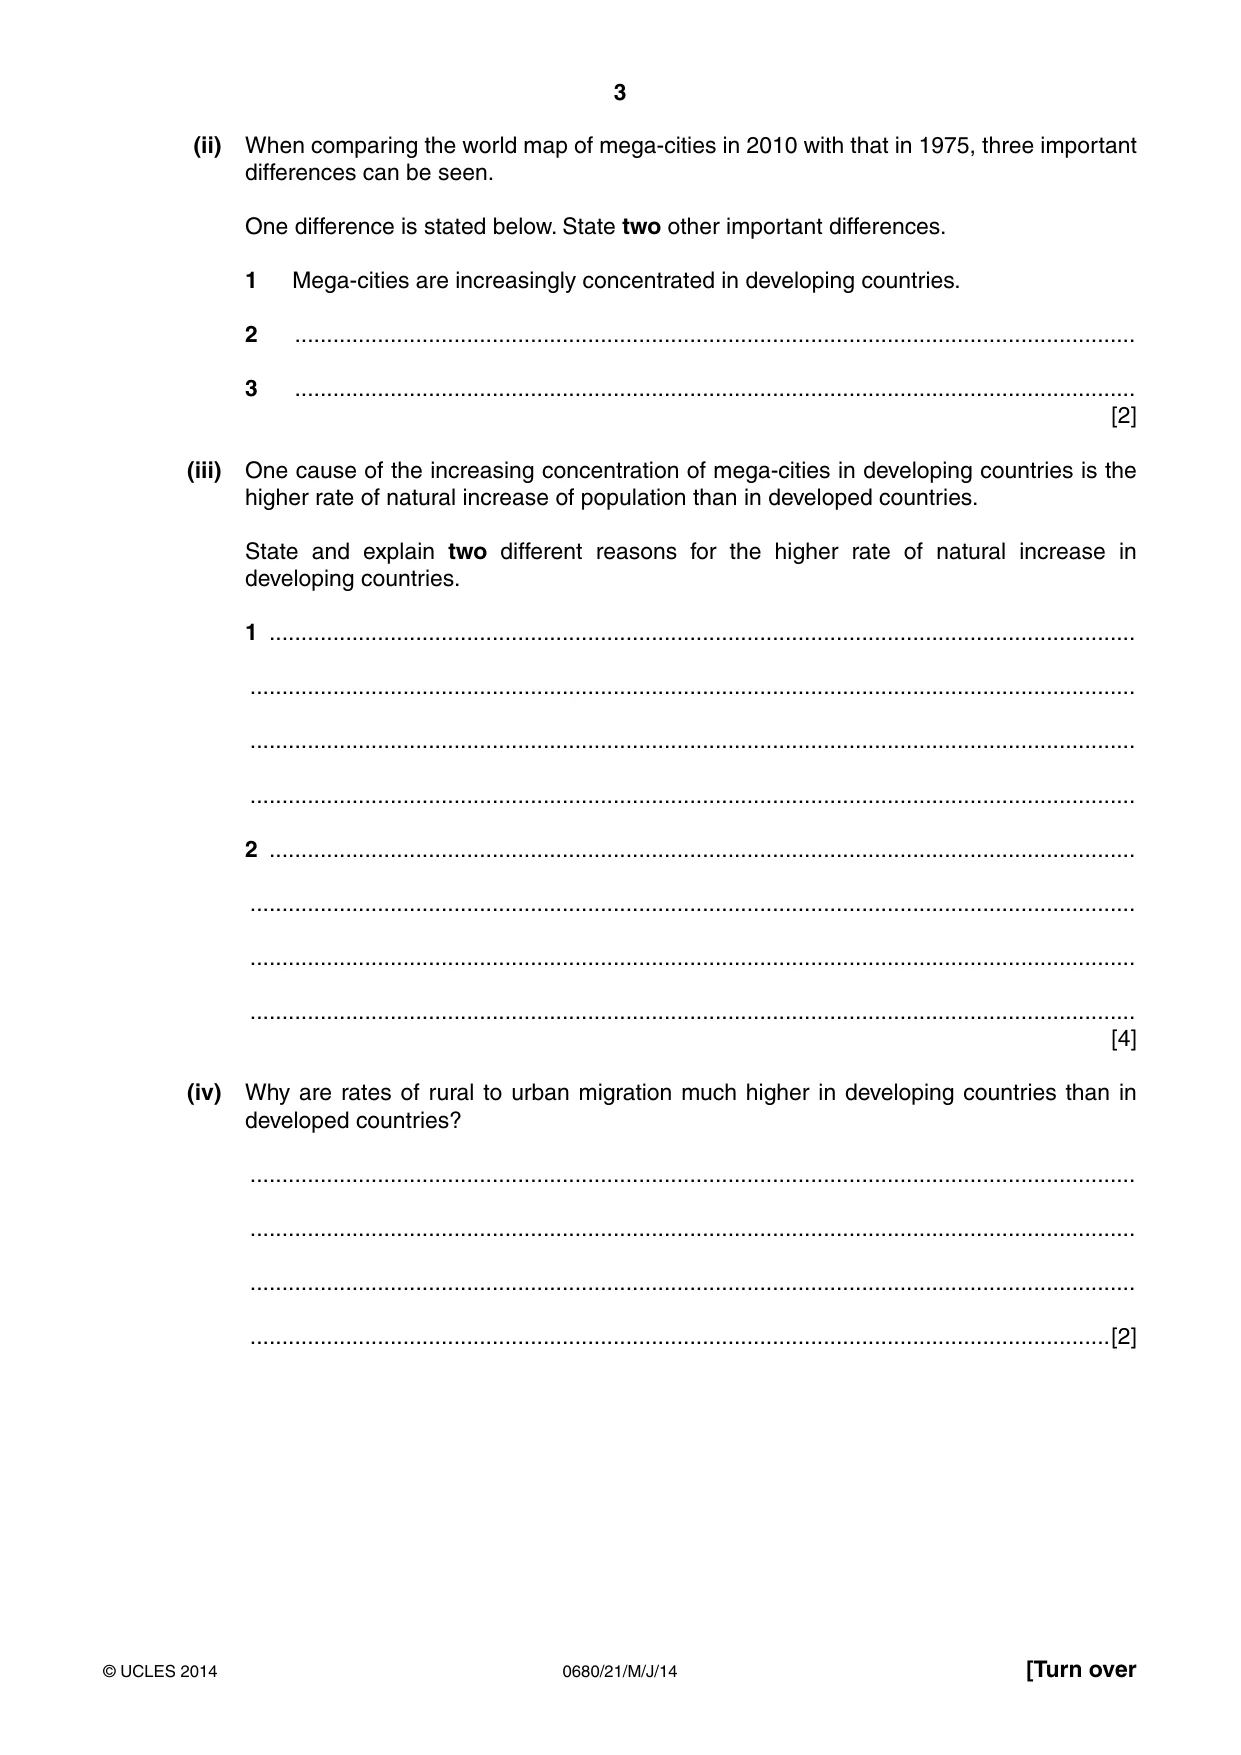
3 0680/21/M/J/14 © UCLES 2014 [Turn over (ii) When comparing the world map of mega-cities in 2010 with that in 1975, three important differences can be seen. One difference is stated below. State two other important differences. 1 Mega-cities are increasingly concentrated in developing countries. 2 … 3 … [2] (iii) One cause of the increasing concentration of mega-cities in developing countries is the higher rate of natural increase of population than in developed countries. State and explain two different reasons for the higher rate of natural increase in developing countries. 1 … … … … 2 … … … … [4] (iv) Why are rates of rural to urban migration much higher in developing countries than in developed countries? … … … …[2]
Question paper, page 4
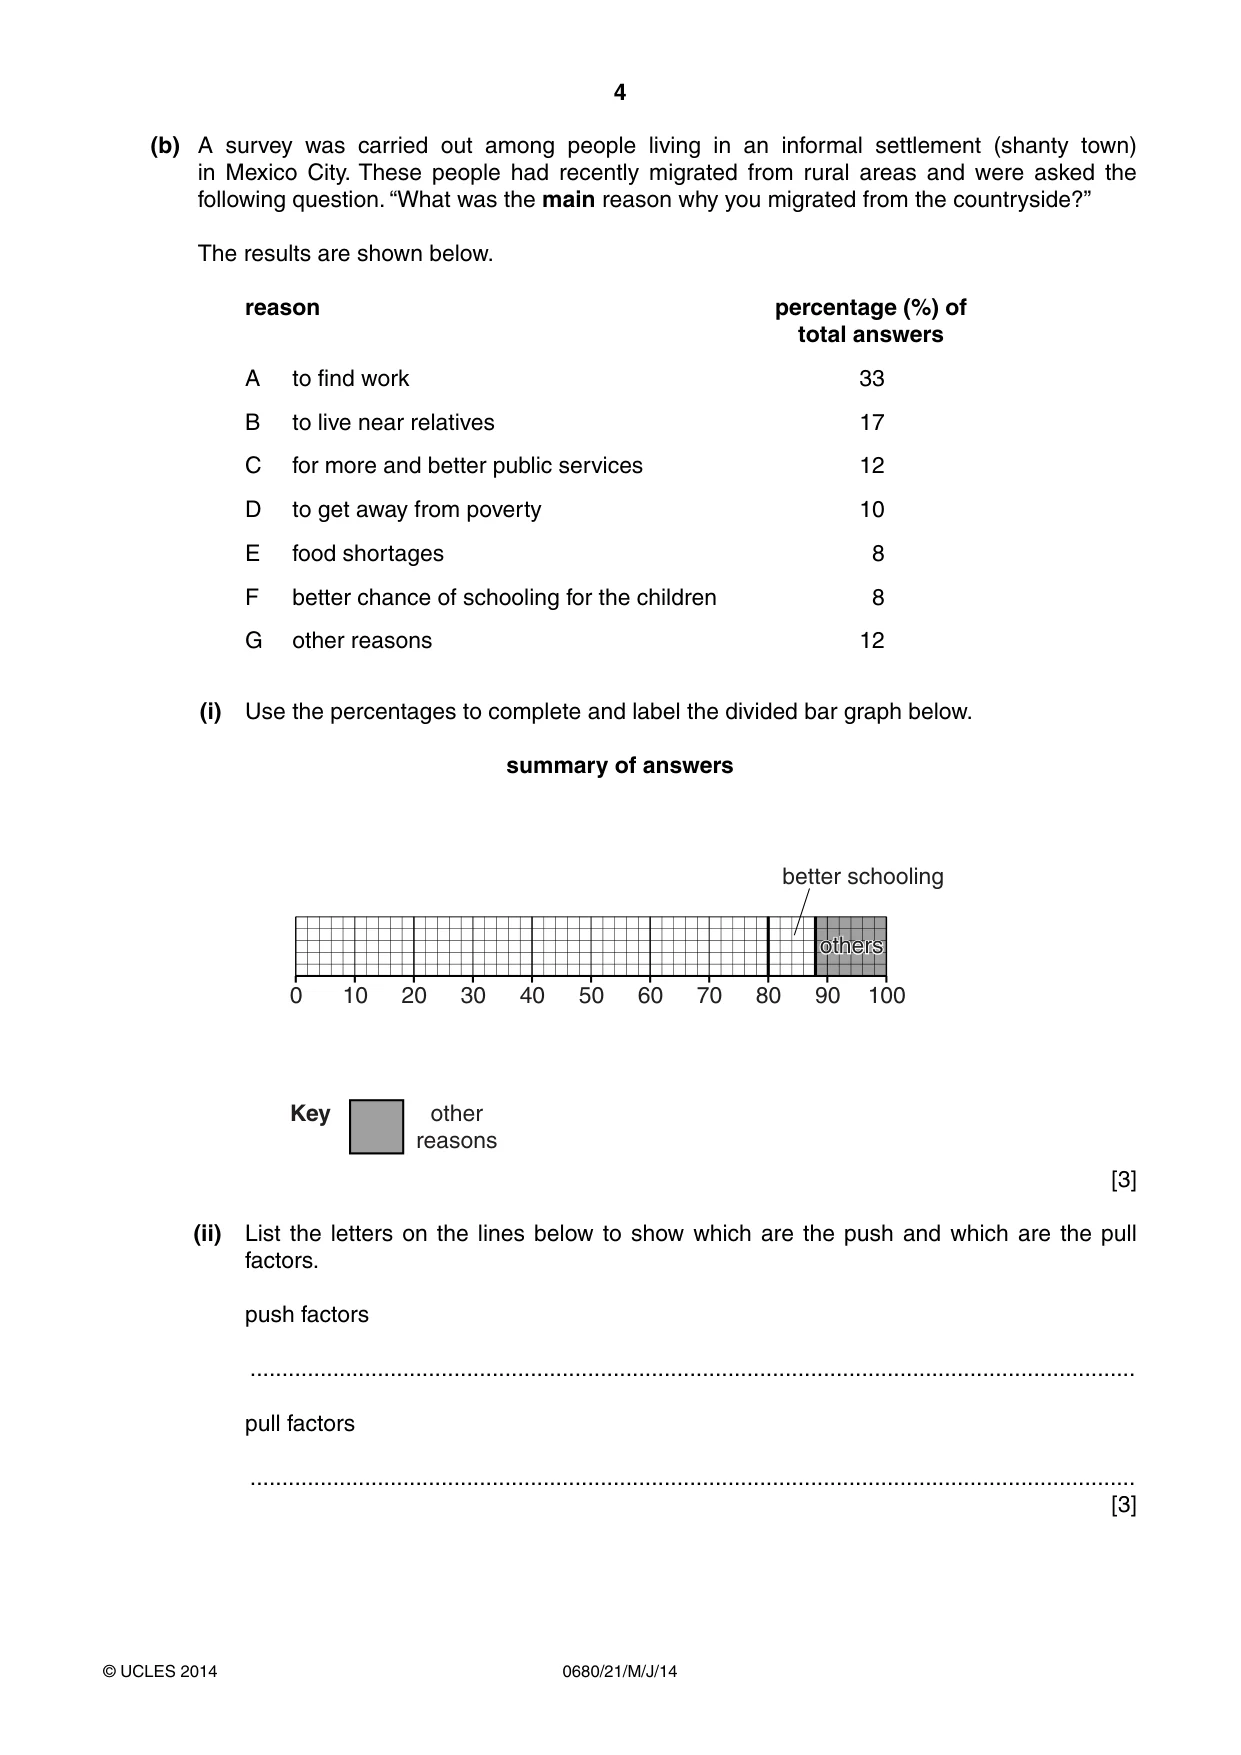
4 0680/21/M/J/14 © UCLES 2014 (b) A survey was carried out among people living in an informal settlement (shanty town) in Mexico City. These people had recently migrated from rural areas and were asked the following question. “What was the main reason why you migrated from the countryside?” The results are shown below. reason percentage (%) of total answers A to find work 33 B to live near relatives 17 C for more and better public services 12 D to get away from poverty 10 E food shortages 8 F better chance of schooling for the children 8 G other reasons 12 (i) Use the percentages to complete and label the divided bar graph below. summary of answers 0 10 20 30 40 50 60 70 80 90 100 others better schooling other reasons Key [3] (ii) List the letters on the lines below to show which are the push and which are the pull factors. push factors … pull factors … [3]
Question paper, page 5
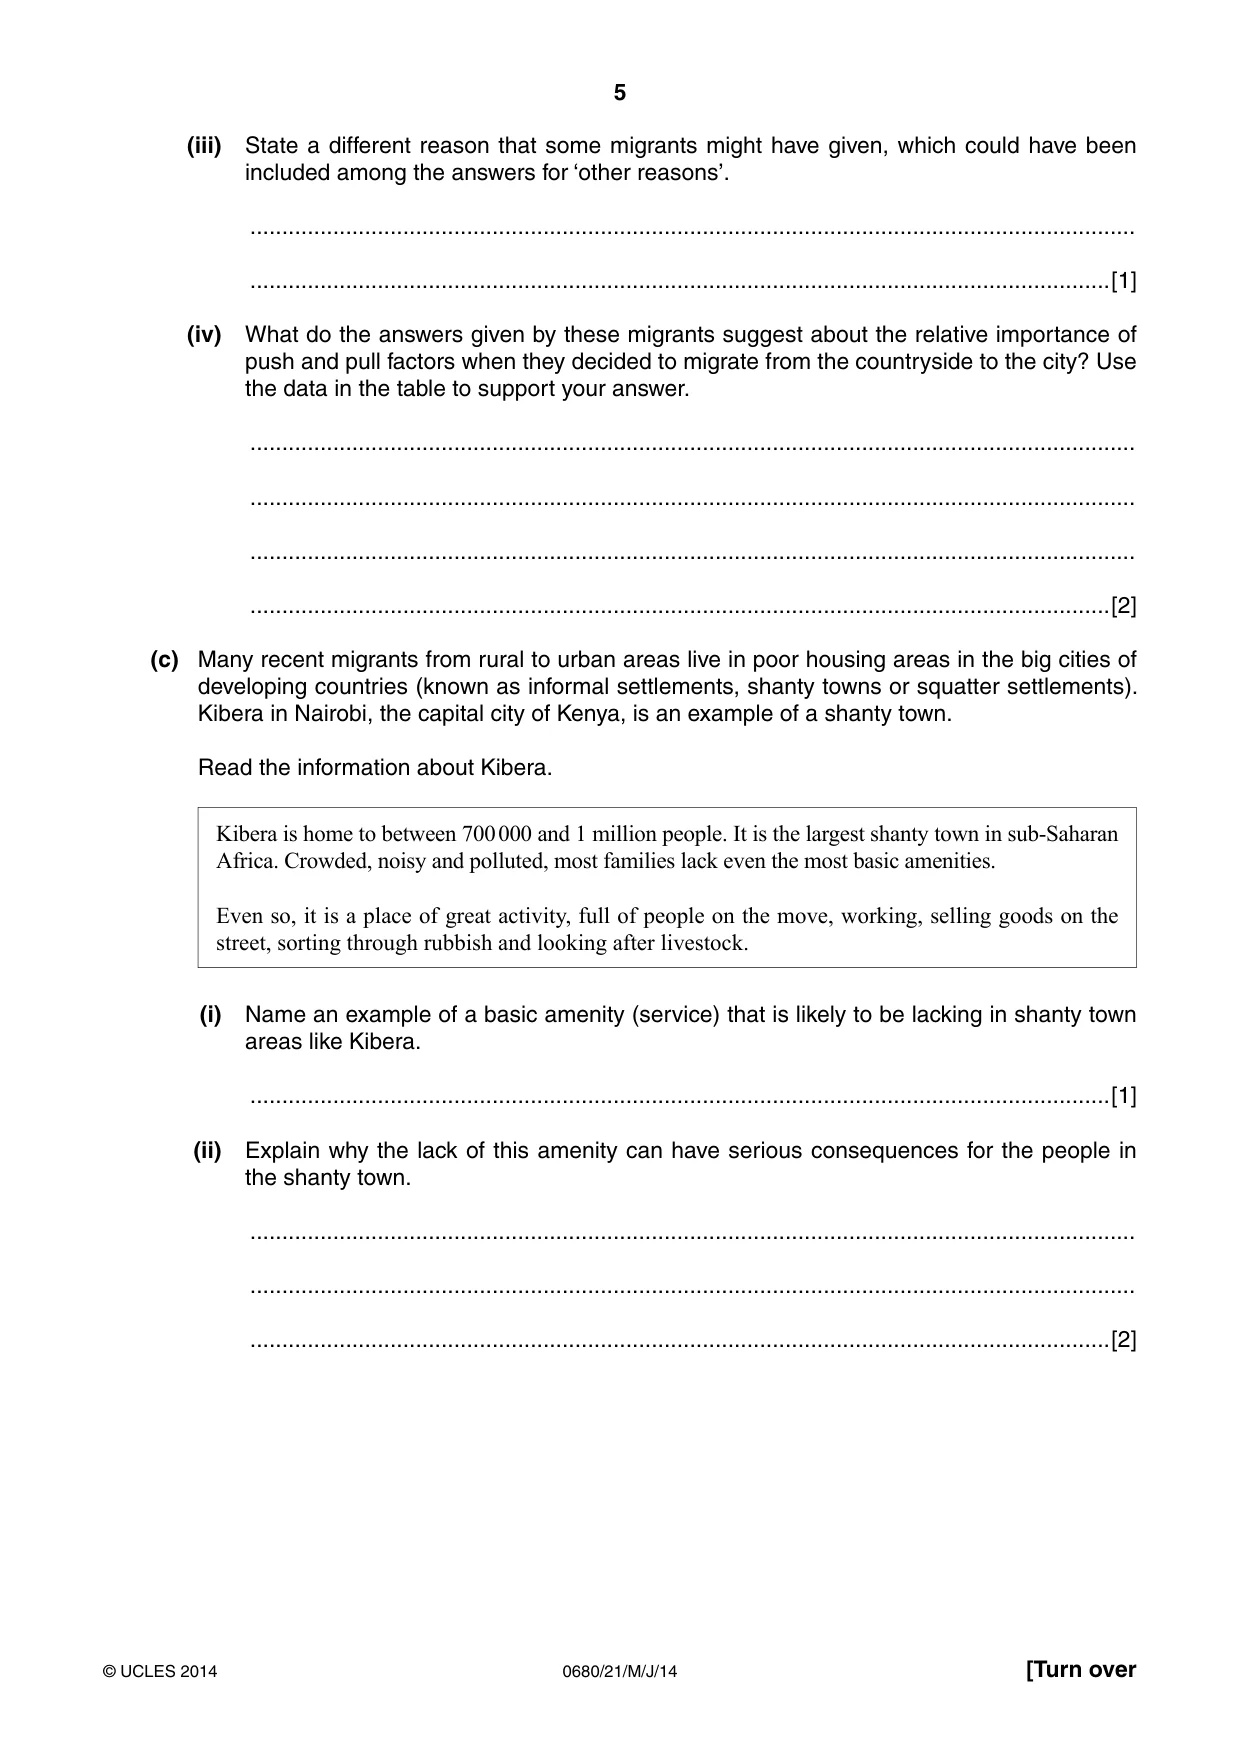
5 0680/21/M/J/14 © UCLES 2014 [Turn over (iii) State a different reason that some migrants might have given, which could have been included among the answers for ‘other reasons’. … …[1] (iv) What do the answers given by these migrants suggest about the relative importance of push and pull factors when they decided to migrate from the countryside to the city? Use the data in the table to support your answer. … … … …[2] (c) Many recent migrants from rural to urban areas live in poor housing areas in the big cities of developing countries (known as informal settlements, shanty towns or squatter settlements). Kibera in Nairobi, the capital city of Kenya, is an example of a shanty town. Read the information about Kibera. Kibera is home to between 700 000 and 1 million people. It is the largest shanty town in sub-Saharan Africa. Crowded, noisy and polluted, most families lack even the most basic amenities. Even so, it is a place of great activity, full of people on the move, working, selling goods on the street, sorting through rubbish and looking after livestock. (i) Name an example of a basic amenity (service) that is likely to be lacking in shanty town areas like Kibera. …[1] (ii) Explain why the lack of this amenity can have serious consequences for the people in the shanty town. … … …[2]
Question paper, page 6
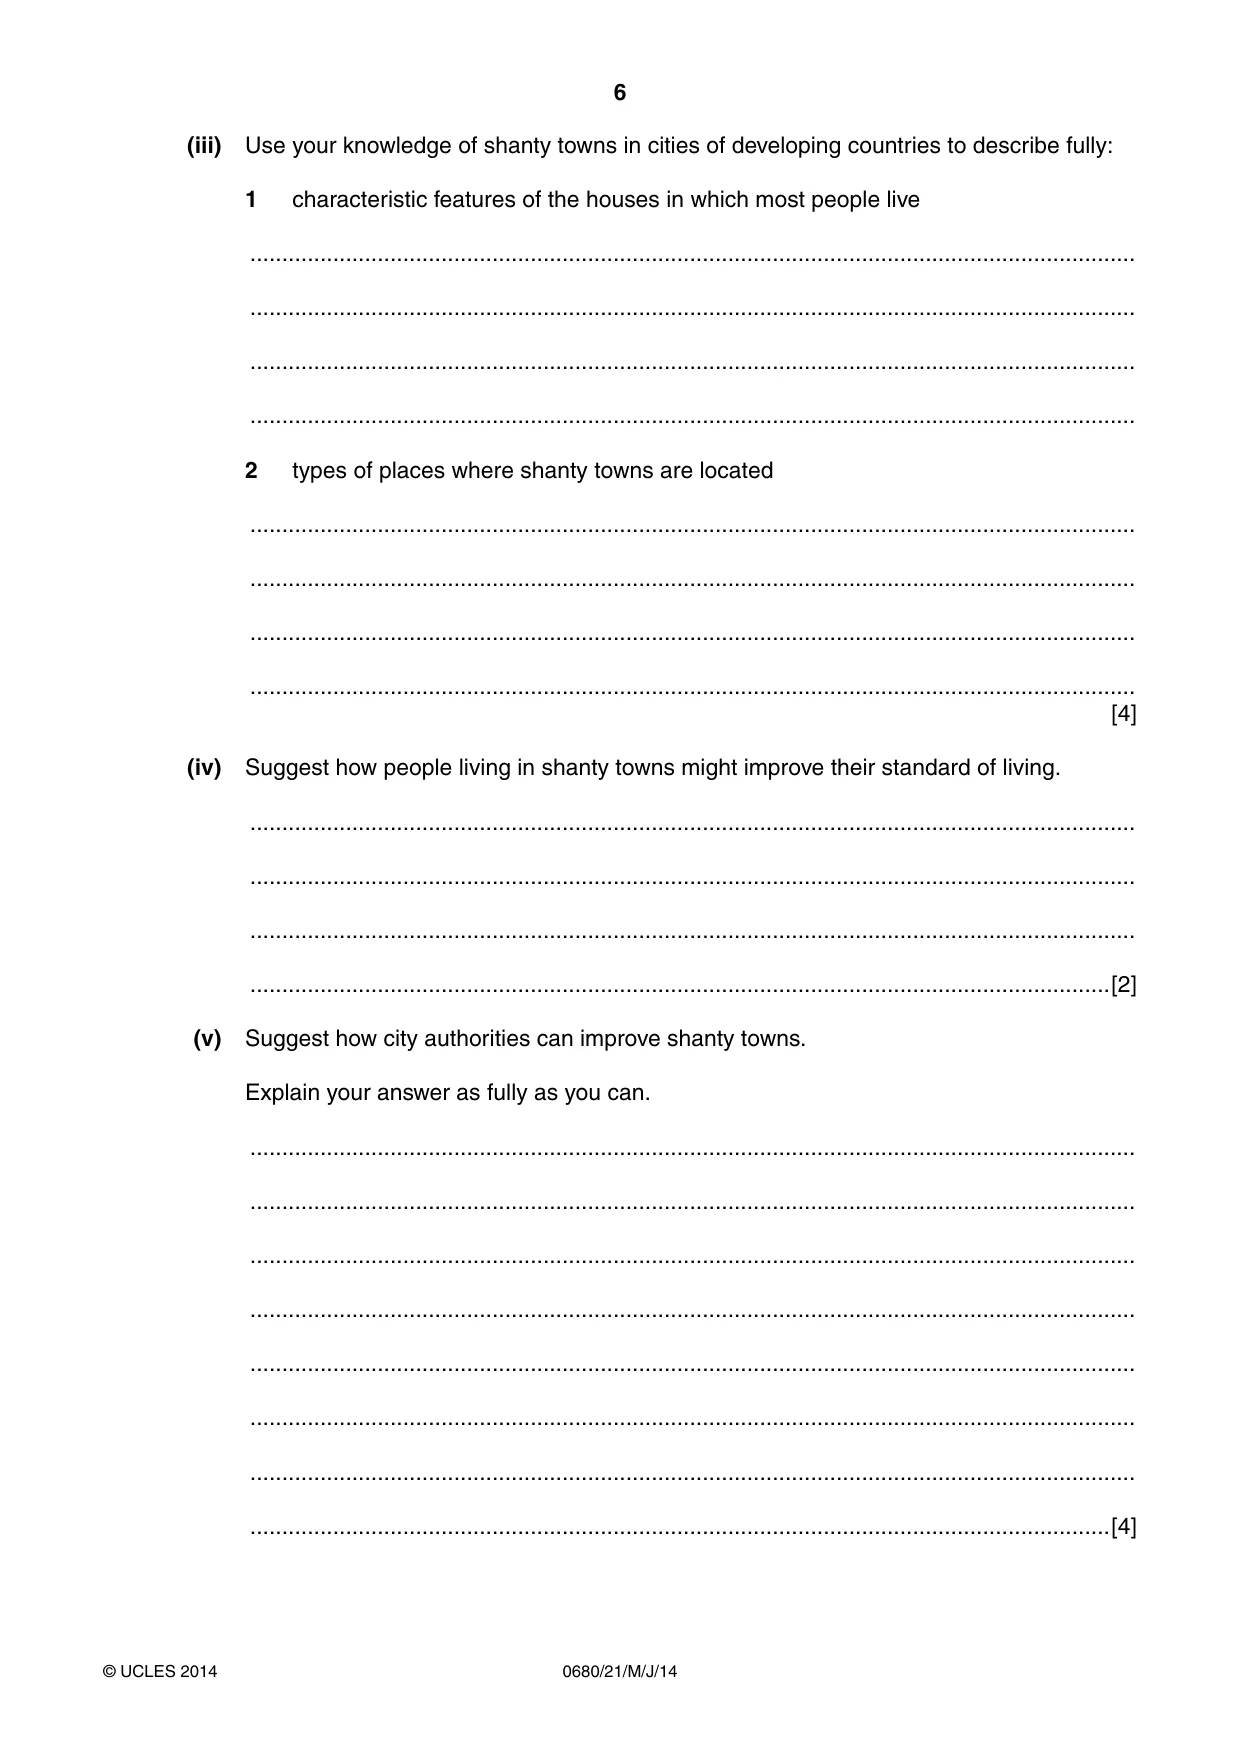
6 0680/21/M/J/14 © UCLES 2014 (iii) Use your knowledge of shanty towns in cities of developing countries to describe fully: 1 characteristic features of the houses in which most people live … … … … 2 types of places where shanty towns are located … … … … [4] (iv) Suggest how people living in shanty towns might improve their standard of living. … … … …[2] (v) Suggest how city authorities can improve shanty towns. Explain your answer as fully as you can. … … … … … … … …[4]
Question paper, page 7
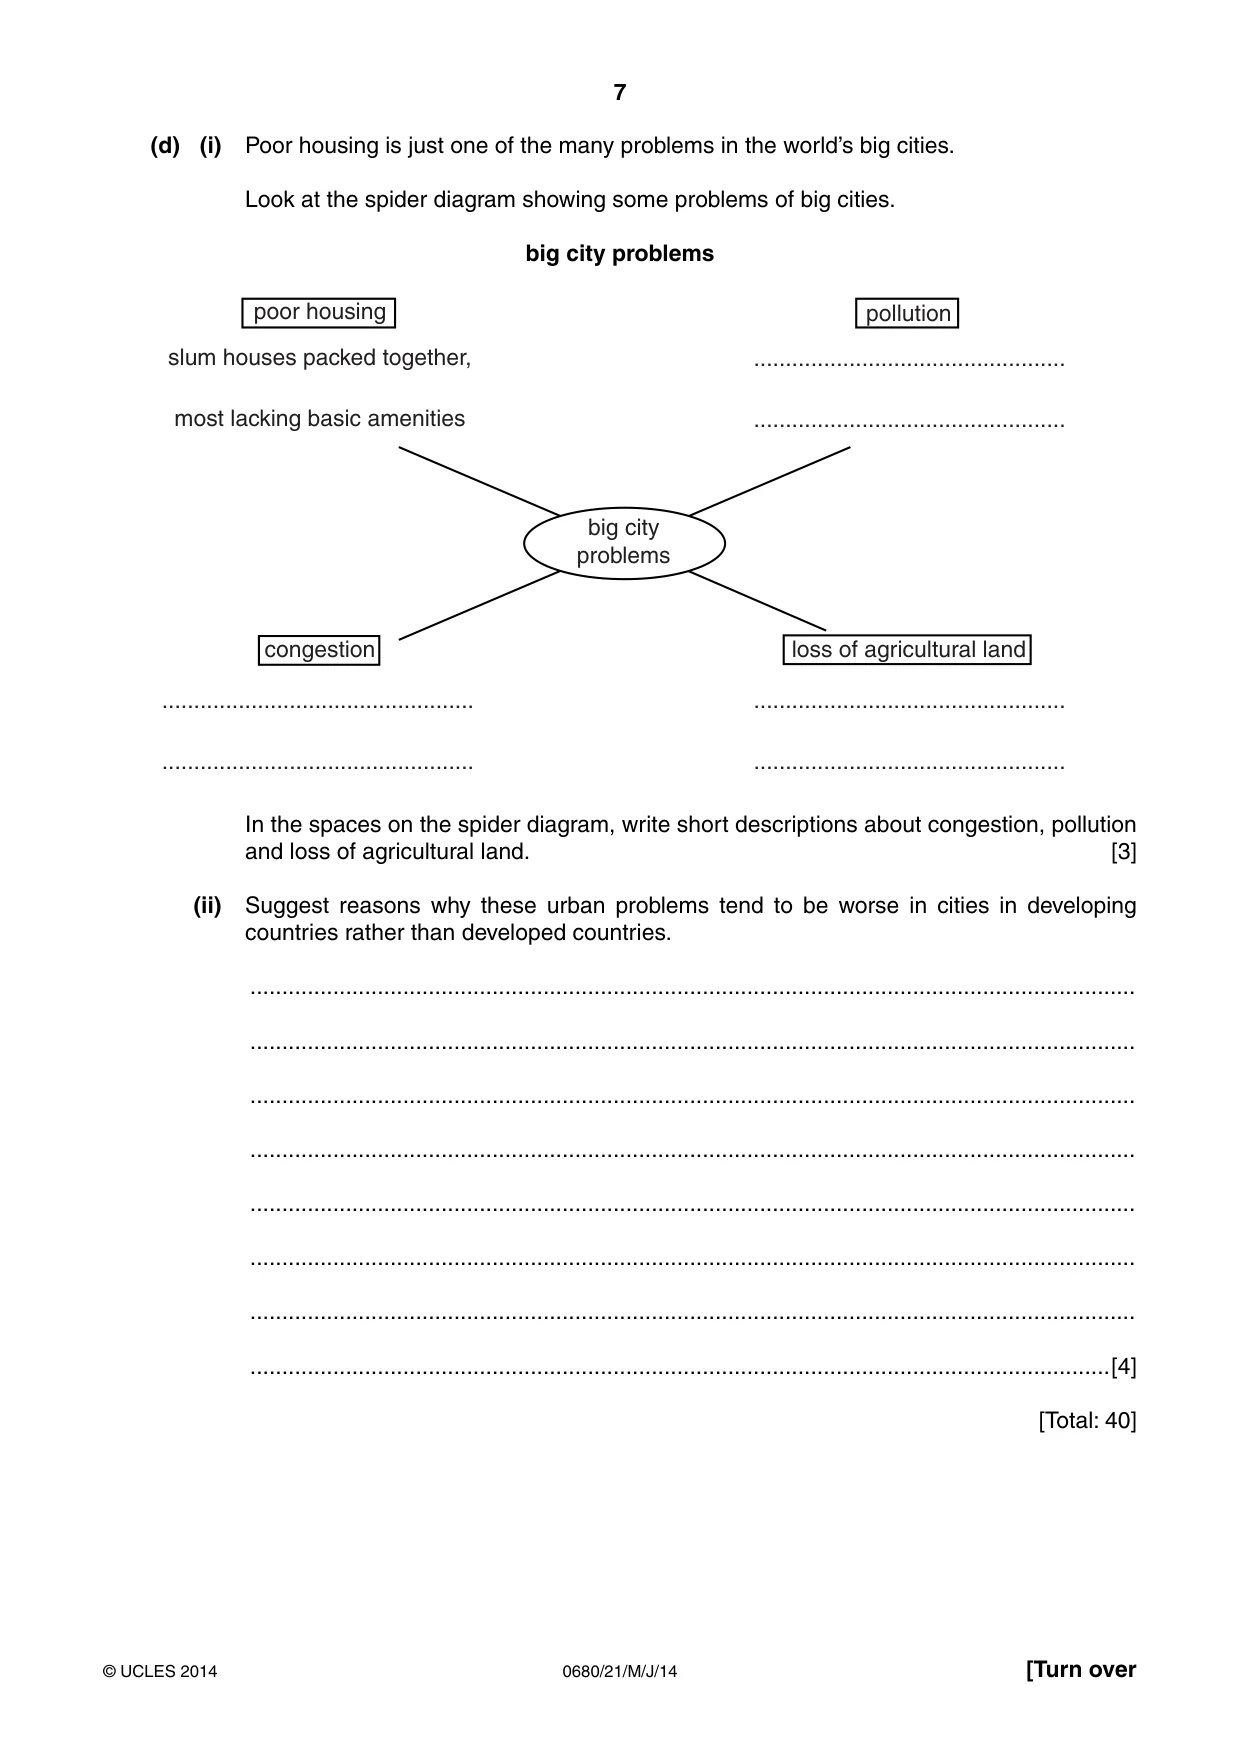
7 0680/21/M/J/14 © UCLES 2014 [Turn over (d) (i) Poor housing is just one of the many problems in the world’s big cities. Look at the spider diagram showing some problems of big cities. big city problems big city problems poor housing slum houses packed together, most lacking basic amenities congestion loss of agricultural land pollution … … … … … … In the spaces on the spider diagram, write short descriptions about congestion, pollution and loss of agricultural land. [3] (ii) Suggest reasons why these urban problems tend to be worse in cities in developing countries rather than developed countries. … … … … … … … …[4] [Total: 40]
Question paper, page 8
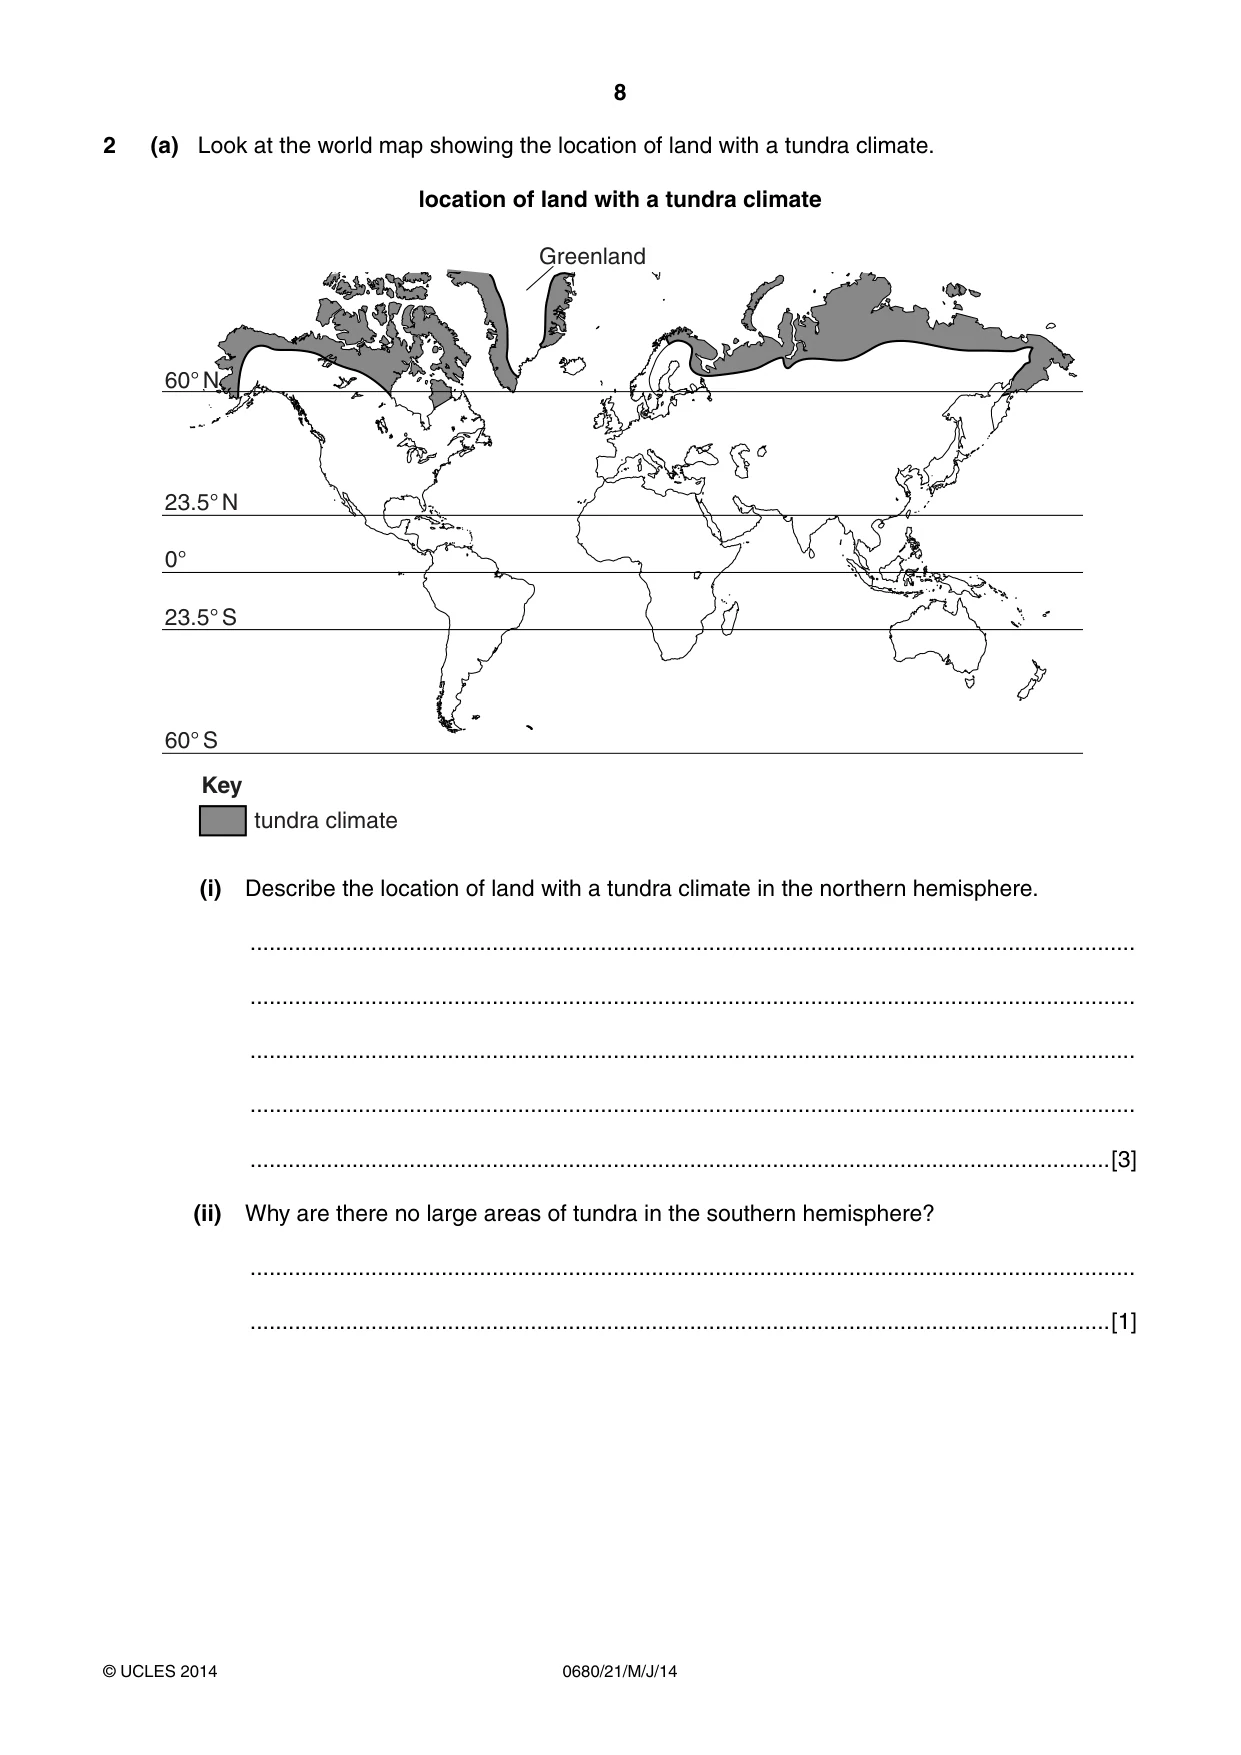
8 0680/21/M/J/14 © UCLES 2014 2 (a) Look at the world map showing the location of land with a tundra climate. location of land with a tundra climate 0° 23.5° N 23.5° S 60° N 60° S tundra climate Greenland Key (i) Describe the location of land with a tundra climate in the northern hemisphere. … … … … …[3] (ii) Why are there no large areas of tundra in the southern hemisphere? … …[1]
Question paper, page 9
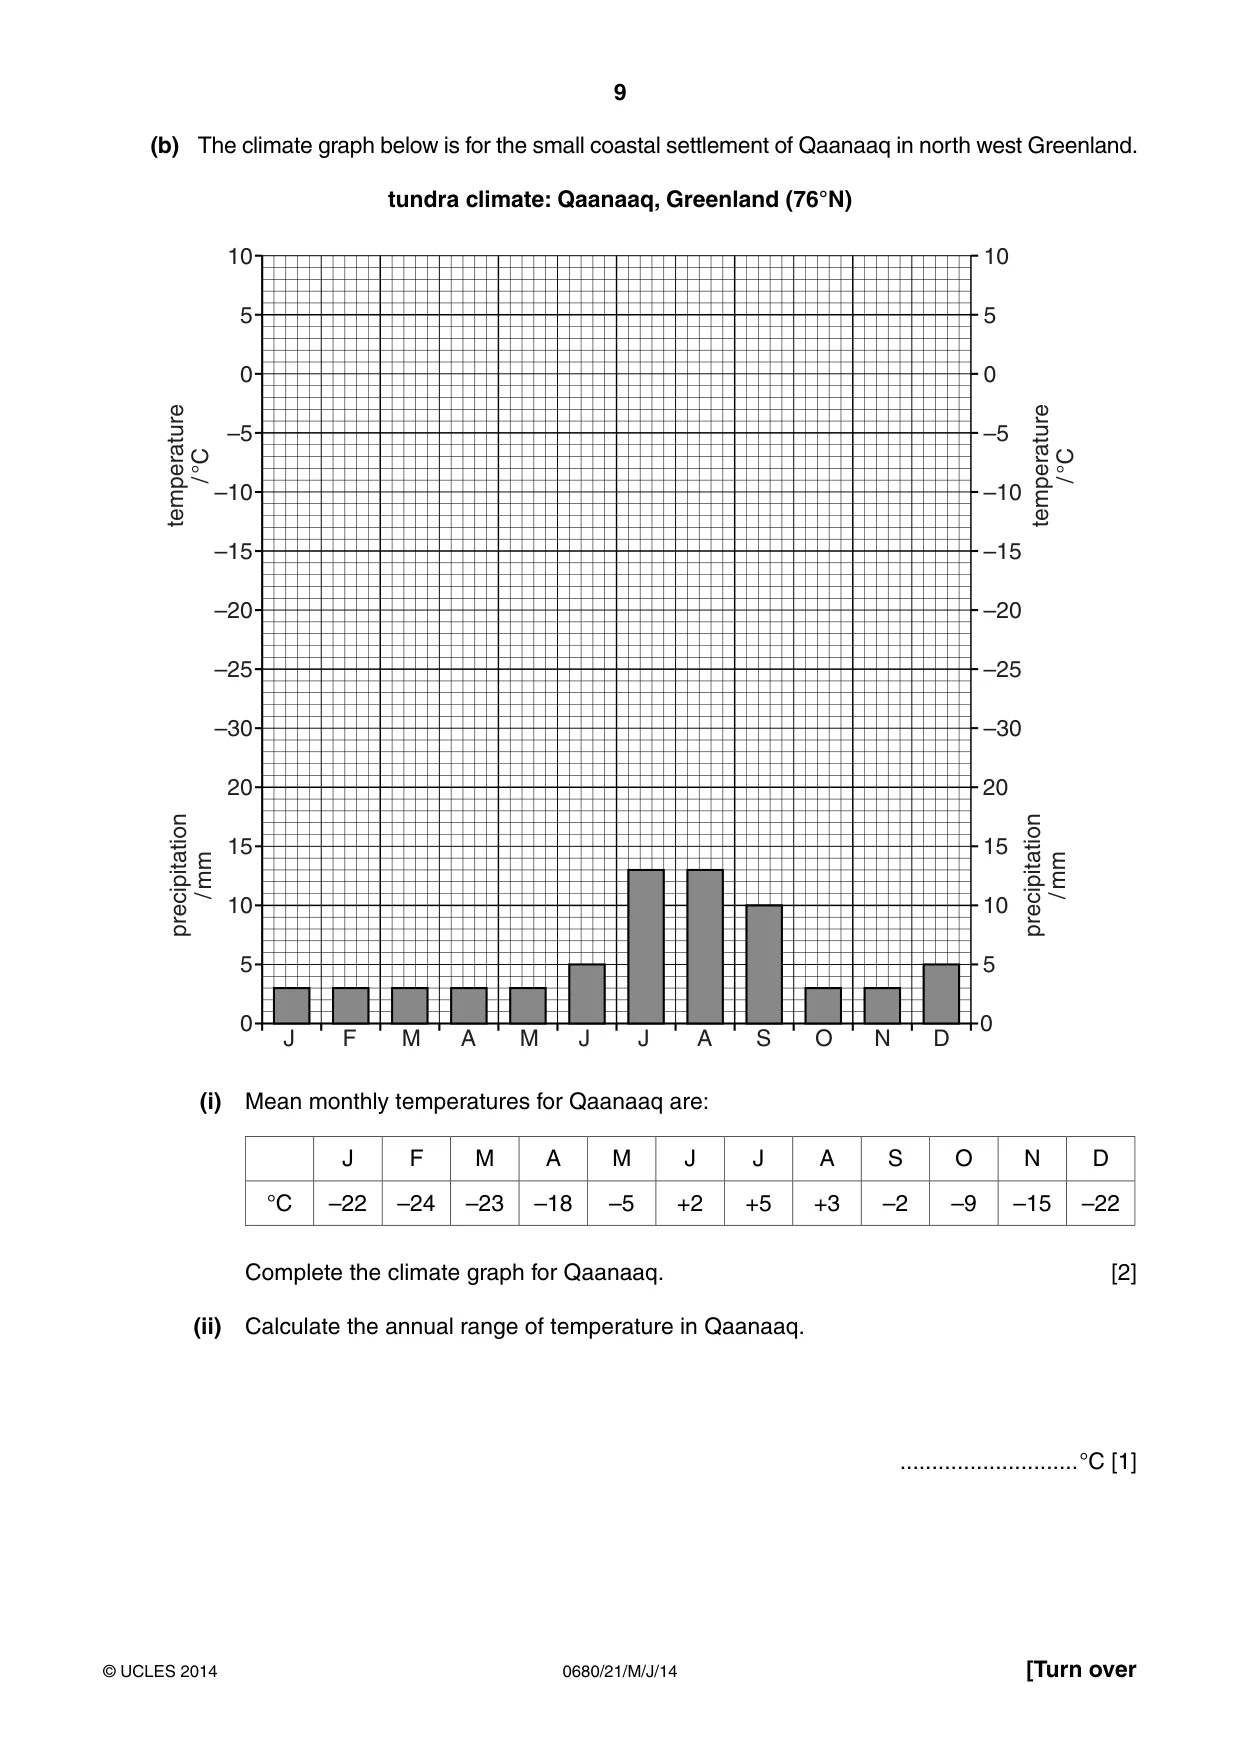
9 0680/21/M/J/14 © UCLES 2014 [Turn over (b) The climate graph below is for the small coastal settlement of Qaanaaq in north west Greenland. tundra climate: Qaanaaq, Greenland (76°N) J F M A M J J A S O N D 0 5 10 15 20 precipitation / mm temperature / °C precipitation / mm temperature / °C 5 10 –30 –25 –20 –15 –10 –5 0 5 10 –30 –25 –20 –15 –10 –5 0 5 10 15 20 0 (i) Mean monthly temperatures for Qaanaaq are: J F M A M J J A S O N D °C –22 –24 –23 –18 –5 +2 +5 +3 –2 –9 –15 –22 Complete the climate graph for Qaanaaq. [2] (ii) Calculate the annual range of temperature in Qaanaaq. …°C [1]
Question paper, page 10
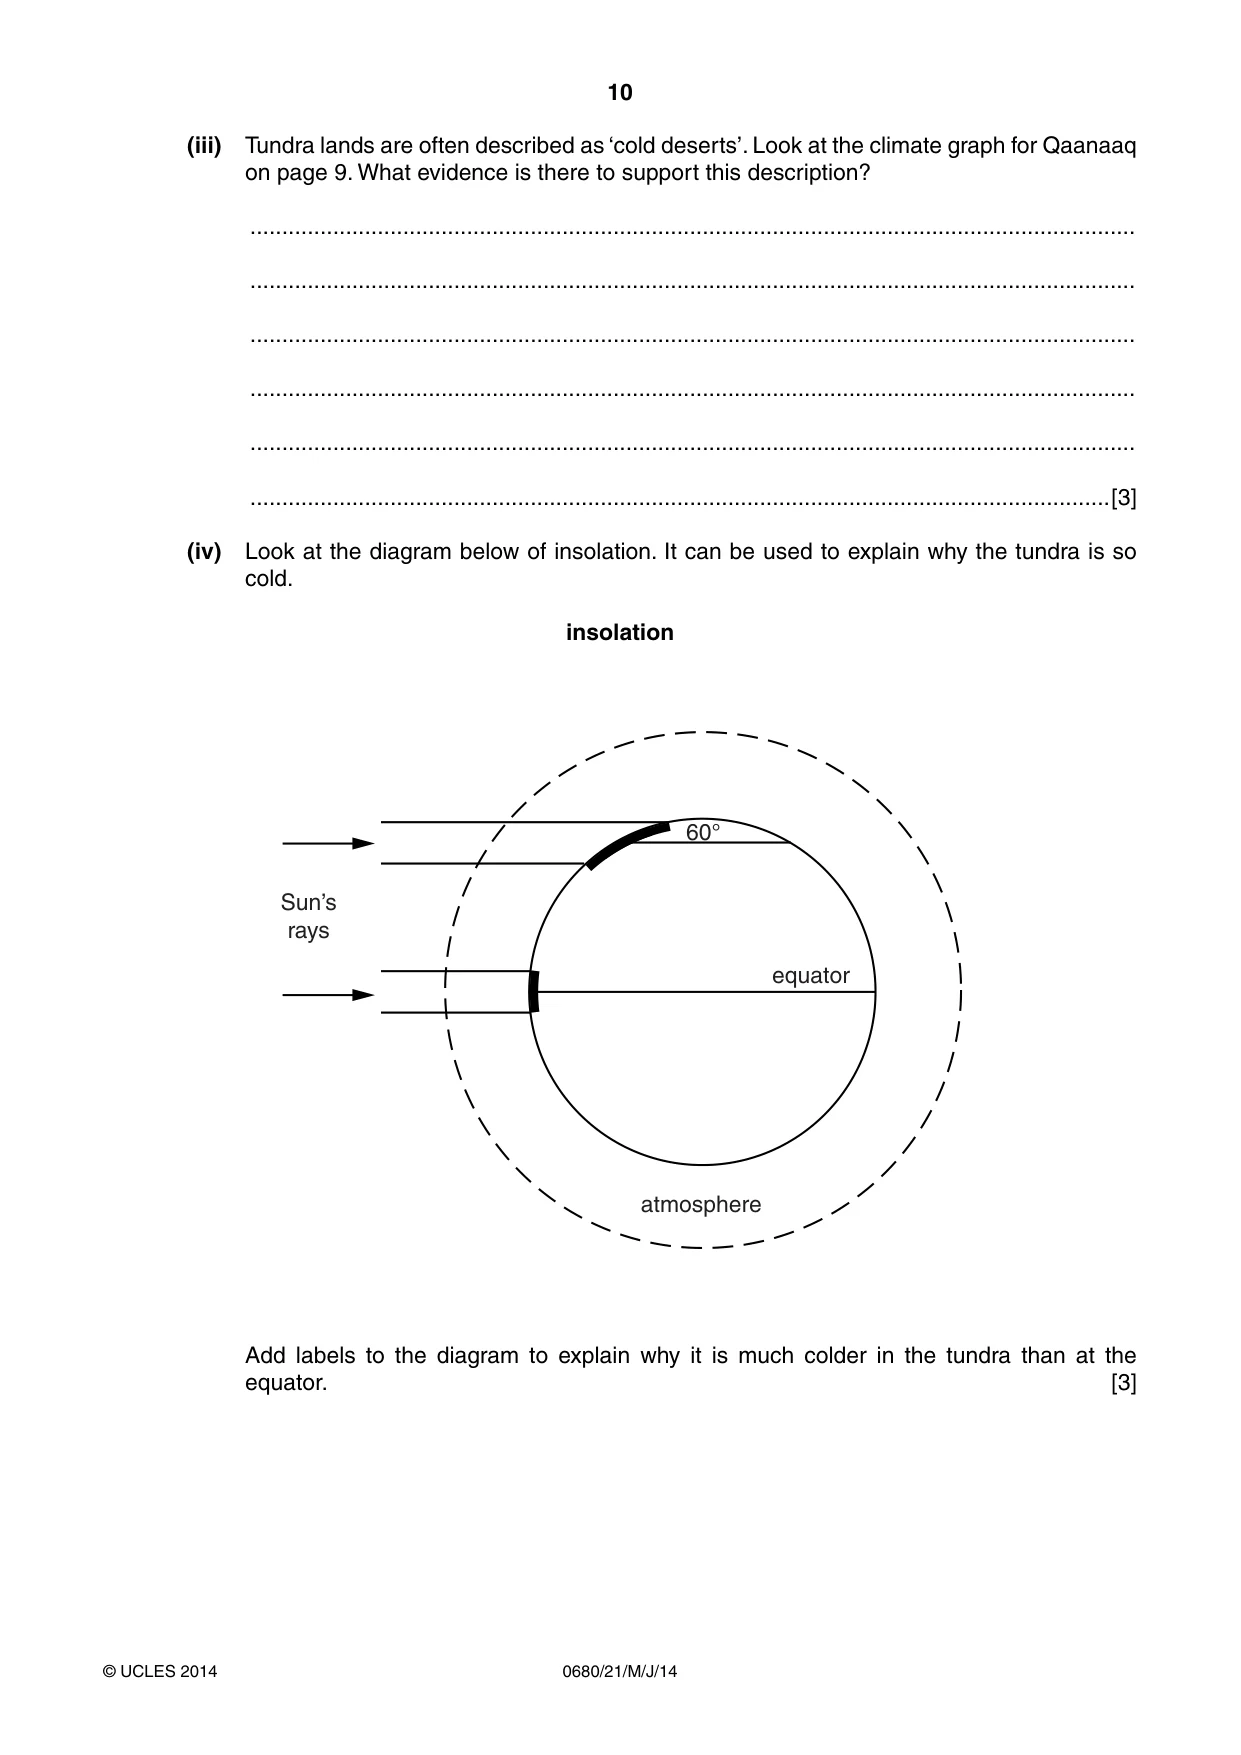
10 0680/21/M/J/14 © UCLES 2014 (iii) Tundra lands are often described as ‘cold deserts’. Look at the climate graph for Qaanaaq on page 9. What evidence is there to support this description? … … … … … …[3] (iv) Look at the diagram below of insolation. It can be used to explain why the tundra is so cold. insolation equator atmosphere 60° Sun’s rays Add labels to the diagram to explain why it is much colder in the tundra than at the equator. [3]
Question paper, page 11
11 0680/21/M/J/14 © UCLES 2014 [Turn over (c) Look at the Insert photograph taken in summer near the coast in western Greenland. (i) Describe what the photograph shows about tundra vegetation and its distribution in this area. … … … … … …[3] (ii) In western Greenland, the traditional way to make a living is from the sea, by fishing, hunting seals and whaling. Look at both the climate data on page 9 and the Insert photograph. Explain why it is not possible to make a living from farming the land in western Greenland. … … … … … …[3]
Question paper, page 12
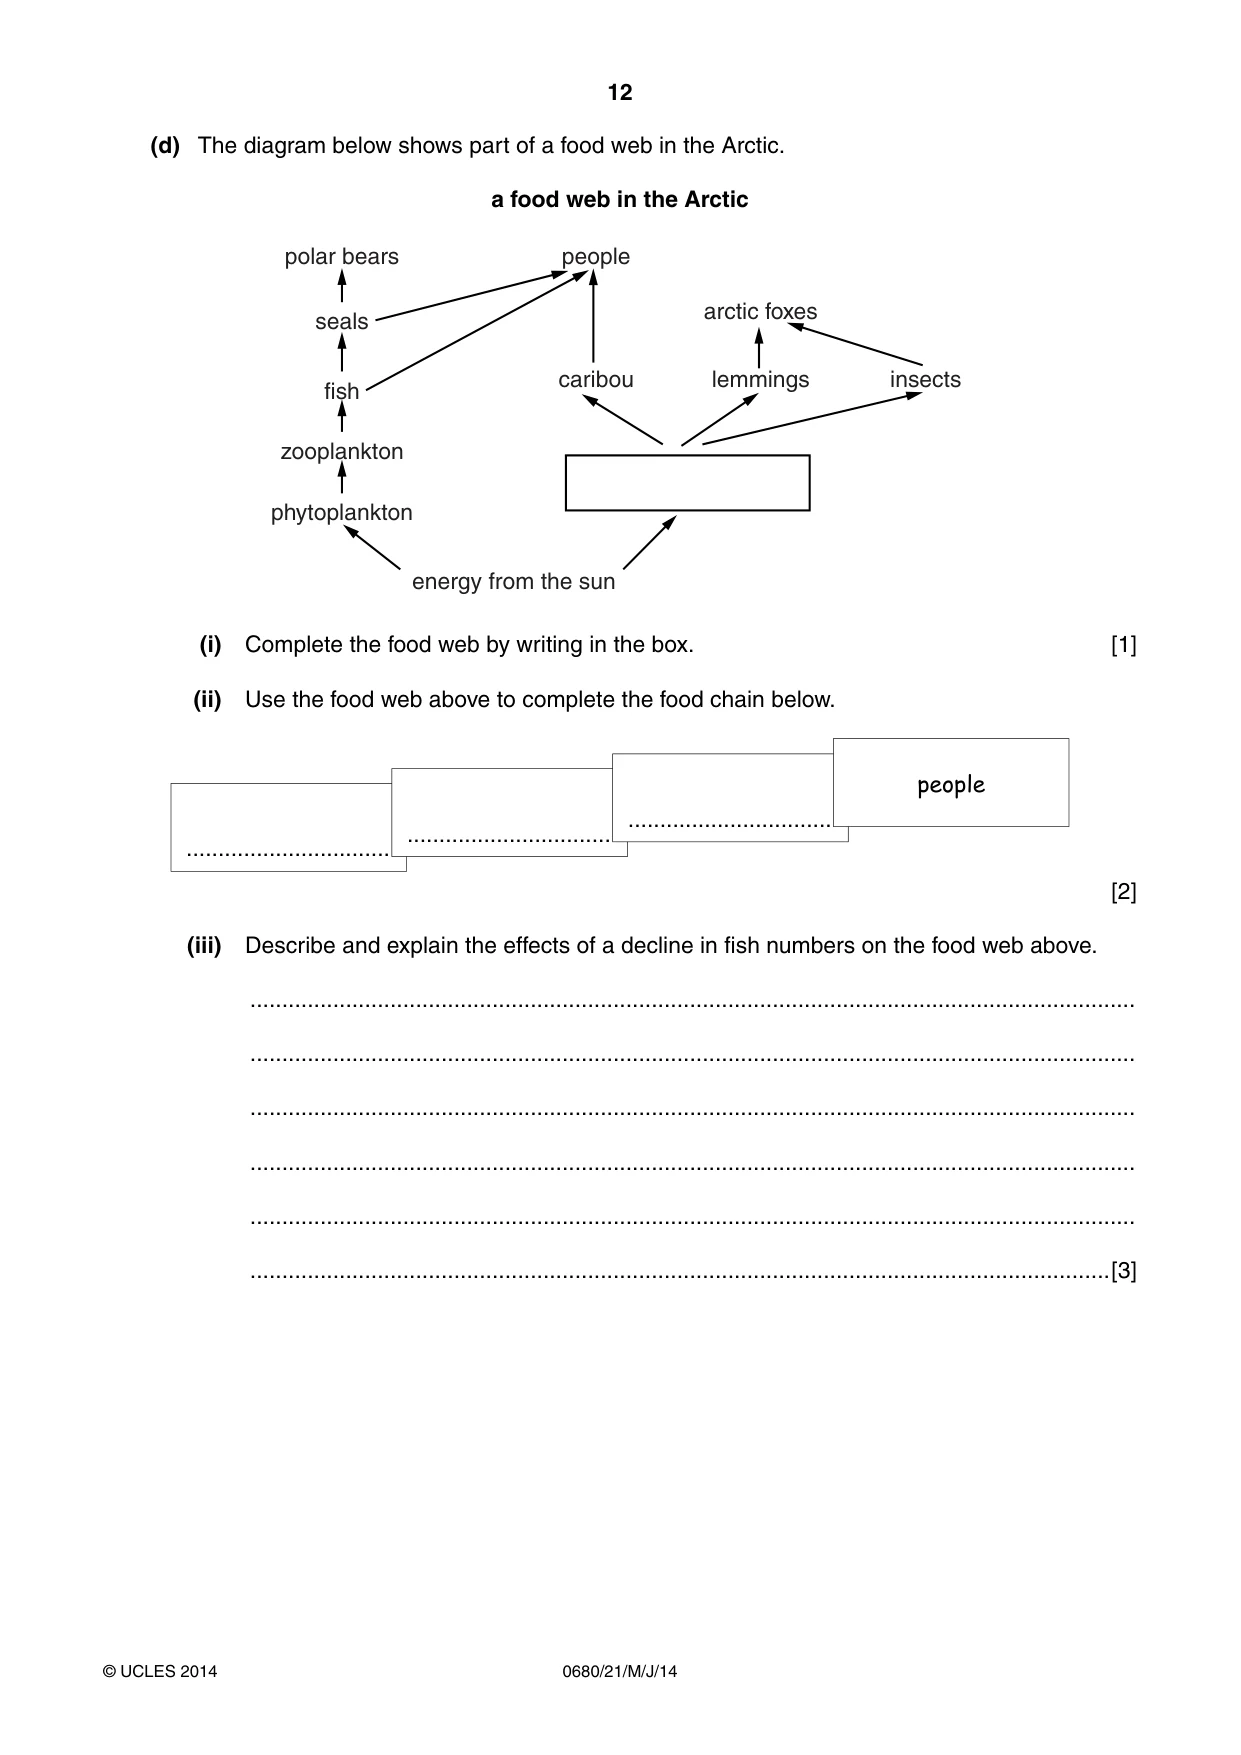
12 0680/21/M/J/14 © UCLES 2014 (d) The diagram below shows part of a food web in the Arctic. a food web in the Arctic polar bears seals people caribou lemmings insects arctic foxes fish zooplankton phytoplankton energy from the sun (i) Complete the food web by writing in the box. [1] (ii) Use the food web above to complete the food chain below. … … … people [2] (iii) Describe and explain the effects of a decline in fish numbers on the food web above. … … … … … …[3]
Question paper, page 13
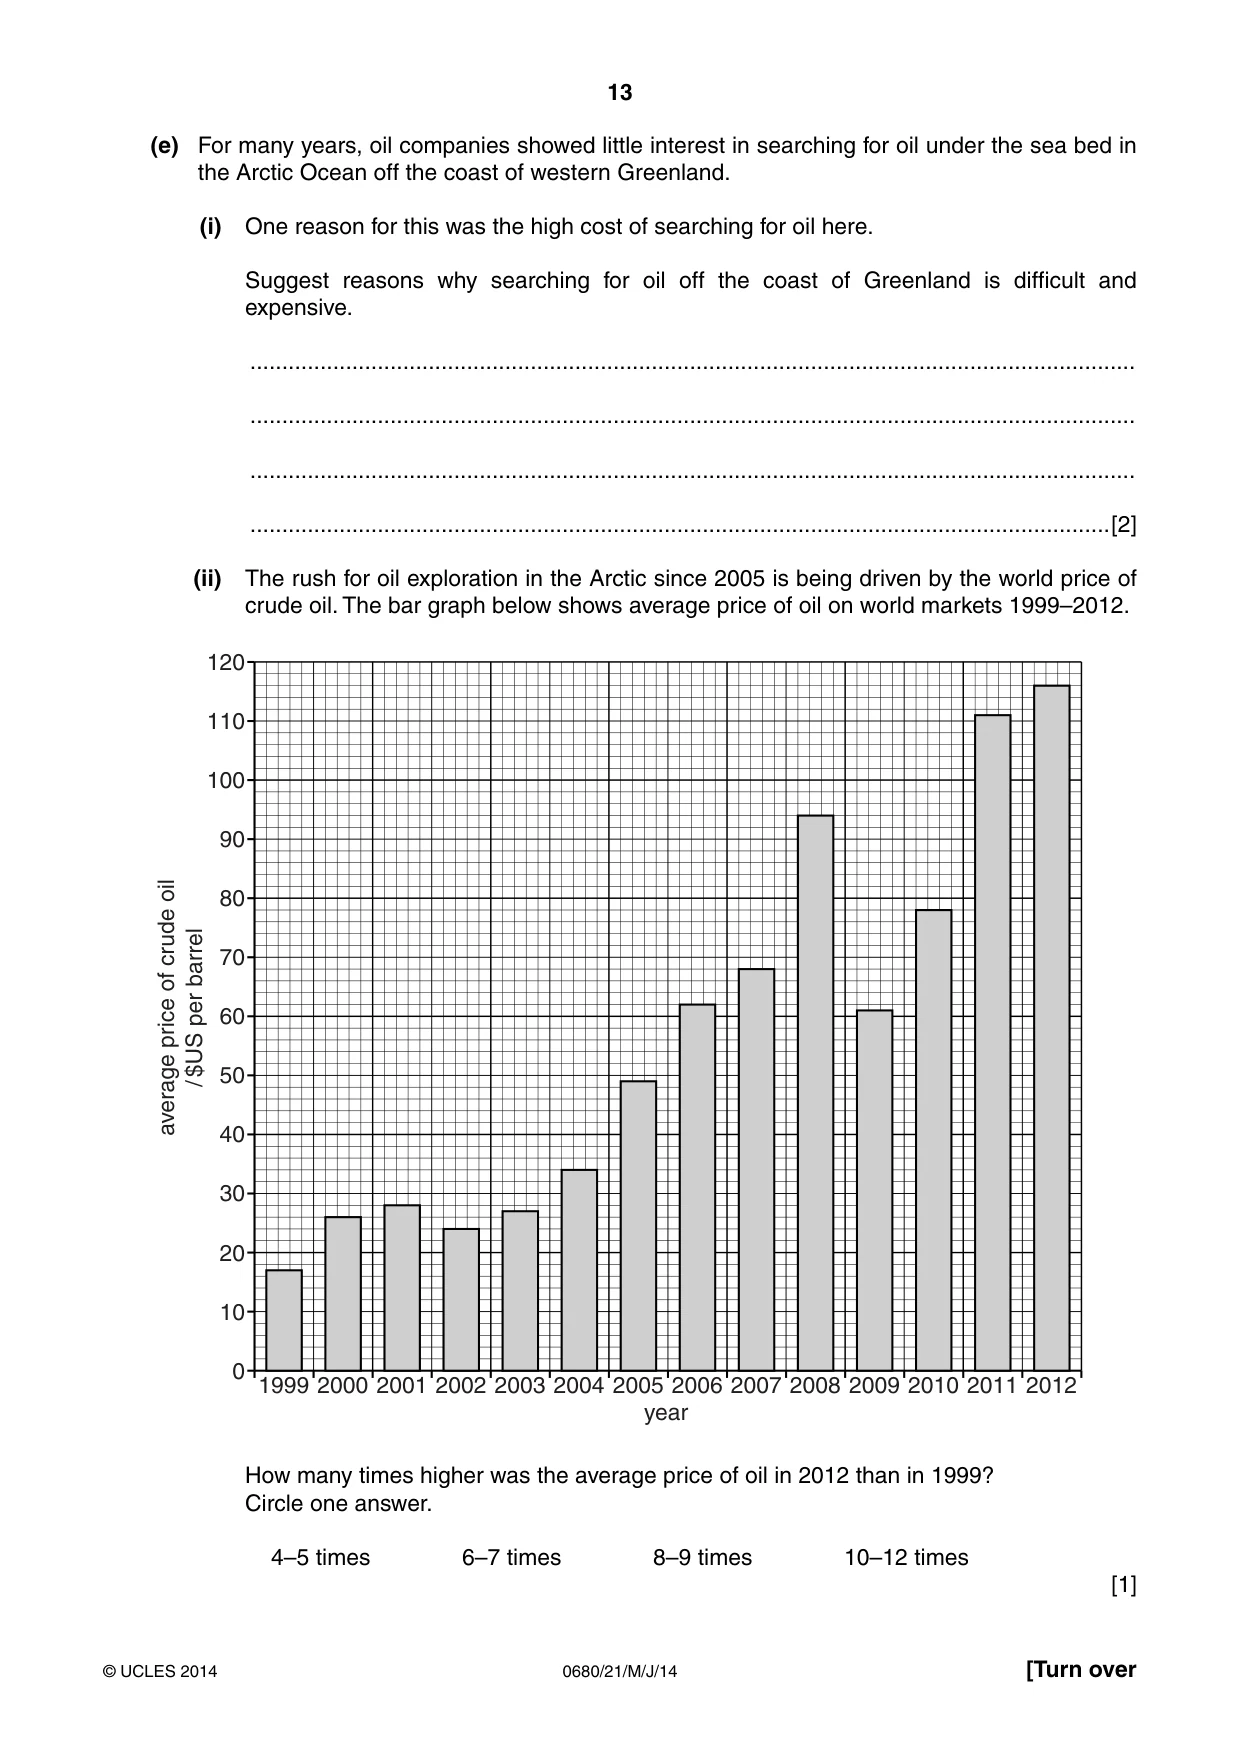
13 0680/21/M/J/14 © UCLES 2014 [Turn over (e) For many years, oil companies showed little interest in searching for oil under the sea bed in the Arctic Ocean off the coast of western Greenland. (i) One reason for this was the high cost of searching for oil here. Suggest reasons why searching for oil off the coast of Greenland is difficult and expensive. … … … …[2] (ii) The rush for oil exploration in the Arctic since 2005 is being driven by the world price of crude oil. The bar graph below shows average price of oil on world markets 1999–2012. 1999 2000 2001 2002 average price of crude oil / $US per barrel 2003 2004 2005 year 2006 2007 2008 2009 2010 2011 2012 0 10 90 100 20 30 40 50 60 70 80 110 120 How many times higher was the average price of oil in 2012 than in 1999? Circle one answer. 4–5 times 6–7 times 8–9 times 10–12 times [1]
Question paper, page 14
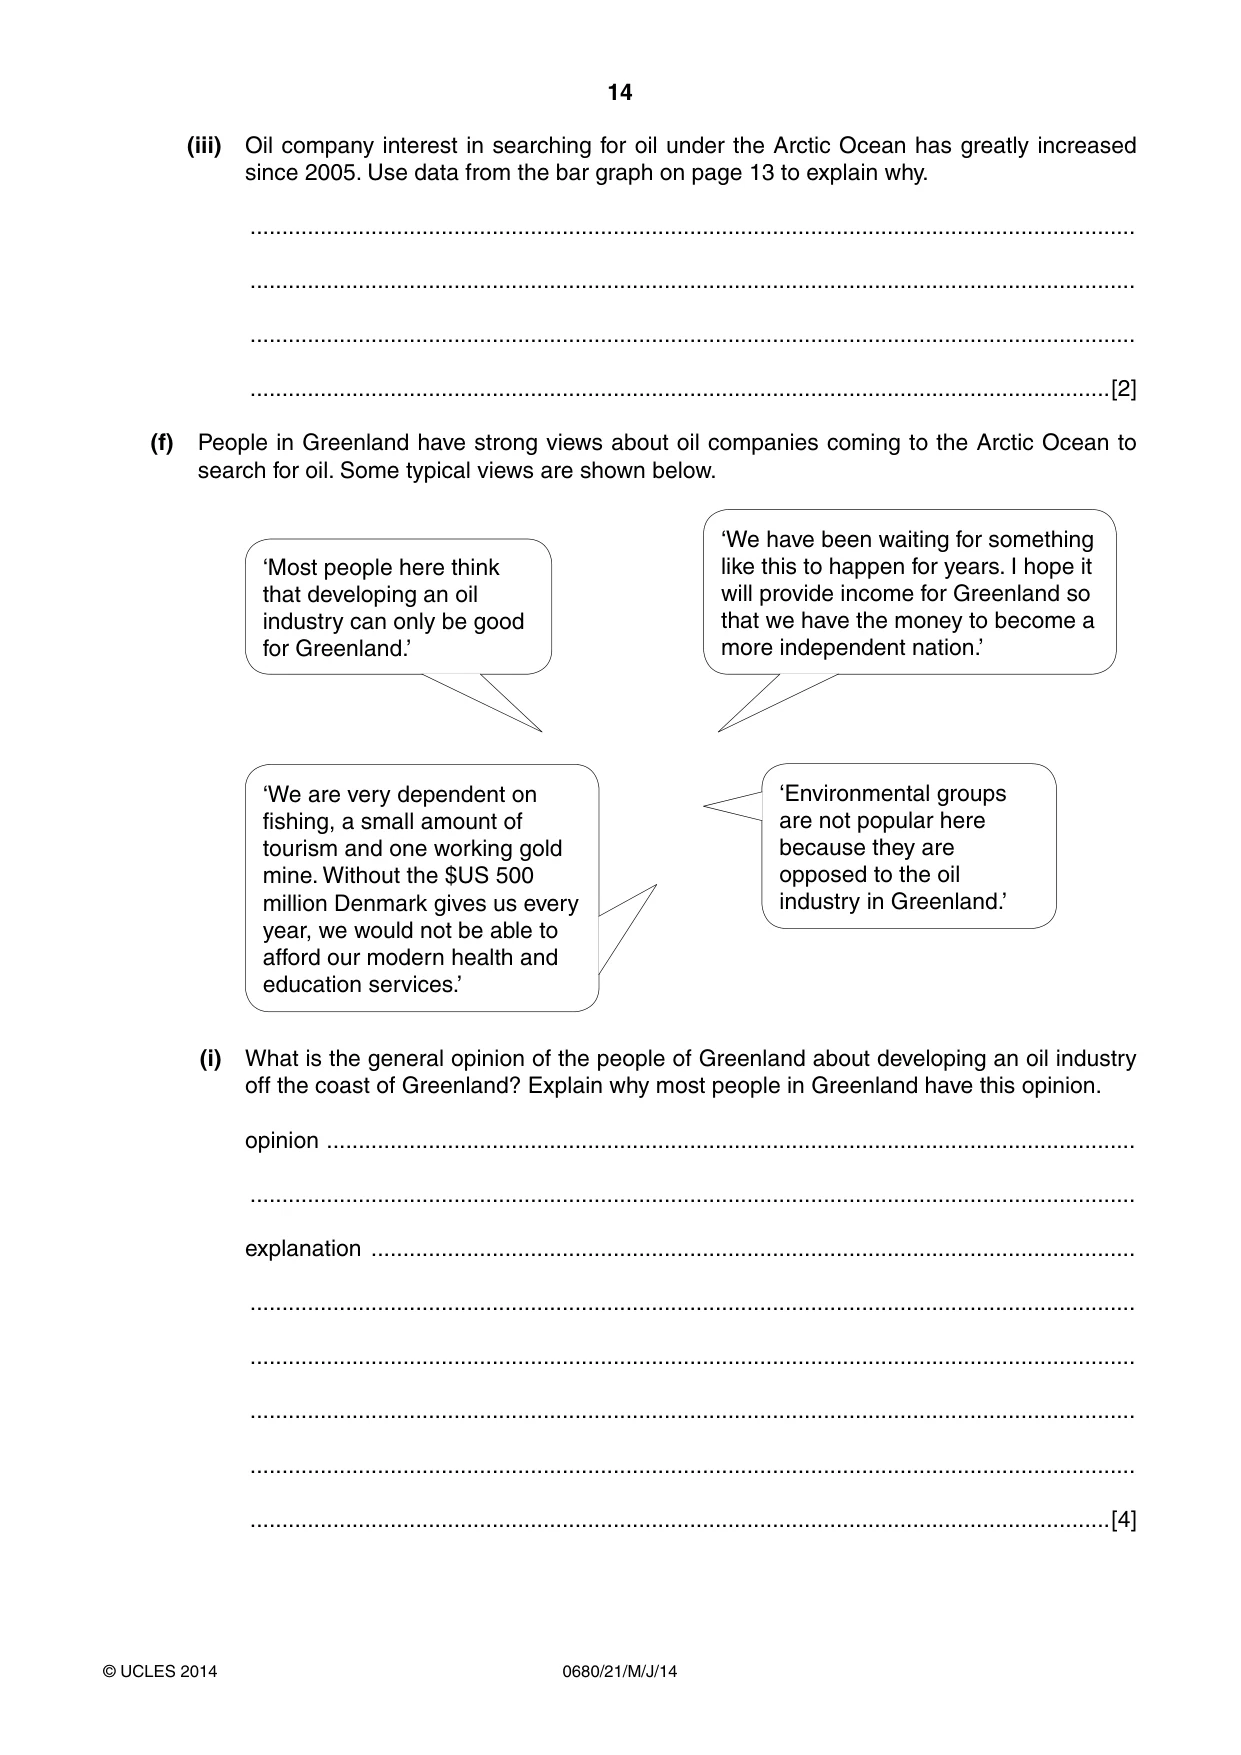
14 0680/21/M/J/14 © UCLES 2014 (iii) Oil company interest in searching for oil under the Arctic Ocean has greatly increased since 2005. Use data from the bar graph on page 13 to explain why. … … … …[2] (f) People in Greenland have strong views about oil companies coming to the Arctic Ocean to search for oil. Some typical views are shown below. ‘Most people here think that developing an oil industry can only be good for Greenland.’ ‘We have been waiting for something like this to happen for years. I hope it will provide income for Greenland so that we have the money to become a more independent nation.’ ‘We are very dependent on fishing, a small amount of tourism and one working gold mine. Without the $US 500 million Denmark gives us every year, we would not be able to afford our modern health and education services.’ ‘Environmental groups are not popular here because they are opposed to the oil industry in Greenland.’ (i) What is the general opinion of the people of Greenland about developing an oil industry off the coast of Greenland? Explain why most people in Greenland have this opinion. opinion … … explanation … … … … … …[4]
Question paper, page 15
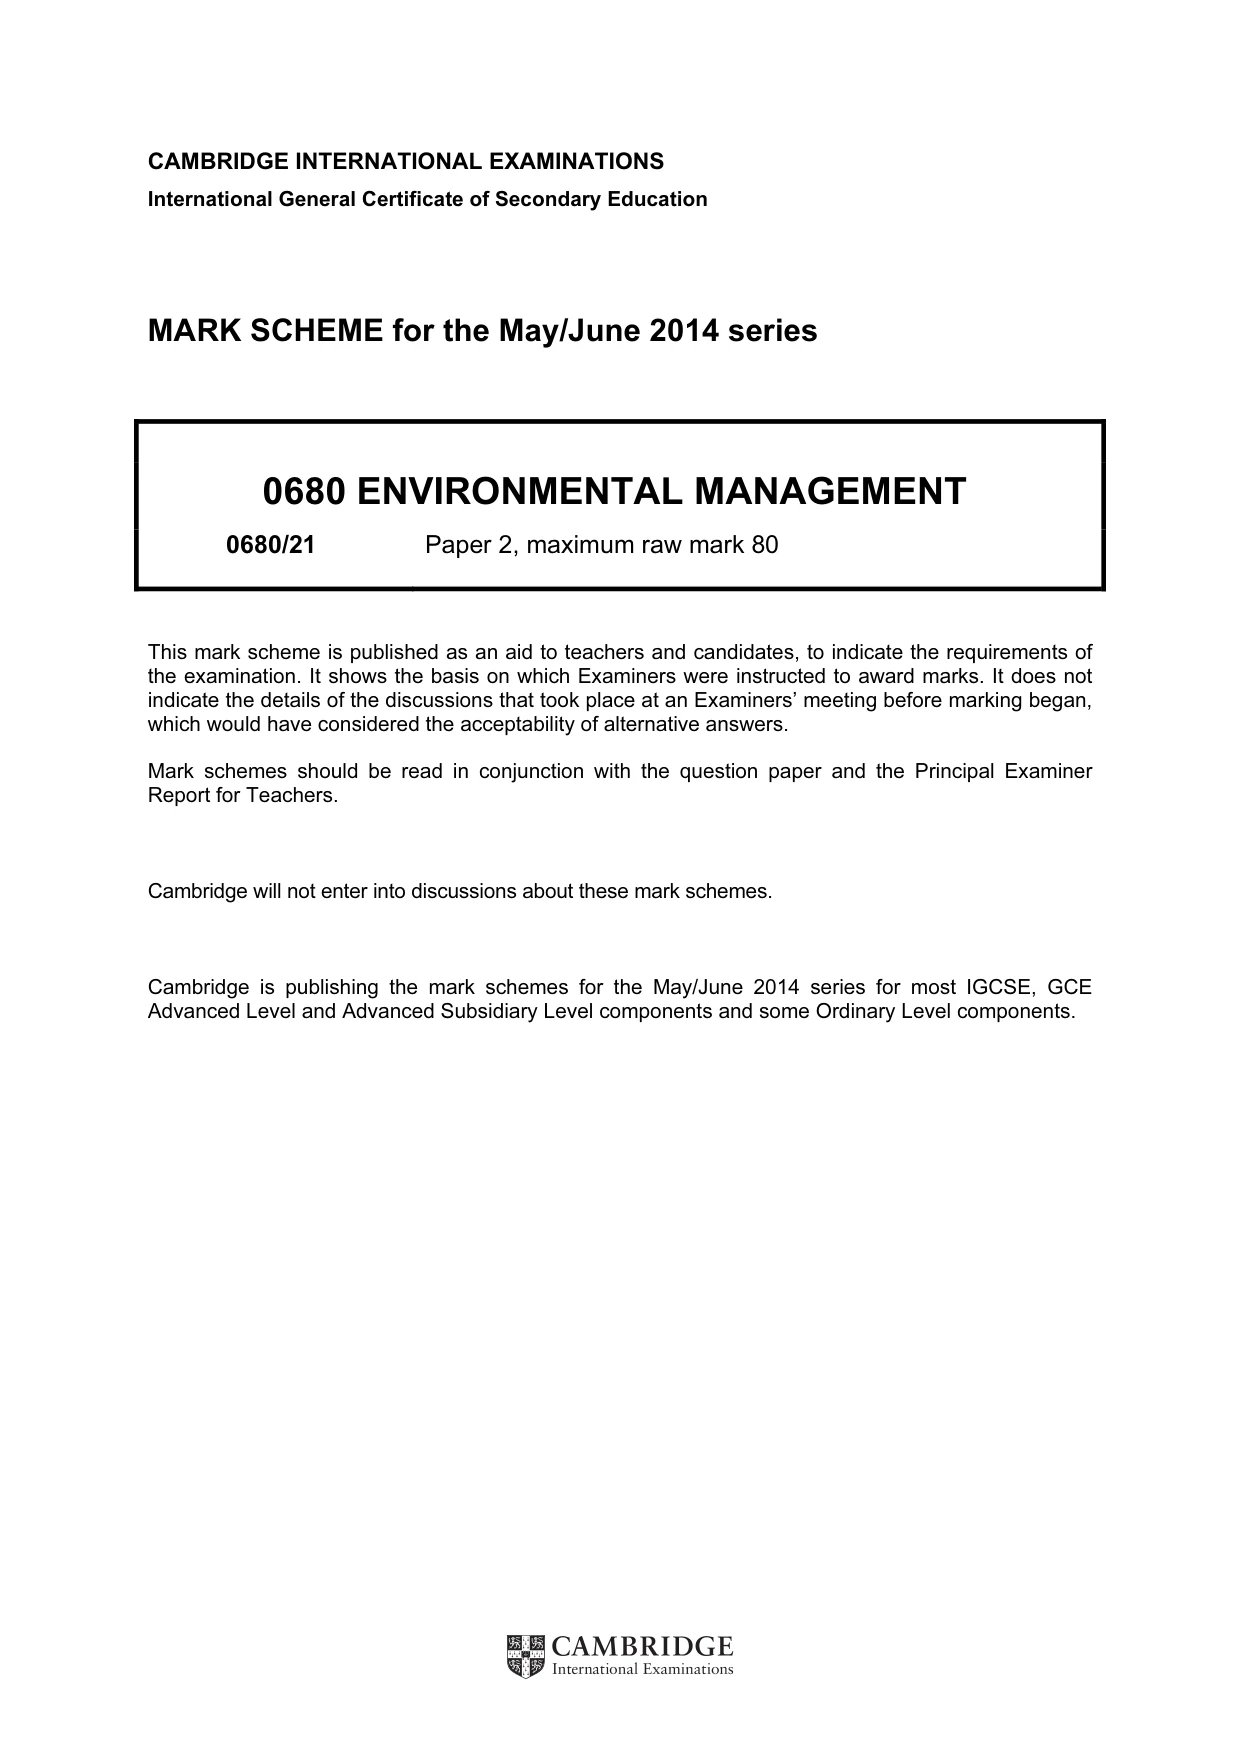
15 0680/21/M/J/14 © UCLES 2014 (ii) Environmental groups are against any development in the Arctic. The Arctic is one of the world’s last remaining wilderness regions, largely untouched by humans. Explain the problems for the environment of developing an oil industry in the Arctic. … … … … …[3] (iii) Should the people in Greenland take more seriously the arguments made by environmental groups? Explain your views. … … … … …[3] [Total: 40]
Question paper, page 16
16 0680/21/M/J/14 © UCLES 2014 Copyright Acknowledgements: Insert John Pallister © UCLES Permission to reproduce items where third-party owned material protected by copyright is included has been sought and cleared where possible. Every reasonable effort has been made by the publisher (UCLES) to trace copyright holders, but if any items requiring clearance have unwittingly been included, the publisher will be pleased to make amends at the earliest possible opportunity. Cambridge International Examinations is part of the Cambridge Assessment Group. Cambridge Assessment is the brand name of University of Cambridge Local Examinations Syndicate (UCLES), which is itself a department of the University of Cambridge. BLANK PAGE
Mark scheme, page 1
CAMBRIDGE INTERNATIONAL EXAMINATIONS International General Certificate of Secondary Education MARK SCHEME for the May/June 2014 series 0680 ENVIRONMENTAL MANAGEMENT 0680/21 Paper 2, maximum raw mark 80 This mark scheme is published as an aid to teachers and candidates, to indicate the requirements of the examination. It shows the basis on which Examiners were instructed to award marks. It does not indicate the details of the discussions that took place at an Examiners’ meeting before marking began, which would have considered the acceptability of alternative answers. Mark schemes should be read in conjunction with the question paper and the Principal Examiner Report for Teachers. Cambridge will not enter into discussions about these mark schemes. Cambridge is publishing the mark schemes for the May/June 2014 series for most IGCSE, GCE Advanced Level and Advanced Subsidiary Level components and some Ordinary Level components.
Mark scheme, page 2
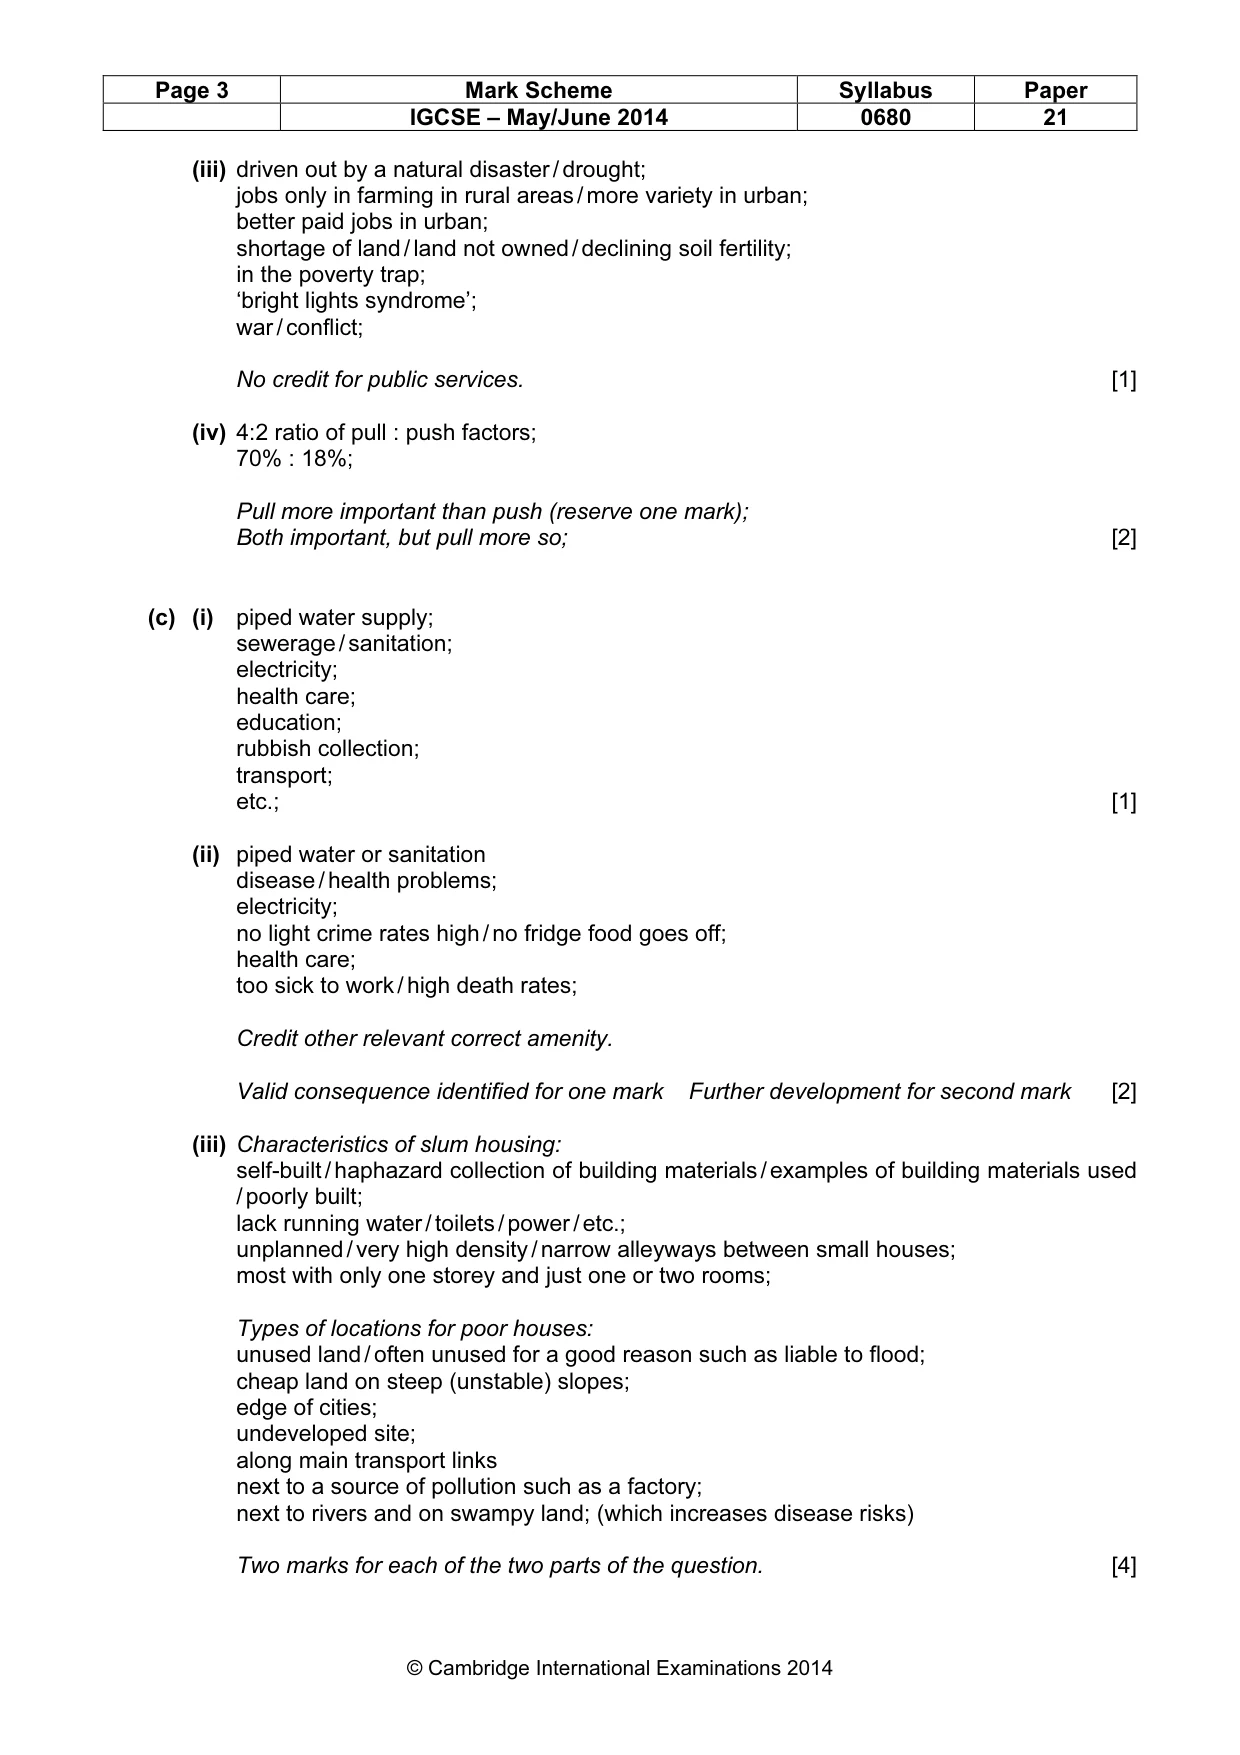
Page 2 Mark Scheme Syllabus Paper IGCSE – May/June 2014 0680 21 © Cambridge International Examinations 2014 1 (a) (i) Table infilling from left to right: 2 : 2 : 10 : 0 : 2 : 4 : 20 : 16 : 4 or 1 : 4 or 1 : 2 : 11 : 0 : 2 : 4 : 17 : 3 All correct for three marks or all six correct continents for two marks, at least three correct for one mark, ratio correct for one mark. [3] (ii) more megacities / great increase in numbers; more further south / in lower latitudes; more in the tropics than in temperate lands; many more / most in Asia; more widespread throughout; Europe / Africa now have mega-cities; none in Australia; [2] (iii) less use / availability of methods of contraception; greater economic need for and value of children; absence of / weak national population policies / government attitude; religious reasons; poor / absence of education especially for women; tradition of large families; large proportion of women are of child-bearing age; all in death rate explained; Remember that the question focus is upon developing countries. Reason for one mark. Further development / elaboration for one mark. [4] (iv) already much urbanisation in developed world countries; less difference in services between rural and urban areas in developed countries; greater poverty and absence of modern facilities in rural areas; natural and human disasters may drive people out such as flood, wars; industrialisation in developing / jobs in urban areas; in developed countries people wish to escape crime / pollution / noise of cities; [2] (b) (i) plots complete and accurate on the divided bar for two marks at least two plotted correctly for one mark labelling for one mark [3] (ii) push factors D E pull factors A B C F All correct for three marks, 4 or 5 correct for two marks, 2 or 3 correct for one mark. [3]
Mark scheme, page 3
Page 3 Mark Scheme Syllabus Paper IGCSE – May/June 2014 0680 21 © Cambridge International Examinations 2014 (iii) driven out by a natural disaster / drought; jobs only in farming in rural areas / more variety in urban; better paid jobs in urban; shortage of land / land not owned / declining soil fertility; in the poverty trap; ‘bright lights syndrome’; war / conflict; No credit for public services. [1] (iv) 4:2 ratio of pull : push factors; 70% : 18%; Pull more important than push (reserve one mark); Both important, but pull more so; [2] (c) (i) piped water supply; sewerage / sanitation; electricity; health care; education; rubbish collection; transport; etc.; [1] (ii) piped water or sanitation disease / health problems; electricity; no light crime rates high / no fridge food goes off; health care; too sick to work / high death rates; Credit other relevant correct amenity. Valid consequence identified for one mark Further development for second mark [2] (iii) Characteristics of slum housing: self-built / haphazard collection of building materials / examples of building materials used / poorly built; lack running water / toilets / power / etc.; unplanned / very high density / narrow alleyways between small houses; most with only one storey and just one or two rooms; Types of locations for poor houses: unused land / often unused for a good reason such as liable to flood; cheap land on steep (unstable) slopes; edge of cities; undeveloped site; along main transport links next to a source of pollution such as a factory; next to rivers and on swampy land; (which increases disease risks) Two marks for each of the two parts of the question. [4]
Mark scheme, page 4
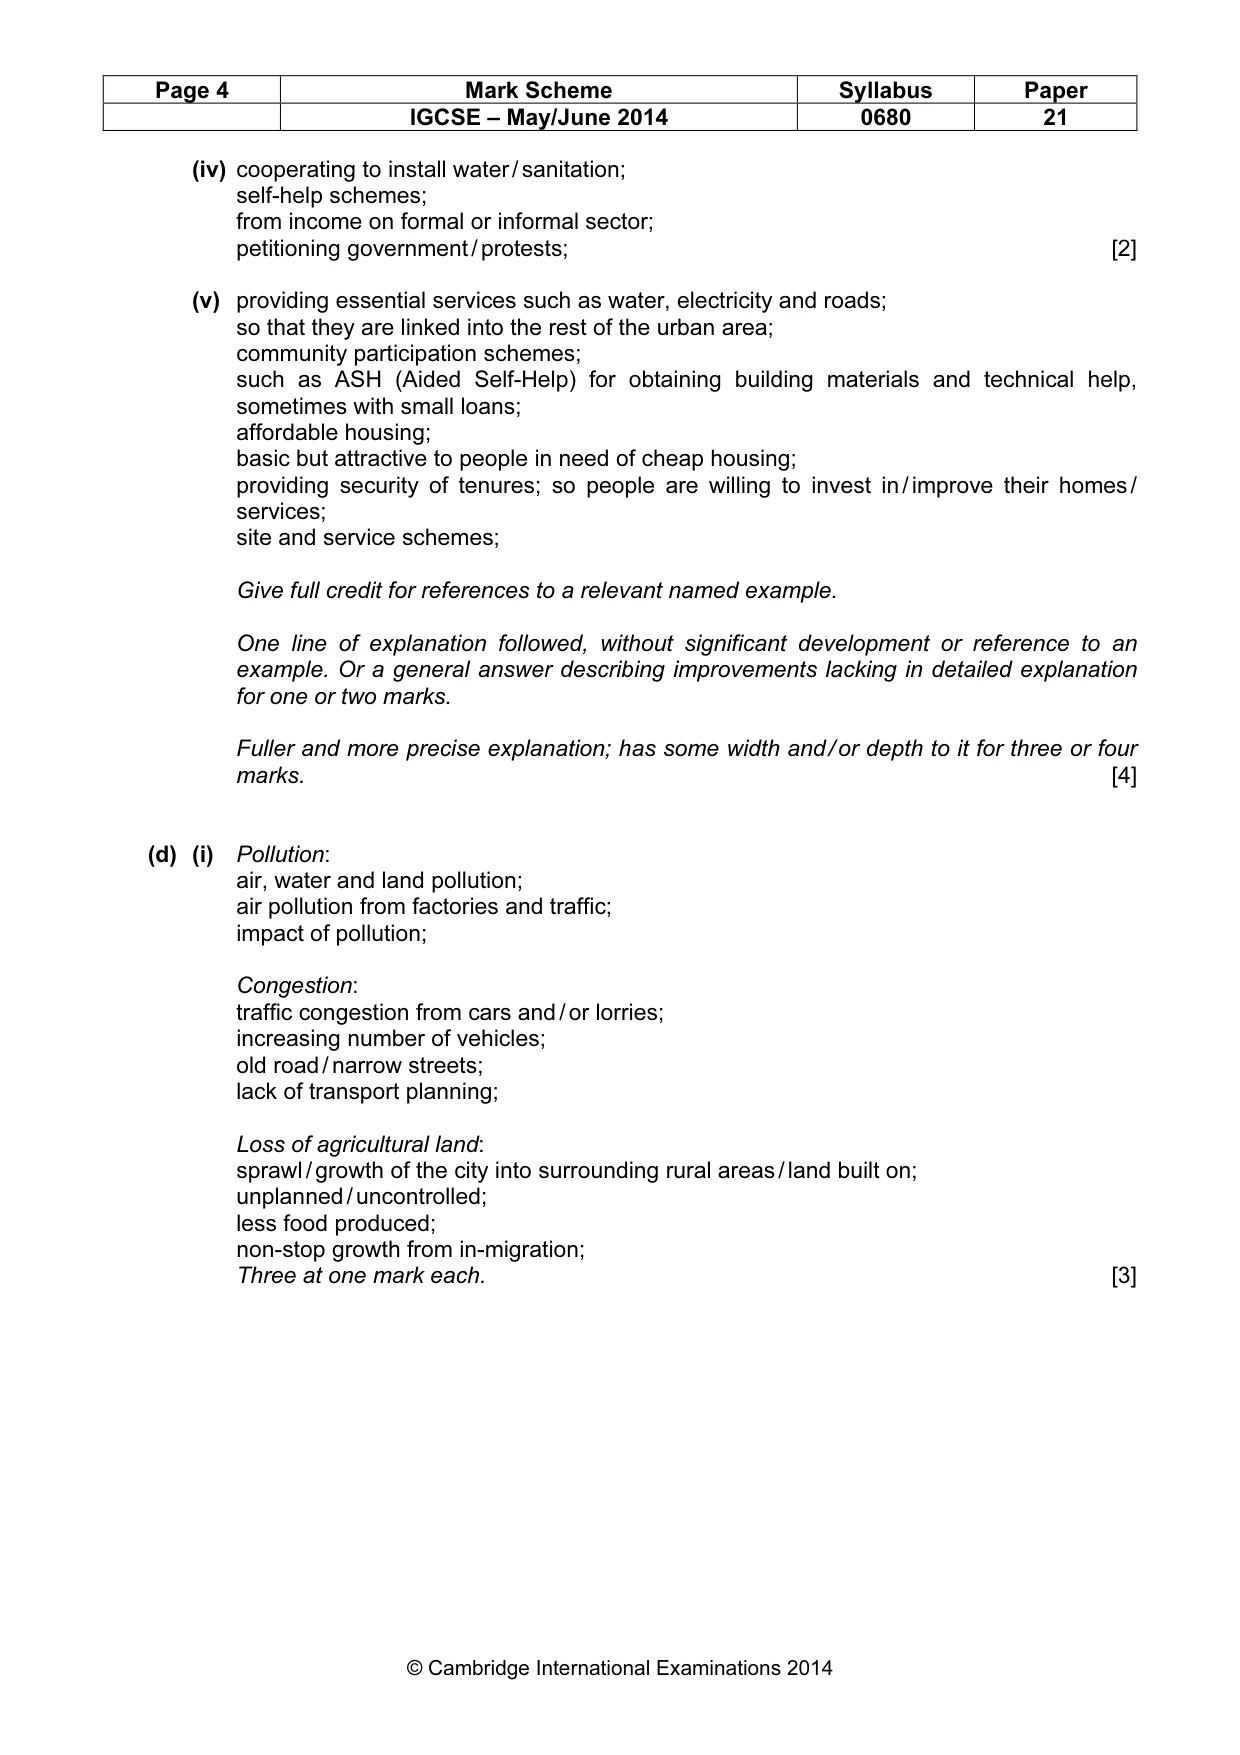
Page 4 Mark Scheme Syllabus Paper IGCSE – May/June 2014 0680 21 © Cambridge International Examinations 2014 (iv) cooperating to install water / sanitation; self-help schemes; from income on formal or informal sector; petitioning government / protests; [2] (v) providing essential services such as water, electricity and roads; so that they are linked into the rest of the urban area; community participation schemes; such as ASH (Aided Self-Help) for obtaining building materials and technical help, sometimes with small loans; affordable housing; basic but attractive to people in need of cheap housing; providing security of tenures; so people are willing to invest in / improve their homes / services; site and service schemes; Give full credit for references to a relevant named example. One line of explanation followed, without significant development or reference to an example. Or a general answer describing improvements lacking in detailed explanation for one or two marks. Fuller and more precise explanation; has some width and / or depth to it for three or four marks. [4] (d) (i) Pollution: air, water and land pollution; air pollution from factories and traffic; impact of pollution; Congestion: traffic congestion from cars and / or lorries; increasing number of vehicles; old road / narrow streets; lack of transport planning; Loss of agricultural land: sprawl / growth of the city into surrounding rural areas / land built on; unplanned / uncontrolled; less food produced; non-stop growth from in-migration; Three at one mark each. [3]
Mark scheme, page 5
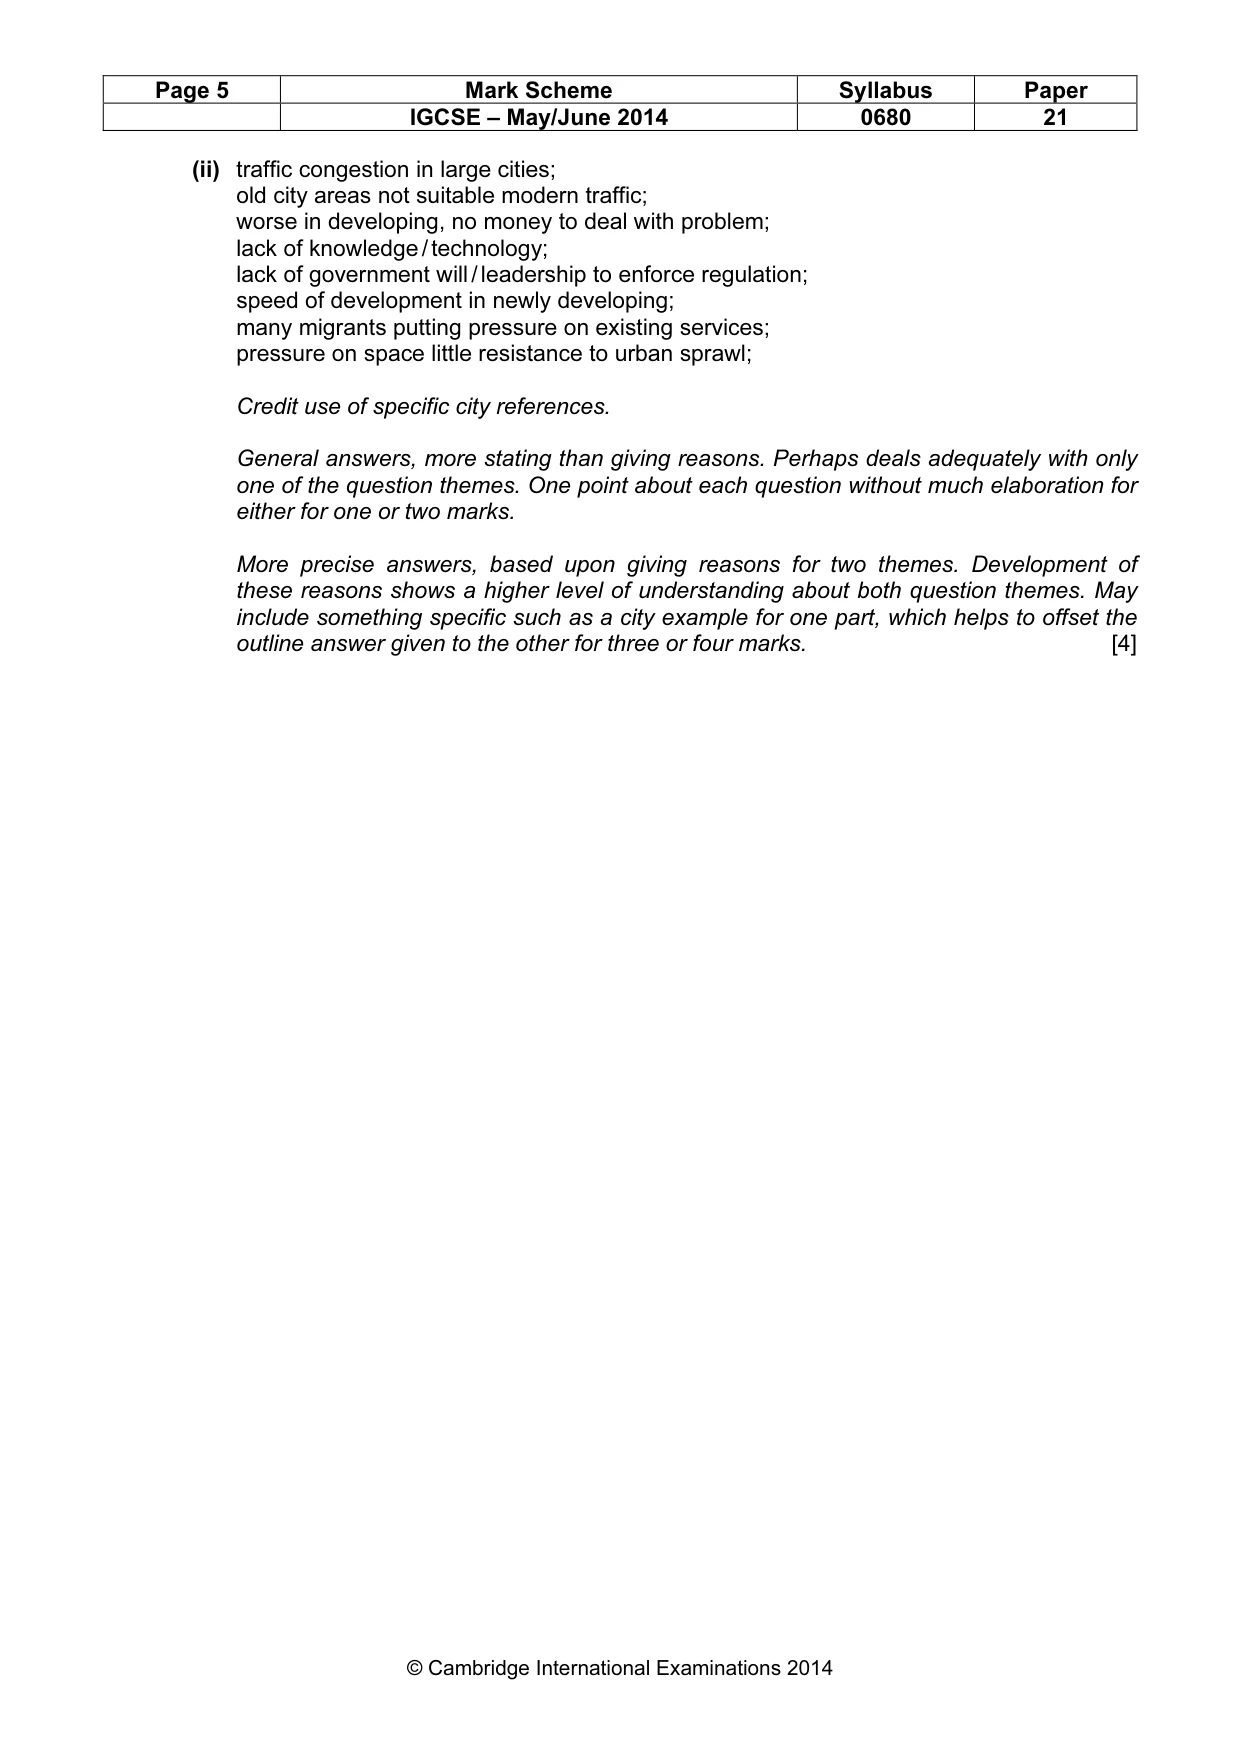
Page 5 Mark Scheme Syllabus Paper IGCSE – May/June 2014 0680 21 © Cambridge International Examinations 2014 (ii) traffic congestion in large cities; old city areas not suitable modern traffic; worse in developing, no money to deal with problem; lack of knowledge / technology; lack of government will / leadership to enforce regulation; speed of development in newly developing; many migrants putting pressure on existing services; pressure on space little resistance to urban sprawl; Credit use of specific city references. General answers, more stating than giving reasons. Perhaps deals adequately with only one of the question themes. One point about each question without much elaboration for either for one or two marks. More precise answers, based upon giving reasons for two themes. Development of these reasons shows a higher level of understanding about both question themes. May include something specific such as a city example for one part, which helps to offset the outline answer given to the other for three or four marks. [4]
Mark scheme, page 6
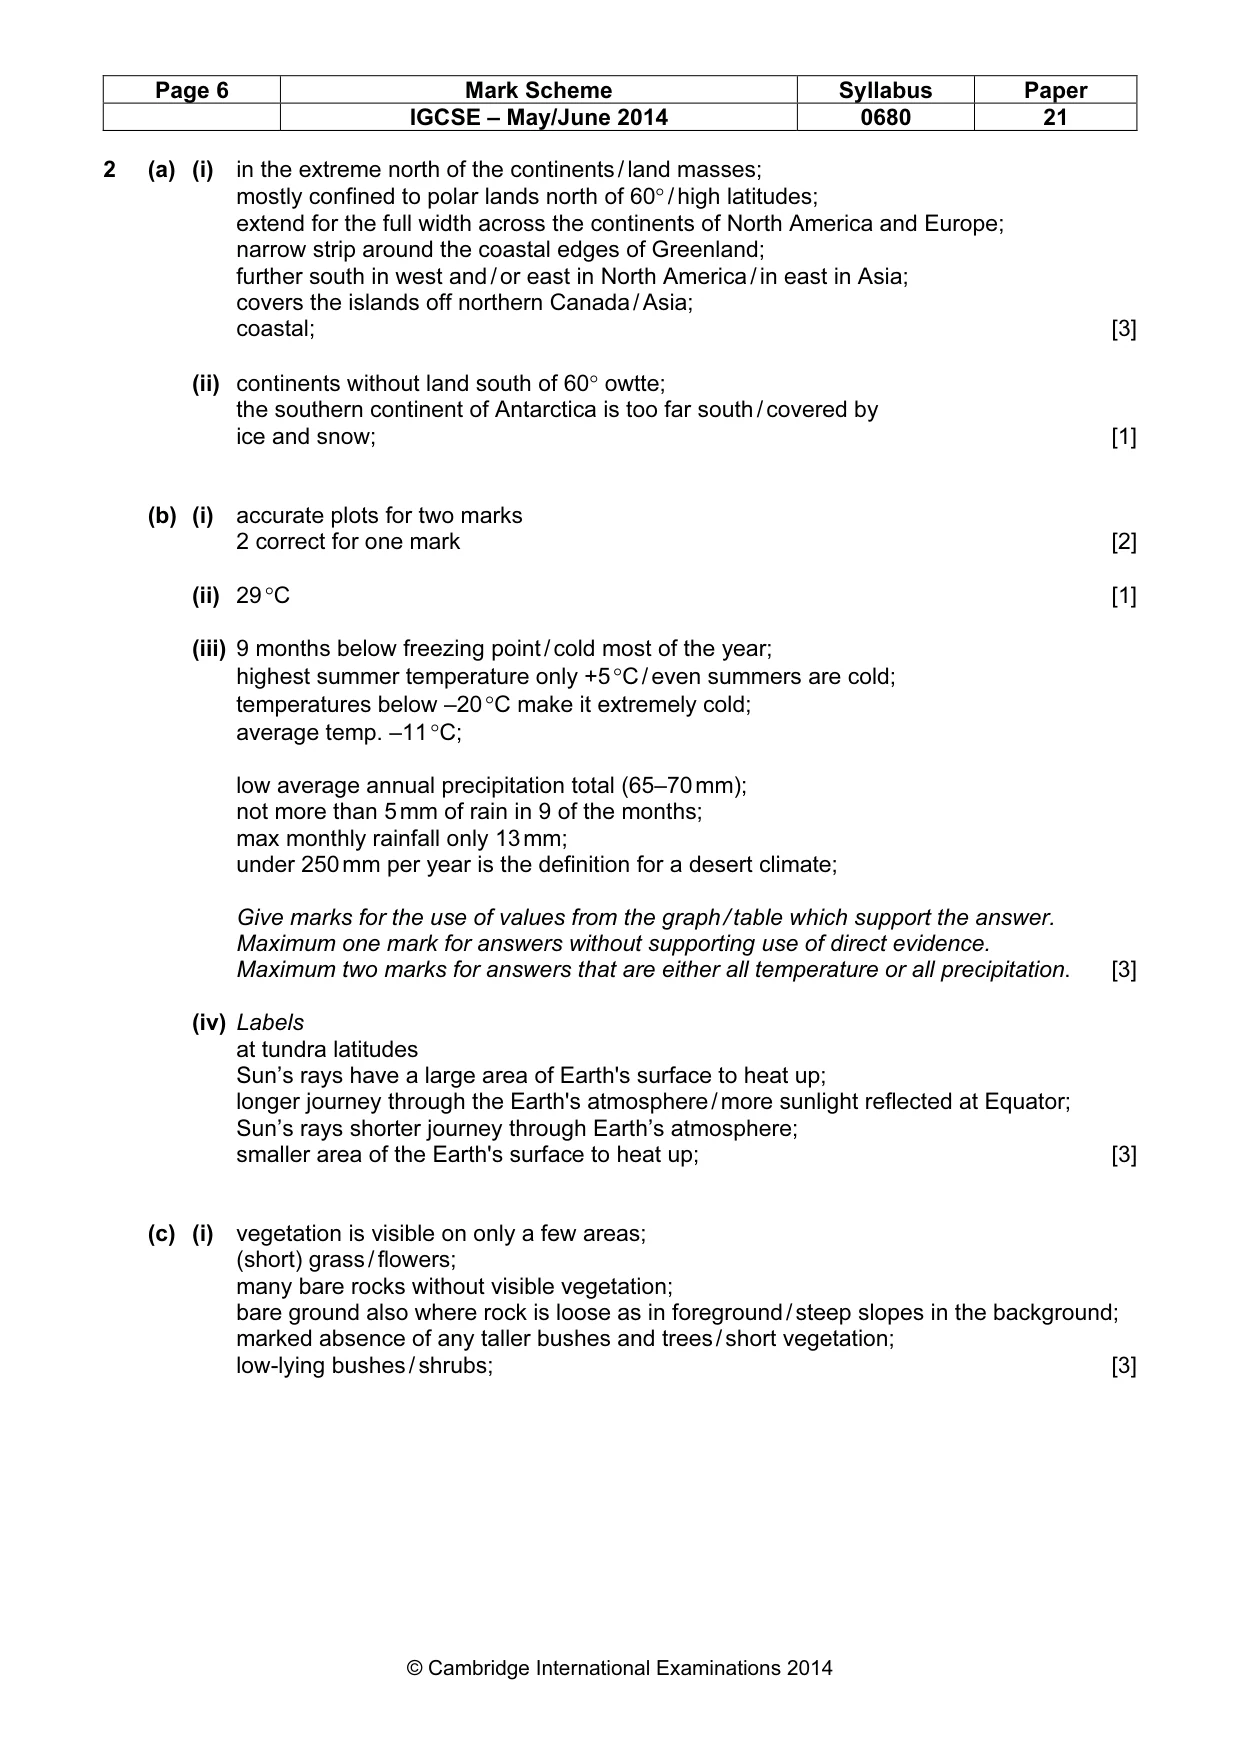
Page 6 Mark Scheme Syllabus Paper IGCSE – May/June 2014 0680 21 © Cambridge International Examinations 2014 2 (a) (i) in the extreme north of the continents / land masses; mostly confined to polar lands north of 60° / high latitudes; extend for the full width across the continents of North America and Europe; narrow strip around the coastal edges of Greenland; further south in west and / or east in North America / in east in Asia; covers the islands off northern Canada / Asia; coastal; [3] (ii) continents without land south of 60° owtte; the southern continent of Antarctica is too far south / covered by ice and snow; [1] (b) (i) accurate plots for two marks 2 correct for one mark [2] (ii) 29 °C [1] (iii) 9 months below freezing point / cold most of the year; highest summer temperature only +5 °C / even summers are cold; temperatures below –20 °C make it extremely cold; average temp. –11 °C; low average annual precipitation total (65–70 mm); not more than 5 mm of rain in 9 of the months; max monthly rainfall only 13 mm; under 250 mm per year is the definition for a desert climate; Give marks for the use of values from the graph / table which support the answer. Maximum one mark for answers without supporting use of direct evidence. Maximum two marks for answers that are either all temperature or all precipitation. [3] (iv) Labels at tundra latitudes Sun’s rays have a large area of Earth's surface to heat up; longer journey through the Earth's atmosphere / more sunlight reflected at Equator; Sun’s rays shorter journey through Earth’s atmosphere; smaller area of the Earth's surface to heat up; [3] (c) (i) vegetation is visible on only a few areas; (short) grass / flowers; many bare rocks without visible vegetation; bare ground also where rock is loose as in foreground / steep slopes in the background; marked absence of any taller bushes and trees / short vegetation; low-lying bushes / shrubs; [3]
Mark scheme, page 7
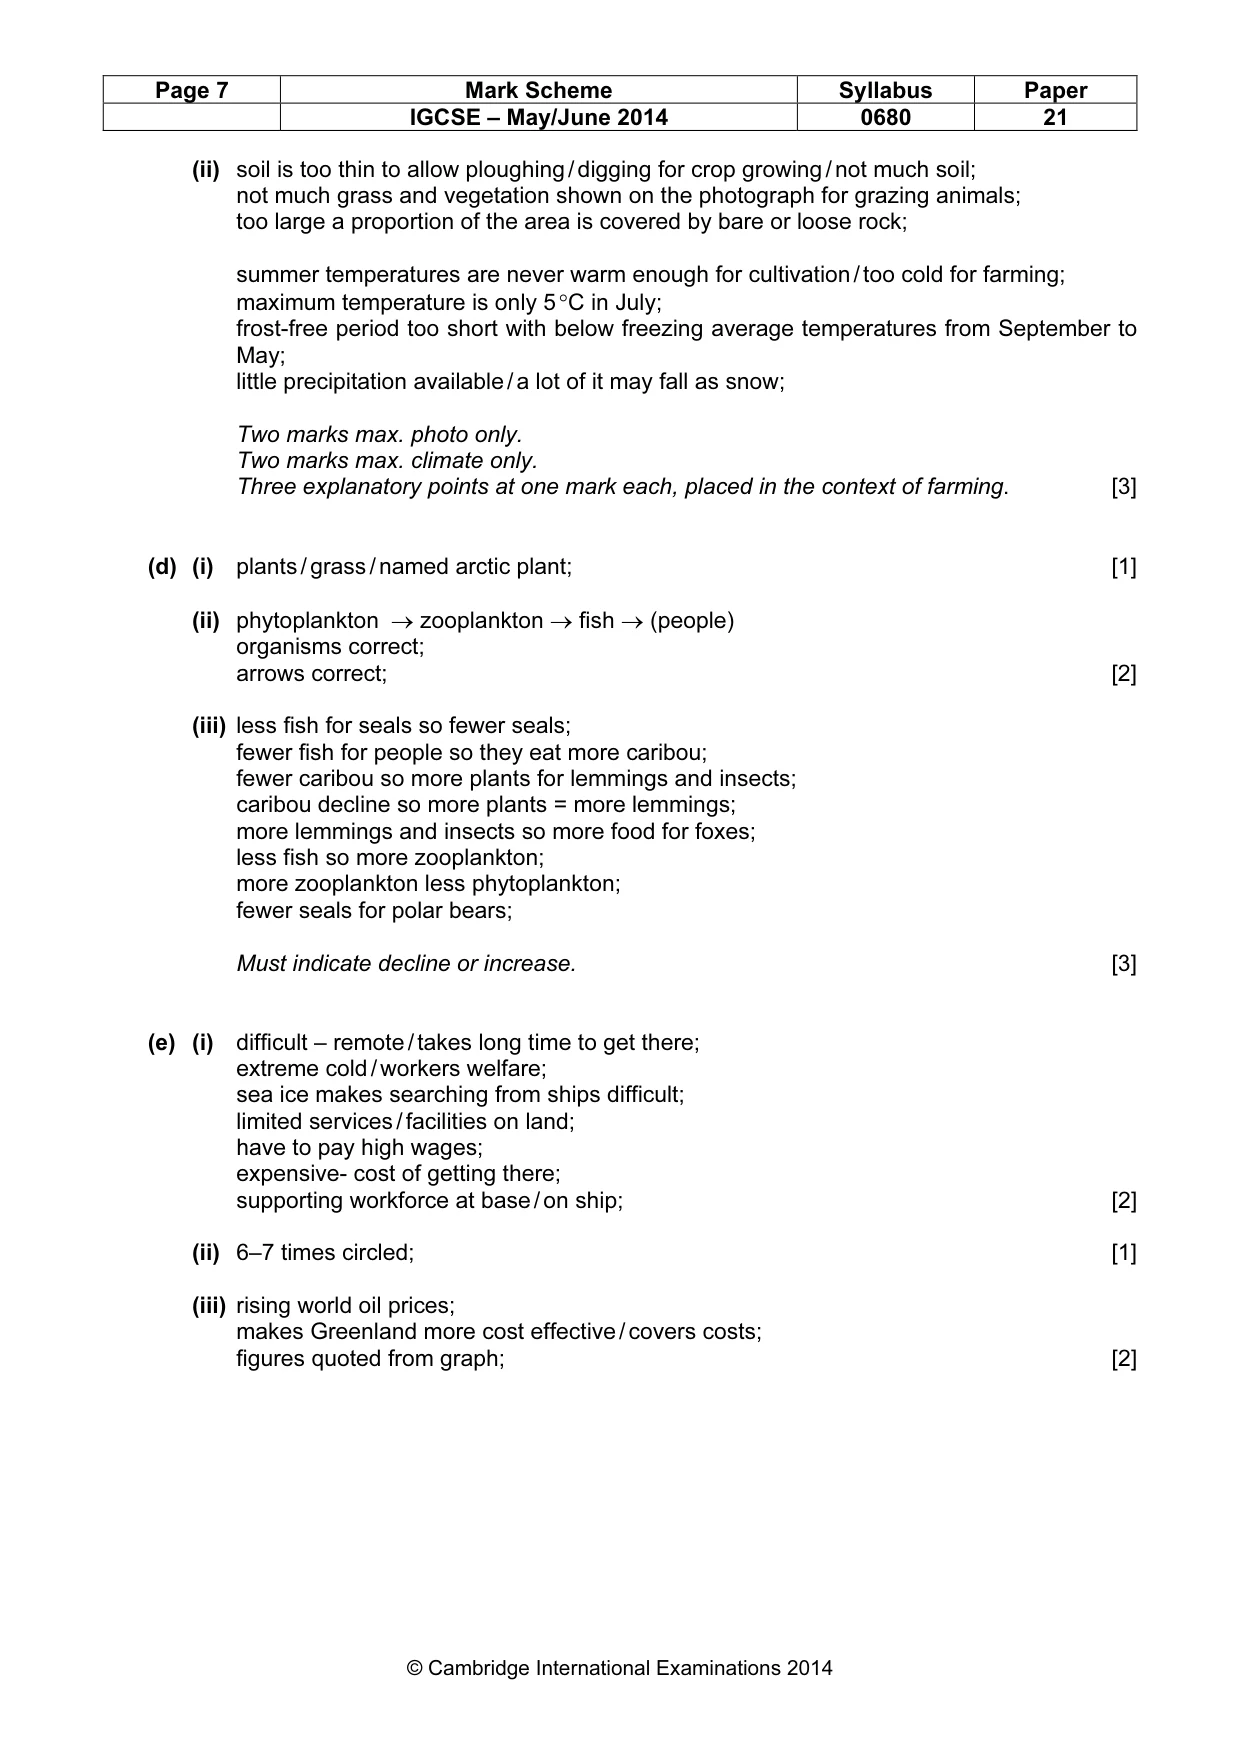
Page 7 Mark Scheme Syllabus Paper IGCSE – May/June 2014 0680 21 © Cambridge International Examinations 2014 (ii) soil is too thin to allow ploughing / digging for crop growing / not much soil; not much grass and vegetation shown on the photograph for grazing animals; too large a proportion of the area is covered by bare or loose rock; summer temperatures are never warm enough for cultivation / too cold for farming; maximum temperature is only 5 °C in July; frost-free period too short with below freezing average temperatures from September to May; little precipitation available / a lot of it may fall as snow; Two marks max. photo only. Two marks max. climate only. Three explanatory points at one mark each, placed in the context of farming. [3] (d) (i) plants / grass / named arctic plant; [1] (ii) phytoplankton → zooplankton → fish → (people) organisms correct; arrows correct; [2] (iii) less fish for seals so fewer seals; fewer fish for people so they eat more caribou; fewer caribou so more plants for lemmings and insects; caribou decline so more plants = more lemmings; more lemmings and insects so more food for foxes; less fish so more zooplankton; more zooplankton less phytoplankton; fewer seals for polar bears; Must indicate decline or increase. [3] (e) (i) difficult – remote / takes long time to get there; extreme cold / workers welfare; sea ice makes searching from ships difficult; limited services / facilities on land; have to pay high wages; expensive- cost of getting there; supporting workforce at base / on ship; [2] (ii) 6–7 times circled; [1] (iii) rising world oil prices; makes Greenland more cost effective / covers costs; figures quoted from graph; [2]
Mark scheme, page 8
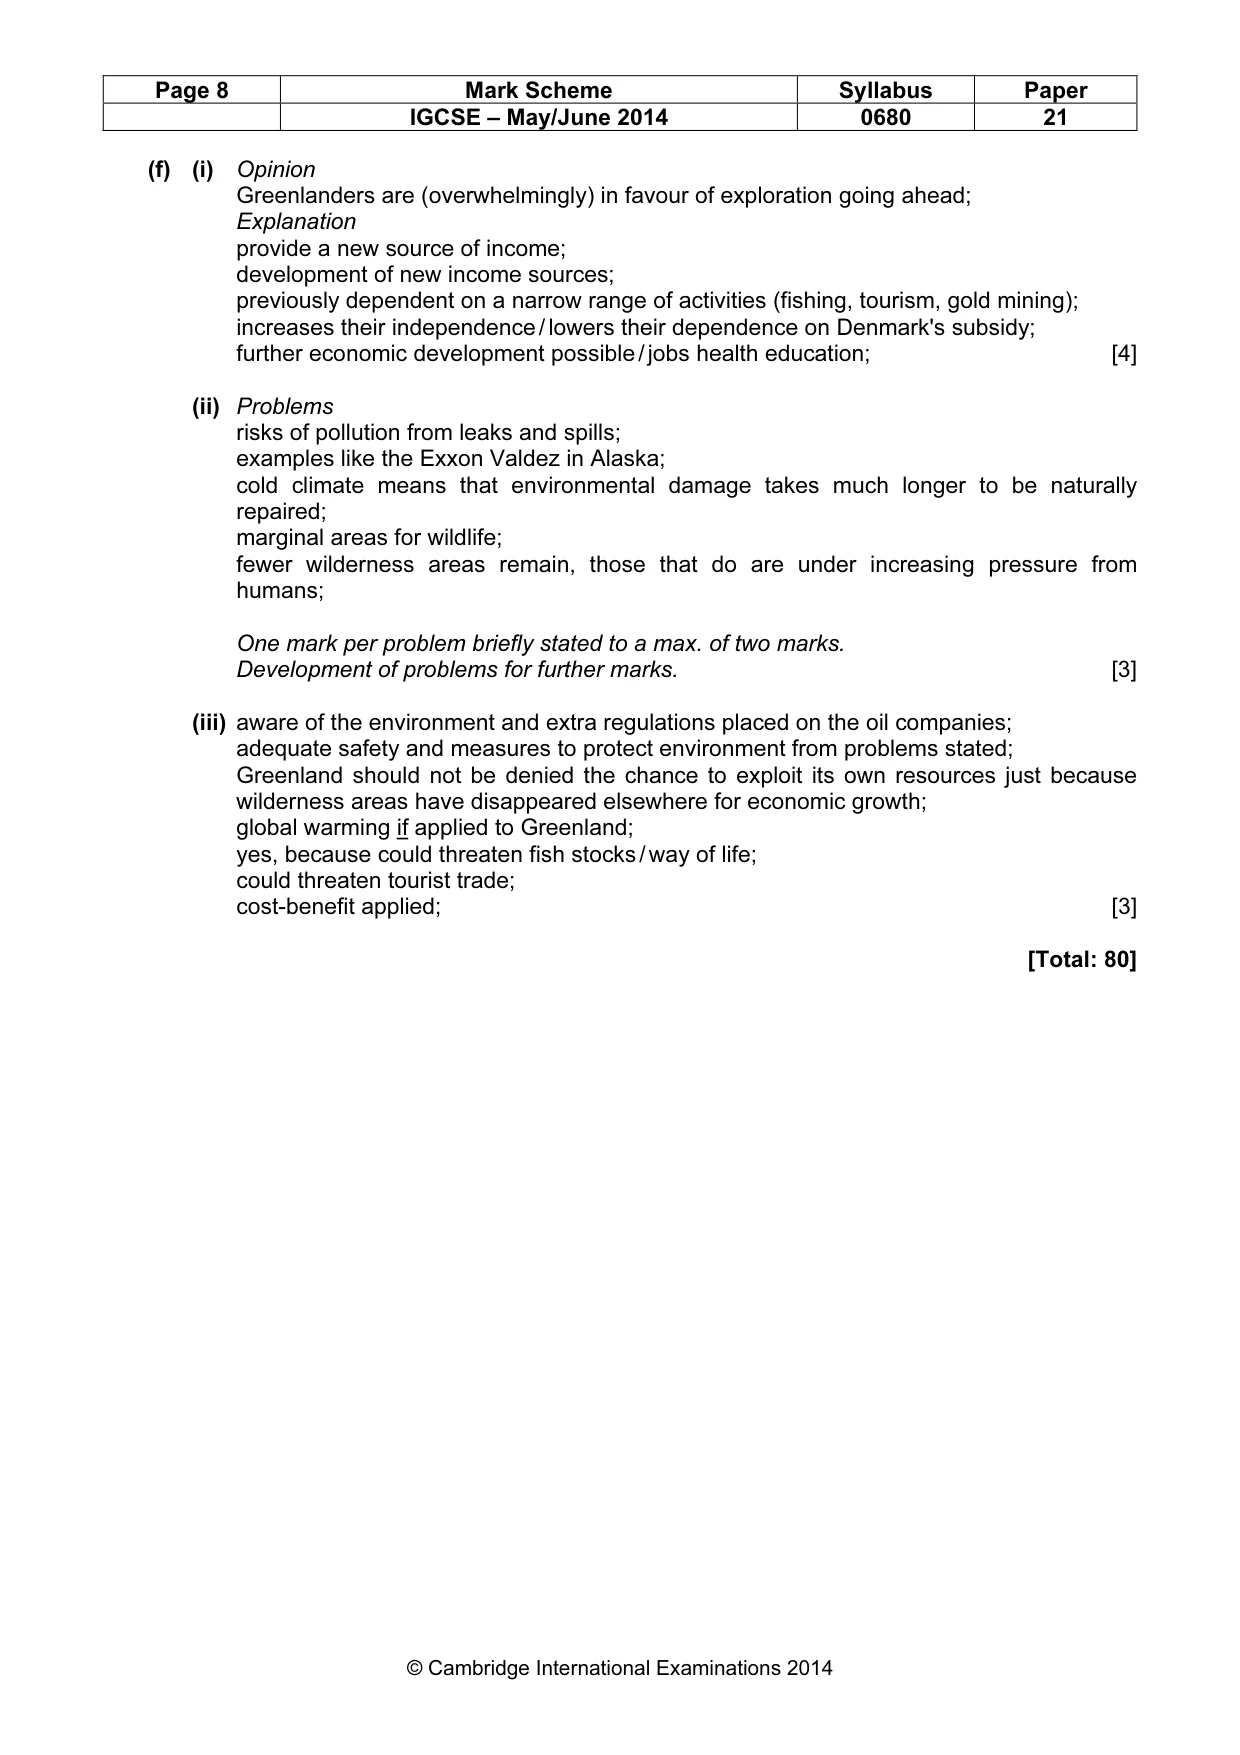
Page 8 Mark Scheme Syllabus Paper IGCSE – May/June 2014 0680 21 © Cambridge International Examinations 2014 (f) (i) Opinion Greenlanders are (overwhelmingly) in favour of exploration going ahead; Explanation provide a new source of income; development of new income sources; previously dependent on a narrow range of activities (fishing, tourism, gold mining); increases their independence / lowers their dependence on Denmark's subsidy; further economic development possible / jobs health education; [4] (ii) Problems risks of pollution from leaks and spills; examples like the Exxon Valdez in Alaska; cold climate means that environmental damage takes much longer to be naturally repaired; marginal areas for wildlife; fewer wilderness areas remain, those that do are under increasing pressure from humans; One mark per problem briefly stated to a max. of two marks. Development of problems for further marks. [3] (iii) aware of the environment and extra regulations placed on the oil companies; adequate safety and measures to protect environment from problems stated; Greenland should not be denied the chance to exploit its own resources just because wilderness areas have disappeared elsewhere for economic growth; global warming if applied to Greenland; yes, because could threaten fish stocks / way of life; could threaten tourist trade; cost-benefit applied; [3] [Total: 80]
What you needed in this session
Cambridge’s own grade thresholds for 2014 May/June, Paper 2 · Variant 1. A higher threshold means an easier paper — the bar moves with how the cohort did.