Cambridge IGCSE Environmental Management 0680 — 2013 Oct/Nov Paper 2 · Variant 2
0680/22/O/N/13 · 80 marks · ≈90 min
The question paper and its mark scheme, free to read here and free to download. This is Cambridge’s own paper, exactly as it was sat.
Question paper20 pages




Mark scheme9 pages
Answers below. Sit the paper first if you are practising.
Paper as text
Question paper, page 1
This document consists of 18 printed pages and 2 blank pages. DC (RW/CGW) 69452/3 © UCLES 2013 [Turn over UNIVERSITY OF CAMBRIDGE INTERNATIONAL EXAMINATIONS International General Certificate of Secondary Education * 2 3 5 7 4 1 1 7 4 8 * ENVIRONMENTAL MANAGEMENT 0680/22 Paper 2 October/November 2013 1 hour 45 minutes Candidates answer on the Question Paper. Additional Materials: Ruler READ THESE INSTRUCTIONS FIRST Write your Centre number, candidate number and name on all the work you hand in. Write in dark blue or black pen. You may use a soft pencil for any diagrams, graphs or rough working. Do not use staples, paper clips, highlighters, glue or correction fluid. DO NOT WRITE IN ANY BARCODES. Answer both questions. Electronic calculators may be used. You may lose marks if you do not show your working or if you do not use appropriate units. At the end of the examination, fasten all your work securely together. The number of marks is given in brackets [ ] at the end of each question or part question. For Examiner’s Use 1 2 Total
Question paper, page 2
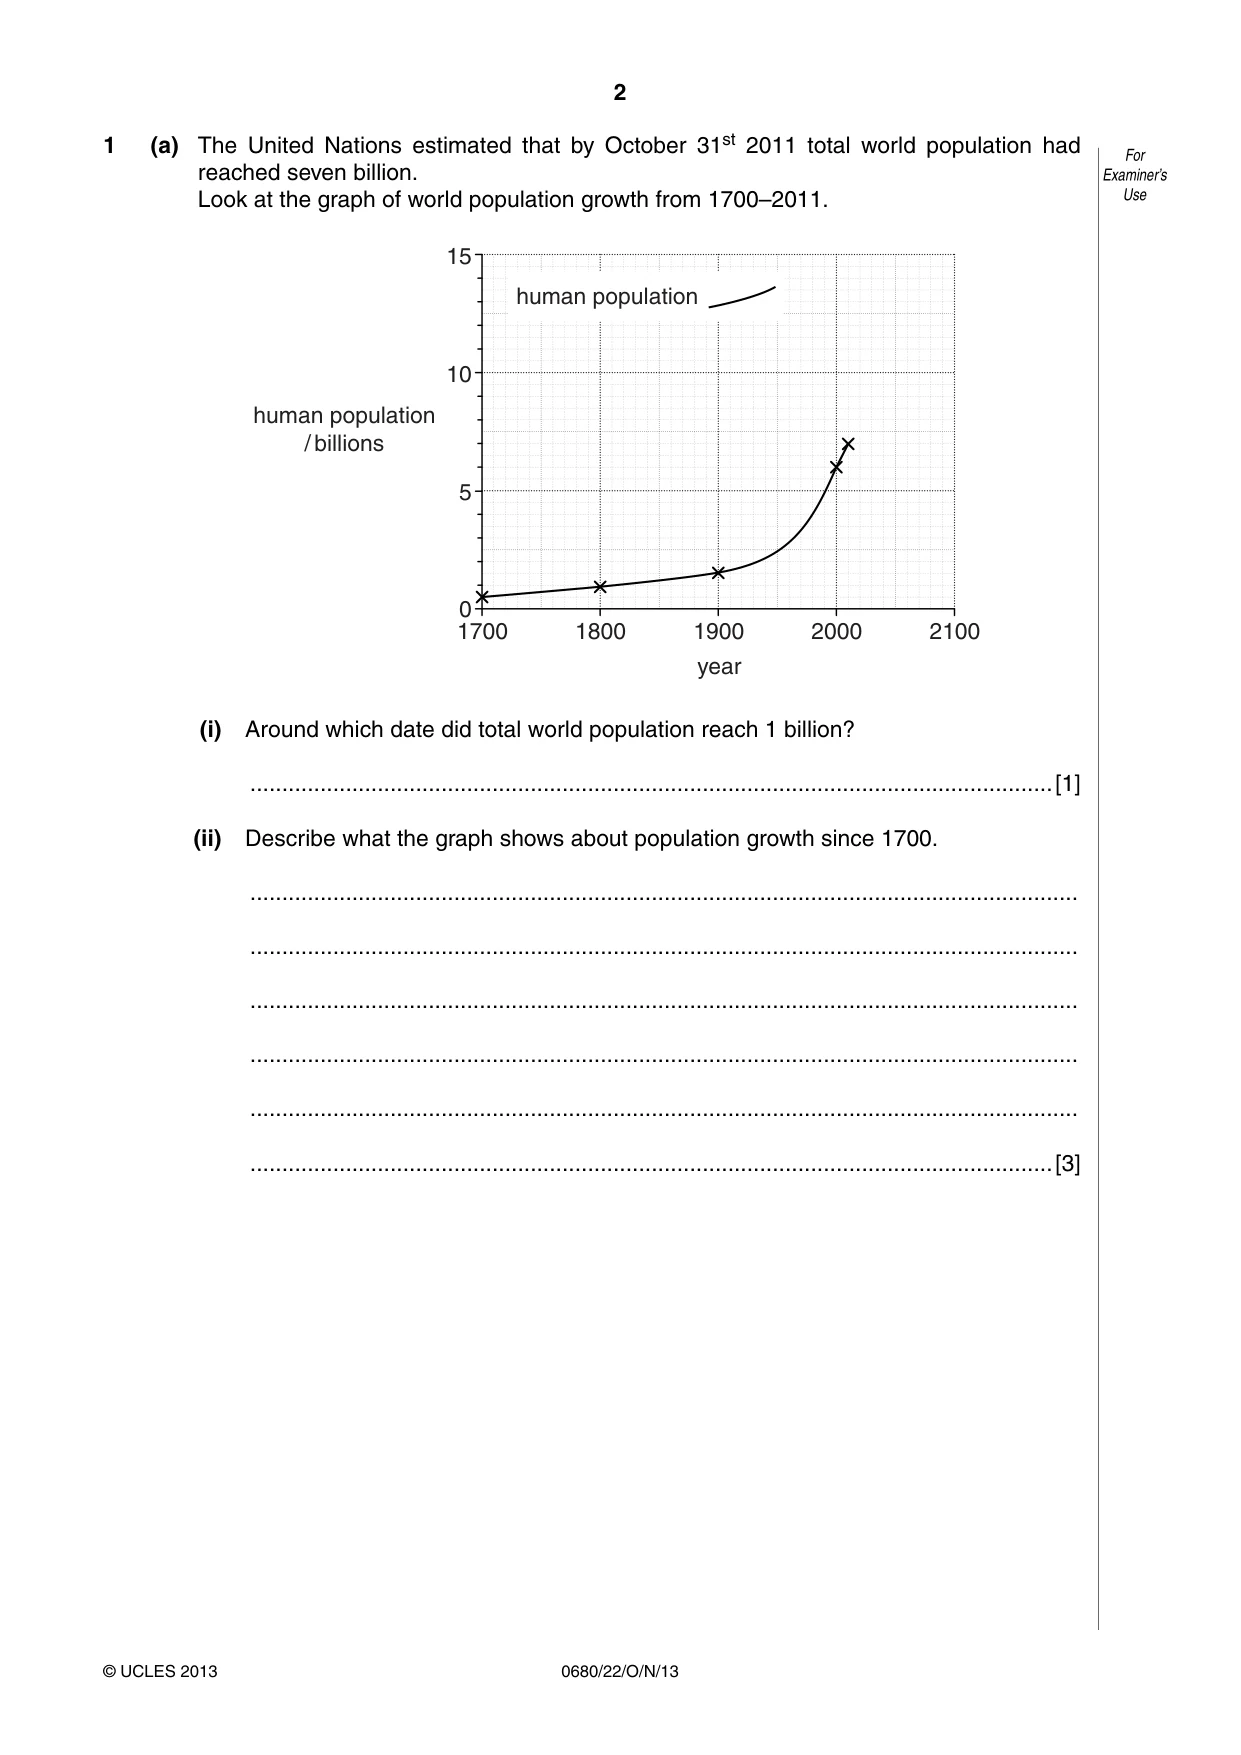
2 0680/22/O/N/13 © UCLES 2013 For Examiner’s Use 1 (a) The United Nations estimated that by October 31st 2011 total world population had reached seven billion. Look at the graph of world population growth from 1700–2011. 1700 1800 1900 0 5 10 15 year 2000 2100 human population / billions human population (i) Around which date did total world population reach 1 billion? …[1] (ii) Describe what the graph shows about population growth since 1700. … … … … … …[3]
Question paper, page 3
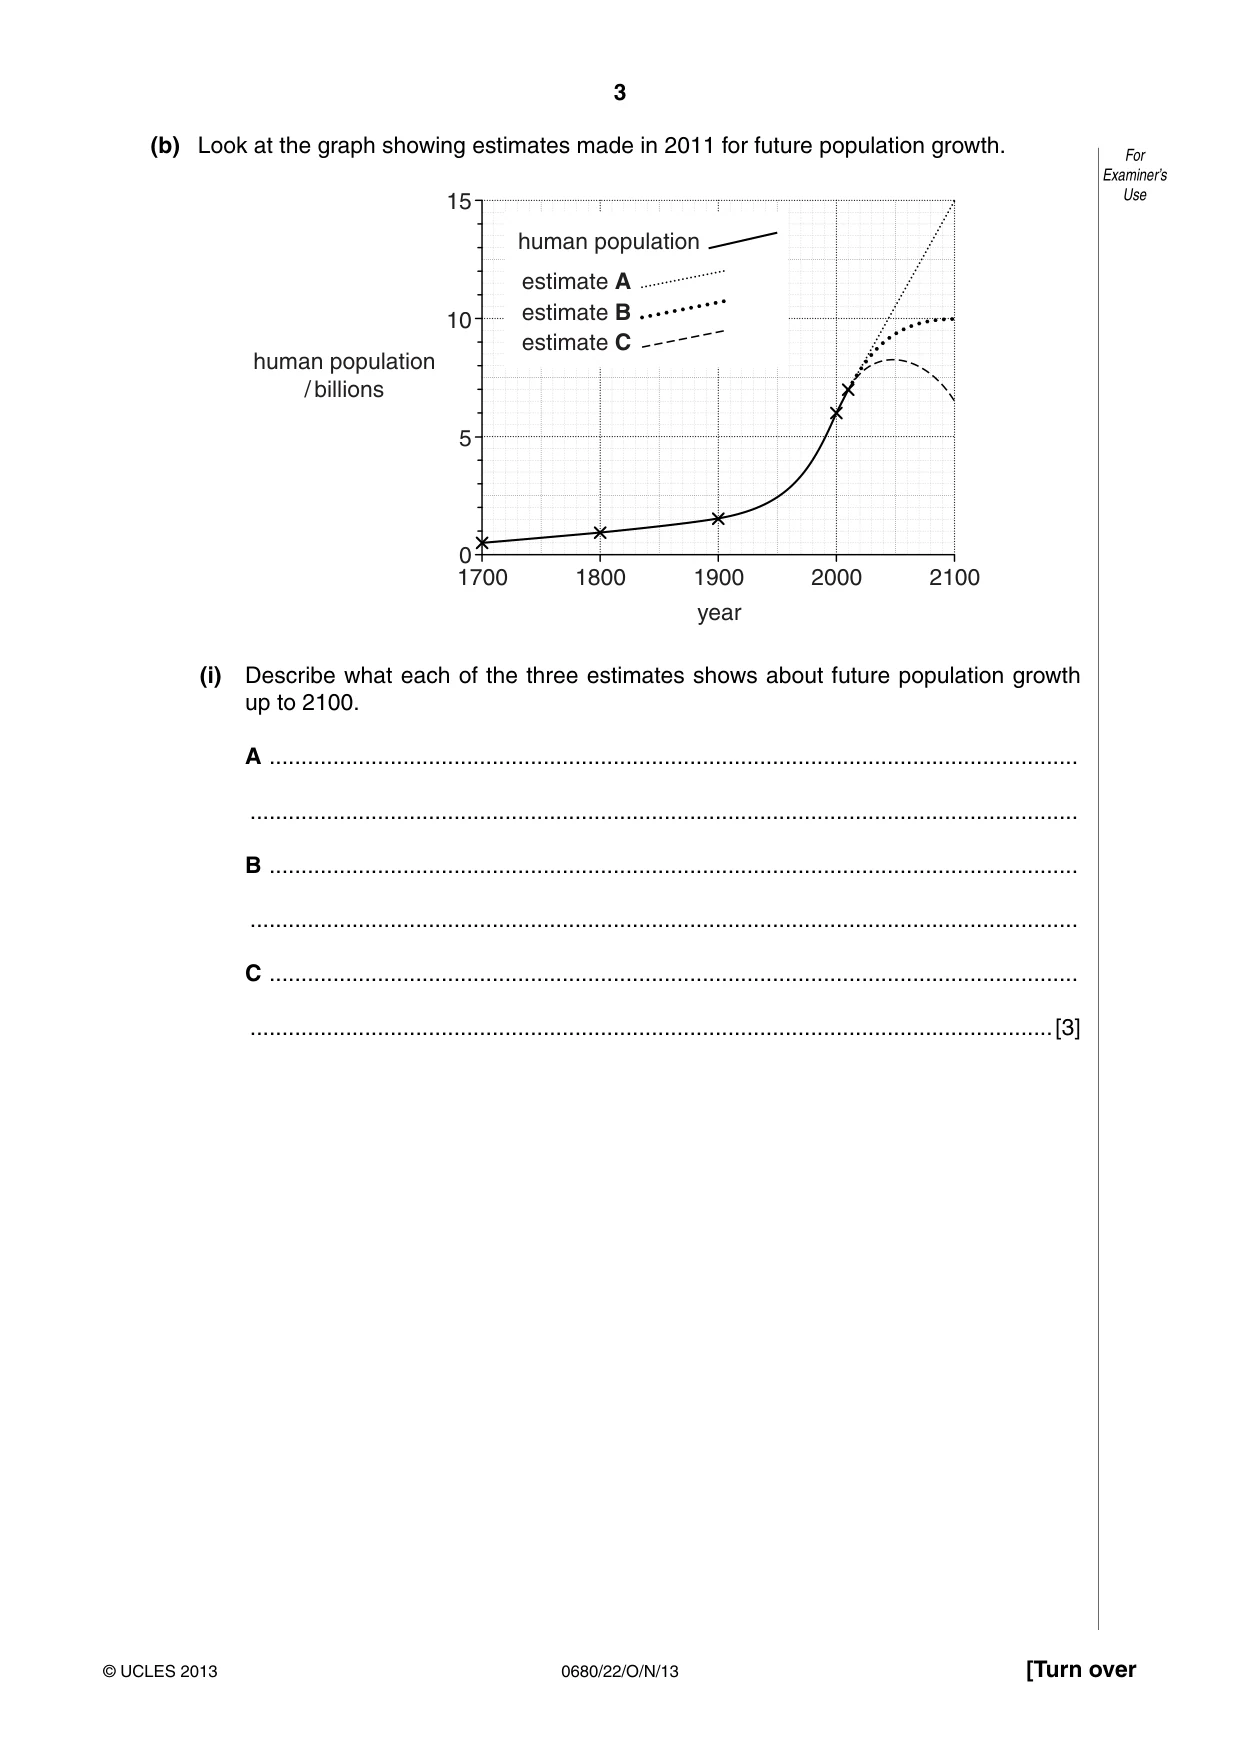
3 0680/22/O/N/13 © UCLES 2013 [Turn over For Examiner’s Use (b) Look at the graph showing estimates made in 2011 for future population growth. 1700 1800 1900 0 5 10 15 year 2000 2100 human population / billions human population estimate A estimate B estimate C (i) Describe what each of the three estimates shows about future population growth up to 2100. A … … B … … C … …[3]
Question paper, page 4
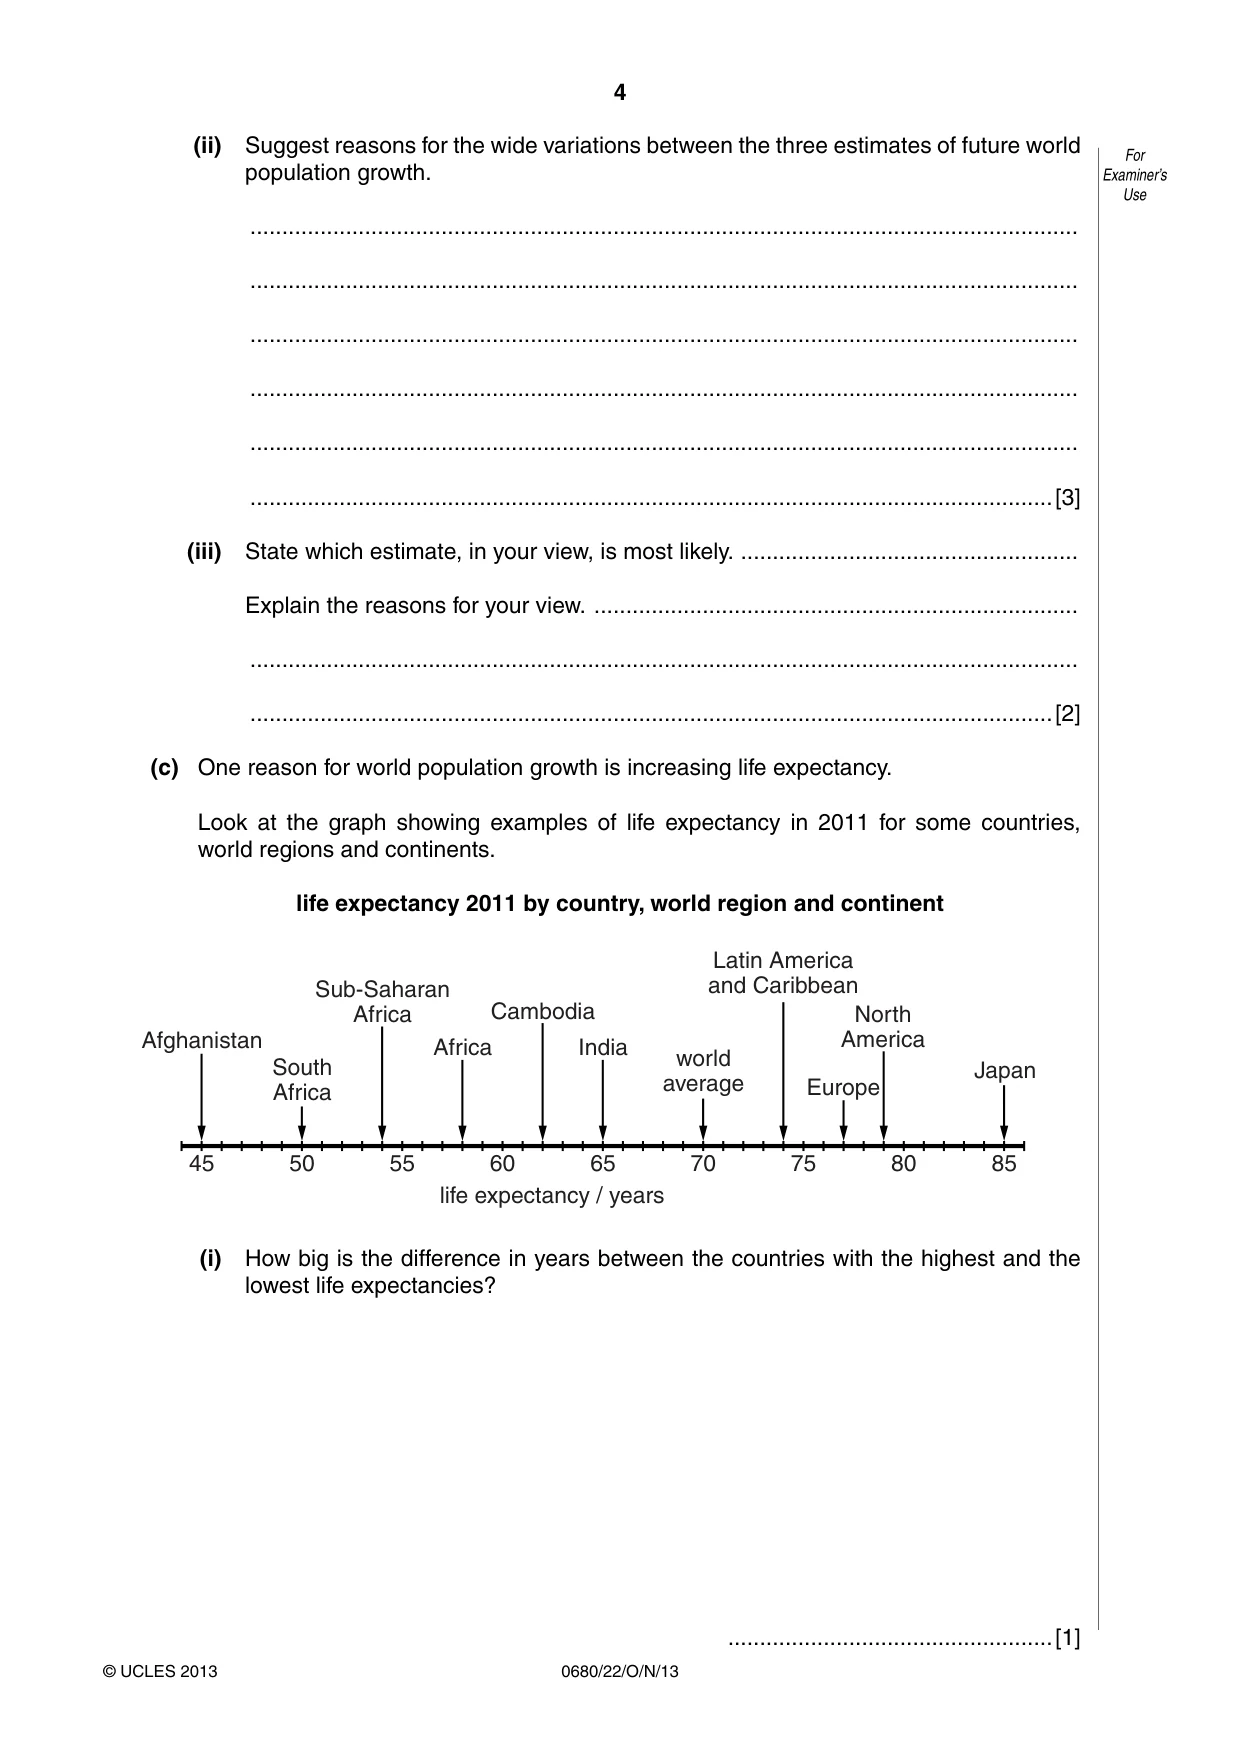
4 0680/22/O/N/13 © UCLES 2013 For Examiner’s Use (ii) Suggest reasons for the wide variations between the three estimates of future world population growth. … … … … … …[3] (iii) State which estimate, in your view, is most likely. … Explain the reasons for your view. … … …[2] (c) One reason for world population growth is increasing life expectancy. Look at the graph showing examples of life expectancy in 2011 for some countries, world regions and continents. life expectancy 2011 by country, world region and continent 45 50 55 60 life expectancy / years Afghanistan India Africa Europe North America Japan South Africa Cambodia world average Sub-Saharan Africa Latin America and Caribbean 65 70 75 80 85 (i) How big is the difference in years between the countries with the highest and the lowest life expectancies? …[1]
Question paper, page 5
5 0680/22/O/N/13 © UCLES 2013 [Turn over For Examiner’s Use (ii) Suggest what is the most important reason for differences in life expectancy between countries, world regions and continents like the ones shown in the graph. Explain your answer. … … … …[2] (iii) Describe other, additional causes of very low life expectancies (below 60) in some countries. … … … … … …[3]
Question paper, page 6
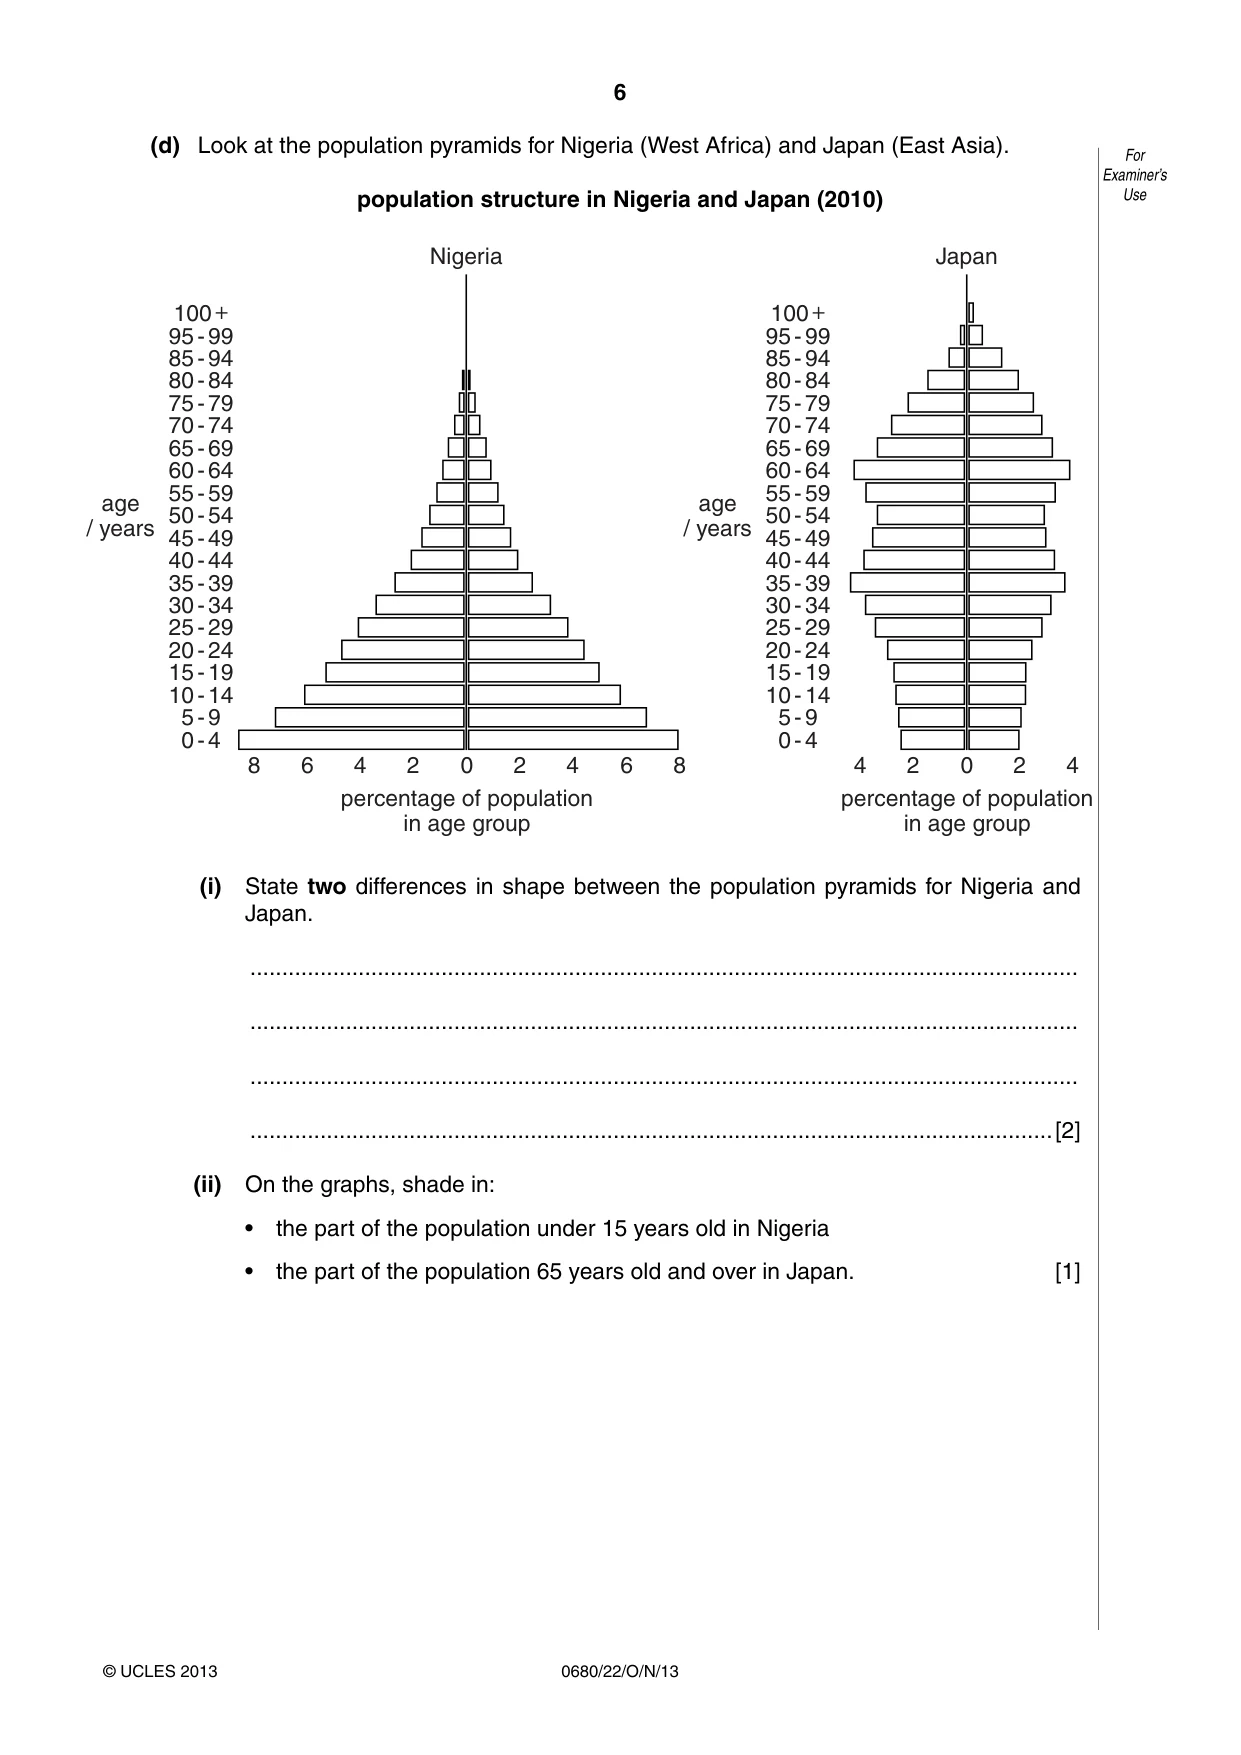
6 0680/22/O/N/13 © UCLES 2013 For Examiner’s Use (d) Look at the population pyramids for Nigeria (West Africa) and Japan (East Asia). population structure in Nigeria and Japan (2010) 100 + 95 - 99 85 - 94 80 - 84 75 - 79 70 - 74 65 - 69 60 - 64 55 - 59 50 - 54 45 - 49 40 - 44 35 - 39 30 - 34 25 - 29 20 - 24 15 - 19 10 - 14 5 - 9 0 - 4 0 2 4 4 2 0 percentage of population in age group percentage of population in age group age / years 100 + 95 - 99 85 - 94 80 - 84 75 - 79 70 - 74 65 - 69 60 - 64 55 - 59 50 - 54 45 - 49 40 - 44 35 - 39 30 - 34 25 - 29 20 - 24 15 - 19 10 - 14 5 - 9 0 - 4 age / years 2 4 2 6 4 8 8 6 Nigeria Japan (i) State two differences in shape between the population pyramids for Nigeria and Japan. … … … …[2] (ii) On the graphs, shade in: • the part of the population under 15 years old in Nigeria • the part of the population 65 years old and over in Japan. [1]
Question paper, page 7
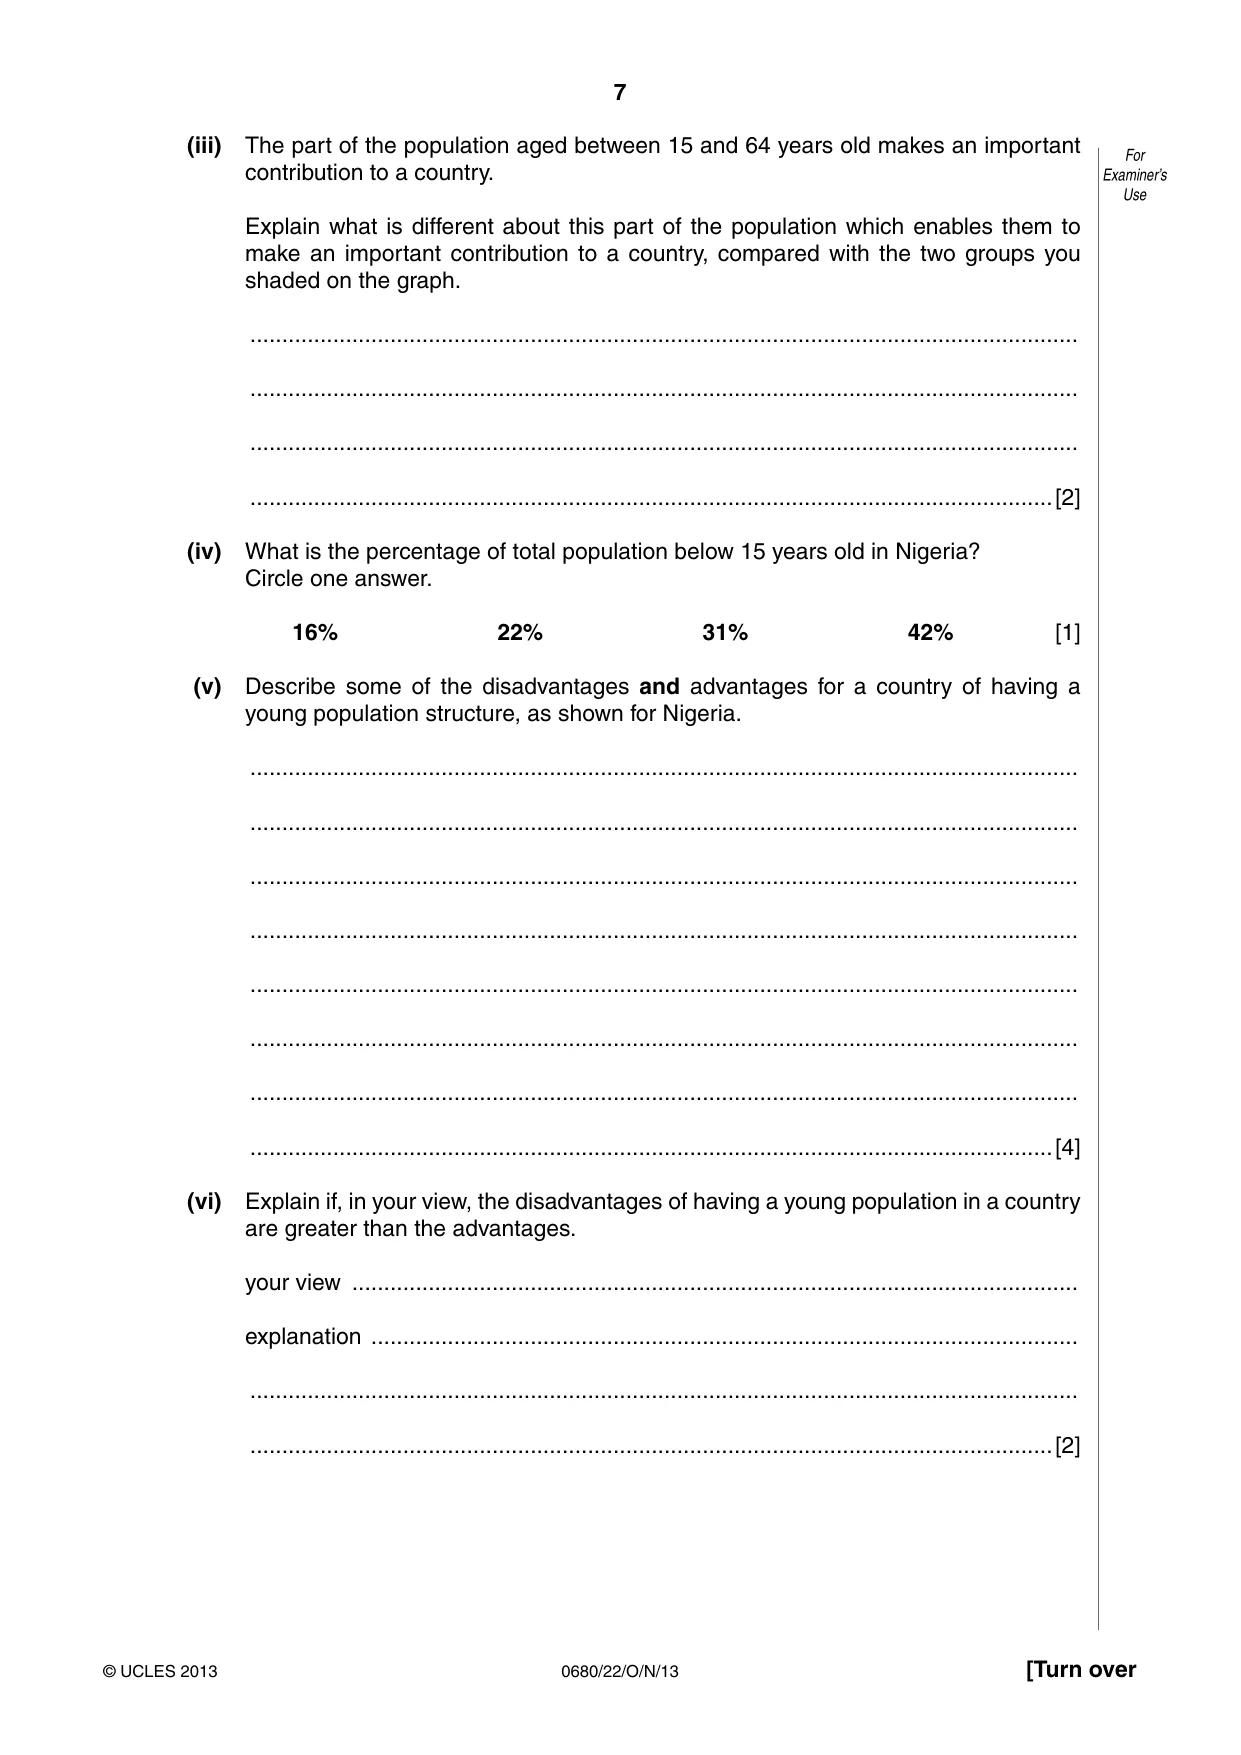
7 0680/22/O/N/13 © UCLES 2013 [Turn over For Examiner’s Use (iii) The part of the population aged between 15 and 64 years old makes an important contribution to a country. Explain what is different about this part of the population which enables them to make an important contribution to a country, compared with the two groups you shaded on the graph. … … … …[2] (iv) What is the percentage of total population below 15 years old in Nigeria? Circle one answer. 16% 22% 31% 42% [1] (v) Describe some of the disadvantages and advantages for a country of having a young population structure, as shown for Nigeria. … … … … … … … …[4] (vi) Explain if, in your view, the disadvantages of having a young population in a country are greater than the advantages. your view … explanation … … …[2]
Question paper, page 8
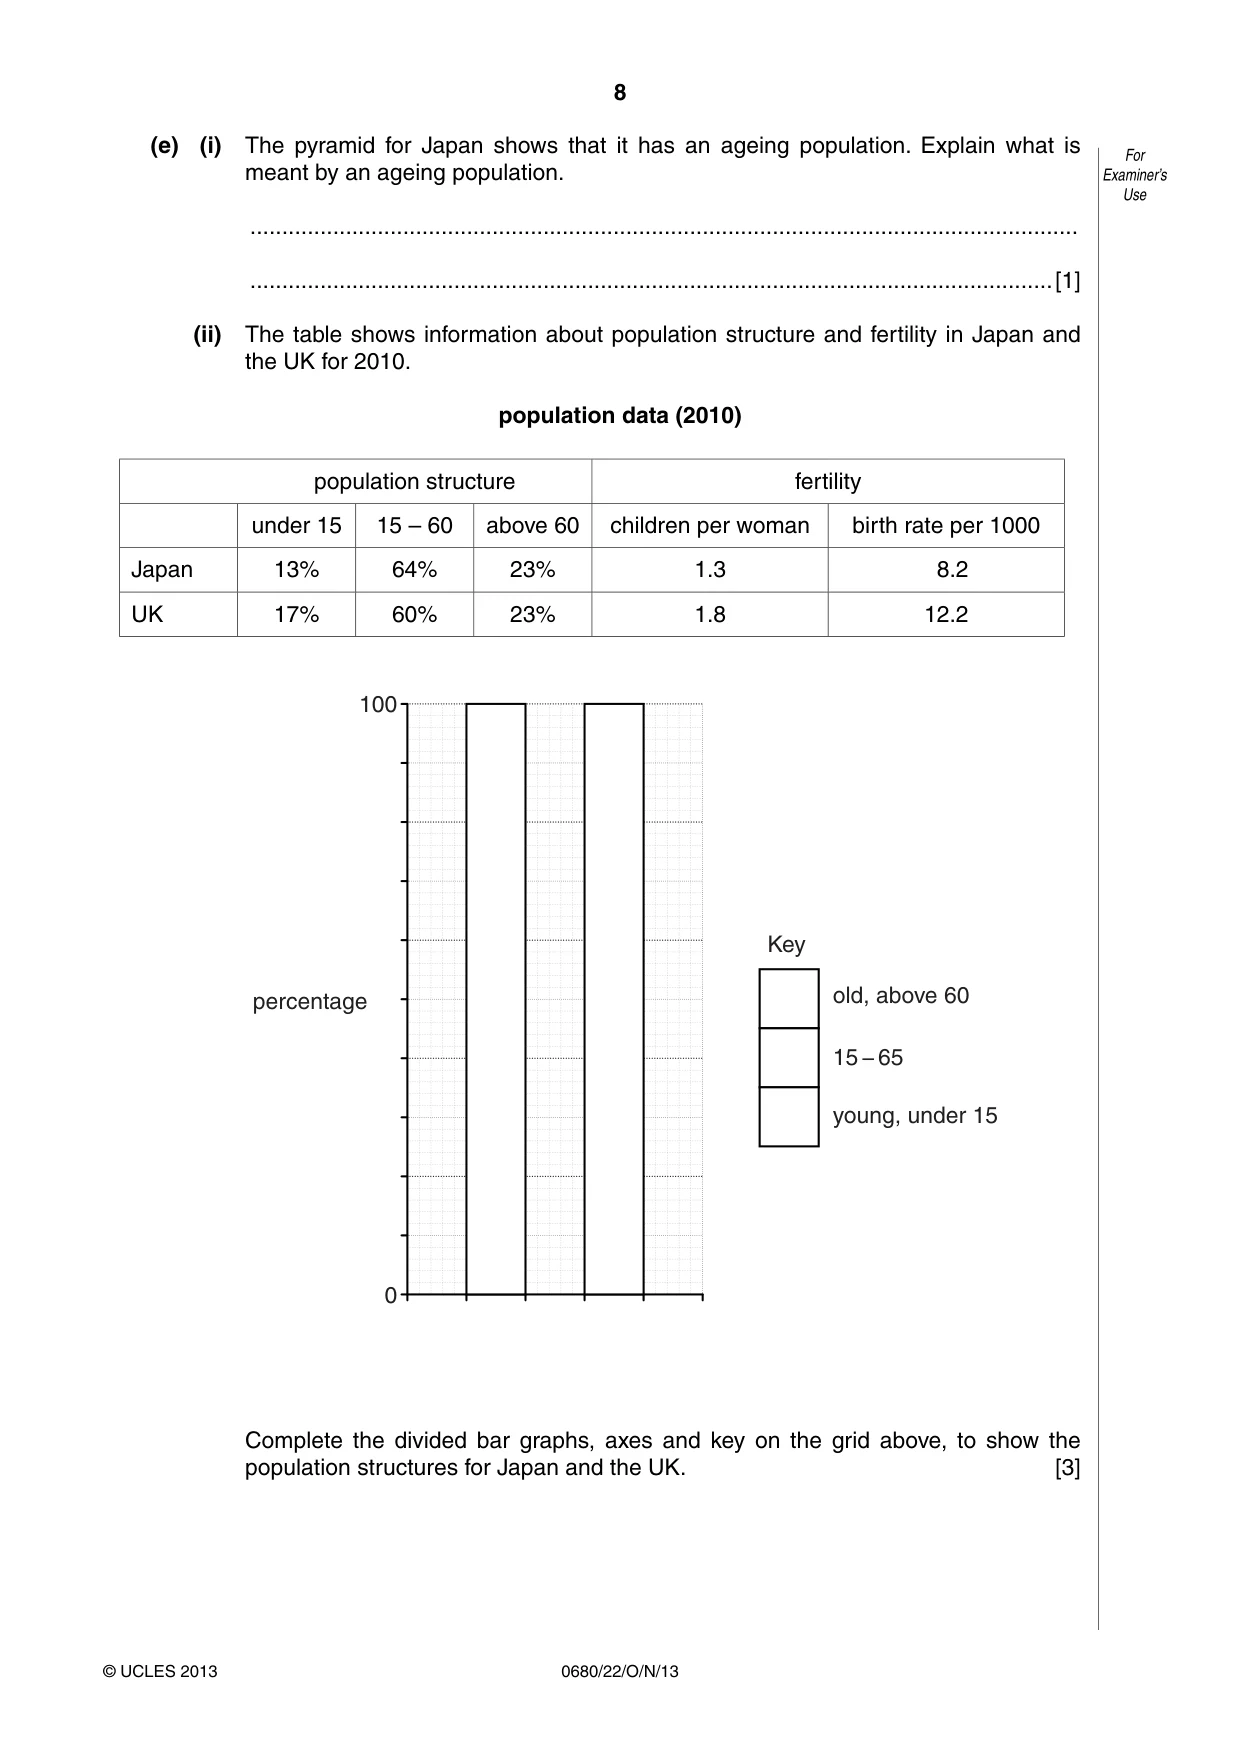
8 0680/22/O/N/13 © UCLES 2013 For Examiner’s Use (e) (i) The pyramid for Japan shows that it has an ageing population. Explain what is meant by an ageing population. … …[1] (ii) The table shows information about population structure and fertility in Japan and the UK for 2010. population data (2010) population structure fertility under 15 15 – 60 above 60 children per woman birth rate per 1000 Japan 13% 64% 23% 1.3 8.2 UK 17% 60% 23% 1.8 12.2 0 100 percentage Key old, above 60 15 − 65 young, under 15 Complete the divided bar graphs, axes and key on the grid above, to show the population structures for Japan and the UK. [3]
Question paper, page 9
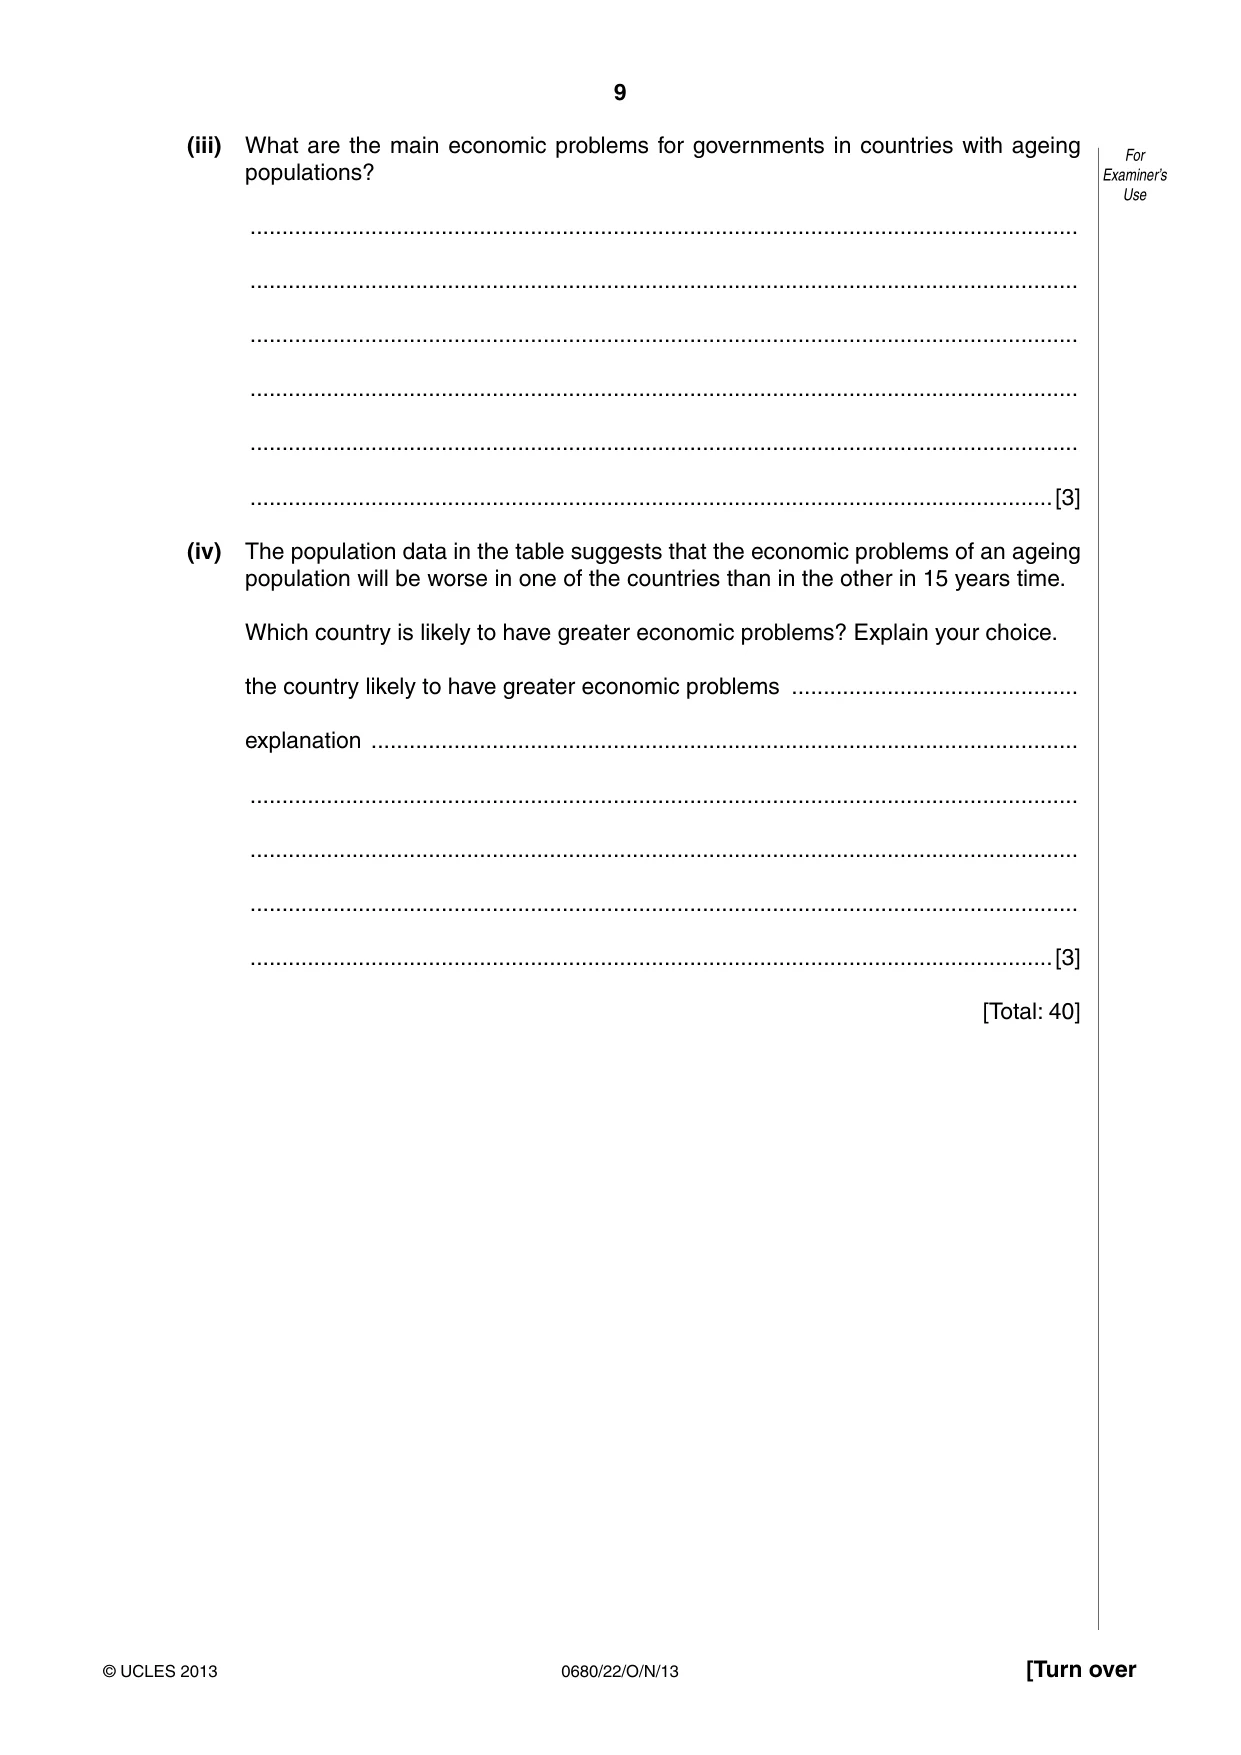
9 0680/22/O/N/13 © UCLES 2013 [Turn over For Examiner’s Use (iii) What are the main economic problems for governments in countries with ageing populations? … … … … … …[3] (iv) The population data in the table suggests that the economic problems of an ageing population will be worse in one of the countries than in the other in 15 years time. Which country is likely to have greater economic problems? Explain your choice. the country likely to have greater economic problems … explanation … … … … …[3] [Total: 40]
Question paper, page 10
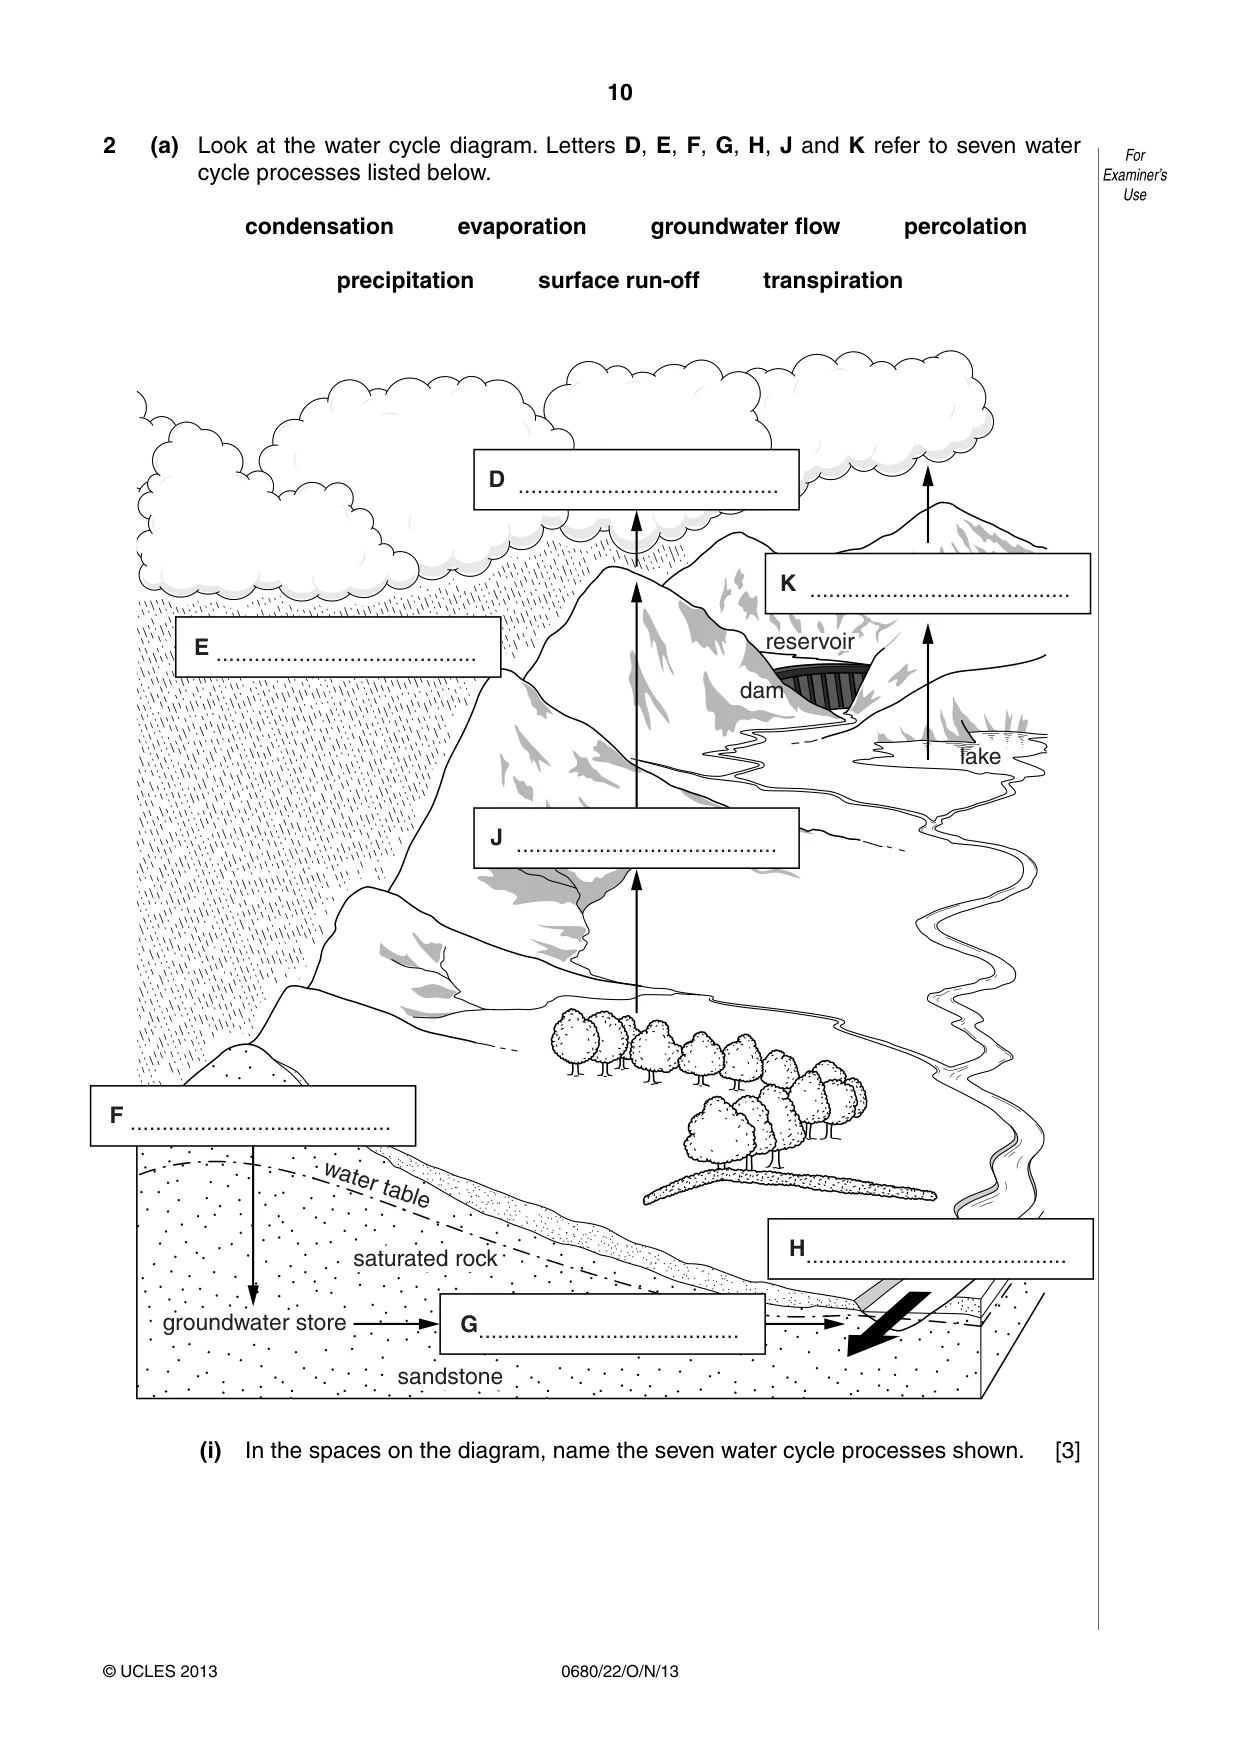
10 0680/22/O/N/13 © UCLES 2013 For Examiner’s Use 2 (a) Look at the water cycle diagram. Letters D, E, F, G, H, J and K refer to seven water cycle processes listed below. condensation evaporation groundwater flow percolation precipitation surface run-off transpiration lake dam E … F … G… H… D … J … K … reservoir groundwater store saturated rock water table sandstone (i) In the spaces on the diagram, name the seven water cycle processes shown. [3]
Question paper, page 11
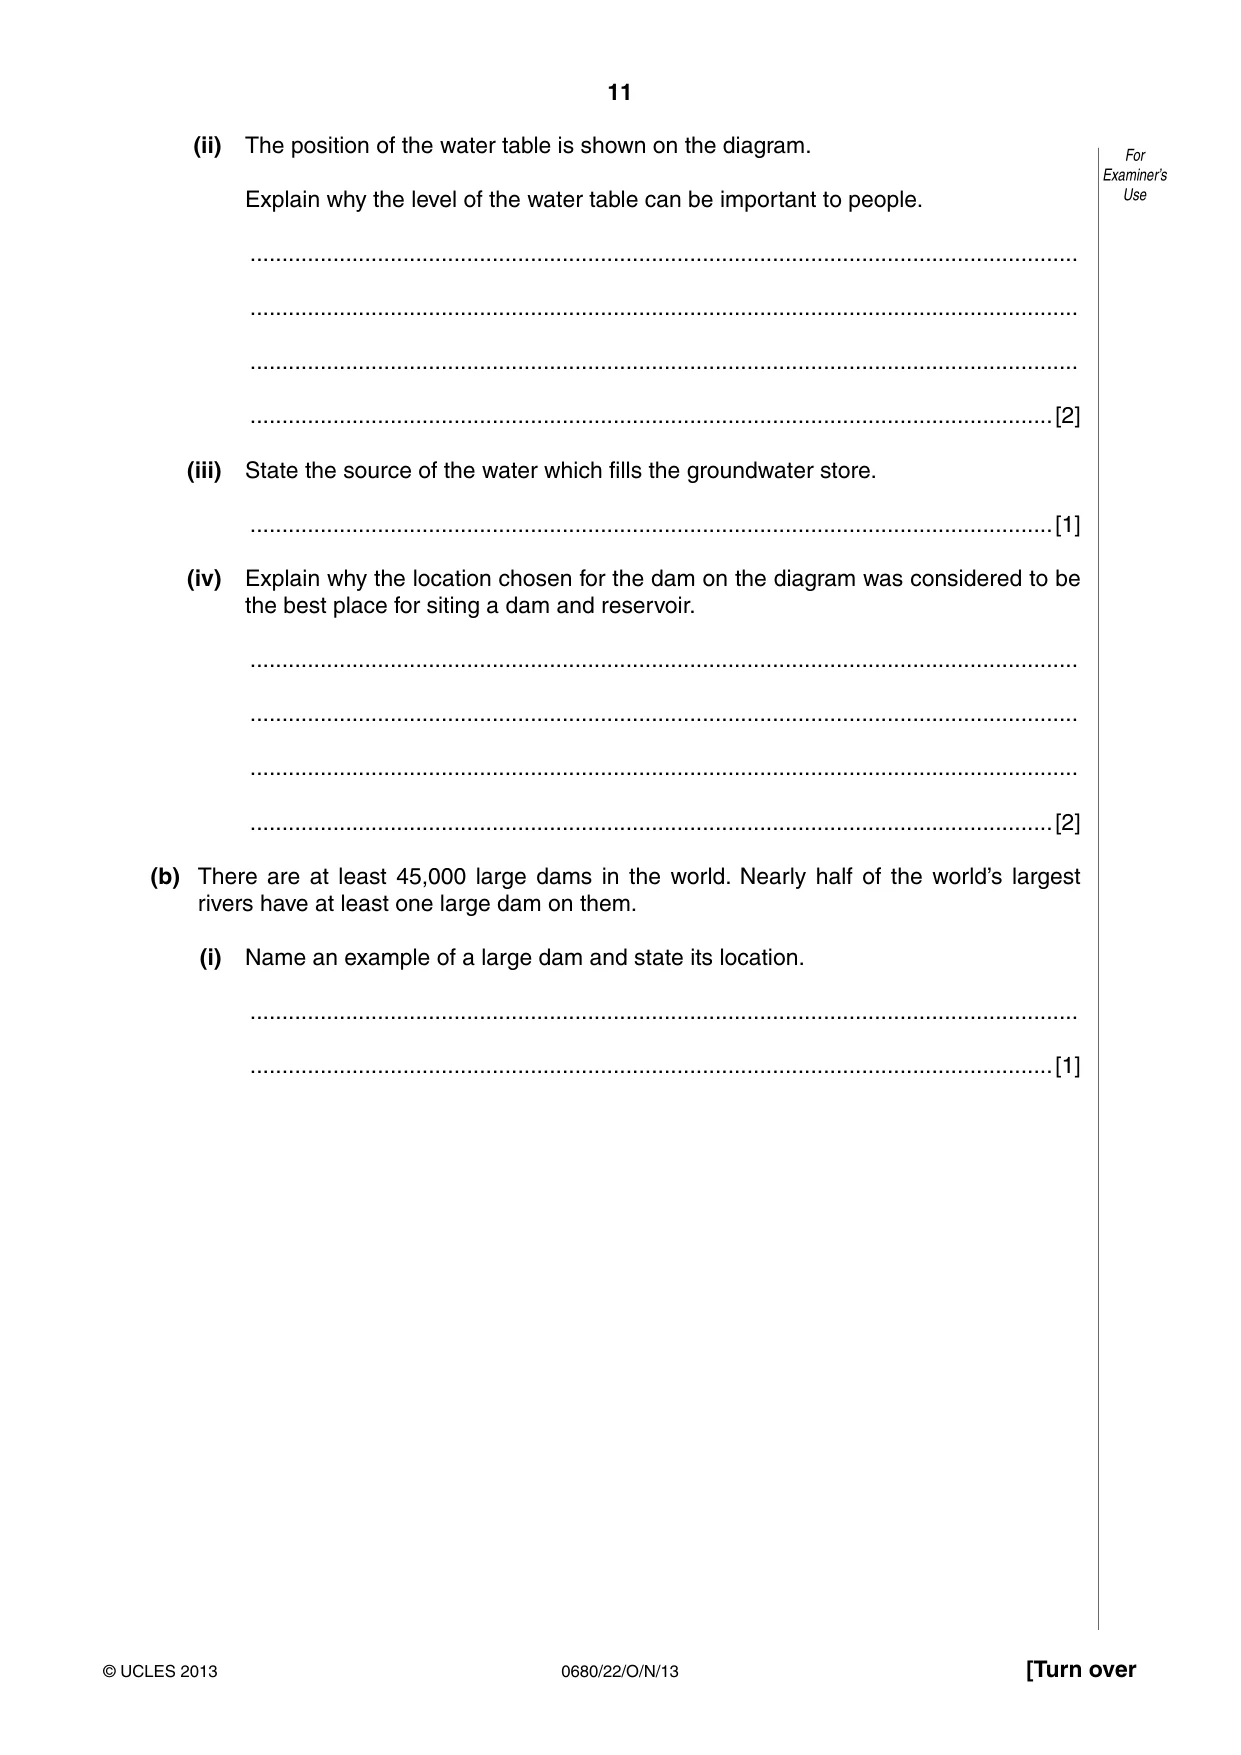
11 0680/22/O/N/13 © UCLES 2013 [Turn over For Examiner’s Use (ii) The position of the water table is shown on the diagram. Explain why the level of the water table can be important to people. … … … …[2] (iii) State the source of the water which fills the groundwater store. …[1] (iv) Explain why the location chosen for the dam on the diagram was considered to be the best place for siting a dam and reservoir. … … … …[2] (b) There are at least 45,000 large dams in the world. Nearly half of the world’s largest rivers have at least one large dam on them. (i) Name an example of a large dam and state its location. … …[1]
Question paper, page 12
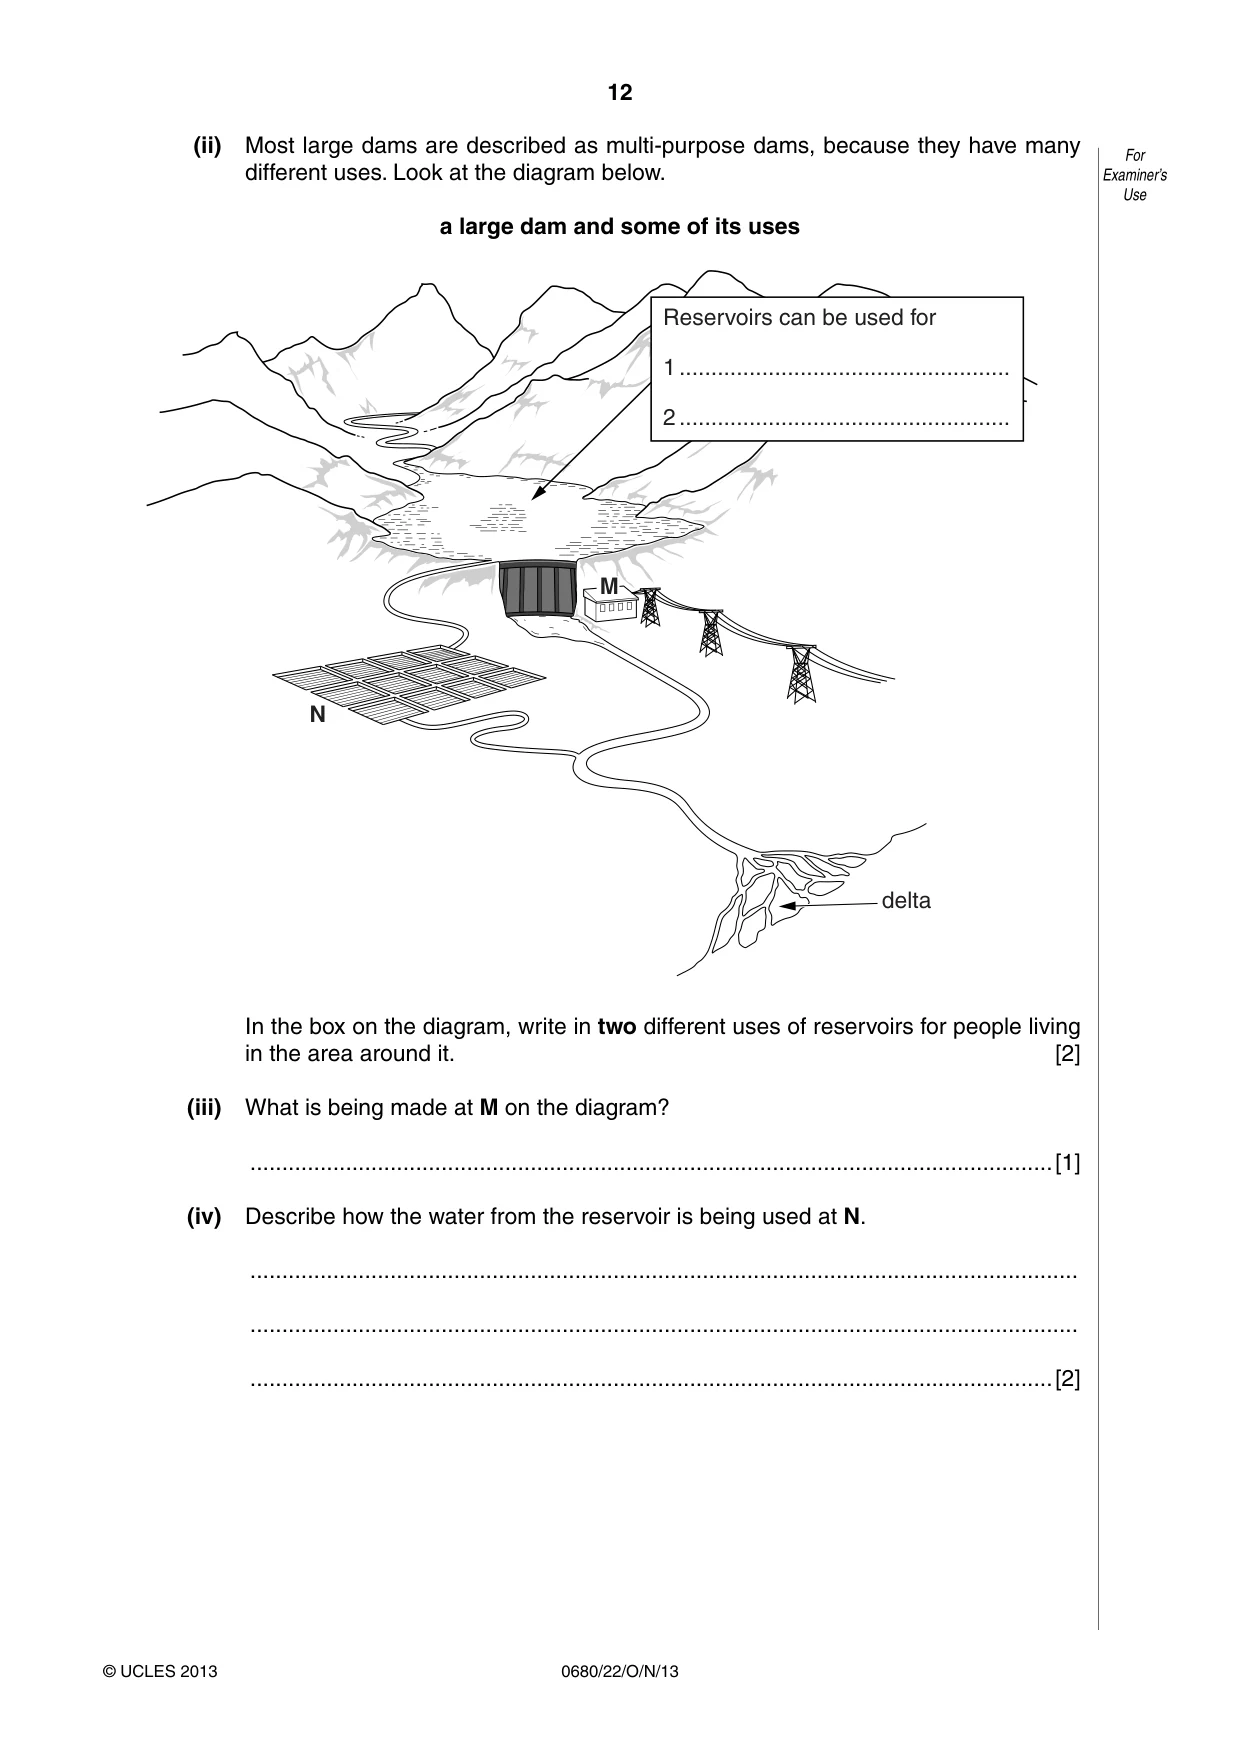
12 0680/22/O/N/13 © UCLES 2013 For Examiner’s Use (ii) Most large dams are described as multi-purpose dams, because they have many different uses. Look at the diagram below. a large dam and some of its uses Reservoirs can be used for 1 … 2 … M N delta In the box on the diagram, write in two different uses of reservoirs for people living in the area around it. [2] (iii) What is being made at M on the diagram? …[1] (iv) Describe how the water from the reservoir is being used at N. … … …[2]
Question paper, page 13
13 0680/22/O/N/13 © UCLES 2013 [Turn over QUESTION 2(c) STARTS ON PAGE 14
Question paper, page 14
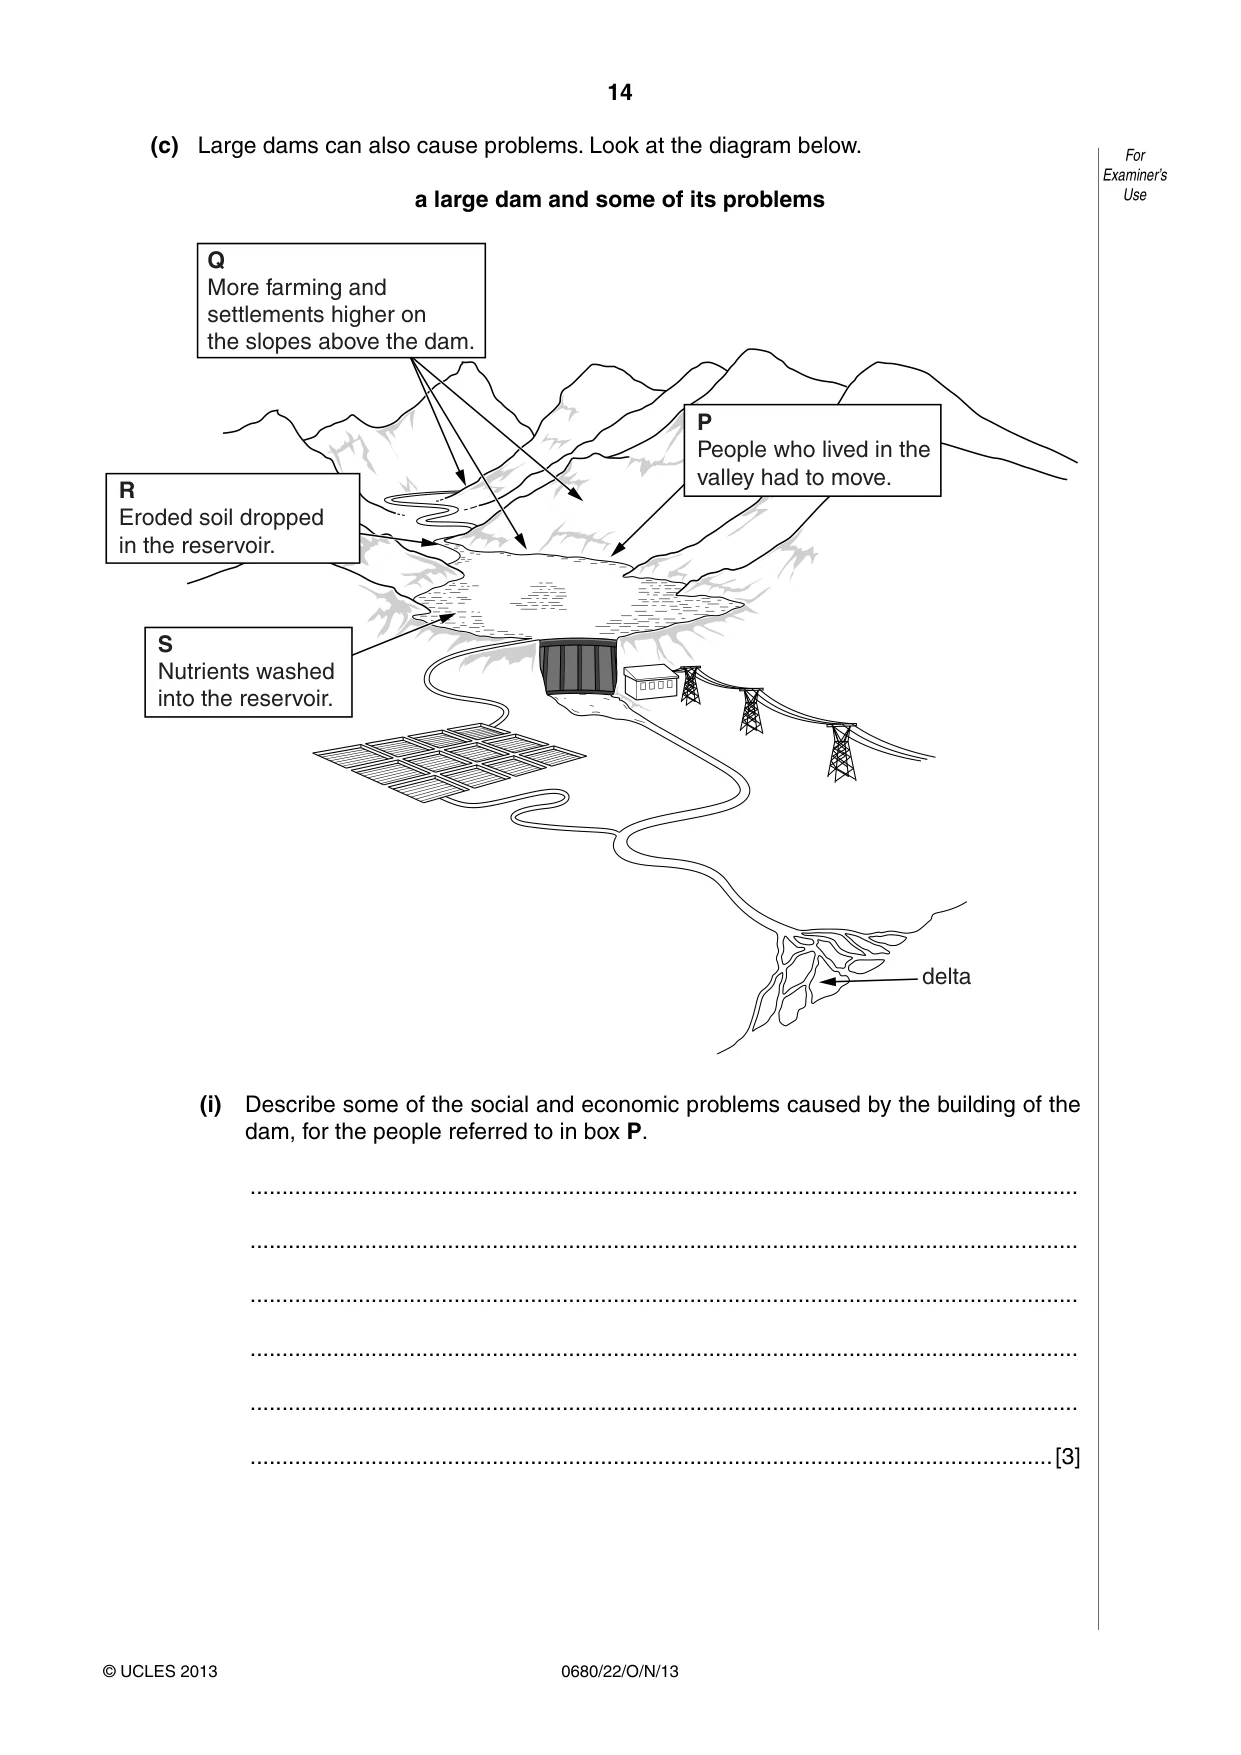
14 0680/22/O/N/13 © UCLES 2013 For Examiner’s Use (c) Large dams can also cause problems. Look at the diagram below. a large dam and some of its problems P People who lived in the valley had to move. delta R Eroded soil dropped in the reservoir. S Nutrients washed into the reservoir. Q More farming and settlements higher on the slopes above the dam. (i) Describe some of the social and economic problems caused by the building of the dam, for the people referred to in box P. … … … … … …[3]
Question paper, page 15
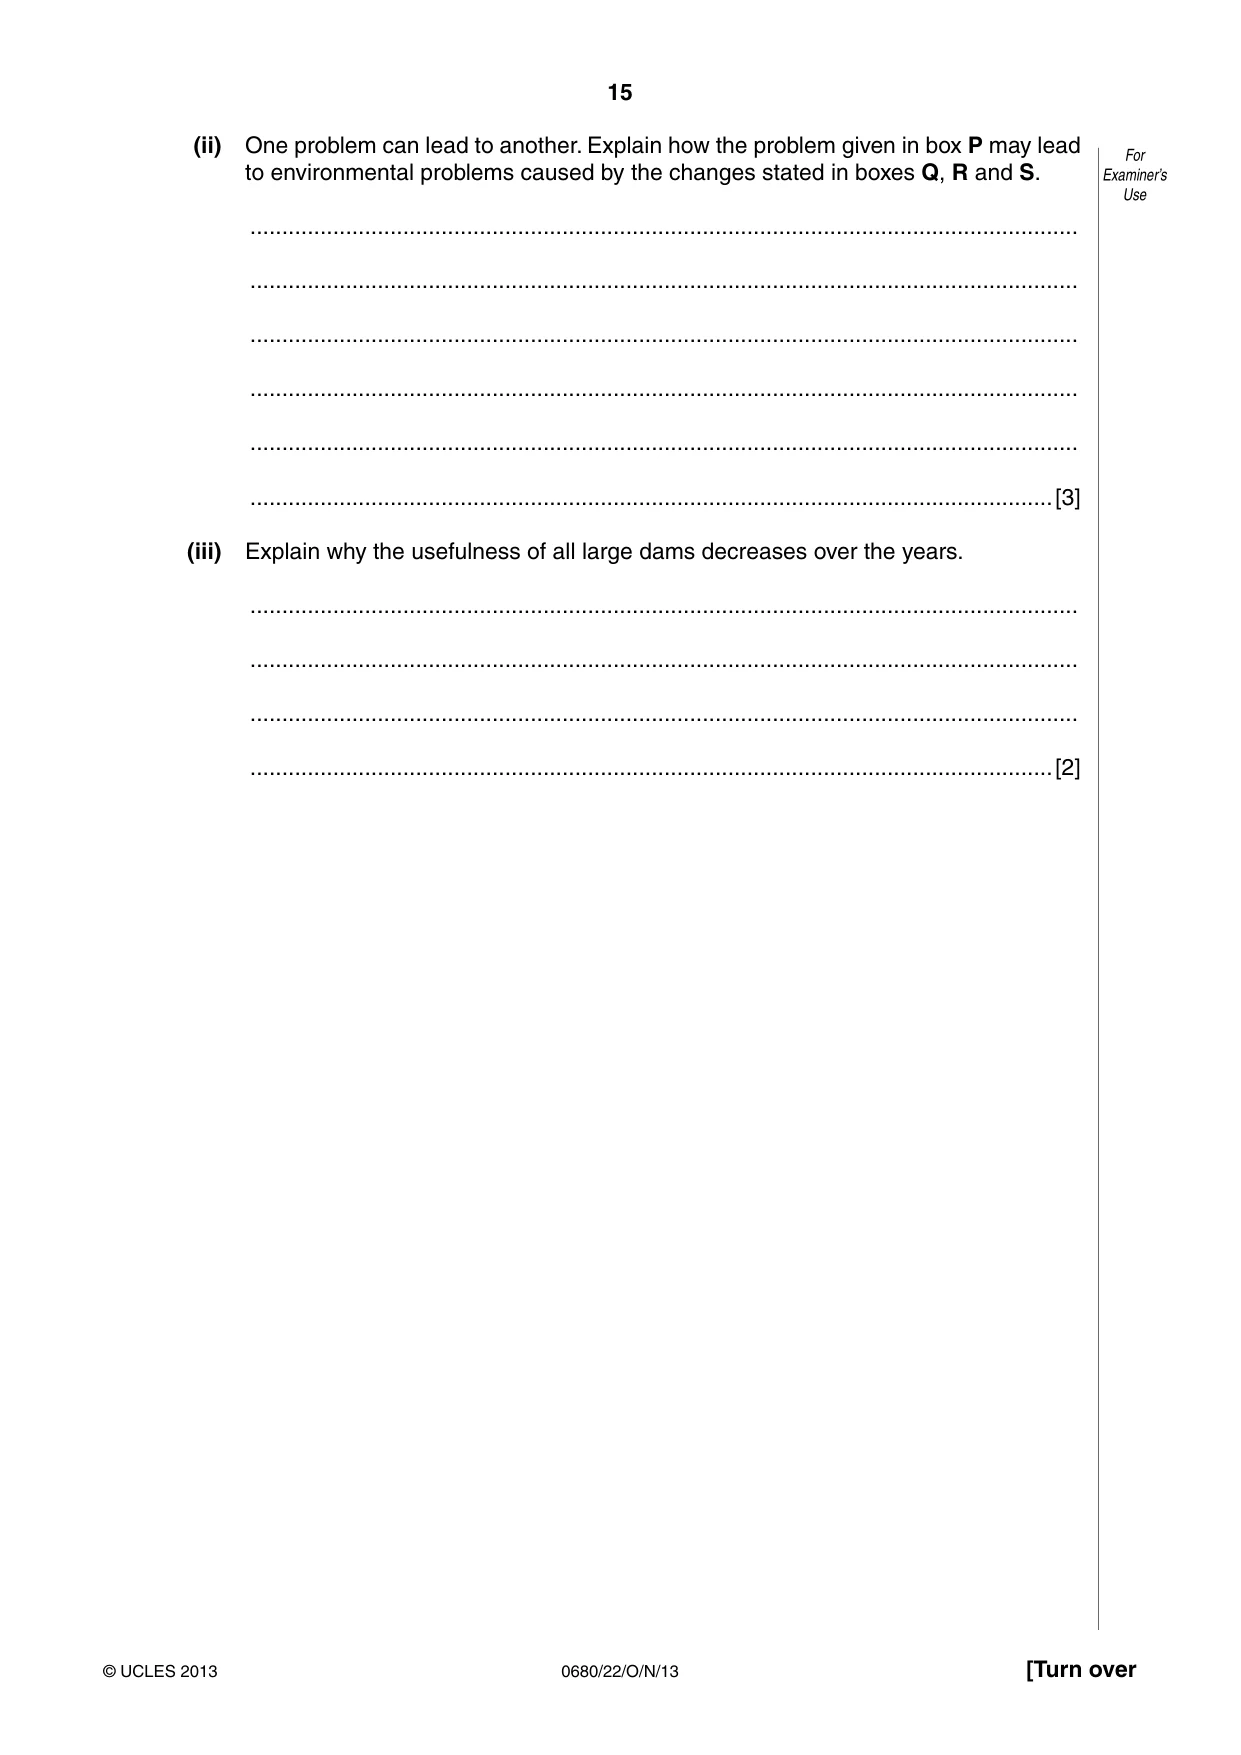
15 0680/22/O/N/13 © UCLES 2013 [Turn over For Examiner’s Use (ii) One problem can lead to another. Explain how the problem given in box P may lead to environmental problems caused by the changes stated in boxes Q, R and S. … … … … … …[3] (iii) Explain why the usefulness of all large dams decreases over the years. … … … …[2]
Question paper, page 16
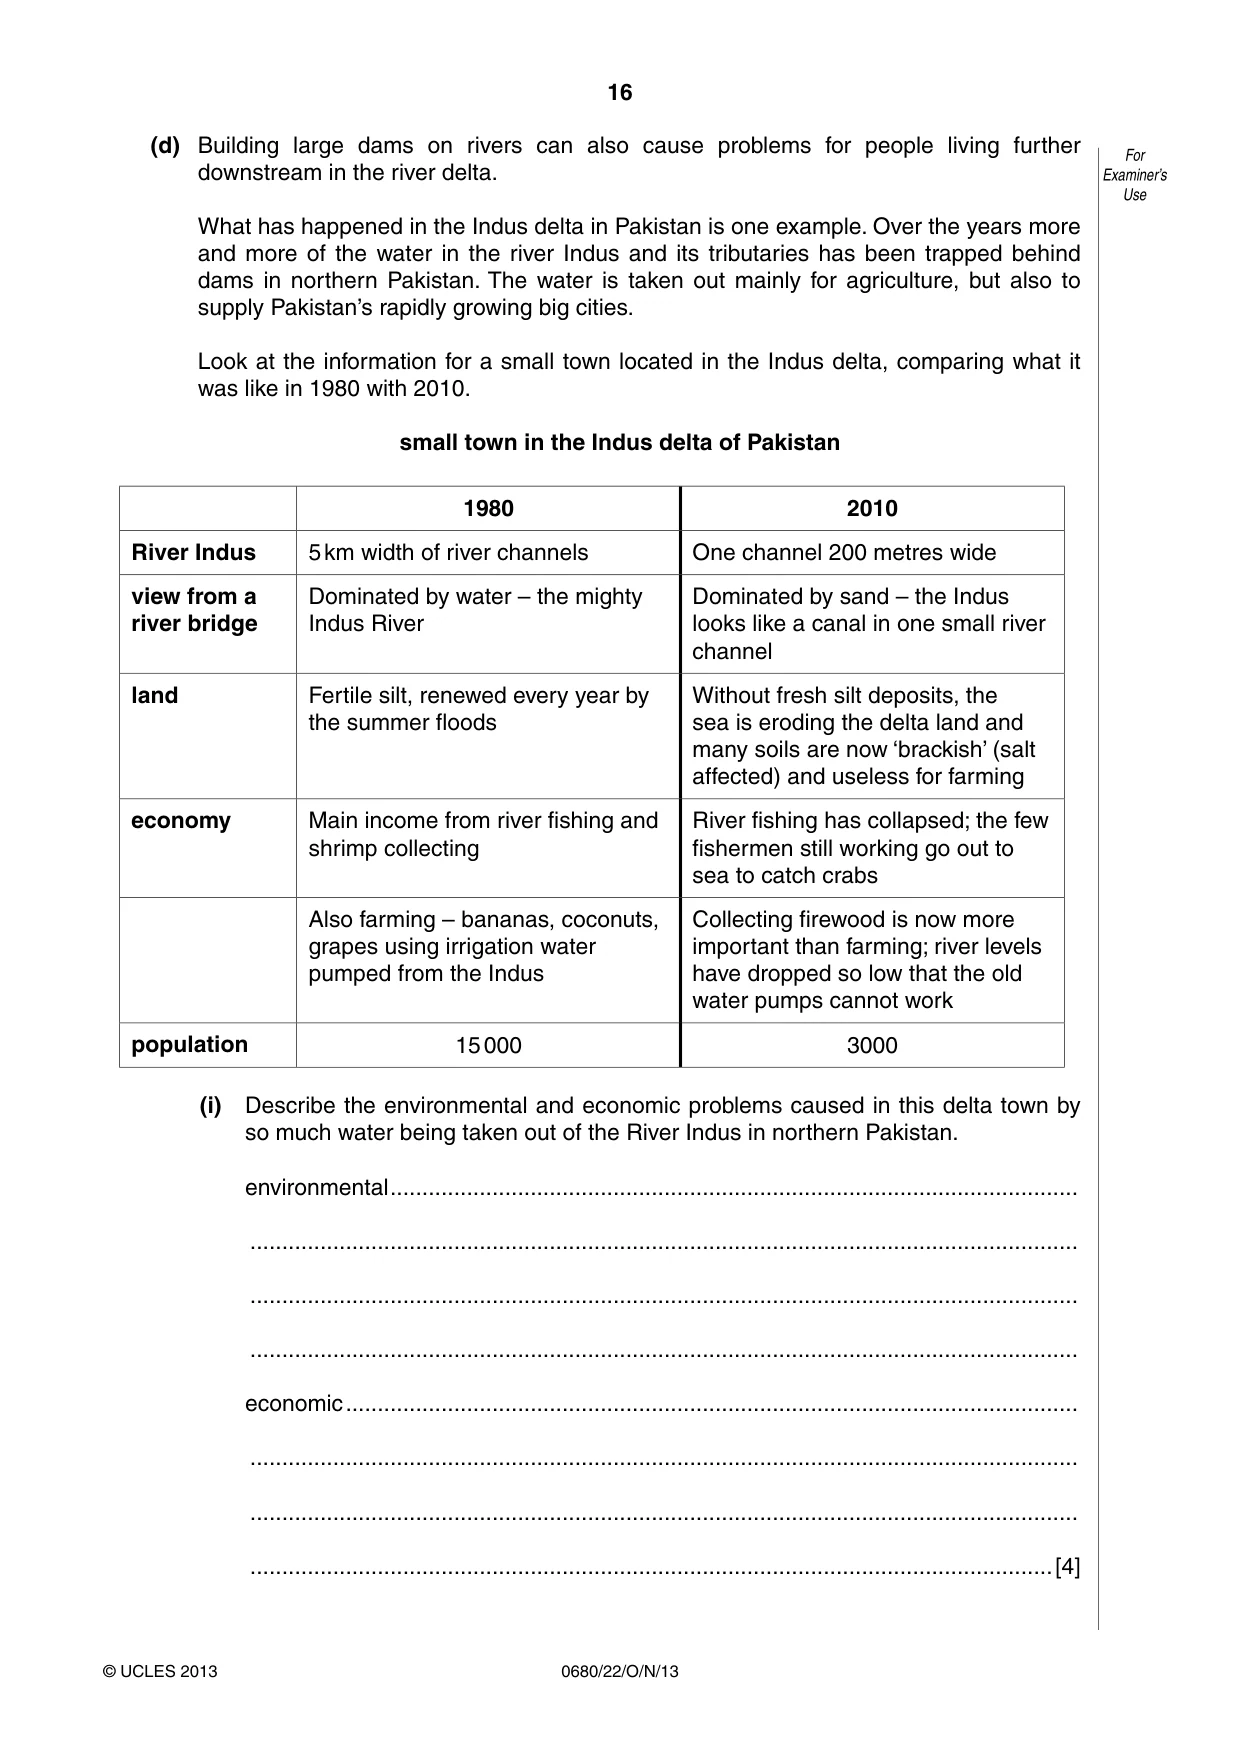
16 0680/22/O/N/13 © UCLES 2013 For Examiner’s Use (d) Building large dams on rivers can also cause problems for people living further downstream in the river delta. What has happened in the Indus delta in Pakistan is one example. Over the years more and more of the water in the river Indus and its tributaries has been trapped behind dams in northern Pakistan. The water is taken out mainly for agriculture, but also to supply Pakistan’s rapidly growing big cities. Look at the information for a small town located in the Indus delta, comparing what it was like in 1980 with 2010. small town in the Indus delta of Pakistan 1980 2010 River Indus 5 km width of river channels One channel 200 metres wide view from a river bridge Dominated by water – the mighty Indus River Dominated by sand – the Indus looks like a canal in one small river channel land Fertile silt, renewed every year by the summer floods Without fresh silt deposits, the sea is eroding the delta land and many soils are now ‘brackish’ (salt affected) and useless for farming economy Main income from river fishing and shrimp collecting River fishing has collapsed; the few fishermen still working go out to sea to catch crabs Also farming – bananas, coconuts, grapes using irrigation water pumped from the Indus Collecting firewood is now more important than farming; river levels have dropped so low that the old water pumps cannot work population 15 000 3000 (i) Describe the environmental and economic problems caused in this delta town by so much water being taken out of the River Indus in northern Pakistan. environmental … … … … economic … … … …[4]
Question paper, page 17
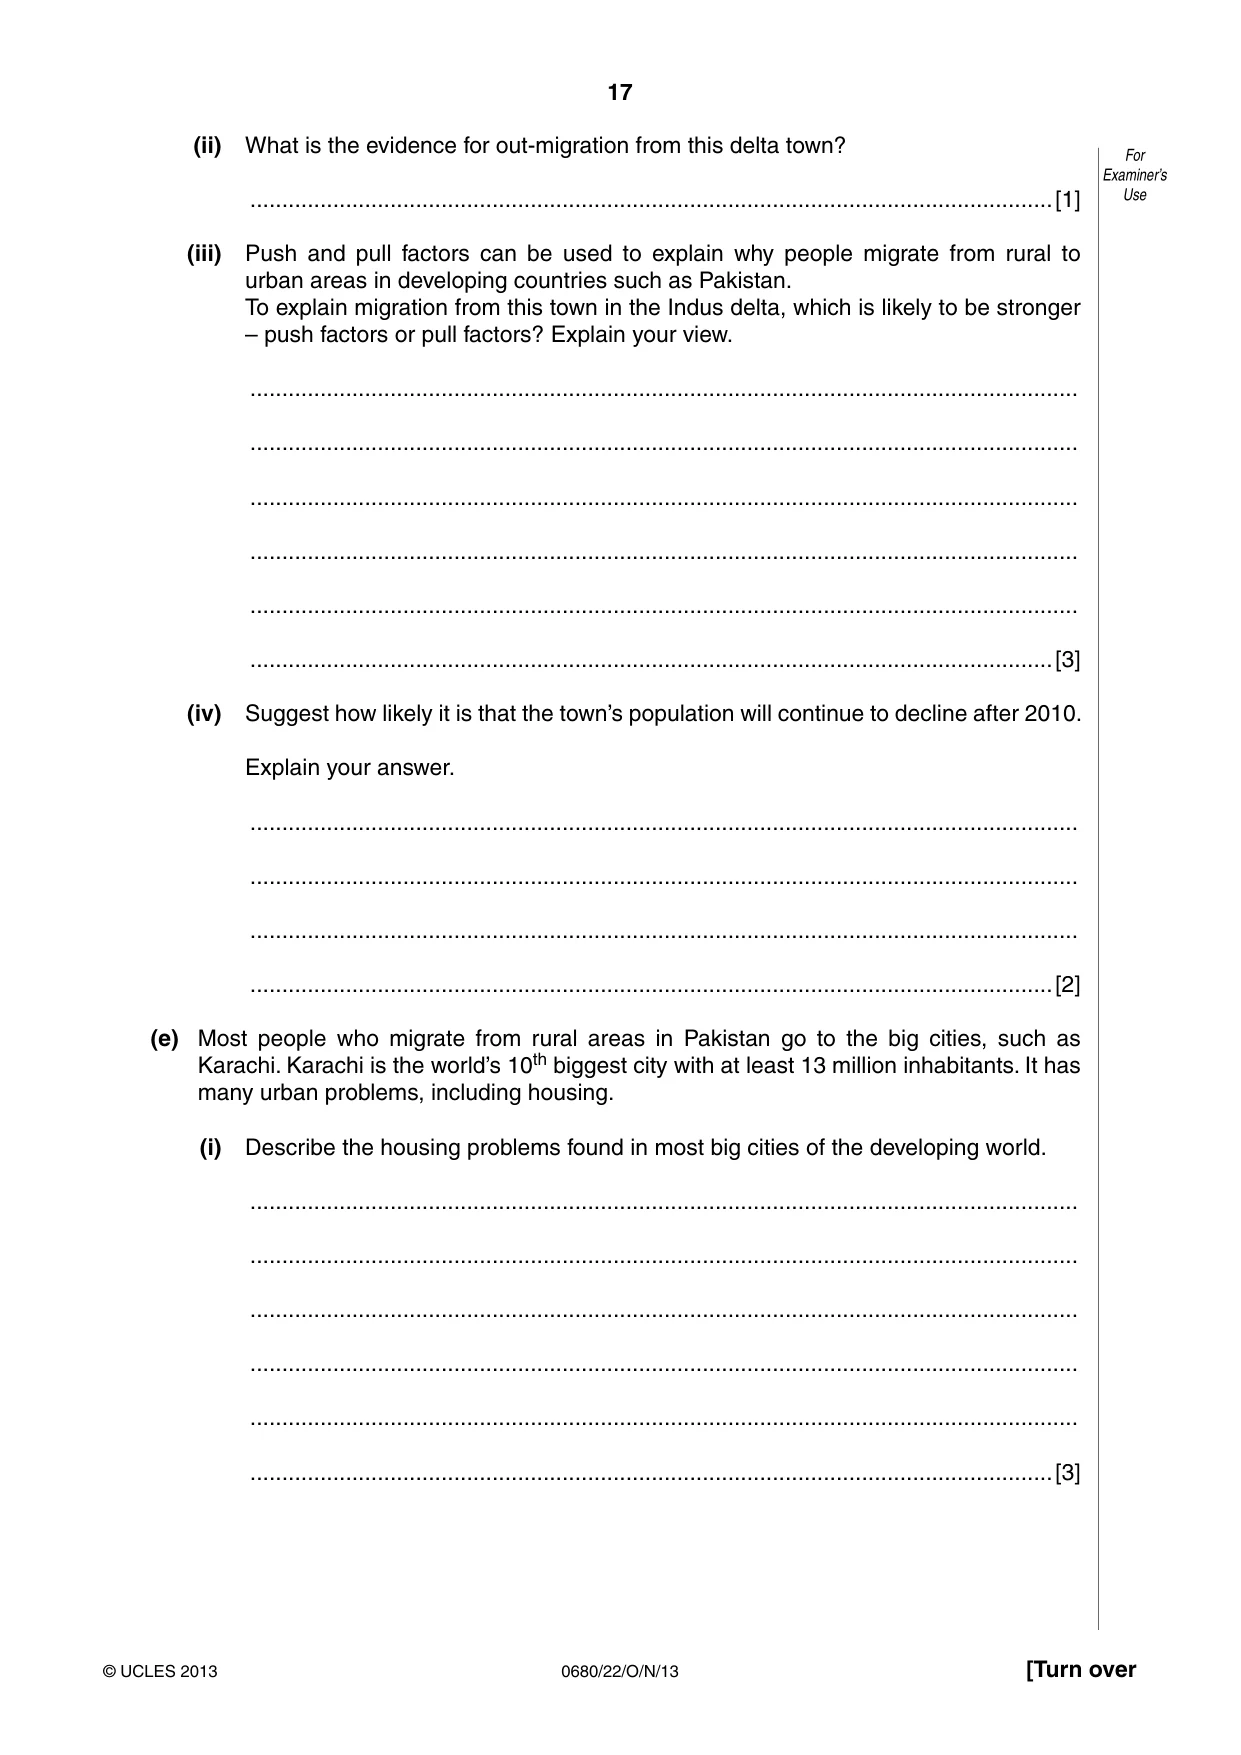
17 0680/22/O/N/13 © UCLES 2013 [Turn over For Examiner’s Use (ii) What is the evidence for out-migration from this delta town? …[1] (iii) Push and pull factors can be used to explain why people migrate from rural to urban areas in developing countries such as Pakistan. To explain migration from this town in the Indus delta, which is likely to be stronger – push factors or pull factors? Explain your view. … … … … … …[3] (iv) Suggest how likely it is that the town’s population will continue to decline after 2010. Explain your answer. … … … …[2] (e) Most people who migrate from rural areas in Pakistan go to the big cities, such as Karachi. Karachi is the world’s 10th biggest city with at least 13 million inhabitants. It has many urban problems, including housing. (i) Describe the housing problems found in most big cities of the developing world. … … … … … …[3]
Question paper, page 18
18 0680/22/O/N/13 © UCLES 2013 For Examiner’s Use (ii) Choose one city in the developing world. What strategies are being used to manage its housing problems and how successful have they been? name of city … strategies and their success … … … … … … … … … …[5] [Total: 40]
Question paper, page 19
19 0680/22/O/N/13 © UCLES 2013 BLANK PAGE
Question paper, page 20
20 0680/22/O/N/13 © UCLES 2013 Permission to reproduce items where third-party owned material protected by copyright is included has been sought and cleared where possible. Every reasonable effort has been made by the publisher (UCLES) to trace copyright holders, but if any items requiring clearance have unwittingly been included, the publisher will be pleased to make amends at the earliest possible opportunity. University of Cambridge International Examinations is part of the Cambridge Assessment Group. Cambridge Assessment is the brand name of University of Cambridge Local Examinations Syndicate (UCLES), which is itself a department of the University of Cambridge. BLANK PAGE
Mark scheme, page 1
CAMBRIDGE INTERNATIONAL EXAMINATIONS International General Certificate of Secondary Education MARK SCHEME for the October/November 2013 series 0680 ENVIRONMENTAL MANAGEMENT 0680/22 Paper 2, maximum raw mark 80 This mark scheme is published as an aid to teachers and candidates, to indicate the requirements of the examination. It shows the basis on which Examiners were instructed to award marks. It does not indicate the details of the discussions that took place at an Examiners’ meeting before marking began, which would have considered the acceptability of alternative answers. Mark schemes should be read in conjunction with the question paper and the Principal Examiner Report for Teachers. Cambridge will not enter into discussions about these mark schemes. Cambridge is publishing the mark schemes for the October/November 2013 series for most IGCSE, GCE Advanced Level and Advanced Subsidiary Level components and some Ordinary Level components.
Mark scheme, page 2
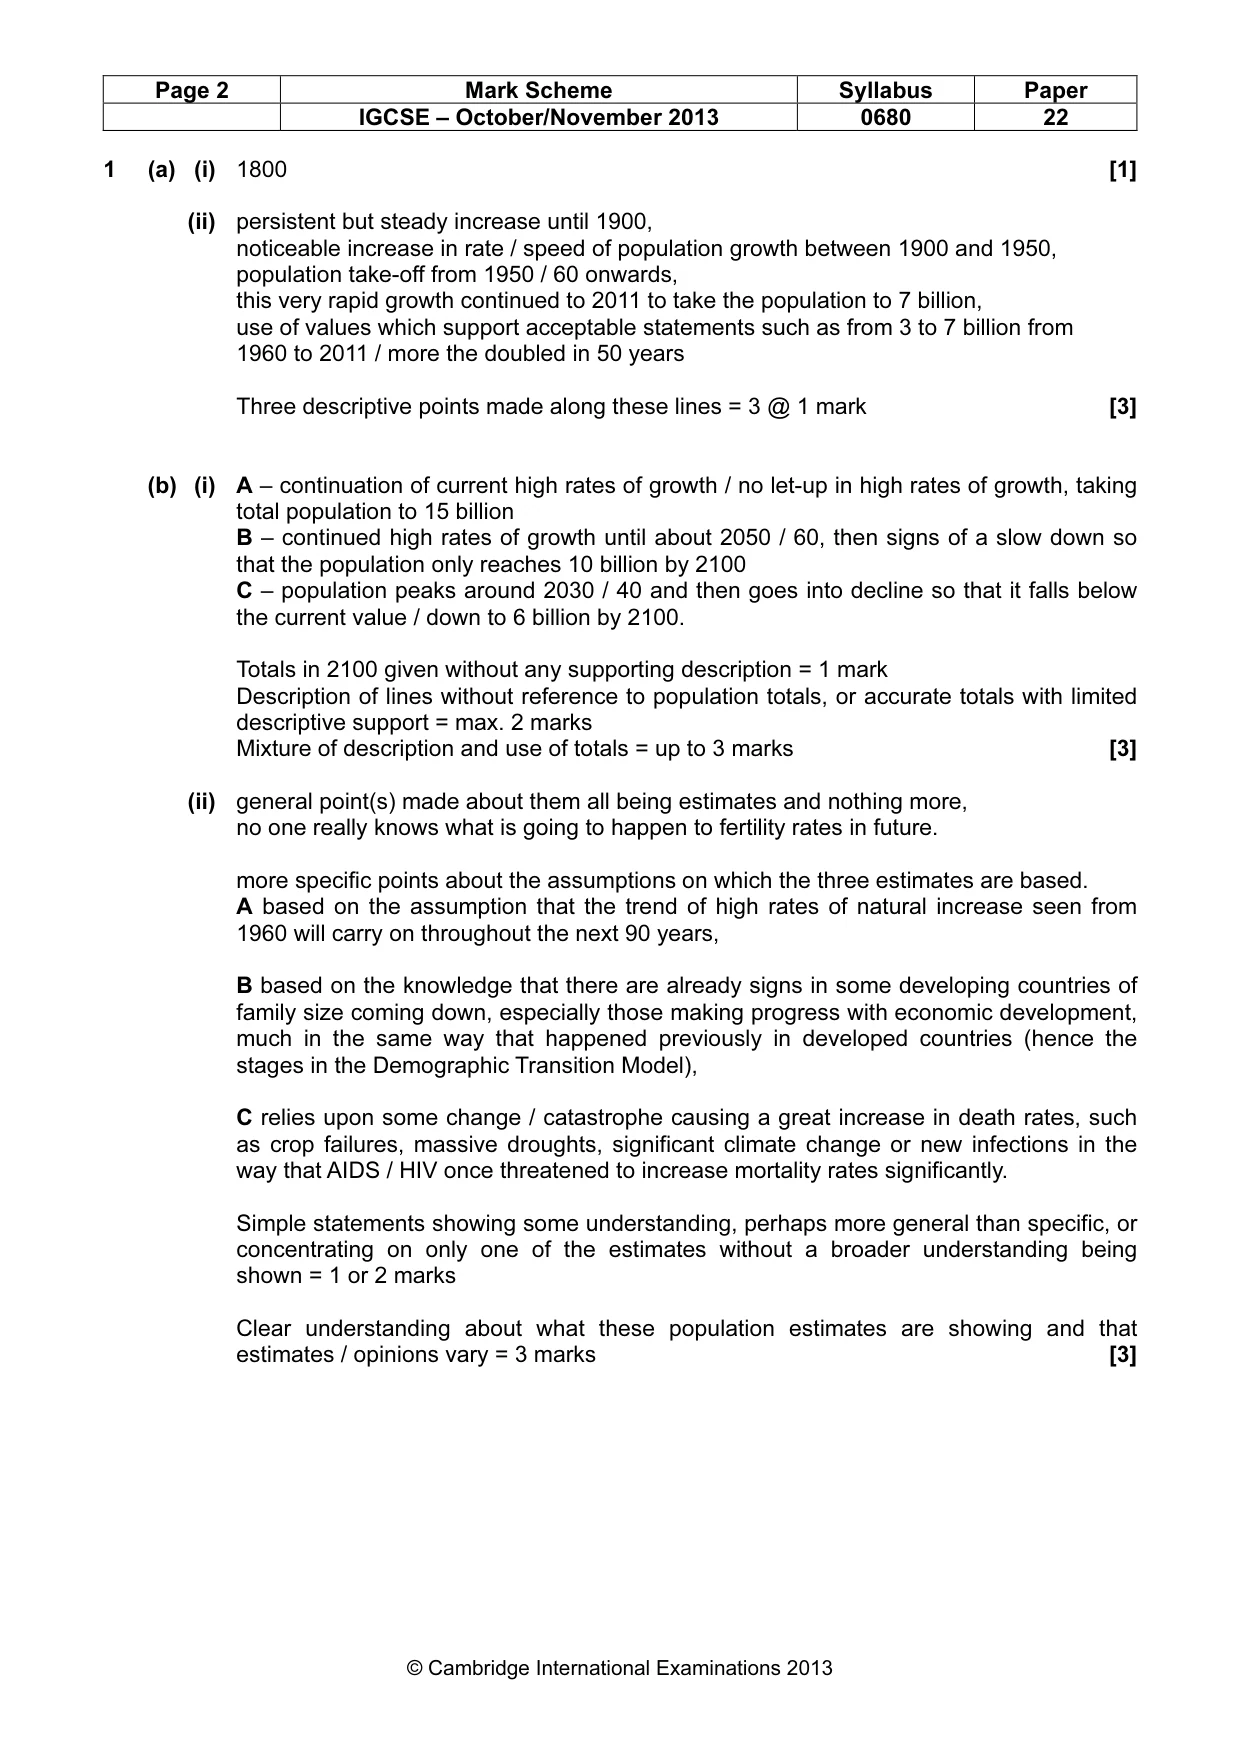
Page 2 Mark Scheme Syllabus Paper IGCSE – October/November 2013 0680 22 © Cambridge International Examinations 2013 1 (a) (i) 1800 [1] (ii) persistent but steady increase until 1900, noticeable increase in rate / speed of population growth between 1900 and 1950, population take-off from 1950 / 60 onwards, this very rapid growth continued to 2011 to take the population to 7 billion, use of values which support acceptable statements such as from 3 to 7 billion from 1960 to 2011 / more the doubled in 50 years Three descriptive points made along these lines = 3 @ 1 mark [3] (b) (i) A – continuation of current high rates of growth / no let-up in high rates of growth, taking total population to 15 billion B – continued high rates of growth until about 2050 / 60, then signs of a slow down so that the population only reaches 10 billion by 2100 C – population peaks around 2030 / 40 and then goes into decline so that it falls below the current value / down to 6 billion by 2100. Totals in 2100 given without any supporting description = 1 mark Description of lines without reference to population totals, or accurate totals with limited descriptive support = max. 2 marks Mixture of description and use of totals = up to 3 marks [3] (ii) general point(s) made about them all being estimates and nothing more, no one really knows what is going to happen to fertility rates in future. more specific points about the assumptions on which the three estimates are based. A based on the assumption that the trend of high rates of natural increase seen from 1960 will carry on throughout the next 90 years, B based on the knowledge that there are already signs in some developing countries of family size coming down, especially those making progress with economic development, much in the same way that happened previously in developed countries (hence the stages in the Demographic Transition Model), C relies upon some change / catastrophe causing a great increase in death rates, such as crop failures, massive droughts, significant climate change or new infections in the way that AIDS / HIV once threatened to increase mortality rates significantly. Simple statements showing some understanding, perhaps more general than specific, or concentrating on only one of the estimates without a broader understanding being shown = 1 or 2 marks Clear understanding about what these population estimates are showing and that estimates / opinions vary = 3 marks [3]
Mark scheme, page 3
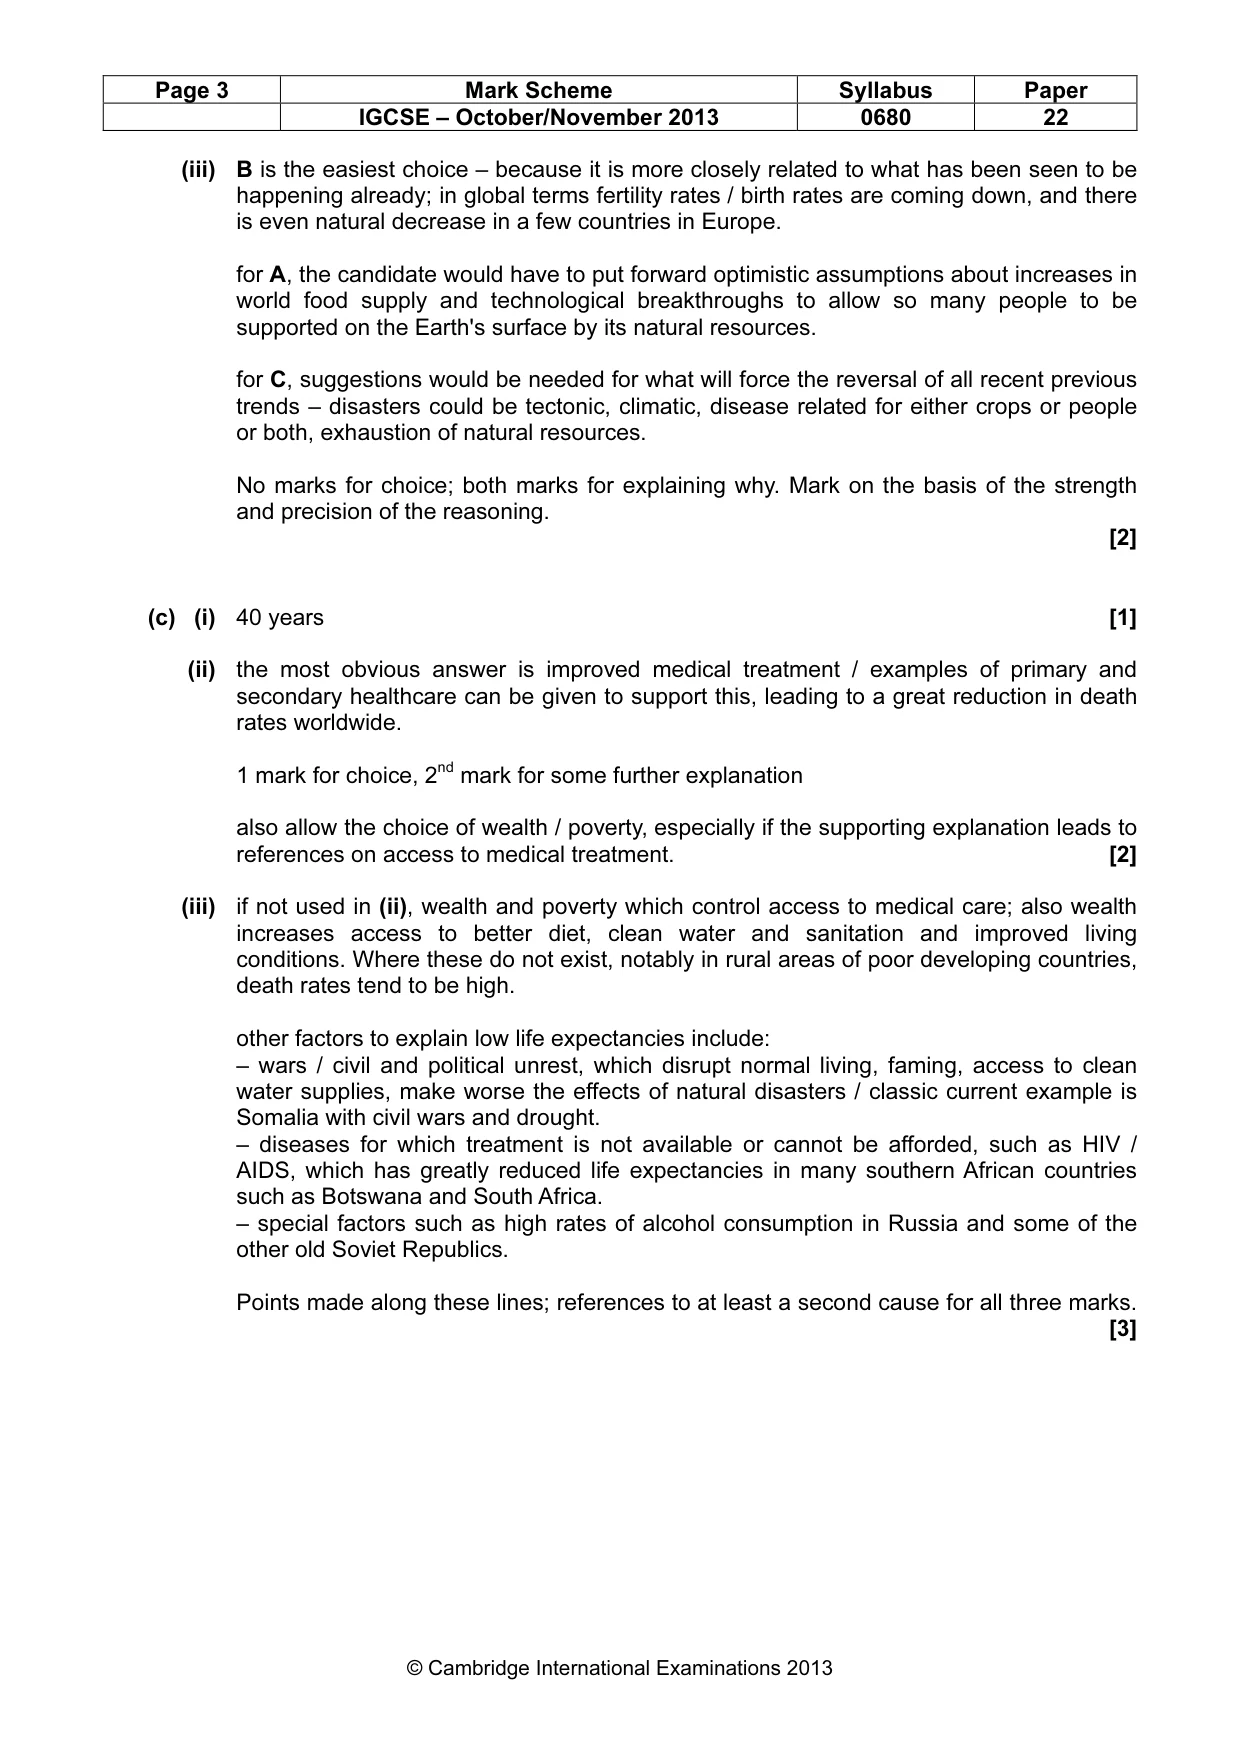
Page 3 Mark Scheme Syllabus Paper IGCSE – October/November 2013 0680 22 © Cambridge International Examinations 2013 (iii) B is the easiest choice – because it is more closely related to what has been seen to be happening already; in global terms fertility rates / birth rates are coming down, and there is even natural decrease in a few countries in Europe. for A, the candidate would have to put forward optimistic assumptions about increases in world food supply and technological breakthroughs to allow so many people to be supported on the Earth's surface by its natural resources. for C, suggestions would be needed for what will force the reversal of all recent previous trends – disasters could be tectonic, climatic, disease related for either crops or people or both, exhaustion of natural resources. No marks for choice; both marks for explaining why. Mark on the basis of the strength and precision of the reasoning. [2] (c) (i) 40 years [1] (ii) the most obvious answer is improved medical treatment / examples of primary and secondary healthcare can be given to support this, leading to a great reduction in death rates worldwide. 1 mark for choice, 2nd mark for some further explanation also allow the choice of wealth / poverty, especially if the supporting explanation leads to references on access to medical treatment. [2] (iii) if not used in (ii), wealth and poverty which control access to medical care; also wealth increases access to better diet, clean water and sanitation and improved living conditions. Where these do not exist, notably in rural areas of poor developing countries, death rates tend to be high. other factors to explain low life expectancies include: – wars / civil and political unrest, which disrupt normal living, faming, access to clean water supplies, make worse the effects of natural disasters / classic current example is Somalia with civil wars and drought. – diseases for which treatment is not available or cannot be afforded, such as HIV / AIDS, which has greatly reduced life expectancies in many southern African countries such as Botswana and South Africa. – special factors such as high rates of alcohol consumption in Russia and some of the other old Soviet Republics. Points made along these lines; references to at least a second cause for all three marks. [3]
Mark scheme, page 4
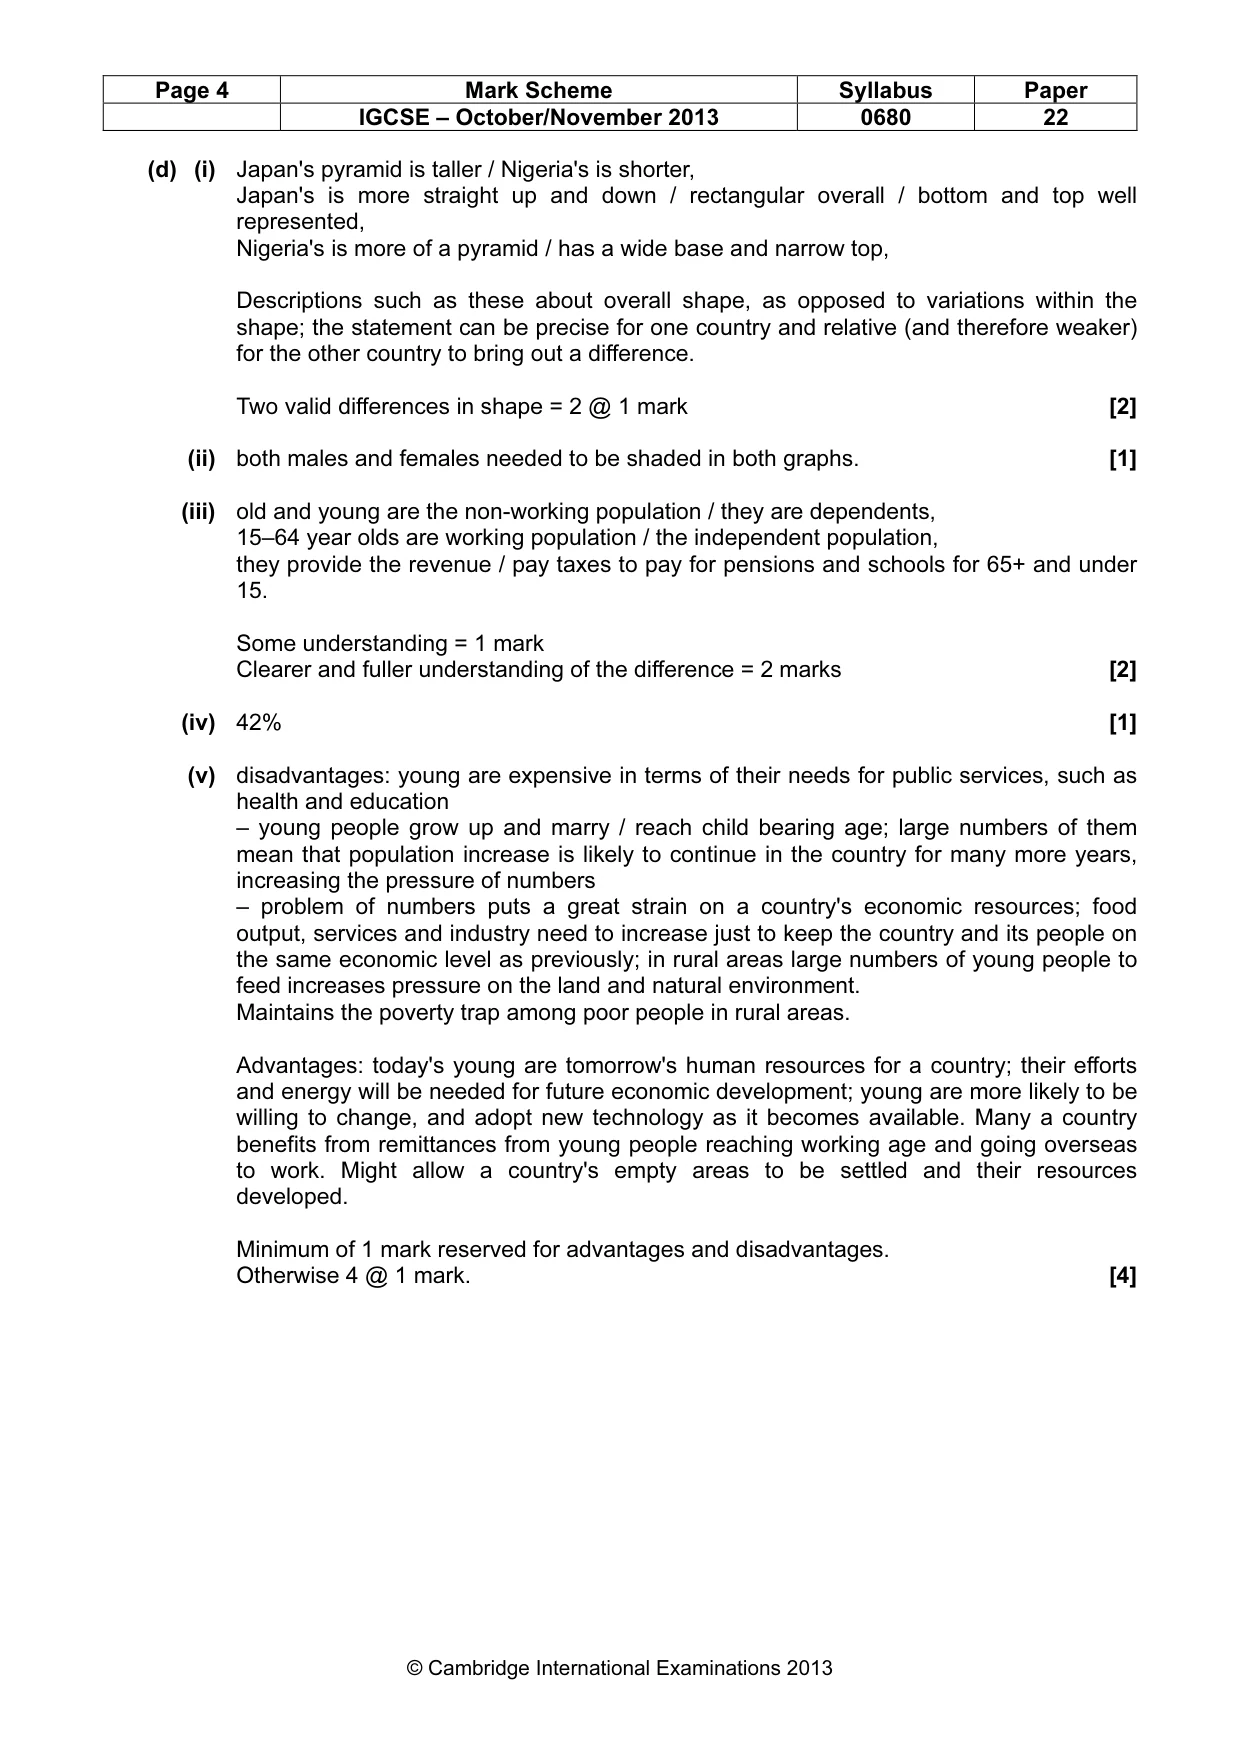
Page 4 Mark Scheme Syllabus Paper IGCSE – October/November 2013 0680 22 © Cambridge International Examinations 2013 (d) (i) Japan's pyramid is taller / Nigeria's is shorter, Japan's is more straight up and down / rectangular overall / bottom and top well represented, Nigeria's is more of a pyramid / has a wide base and narrow top, Descriptions such as these about overall shape, as opposed to variations within the shape; the statement can be precise for one country and relative (and therefore weaker) for the other country to bring out a difference. Two valid differences in shape = 2 @ 1 mark [2] (ii) both males and females needed to be shaded in both graphs. [1] (iii) old and young are the non-working population / they are dependents, 15–64 year olds are working population / the independent population, they provide the revenue / pay taxes to pay for pensions and schools for 65+ and under 15. Some understanding = 1 mark Clearer and fuller understanding of the difference = 2 marks [2] (iv) 42% [1] (v) disadvantages: young are expensive in terms of their needs for public services, such as health and education – young people grow up and marry / reach child bearing age; large numbers of them mean that population increase is likely to continue in the country for many more years, increasing the pressure of numbers – problem of numbers puts a great strain on a country's economic resources; food output, services and industry need to increase just to keep the country and its people on the same economic level as previously; in rural areas large numbers of young people to feed increases pressure on the land and natural environment. Maintains the poverty trap among poor people in rural areas. Advantages: today's young are tomorrow's human resources for a country; their efforts and energy will be needed for future economic development; young are more likely to be willing to change, and adopt new technology as it becomes available. Many a country benefits from remittances from young people reaching working age and going overseas to work. Might allow a country's empty areas to be settled and their resources developed. Minimum of 1 mark reserved for advantages and disadvantages. Otherwise 4 @ 1 mark. [4]
Mark scheme, page 5
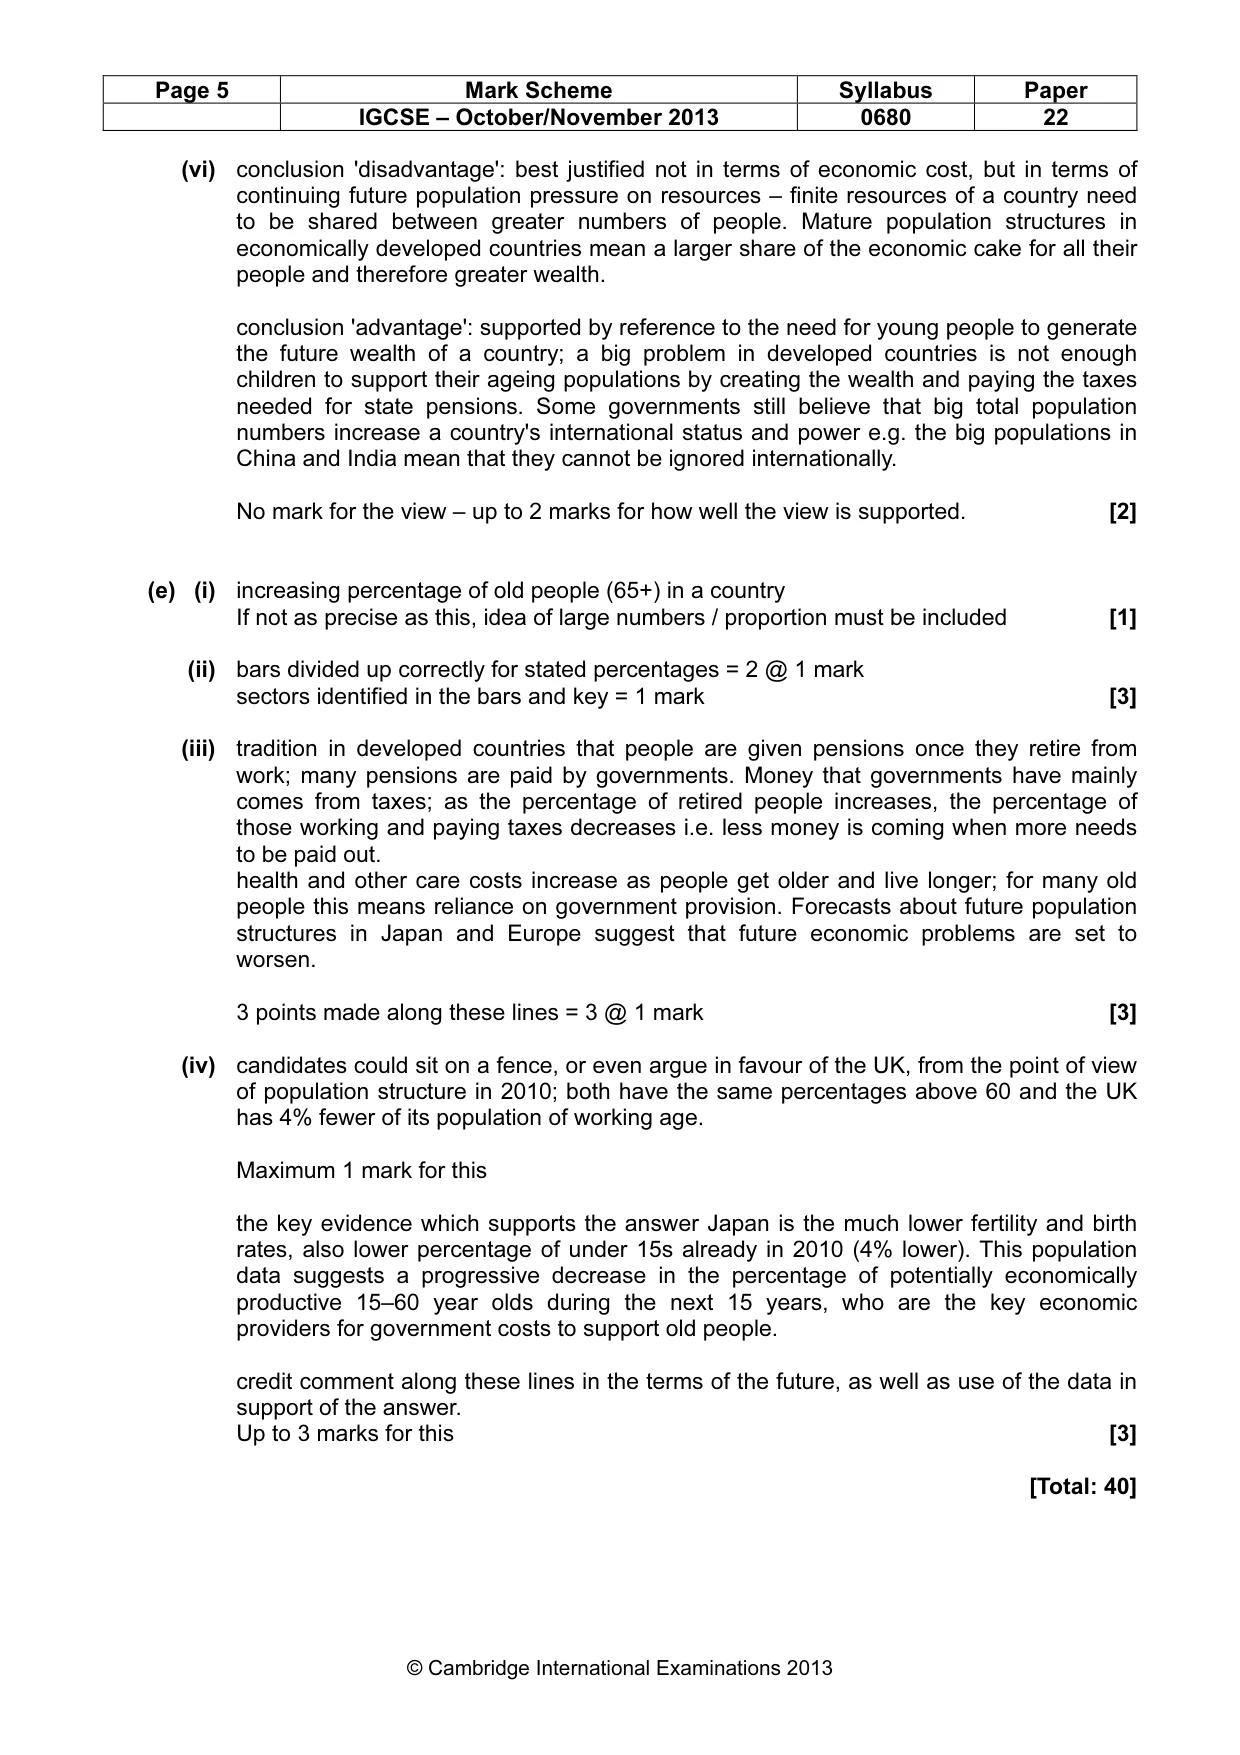
Page 5 Mark Scheme Syllabus Paper IGCSE – October/November 2013 0680 22 © Cambridge International Examinations 2013 (vi) conclusion 'disadvantage': best justified not in terms of economic cost, but in terms of continuing future population pressure on resources – finite resources of a country need to be shared between greater numbers of people. Mature population structures in economically developed countries mean a larger share of the economic cake for all their people and therefore greater wealth. conclusion 'advantage': supported by reference to the need for young people to generate the future wealth of a country; a big problem in developed countries is not enough children to support their ageing populations by creating the wealth and paying the taxes needed for state pensions. Some governments still believe that big total population numbers increase a country's international status and power e.g. the big populations in China and India mean that they cannot be ignored internationally. No mark for the view – up to 2 marks for how well the view is supported. [2] (e) (i) increasing percentage of old people (65+) in a country If not as precise as this, idea of large numbers / proportion must be included [1] (ii) bars divided up correctly for stated percentages = 2 @ 1 mark sectors identified in the bars and key = 1 mark [3] (iii) tradition in developed countries that people are given pensions once they retire from work; many pensions are paid by governments. Money that governments have mainly comes from taxes; as the percentage of retired people increases, the percentage of those working and paying taxes decreases i.e. less money is coming when more needs to be paid out. health and other care costs increase as people get older and live longer; for many old people this means reliance on government provision. Forecasts about future population structures in Japan and Europe suggest that future economic problems are set to worsen. 3 points made along these lines = 3 @ 1 mark [3] (iv) candidates could sit on a fence, or even argue in favour of the UK, from the point of view of population structure in 2010; both have the same percentages above 60 and the UK has 4% fewer of its population of working age. Maximum 1 mark for this the key evidence which supports the answer Japan is the much lower fertility and birth rates, also lower percentage of under 15s already in 2010 (4% lower). This population data suggests a progressive decrease in the percentage of potentially economically productive 15–60 year olds during the next 15 years, who are the key economic providers for government costs to support old people. credit comment along these lines in the terms of the future, as well as use of the data in support of the answer. Up to 3 marks for this [3] [Total: 40]
Mark scheme, page 6
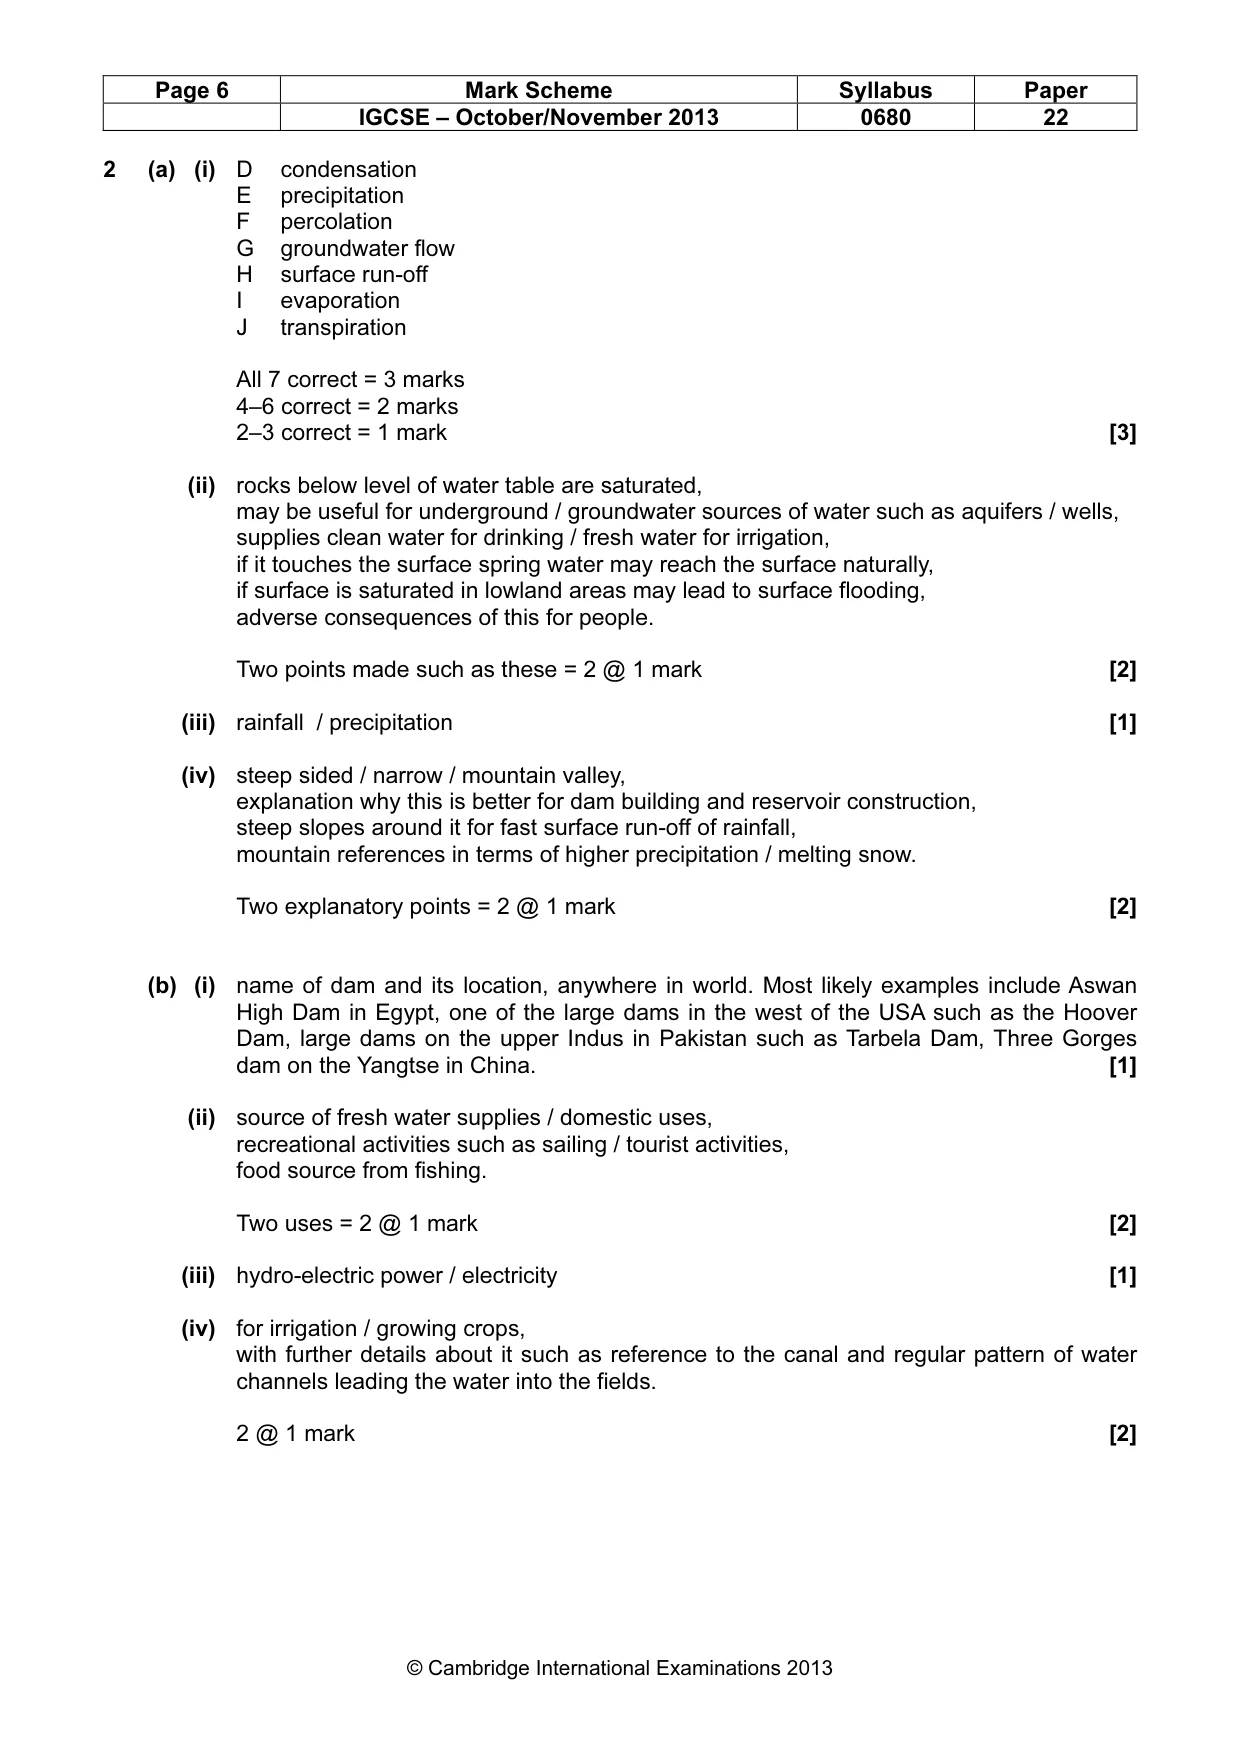
Page 6 Mark Scheme Syllabus Paper IGCSE – October/November 2013 0680 22 © Cambridge International Examinations 2013 2 (a) (i) D condensation E precipitation F percolation G groundwater flow H surface run-off I evaporation J transpiration All 7 correct = 3 marks 4–6 correct = 2 marks 2–3 correct = 1 mark [3] (ii) rocks below level of water table are saturated, may be useful for underground / groundwater sources of water such as aquifers / wells, supplies clean water for drinking / fresh water for irrigation, if it touches the surface spring water may reach the surface naturally, if surface is saturated in lowland areas may lead to surface flooding, adverse consequences of this for people. Two points made such as these = 2 @ 1 mark [2] (iii) rainfall / precipitation [1] (iv) steep sided / narrow / mountain valley, explanation why this is better for dam building and reservoir construction, steep slopes around it for fast surface run-off of rainfall, mountain references in terms of higher precipitation / melting snow. Two explanatory points = 2 @ 1 mark [2] (b) (i) name of dam and its location, anywhere in world. Most likely examples include Aswan High Dam in Egypt, one of the large dams in the west of the USA such as the Hoover Dam, large dams on the upper Indus in Pakistan such as Tarbela Dam, Three Gorges dam on the Yangtse in China. [1] (ii) source of fresh water supplies / domestic uses, recreational activities such as sailing / tourist activities, food source from fishing. Two uses = 2 @ 1 mark [2] (iii) hydro-electric power / electricity [1] (iv) for irrigation / growing crops, with further details about it such as reference to the canal and regular pattern of water channels leading the water into the fields. 2 @ 1 mark [2]
Mark scheme, page 7
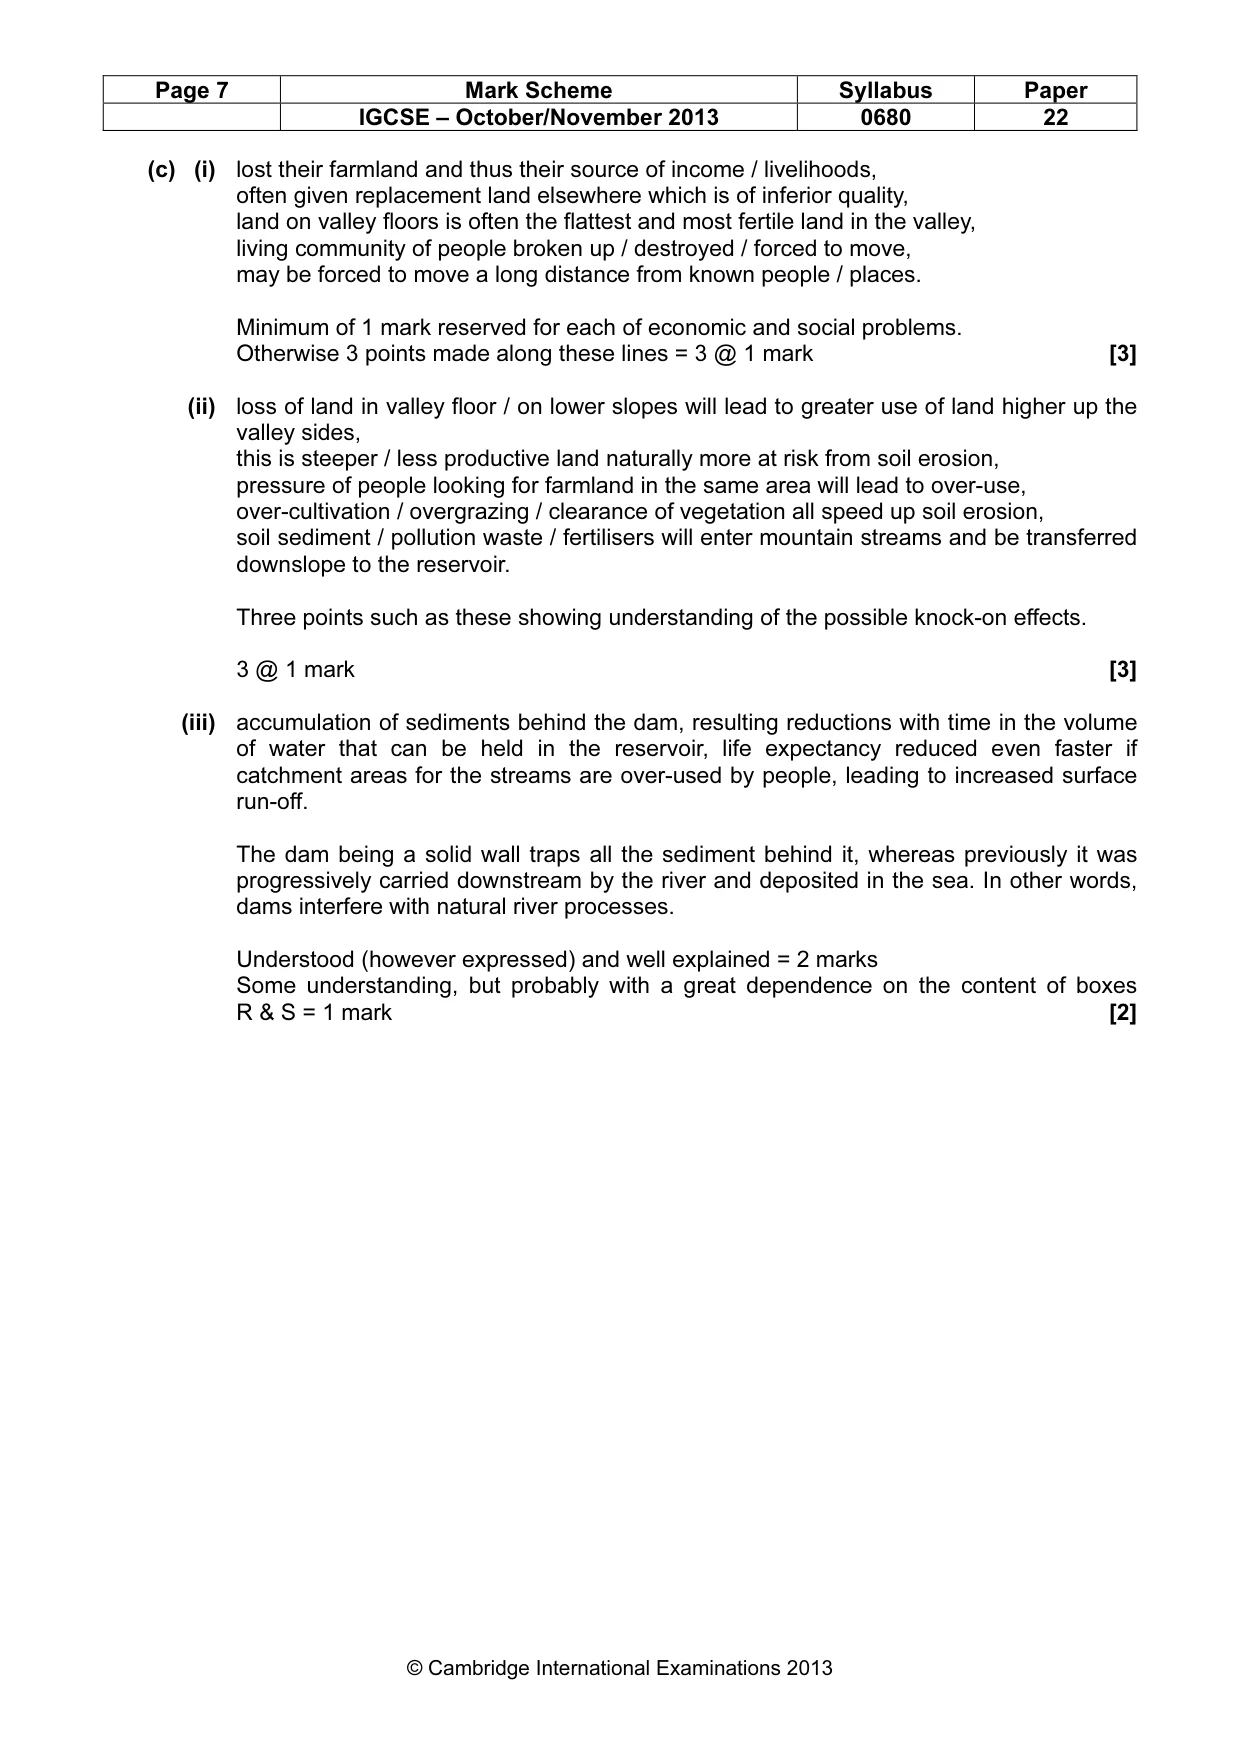
Page 7 Mark Scheme Syllabus Paper IGCSE – October/November 2013 0680 22 © Cambridge International Examinations 2013 (c) (i) lost their farmland and thus their source of income / livelihoods, often given replacement land elsewhere which is of inferior quality, land on valley floors is often the flattest and most fertile land in the valley, living community of people broken up / destroyed / forced to move, may be forced to move a long distance from known people / places. Minimum of 1 mark reserved for each of economic and social problems. Otherwise 3 points made along these lines = 3 @ 1 mark [3] (ii) loss of land in valley floor / on lower slopes will lead to greater use of land higher up the valley sides, this is steeper / less productive land naturally more at risk from soil erosion, pressure of people looking for farmland in the same area will lead to over-use, over-cultivation / overgrazing / clearance of vegetation all speed up soil erosion, soil sediment / pollution waste / fertilisers will enter mountain streams and be transferred downslope to the reservoir. Three points such as these showing understanding of the possible knock-on effects. 3 @ 1 mark [3] (iii) accumulation of sediments behind the dam, resulting reductions with time in the volume of water that can be held in the reservoir, life expectancy reduced even faster if catchment areas for the streams are over-used by people, leading to increased surface run-off. The dam being a solid wall traps all the sediment behind it, whereas previously it was progressively carried downstream by the river and deposited in the sea. In other words, dams interfere with natural river processes. Understood (however expressed) and well explained = 2 marks Some understanding, but probably with a great dependence on the content of boxes R & S = 1 mark [2]
Mark scheme, page 8
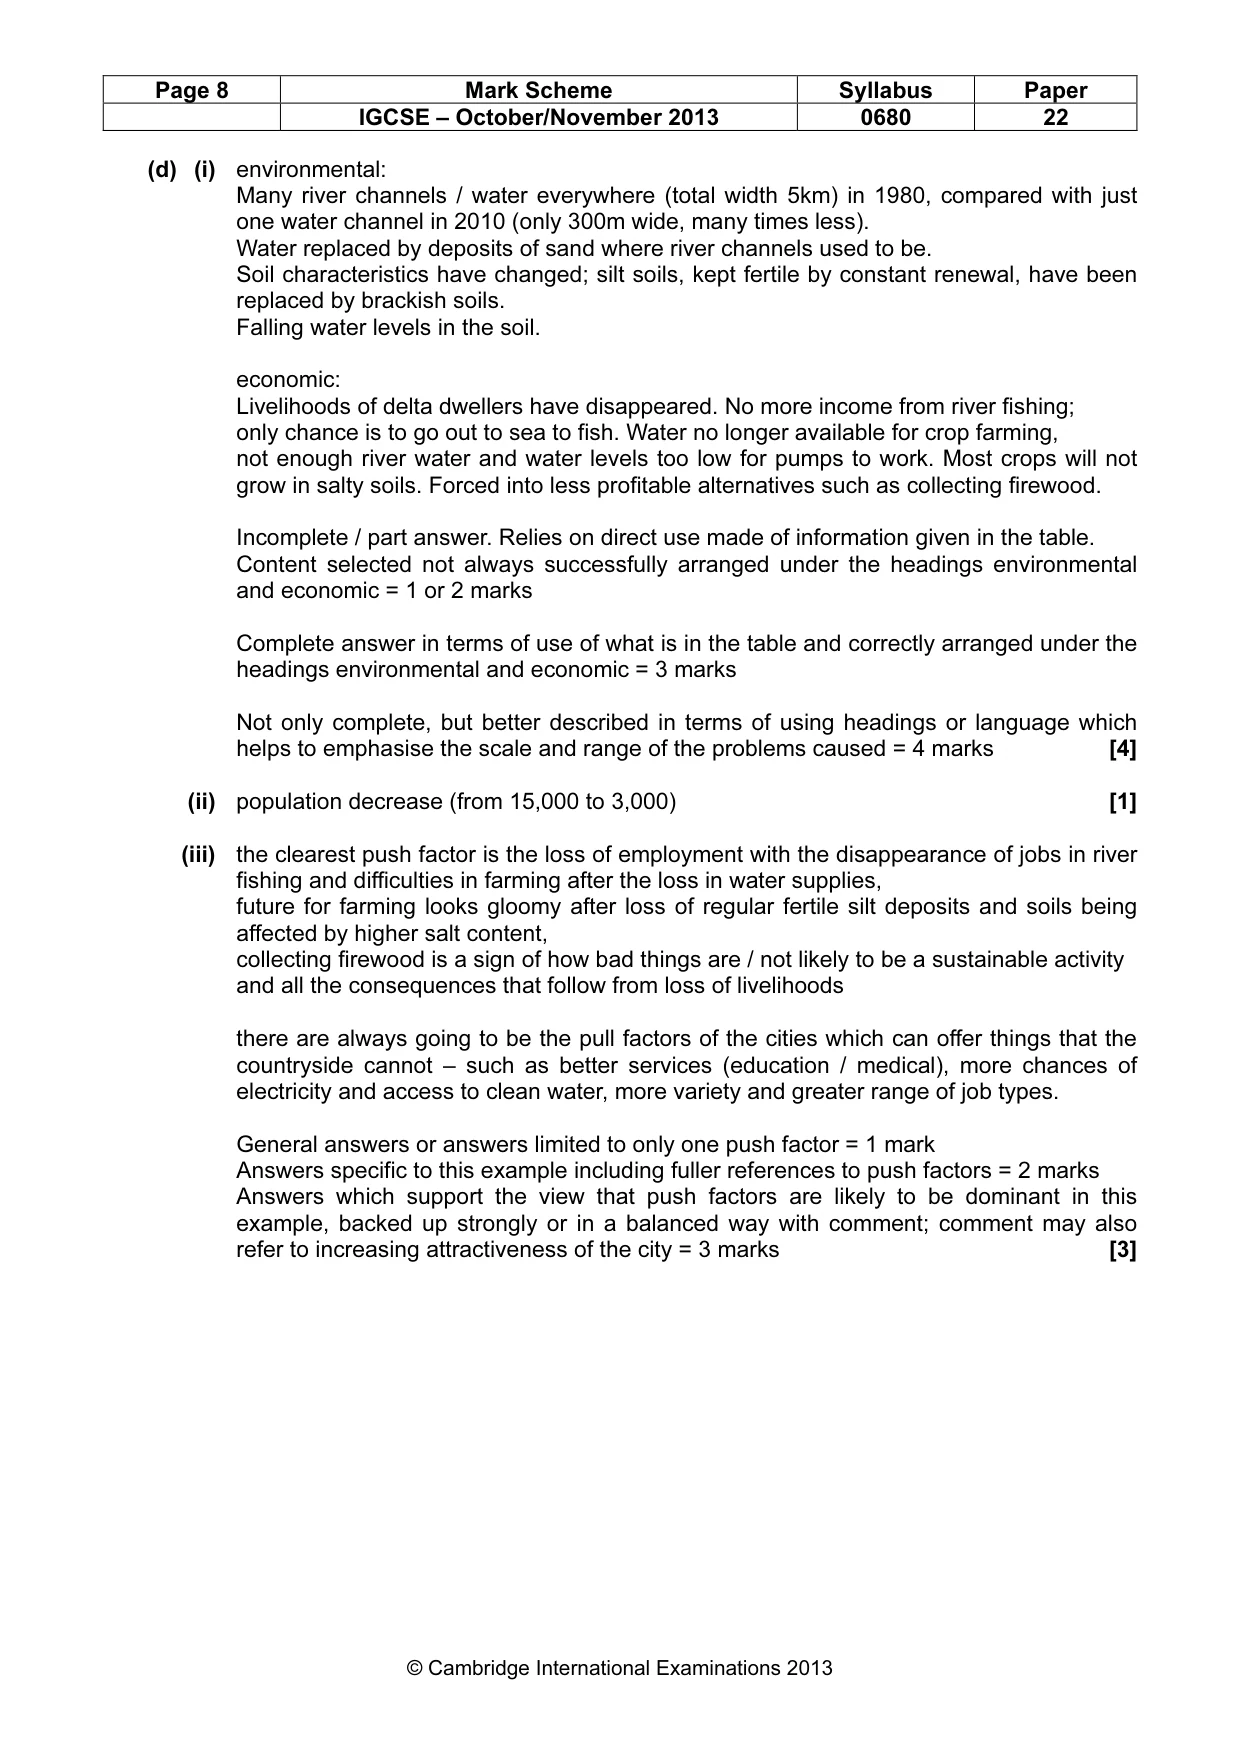
Page 8 Mark Scheme Syllabus Paper IGCSE – October/November 2013 0680 22 © Cambridge International Examinations 2013 (d) (i) environmental: Many river channels / water everywhere (total width 5km) in 1980, compared with just one water channel in 2010 (only 300m wide, many times less). Water replaced by deposits of sand where river channels used to be. Soil characteristics have changed; silt soils, kept fertile by constant renewal, have been replaced by brackish soils. Falling water levels in the soil. economic: Livelihoods of delta dwellers have disappeared. No more income from river fishing; only chance is to go out to sea to fish. Water no longer available for crop farming, not enough river water and water levels too low for pumps to work. Most crops will not grow in salty soils. Forced into less profitable alternatives such as collecting firewood. Incomplete / part answer. Relies on direct use made of information given in the table. Content selected not always successfully arranged under the headings environmental and economic = 1 or 2 marks Complete answer in terms of use of what is in the table and correctly arranged under the headings environmental and economic = 3 marks Not only complete, but better described in terms of using headings or language which helps to emphasise the scale and range of the problems caused = 4 marks [4] (ii) population decrease (from 15,000 to 3,000) [1] (iii) the clearest push factor is the loss of employment with the disappearance of jobs in river fishing and difficulties in farming after the loss in water supplies, future for farming looks gloomy after loss of regular fertile silt deposits and soils being affected by higher salt content, collecting firewood is a sign of how bad things are / not likely to be a sustainable activity and all the consequences that follow from loss of livelihoods there are always going to be the pull factors of the cities which can offer things that the countryside cannot – such as better services (education / medical), more chances of electricity and access to clean water, more variety and greater range of job types. General answers or answers limited to only one push factor = 1 mark Answers specific to this example including fuller references to push factors = 2 marks Answers which support the view that push factors are likely to be dominant in this example, backed up strongly or in a balanced way with comment; comment may also refer to increasing attractiveness of the city = 3 marks [3]
Mark scheme, page 9
Page 9 Mark Scheme Syllabus Paper IGCSE – October/November 2013 0680 22 © Cambridge International Examinations 2013 (iv) the easiest view to support is highly likely due to further knock-on effects such as deteriorating soils, falling water supplies, over-use of firewood resources. also since the dams are in place much further north outside the region, there doesn't seem much chance that more water will be released into the Indus – seems more chance that there might be even less. once the community disappears, more likely to leave / some will now have relatives and friends in the cities to make the move easier. Community itself likely to be ageing after people of working age have migrated. support for unlikely to decline further is less obvious / but the 3000 might represent the number that can be supported by current resources and activities like sea fishing and collecting firewood. All those with any desire to migrate have already done so. View expressed but weakly supported = 1 mark View expressed and more strongly supported = 2 marks [2] (e) (i) the obvious focus is on squatter settlements / slum housing / shanty towns, self-help housing using mixed 'building materials', high density / haphazard layout, lacking in essential public services such as water supply, overcrowded / easy spread of disease, located in inferior locations not already used for formal housing. possible also to refer to the high costs of modern housing such as apartment blocks supposedly built for the poor. Points made along these lines. Credit any references to specific examples. 3 @ 1 mark [3] (ii) an example from a big city in the country where the candidate lives, textbook examples such as Chennai and the Housing and Slum Clearance Boards, the Orangi Pilot Project in Karachi involving the communities in self-help schemes, and the 'new settlement' policy in Greater Cairo. most strategies for improving housing are of the ASH (aided self-help) type, giving legal titles to the land, providing essential services, offering loans and providing technical help. Less successful are those that involve clearance and housing redevelopment (usually high-rise) in another part of the city, often some distance away. Bulldozing without any new provision. Answer about strategies for managing housing problems; many will be general in nature and weakly related to a city even when one is named – Maximum 3 marks for these answers, with the mark within the range dependent on the dependent on amount given or range of points made. General answers. Answers that contain direct and identifiable references to a named city – Up to 5 marks with adequate supporting detail. City specific answers. [5] [Total: 40]
What you needed in this session
Cambridge’s own grade thresholds for 2013 Oct/Nov, Paper 2 · Variant 2. A higher threshold means an easier paper — the bar moves with how the cohort did.