Cambridge IGCSE Environmental Management 0680 — 2013 Oct/Nov Paper 2 · Variant 3
0680/23/O/N/13 · 80 marks · ≈90 min
The question paper and its mark scheme, free to read here and free to download. This is Cambridge’s own paper, exactly as it was sat.
Question paper16 pages

Mark scheme8 pages
Answers below. Sit the paper first if you are practising.
Paper as text
Question paper, page 1
This document consists of 16 printed pages. DC (CW/CGW) 67397/3 © UCLES 2013 [Turn over UNIVERSITY OF CAMBRIDGE INTERNATIONAL EXAMINATIONS International General Certificate of Secondary Education * 8 2 5 8 3 5 0 8 7 7 * ENVIRONMENTAL MANAGEMENT 0680/23 Paper 2 October/November 2013 1 hour 45 minutes Candidates answer on the Question Paper. Additional Materials: Ruler READ THESE INSTRUCTIONS FIRST Write your Centre number, candidate number and name on all the work you hand in. Write in dark blue or black pen. You may use a soft pencil for any diagrams, graphs or rough working. Do not use staples, paper clips, highlighters, glue or correction fluid. DO NOT WRITE IN ANY BARCODES. Answer both questions. Electronic calculators may be used. You may lose marks if you do not show your working or if you do not use appropriate units. At the end of the examination, fasten all your work securely together. The number of marks is given in brackets [ ] at the end of each question or part question. For Examiner’s Use 1 2 Total
Question paper, page 2
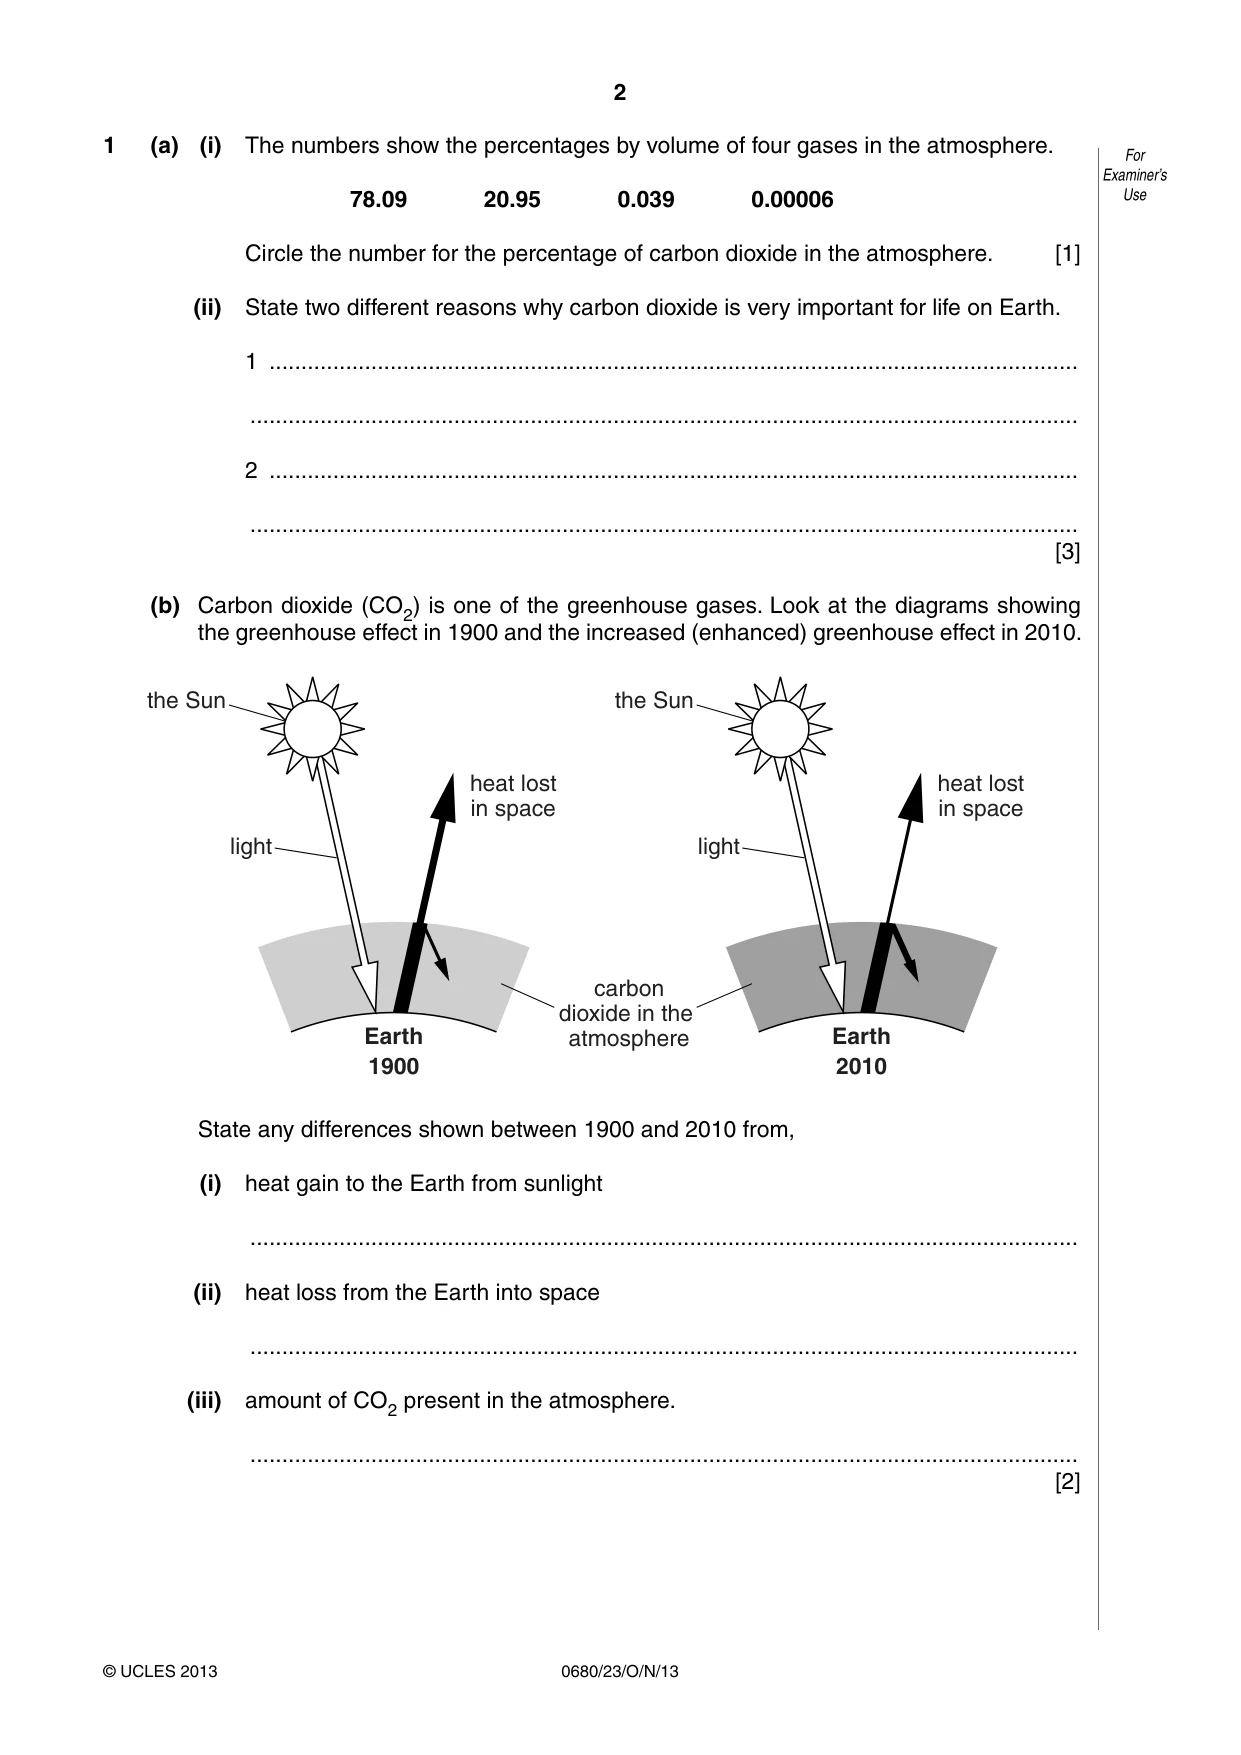
2 0680/23/O/N/13 © UCLES 2013 For Examiner’s Use 1 (a) (i) The numbers show the percentages by volume of four gases in the atmosphere. 78.09 20.95 0.039 0.00006 Circle the number for the percentage of carbon dioxide in the atmosphere. [1] (ii) State two different reasons why carbon dioxide is very important for life on Earth. 1 … … 2 … … [3] (b) Carbon dioxide (CO2) is one of the greenhouse gases. Look at the diagrams showing the greenhouse effect in 1900 and the increased (enhanced) greenhouse effect in 2010. the Sun light heat lost in space carbon dioxide in the atmosphere Earth 2010 the Sun light heat lost in space Earth 1900 State any differences shown between 1900 and 2010 from, (i) heat gain to the Earth from sunlight … (ii) heat loss from the Earth into space … (iii) amount of CO2 present in the atmosphere. … [2]
Question paper, page 3
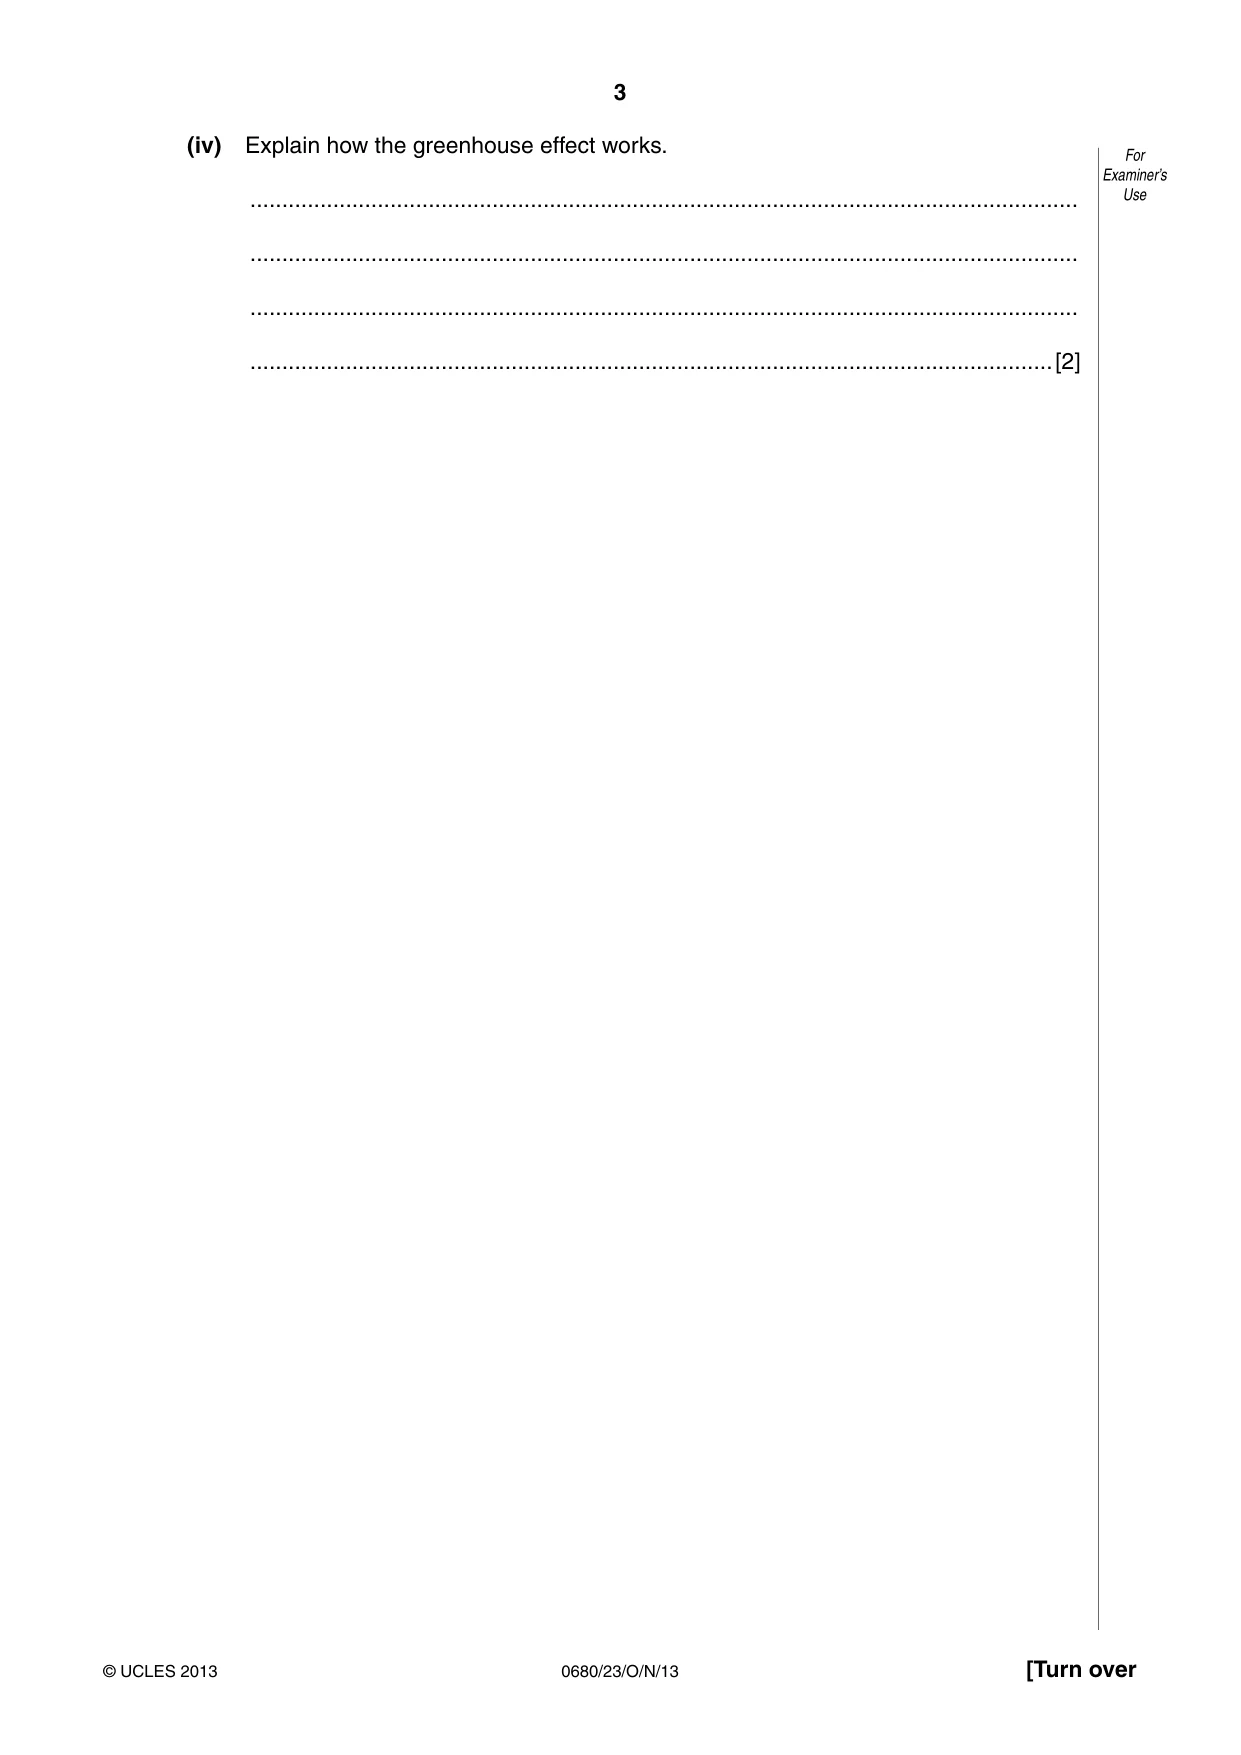
3 0680/23/O/N/13 © UCLES 2013 [Turn over For Examiner’s Use (iv) Explain how the greenhouse effect works. … … … …[2]
Question paper, page 4
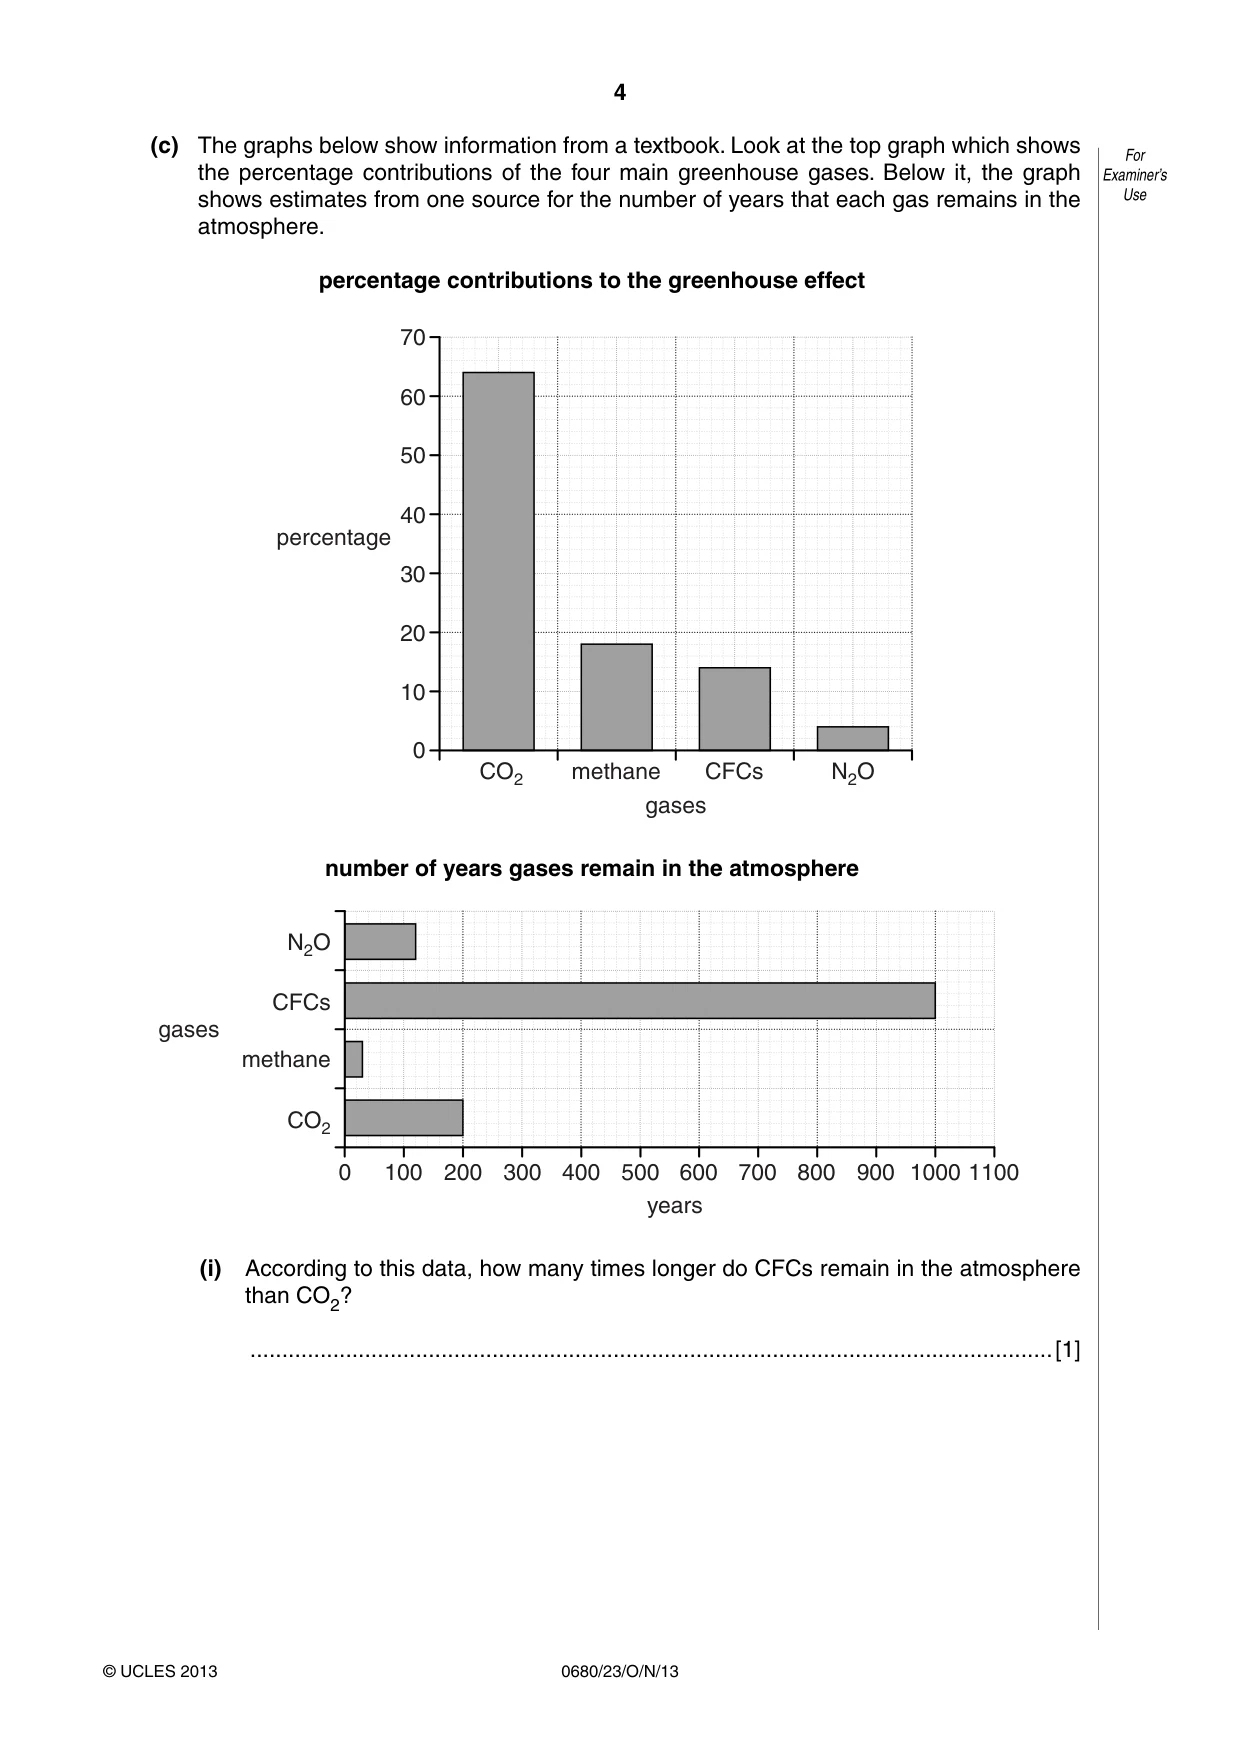
4 0680/23/O/N/13 © UCLES 2013 For Examiner’s Use (c) The graphs below show information from a textbook. Look at the top graph which shows the percentage contributions of the four main greenhouse gases. Below it, the graph shows estimates from one source for the number of years that each gas remains in the atmosphere. percentage contributions to the greenhouse effect 70 60 50 40 percentage CO2 methane gases N2O CFCs 30 20 10 0 number of years gases remain in the atmosphere years 400 300 200 100 800 700 600 500 1100 1000 900 0 CO2 N2O methane gases CFCs (i) According to this data, how many times longer do CFCs remain in the atmosphere than CO2? …[1]
Question paper, page 5
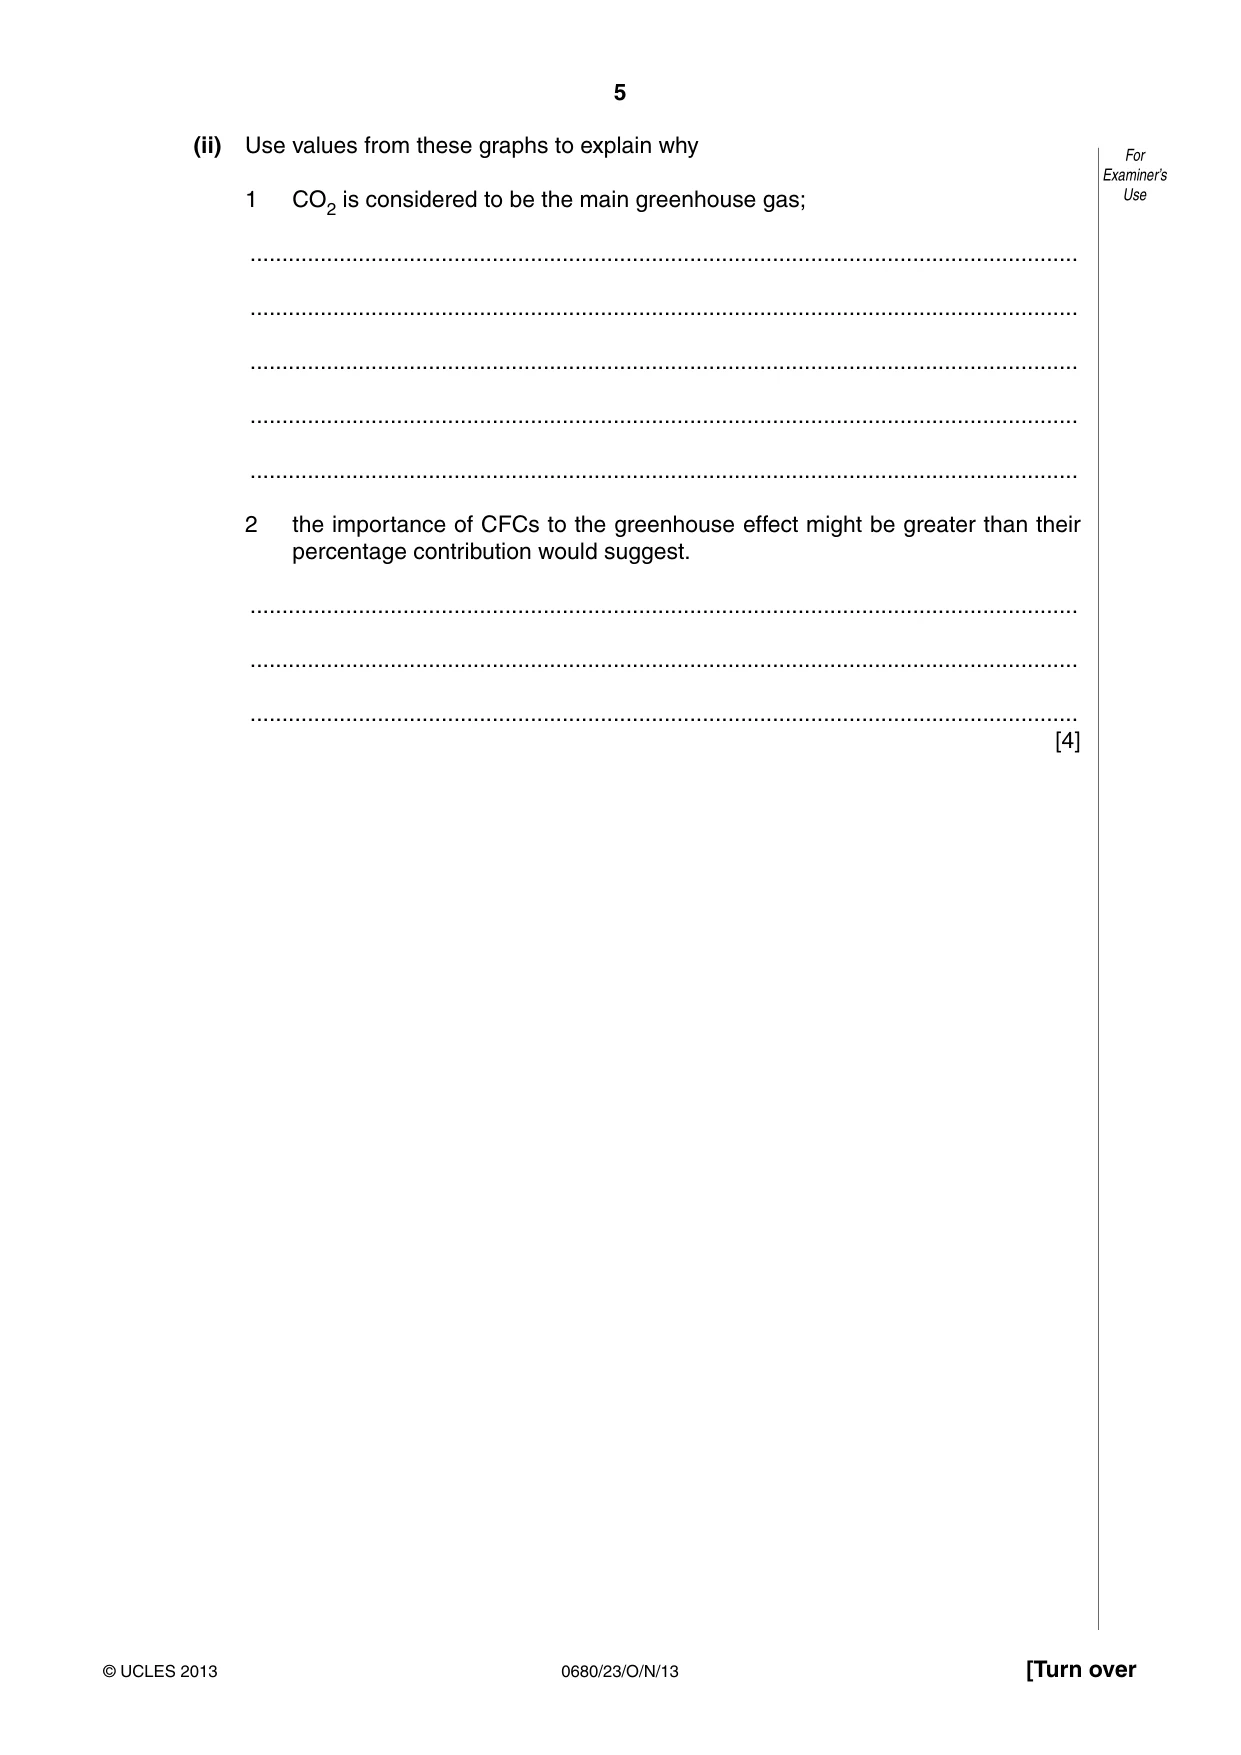
5 0680/23/O/N/13 © UCLES 2013 [Turn over For Examiner’s Use (ii) Use values from these graphs to explain why 1 CO2 is considered to be the main greenhouse gas; … … … … … 2 the importance of CFCs to the greenhouse effect might be greater than their percentage contribution would suggest. … … … [4]
Question paper, page 6
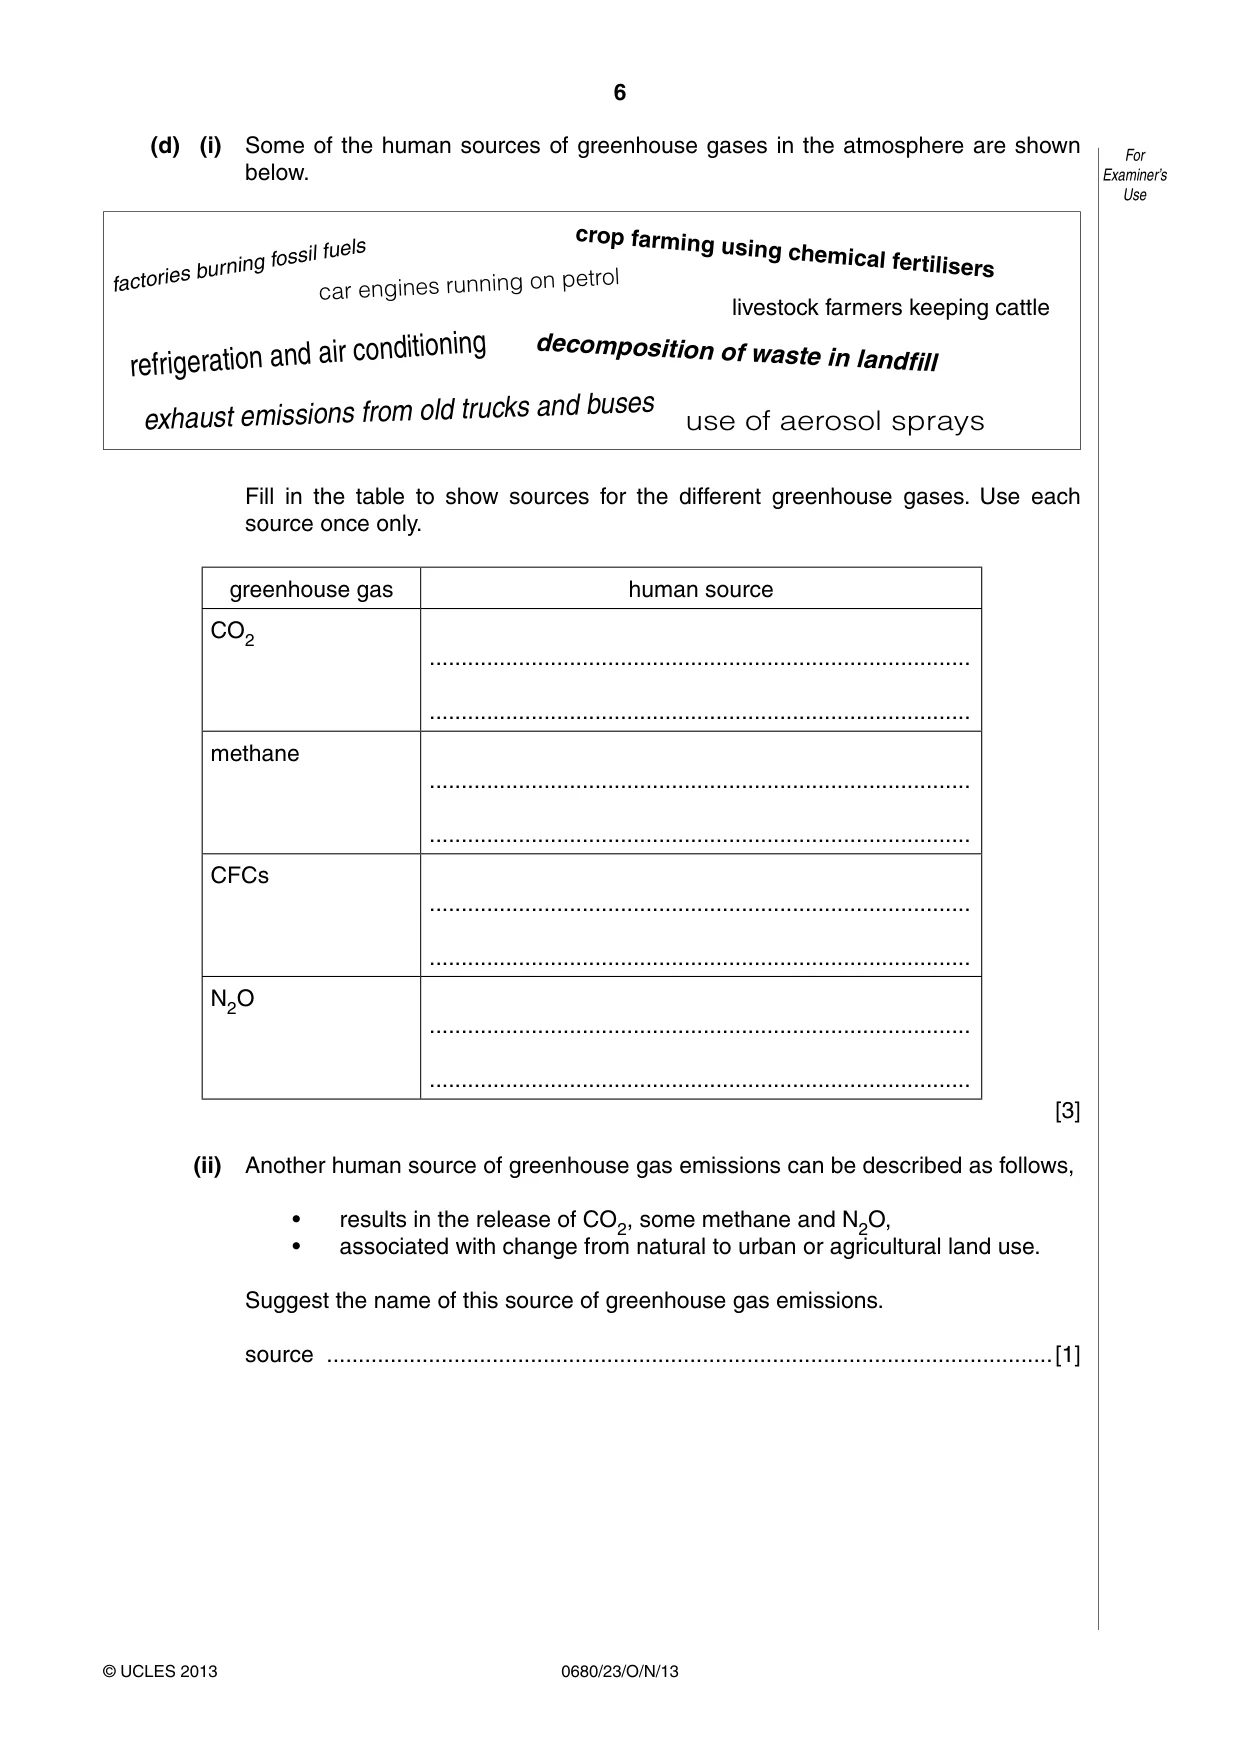
6 0680/23/O/N/13 © UCLES 2013 For Examiner’s Use (d) (i) Some of the human sources of greenhouse gases in the atmosphere are shown below. factories burning fossil fuels crop farming using chemical fertilisers car engines running on petrol livestock farmers keeping cattle refrigeration and air conditioning decomposition of waste in landfill exhaust emissions from old trucks and buses use of aerosol sprays Fill in the table to show sources for the different greenhouse gases. Use each source once only. greenhouse gas human source CO2 … … methane … … CFCs … … N2O … … [3] (ii) Another human source of greenhouse gas emissions can be described as follows, • results in the release of CO2, some methane and N2O, • associated with change from natural to urban or agricultural land use. Suggest the name of this source of greenhouse gas emissions. source …[1]
Question paper, page 7
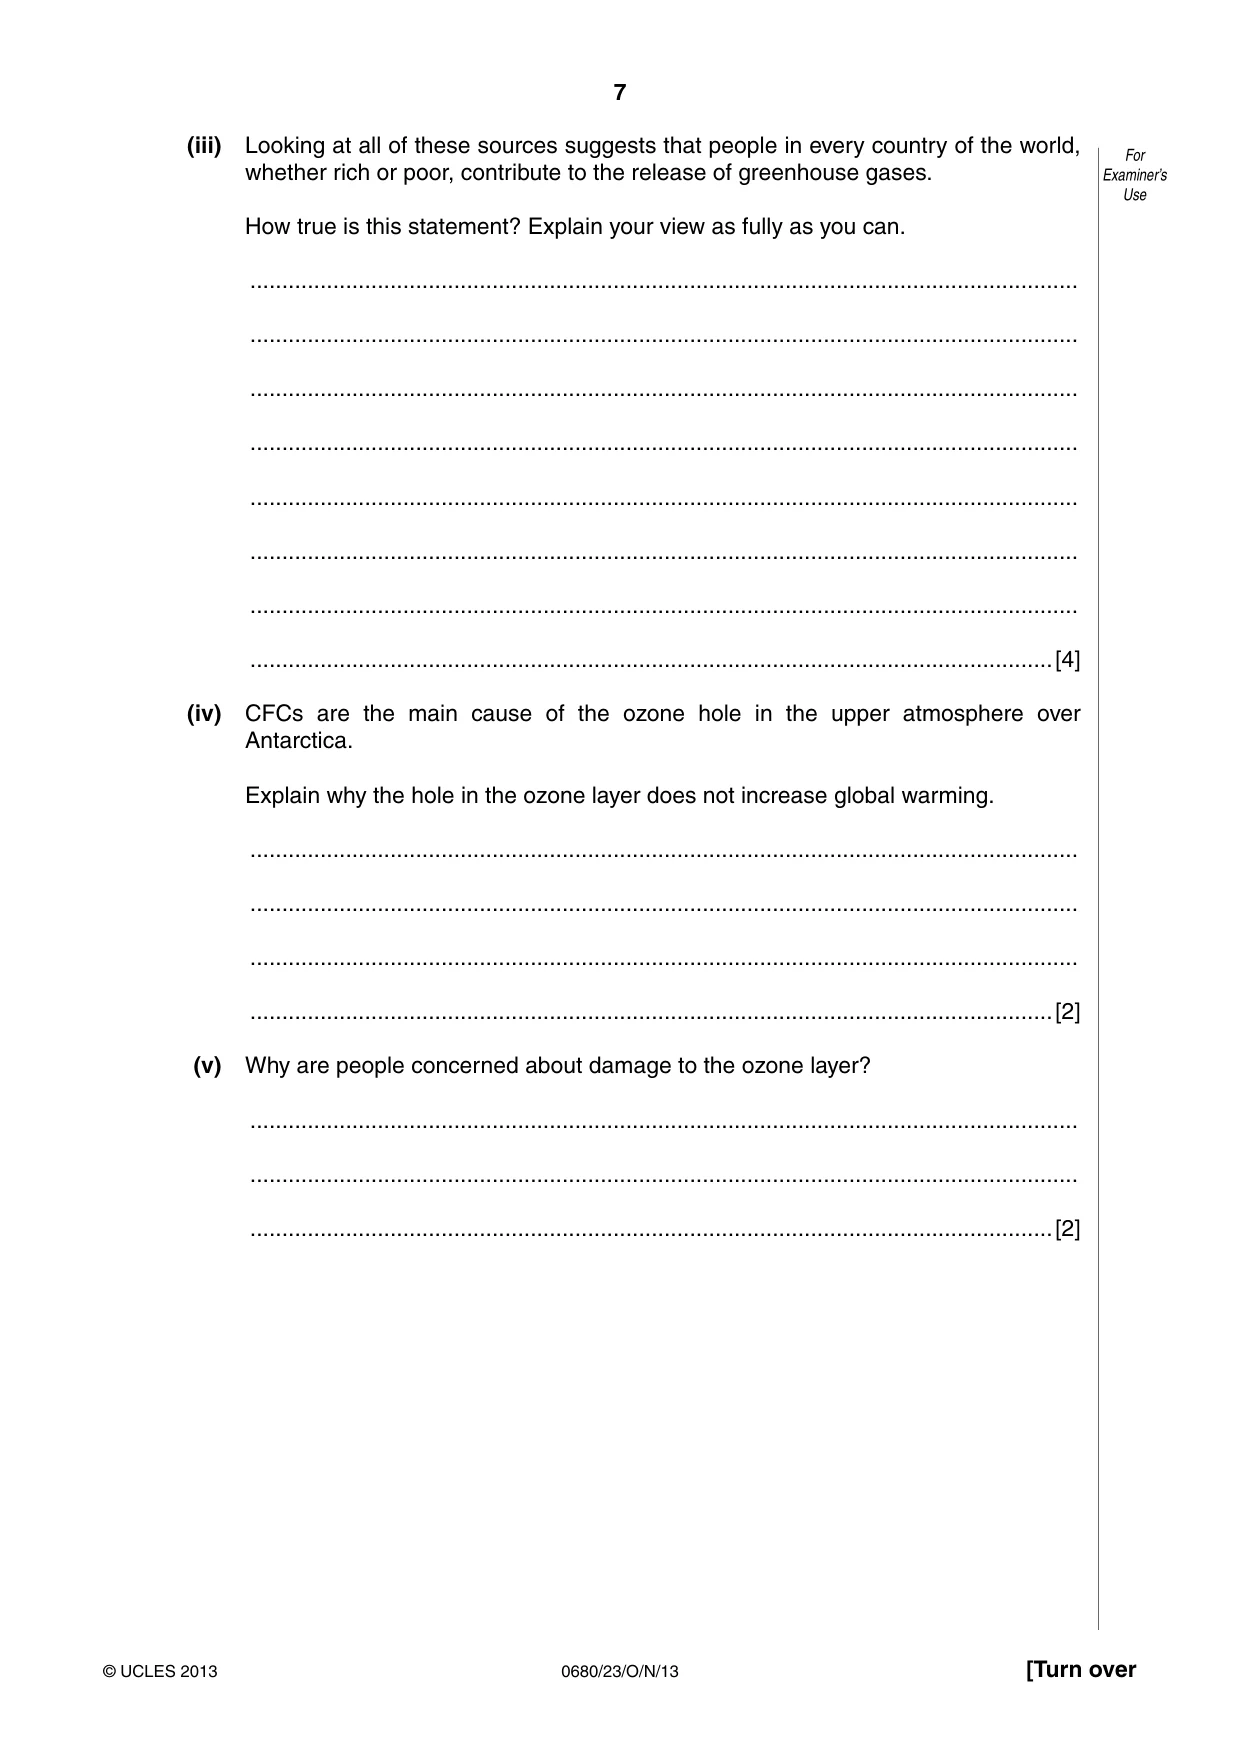
7 0680/23/O/N/13 © UCLES 2013 [Turn over For Examiner’s Use (iii) Looking at all of these sources suggests that people in every country of the world, whether rich or poor, contribute to the release of greenhouse gases. How true is this statement? Explain your view as fully as you can. … … … … … … … …[4] (iv) CFCs are the main cause of the ozone hole in the upper atmosphere over Antarctica. Explain why the hole in the ozone layer does not increase global warming. … … … …[2] (v) Why are people concerned about damage to the ozone layer? … … …[2]
Question paper, page 8
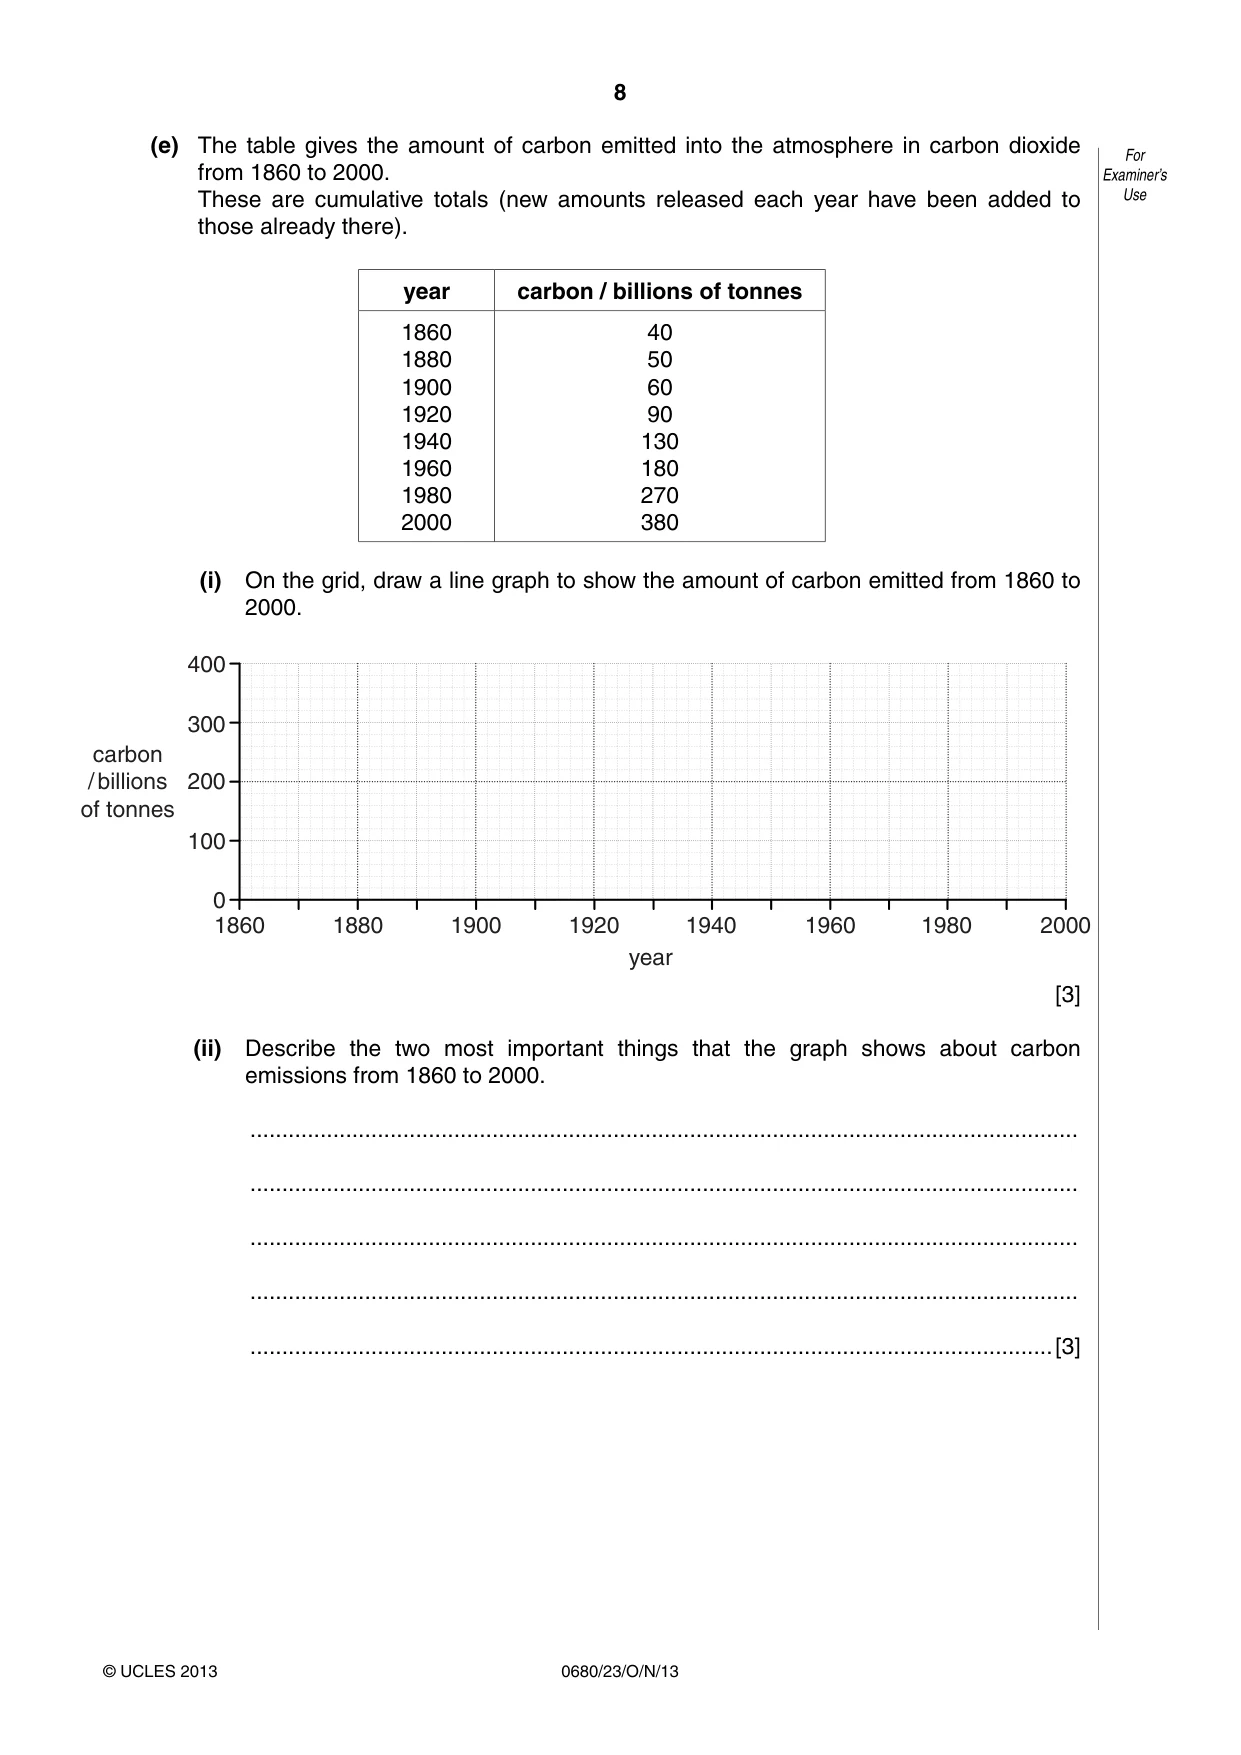
8 0680/23/O/N/13 © UCLES 2013 For Examiner’s Use (e) The table gives the amount of carbon emitted into the atmosphere in carbon dioxide from 1860 to 2000. These are cumulative totals (new amounts released each year have been added to those already there). year carbon / billions of tonnes 1860 1880 1900 1920 1940 1960 1980 2000 40 50 60 90 130 180 270 380 (i) On the grid, draw a line graph to show the amount of carbon emitted from 1860 to 2000. year 1900 1880 1940 1920 1960 1980 2000 1860 100 0 400 carbon / billions of tonnes 200 300 [3] (ii) Describe the two most important things that the graph shows about carbon emissions from 1860 to 2000. … … … … …[3]
Question paper, page 9
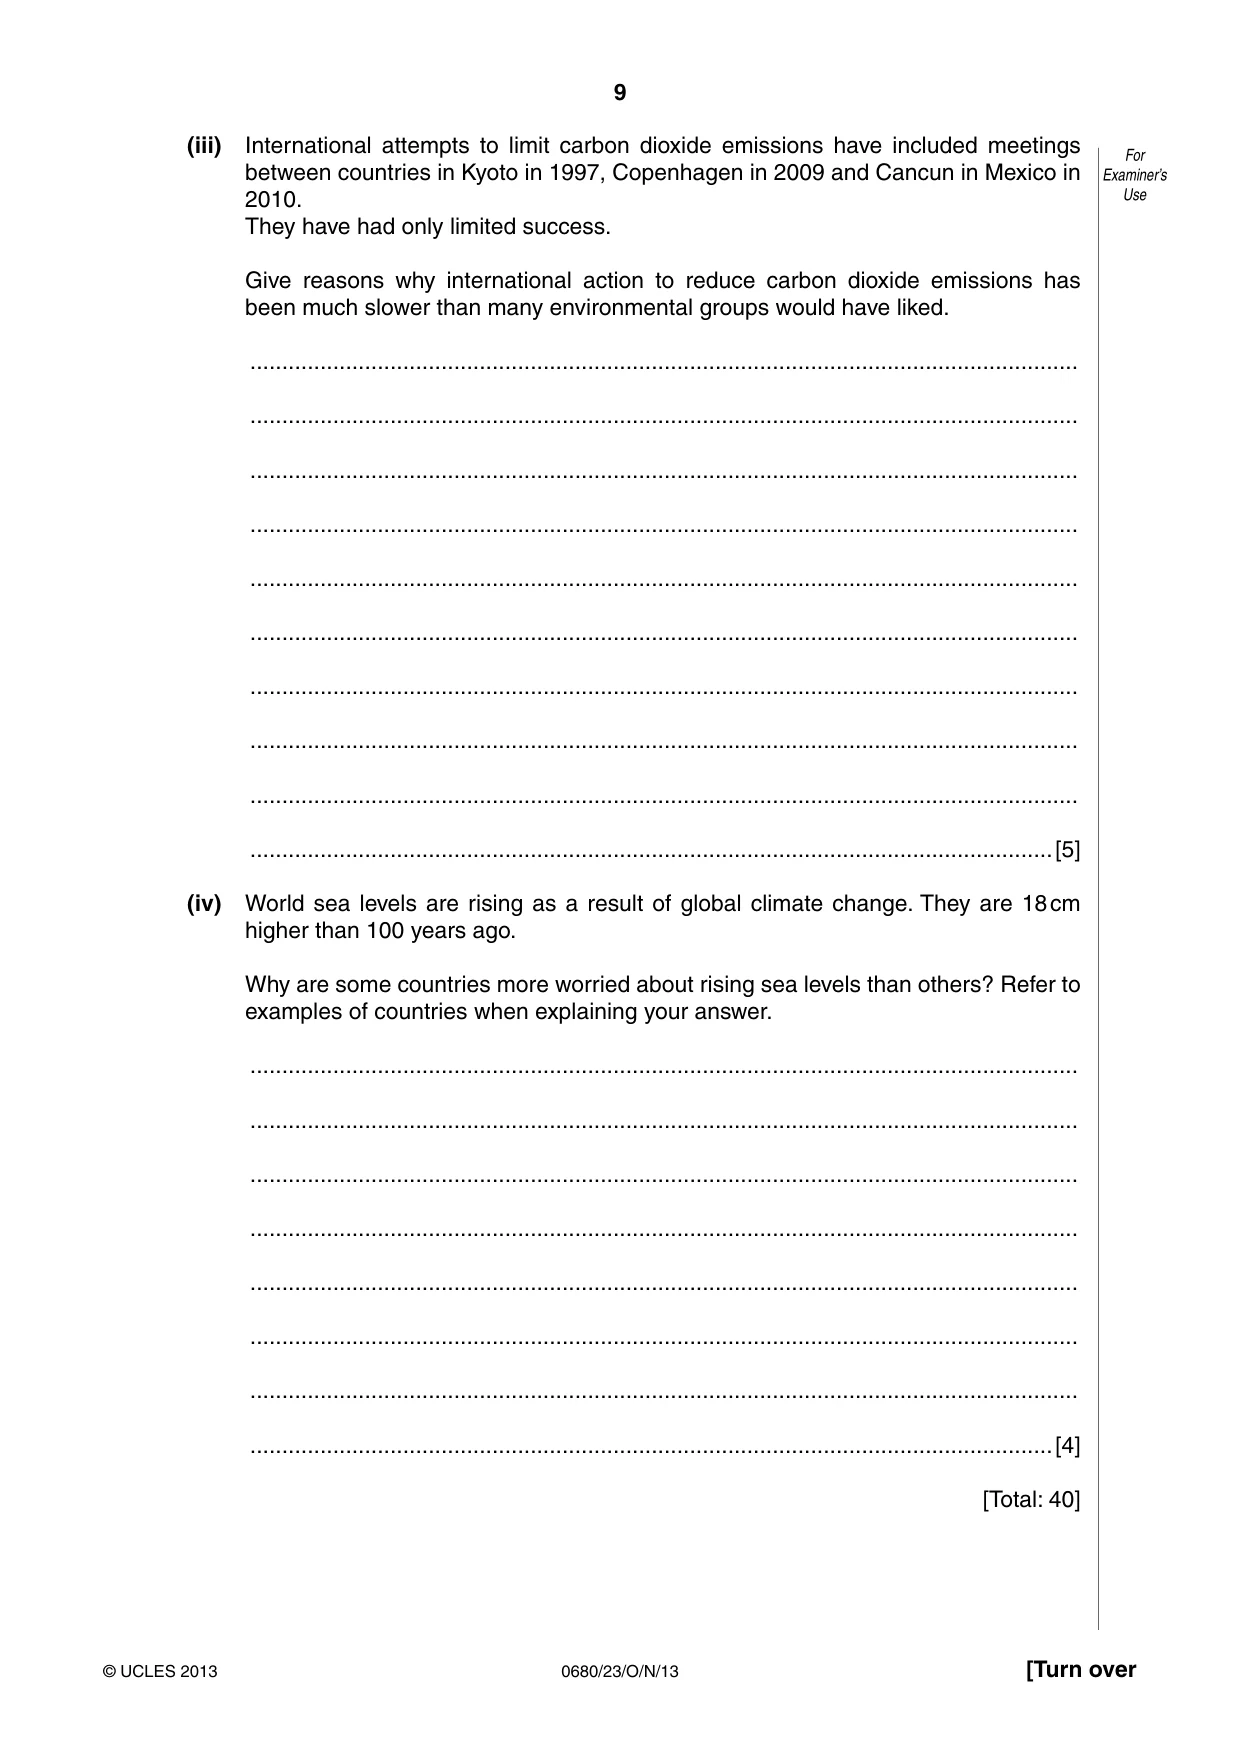
9 0680/23/O/N/13 © UCLES 2013 [Turn over For Examiner’s Use (iii) International attempts to limit carbon dioxide emissions have included meetings between countries in Kyoto in 1997, Copenhagen in 2009 and Cancun in Mexico in 2010. They have had only limited success. Give reasons why international action to reduce carbon dioxide emissions has been much slower than many environmental groups would have liked. … … … … … … … … … …[5] (iv) World sea levels are rising as a result of global climate change. They are 18 cm higher than 100 years ago. Why are some countries more worried about rising sea levels than others? Refer to examples of countries when explaining your answer. … … … … … … … …[4] [Total: 40]
Question paper, page 10
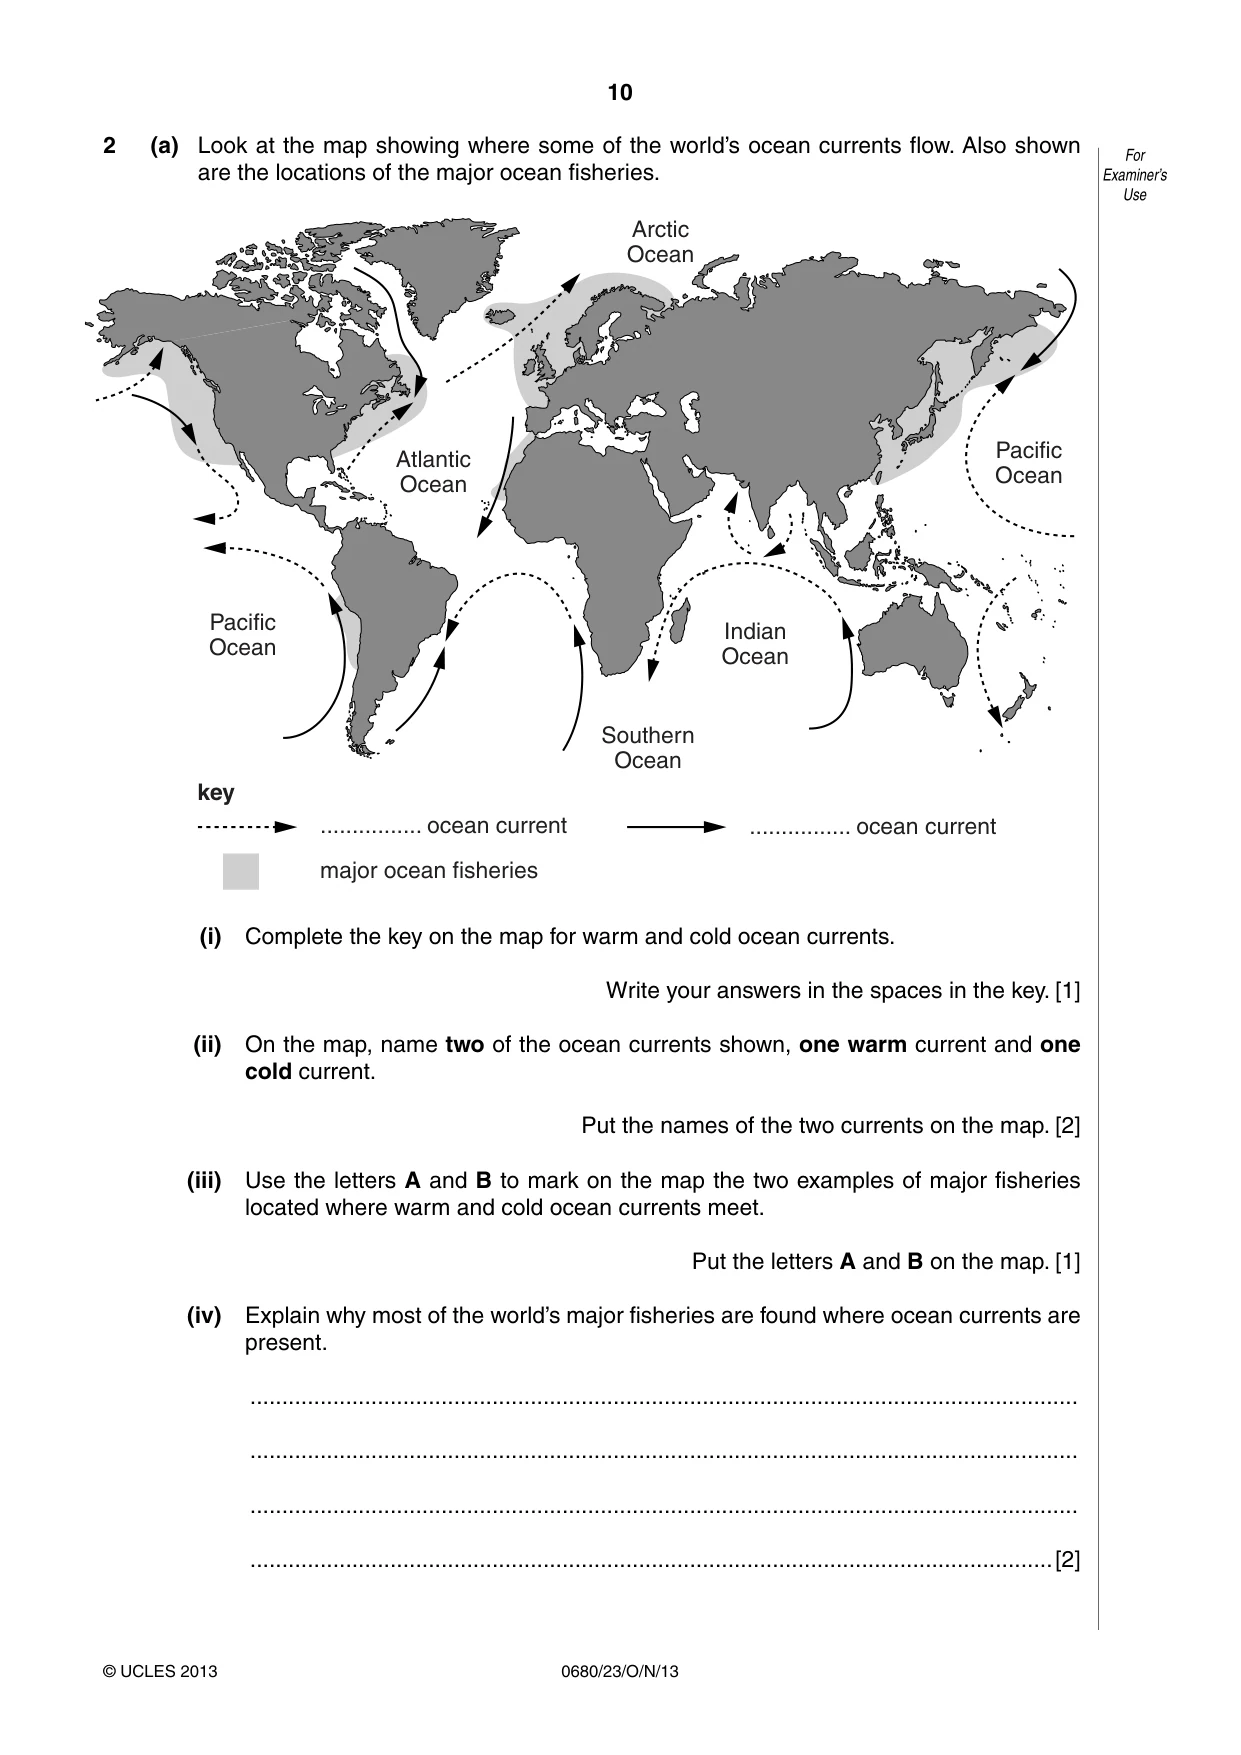
10 0680/23/O/N/13 © UCLES 2013 For Examiner’s Use 2 (a) Look at the map showing where some of the world’s ocean currents flow. Also shown are the locations of the major ocean fisheries. Atlantic Ocean Arctic Ocean Pacific Ocean Pacific Ocean … ocean current key … ocean current major ocean fisheries Indian Ocean Southern Ocean (i) Complete the key on the map for warm and cold ocean currents. Write your answers in the spaces in the key. [1] (ii) On the map, name two of the ocean currents shown, one warm current and one cold current. Put the names of the two currents on the map. [2] (iii) Use the letters A and B to mark on the map the two examples of major fisheries located where warm and cold ocean currents meet. Put the letters A and B on the map. [1] (iv) Explain why most of the world’s major fisheries are found where ocean currents are present. … … … …[2]
Question paper, page 11
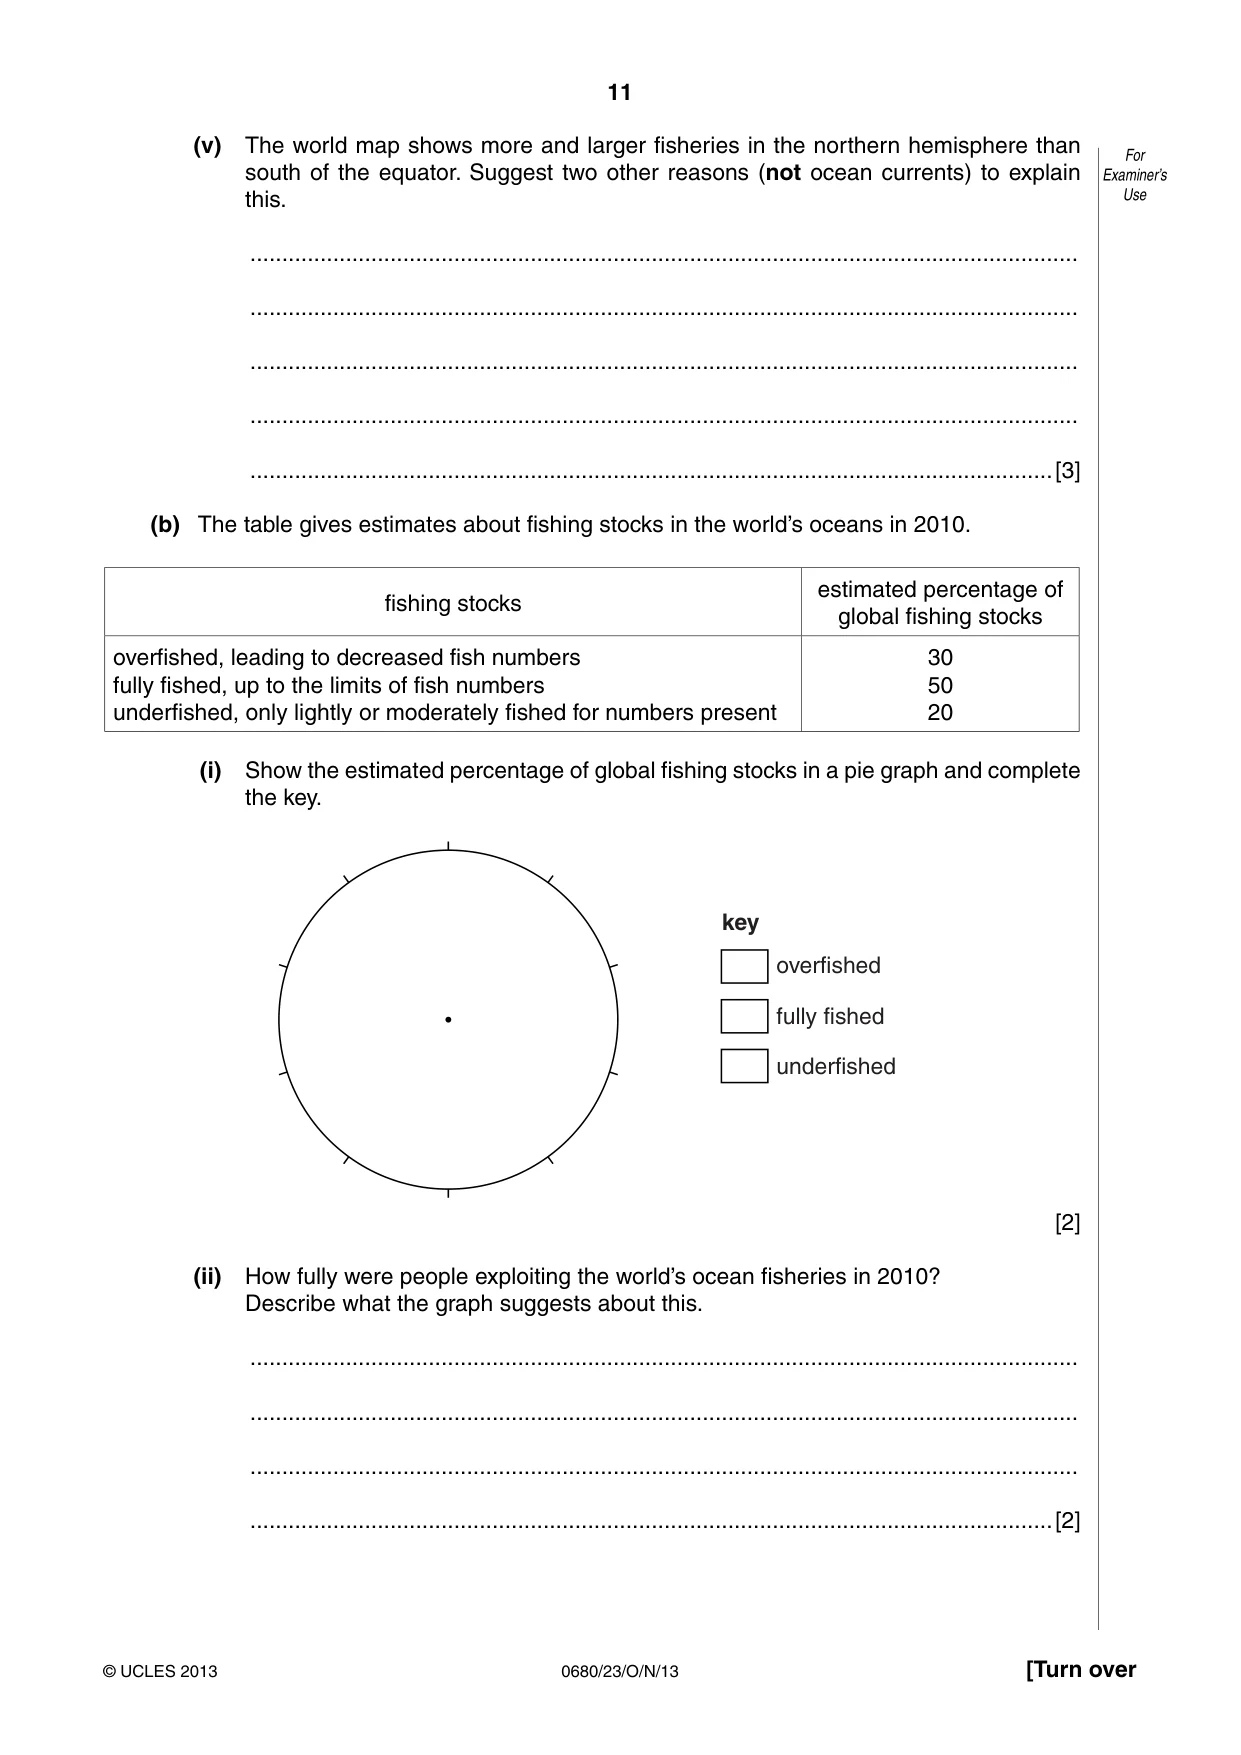
11 0680/23/O/N/13 © UCLES 2013 [Turn over For Examiner’s Use (v) The world map shows more and larger fisheries in the northern hemisphere than south of the equator. Suggest two other reasons (not ocean currents) to explain this. … … … … …[3] (b) The table gives estimates about fishing stocks in the world’s oceans in 2010. fishing stocks estimated percentage of global fishing stocks overfished, leading to decreased fish numbers fully fished, up to the limits of fish numbers underfished, only lightly or moderately fished for numbers present 30 50 20 (i) Show the estimated percentage of global fishing stocks in a pie graph and complete the key. key overfished fully fished underfished [2] (ii) How fully were people exploiting the world’s ocean fisheries in 2010? Describe what the graph suggests about this. … … … …[2]
Question paper, page 12
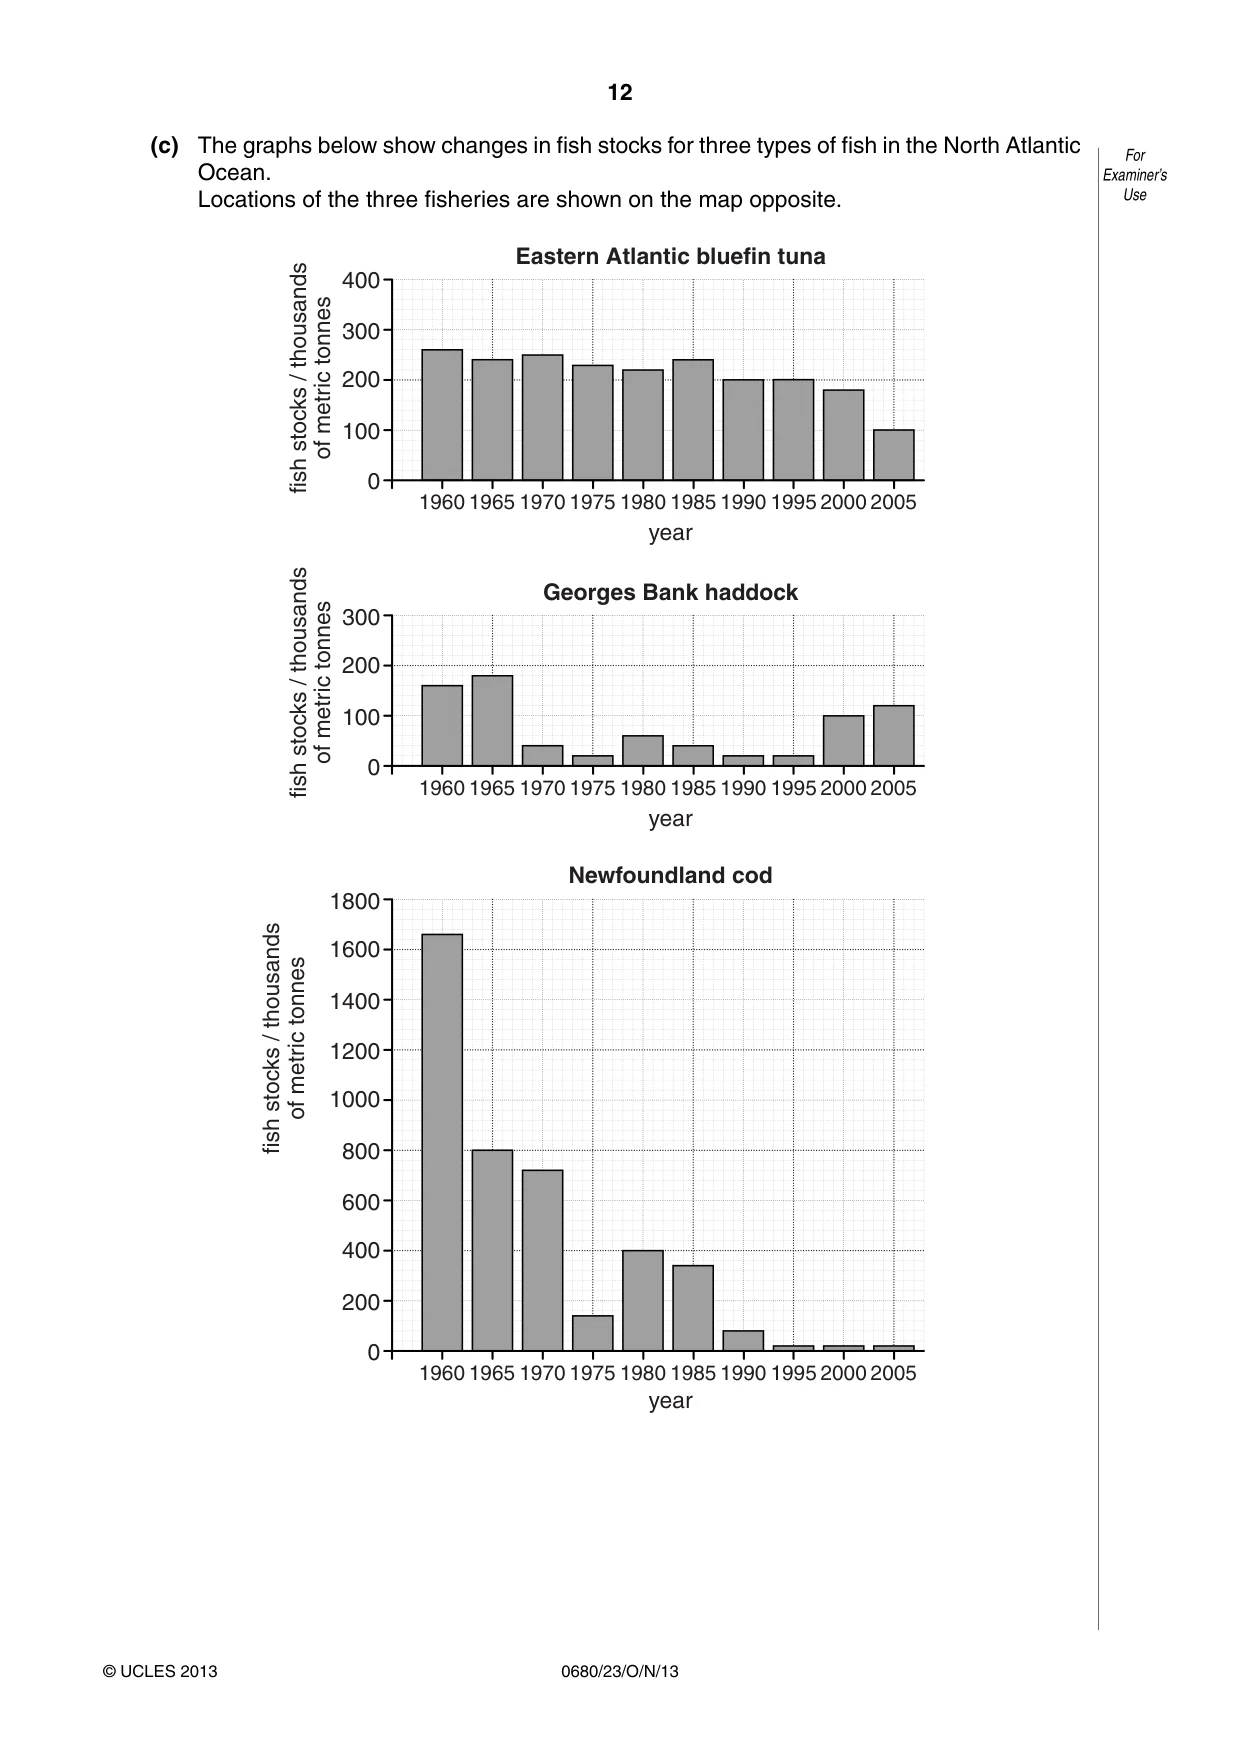
12 0680/23/O/N/13 © UCLES 2013 For Examiner’s Use (c) The graphs below show changes in fish stocks for three types of fish in the North Atlantic Ocean. Locations of the three fisheries are shown on the map opposite. year Eastern Atlantic bluefin tuna 1970 1965 1980 1975 1985 1990 2000 1995 2005 1960 100 0 400 fish stocks / thousands of metric tonnes 200 300 year Georges Bank haddock 1970 1965 1980 1975 1985 1990 2000 1995 2005 1960 100 0 fish stocks / thousands of metric tonnes 200 300 year Newfoundland cod 1970 1965 1980 1975 1985 1990 2000 1995 2005 1960 200 0 fish stocks / thousands of metric tonnes 400 600 800 1000 1200 1400 1600 1800
Question paper, page 13
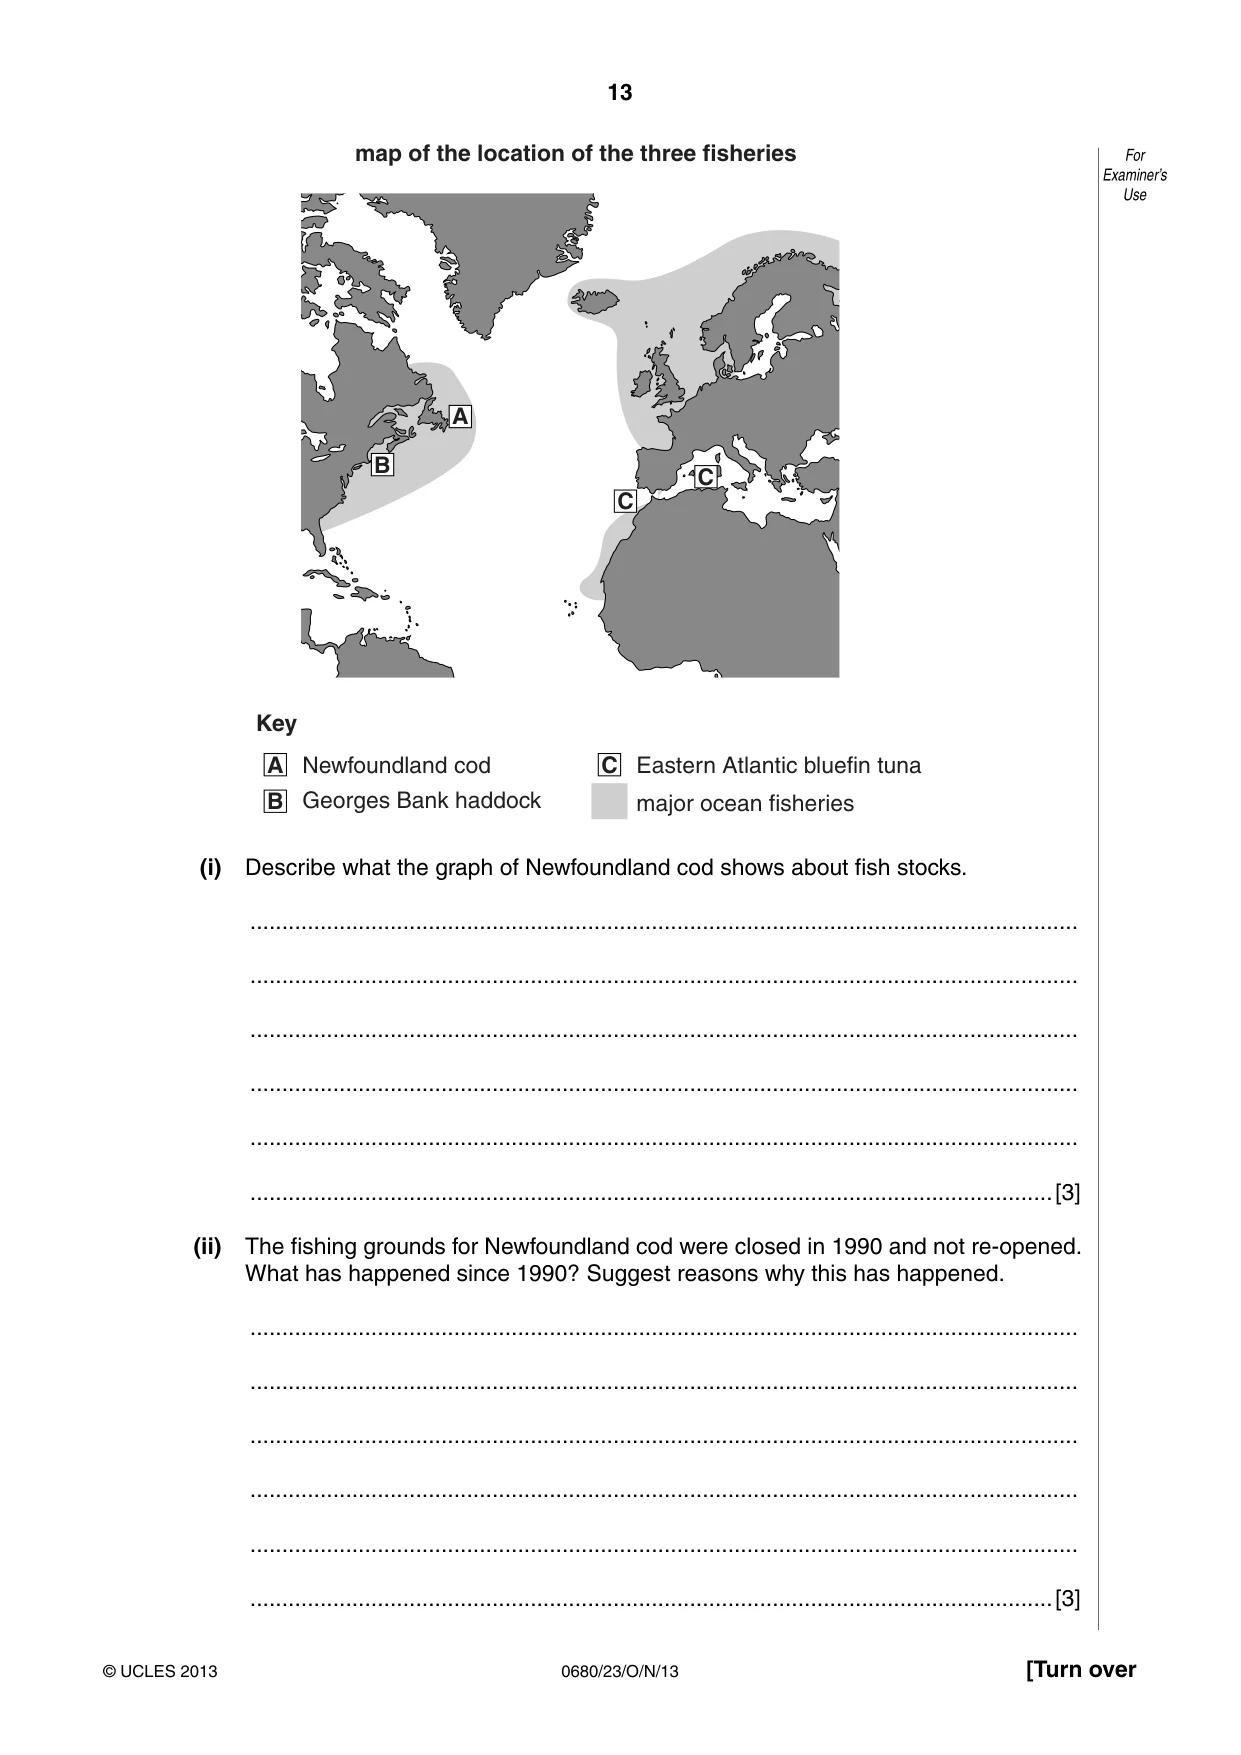
13 0680/23/O/N/13 © UCLES 2013 [Turn over For Examiner’s Use Newfoundland cod map of the location of the three fisheries Key Georges Bank haddock Eastern Atlantic bluefin tuna major ocean fisheries A A B C C C B (i) Describe what the graph of Newfoundland cod shows about fish stocks. … … … … … …[3] (ii) The fishing grounds for Newfoundland cod were closed in 1990 and not re-opened. What has happened since 1990? Suggest reasons why this has happened. … … … … … …[3]
Question paper, page 14
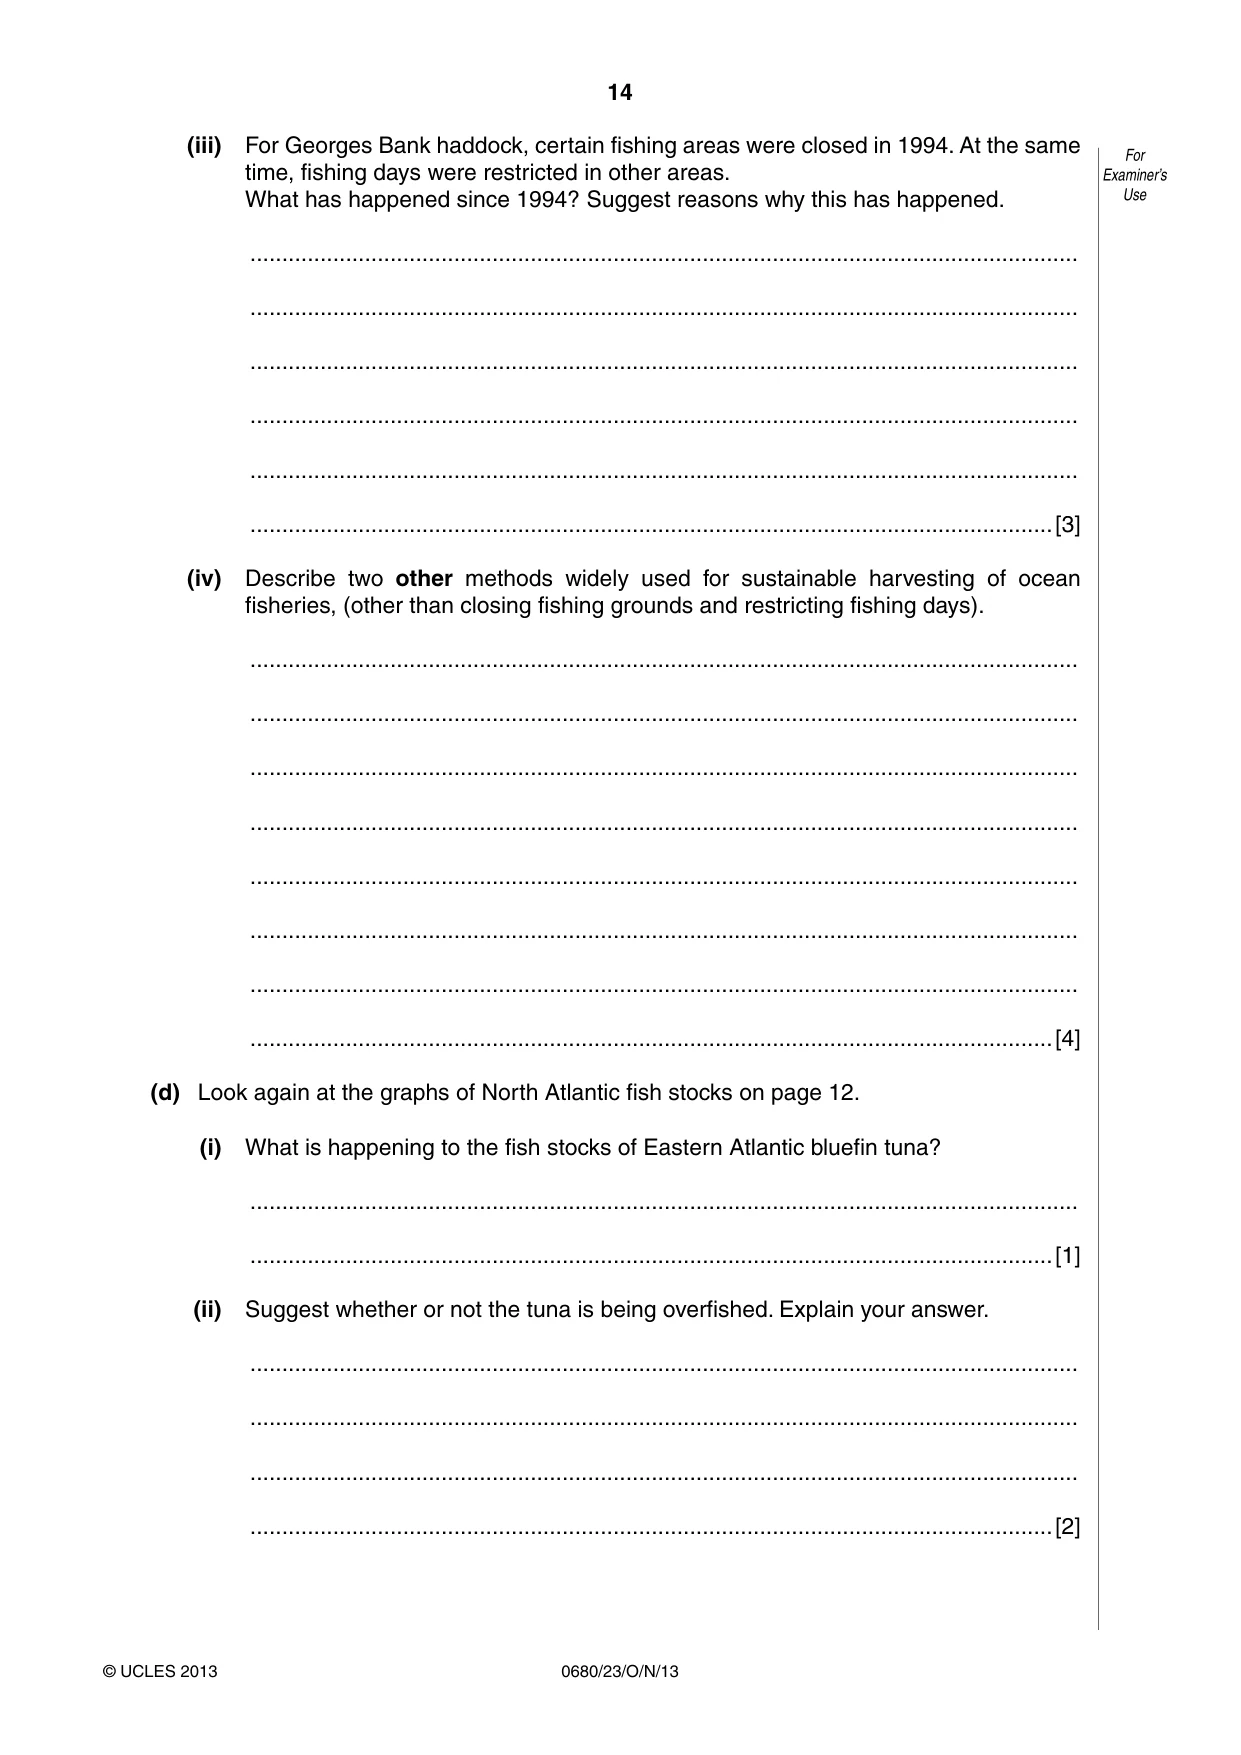
14 0680/23/O/N/13 © UCLES 2013 For Examiner’s Use (iii) For Georges Bank haddock, certain fishing areas were closed in 1994. At the same time, fishing days were restricted in other areas. What has happened since 1994? Suggest reasons why this has happened. … … … … … …[3] (iv) Describe two other methods widely used for sustainable harvesting of ocean fisheries, (other than closing fishing grounds and restricting fishing days). … … … … … … … …[4] (d) Look again at the graphs of North Atlantic fish stocks on page 12. (i) What is happening to the fish stocks of Eastern Atlantic bluefin tuna? … …[1] (ii) Suggest whether or not the tuna is being overfished. Explain your answer. … … … …[2]
Question paper, page 15
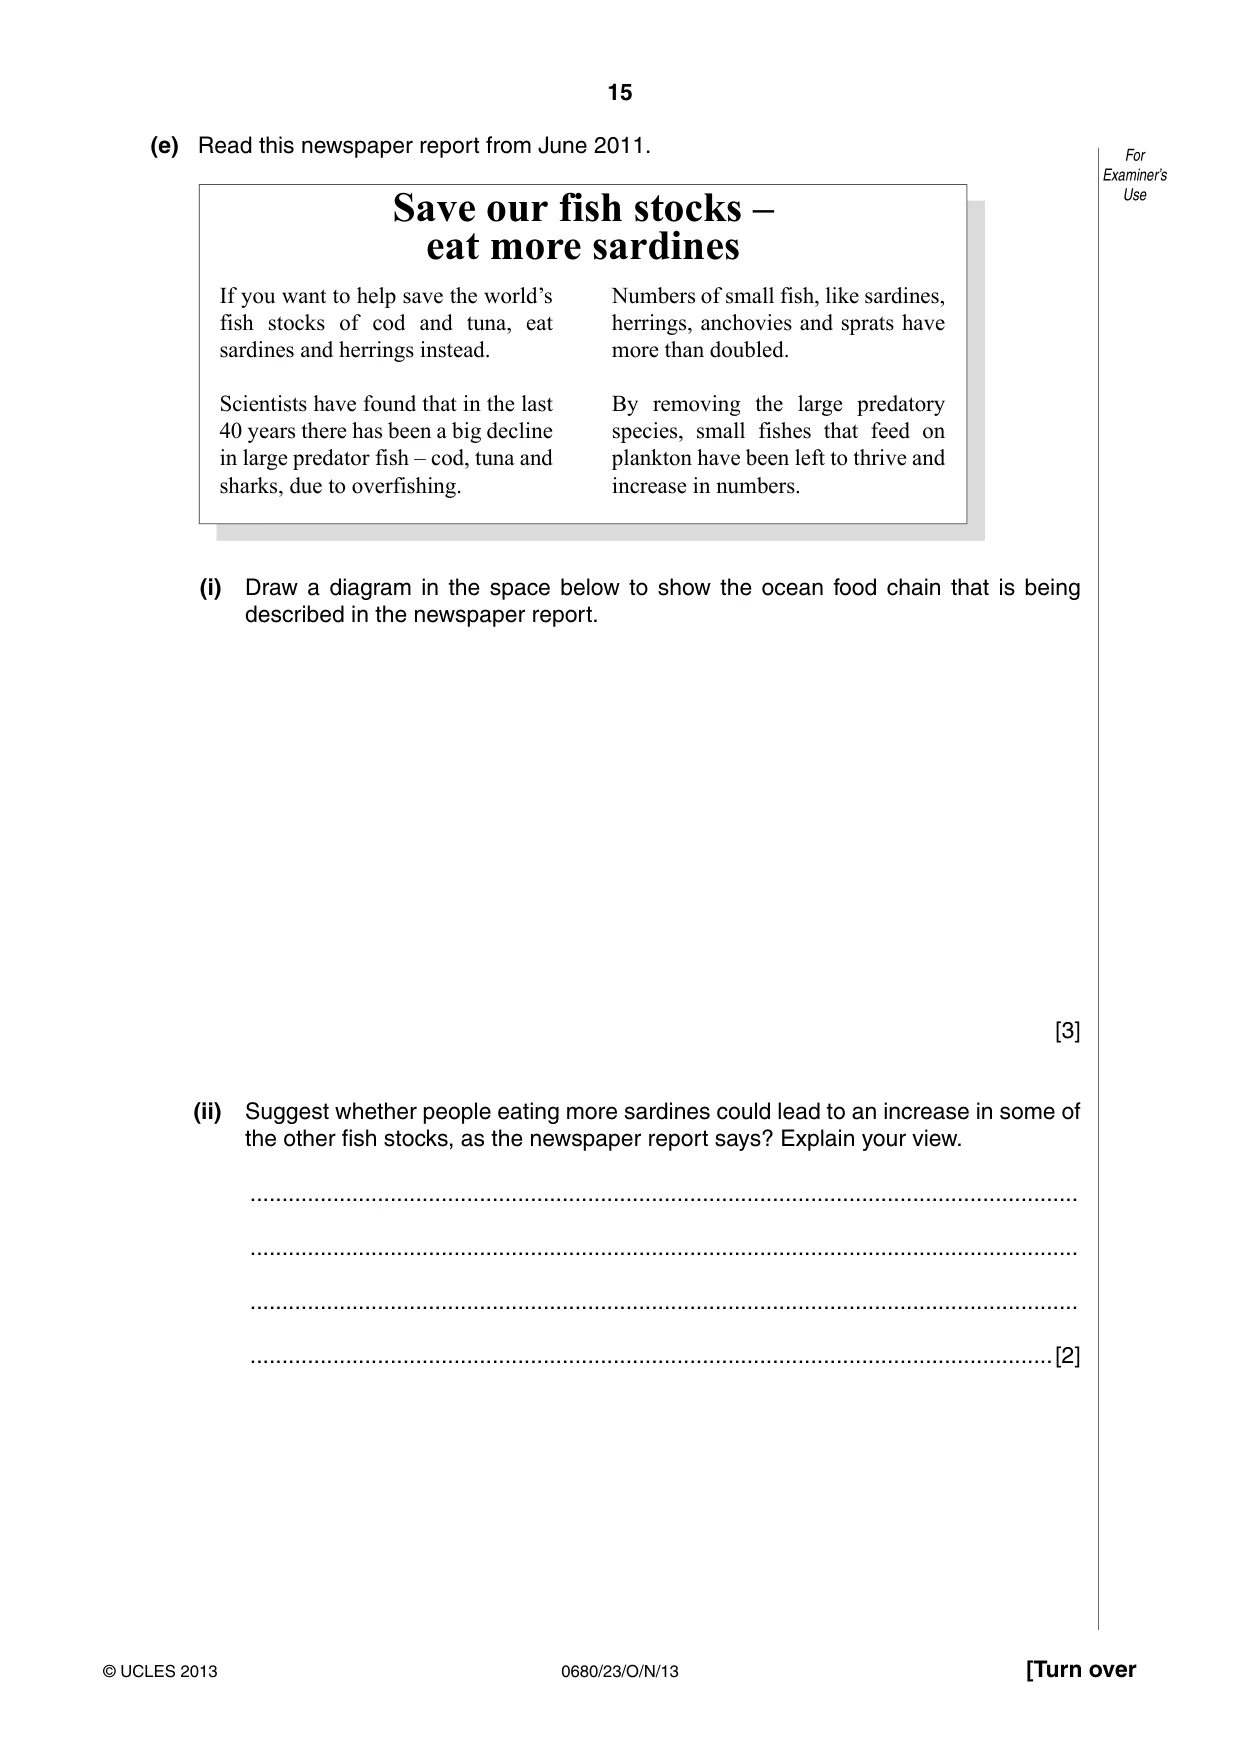
15 0680/23/O/N/13 © UCLES 2013 [Turn over For Examiner’s Use (e) Read this newspaper report from June 2011. Save our fish stocks – eat more sardines If you want to help save the world’s fish stocks of cod and tuna, eat sardines and herrings instead. Scientists have found that in the last 40 years there has been a big decline in large predator fish – cod, tuna and sharks, due to overfishing. Numbers of small fish, like sardines, herrings, anchovies and sprats have more than doubled. By removing the large predatory species, small fishes that feed on plankton have been left to thrive and increase in numbers. (i) Draw a diagram in the space below to show the ocean food chain that is being described in the newspaper report. [3] (ii) Suggest whether people eating more sardines could lead to an increase in some of the other fish stocks, as the newspaper report says? Explain your view. … … … …[2]
Question paper, page 16
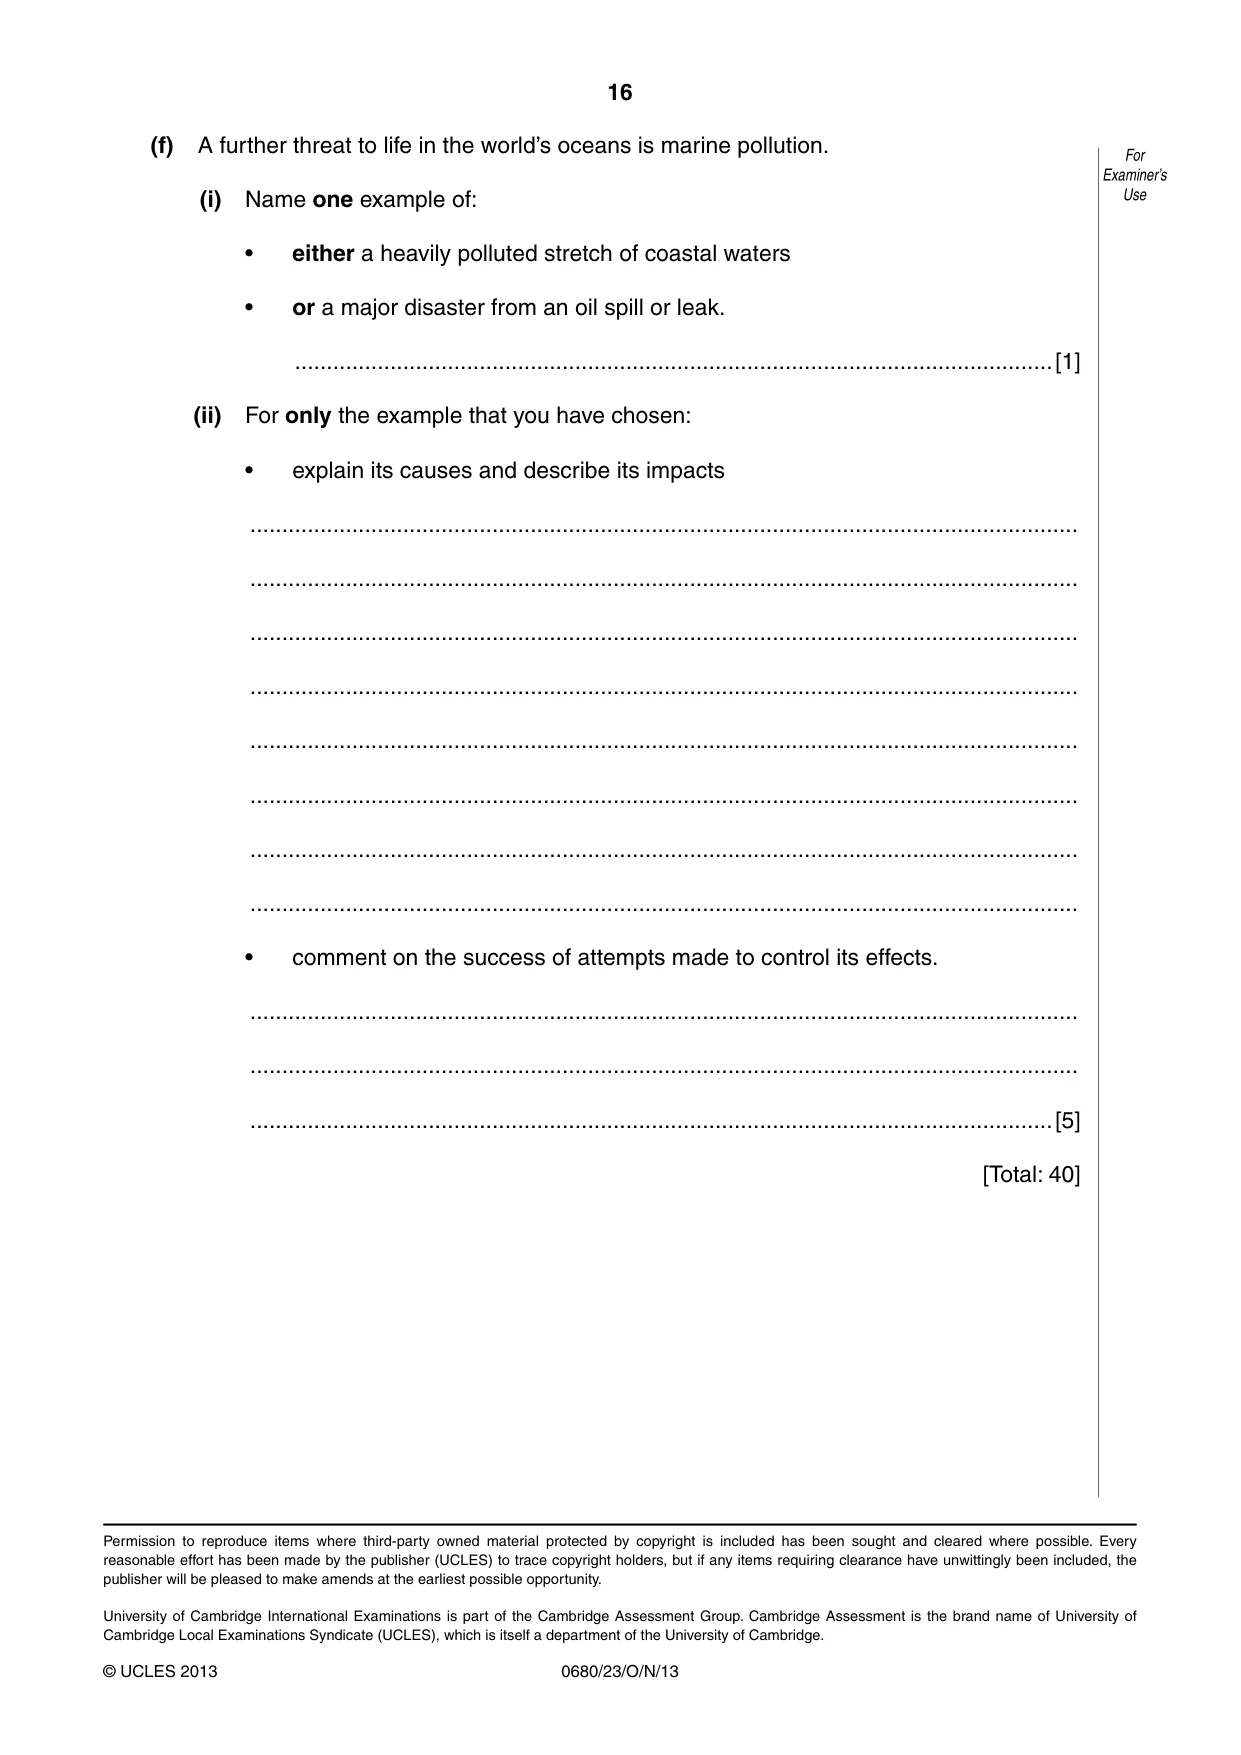
16 0680/23/O/N/13 © UCLES 2013 For Examiner’s Use (f) A further threat to life in the world’s oceans is marine pollution. (i) Name one example of: • either a heavily polluted stretch of coastal waters • or a major disaster from an oil spill or leak. …[1] (ii) For only the example that you have chosen: • explain its causes and describe its impacts … … … … … … … … • comment on the success of attempts made to control its effects. … … …[5] [Total: 40] Permission to reproduce items where third-party owned material protected by copyright is included has been sought and cleared where possible. Every reasonable effort has been made by the publisher (UCLES) to trace copyright holders, but if any items requiring clearance have unwittingly been included, the publisher will be pleased to make amends at the earliest possible opportunity. University of Cambridge International Examinations is part of the Cambridge Assessment Group. Cambridge Assessment is the brand name of University of Cambridge Local Examinations Syndicate (UCLES), which is itself a department of the University of Cambridge.
Mark scheme, page 1
CAMBRIDGE INTERNATIONAL EXAMINATIONS International General Certificate of Secondary Education MARK SCHEME for the October/November 2013 series 0680 ENVIRONMENTAL MANAGEMENT 0680/23 Paper 2, maximum raw mark 80 This mark scheme is published as an aid to teachers and candidates, to indicate the requirements of the examination. It shows the basis on which Examiners were instructed to award marks. It does not indicate the details of the discussions that took place at an Examiners’ meeting before marking began, which would have considered the acceptability of alternative answers. Mark schemes should be read in conjunction with the question paper and the Principal Examiner Report for Teachers. Cambridge will not enter into discussions about these mark schemes. Cambridge is publishing the mark schemes for the October/November 2013 series for most IGCSE, GCE Advanced Level and Advanced Subsidiary Level components and some Ordinary Level components.
Mark scheme, page 2
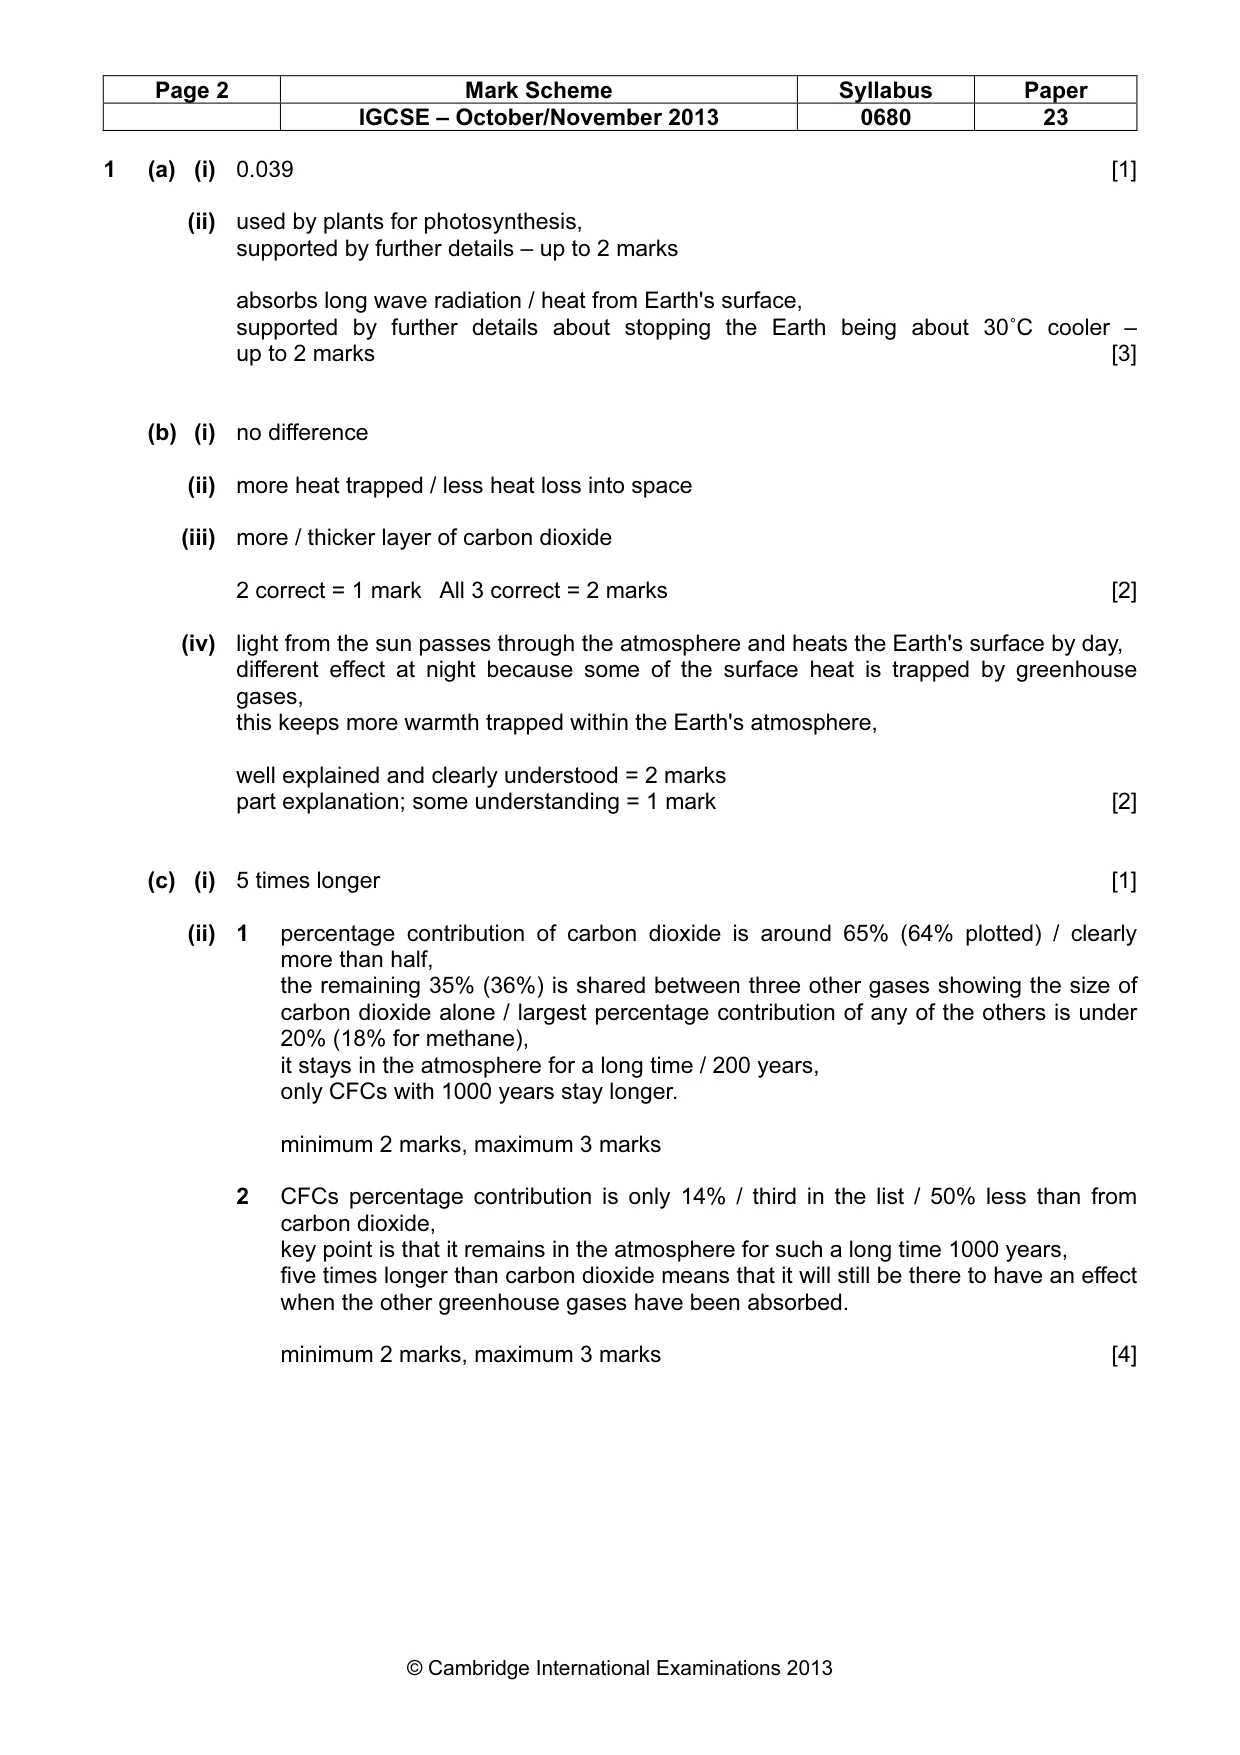
Page 2 Mark Scheme Syllabus Paper IGCSE – October/November 2013 0680 23 © Cambridge International Examinations 2013 1 (a) (i) 0.039 [1] (ii) used by plants for photosynthesis, supported by further details – up to 2 marks absorbs long wave radiation / heat from Earth's surface, supported by further details about stopping the Earth being about 30˚C cooler – up to 2 marks [3] (b) (i) no difference (ii) more heat trapped / less heat loss into space (iii) more / thicker layer of carbon dioxide 2 correct = 1 mark All 3 correct = 2 marks [2] (iv) light from the sun passes through the atmosphere and heats the Earth's surface by day, different effect at night because some of the surface heat is trapped by greenhouse gases, this keeps more warmth trapped within the Earth's atmosphere, well explained and clearly understood = 2 marks part explanation; some understanding = 1 mark [2] (c) (i) 5 times longer [1] (ii) 1 percentage contribution of carbon dioxide is around 65% (64% plotted) / clearly more than half, the remaining 35% (36%) is shared between three other gases showing the size of carbon dioxide alone / largest percentage contribution of any of the others is under 20% (18% for methane), it stays in the atmosphere for a long time / 200 years, only CFCs with 1000 years stay longer. minimum 2 marks, maximum 3 marks 2 CFCs percentage contribution is only 14% / third in the list / 50% less than from carbon dioxide, key point is that it remains in the atmosphere for such a long time 1000 years, five times longer than carbon dioxide means that it will still be there to have an effect when the other greenhouse gases have been absorbed. minimum 2 marks, maximum 3 marks [4]
Mark scheme, page 3
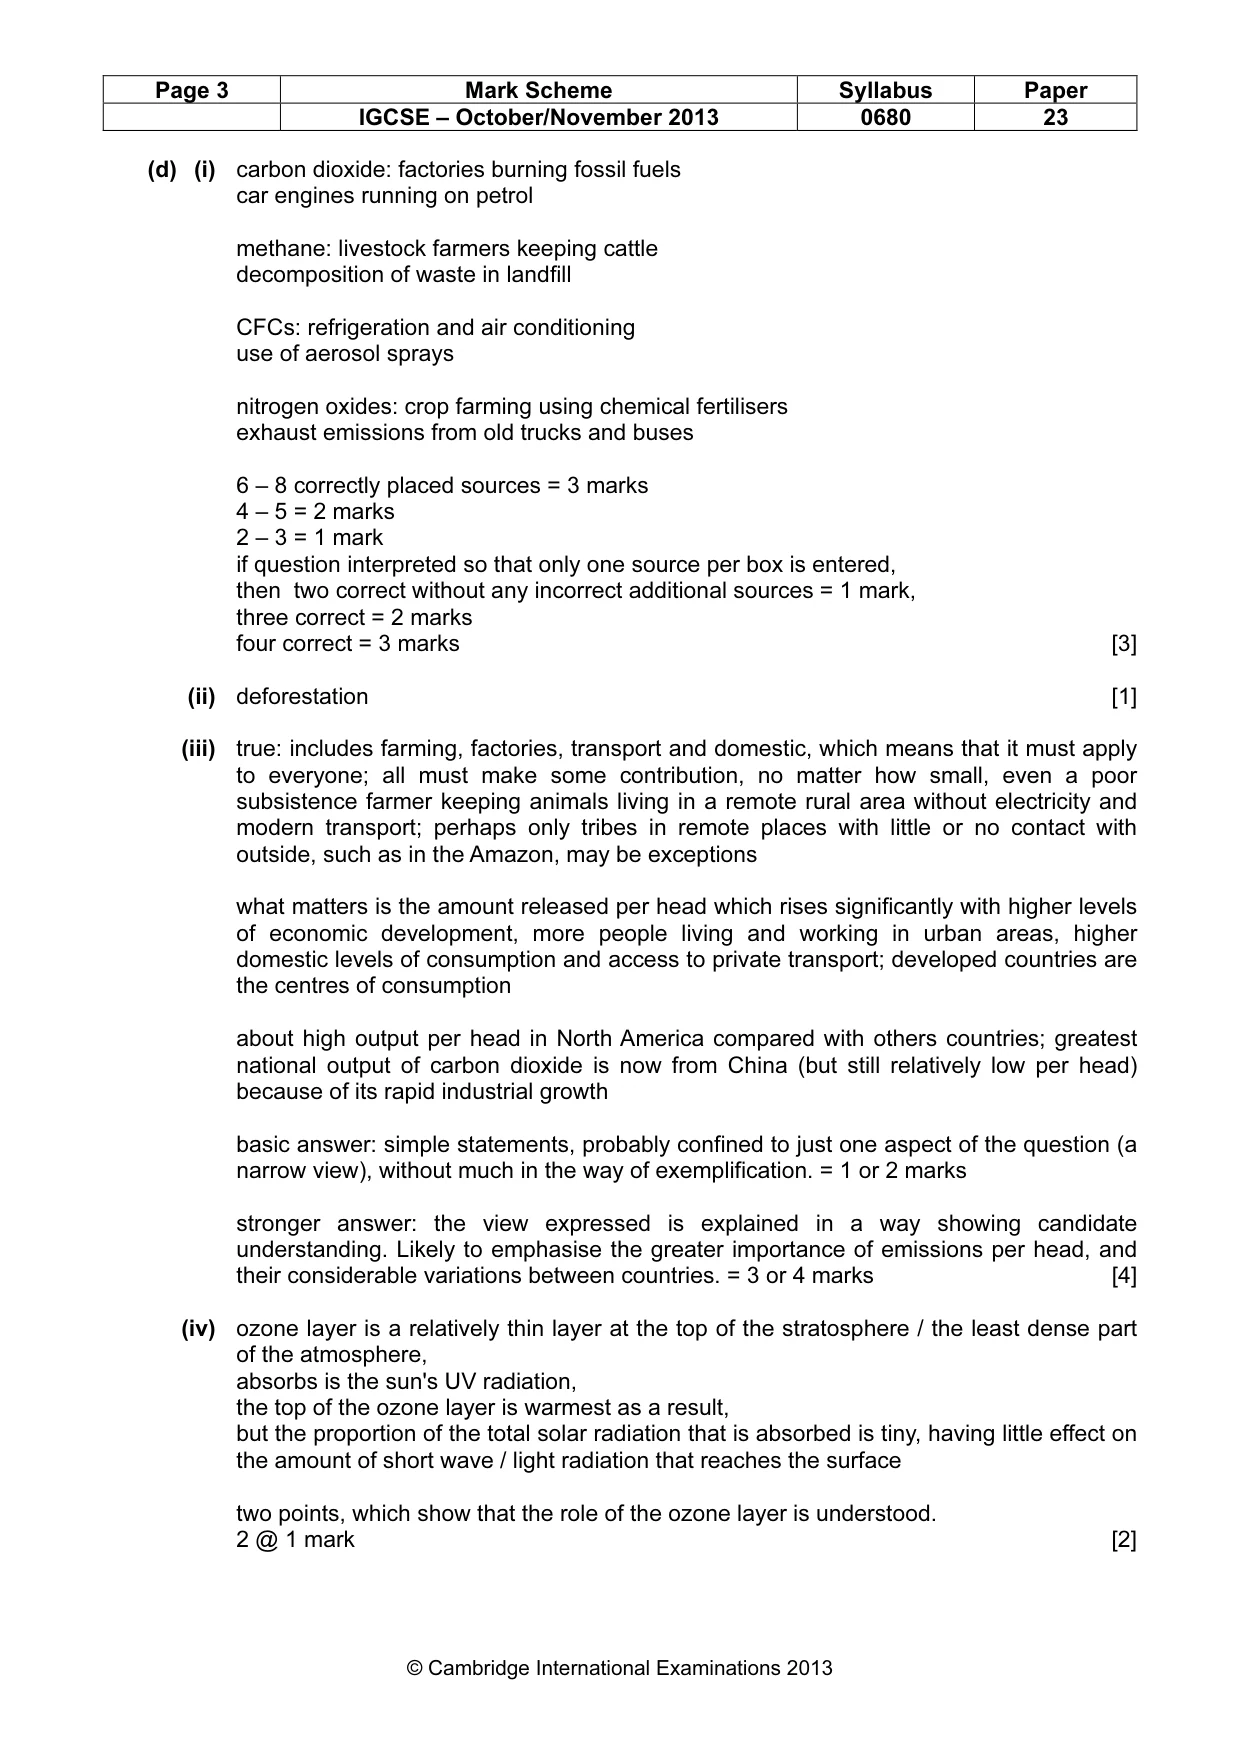
Page 3 Mark Scheme Syllabus Paper IGCSE – October/November 2013 0680 23 © Cambridge International Examinations 2013 (d) (i) carbon dioxide: factories burning fossil fuels car engines running on petrol methane: livestock farmers keeping cattle decomposition of waste in landfill CFCs: refrigeration and air conditioning use of aerosol sprays nitrogen oxides: crop farming using chemical fertilisers exhaust emissions from old trucks and buses 6 – 8 correctly placed sources = 3 marks 4 – 5 = 2 marks 2 – 3 = 1 mark if question interpreted so that only one source per box is entered, then two correct without any incorrect additional sources = 1 mark, three correct = 2 marks four correct = 3 marks [3] (ii) deforestation [1] (iii) true: includes farming, factories, transport and domestic, which means that it must apply to everyone; all must make some contribution, no matter how small, even a poor subsistence farmer keeping animals living in a remote rural area without electricity and modern transport; perhaps only tribes in remote places with little or no contact with outside, such as in the Amazon, may be exceptions what matters is the amount released per head which rises significantly with higher levels of economic development, more people living and working in urban areas, higher domestic levels of consumption and access to private transport; developed countries are the centres of consumption about high output per head in North America compared with others countries; greatest national output of carbon dioxide is now from China (but still relatively low per head) because of its rapid industrial growth basic answer: simple statements, probably confined to just one aspect of the question (a narrow view), without much in the way of exemplification. = 1 or 2 marks stronger answer: the view expressed is explained in a way showing candidate understanding. Likely to emphasise the greater importance of emissions per head, and their considerable variations between countries. = 3 or 4 marks [4] (iv) ozone layer is a relatively thin layer at the top of the stratosphere / the least dense part of the atmosphere, absorbs is the sun's UV radiation, the top of the ozone layer is warmest as a result, but the proportion of the total solar radiation that is absorbed is tiny, having little effect on the amount of short wave / light radiation that reaches the surface two points, which show that the role of the ozone layer is understood. 2 @ 1 mark [2]
Mark scheme, page 4
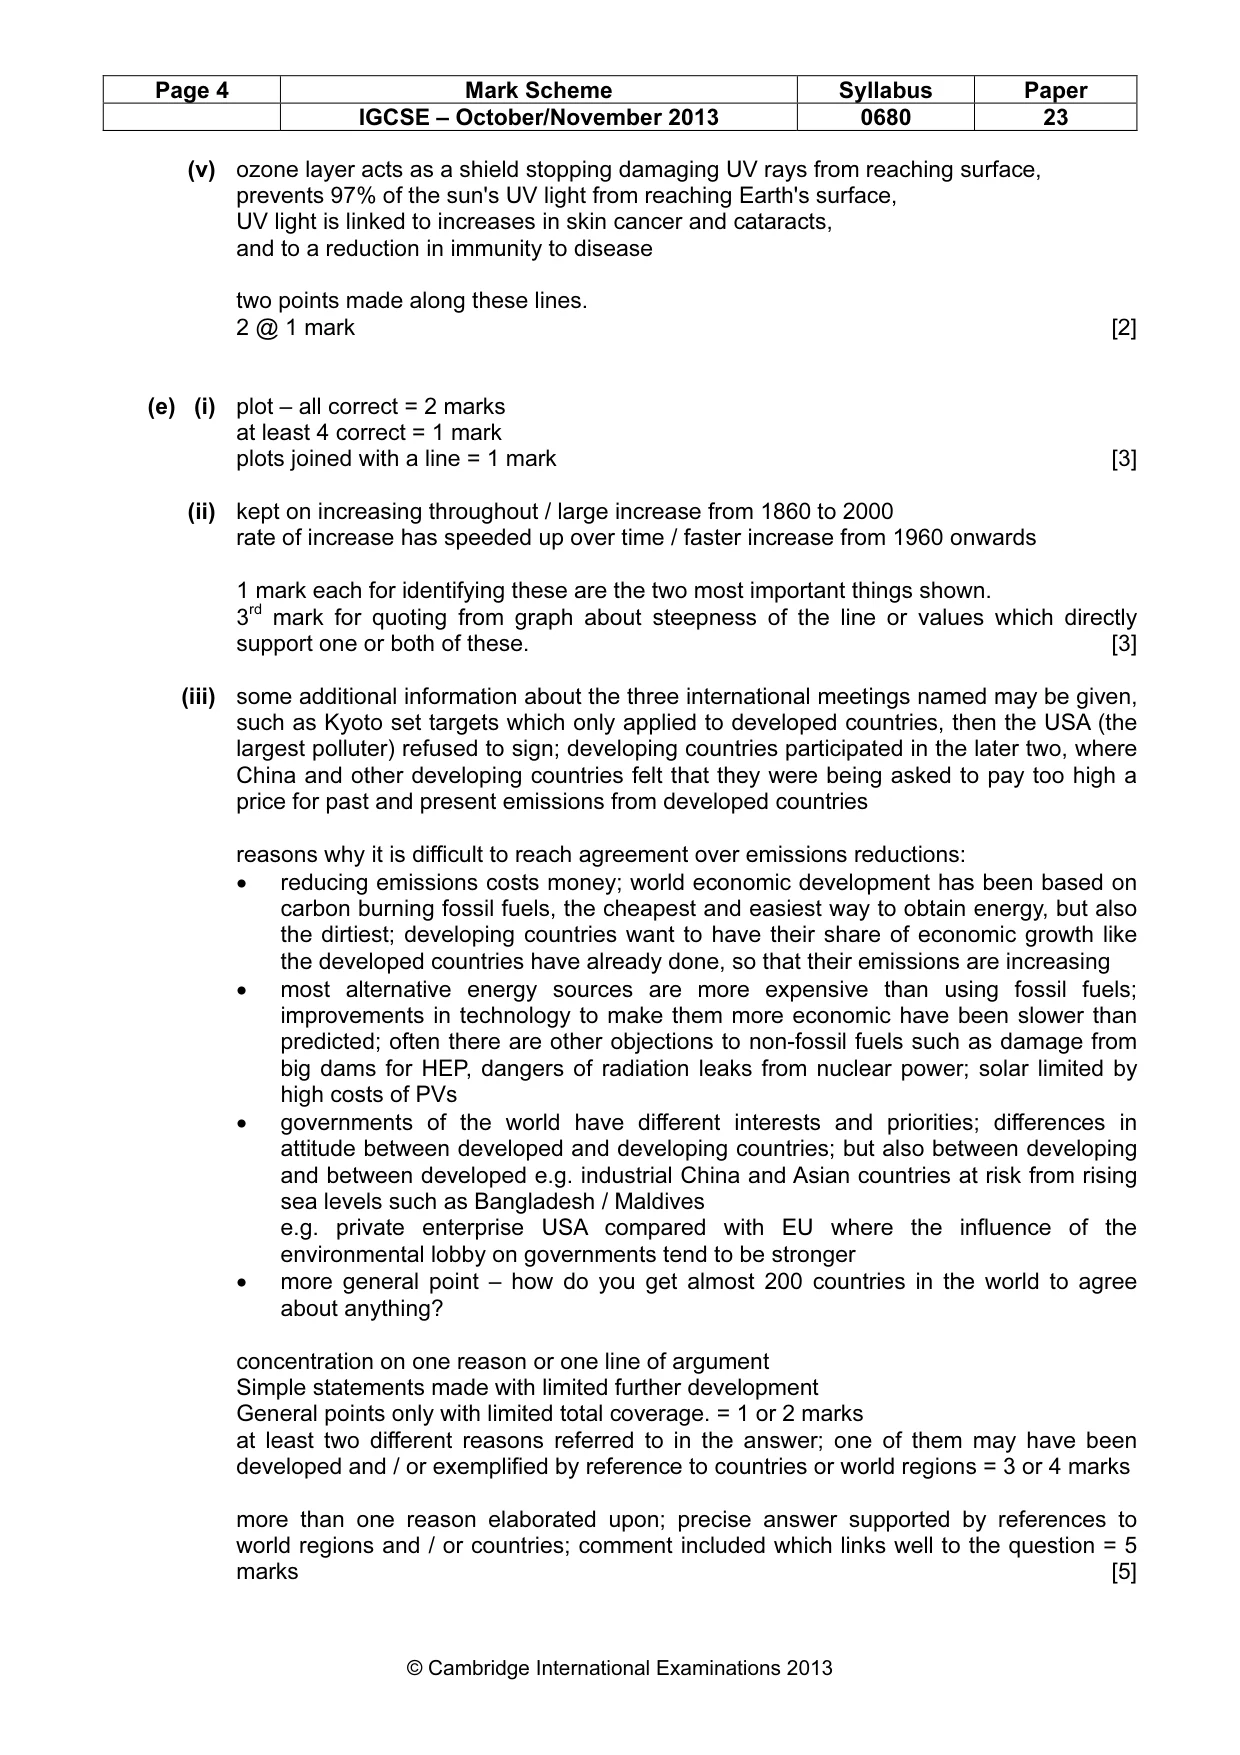
Page 4 Mark Scheme Syllabus Paper IGCSE – October/November 2013 0680 23 © Cambridge International Examinations 2013 (v) ozone layer acts as a shield stopping damaging UV rays from reaching surface, prevents 97% of the sun's UV light from reaching Earth's surface, UV light is linked to increases in skin cancer and cataracts, and to a reduction in immunity to disease two points made along these lines. 2 @ 1 mark [2] (e) (i) plot – all correct = 2 marks at least 4 correct = 1 mark plots joined with a line = 1 mark [3] (ii) kept on increasing throughout / large increase from 1860 to 2000 rate of increase has speeded up over time / faster increase from 1960 onwards 1 mark each for identifying these are the two most important things shown. 3rd mark for quoting from graph about steepness of the line or values which directly support one or both of these. [3] (iii) some additional information about the three international meetings named may be given, such as Kyoto set targets which only applied to developed countries, then the USA (the largest polluter) refused to sign; developing countries participated in the later two, where China and other developing countries felt that they were being asked to pay too high a price for past and present emissions from developed countries reasons why it is difficult to reach agreement over emissions reductions: • reducing emissions costs money; world economic development has been based on carbon burning fossil fuels, the cheapest and easiest way to obtain energy, but also the dirtiest; developing countries want to have their share of economic growth like the developed countries have already done, so that their emissions are increasing • most alternative energy sources are more expensive than using fossil fuels; improvements in technology to make them more economic have been slower than predicted; often there are other objections to non-fossil fuels such as damage from big dams for HEP, dangers of radiation leaks from nuclear power; solar limited by high costs of PVs • governments of the world have different interests and priorities; differences in attitude between developed and developing countries; but also between developing and between developed e.g. industrial China and Asian countries at risk from rising sea levels such as Bangladesh / Maldives e.g. private enterprise USA compared with EU where the influence of the environmental lobby on governments tend to be stronger • more general point – how do you get almost 200 countries in the world to agree about anything? concentration on one reason or one line of argument Simple statements made with limited further development General points only with limited total coverage. = 1 or 2 marks at least two different reasons referred to in the answer; one of them may have been developed and / or exemplified by reference to countries or world regions = 3 or 4 marks more than one reason elaborated upon; precise answer supported by references to world regions and / or countries; comment included which links well to the question = 5 marks [5]
Mark scheme, page 5
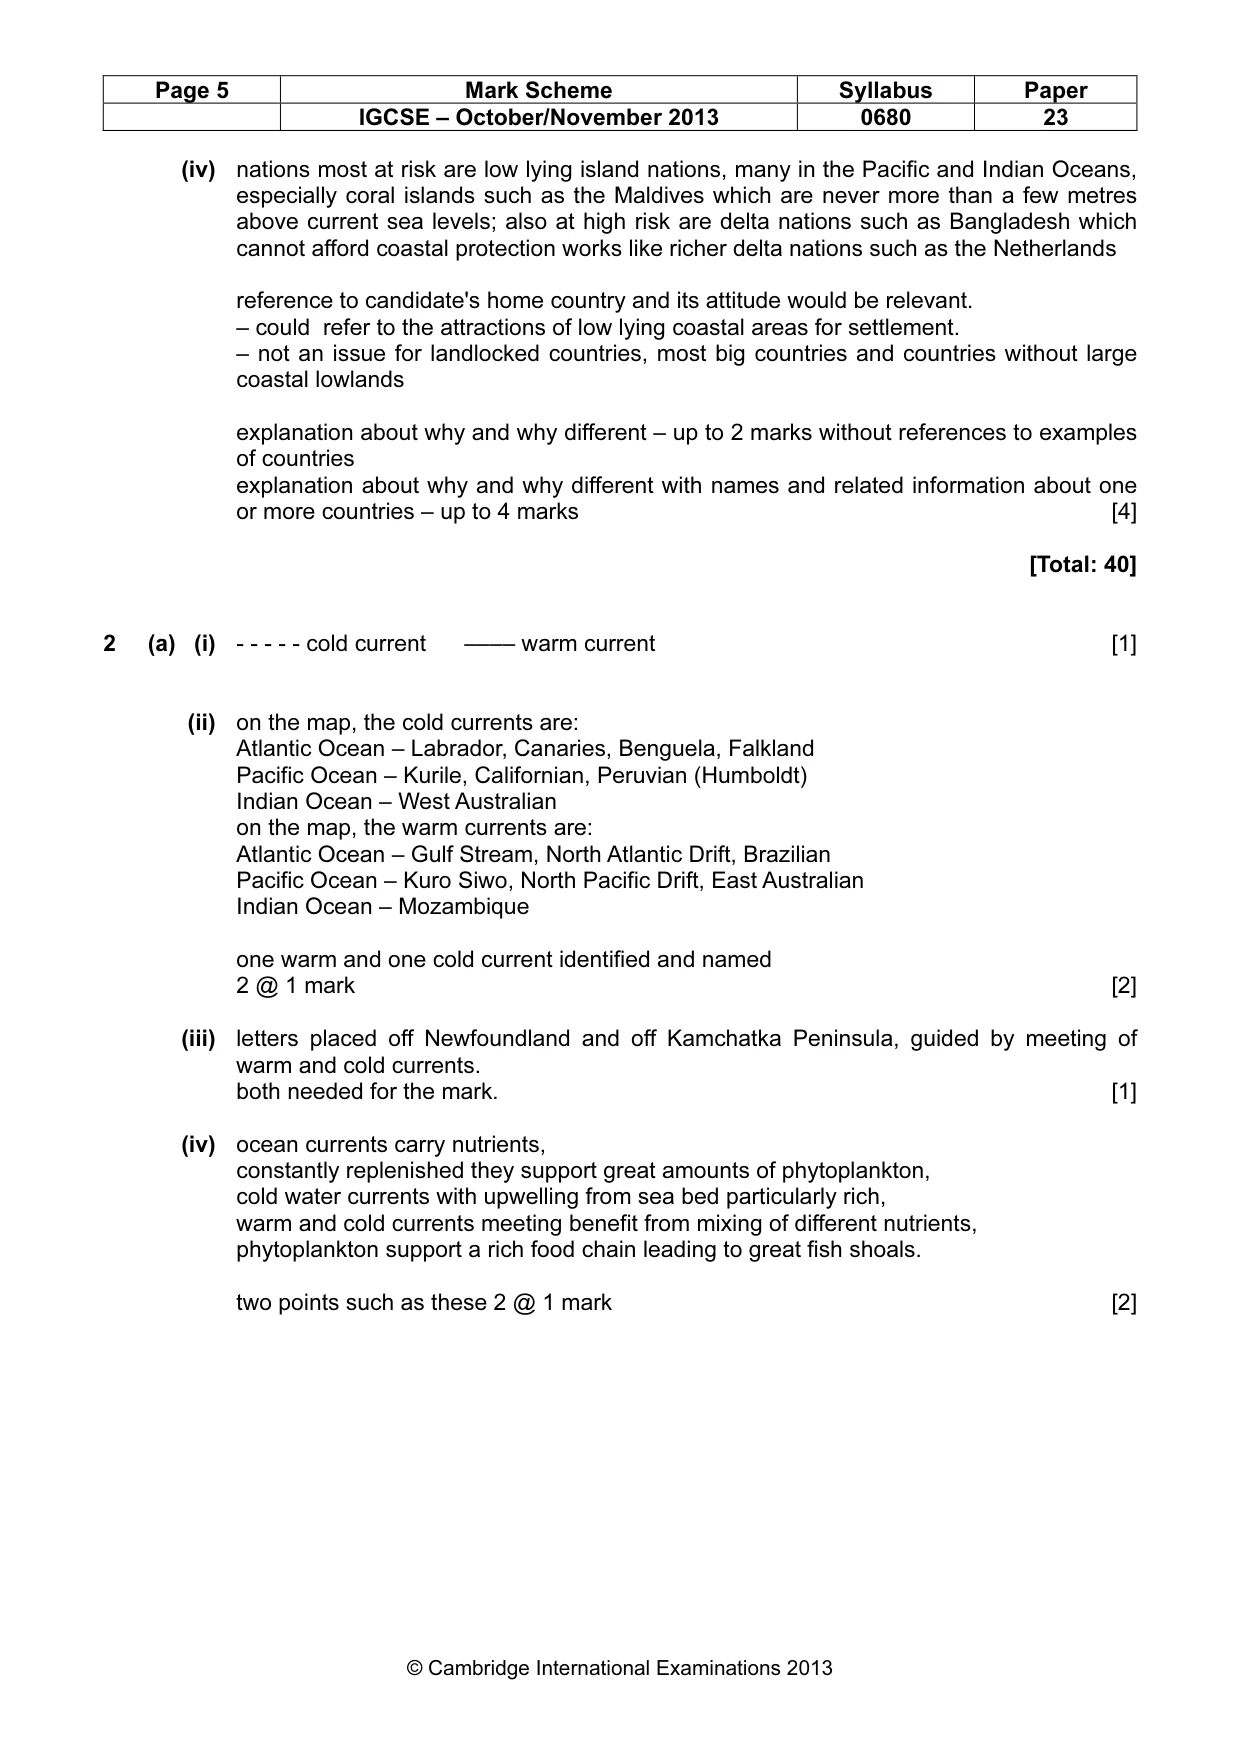
Page 5 Mark Scheme Syllabus Paper IGCSE – October/November 2013 0680 23 © Cambridge International Examinations 2013 (iv) nations most at risk are low lying island nations, many in the Pacific and Indian Oceans, especially coral islands such as the Maldives which are never more than a few metres above current sea levels; also at high risk are delta nations such as Bangladesh which cannot afford coastal protection works like richer delta nations such as the Netherlands reference to candidate's home country and its attitude would be relevant. – could refer to the attractions of low lying coastal areas for settlement. – not an issue for landlocked countries, most big countries and countries without large coastal lowlands explanation about why and why different – up to 2 marks without references to examples of countries explanation about why and why different with names and related information about one or more countries – up to 4 marks [4] [Total: 40] 2 (a) (i) - - - - - cold current –––– warm current [1] (ii) on the map, the cold currents are: Atlantic Ocean – Labrador, Canaries, Benguela, Falkland Pacific Ocean – Kurile, Californian, Peruvian (Humboldt) Indian Ocean – West Australian on the map, the warm currents are: Atlantic Ocean – Gulf Stream, North Atlantic Drift, Brazilian Pacific Ocean – Kuro Siwo, North Pacific Drift, East Australian Indian Ocean – Mozambique one warm and one cold current identified and named 2 @ 1 mark [2] (iii) letters placed off Newfoundland and off Kamchatka Peninsula, guided by meeting of warm and cold currents. both needed for the mark. [1] (iv) ocean currents carry nutrients, constantly replenished they support great amounts of phytoplankton, cold water currents with upwelling from sea bed particularly rich, warm and cold currents meeting benefit from mixing of different nutrients, phytoplankton support a rich food chain leading to great fish shoals. two points such as these 2 @ 1 mark [2]
Mark scheme, page 6
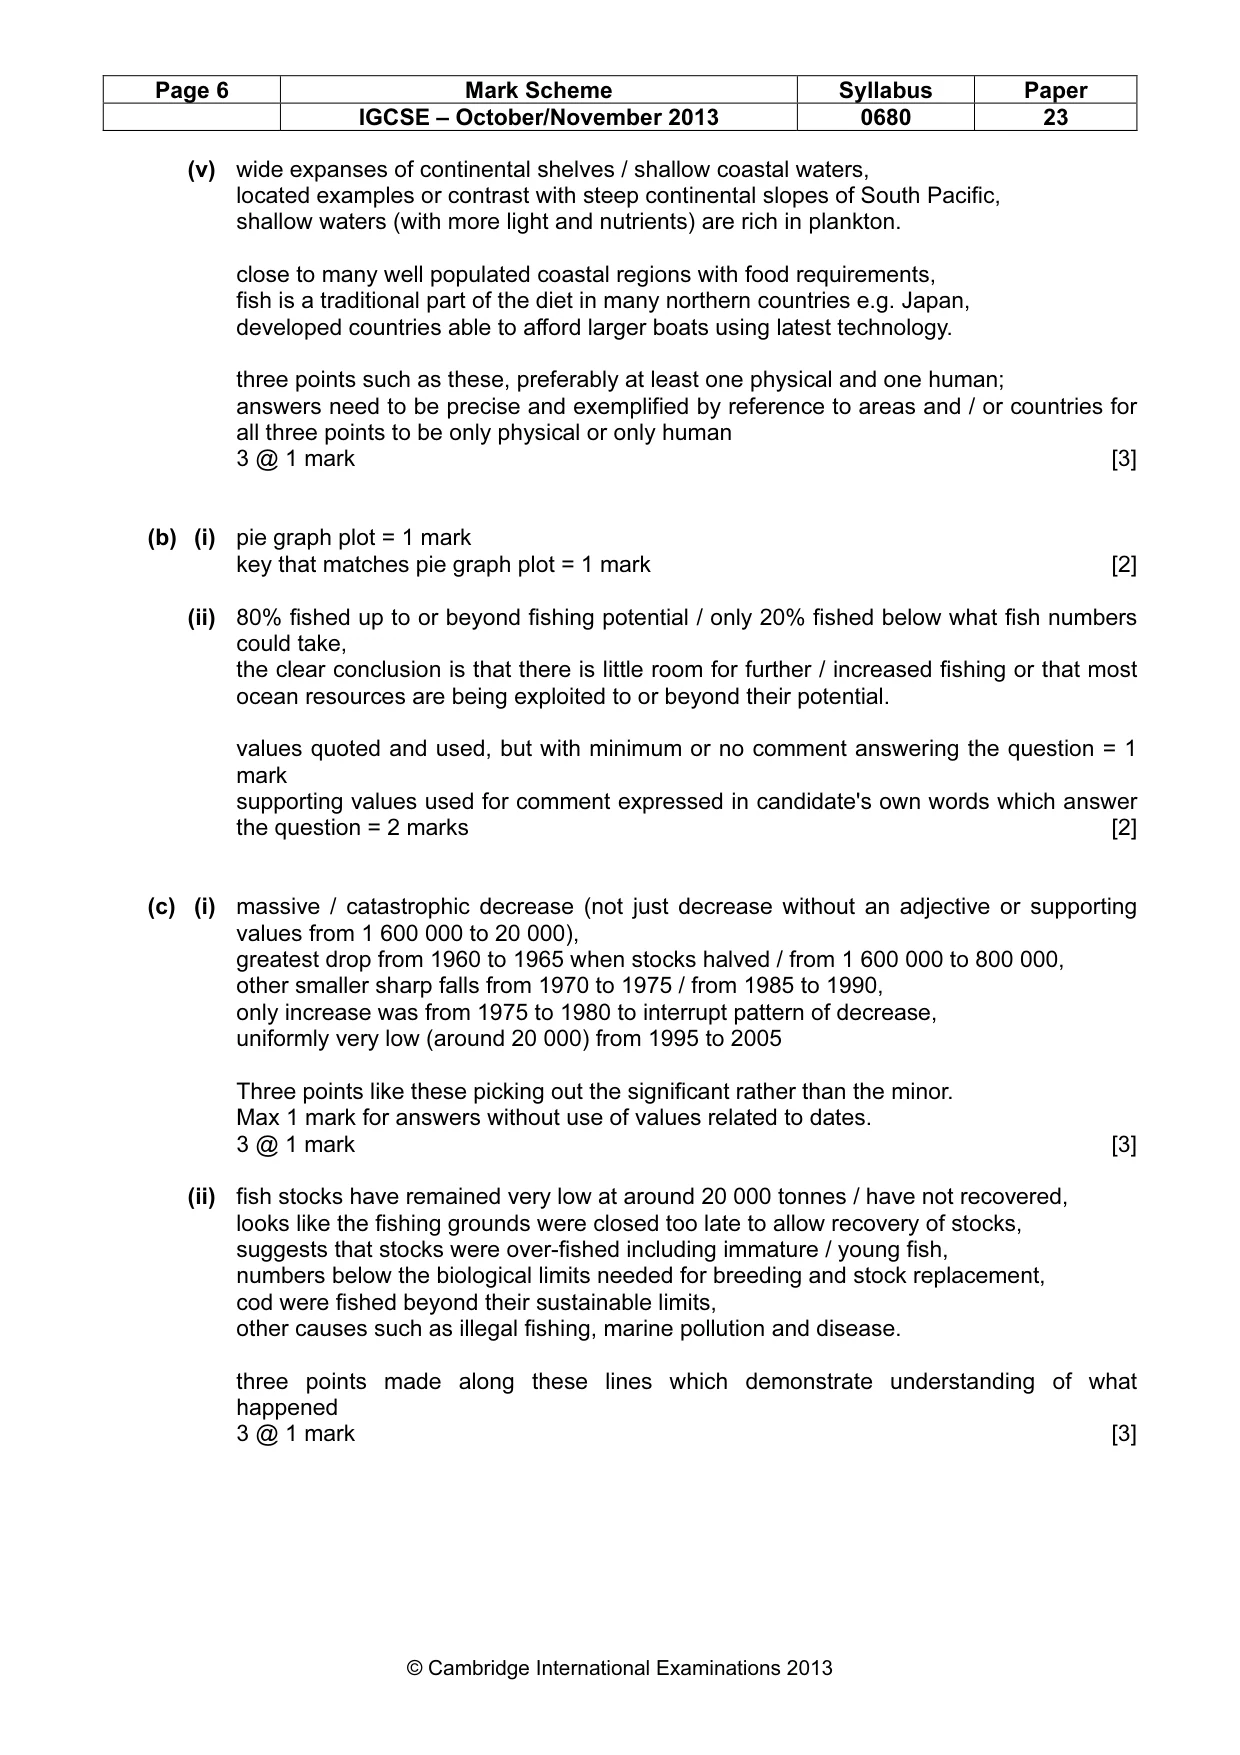
Page 6 Mark Scheme Syllabus Paper IGCSE – October/November 2013 0680 23 © Cambridge International Examinations 2013 (v) wide expanses of continental shelves / shallow coastal waters, located examples or contrast with steep continental slopes of South Pacific, shallow waters (with more light and nutrients) are rich in plankton. close to many well populated coastal regions with food requirements, fish is a traditional part of the diet in many northern countries e.g. Japan, developed countries able to afford larger boats using latest technology. three points such as these, preferably at least one physical and one human; answers need to be precise and exemplified by reference to areas and / or countries for all three points to be only physical or only human 3 @ 1 mark [3] (b) (i) pie graph plot = 1 mark key that matches pie graph plot = 1 mark [2] (ii) 80% fished up to or beyond fishing potential / only 20% fished below what fish numbers could take, the clear conclusion is that there is little room for further / increased fishing or that most ocean resources are being exploited to or beyond their potential. values quoted and used, but with minimum or no comment answering the question = 1 mark supporting values used for comment expressed in candidate's own words which answer the question = 2 marks [2] (c) (i) massive / catastrophic decrease (not just decrease without an adjective or supporting values from 1 600 000 to 20 000), greatest drop from 1960 to 1965 when stocks halved / from 1 600 000 to 800 000, other smaller sharp falls from 1970 to 1975 / from 1985 to 1990, only increase was from 1975 to 1980 to interrupt pattern of decrease, uniformly very low (around 20 000) from 1995 to 2005 Three points like these picking out the significant rather than the minor. Max 1 mark for answers without use of values related to dates. 3 @ 1 mark [3] (ii) fish stocks have remained very low at around 20 000 tonnes / have not recovered, looks like the fishing grounds were closed too late to allow recovery of stocks, suggests that stocks were over-fished including immature / young fish, numbers below the biological limits needed for breeding and stock replacement, cod were fished beyond their sustainable limits, other causes such as illegal fishing, marine pollution and disease. three points made along these lines which demonstrate understanding of what happened 3 @ 1 mark [3]
Mark scheme, page 7
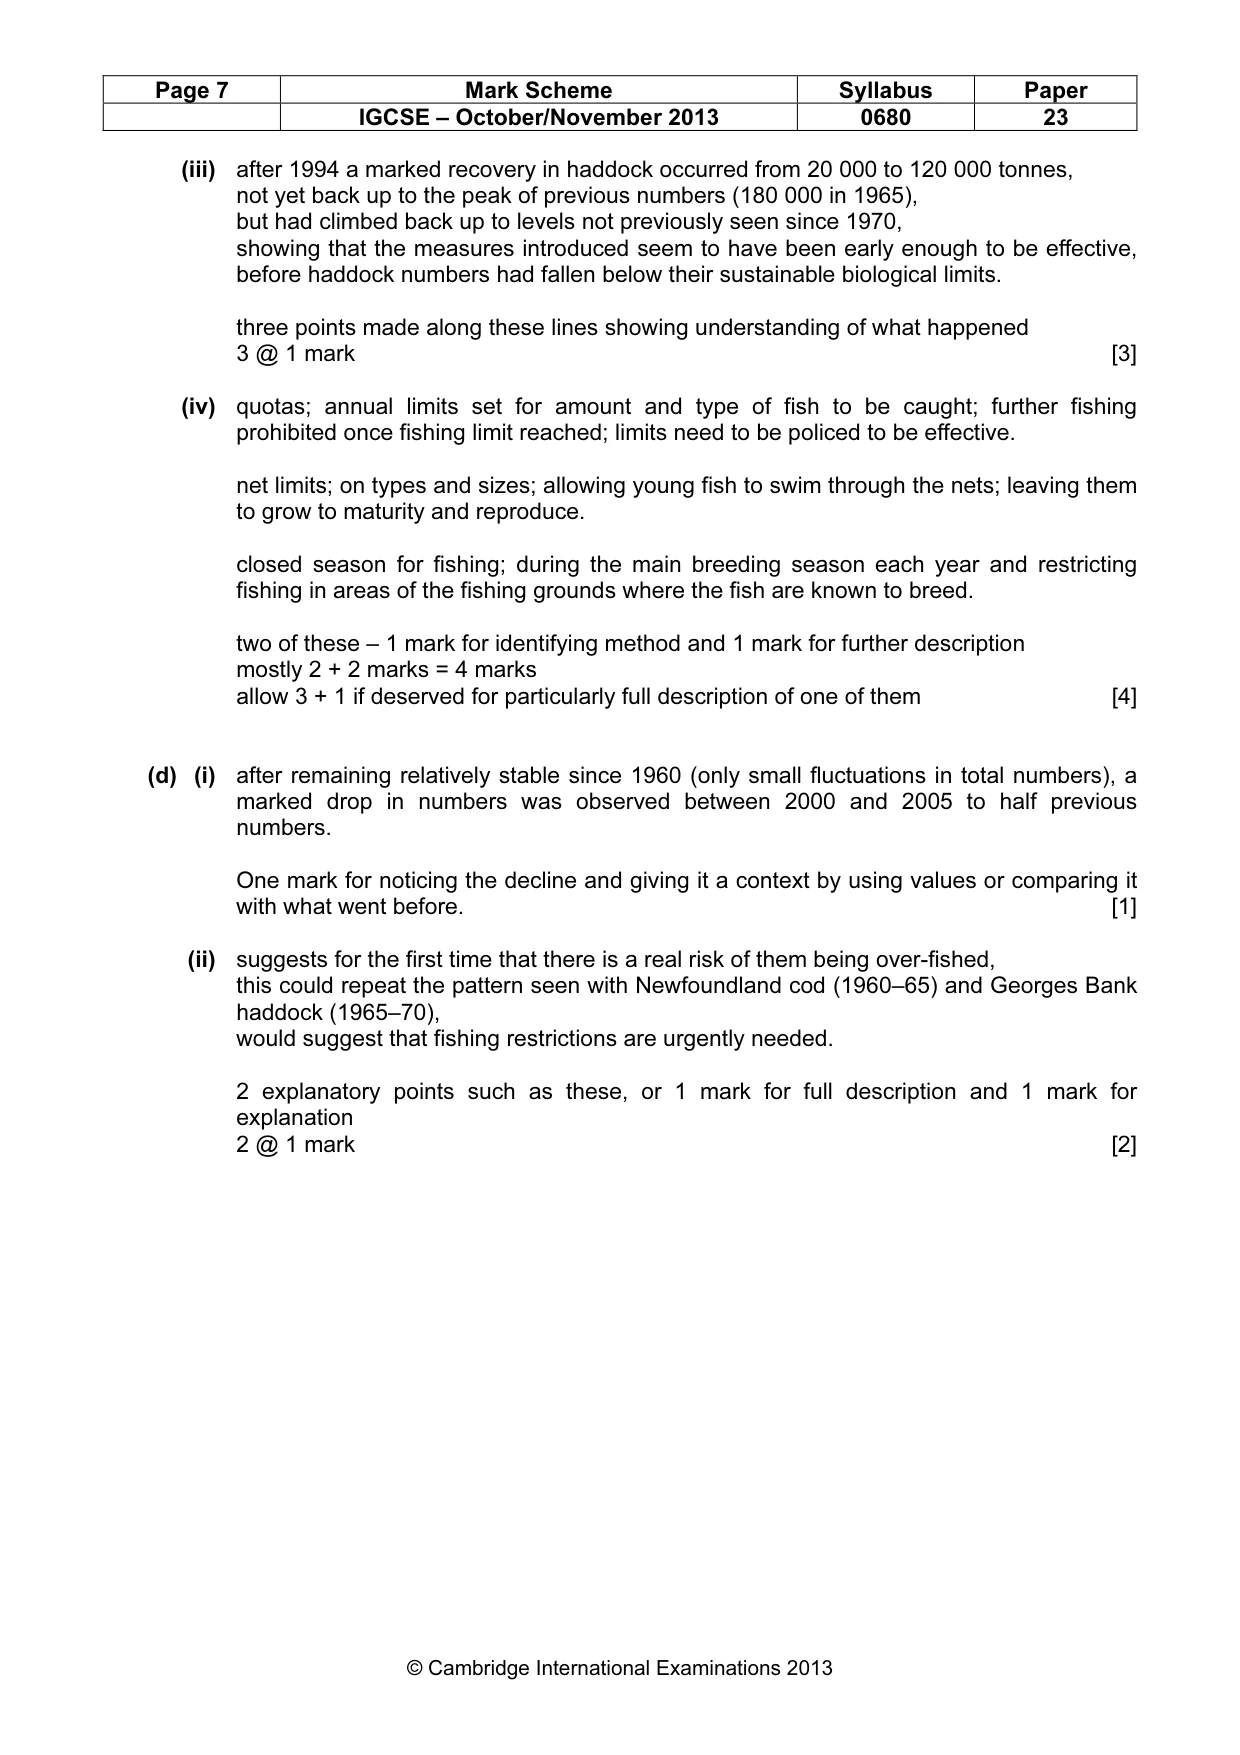
Page 7 Mark Scheme Syllabus Paper IGCSE – October/November 2013 0680 23 © Cambridge International Examinations 2013 (iii) after 1994 a marked recovery in haddock occurred from 20 000 to 120 000 tonnes, not yet back up to the peak of previous numbers (180 000 in 1965), but had climbed back up to levels not previously seen since 1970, showing that the measures introduced seem to have been early enough to be effective, before haddock numbers had fallen below their sustainable biological limits. three points made along these lines showing understanding of what happened 3 @ 1 mark [3] (iv) quotas; annual limits set for amount and type of fish to be caught; further fishing prohibited once fishing limit reached; limits need to be policed to be effective. net limits; on types and sizes; allowing young fish to swim through the nets; leaving them to grow to maturity and reproduce. closed season for fishing; during the main breeding season each year and restricting fishing in areas of the fishing grounds where the fish are known to breed. two of these – 1 mark for identifying method and 1 mark for further description mostly 2 + 2 marks = 4 marks allow 3 + 1 if deserved for particularly full description of one of them [4] (d) (i) after remaining relatively stable since 1960 (only small fluctuations in total numbers), a marked drop in numbers was observed between 2000 and 2005 to half previous numbers. One mark for noticing the decline and giving it a context by using values or comparing it with what went before. [1] (ii) suggests for the first time that there is a real risk of them being over-fished, this could repeat the pattern seen with Newfoundland cod (1960–65) and Georges Bank haddock (1965–70), would suggest that fishing restrictions are urgently needed. 2 explanatory points such as these, or 1 mark for full description and 1 mark for explanation 2 @ 1 mark [2]
Mark scheme, page 8
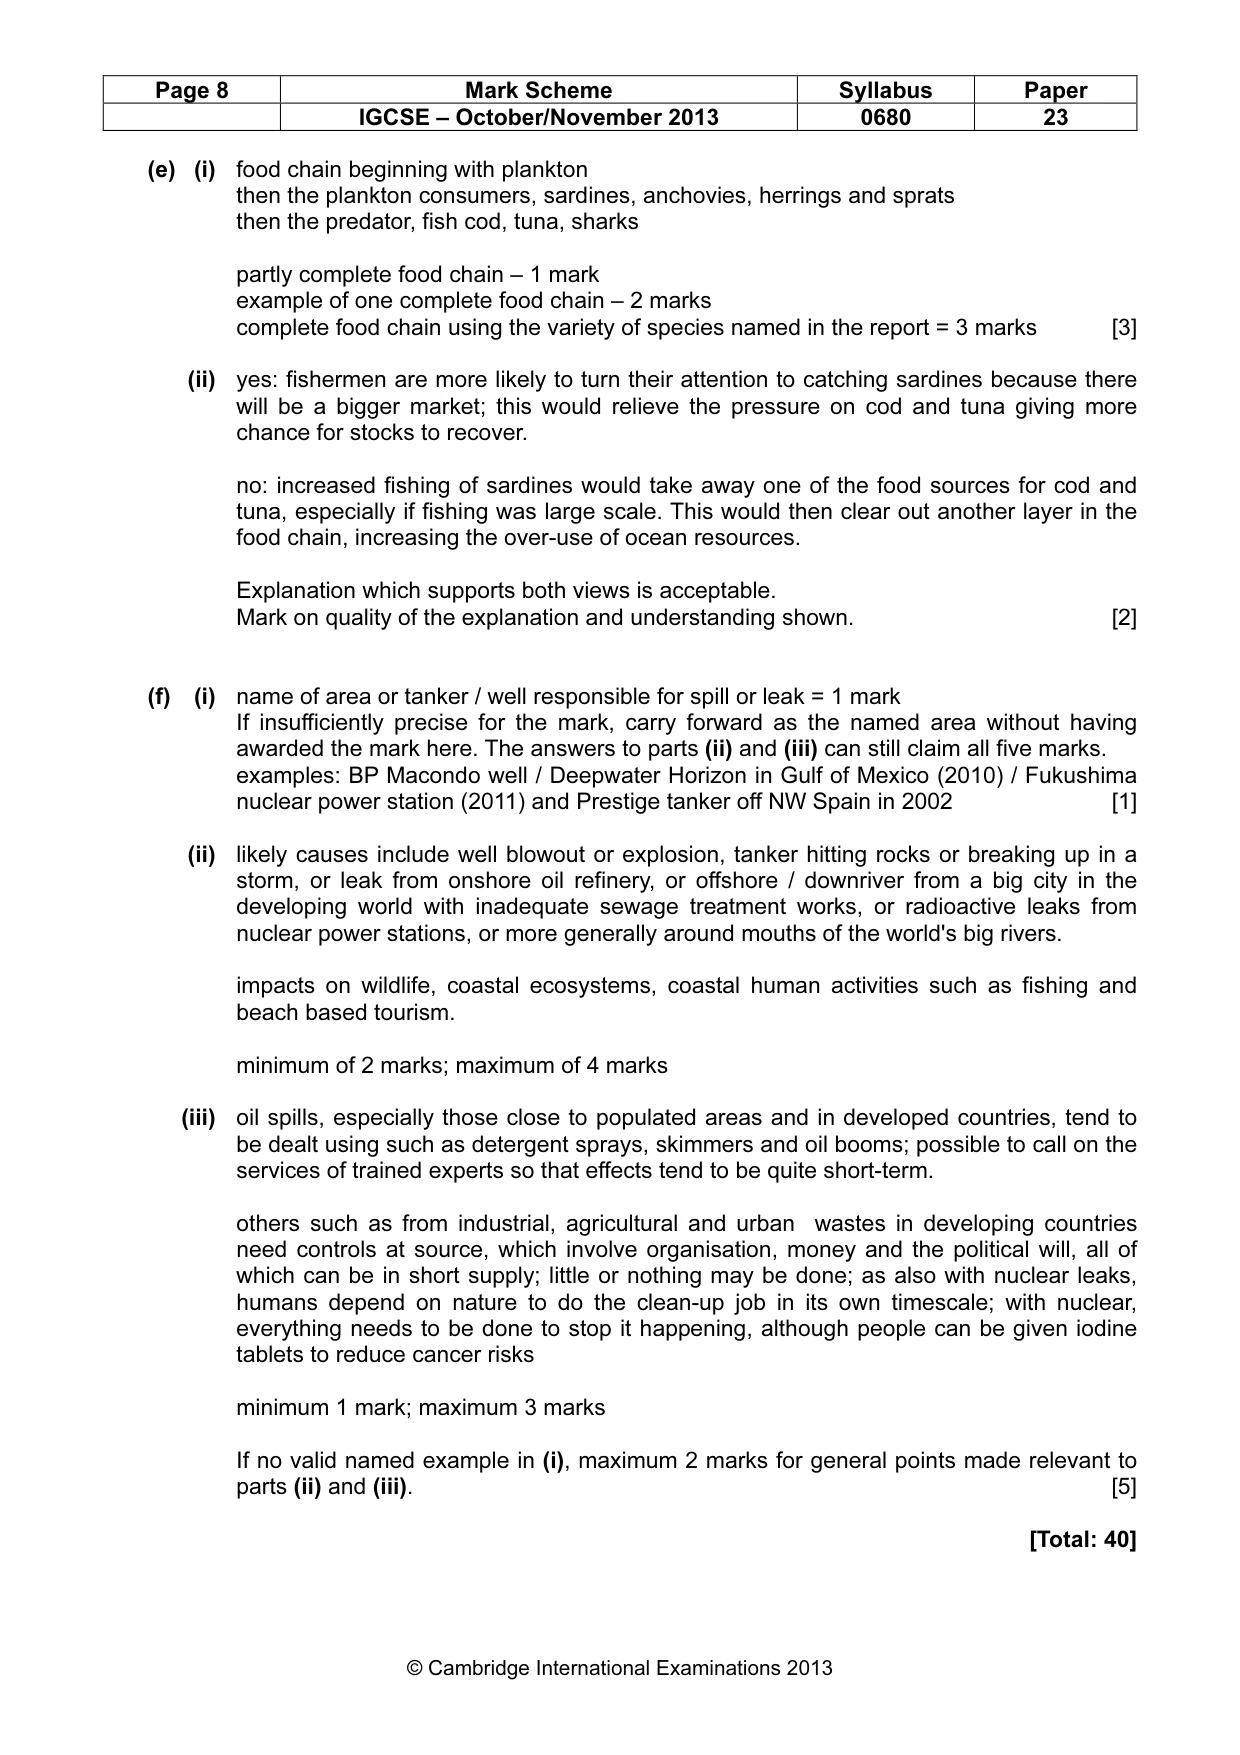
Page 8 Mark Scheme Syllabus Paper IGCSE – October/November 2013 0680 23 © Cambridge International Examinations 2013 (e) (i) food chain beginning with plankton then the plankton consumers, sardines, anchovies, herrings and sprats then the predator, fish cod, tuna, sharks partly complete food chain – 1 mark example of one complete food chain – 2 marks complete food chain using the variety of species named in the report = 3 marks [3] (ii) yes: fishermen are more likely to turn their attention to catching sardines because there will be a bigger market; this would relieve the pressure on cod and tuna giving more chance for stocks to recover. no: increased fishing of sardines would take away one of the food sources for cod and tuna, especially if fishing was large scale. This would then clear out another layer in the food chain, increasing the over-use of ocean resources. Explanation which supports both views is acceptable. Mark on quality of the explanation and understanding shown. [2] (f) (i) name of area or tanker / well responsible for spill or leak = 1 mark If insufficiently precise for the mark, carry forward as the named area without having awarded the mark here. The answers to parts (ii) and (iii) can still claim all five marks. examples: BP Macondo well / Deepwater Horizon in Gulf of Mexico (2010) / Fukushima nuclear power station (2011) and Prestige tanker off NW Spain in 2002 [1] (ii) likely causes include well blowout or explosion, tanker hitting rocks or breaking up in a storm, or leak from onshore oil refinery, or offshore / downriver from a big city in the developing world with inadequate sewage treatment works, or radioactive leaks from nuclear power stations, or more generally around mouths of the world's big rivers. impacts on wildlife, coastal ecosystems, coastal human activities such as fishing and beach based tourism. minimum of 2 marks; maximum of 4 marks (iii) oil spills, especially those close to populated areas and in developed countries, tend to be dealt using such as detergent sprays, skimmers and oil booms; possible to call on the services of trained experts so that effects tend to be quite short-term. others such as from industrial, agricultural and urban wastes in developing countries need controls at source, which involve organisation, money and the political will, all of which can be in short supply; little or nothing may be done; as also with nuclear leaks, humans depend on nature to do the clean-up job in its own timescale; with nuclear, everything needs to be done to stop it happening, although people can be given iodine tablets to reduce cancer risks minimum 1 mark; maximum 3 marks If no valid named example in (i), maximum 2 marks for general points made relevant to parts (ii) and (iii). [5] [Total: 40]
What you needed in this session
Cambridge’s own grade thresholds for 2013 Oct/Nov, Paper 2 · Variant 3. A higher threshold means an easier paper — the bar moves with how the cohort did.