Cambridge IGCSE Environmental Management 0680 — 2013 May/June Paper 4 · Variant 3
0680/43/M/J/13 · 60 marks · ≈68 min
The question paper and its mark scheme, free to read here and free to download. This is Cambridge’s own paper, exactly as it was sat.
Question paper16 pages
Mark scheme4 pages
Answers below. Sit the paper first if you are practising.
Paper as text
Question paper, page 1
This document consists of 16 printed pages. DC (CW/CGW) 65645/3 © UCLES 2013 [Turn over UNIVERSITY OF CAMBRIDGE INTERNATIONAL EXAMINATIONS International General Certificate of Secondary Education * 2 1 2 1 8 6 4 0 3 7 * ENVIRONMENTAL MANAGEMENT 0680/43 Alternative to Coursework May/June 2013 1 hour 30 minutes Candidates answer on the Question Paper. Additional Materials: Ruler READ THESE INSTRUCTIONS FIRST Write your Centre number, candidate number and name on all the work you hand in. Write in dark blue or black pen. You may use a soft pencil for any diagrams, graphs or rough working. Do not use staples, paper clips, highlighters, glue or correction fluid. Electronic calculators may be used. DO NOT WRITE IN ANY BARCODES. Answer all questions. Study the appropriate Source materials before you start to write your answers. Credit will be given for appropriate selection and use of data in your answers and for relevant interpretation of these data. Suggestions for data sources are given in some questions. You may use the source data to draw diagrams and graphs or to do calculations to illustrate your answers. At the end of the examination, fasten all your work securely together. The number of marks is given in brackets [ ] at the end of each question or part question. For Examiner’s Use 1 2 Total
Question paper, page 2
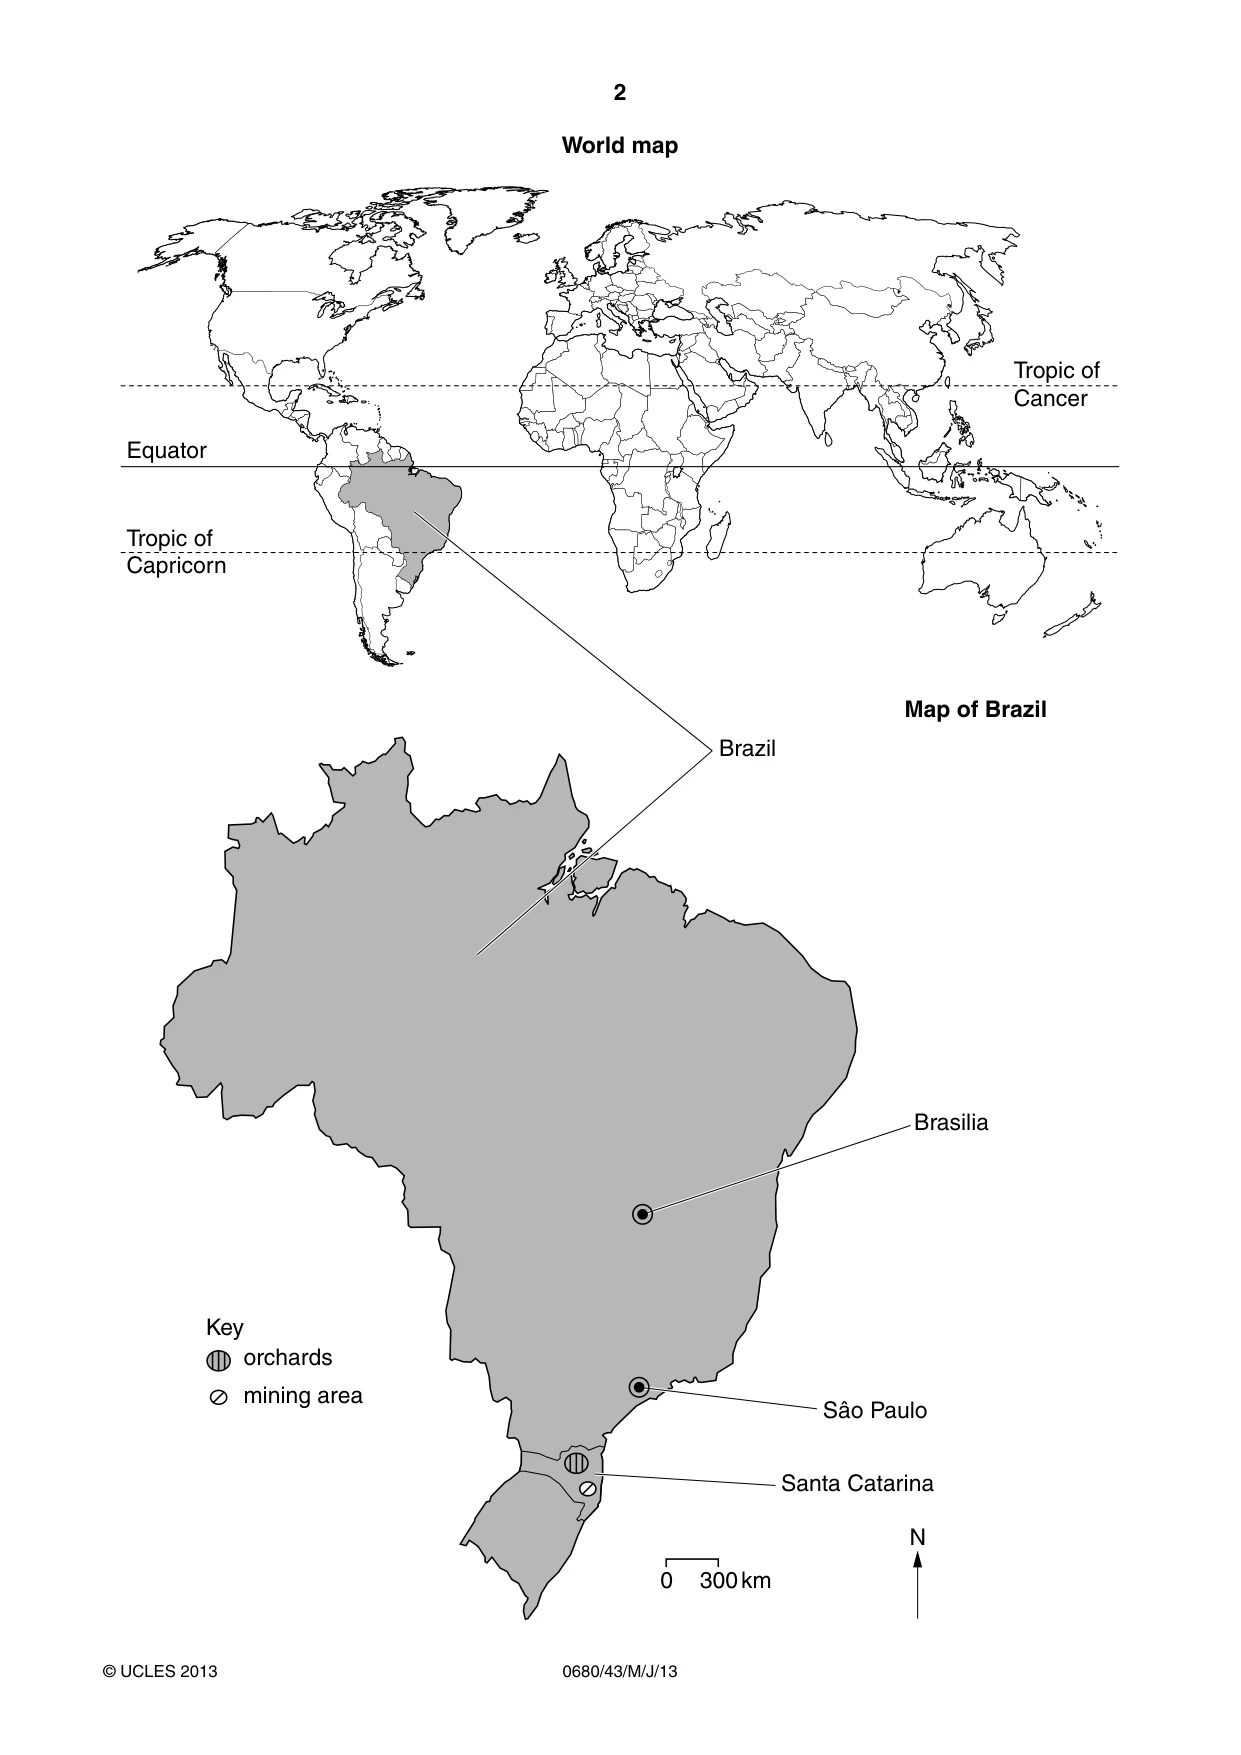
2 0680/43/M/J/13 © UCLES 2013 World map Equator Brazil N Key orchards mining area 0 300 km Tropic of Capricorn Tropic of Cancer Santa Catarina Sâo Paulo Brasilia Map of Brazil
Question paper, page 3
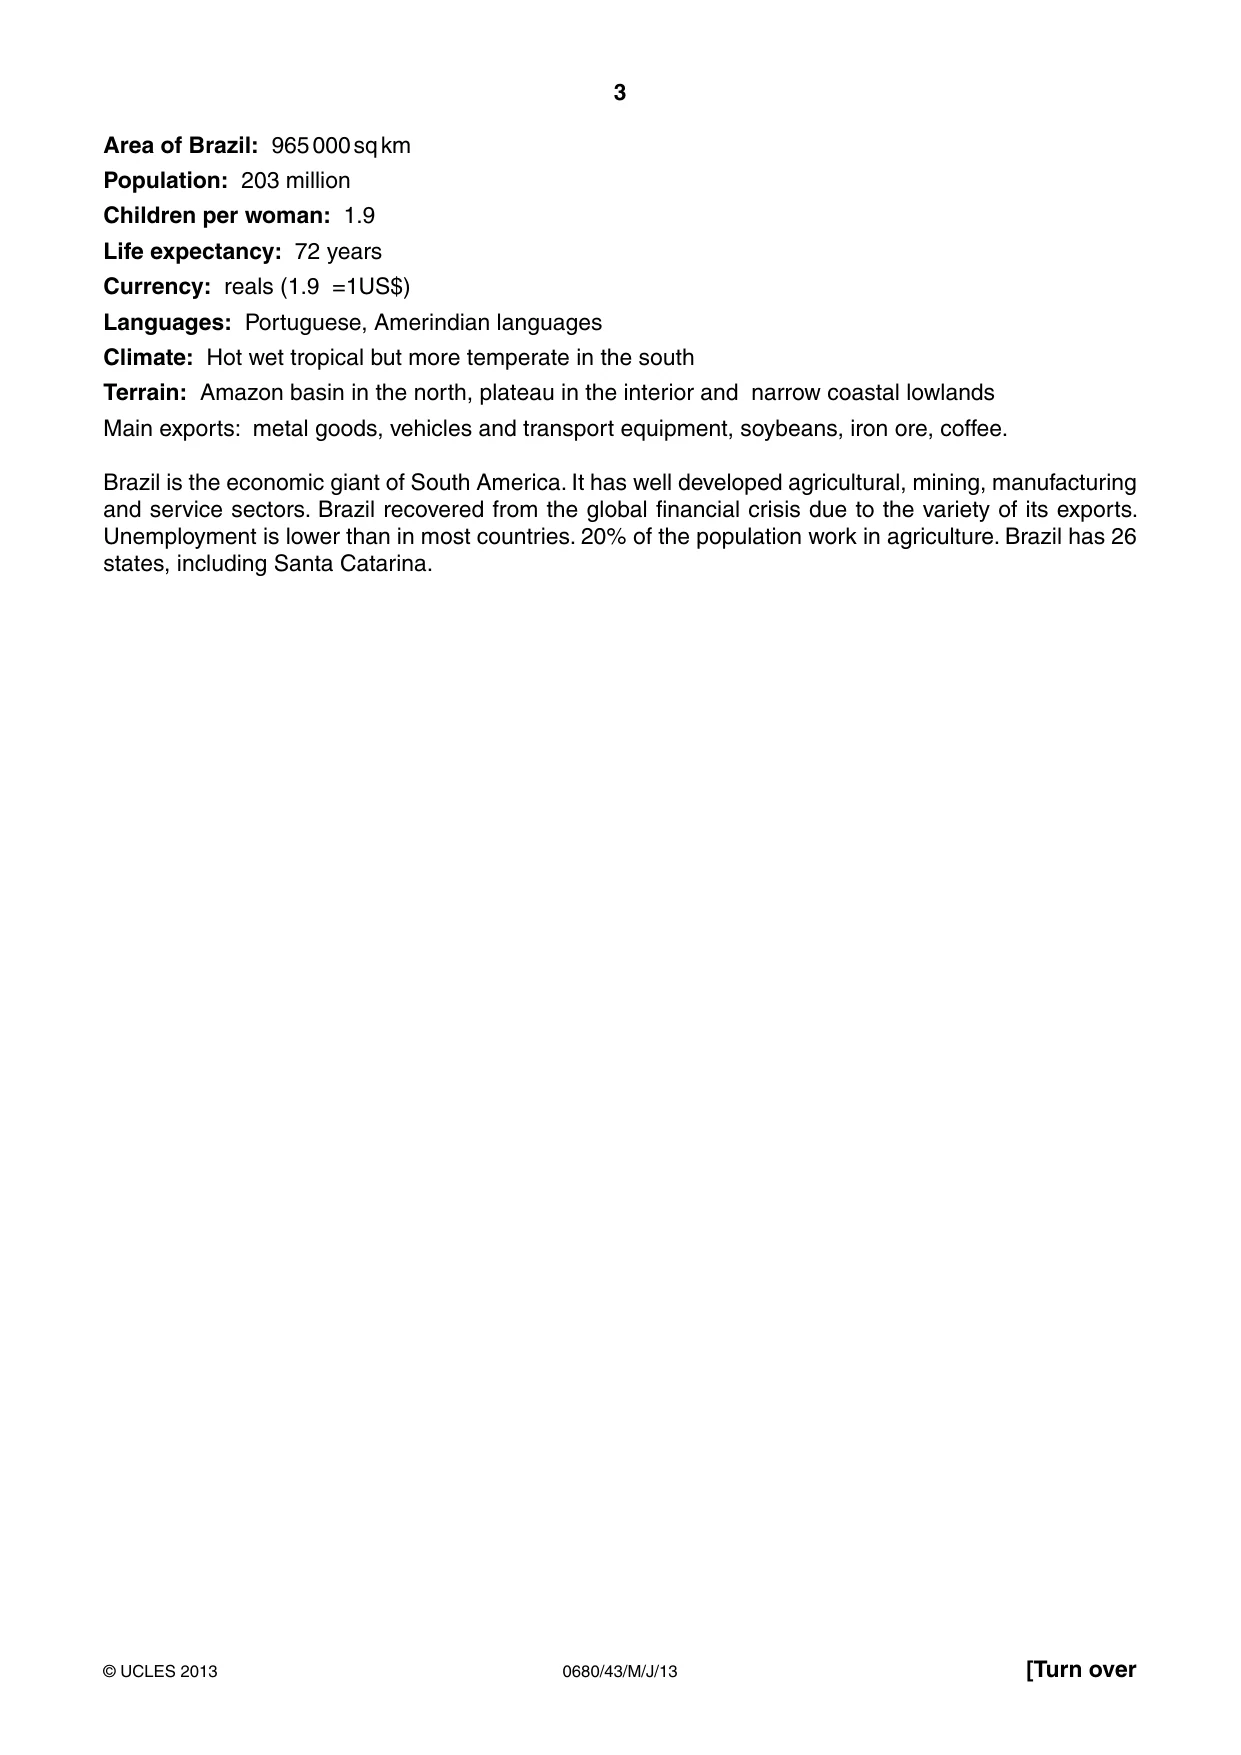
3 0680/43/M/J/13 © UCLES 2013 [Turn over Area of Brazil: 965 000 sq km Population: 203 million Children per woman: 1.9 Life expectancy: 72 years Currency: reals (1.9 =1US$) Languages: Portuguese, Amerindian languages Climate: Hot wet tropical but more temperate in the south Terrain: Amazon basin in the north, plateau in the interior and narrow coastal lowlands Main exports: metal goods, vehicles and transport equipment, soybeans, iron ore, coffee. Brazil is the economic giant of South America. It has well developed agricultural, mining, manufacturing and service sectors. Brazil recovered from the global financial crisis due to the variety of its exports. Unemployment is lower than in most countries. 20% of the population work in agriculture. Brazil has 26 states, including Santa Catarina.
Question paper, page 4
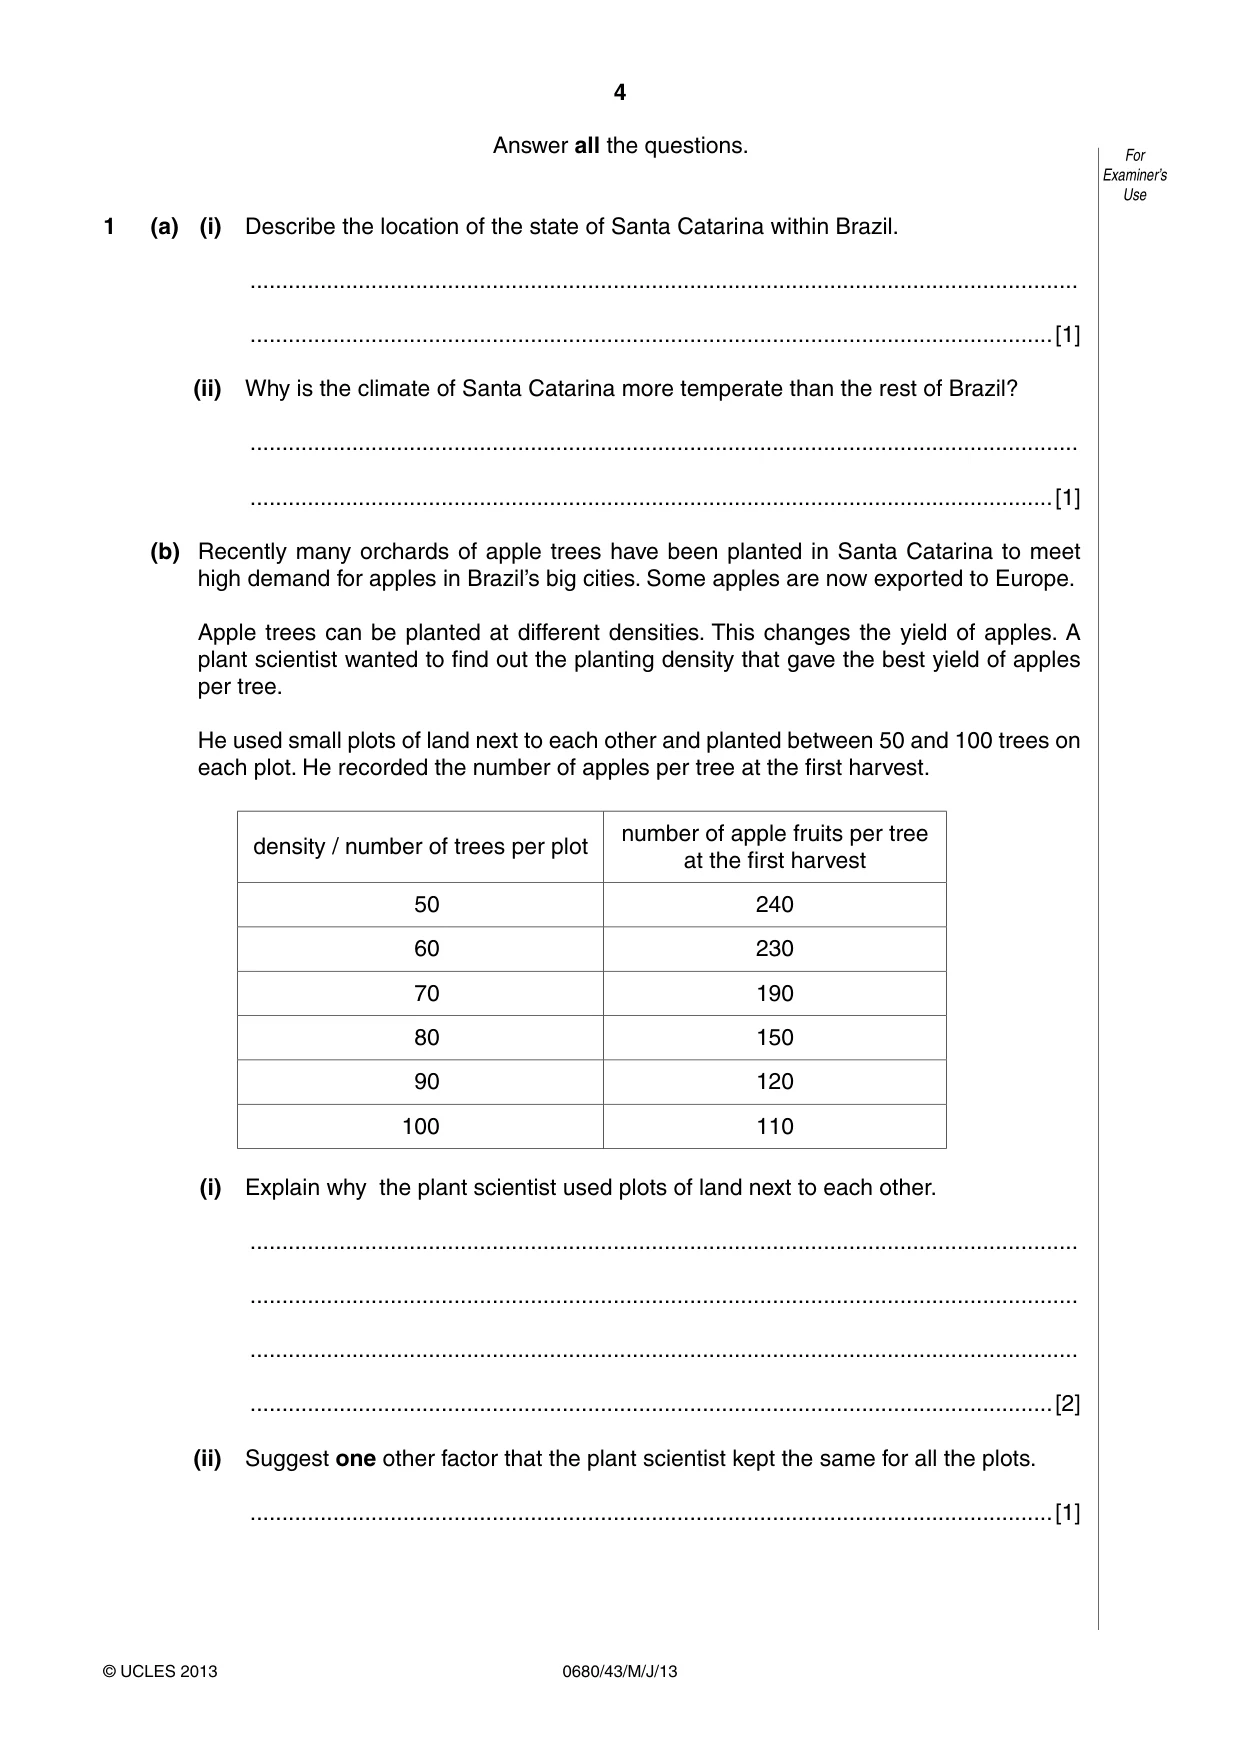
4 0680/43/M/J/13 © UCLES 2013 For Examiner’s Use Answer all the questions. 1 (a) (i) Describe the location of the state of Santa Catarina within Brazil. … …[1] (ii) Why is the climate of Santa Catarina more temperate than the rest of Brazil? … …[1] (b) Recently many orchards of apple trees have been planted in Santa Catarina to meet high demand for apples in Brazil’s big cities. Some apples are now exported to Europe. Apple trees can be planted at different densities. This changes the yield of apples. A plant scientist wanted to find out the planting density that gave the best yield of apples per tree. He used small plots of land next to each other and planted between 50 and 100 trees on each plot. He recorded the number of apples per tree at the first harvest. density / number of trees per plot number of apple fruits per tree at the first harvest 50 240 60 230 70 190 80 150 90 120 100 110 (i) Explain why the plant scientist used plots of land next to each other. … … … …[2] (ii) Suggest one other factor that the plant scientist kept the same for all the plots. …[1]
Question paper, page 5
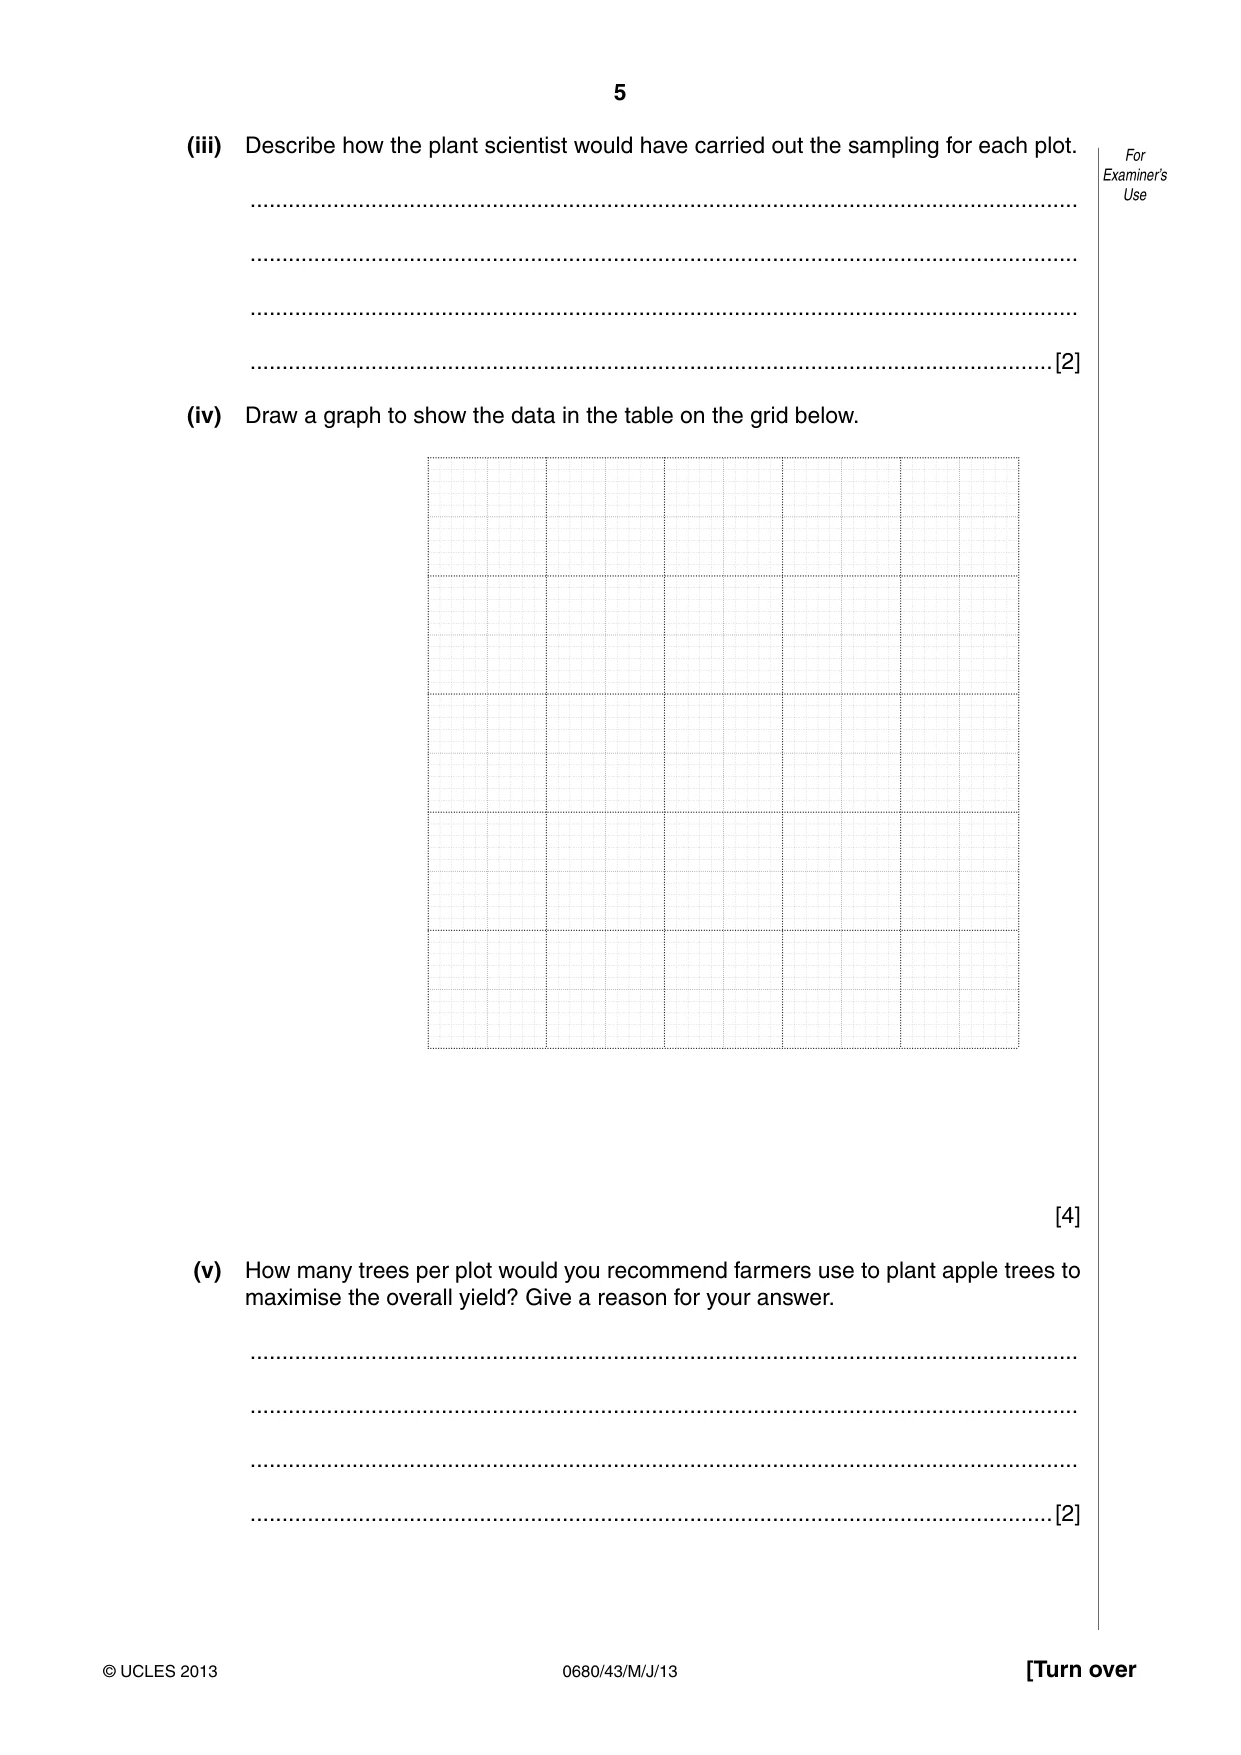
5 0680/43/M/J/13 © UCLES 2013 [Turn over For Examiner’s Use (iii) Describe how the plant scientist would have carried out the sampling for each plot. … … … …[2] (iv) Draw a graph to show the data in the table on the grid below. [4] (v) How many trees per plot would you recommend farmers use to plant apple trees to maximise the overall yield? Give a reason for your answer. … … … …[2]
Question paper, page 6
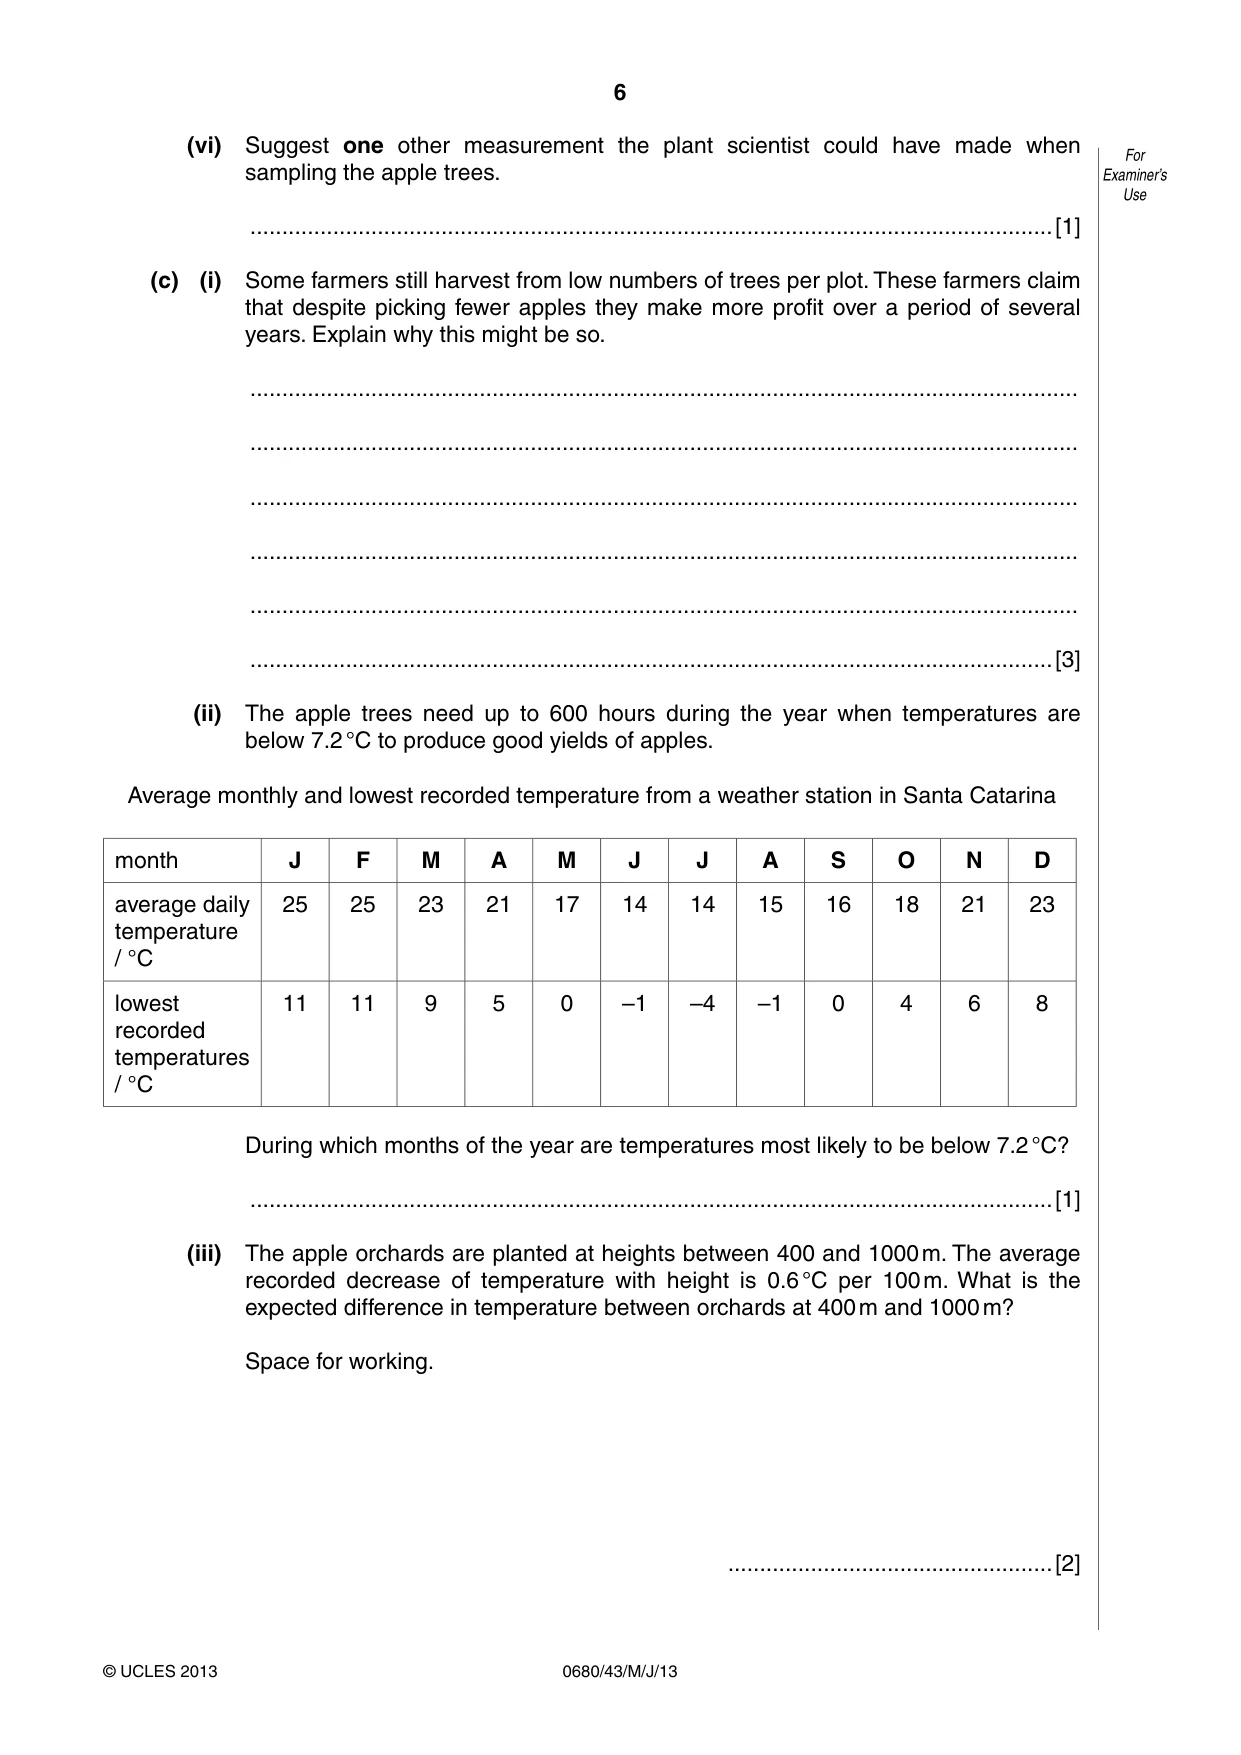
6 0680/43/M/J/13 © UCLES 2013 For Examiner’s Use (vi) Suggest one other measurement the plant scientist could have made when sampling the apple trees. …[1] (c) (i) Some farmers still harvest from low numbers of trees per plot. These farmers claim that despite picking fewer apples they make more profit over a period of several years. Explain why this might be so. … … … … … …[3] (ii) The apple trees need up to 600 hours during the year when temperatures are below 7.2 °C to produce good yields of apples. Average monthly and lowest recorded temperature from a weather station in Santa Catarina month J F M A M J J A S O N D average daily temperature / °C 25 25 23 21 17 14 14 15 16 18 21 23 lowest recorded temperatures / °C 11 11 9 5 0 –1 –4 –1 0 4 6 8 During which months of the year are temperatures most likely to be below 7.2 °C? …[1] (iii) The apple orchards are planted at heights between 400 and 1000 m. The average recorded decrease of temperature with height is 0.6 °C per 100 m. What is the expected difference in temperature between orchards at 400 m and 1000 m? Space for working. …[2]
Question paper, page 7
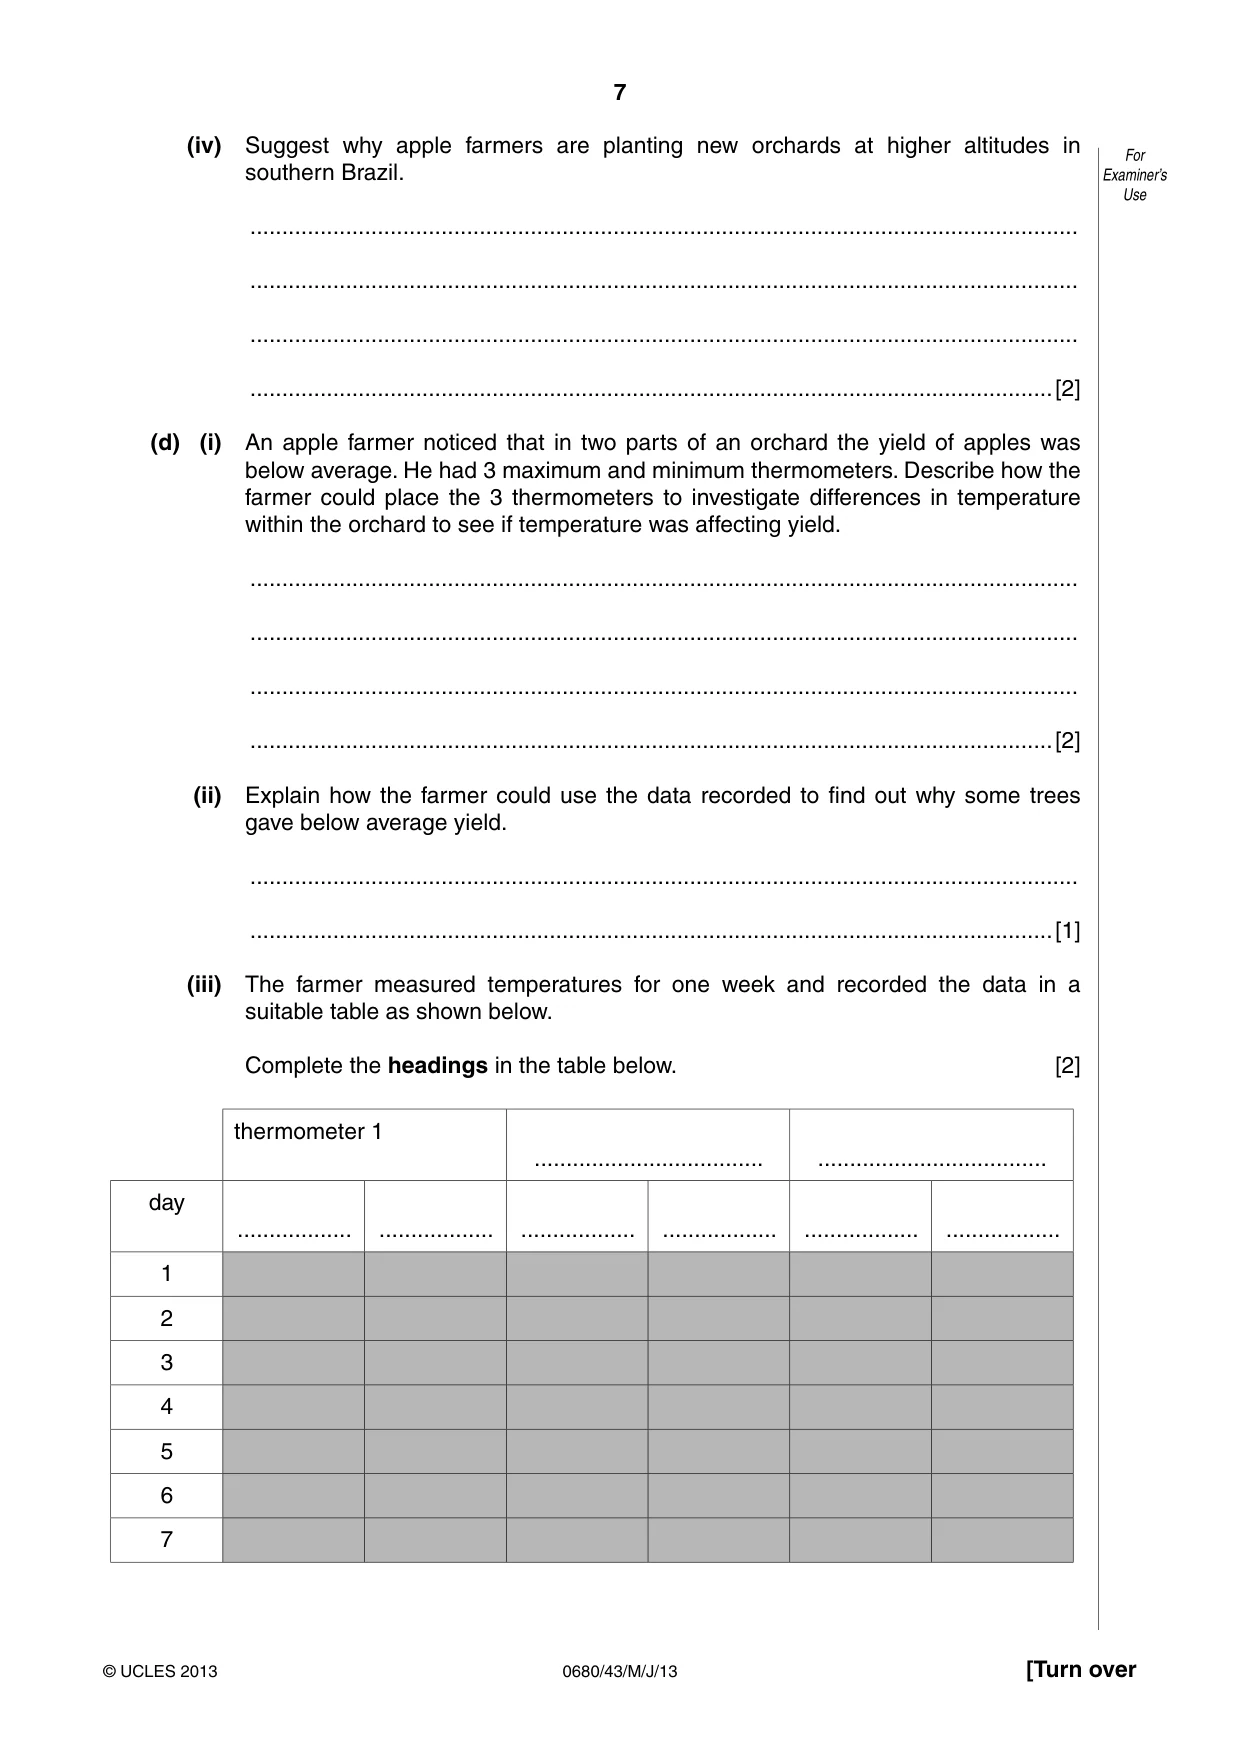
7 0680/43/M/J/13 © UCLES 2013 [Turn over For Examiner’s Use (iv) Suggest why apple farmers are planting new orchards at higher altitudes in southern Brazil. … … … …[2] (d) (i) An apple farmer noticed that in two parts of an orchard the yield of apples was below average. He had 3 maximum and minimum thermometers. Describe how the farmer could place the 3 thermometers to investigate differences in temperature within the orchard to see if temperature was affecting yield. … … … …[2] (ii) Explain how the farmer could use the data recorded to find out why some trees gave below average yield. … …[1] (iii) The farmer measured temperatures for one week and recorded the data in a suitable table as shown below. Complete the headings in the table below. [2] thermometer 1 … … day … … … … … … 1 2 3 4 5 6 7
Question paper, page 8
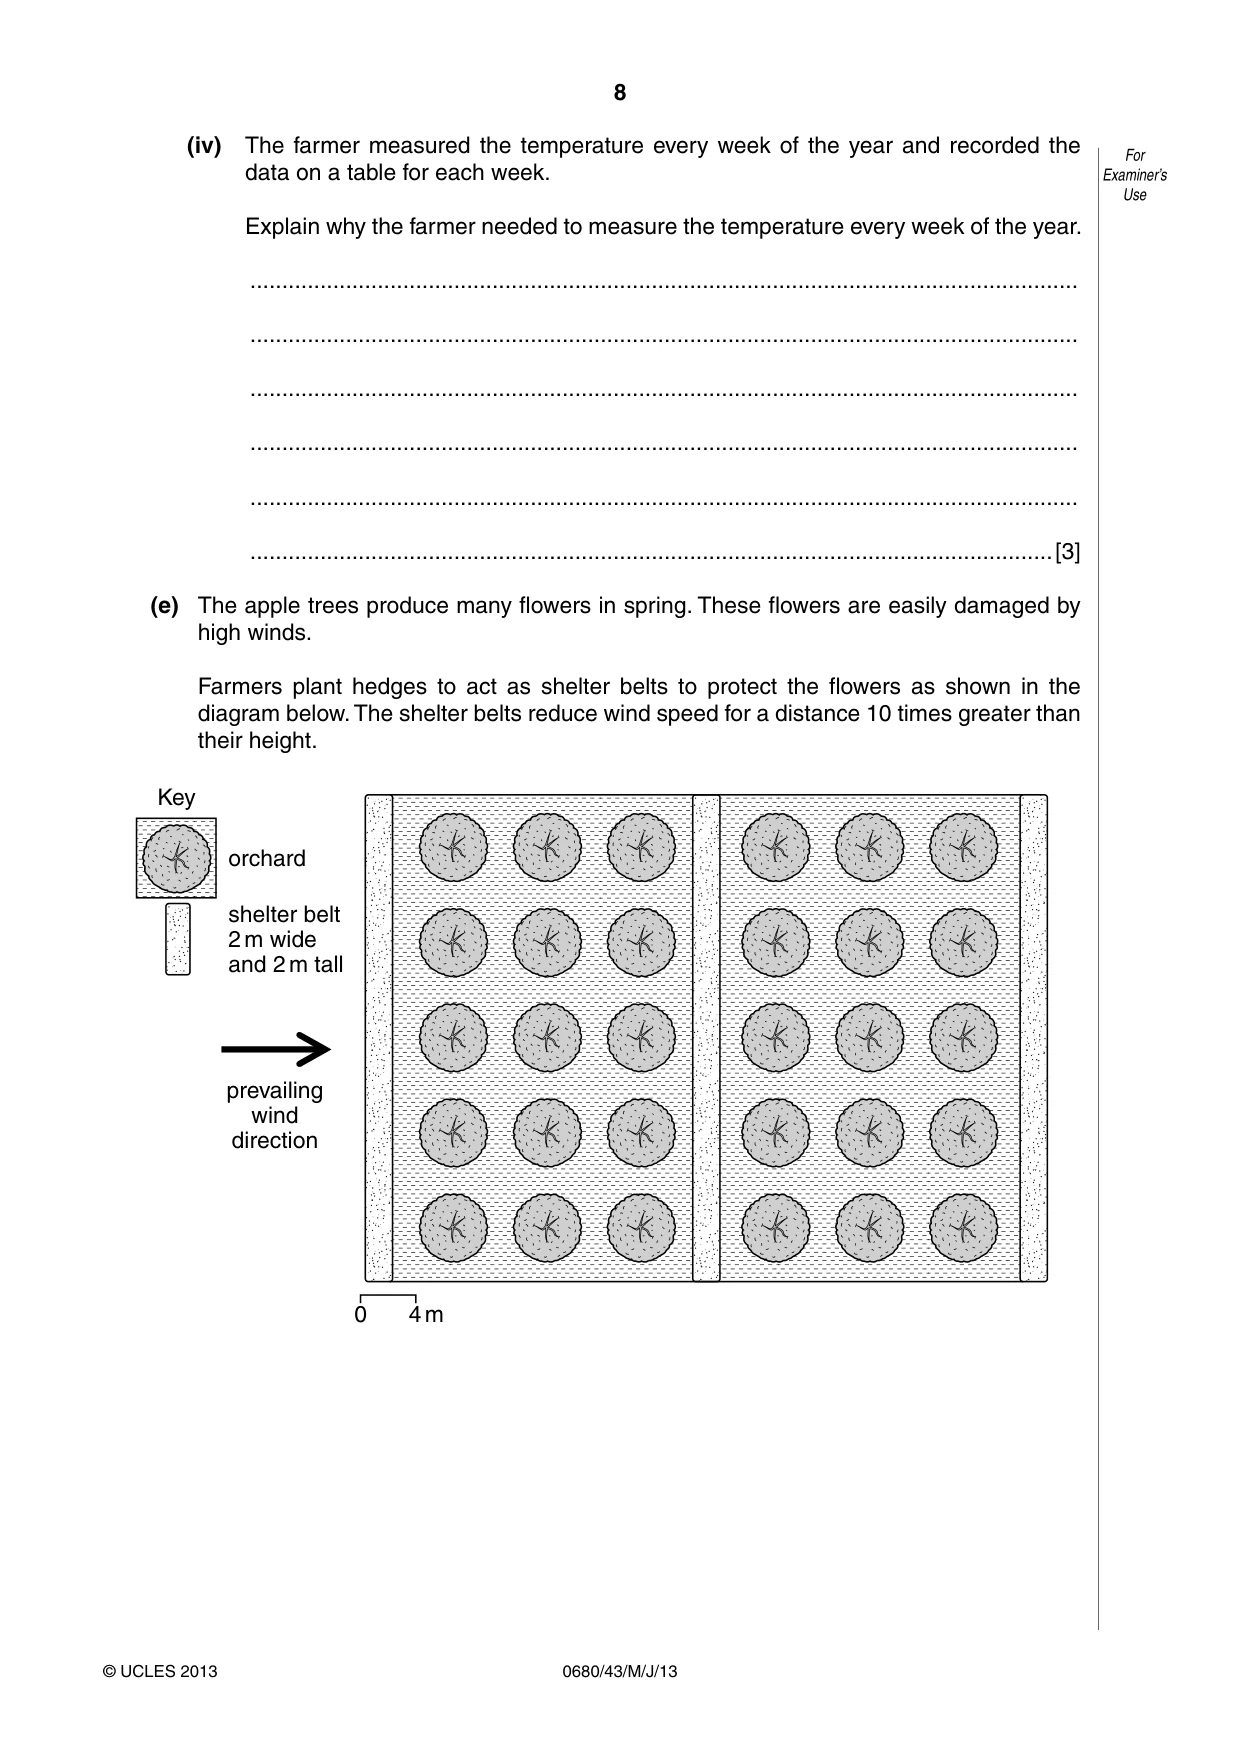
8 0680/43/M/J/13 © UCLES 2013 For Examiner’s Use (iv) The farmer measured the temperature every week of the year and recorded the data on a table for each week. Explain why the farmer needed to measure the temperature every week of the year. … … … … … …[3] (e) The apple trees produce many flowers in spring. These flowers are easily damaged by high winds. Farmers plant hedges to act as shelter belts to protect the flowers as shown in the diagram below. The shelter belts reduce wind speed for a distance 10 times greater than their height. Key orchard shelter belt 2 m wide and 2 m tall prevailing wind direction 0 4 m
Question paper, page 9
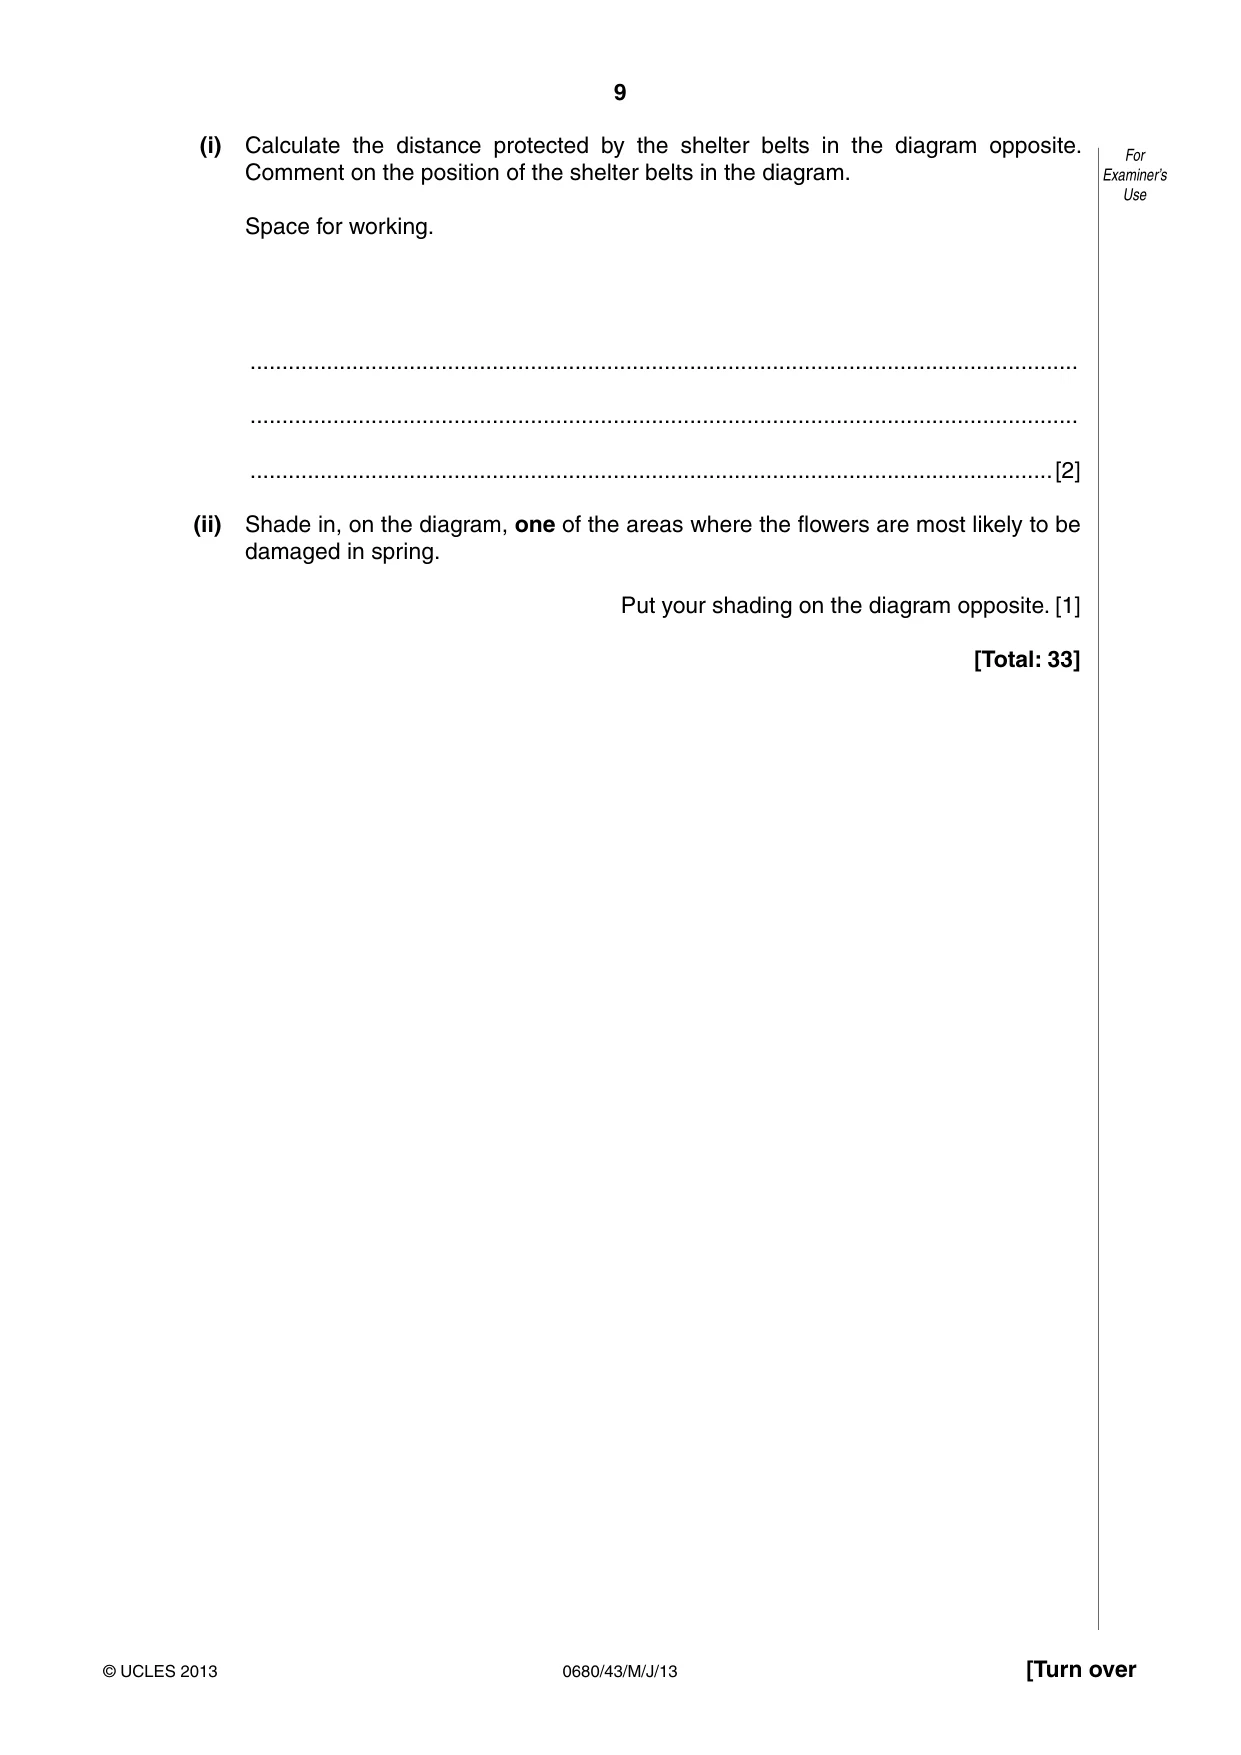
9 0680/43/M/J/13 © UCLES 2013 [Turn over For Examiner’s Use (i) Calculate the distance protected by the shelter belts in the diagram opposite. Comment on the position of the shelter belts in the diagram. Space for working. … … …[2] (ii) Shade in, on the diagram, one of the areas where the flowers are most likely to be damaged in spring. Put your shading on the diagram opposite. [1] [Total: 33]
Question paper, page 10
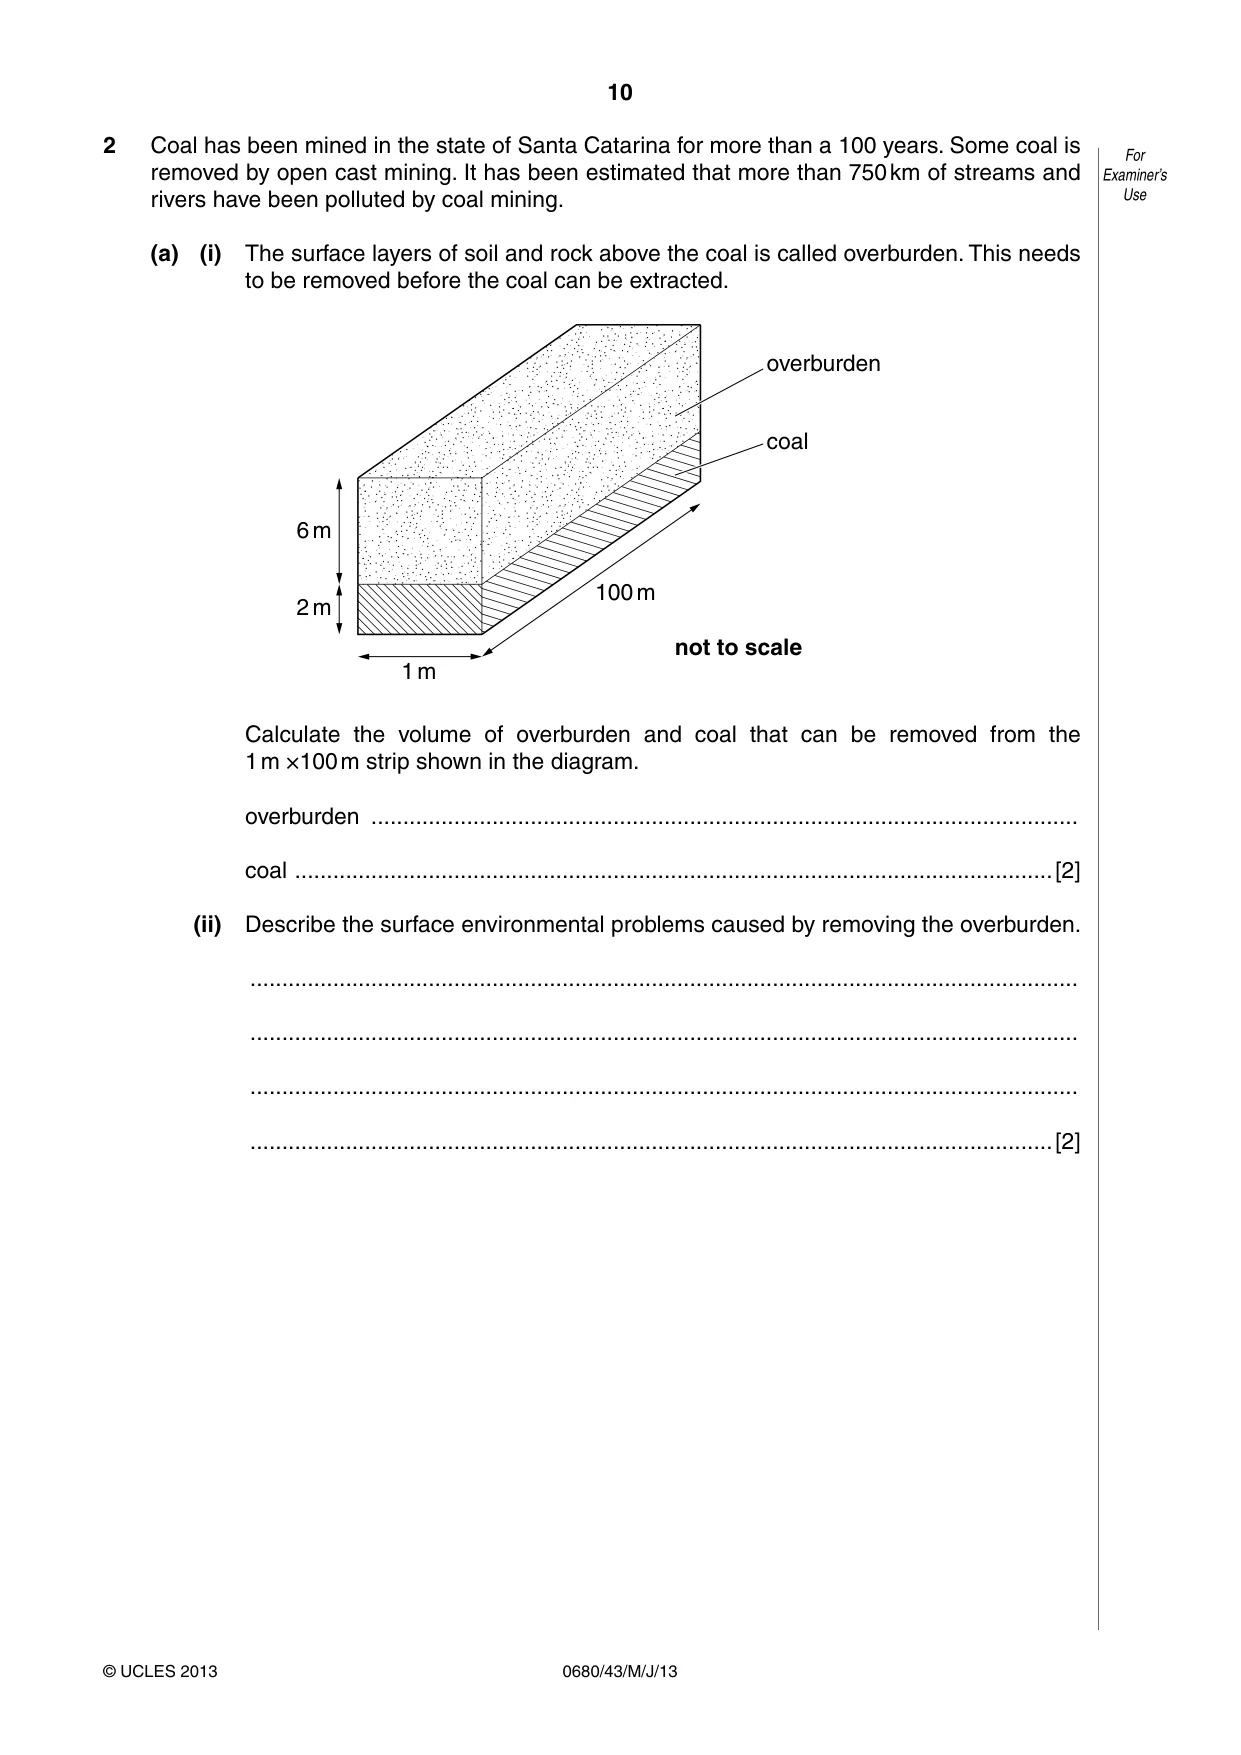
10 0680/43/M/J/13 © UCLES 2013 For Examiner’s Use 2 Coal has been mined in the state of Santa Catarina for more than a 100 years. Some coal is removed by open cast mining. It has been estimated that more than 750 km of streams and rivers have been polluted by coal mining. (a) (i) The surface layers of soil and rock above the coal is called overburden. This needs to be removed before the coal can be extracted. 1 m 100 m coal overburden not to scale 6 m 2 m Calculate the volume of overburden and coal that can be removed from the 1 m ×100 m strip shown in the diagram. overburden … coal …[2] (ii) Describe the surface environmental problems caused by removing the overburden. … … … …[2]
Question paper, page 11
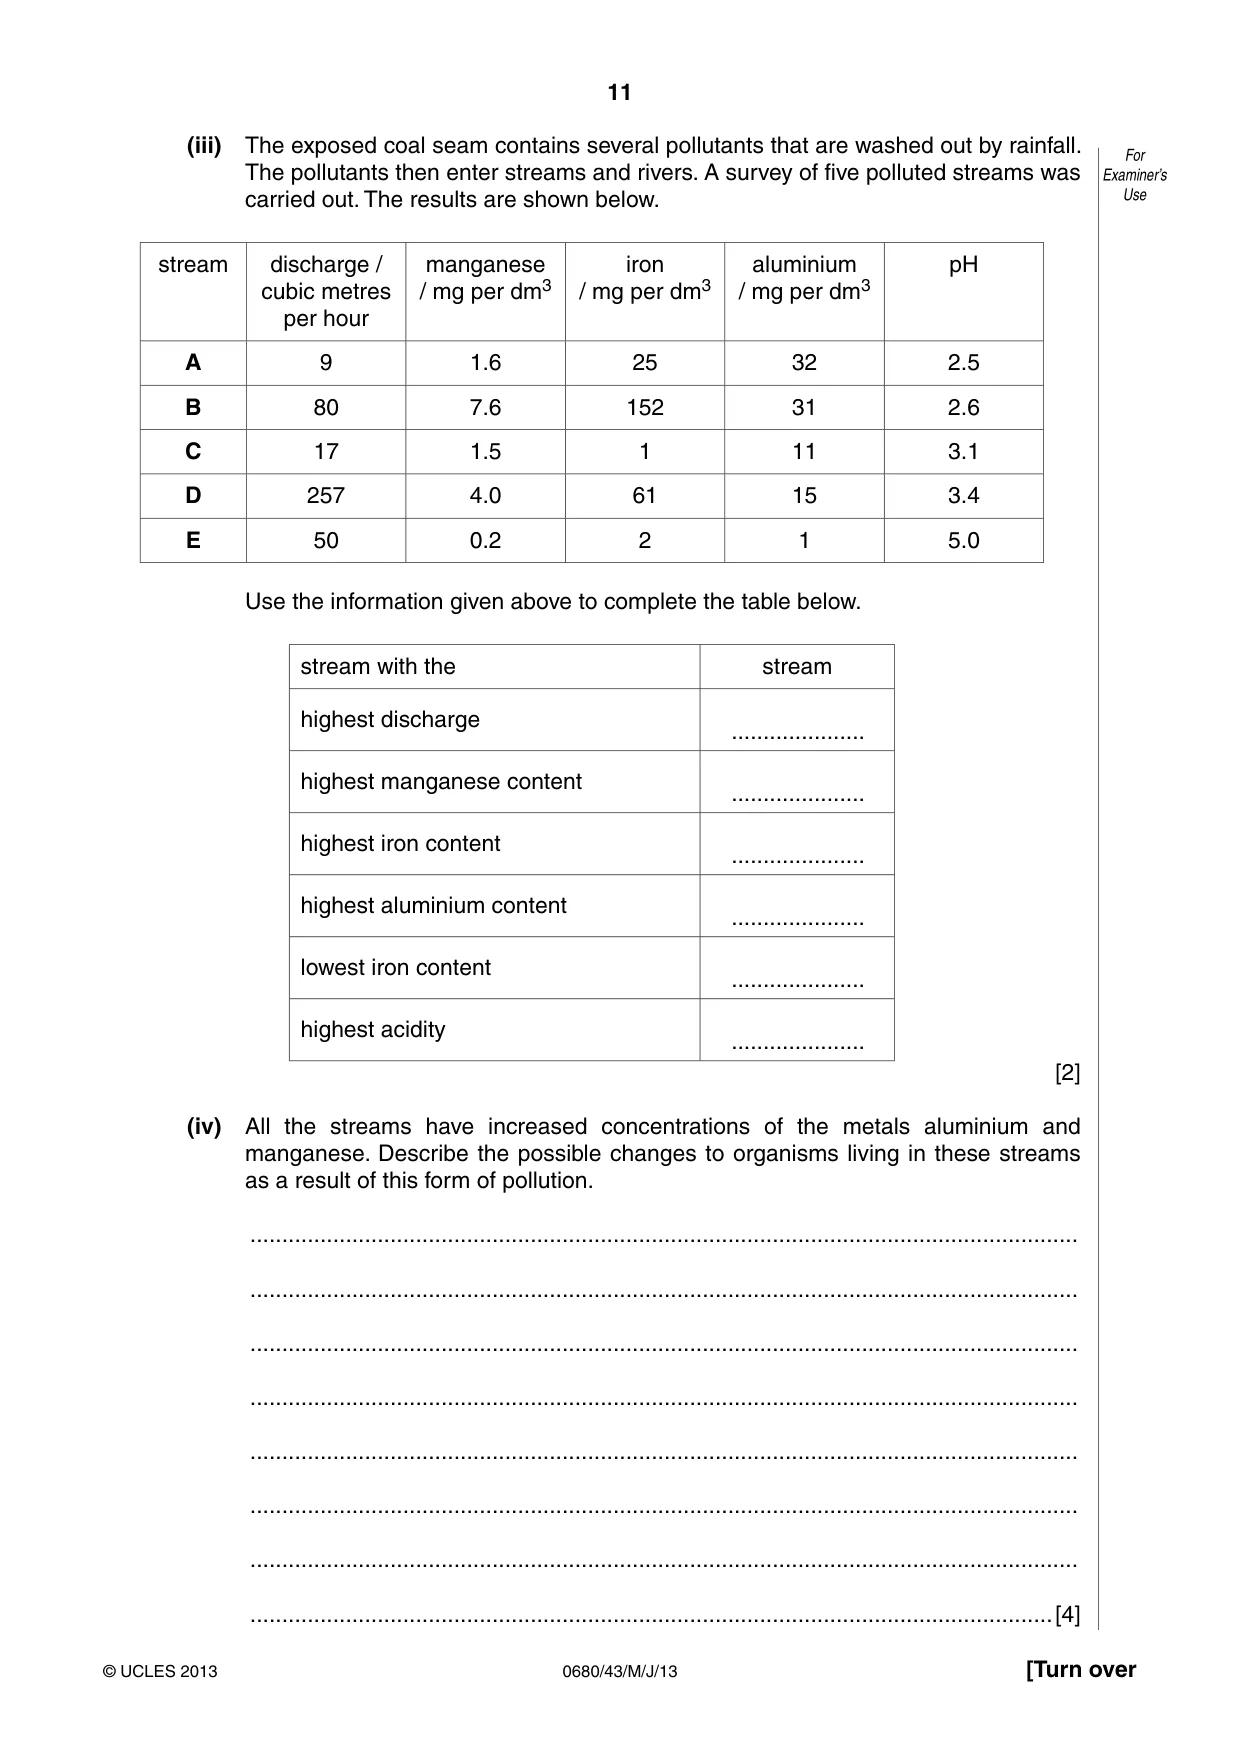
11 0680/43/M/J/13 © UCLES 2013 [Turn over For Examiner’s Use (iii) The exposed coal seam contains several pollutants that are washed out by rainfall. The pollutants then enter streams and rivers. A survey of five polluted streams was carried out. The results are shown below. stream discharge / cubic metres per hour manganese / mg per dm3 iron / mg per dm3 aluminium / mg per dm3 pH A 9 1.6 25 32 2.5 B 80 7.6 152 31 2.6 C 17 1.5 1 11 3.1 D 257 4.0 61 15 3.4 E 50 0.2 2 1 5.0 Use the information given above to complete the table below. stream with the stream highest discharge … highest manganese content … highest iron content … highest aluminium content … lowest iron content … highest acidity … [2] (iv) All the streams have increased concentrations of the metals aluminium and manganese. Describe the possible changes to organisms living in these streams as a result of this form of pollution. … … … … … … … …[4]
Question paper, page 12
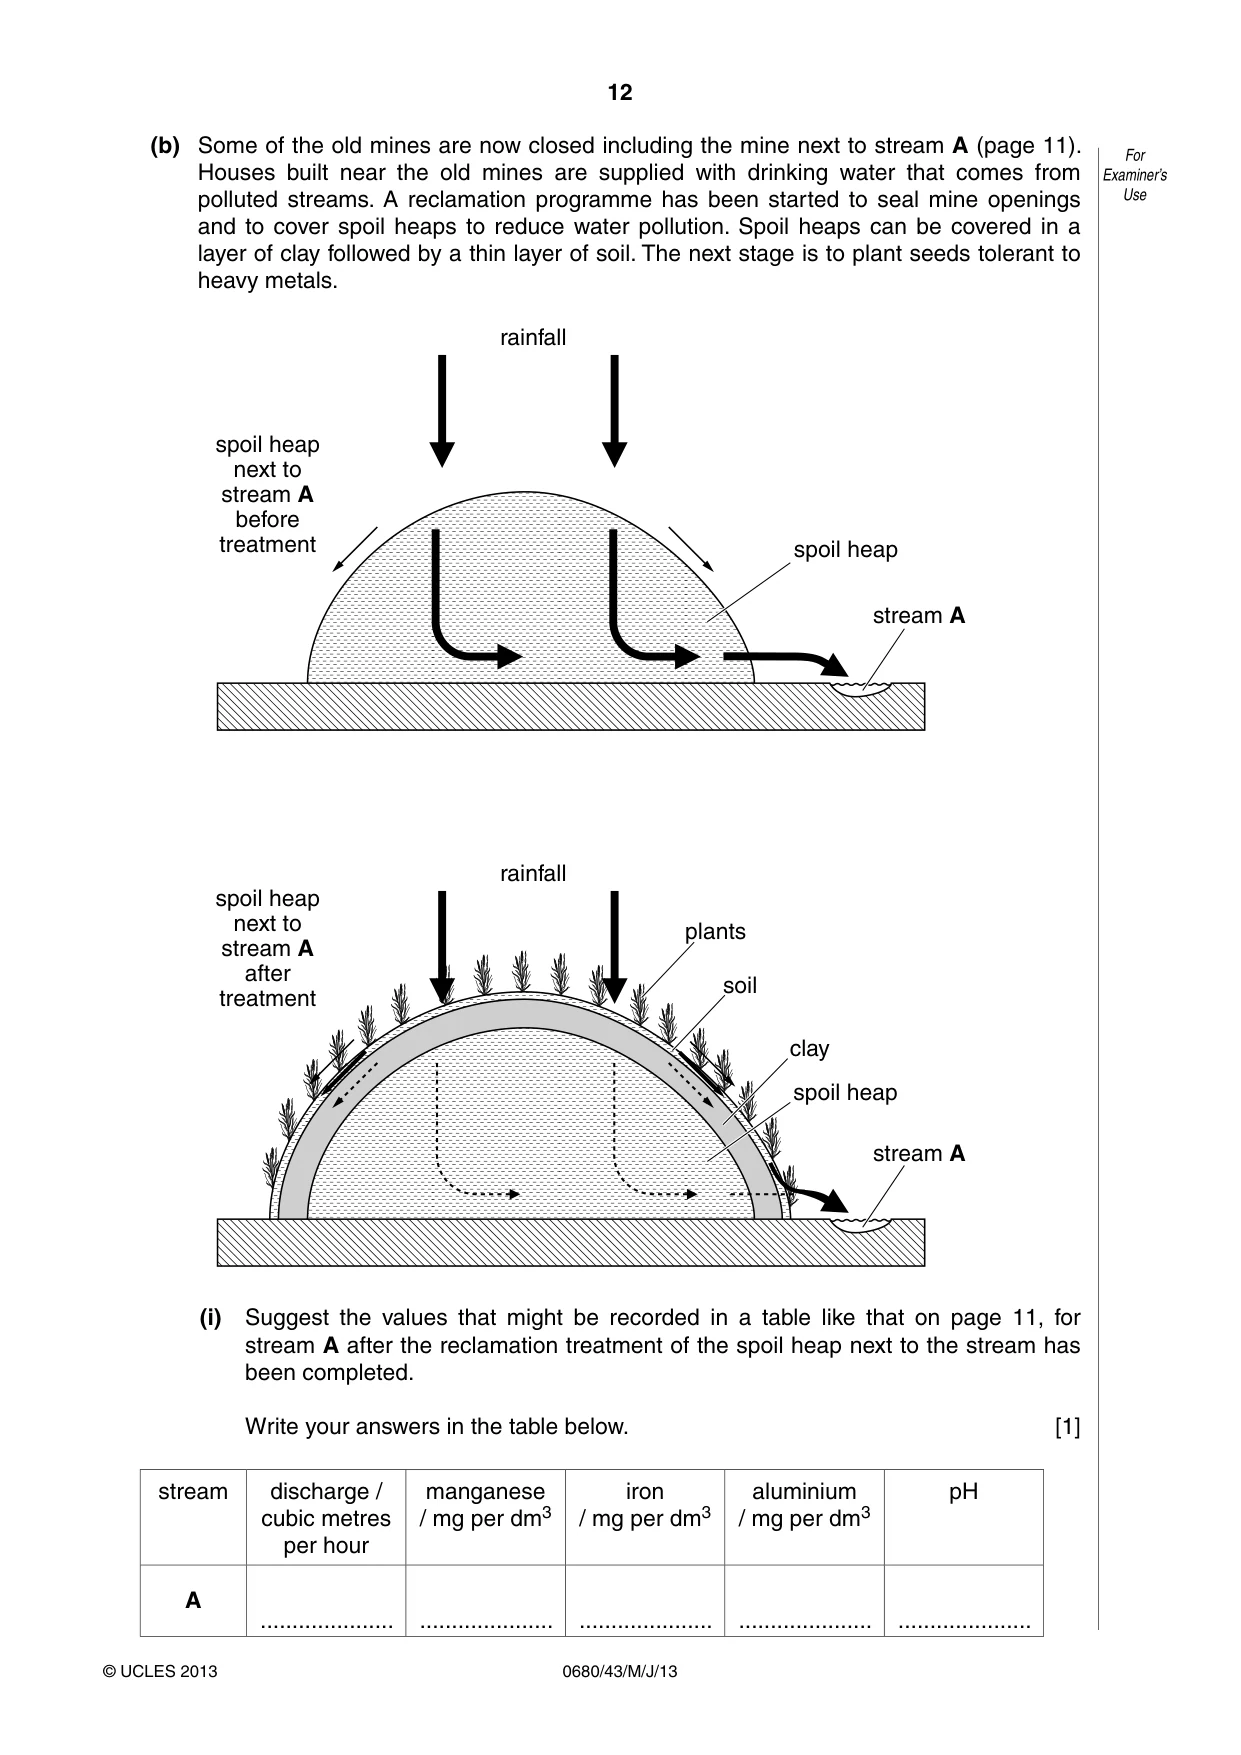
12 0680/43/M/J/13 © UCLES 2013 For Examiner’s Use (b) Some of the old mines are now closed including the mine next to stream A (page 11). Houses built near the old mines are supplied with drinking water that comes from polluted streams. A reclamation programme has been started to seal mine openings and to cover spoil heaps to reduce water pollution. Spoil heaps can be covered in a layer of clay followed by a thin layer of soil. The next stage is to plant seeds tolerant to heavy metals. rainfall stream A spoil heap rainfall spoil heap next to stream A before treatment spoil heap next to stream A after treatment stream A spoil heap clay soil plants (i) Suggest the values that might be recorded in a table like that on page 11, for stream A after the reclamation treatment of the spoil heap next to the stream has been completed. Write your answers in the table below. [1] stream discharge / cubic metres per hour manganese / mg per dm3 iron / mg per dm3 aluminium / mg per dm3 pH A … … … … …
Question paper, page 13
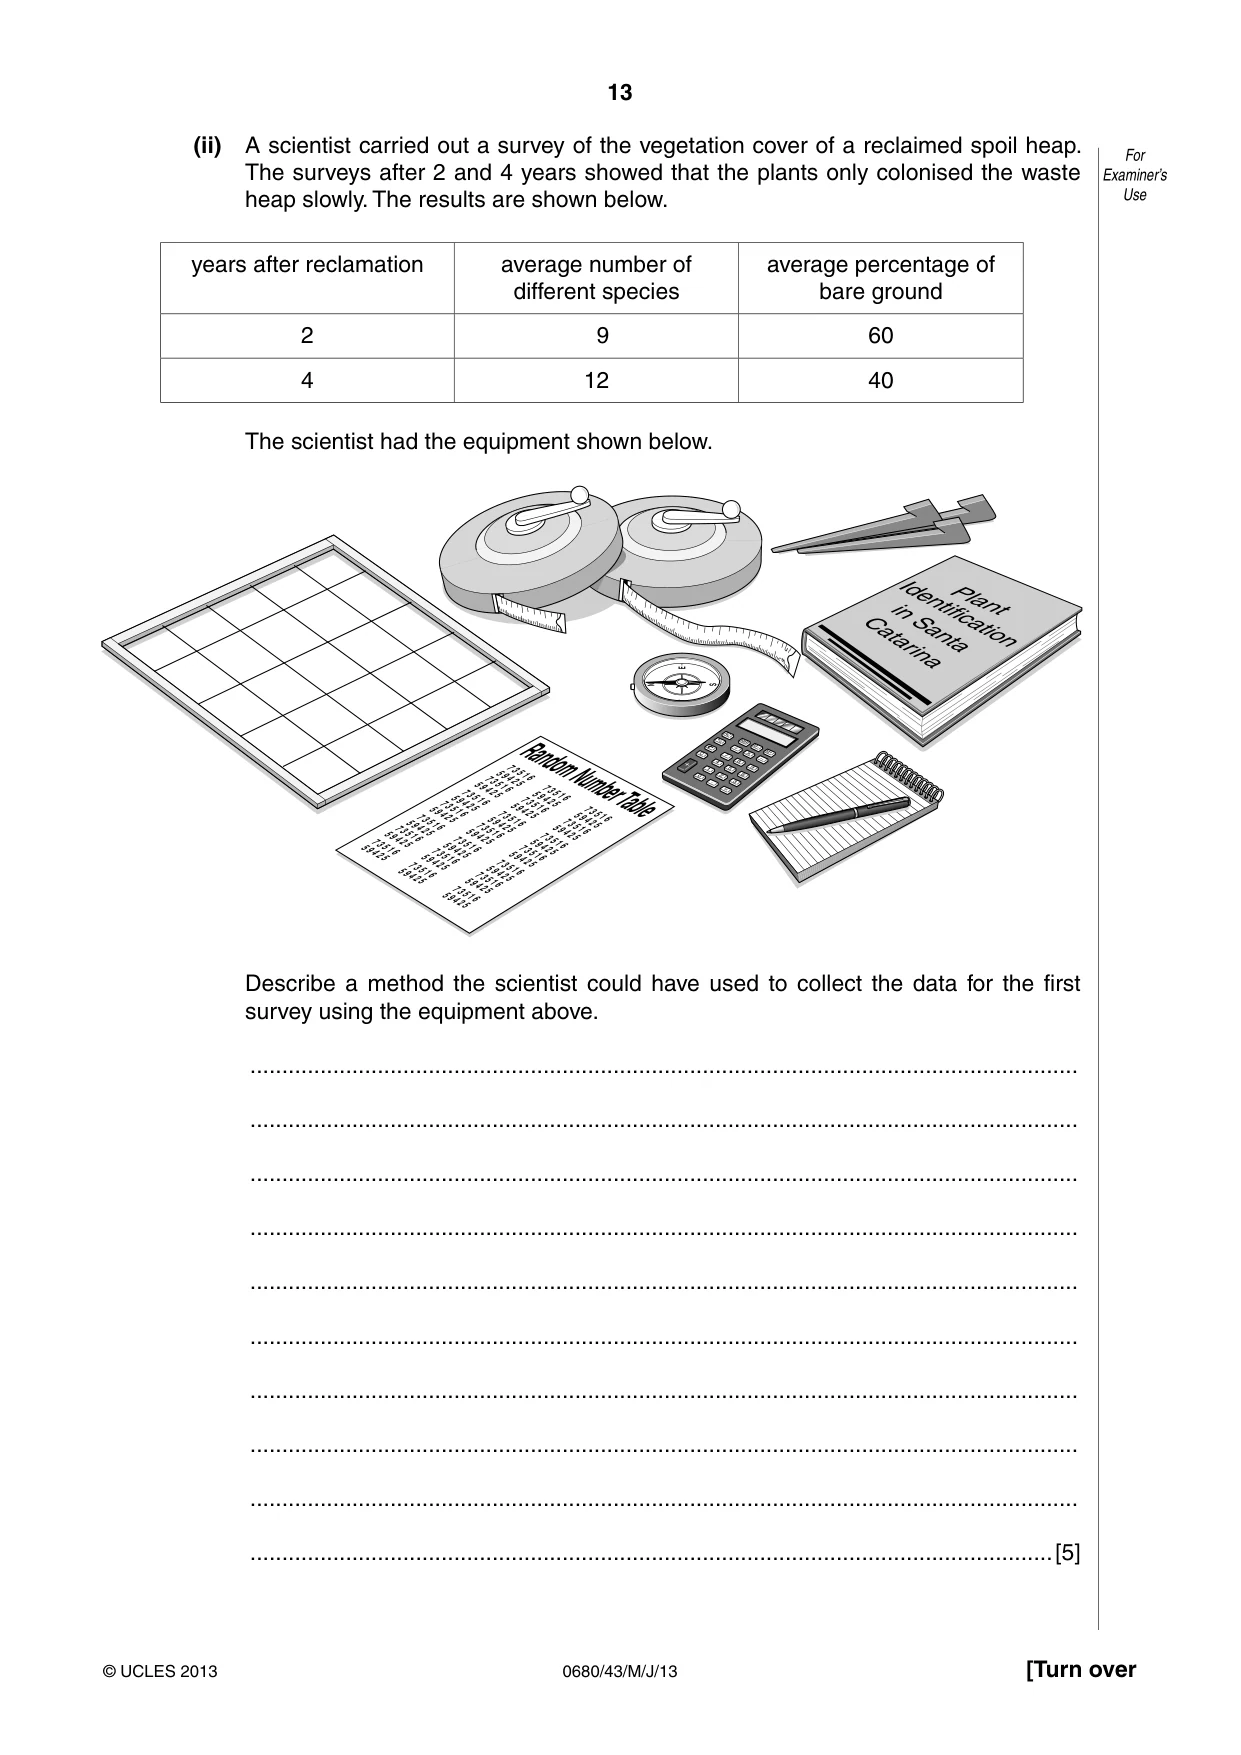
13 0680/43/M/J/13 © UCLES 2013 [Turn over For Examiner’s Use (ii) A scientist carried out a survey of the vegetation cover of a reclaimed spoil heap. The surveys after 2 and 4 years showed that the plants only colonised the waste heap slowly. The results are shown below. years after reclamation average number of different species average percentage of bare ground 2 9 60 4 12 40 The scientist had the equipment shown below. Random Number Table 7 3 5 1 6 5 9 4 2 5 7 3 5 1 6 5 9 4 2 5 7 3 5 1 6 5 9 4 2 5 7 3 5 1 6 5 9 4 2 5 7 3 5 1 6 5 9 4 2 5 7 3 5 1 6 5 9 4 2 5 7 3 5 1 6 5 9 4 2 5 7 3 5 1 6 5 9 4 2 5 7 3 5 1 6 5 9 4 2 5 7 3 5 1 6 5 9 4 2 5 7 3 5 1 6 5 9 4 2 5 7 3 5 1 6 5 9 4 2 5 7 3 5 1 6 5 9 4 2 5 7 3 5 1 6 5 9 4 2 5 7 3 5 1 6 5 9 4 2 5 7 3 5 1 6 5 9 4 2 5 7 3 5 1 6 5 9 4 2 5 7 3 5 1 6 5 9 4 2 5 7 3 5 1 6 5 9 4 2 5 7 3 5 1 6 5 9 4 2 5 7 3 5 1 6 5 9 4 2 5 0 1 4 C % 7 + – X AC MR M– M+ – 9 6 3 = 8 5 2 . .. Describe a method the scientist could have used to collect the data for the first survey using the equipment above. … … … … … … … … … …[5]
Question paper, page 14
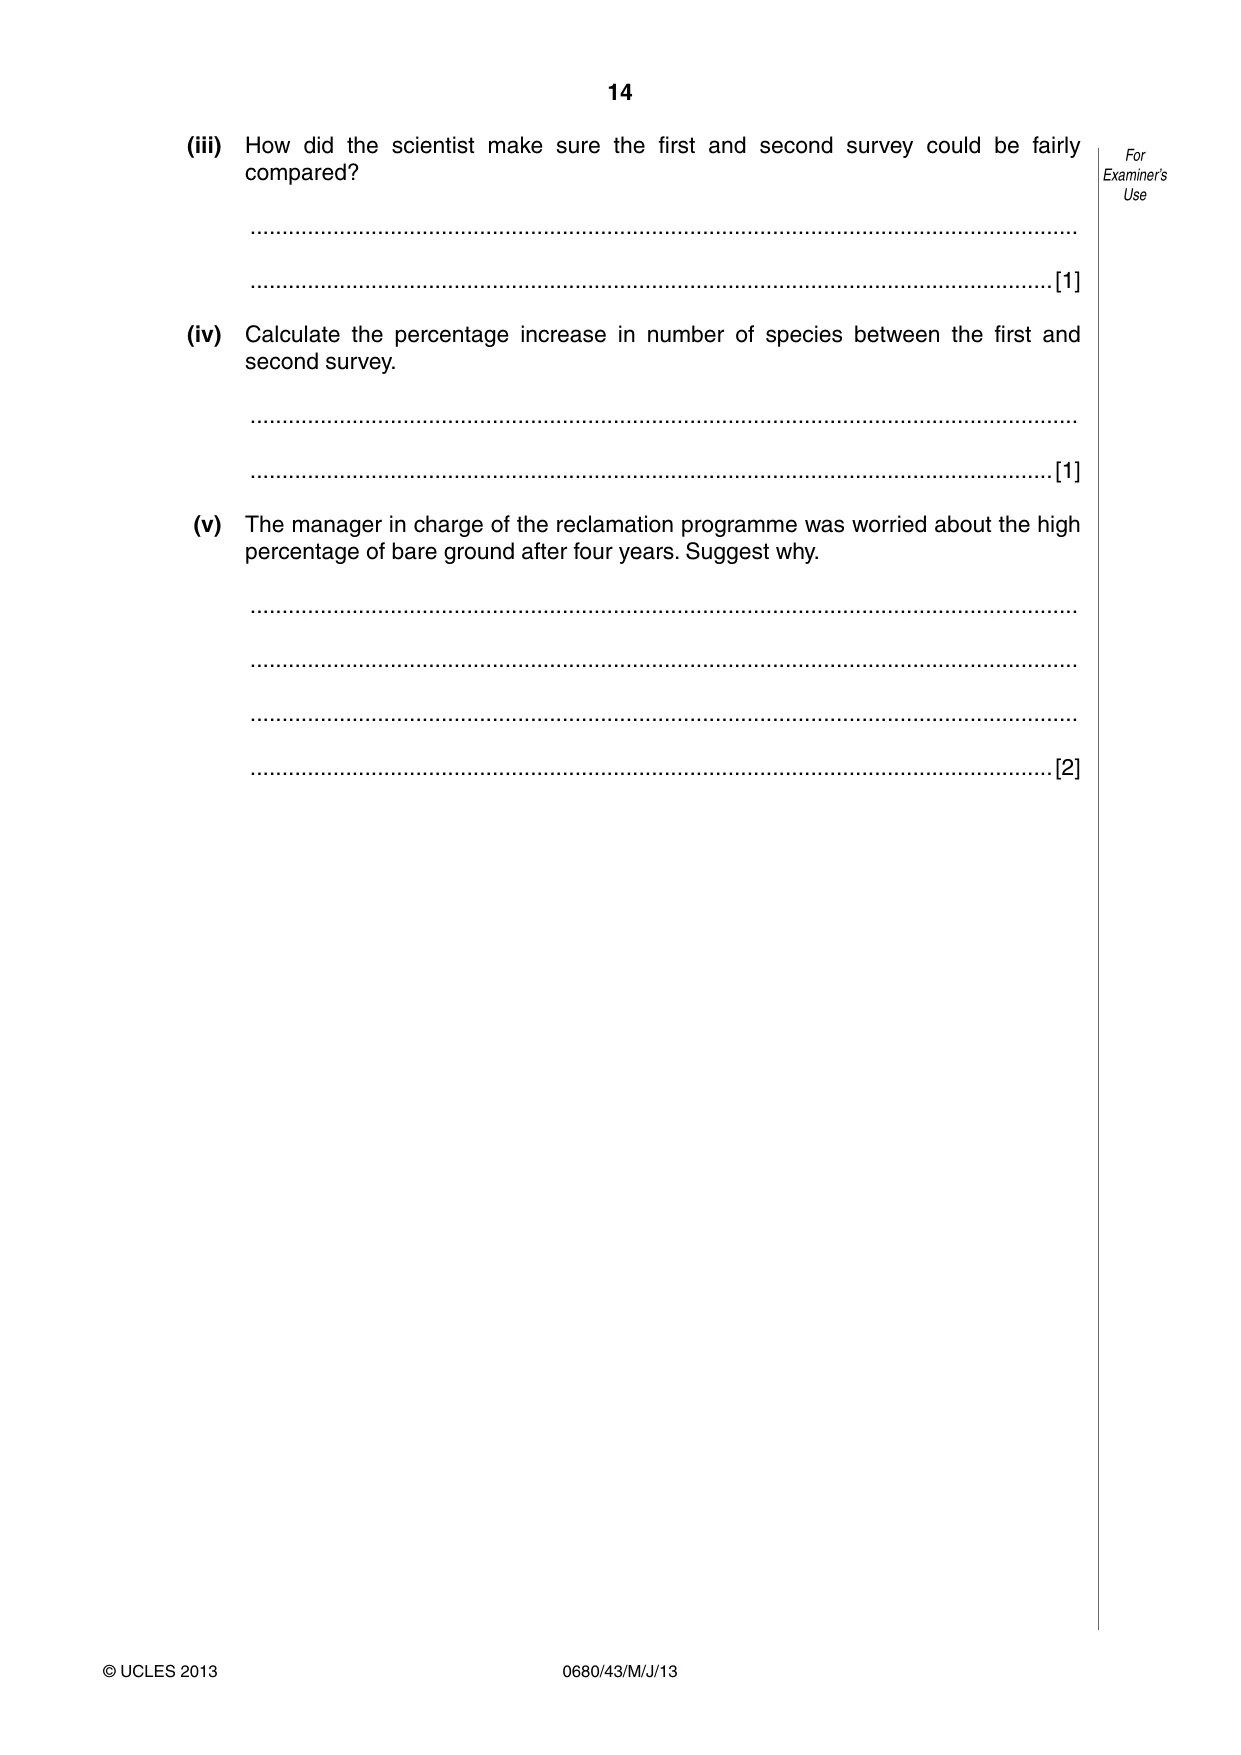
14 0680/43/M/J/13 © UCLES 2013 For Examiner’s Use (iii) How did the scientist make sure the first and second survey could be fairly compared? … …[1] (iv) Calculate the percentage increase in number of species between the first and second survey. … …[1] (v) The manager in charge of the reclamation programme was worried about the high percentage of bare ground after four years. Suggest why. … … … …[2]
Question paper, page 15
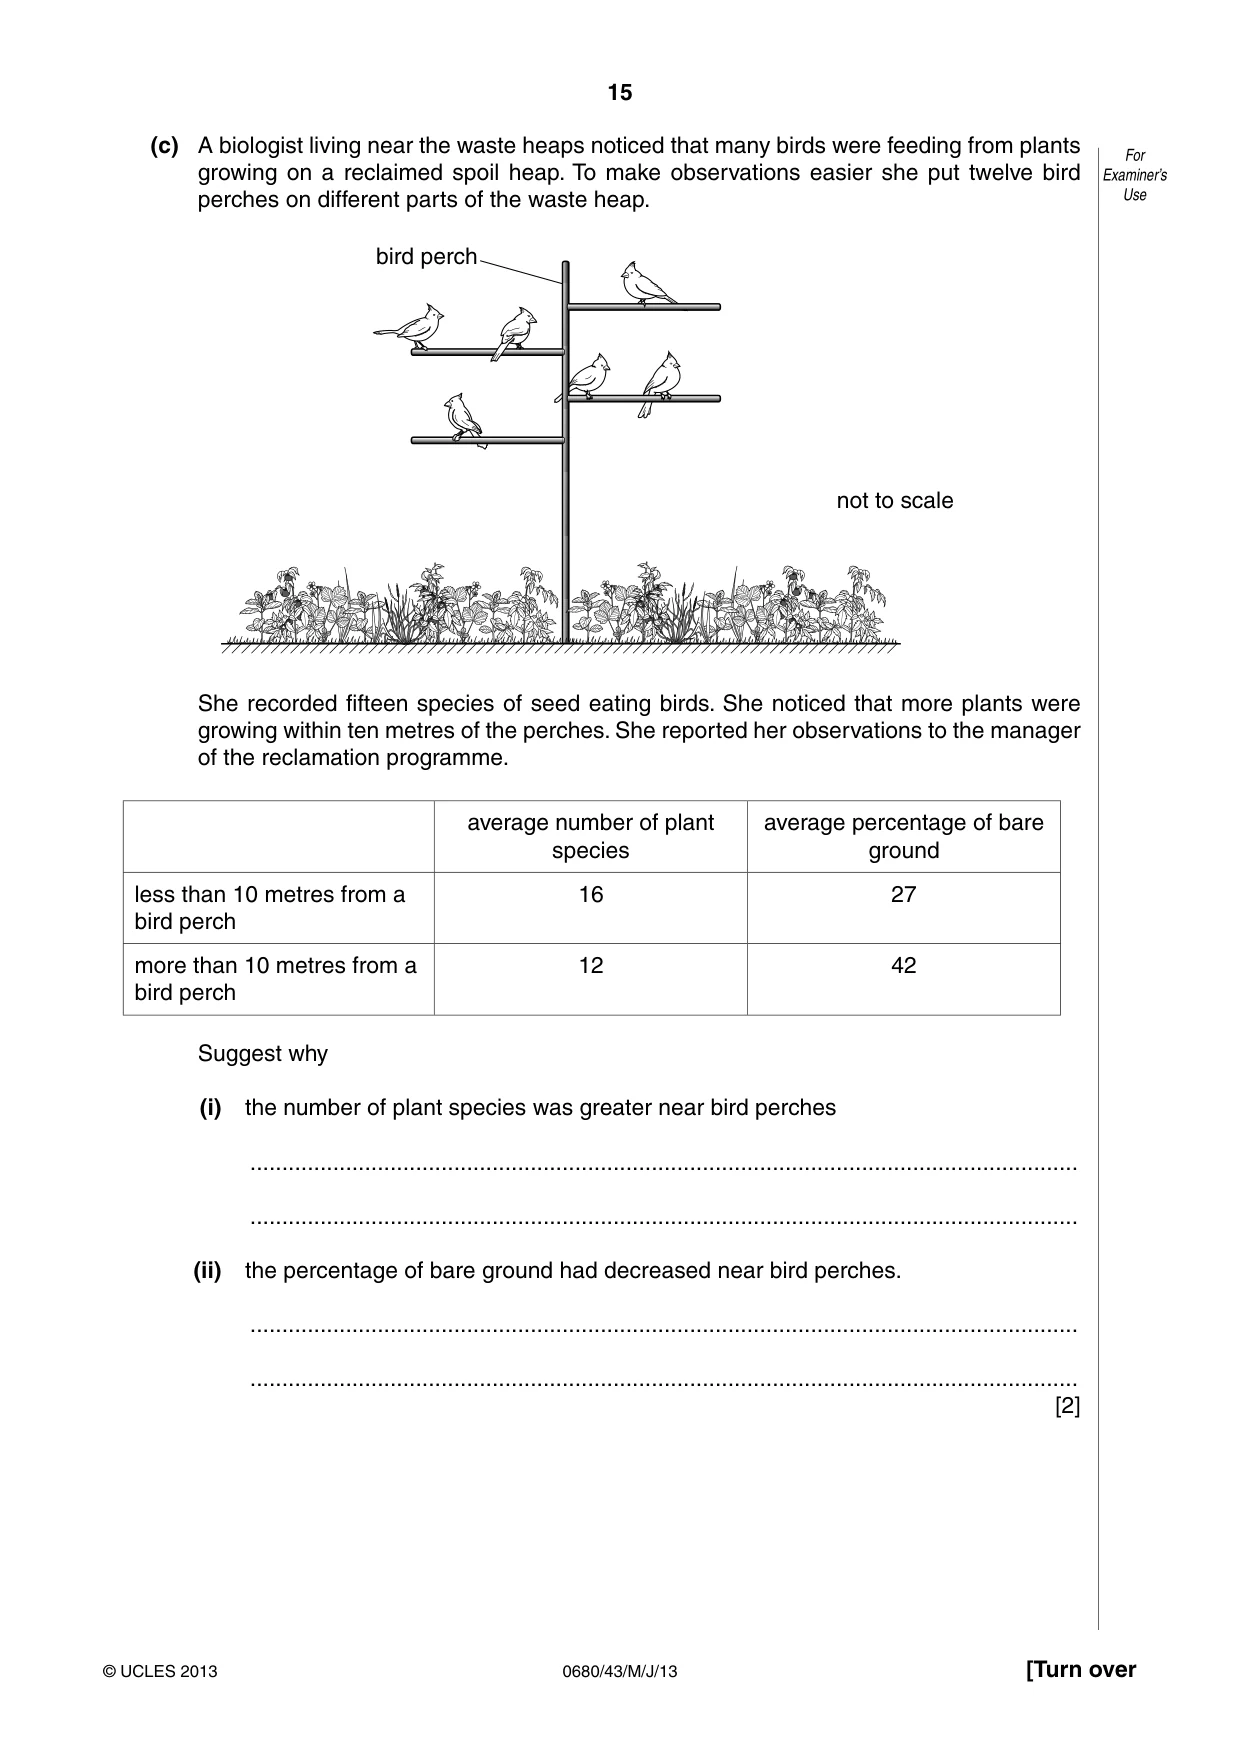
15 0680/43/M/J/13 © UCLES 2013 [Turn over For Examiner’s Use (c) A biologist living near the waste heaps noticed that many birds were feeding from plants growing on a reclaimed spoil heap. To make observations easier she put twelve bird perches on different parts of the waste heap. not to scale bird perch She recorded fifteen species of seed eating birds. She noticed that more plants were growing within ten metres of the perches. She reported her observations to the manager of the reclamation programme. average number of plant species average percentage of bare ground less than 10 metres from a bird perch 16 27 more than 10 metres from a bird perch 12 42 Suggest why (i) the number of plant species was greater near bird perches … … (ii) the percentage of bare ground had decreased near bird perches. … … [2]
Question paper, page 16
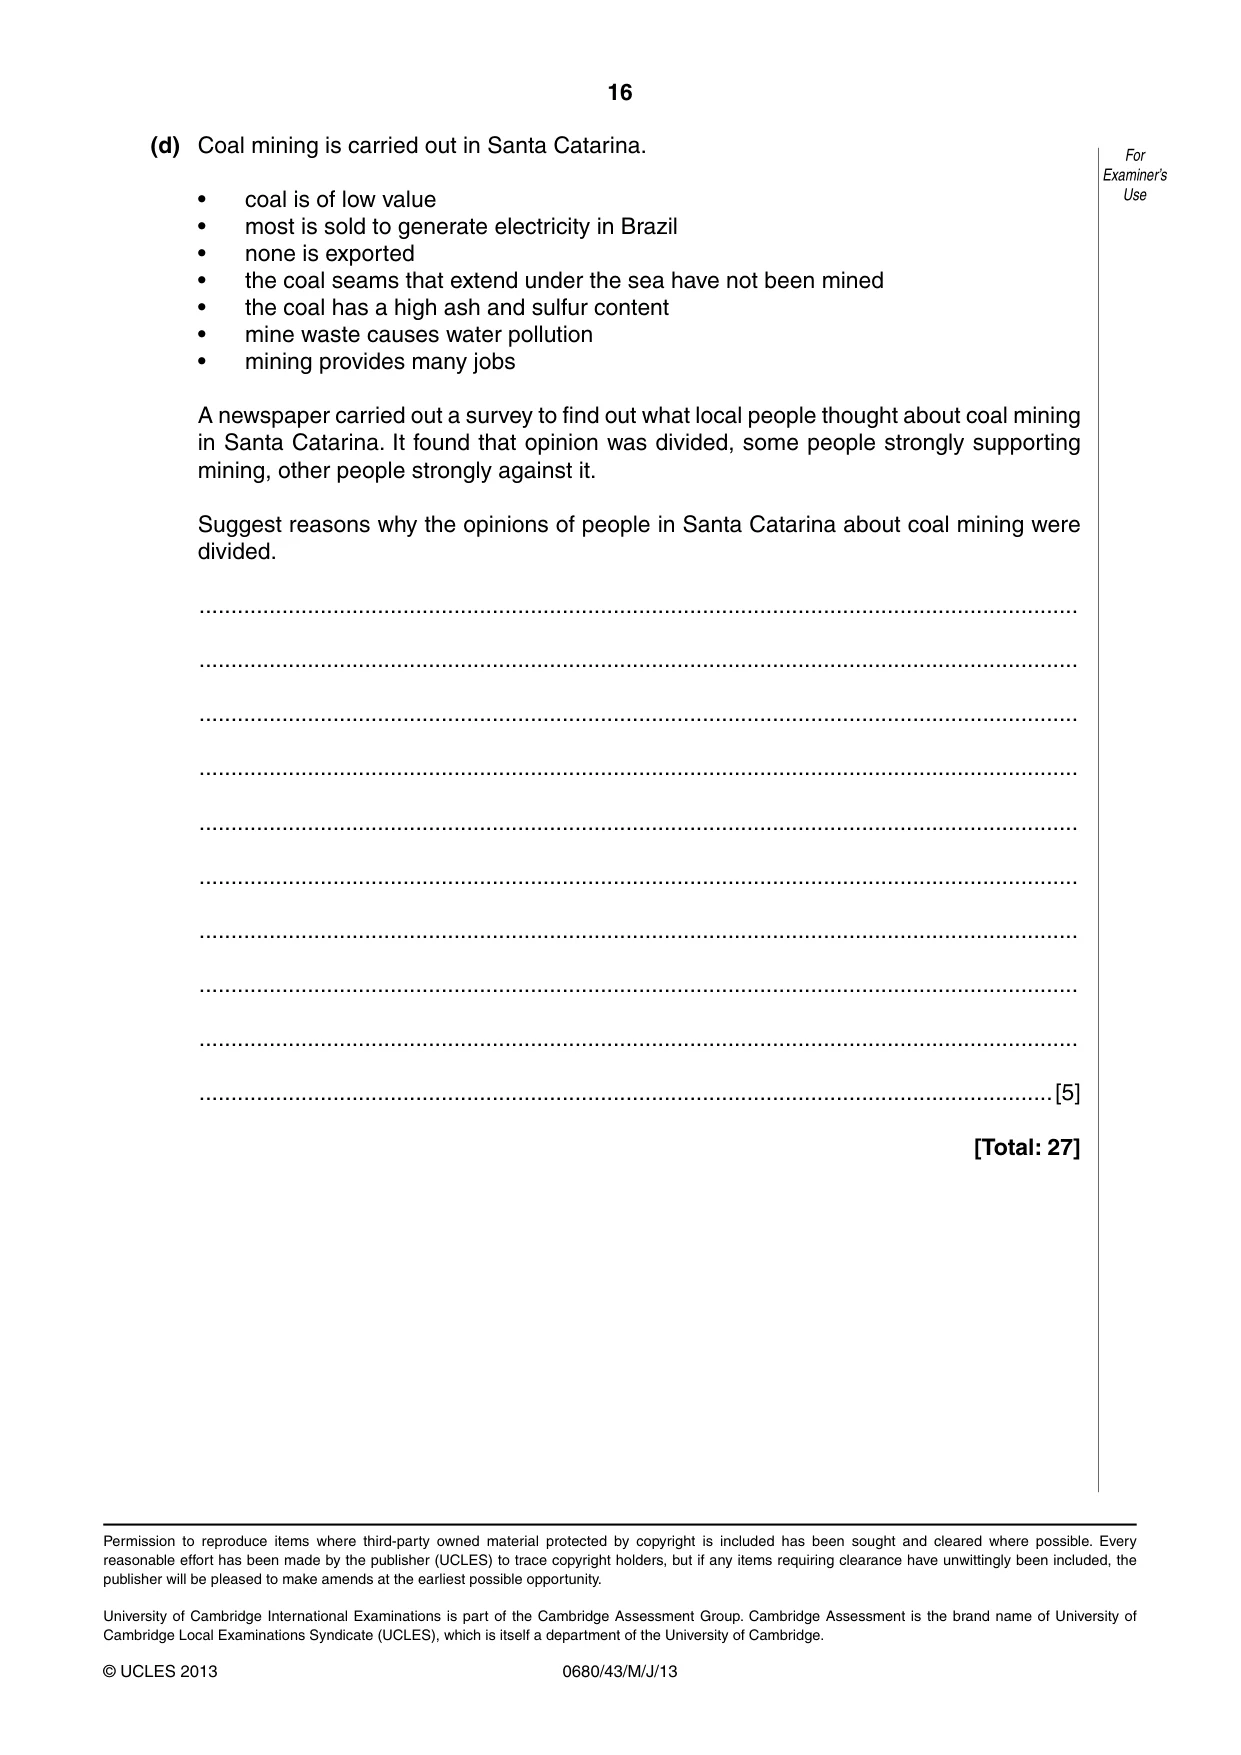
16 0680/43/M/J/13 © UCLES 2013 For Examiner’s Use (d) Coal mining is carried out in Santa Catarina. • coal is of low value • most is sold to generate electricity in Brazil • none is exported • the coal seams that extend under the sea have not been mined • the coal has a high ash and sulfur content • mine waste causes water pollution • mining provides many jobs A newspaper carried out a survey to find out what local people thought about coal mining in Santa Catarina. It found that opinion was divided, some people strongly supporting mining, other people strongly against it. Suggest reasons why the opinions of people in Santa Catarina about coal mining were divided. … … … … … … … … … …[5] [Total: 27] Permission to reproduce items where third-party owned material protected by copyright is included has been sought and cleared where possible. Every reasonable effort has been made by the publisher (UCLES) to trace copyright holders, but if any items requiring clearance have unwittingly been included, the publisher will be pleased to make amends at the earliest possible opportunity. University of Cambridge International Examinations is part of the Cambridge Assessment Group. Cambridge Assessment is the brand name of University of Cambridge Local Examinations Syndicate (UCLES), which is itself a department of the University of Cambridge.
Mark scheme, page 1
CAMBRIDGE INTERNATIONAL EXAMINATIONS International General Certificate of Secondary Education MARK SCHEME for the May/June 2013 series 0680 ENVIRONMENTAL MANAGEMENT 0680/43 Paper 4 (Alternative to Coursework), maximum raw mark 60 This mark scheme is published as an aid to teachers and candidates, to indicate the requirements of the examination. It shows the basis on which Examiners were instructed to award marks. It does not indicate the details of the discussions that took place at an Examiners’ meeting before marking began, which would have considered the acceptability of alternative answers. Mark schemes should be read in conjunction with the question paper and the Principal Examiner Report for Teachers. Cambridge will not enter into discussions about these mark schemes. Cambridge is publishing the mark schemes for the May/June 2013 series for most IGCSE, GCE Advanced Level and Advanced Subsidiary Level components and some Ordinary Level components.
Mark scheme, page 2
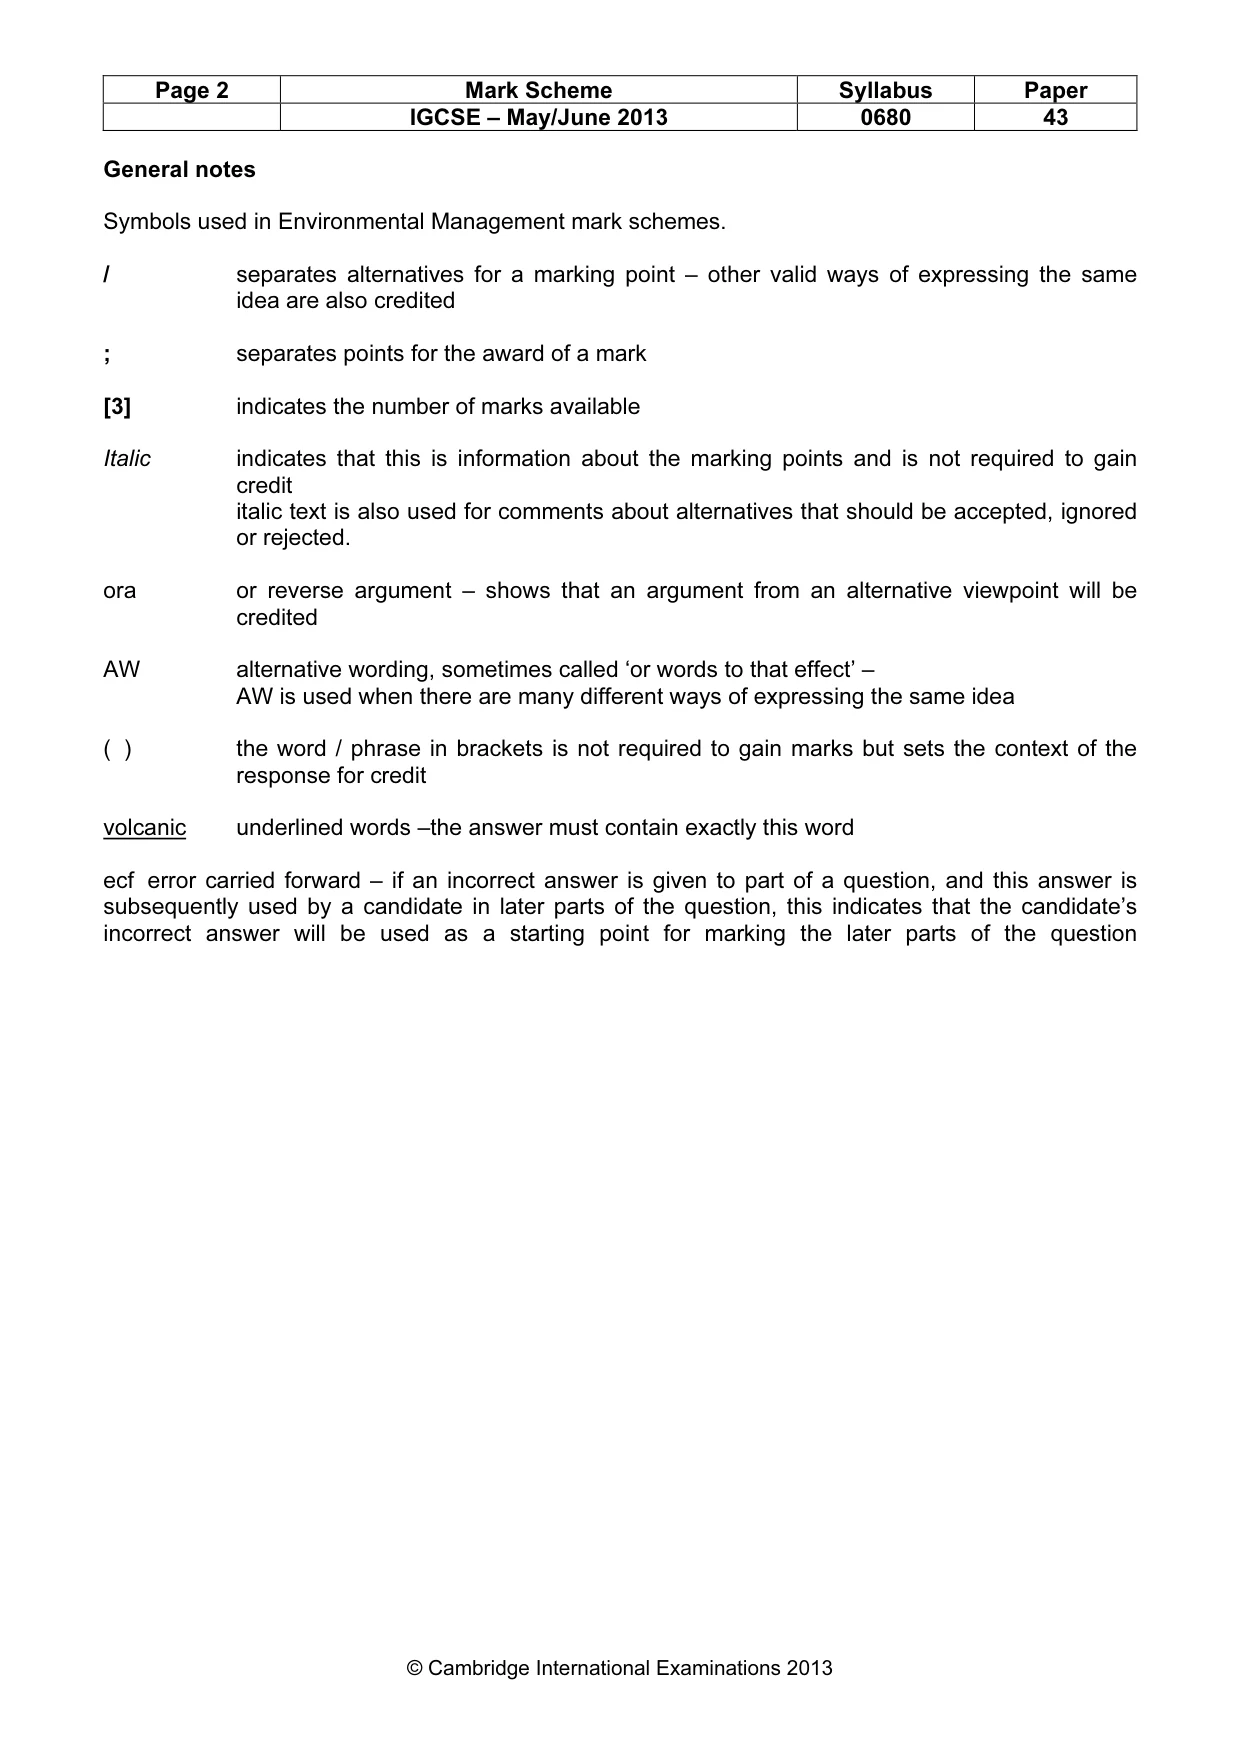
Page 2 Mark Scheme Syllabus Paper IGCSE – May/June 2013 0680 43 © Cambridge International Examinations 2013 General notes Symbols used in Environmental Management mark schemes. / separates alternatives for a marking point – other valid ways of expressing the same idea are also credited ; separates points for the award of a mark [3] indicates the number of marks available Italic indicates that this is information about the marking points and is not required to gain credit italic text is also used for comments about alternatives that should be accepted, ignored or rejected. ora or reverse argument – shows that an argument from an alternative viewpoint will be credited AW alternative wording, sometimes called ‘or words to that effect’ – AW is used when there are many different ways of expressing the same idea ( ) the word / phrase in brackets is not required to gain marks but sets the context of the response for credit volcanic underlined words –the answer must contain exactly this word ecf error carried forward – if an incorrect answer is given to part of a question, and this answer is subsequently used by a candidate in later parts of the question, this indicates that the candidate’s incorrect answer will be used as a starting point for marking the later parts of the question
Mark scheme, page 3
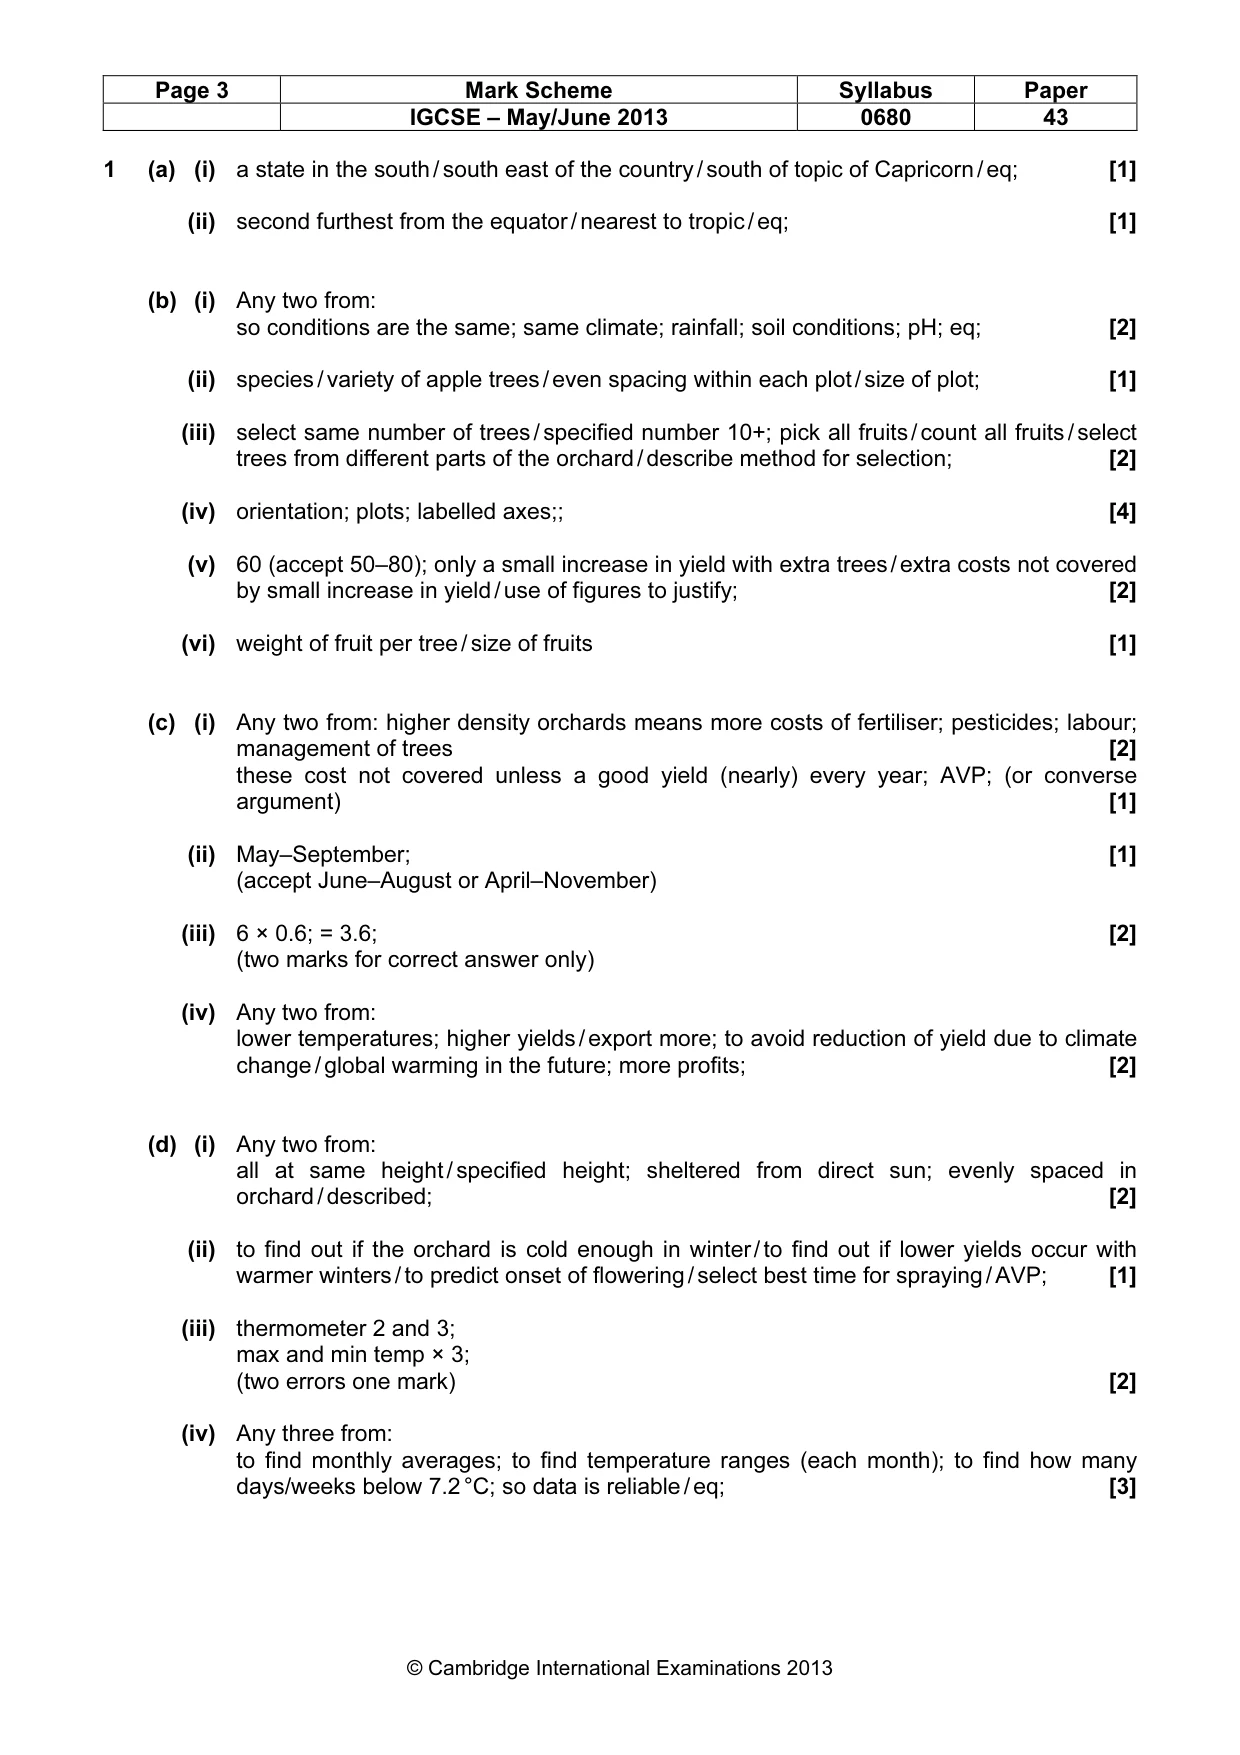
Page 3 Mark Scheme Syllabus Paper IGCSE – May/June 2013 0680 43 © Cambridge International Examinations 2013 1 (a) (i) a state in the south / south east of the country / south of topic of Capricorn / eq; [1] (ii) second furthest from the equator / nearest to tropic / eq; [1] (b) (i) Any two from: so conditions are the same; same climate; rainfall; soil conditions; pH; eq; [2] (ii) species / variety of apple trees / even spacing within each plot / size of plot; [1] (iii) select same number of trees / specified number 10+; pick all fruits / count all fruits / select trees from different parts of the orchard / describe method for selection; [2] (iv) orientation; plots; labelled axes;; [4] (v) 60 (accept 50–80); only a small increase in yield with extra trees / extra costs not covered by small increase in yield / use of figures to justify; [2] (vi) weight of fruit per tree / size of fruits [1] (c) (i) Any two from: higher density orchards means more costs of fertiliser; pesticides; labour; management of trees [2] these cost not covered unless a good yield (nearly) every year; AVP; (or converse argument) [1] (ii) May–September; [1] (accept June–August or April–November) (iii) 6 × 0.6; = 3.6; [2] (two marks for correct answer only) (iv) Any two from: lower temperatures; higher yields / export more; to avoid reduction of yield due to climate change / global warming in the future; more profits; [2] (d) (i) Any two from: all at same height / specified height; sheltered from direct sun; evenly spaced in orchard / described; [2] (ii) to find out if the orchard is cold enough in winter / to find out if lower yields occur with warmer winters / to predict onset of flowering / select best time for spraying / AVP; [1] (iii) thermometer 2 and 3; max and min temp × 3; (two errors one mark) [2] (iv) Any three from: to find monthly averages; to find temperature ranges (each month); to find how many days/weeks below 7.2 °C; so data is reliable / eq; [3]
Mark scheme, page 4
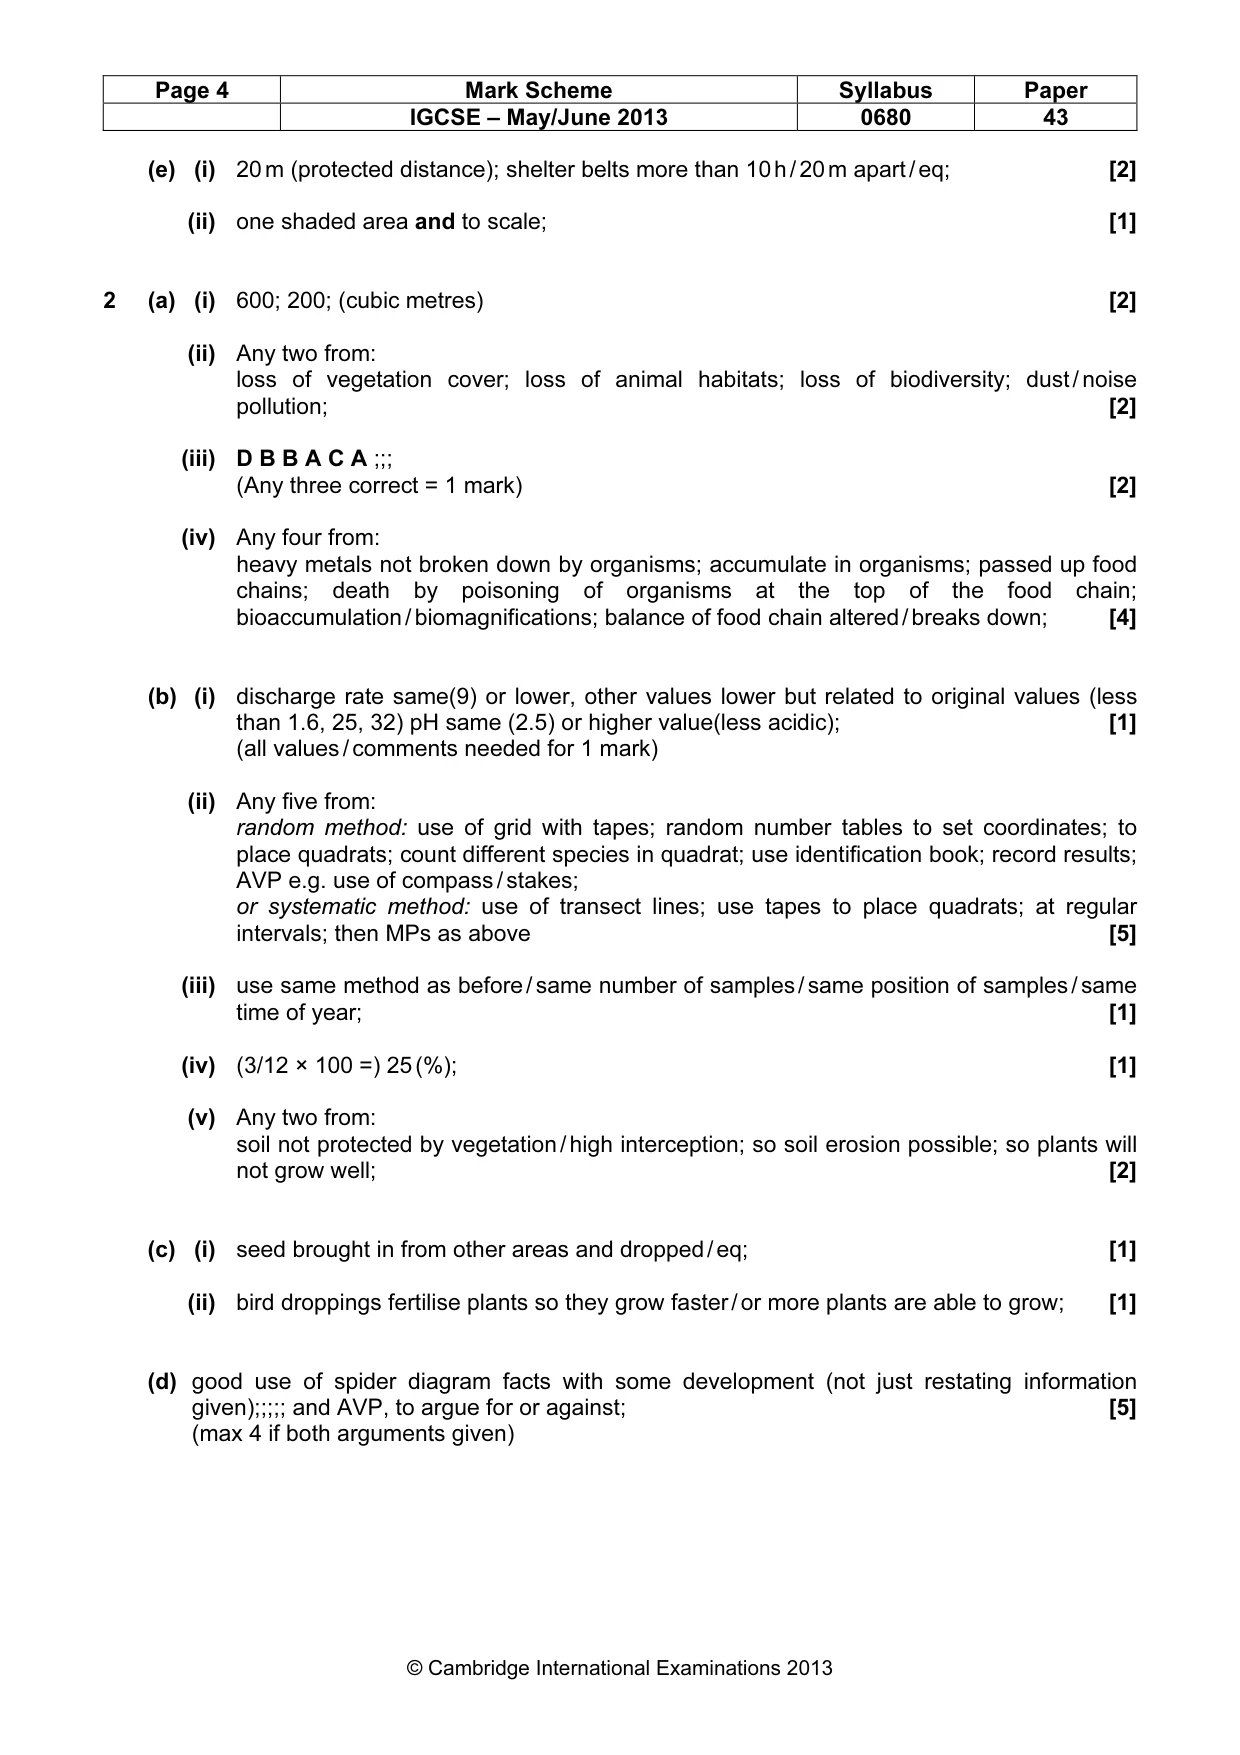
Page 4 Mark Scheme Syllabus Paper IGCSE – May/June 2013 0680 43 © Cambridge International Examinations 2013 (e) (i) 20 m (protected distance); shelter belts more than 10 h / 20 m apart / eq; [2] (ii) one shaded area and to scale; [1] 2 (a) (i) 600; 200; (cubic metres) [2] (ii) Any two from: loss of vegetation cover; loss of animal habitats; loss of biodiversity; dust / noise pollution; [2] (iii) D B B A C A ;;; (Any three correct = 1 mark) [2] (iv) Any four from: heavy metals not broken down by organisms; accumulate in organisms; passed up food chains; death by poisoning of organisms at the top of the food chain; bioaccumulation / biomagnifications; balance of food chain altered / breaks down; [4] (b) (i) discharge rate same(9) or lower, other values lower but related to original values (less than 1.6, 25, 32) pH same (2.5) or higher value(less acidic); [1] (all values / comments needed for 1 mark) (ii) Any five from: random method: use of grid with tapes; random number tables to set coordinates; to place quadrats; count different species in quadrat; use identification book; record results; AVP e.g. use of compass / stakes; or systematic method: use of transect lines; use tapes to place quadrats; at regular intervals; then MPs as above [5] (iii) use same method as before / same number of samples / same position of samples / same time of year; [1] (iv) (3/12 × 100 =) 25 (%); [1] (v) Any two from: soil not protected by vegetation / high interception; so soil erosion possible; so plants will not grow well; [2] (c) (i) seed brought in from other areas and dropped / eq; [1] (ii) bird droppings fertilise plants so they grow faster / or more plants are able to grow; [1] (d) good use of spider diagram facts with some development (not just restating information given);;;;; and AVP, to argue for or against; [5] (max 4 if both arguments given)
What you needed in this session
Cambridge’s own grade thresholds for 2013 May/June, Paper 4 · Variant 3. A higher threshold means an easier paper — the bar moves with how the cohort did.