Cambridge IGCSE Environmental Management 0680 — 2013 May/June Paper 4 · Variant 1
0680/41/M/J/13 · 60 marks · ≈68 min
The question paper and its mark scheme, free to read here and free to download. This is Cambridge’s own paper, exactly as it was sat.
Question paper20 pages









Mark scheme5 pages
Answers below. Sit the paper first if you are practising.

Paper as text
Question paper, page 1
This document consists of 20 printed pages. DC (CW/CGW) 65619/4 © UCLES 2013 [Turn over UNIVERSITY OF CAMBRIDGE INTERNATIONAL EXAMINATIONS International General Certificate of Secondary Education * 5 0 4 6 1 4 9 8 1 7 * ENVIRONMENTAL MANAGEMENT 0680/41 Alternative to Coursework May/June 2013 1 hour 30 minutes Candidates answer on the Question Paper. Additional Materials: Ruler READ THESE INSTRUCTIONS FIRST Write your Centre number, candidate number and name on all the work you hand in. Write in dark blue or black pen. You may use a soft pencil for any diagrams, graphs or rough working. Do not use staples, paper clips, highlighters, glue or correction fluid. Electronic calculators may be used. DO NOT WRITE IN ANY BARCODES. Answer all questions. Study the appropriate Source materials before you start to write your answers. Credit will be given for appropriate selection and use of data in your answers and for relevant interpretation of these data. Suggestions for data sources are given in some questions. You may use the source data to draw diagrams and graphs or to do calculations to illustrate your answers. At the end of the examination, fasten all your work securely together. The number of marks is given in brackets [ ] at the end of each question or part question. For Examiner’s Use 1 2 Total
Question paper, page 2
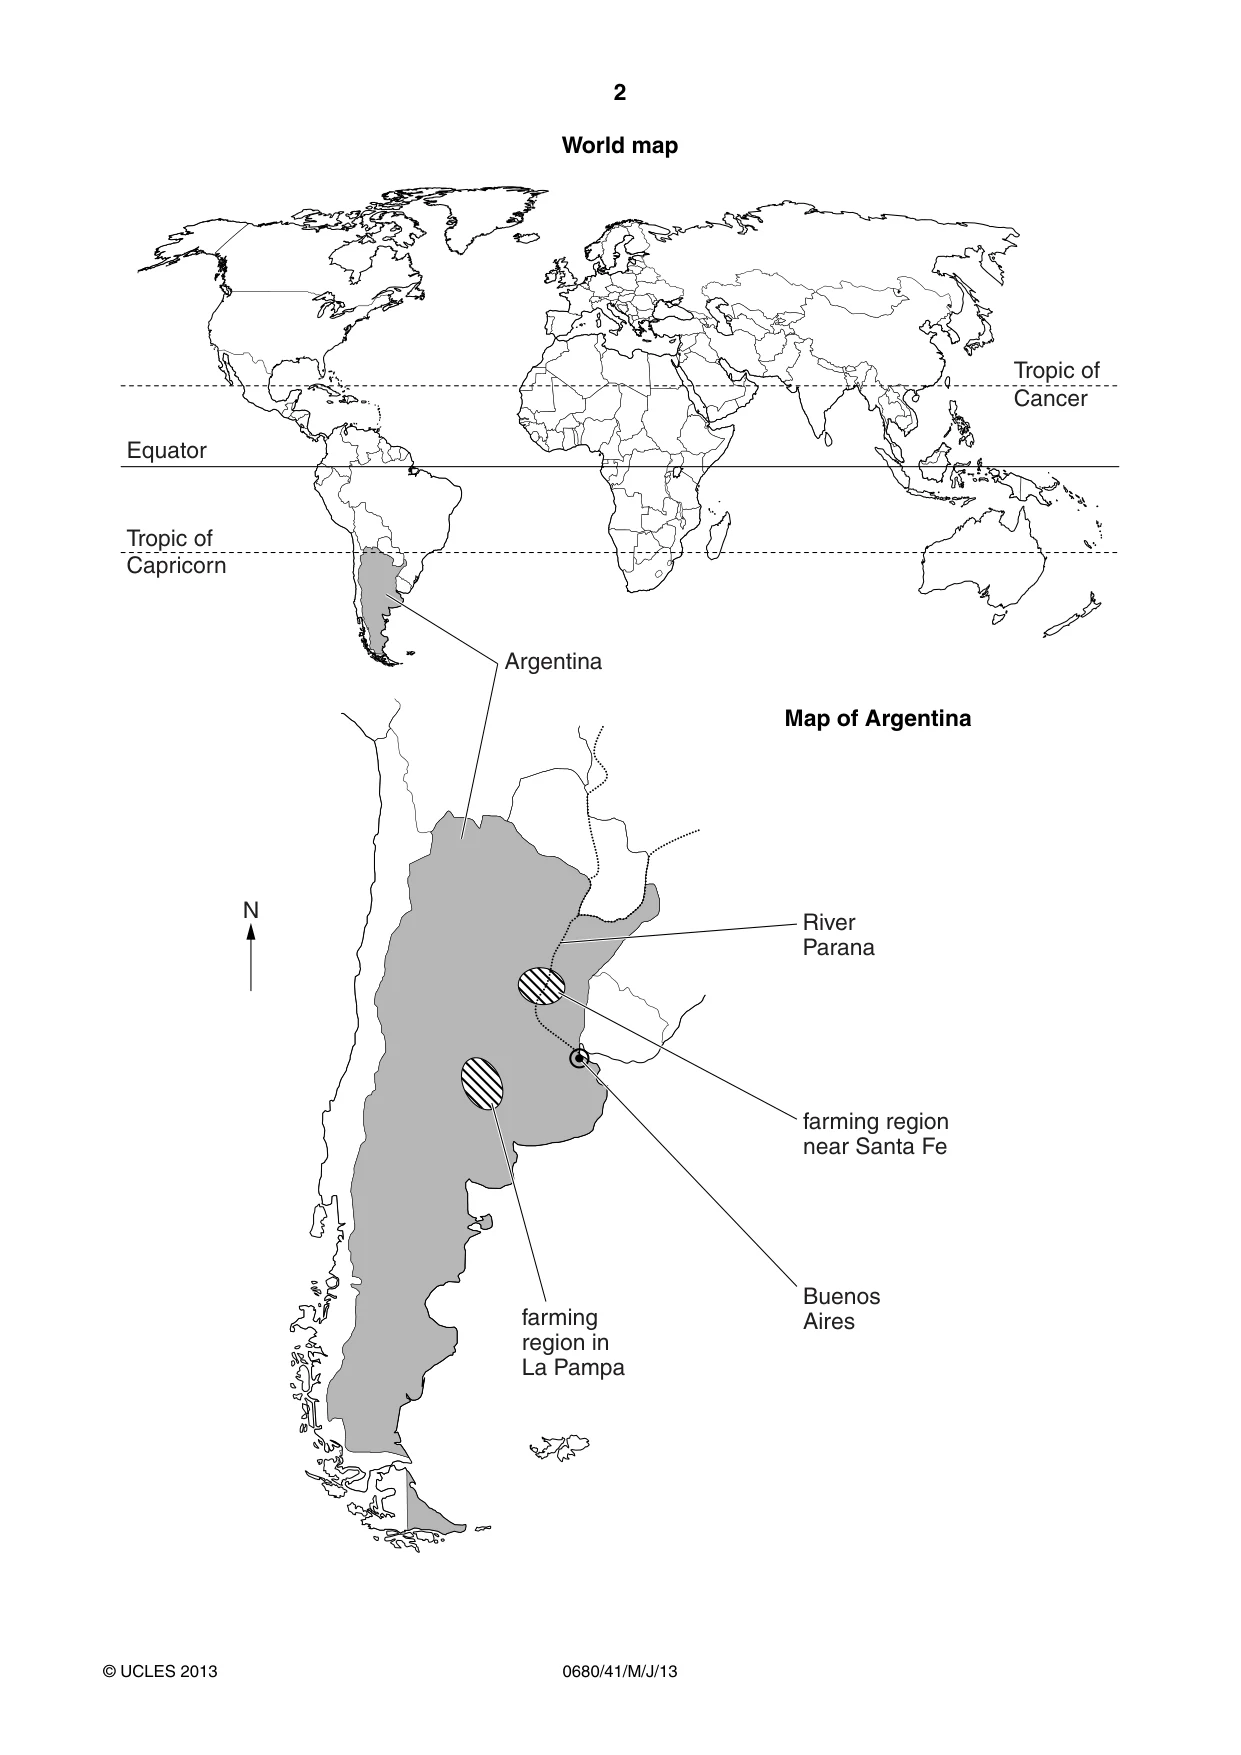
2 0680/41/M/J/13 © UCLES 2013 World map Equator Argentina N River Parana Buenos Aires farming region near Santa Fe Tropic of Capricorn Tropic of Cancer farming region in La Pampa Map of Argentina
Question paper, page 3
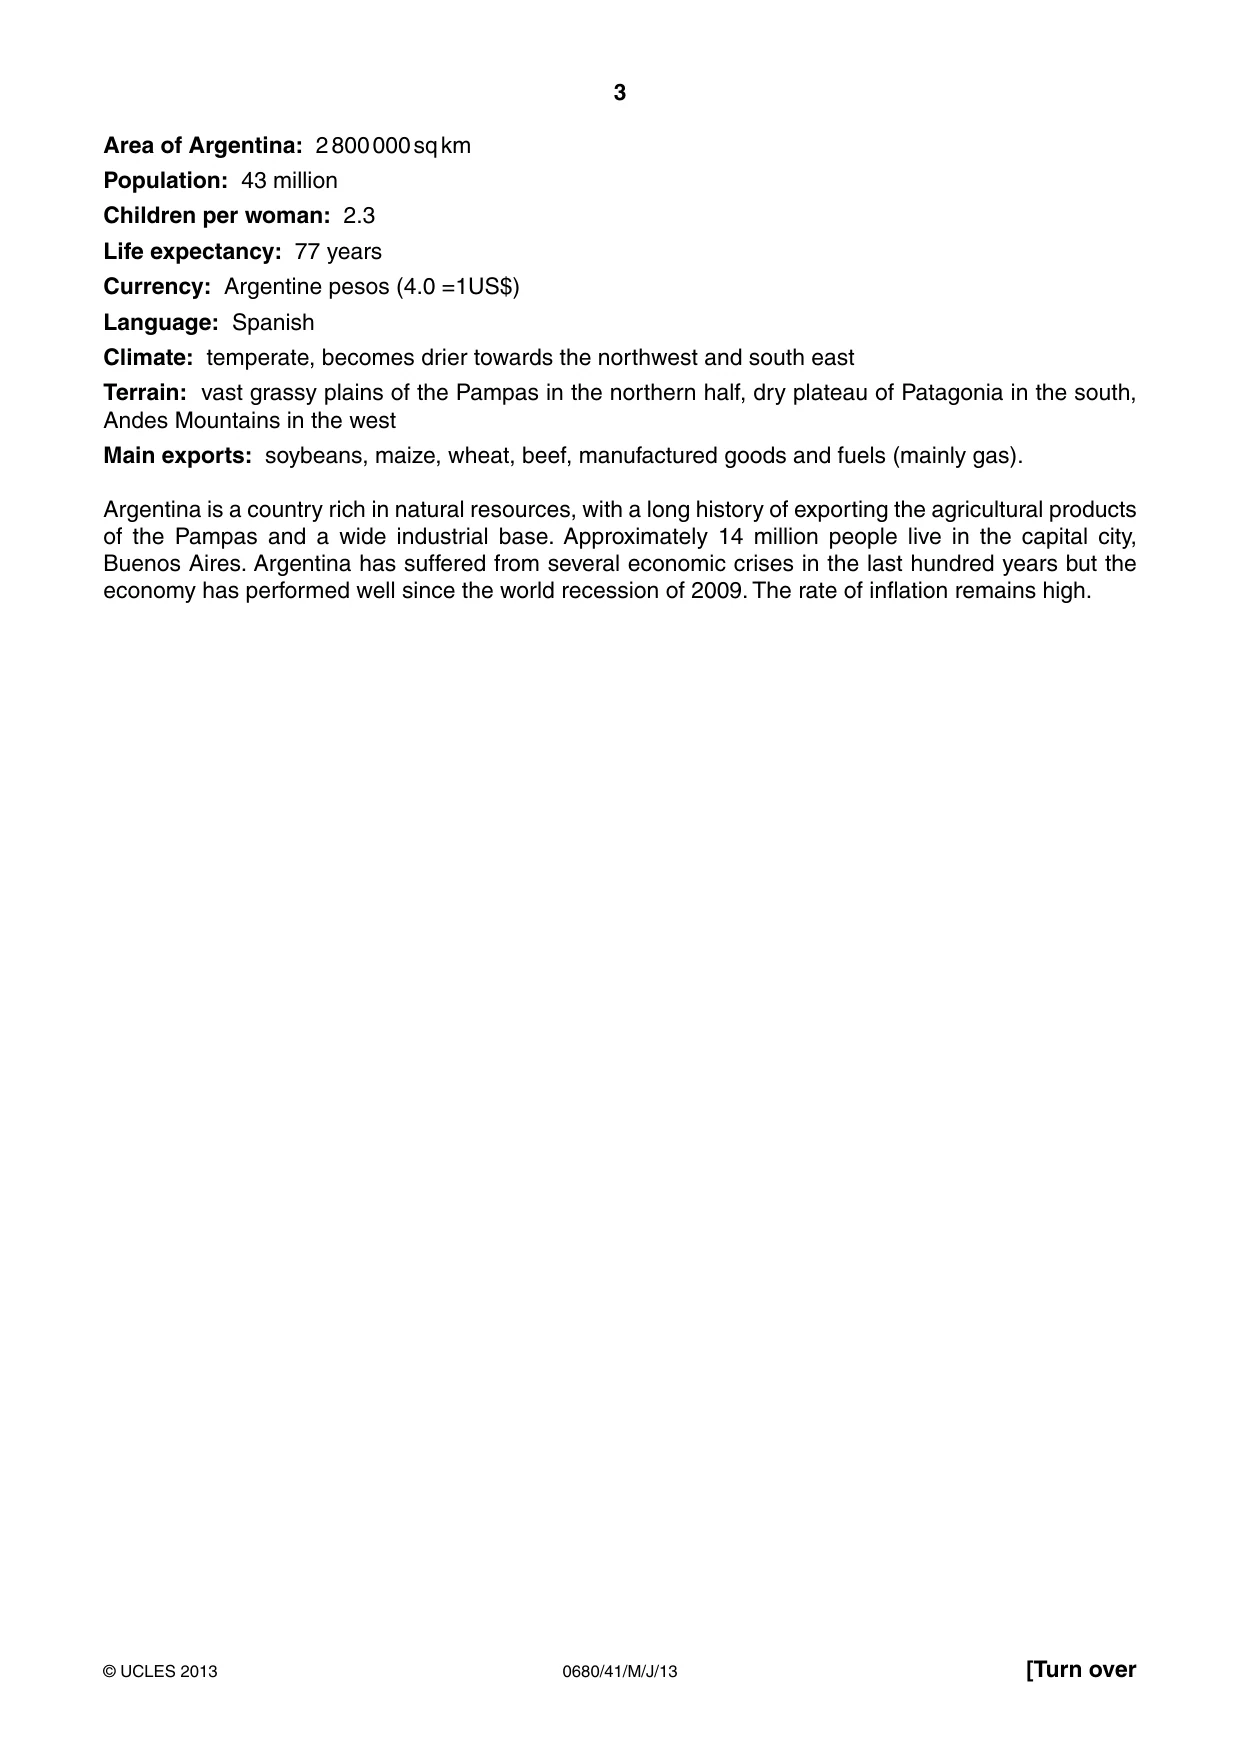
3 0680/41/M/J/13 © UCLES 2013 [Turn over Area of Argentina: 2 800 000 sq km Population: 43 million Children per woman: 2.3 Life expectancy: 77 years Currency: Argentine pesos (4.0 =1US$) Language: Spanish Climate: temperate, becomes drier towards the northwest and south east Terrain: vast grassy plains of the Pampas in the northern half, dry plateau of Patagonia in the south, Andes Mountains in the west Main exports: soybeans, maize, wheat, beef, manufactured goods and fuels (mainly gas). Argentina is a country rich in natural resources, with a long history of exporting the agricultural products of the Pampas and a wide industrial base. Approximately 14 million people live in the capital city, Buenos Aires. Argentina has suffered from several economic crises in the last hundred years but the economy has performed well since the world recession of 2009. The rate of inflation remains high.
Question paper, page 4
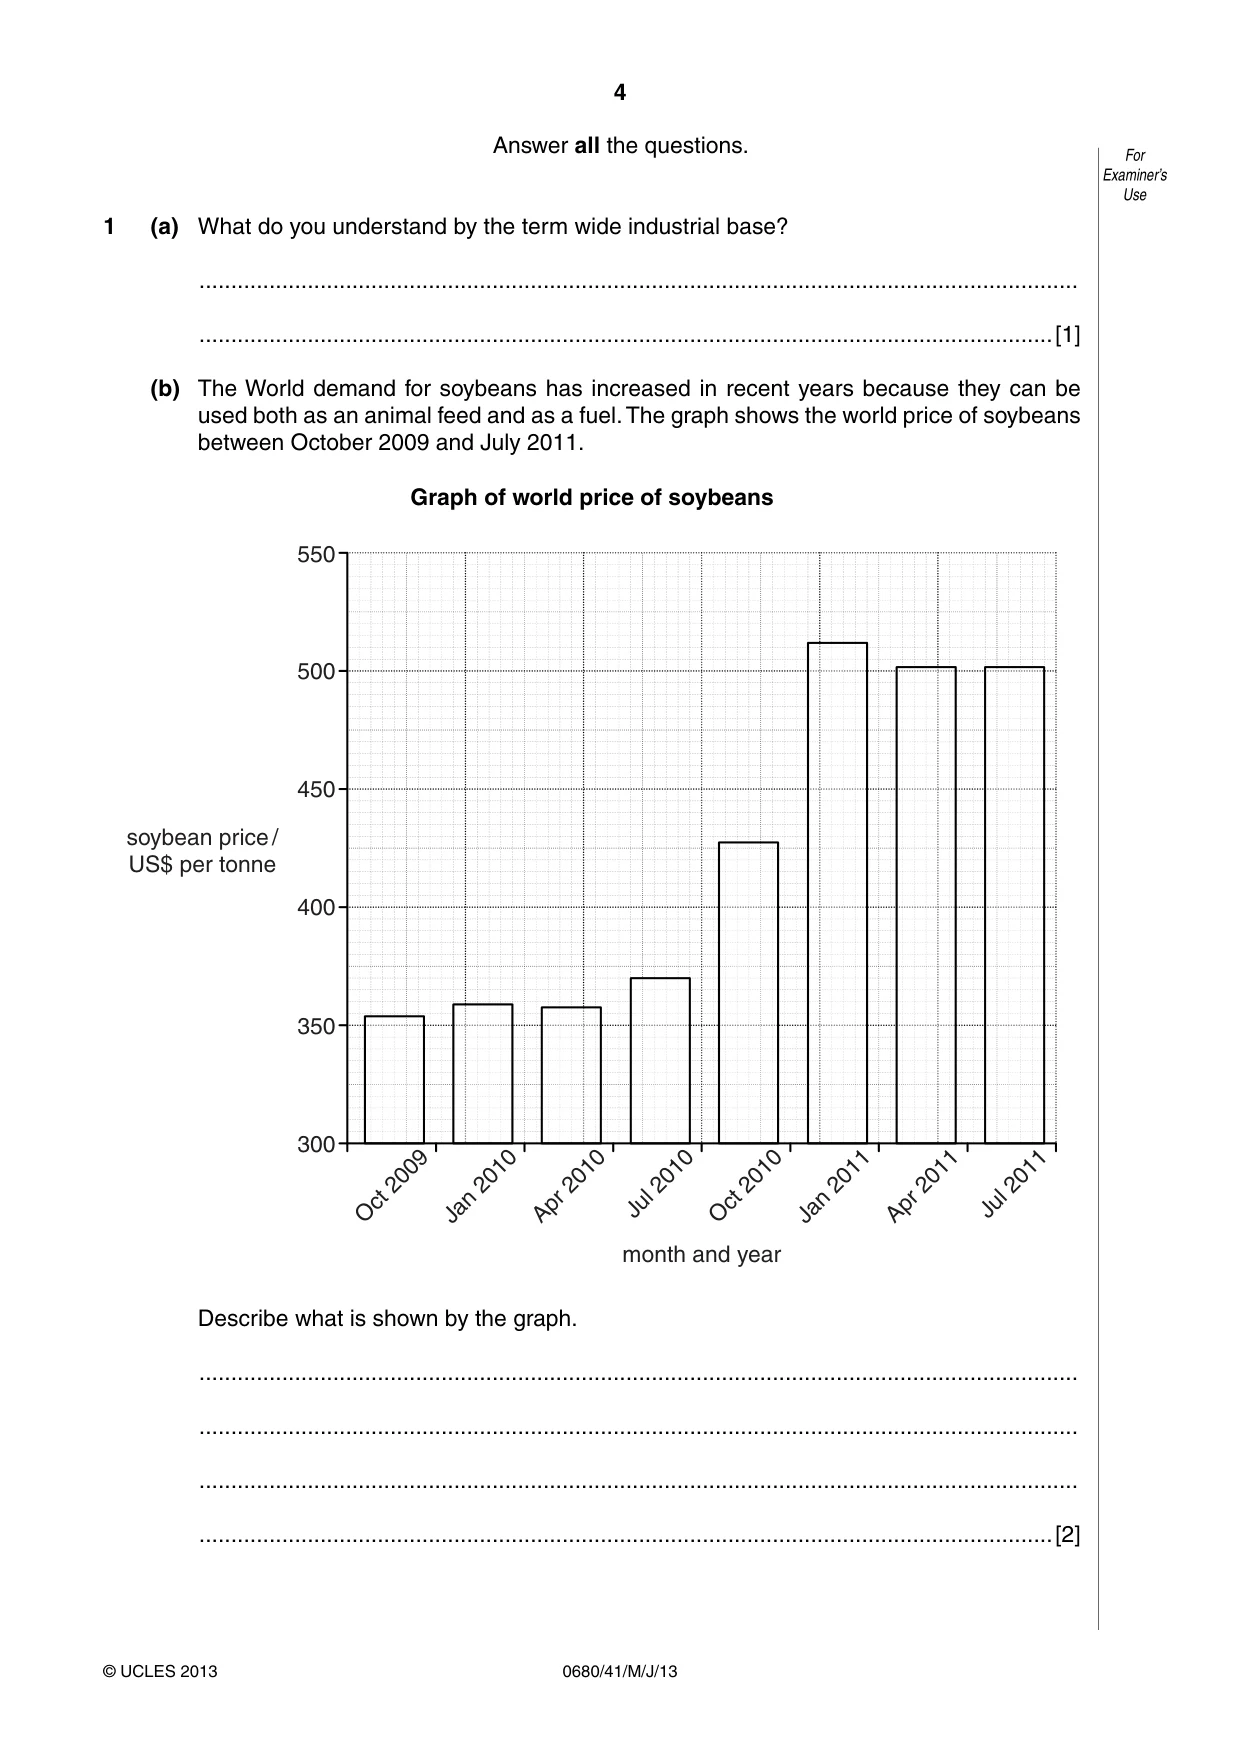
4 0680/41/M/J/13 © UCLES 2013 For Examiner’s Use Answer all the questions. 1 (a) What do you understand by the term wide industrial base? … …[1] (b) The World demand for soybeans has increased in recent years because they can be used both as an animal feed and as a fuel. The graph shows the world price of soybeans between October 2009 and July 2011. Graph of world price of soybeans 300 350 400 450 500 550 month and year soybean price / US$ per tonne Oct 2009 Jan 2010 Apr 2010 Jul 2010 Oct 2010 Jan 2011 Apr 2011 Jul 2011 Describe what is shown by the graph. … … … …[2]
Question paper, page 5
5 0680/41/M/J/13 © UCLES 2013 [Turn over For Examiner’s Use (c) Most of the soybean grown in Argentina is GM (genetically modified). The seeds of soybeans have been genetically modified so a weedkiller ‘round up’ can be sprayed without damaging the soybean crop. The weedkiller allows large areas of land to be planted with one crop (monoculture). (i) Explain one advantage to the farmer of using GM soybeans. … …[1] (ii) Suggest two possible problems of having large areas of monoculture. … … … …[2] (iii) Some people think growing GM crops is a risk to the environment. Why do they think this? … … … …[2]
Question paper, page 6
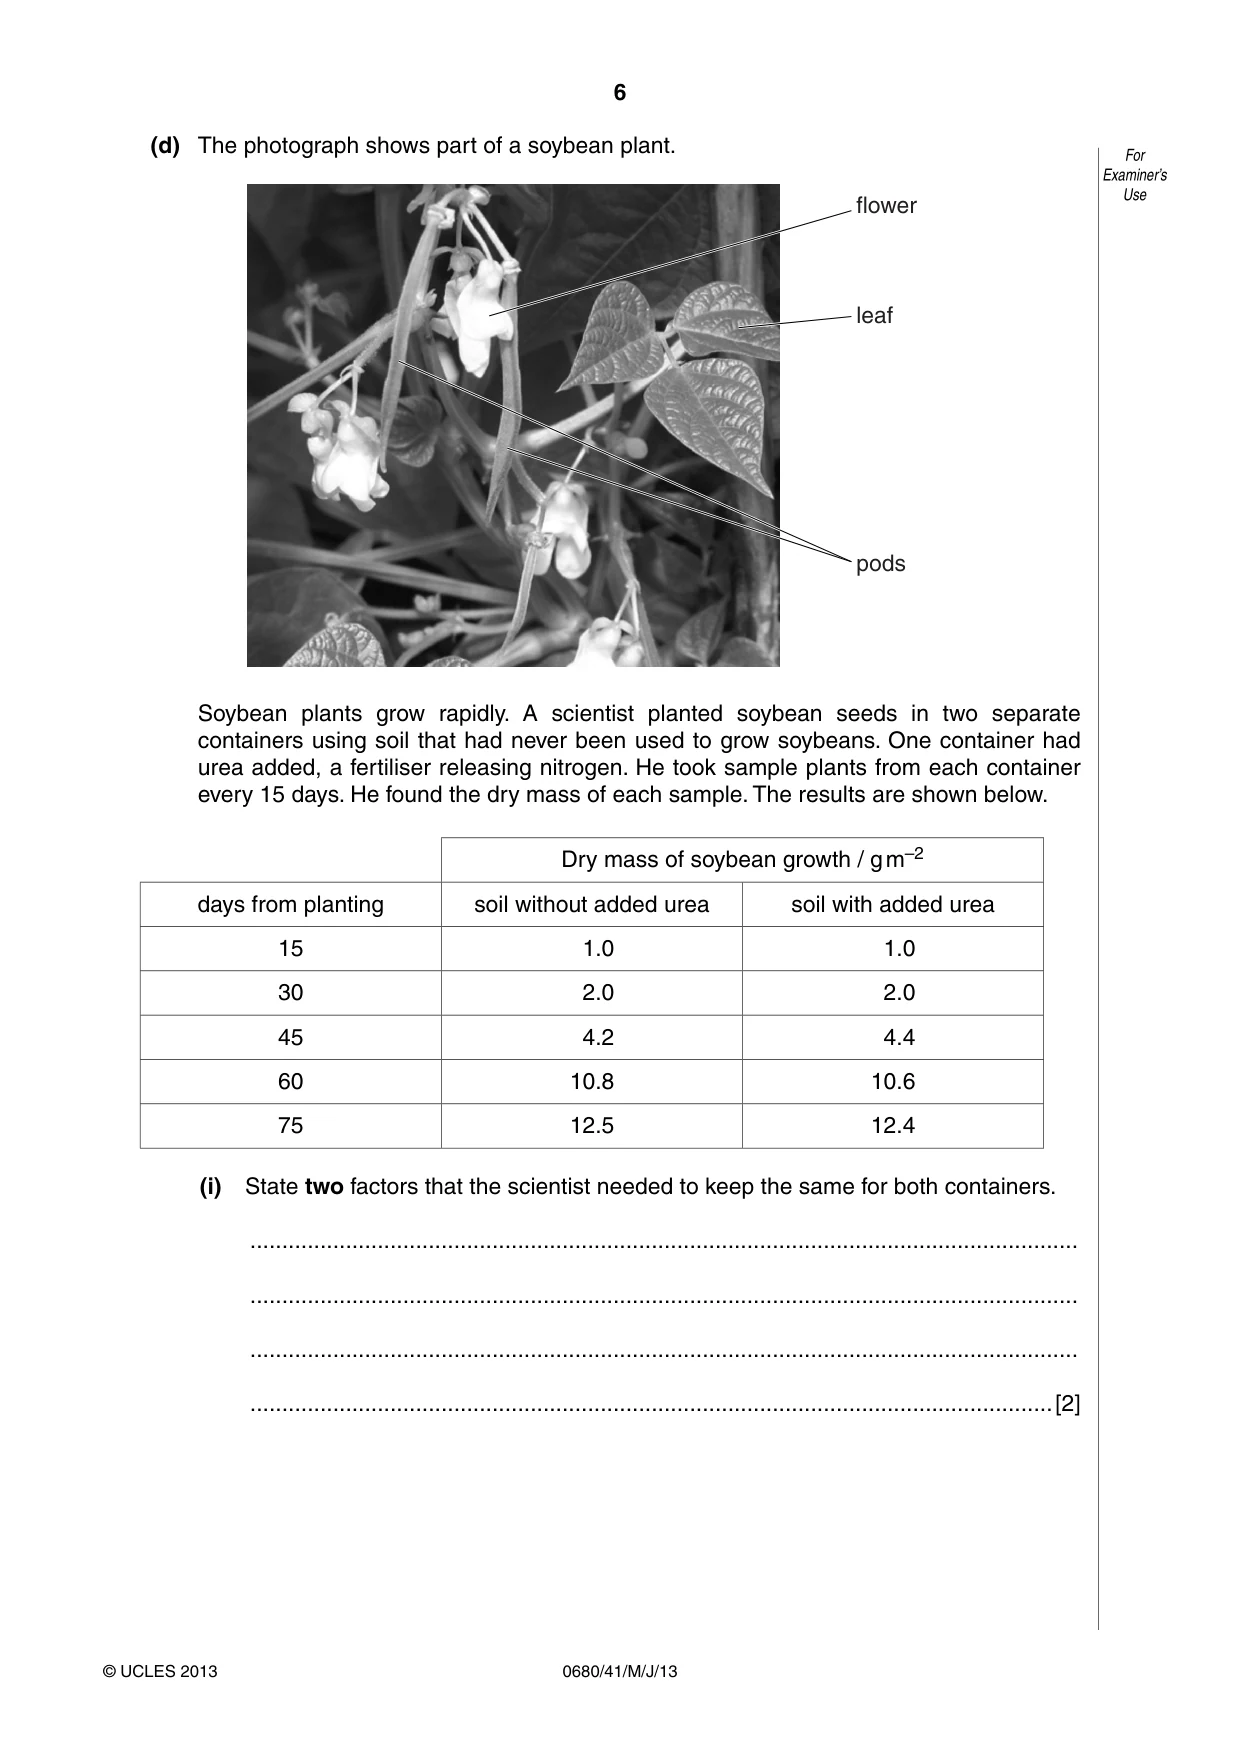
6 0680/41/M/J/13 © UCLES 2013 For Examiner’s Use (d) The photograph shows part of a soybean plant. pods leaf flower Soybean plants grow rapidly. A scientist planted soybean seeds in two separate containers using soil that had never been used to grow soybeans. One container had urea added, a fertiliser releasing nitrogen. He took sample plants from each container every 15 days. He found the dry mass of each sample. The results are shown below. Dry mass of soybean growth / g m–2 days from planting soil without added urea soil with added urea 15 1.0 1.0 30 2.0 2.0 45 4.2 4.4 60 10.8 10.6 75 12.5 12.4 (i) State two factors that the scientist needed to keep the same for both containers. … … … …[2]
Question paper, page 7
7 0680/41/M/J/13 © UCLES 2013 [Turn over For Examiner’s Use (ii) Plot a graph of the data in the table on page 6. [4] (iii) Did the fertiliser make a difference to the growth of soybeans in the two soils? Using information from the graph and table explain your answer. … … … … … …[3]
Question paper, page 8
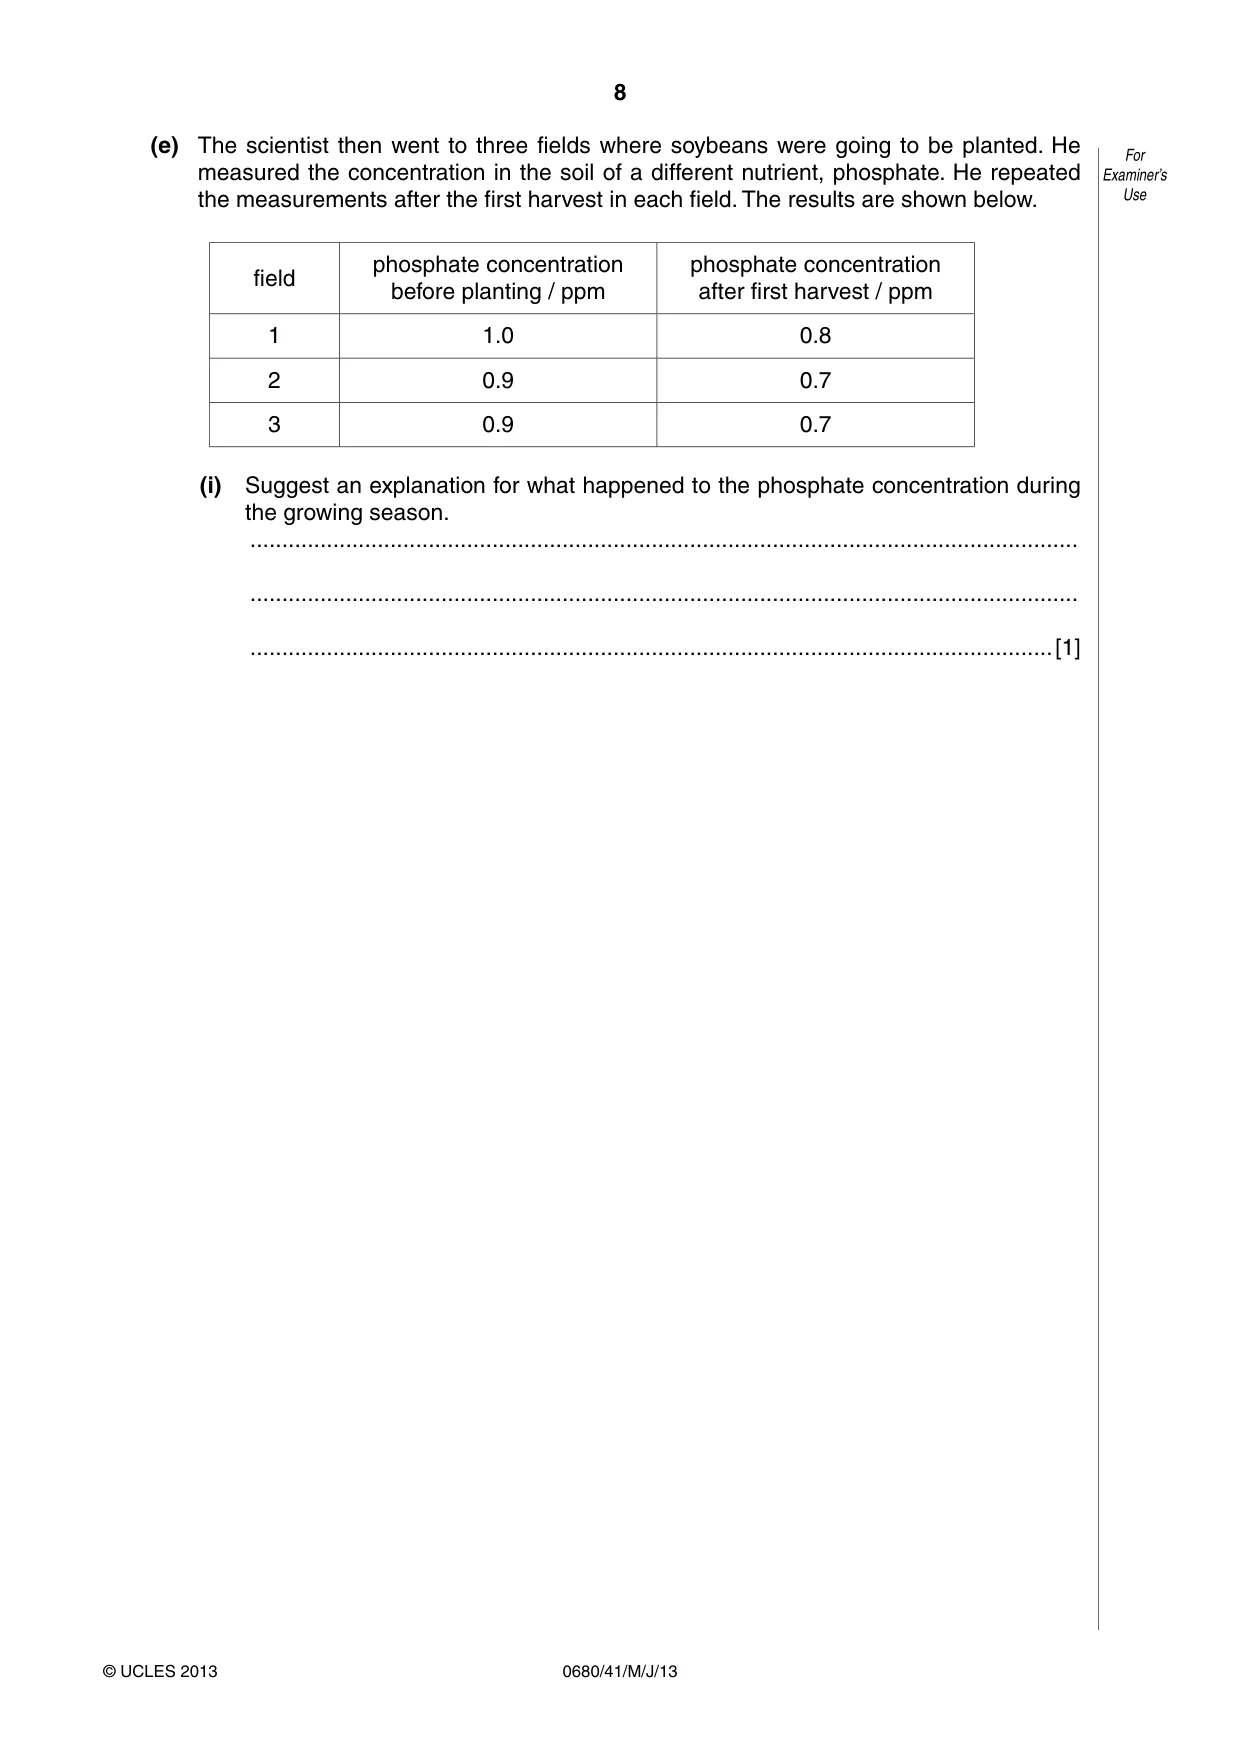
8 0680/41/M/J/13 © UCLES 2013 For Examiner’s Use (e) The scientist then went to three fields where soybeans were going to be planted. He measured the concentration in the soil of a different nutrient, phosphate. He repeated the measurements after the first harvest in each field. The results are shown below. field phosphate concentration before planting / ppm phosphate concentration after first harvest / ppm 1 1.0 0.8 2 0.9 0.7 3 0.9 0.7 (i) Suggest an explanation for what happened to the phosphate concentration during the growing season. … … …[1]
Question paper, page 9
9 0680/41/M/J/13 © UCLES 2013 [Turn over TURN OVER FOR QUESTION 1(e)(ii)
Question paper, page 10
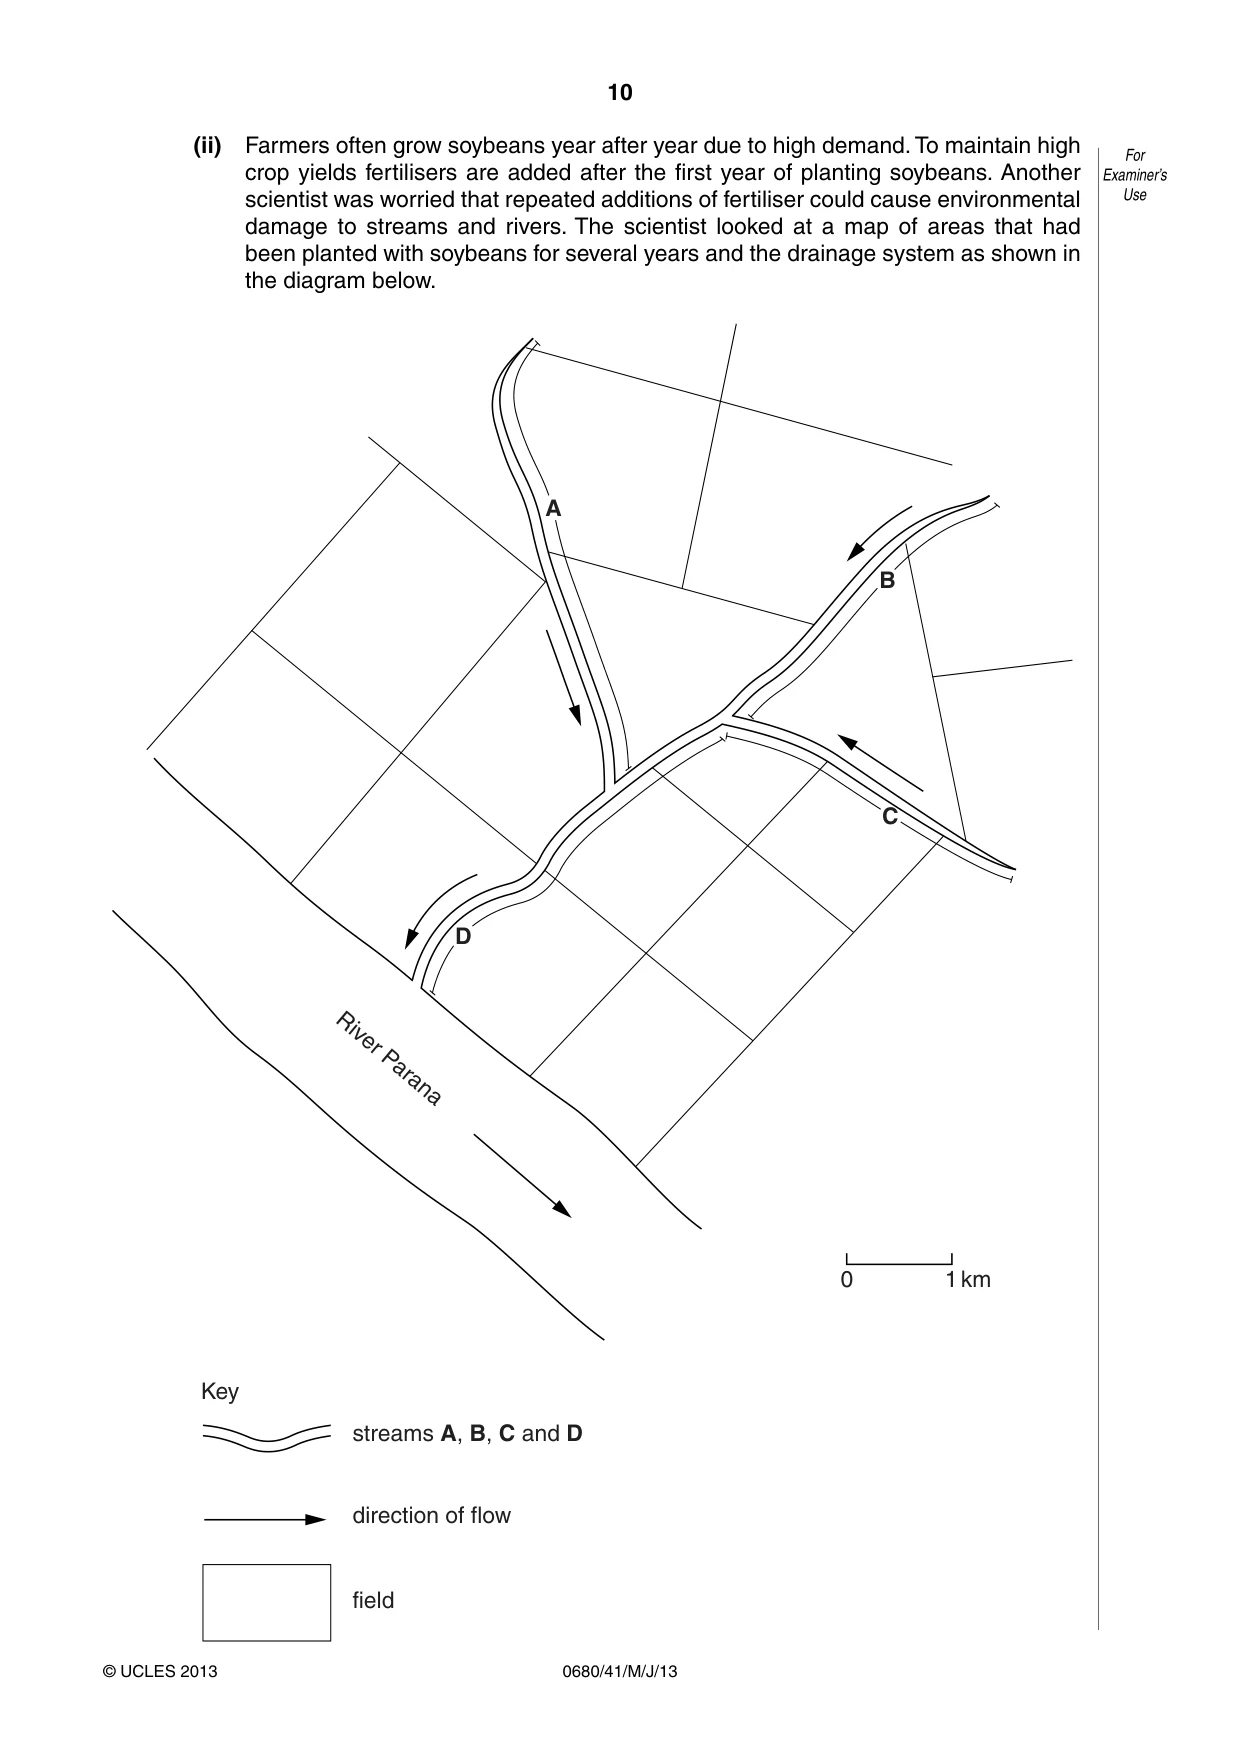
10 0680/41/M/J/13 © UCLES 2013 For Examiner’s Use (ii) Farmers often grow soybeans year after year due to high demand. To maintain high crop yields fertilisers are added after the first year of planting soybeans. Another scientist was worried that repeated additions of fertiliser could cause environmental damage to streams and rivers. The scientist looked at a map of areas that had been planted with soybeans for several years and the drainage system as shown in the diagram below. 0 1 km River Parana A B C D streams A, B, C and D field Key direction of flow
Question paper, page 11
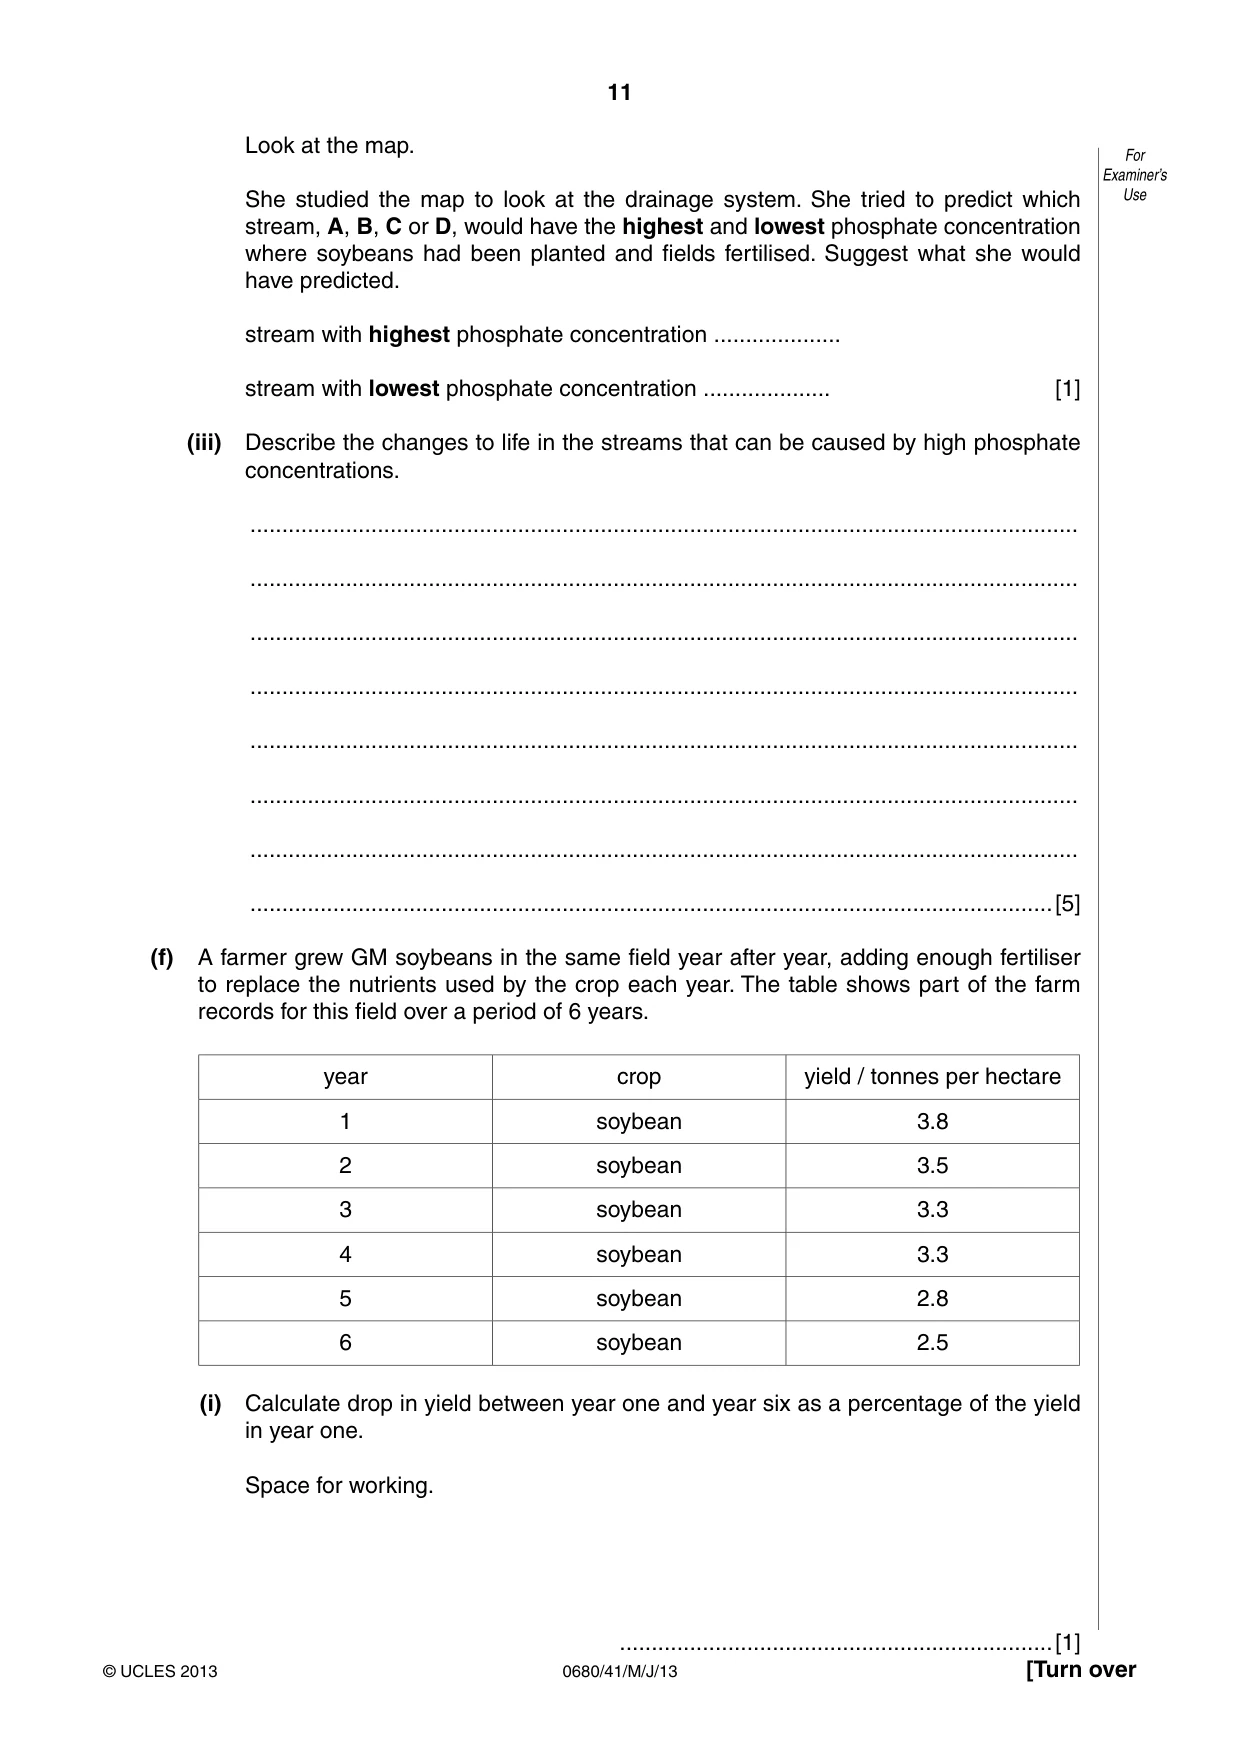
11 0680/41/M/J/13 © UCLES 2013 [Turn over For Examiner’s Use Look at the map. She studied the map to look at the drainage system. She tried to predict which stream, A, B, C or D, would have the highest and lowest phosphate concentration where soybeans had been planted and fields fertilised. Suggest what she would have predicted. stream with highest phosphate concentration … stream with lowest phosphate concentration … [1] (iii) Describe the changes to life in the streams that can be caused by high phosphate concentrations. … … … … … … … …[5] (f) A farmer grew GM soybeans in the same field year after year, adding enough fertiliser to replace the nutrients used by the crop each year. The table shows part of the farm records for this field over a period of 6 years. year crop yield / tonnes per hectare 1 soybean 3.8 2 soybean 3.5 3 soybean 3.3 4 soybean 3.3 5 soybean 2.8 6 soybean 2.5 (i) Calculate drop in yield between year one and year six as a percentage of the yield in year one. Space for working. …[1]
Question paper, page 12
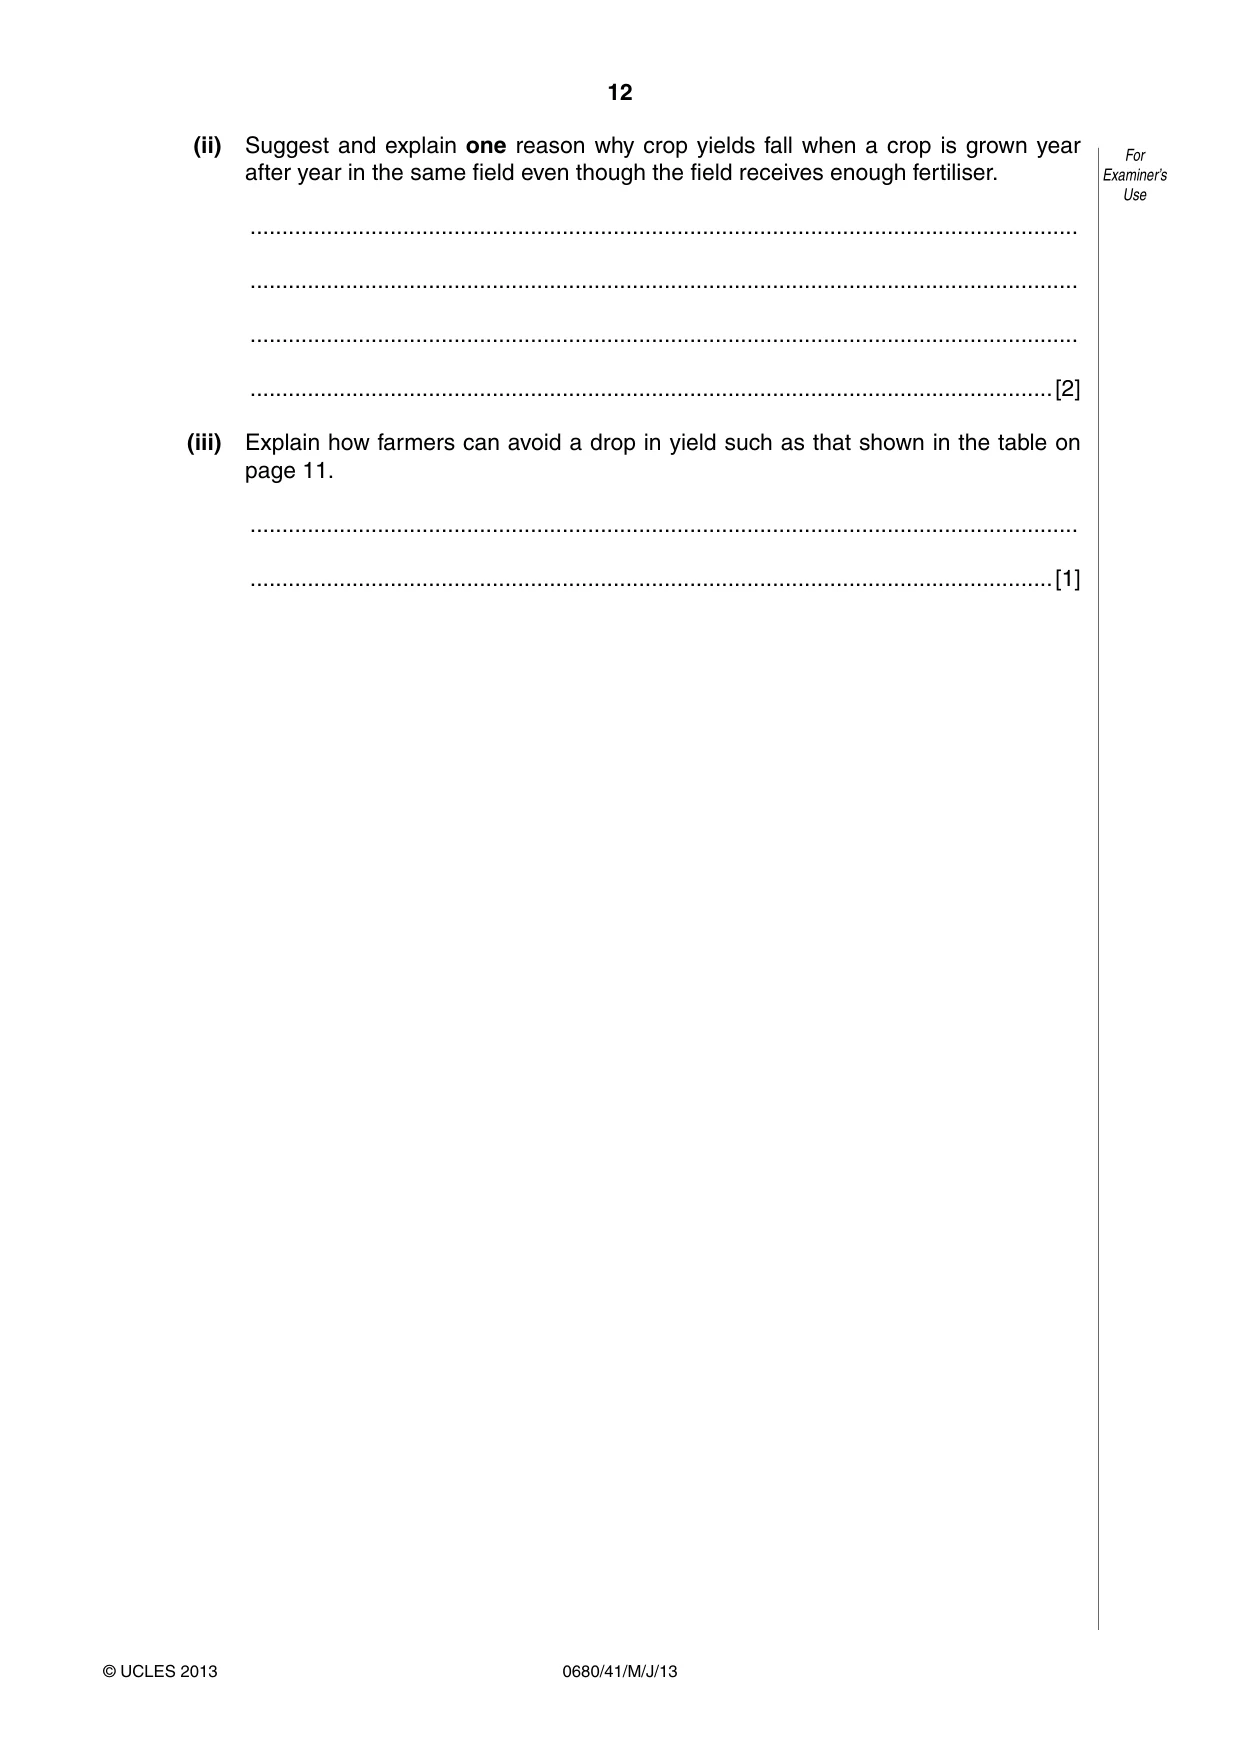
12 0680/41/M/J/13 © UCLES 2013 For Examiner’s Use (ii) Suggest and explain one reason why crop yields fall when a crop is grown year after year in the same field even though the field receives enough fertiliser. … … … …[2] (iii) Explain how farmers can avoid a drop in yield such as that shown in the table on page 11. … …[1]
Question paper, page 13
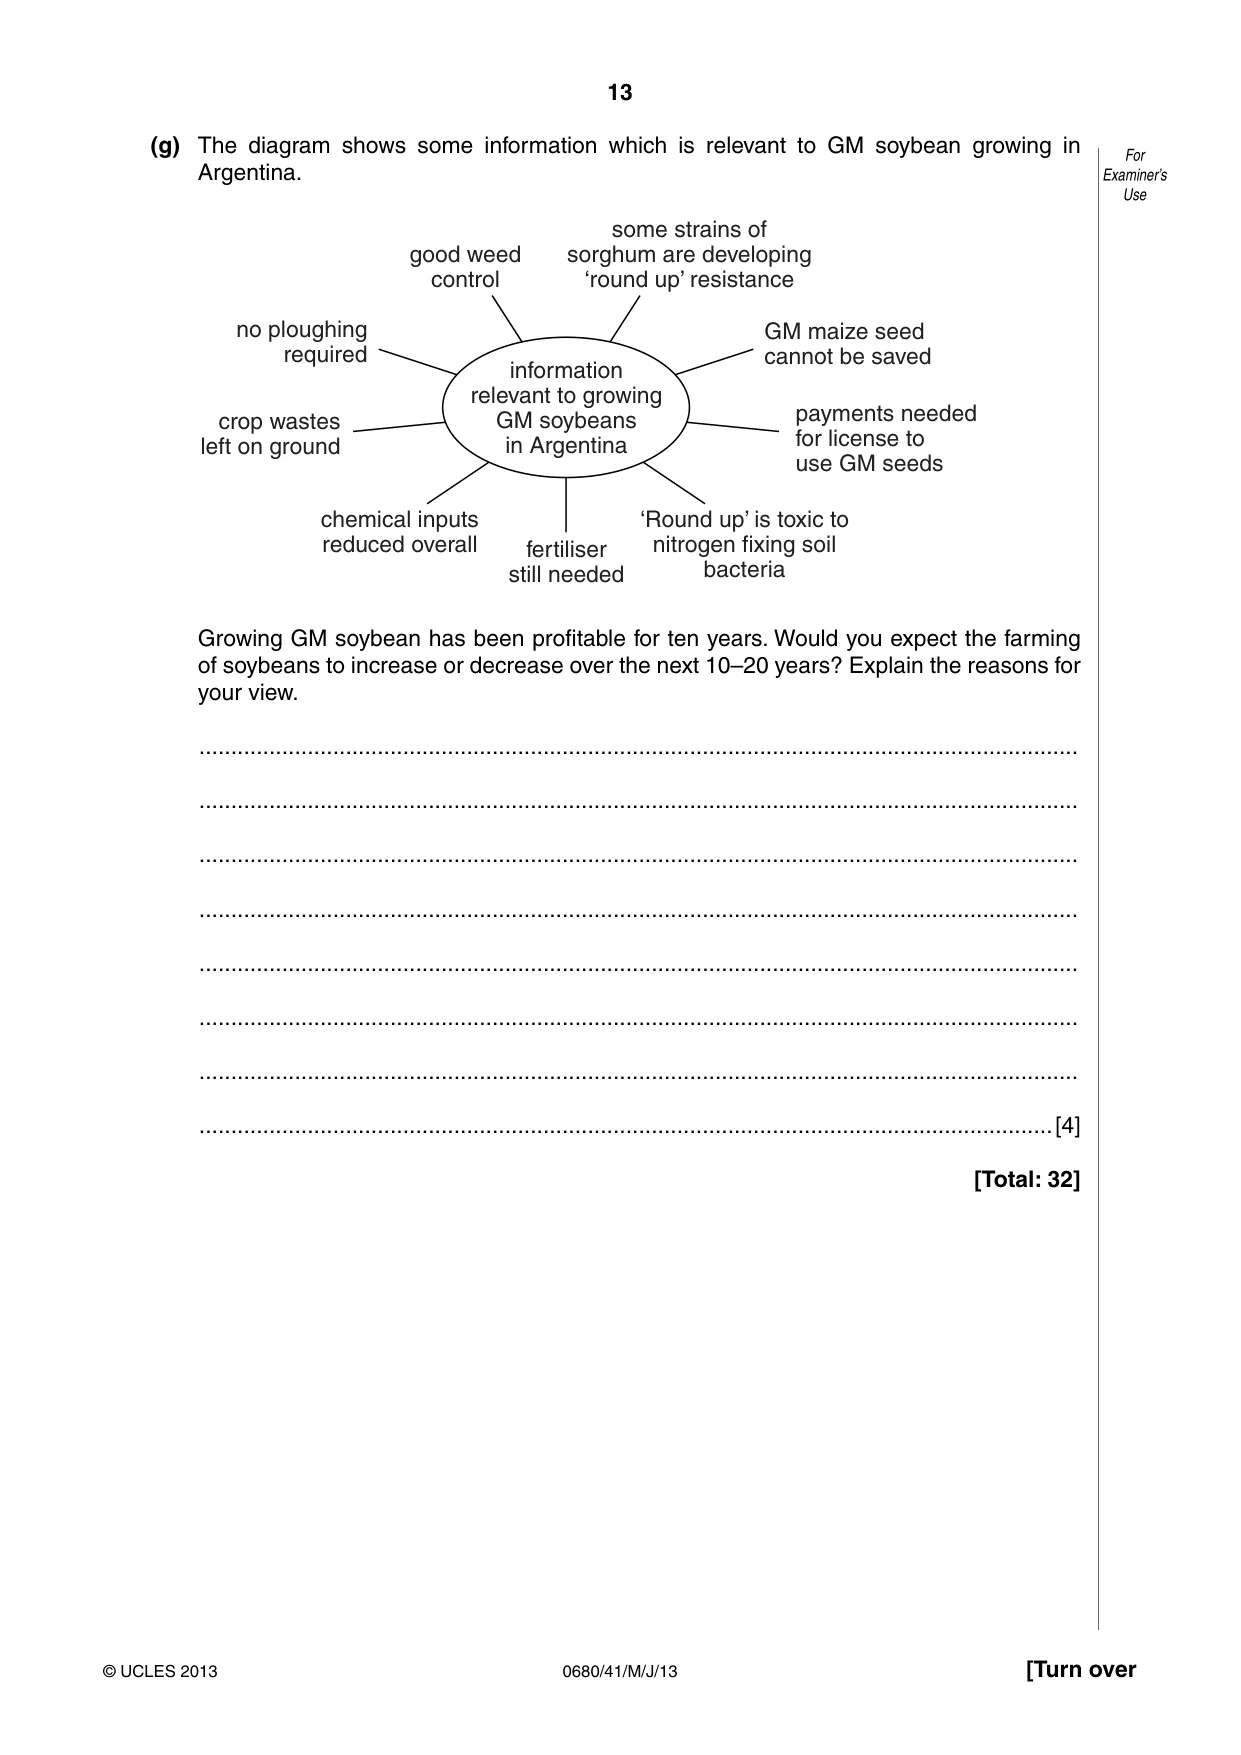
13 0680/41/M/J/13 © UCLES 2013 [Turn over For Examiner’s Use (g) The diagram shows some information which is relevant to GM soybean growing in Argentina. information relevant to growing GM soybeans in Argentina fertiliser still needed ‘Round up’ is toxic to nitrogen fixing soil bacteria GM maize seed cannot be saved no ploughing required good weed control some strains of sorghum are developing ‘round up’ resistance chemical inputs reduced overall crop wastes left on ground payments needed for license to use GM seeds Growing GM soybean has been profitable for ten years. Would you expect the farming of soybeans to increase or decrease over the next 10–20 years? Explain the reasons for your view. … … … … … … … …[4] [Total: 32]
Question paper, page 14
14 0680/41/M/J/13 © UCLES 2013 QUESTION 2 BEGINS ON PAGE 15
Question paper, page 15
15 0680/41/M/J/13 © UCLES 2013 [Turn over For Examiner’s Use 2 Some soybeans are processed into biodiesel. All diesel fuel used in vehicles in Argentina has to have 5% biodiesel and 95% diesel refined from crude oil. The vehicle engines do not need to be modified. The carbon emissions from ordinary diesel and biodiesel are similar. (a) Explain the advantages of using biodiesel. … … … …[2] (b) Buenos Aires has at least two million vehicles moving in the city at peak travel times. A student noticed that some cars were releasing black smoke from their exhaust systems. The student contacted the city authorities and found that 40% of cars are over ten years old. The student decided to carry out a survey of vehicles causing air pollution. The student used the following method. 1. He selected five observation points E, F, G, H and J, in different residential (housing areas) districts of the city 2. He observed all traffic from each point for 30 minutes 3. He recorded the number of cars releasing black smoke. 4. All traffic observations were done at the same time of day (9.00–9.30am) from Monday to Friday. The results are shown below Residential district Observation point E F G H J Number of vehicles releasing black smoke 12 18 52 25 23 (i) Calculate the average number of vehicles releasing black smoke. Space for working. …[2] (ii) Suggest reasons for the variation between residential districts. … … … …[2]
Question paper, page 16
16 0680/41/M/J/13 © UCLES 2013 For Examiner’s Use (iii) Suggest two ways the survey method could have been improved. 1 … … 2 … …[2] (c) The student decided to measure the amount of soot (carbon) particles released by vehicles in the same five districts E, F, G, H and J. The student used the following method. 1. Prepare 15 clear plastic boxes by covering the bottom with sticky jelly. 2. Immediately cover the box with a tightly fitting lid. 3. Place three boxes at each observation point, two metres above the ground. 4. Remove the lids for 24 hours. 5. Collect and seal the boxes. 6. Count the soot particles in each box. The results for October are shown below. For observation point J the boxes with the soot particles in are shown below the table. number of soot particles at each observation point in October sample E F G H J 1 11 6 7 14 … 2 8 10 9 11 … 3 8 8 5 14 … average number of soot particles 9 8 7 13 … Boxes for observation point J sample 1 sample 2 sample 3
Question paper, page 17
17 0680/41/M/J/13 © UCLES 2013 [Turn over For Examiner’s Use (i) Complete the table for observation point J. Space for working. Put your answer in the space in the table on page 16 [1] (ii) Suggest one piece of information the student should have included in their method so it could be repeated reliably. … …[1] (iii) Which district, E, F, G, H or J, does this method show is likely to be most polluted? …[1] (iv) The survey described in question 2(b) (page 15) found that district G was likely to be the most polluted. Suggest one possible explanation for the different findings of the two methods. … … … …[2] (d) The survey carried out in October was repeated six months later in April in the same five districts E, F, G, H and J. The results for April are shown below. Number of soot particles at each observation point in April E F G H J average number of particles 11 9 8 15 9 (i) The student compared these results with the results from the October survey. Suggest a conclusion. … …[1]
Question paper, page 18
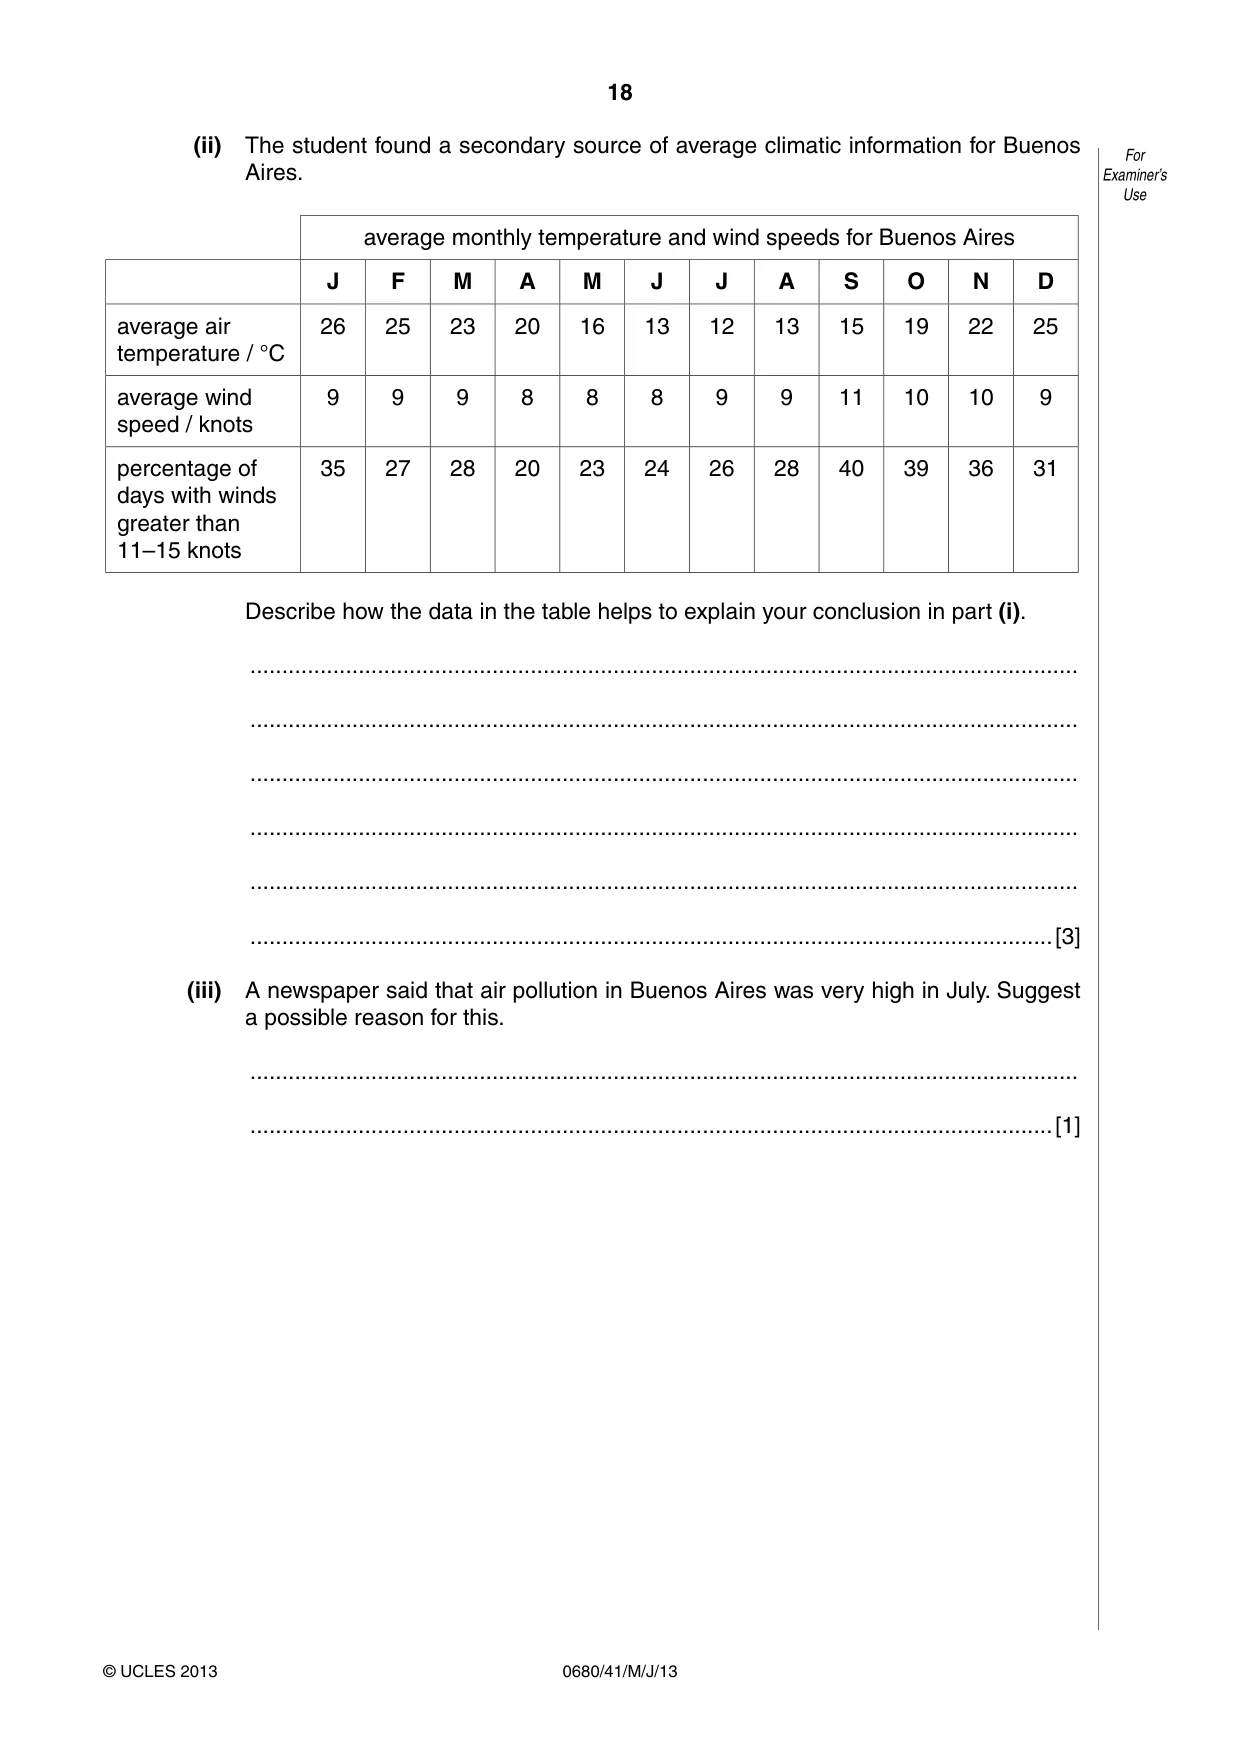
18 0680/41/M/J/13 © UCLES 2013 For Examiner’s Use (ii) The student found a secondary source of average climatic information for Buenos Aires. average monthly temperature and wind speeds for Buenos Aires J F M A M J J A S O N D average air temperature / °C 26 25 23 20 16 13 12 13 15 19 22 25 average wind speed / knots 9 9 9 8 8 8 9 9 11 10 10 9 percentage of days with winds greater than 11–15 knots 35 27 28 20 23 24 26 28 40 39 36 31 Describe how the data in the table helps to explain your conclusion in part (i). … … … … … …[3] (iii) A newspaper said that air pollution in Buenos Aires was very high in July. Suggest a possible reason for this. … …[1]
Question paper, page 19
19 0680/41/M/J/13 © UCLES 2013 [Turn over For Examiner’s Use (e) The same newspaper did a survey of farmers living in an area of La Pampa and of people living in Buenos Aires. The question asked was; Are you in favour of the use of biodiesel in vehicles in Argentina? percentage of people saying: yes no not sure People living in Buenos Aires 65 20 15 Farmers in La Pampa 90 5 5 (i) Suggest reasons for the differences between the views of city people and farmers. … … … …[2] (ii) The student wanted to find out more about people’s views and their knowledge of alternative renewable energy sources. The student started writing a questionnaire. 1. What age are you? … 2. Are you male or female? Male … Female … 3. Do you own a car? Yes … No … 4. 5. 6. Complete the questionnaire with three more questions designed to find out more people’s views and knowledge of other renewable energy sources. [4]
Question paper, page 20
20 0680/41/M/J/13 © UCLES 2013 (f) Investing in renewable sources of energy is often very expensive. What arguments would you use to persuade people living in Argentina that paying higher taxes to pay for investment in renewable sources is a good idea? … … … … … … … …[4] [Total: 28] Permission to reproduce items where third-party owned material protected by copyright is included has been sought and cleared where possible. Every reasonable effort has been made by the publisher (UCLES) to trace copyright holders, but if any items requiring clearance have unwittingly been included, the publisher will be pleased to make amends at the earliest possible opportunity. University of Cambridge International Examinations is part of the Cambridge Assessment Group. Cambridge Assessment is the brand name of University of Cambridge Local Examinations Syndicate (UCLES), which is itself a department of the University of Cambridge.
Mark scheme, page 1
CAMBRIDGE INTERNATIONAL EXAMINATIONS International General Certificate of Secondary Education MARK SCHEME for the May/June 2013 series 0680 ENVIRONMENTAL MANAGEMENT 0680/41 Paper 4 (Alternative to Coursework), maximum raw mark 60 This mark scheme is published as an aid to teachers and candidates, to indicate the requirements of the examination. It shows the basis on which Examiners were instructed to award marks. It does not indicate the details of the discussions that took place at an Examiners’ meeting before marking began, which would have considered the acceptability of alternative answers. Mark schemes should be read in conjunction with the question paper and the Principal Examiner Report for Teachers. Cambridge will not enter into discussions about these mark schemes. Cambridge is publishing the mark schemes for the May/June 2013 series for most IGCSE, GCE Advanced Level and Advanced Subsidiary Level components and some Ordinary Level components.
Mark scheme, page 2
Page 2 Mark Scheme Syllabus Paper IGCSE – May/June 2013 0680 41 © Cambridge International Examinations 2013 General notes Symbols used in Environmental Management mark schemes. / separates alternatives for a marking point – other valid ways of expressing the same idea are also credited ; separates points for the award of a mark [3] indicates the number of marks available [max 3] the number shows the maximum number of marks available for the question where there are more marking points than total marks available [max 3] when part of the marks of a question must come from part of the mark scheme, this is indicated by non-bold marks showing the internal maxima for different parts of the question these non-bold marks are also used to show marks for bands where banded mark schemes are used italic indicates that this is information about the marking points and is not required to gain credit italic text is also used for comments about alternatives that should be accepted, ignored or rejected ora or reverse argument – shows that an argument from an alternative viewpoint will be credited AW alternative wording, sometimes called ‘or words to that effect’ – AW is used when there are many different ways of expressing the same idea ( ) the word / phrase in brackets is not required to gain marks but sets the context of the response for credit e.g. (nuclear) waste – nuclear is not needed but if it was described as a domestic waste then no mark is awarded volcanic underlined words – the answer must contain exactly this word ecf error carried forward – if an incorrect answer is given to part of a question, and this answer is subsequently used by a candidate in later parts of the question, this indicates that the candidate’s incorrect answer will be used as a starting point for marking the later parts of the question
Mark scheme, page 3
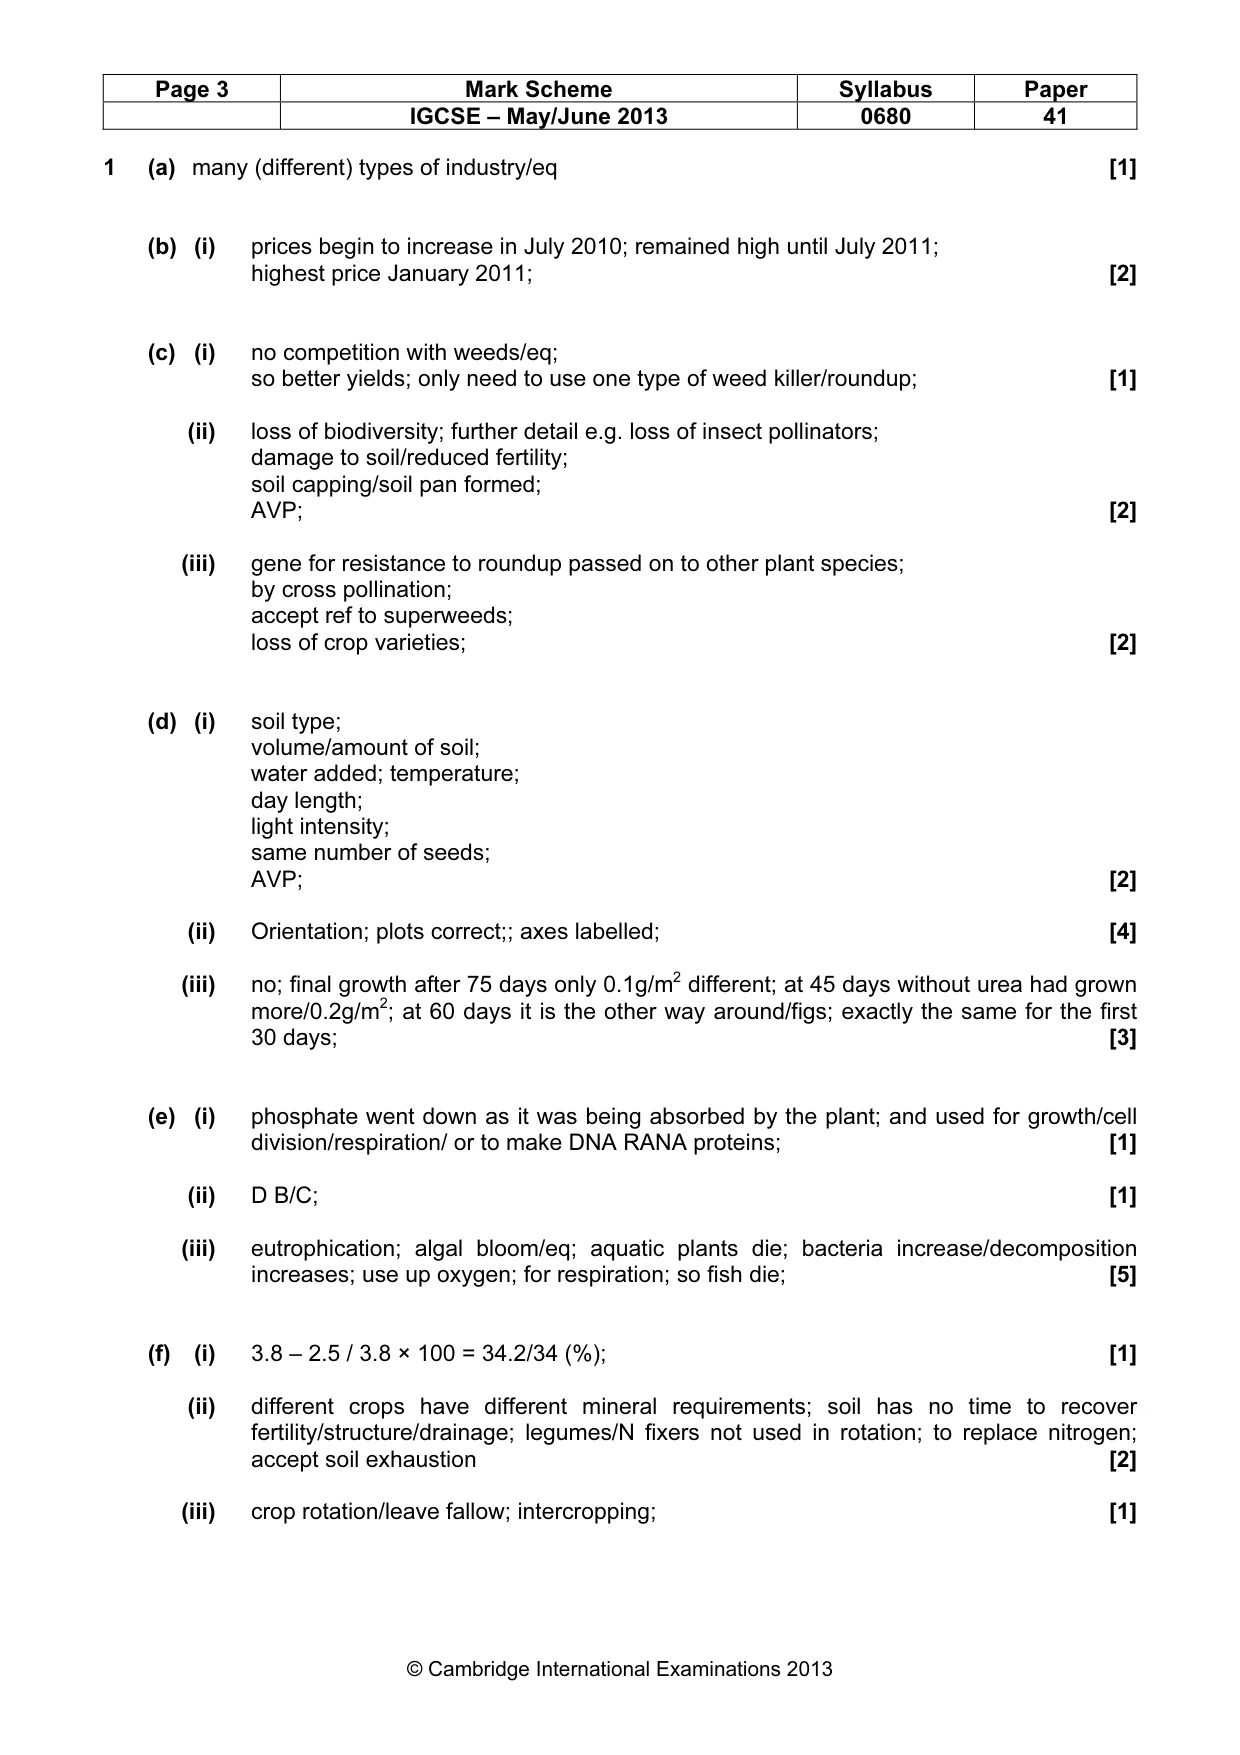
Page 3 Mark Scheme Syllabus Paper IGCSE – May/June 2013 0680 41 © Cambridge International Examinations 2013 1 (a) many (different) types of industry/eq [1] (b) (i) prices begin to increase in July 2010; remained high until July 2011; highest price January 2011; [2] (c) (i) no competition with weeds/eq; so better yields; only need to use one type of weed killer/roundup; [1] (ii) loss of biodiversity; further detail e.g. loss of insect pollinators; damage to soil/reduced fertility; soil capping/soil pan formed; AVP; [2] (iii) gene for resistance to roundup passed on to other plant species; by cross pollination; accept ref to superweeds; loss of crop varieties; [2] (d) (i) soil type; volume/amount of soil; water added; temperature; day length; light intensity; same number of seeds; AVP; [2] (ii) Orientation; plots correct;; axes labelled; [4] (iii) no; final growth after 75 days only 0.1g/m2 different; at 45 days without urea had grown more/0.2g/m2; at 60 days it is the other way around/figs; exactly the same for the first 30 days; [3] (e) (i) phosphate went down as it was being absorbed by the plant; and used for growth/cell division/respiration/ or to make DNA RANA proteins; [1] (ii) D B/C; [1] (iii) eutrophication; algal bloom/eq; aquatic plants die; bacteria increase/decomposition increases; use up oxygen; for respiration; so fish die; [5] (f) (i) 3.8 – 2.5 / 3.8 × 100 = 34.2/34 (%); [1] (ii) different crops have different mineral requirements; soil has no time to recover fertility/structure/drainage; legumes/N fixers not used in rotation; to replace nitrogen; accept soil exhaustion [2] (iii) crop rotation/leave fallow; intercropping; [1]
Mark scheme, page 4
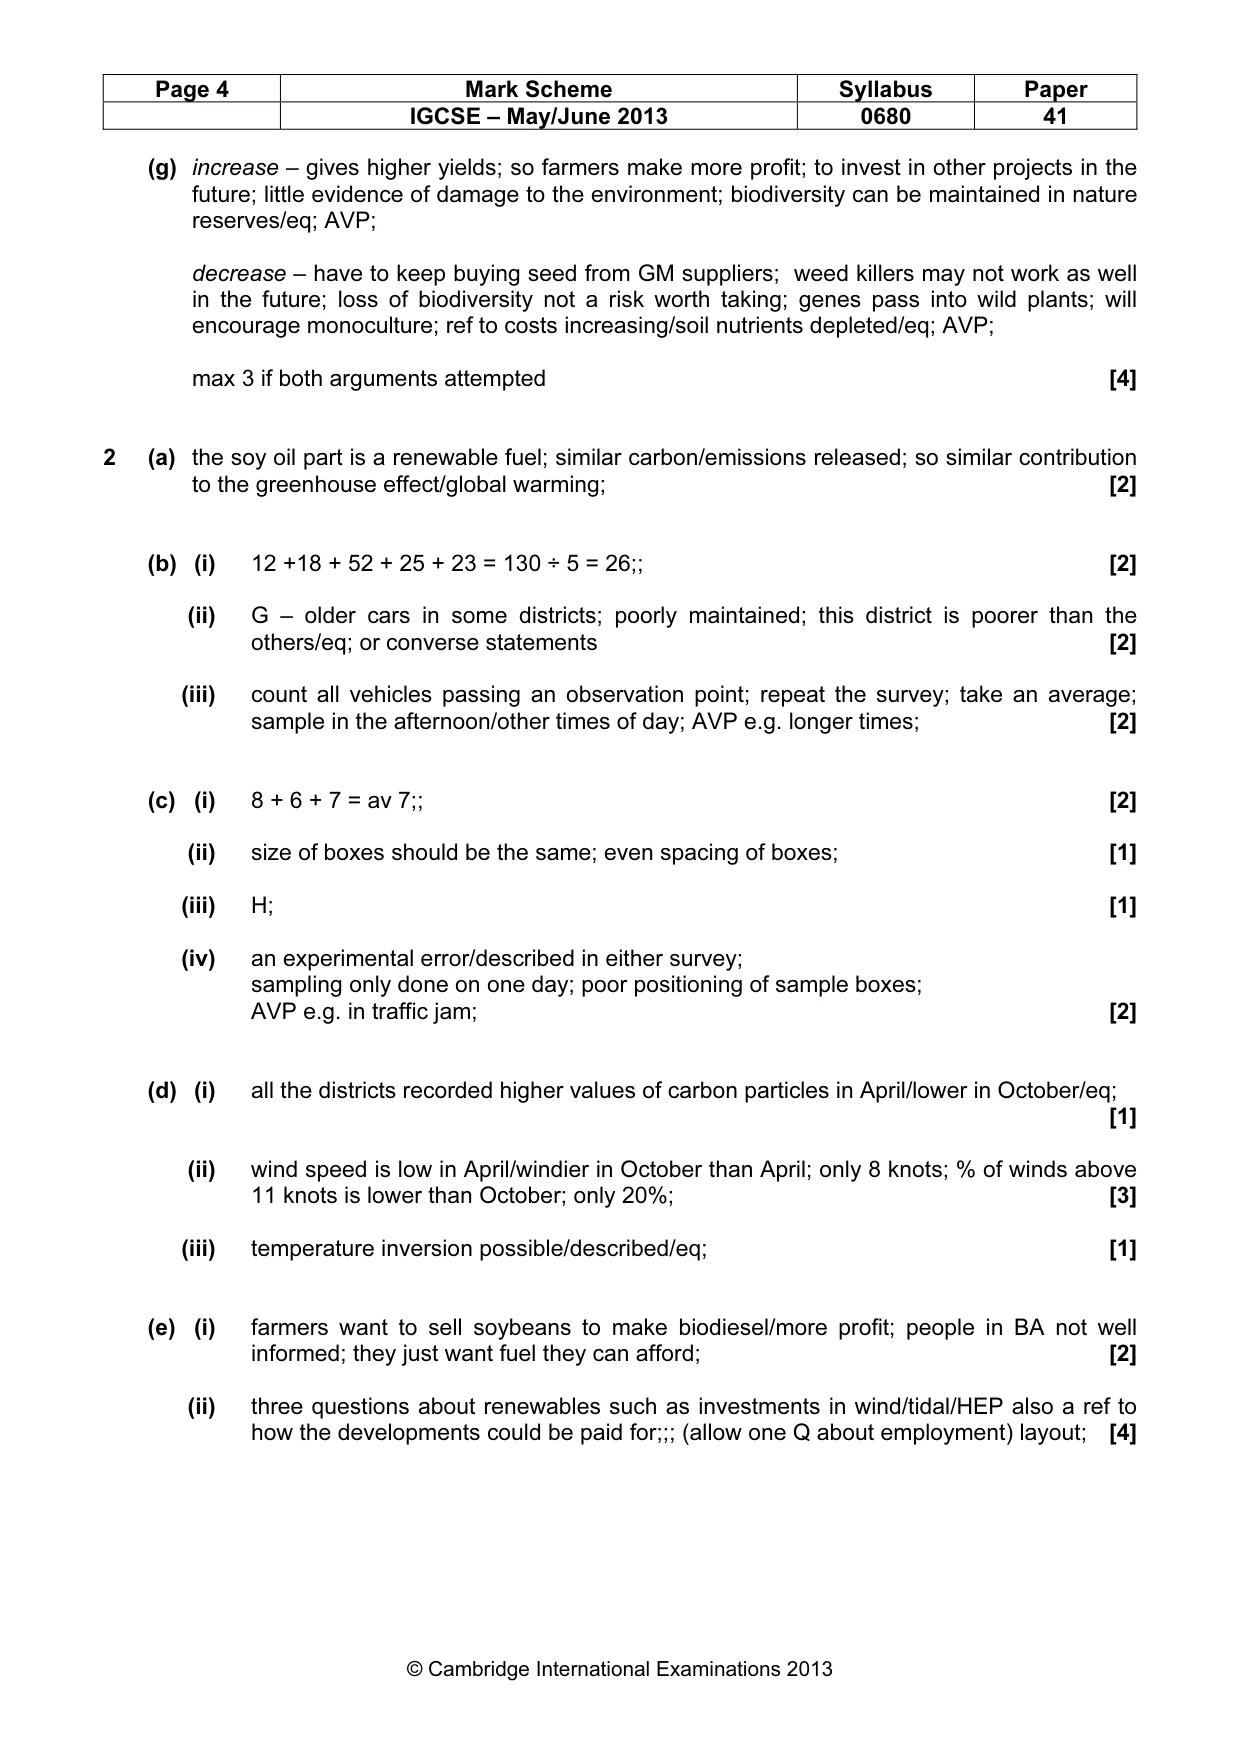
Page 4 Mark Scheme Syllabus Paper IGCSE – May/June 2013 0680 41 © Cambridge International Examinations 2013 (g) increase – gives higher yields; so farmers make more profit; to invest in other projects in the future; little evidence of damage to the environment; biodiversity can be maintained in nature reserves/eq; AVP; decrease – have to keep buying seed from GM suppliers; weed killers may not work as well in the future; loss of biodiversity not a risk worth taking; genes pass into wild plants; will encourage monoculture; ref to costs increasing/soil nutrients depleted/eq; AVP; max 3 if both arguments attempted [4] 2 (a) the soy oil part is a renewable fuel; similar carbon/emissions released; so similar contribution to the greenhouse effect/global warming; [2] (b) (i) 12 +18 + 52 + 25 + 23 = 130 ÷ 5 = 26;; [2] (ii) G – older cars in some districts; poorly maintained; this district is poorer than the others/eq; or converse statements [2] (iii) count all vehicles passing an observation point; repeat the survey; take an average; sample in the afternoon/other times of day; AVP e.g. longer times; [2] (c) (i) 8 + 6 + 7 = av 7;; [2] (ii) size of boxes should be the same; even spacing of boxes; [1] (iii) H; [1] (iv) an experimental error/described in either survey; sampling only done on one day; poor positioning of sample boxes; AVP e.g. in traffic jam; [2] (d) (i) all the districts recorded higher values of carbon particles in April/lower in October/eq; [1] (ii) wind speed is low in April/windier in October than April; only 8 knots; % of winds above 11 knots is lower than October; only 20%; [3] (iii) temperature inversion possible/described/eq; [1] (e) (i) farmers want to sell soybeans to make biodiesel/more profit; people in BA not well informed; they just want fuel they can afford; [2] (ii) three questions about renewables such as investments in wind/tidal/HEP also a ref to how the developments could be paid for;;; (allow one Q about employment) layout; [4]
Mark scheme, page 5
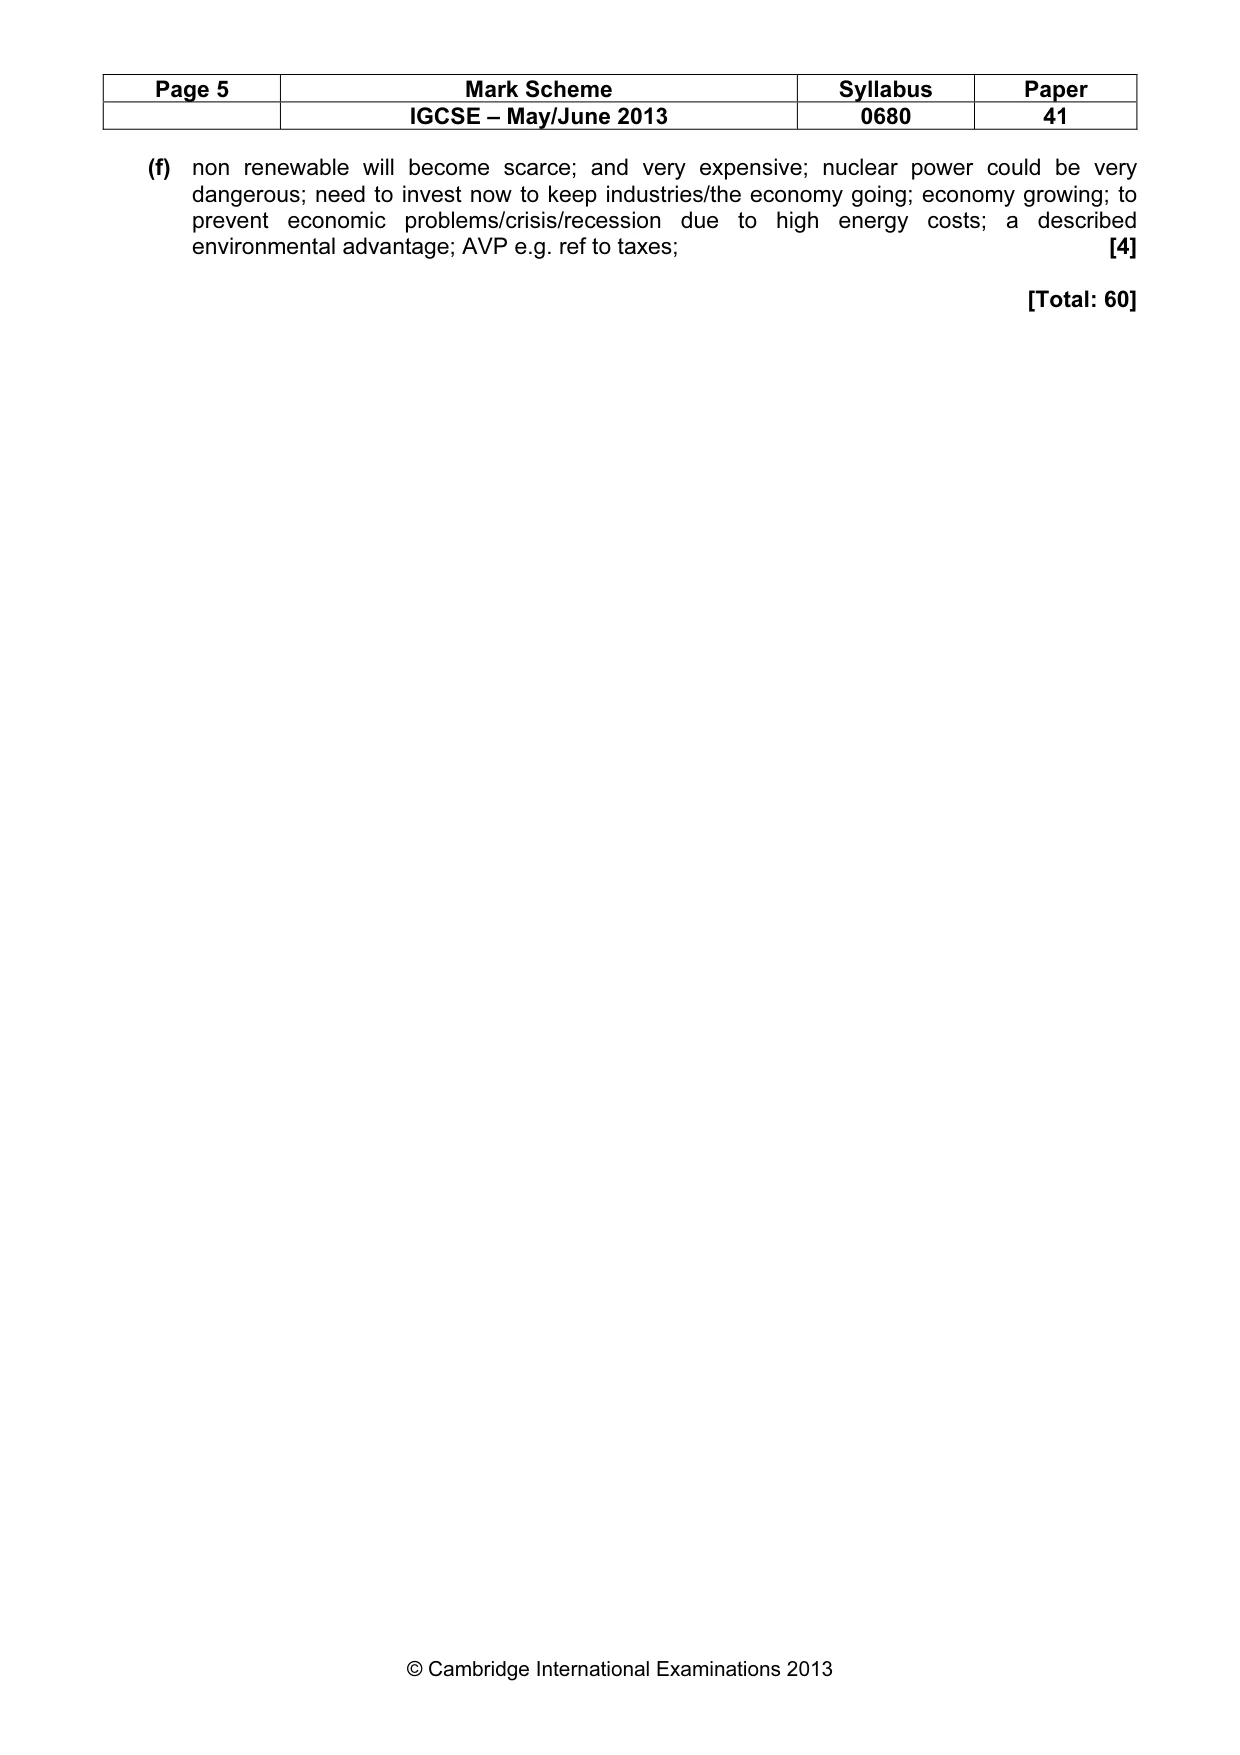
Page 5 Mark Scheme Syllabus Paper IGCSE – May/June 2013 0680 41 © Cambridge International Examinations 2013 (f) non renewable will become scarce; and very expensive; nuclear power could be very dangerous; need to invest now to keep industries/the economy going; economy growing; to prevent economic problems/crisis/recession due to high energy costs; a described environmental advantage; AVP e.g. ref to taxes; [4] [Total: 60]
What you needed in this session
Cambridge’s own grade thresholds for 2013 May/June, Paper 4 · Variant 1. A higher threshold means an easier paper — the bar moves with how the cohort did.