Cambridge IGCSE Environmental Management 0680 — 2013 May/June Paper 4 · Variant 2
0680/42/M/J/13 · 60 marks · ≈68 min
The question paper and its mark scheme, free to read here and free to download. This is Cambridge’s own paper, exactly as it was sat.
Question paper16 pages

Mark scheme5 pages
Answers below. Sit the paper first if you are practising.
Paper as text
Question paper, page 1
This document consists of 15 printed pages and 1 blank page. DC (NF/JG) 65395/4 © UCLES 2013 [Turn over UNIVERSITY OF CAMBRIDGE INTERNATIONAL EXAMINATIONS International General Certificate of Secondary Education * 8 9 4 6 1 1 8 7 4 2 * ENVIRONMENTAL MANAGEMENT 0680/42 Alternative to Coursework May/June 2013 1 hour 30 minutes Candidates answer on the Question Paper. Additional Materials: Ruler READ THESE INSTRUCTIONS FIRST Write your Centre number, candidate number and name on all the work you hand in. Write in dark blue or black pen. You may use a soft pencil for any diagrams, graphs or rough working. Do not use staples, paper clips, highlighters, glue or correction fluid. DO NOT WRITE IN ANY BARCODES. Electronic calculators may be used. Answer all questions. Study the appropriate Source materials before you start to write your answers. Credit will be given for appropriate selection and use of data in your answers and for relevant interpretation of these data. Suggestions for data sources are given in some questions. You may use the source data to draw diagrams and graphs or to do calculations to illustrate your answers. At the end of the examination, fasten all your work securely together. The number of marks is given in brackets [ ] at the end of each question or part question. For Examiner’s Use 1 2 Total
Question paper, page 2
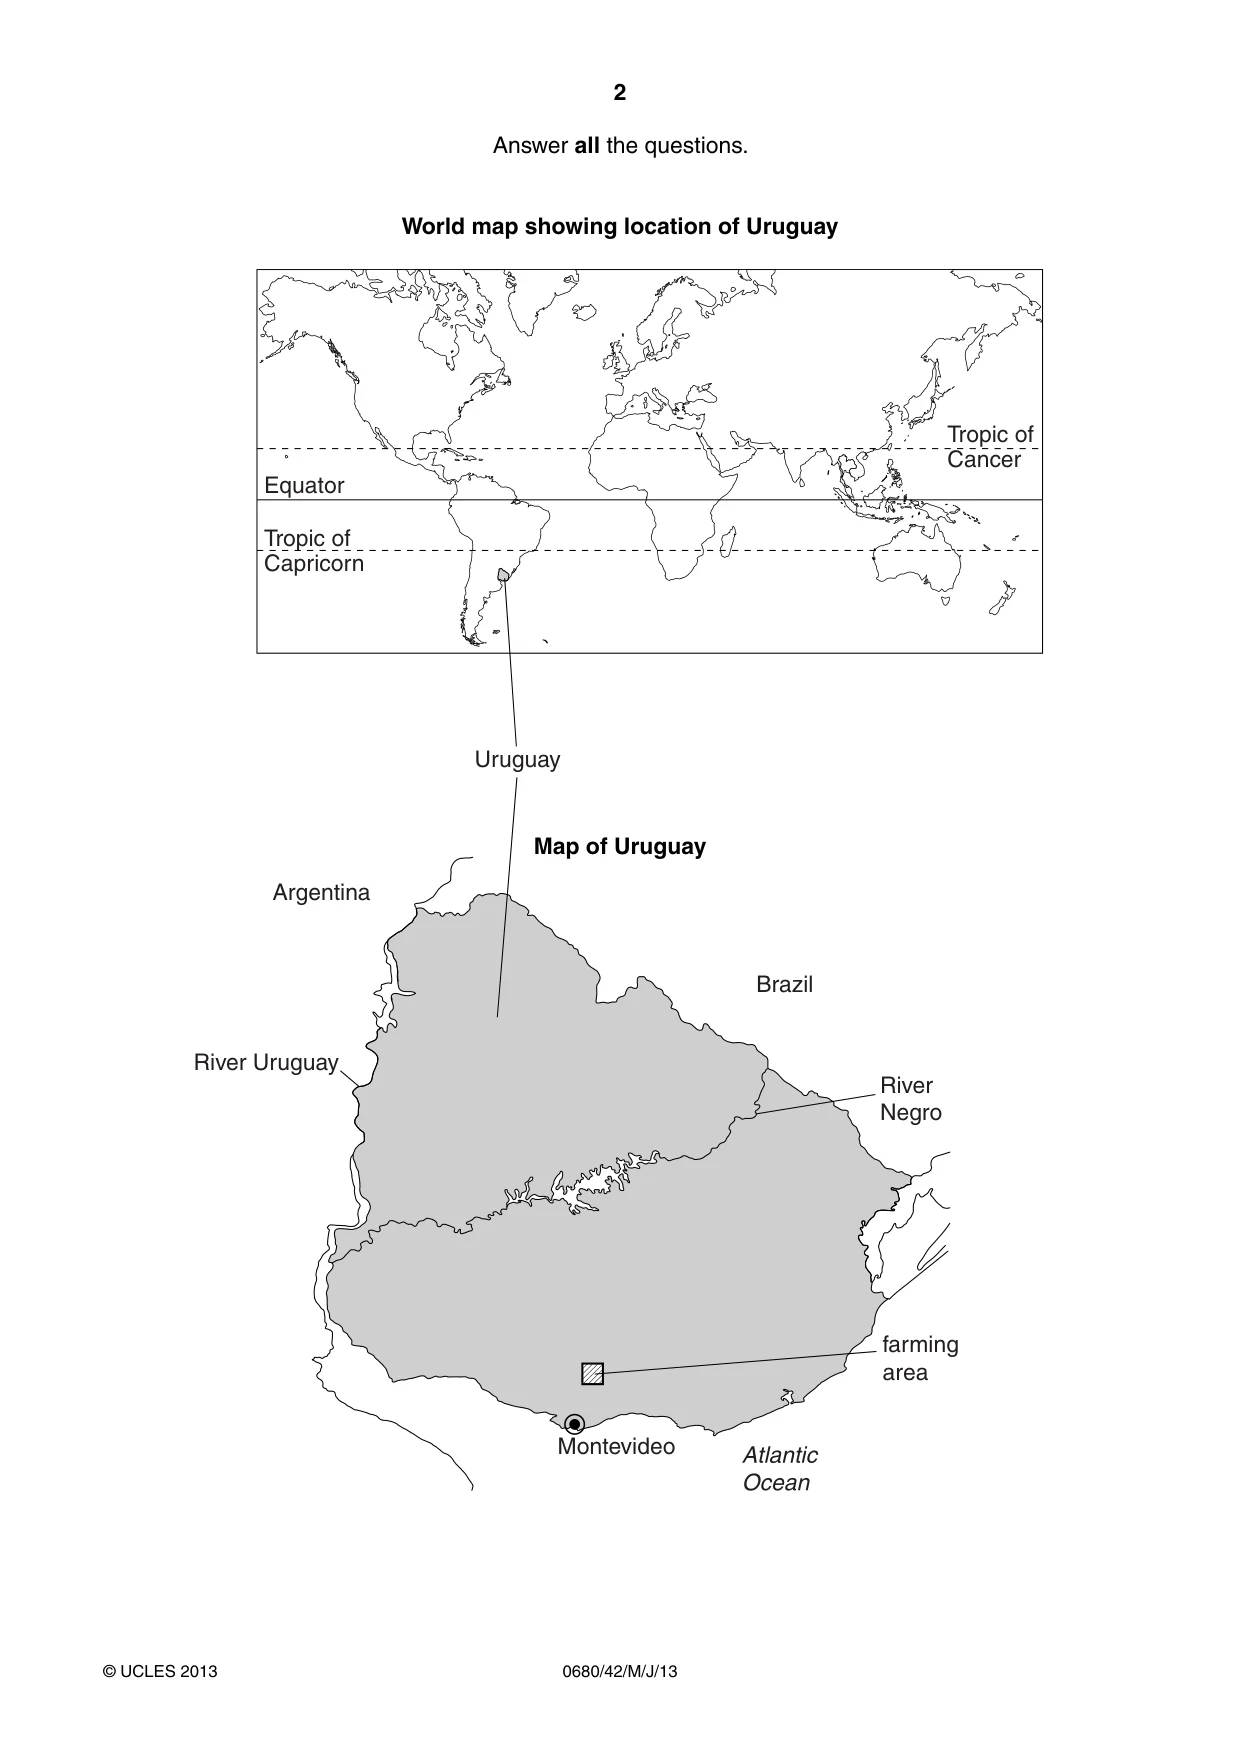
2 0680/42/M/J/13 © UCLES 2013 Answer all the questions. World map showing location of Uruguay Equator Tropic of Cancer Tropic of Capricorn Brazil Argentina River Uruguay Montevideo farming area River Negro Atlantic Ocean Uruguay Map of Uruguay
Question paper, page 3
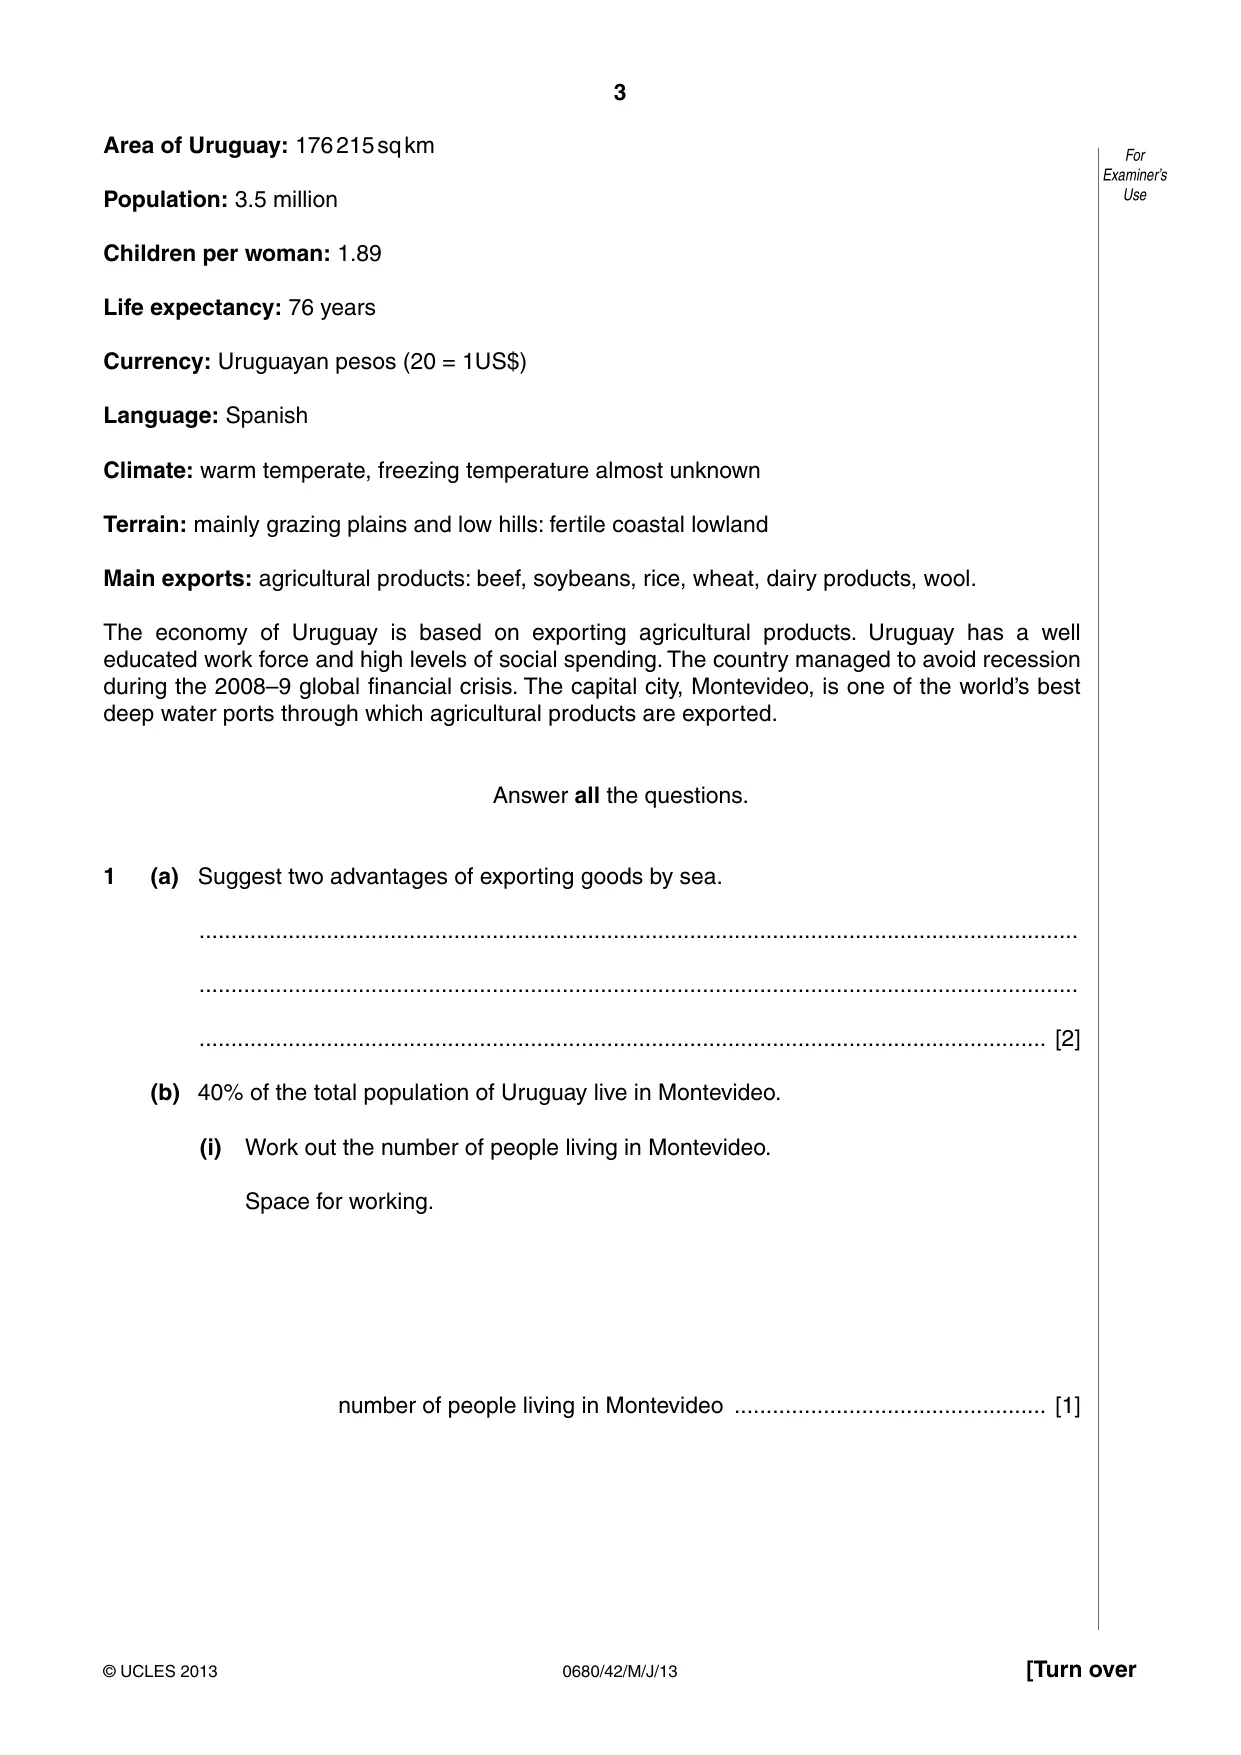
3 0680/42/M/J/13 © UCLES 2013 [Turn over For Examiner’s Use Area of Uruguay: 176 215 sq km Population: 3.5 million Children per woman: 1.89 Life expectancy: 76 years Currency: Uruguayan pesos (20 = 1US$) Language: Spanish Climate: warm temperate, freezing temperature almost unknown Terrain: mainly grazing plains and low hills: fertile coastal lowland Main exports: agricultural products: beef, soybeans, rice, wheat, dairy products, wool. The economy of Uruguay is based on exporting agricultural products. Uruguay has a well educated work force and high levels of social spending. The country managed to avoid recession during the 2008–9 global financial crisis. The capital city, Montevideo, is one of the world’s best deep water ports through which agricultural products are exported. Answer all the questions. 1 (a) Suggest two advantages of exporting goods by sea. … … … [2] (b) 40% of the total population of Uruguay live in Montevideo. (i) Work out the number of people living in Montevideo. Space for working. number of people living in Montevideo … [1]
Question paper, page 4
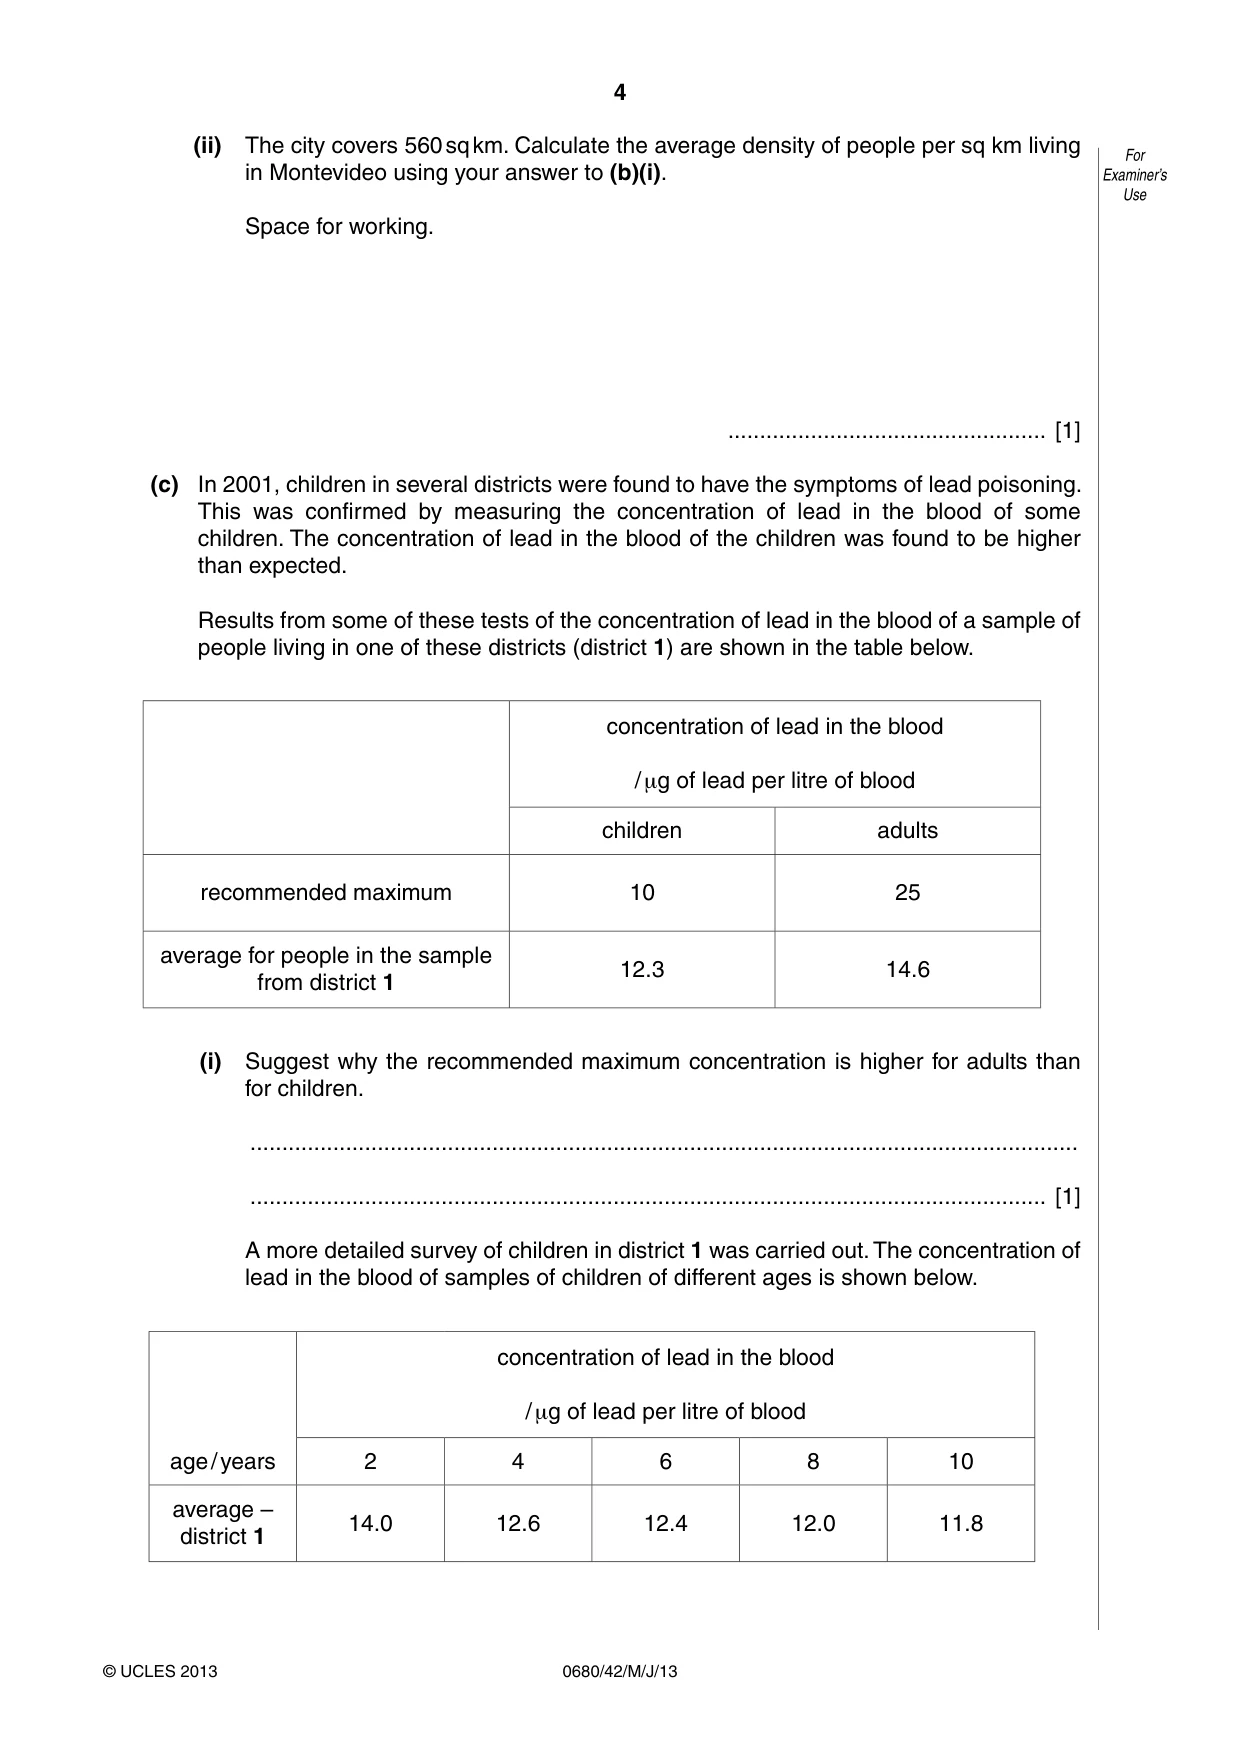
4 0680/42/M/J/13 © UCLES 2013 For Examiner’s Use (ii) The city covers 560 sq km. Calculate the average density of people per sq km living in Montevideo using your answer to (b)(i). Space for working. … [1] (c) In 2001, children in several districts were found to have the symptoms of lead poisoning. This was confirmed by measuring the concentration of lead in the blood of some children. The concentration of lead in the blood of the children was found to be higher than expected. Results from some of these tests of the concentration of lead in the blood of a sample of people living in one of these districts (district 1) are shown in the table below. concentration of lead in the blood / μg of lead per litre of blood children adults recommended maximum 10 25 average for people in the sample from district 1 12.3 14.6 (i) Suggest why the recommended maximum concentration is higher for adults than for children. … … [1] A more detailed survey of children in district 1 was carried out. The concentration of lead in the blood of samples of children of different ages is shown below. concentration of lead in the blood / μg of lead per litre of blood age / years 2 4 6 8 10 average – district 1 14.0 12.6 12.4 12.0 11.8
Question paper, page 5
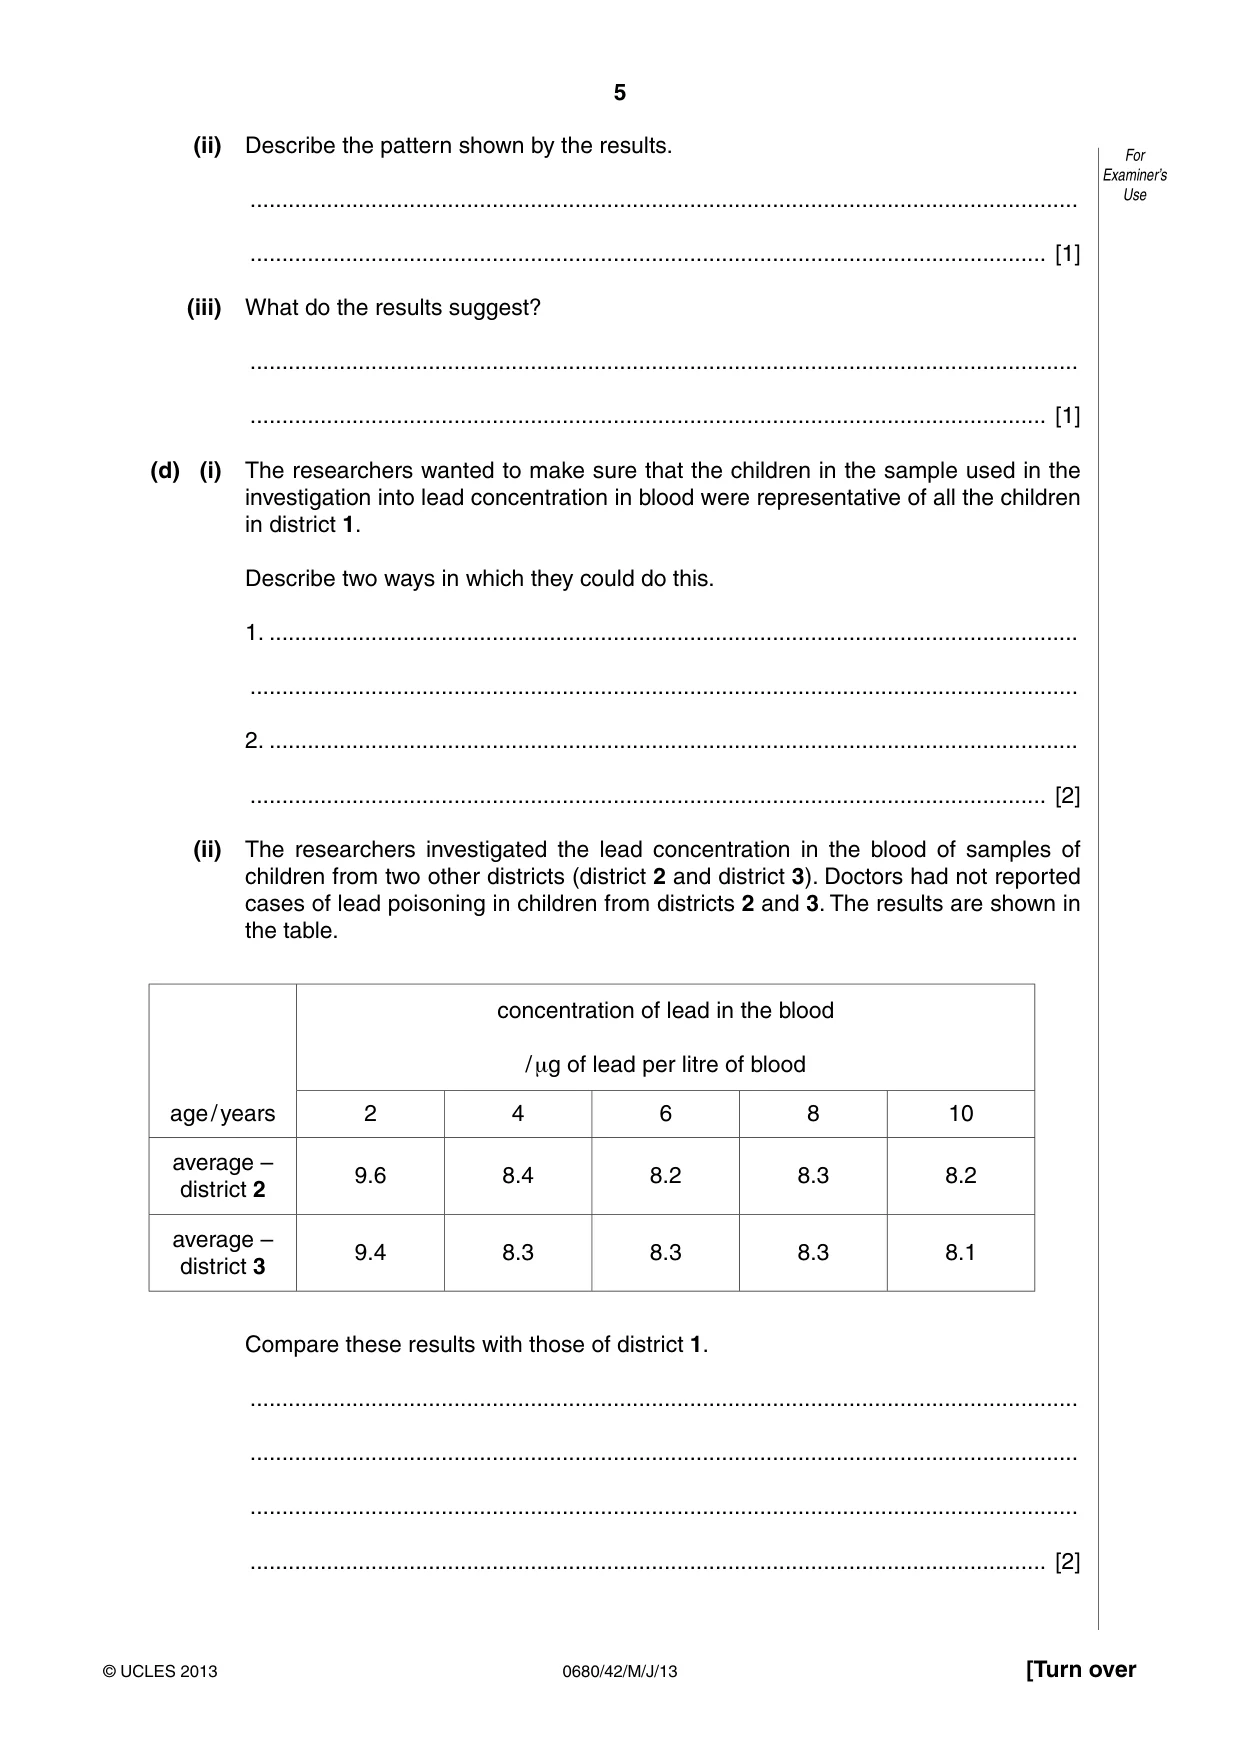
5 0680/42/M/J/13 © UCLES 2013 [Turn over For Examiner’s Use (ii) Describe the pattern shown by the results. … … [1] (iii) What do the results suggest? … … [1] (d) (i) The researchers wanted to make sure that the children in the sample used in the investigation into lead concentration in blood were representative of all the children in district 1. Describe two ways in which they could do this. 1. … … 2. … … [2] (ii) The researchers investigated the lead concentration in the blood of samples of children from two other districts (district 2 and district 3). Doctors had not reported cases of lead poisoning in children from districts 2 and 3. The results are shown in the table. concentration of lead in the blood / μg of lead per litre of blood age / years 2 4 6 8 10 average – district 2 9.6 8.4 8.2 8.3 8.2 average – district 3 9.4 8.3 8.3 8.3 8.1 Compare these results with those of district 1. … … … … [2]
Question paper, page 6
6 0680/42/M/J/13 © UCLES 2013 For Examiner’s Use (iii) The researchers investigated possible sources of lead contamination in Montevideo. In 2001, the following main sources were identified: • small-scale industries using and recycling lead or materials containing lead • emissions from car exhausts • people living on former landfill or industrial sites • careless disposal of wastes containing lead • lead water pipes The city authorities took actions after 2001 which successfully reduced the release of lead contamination into the environment. Suggest and explain what actions the city authorities might have taken to reduce the problem of lead contamination. … … … … … … … … [3]
Question paper, page 7
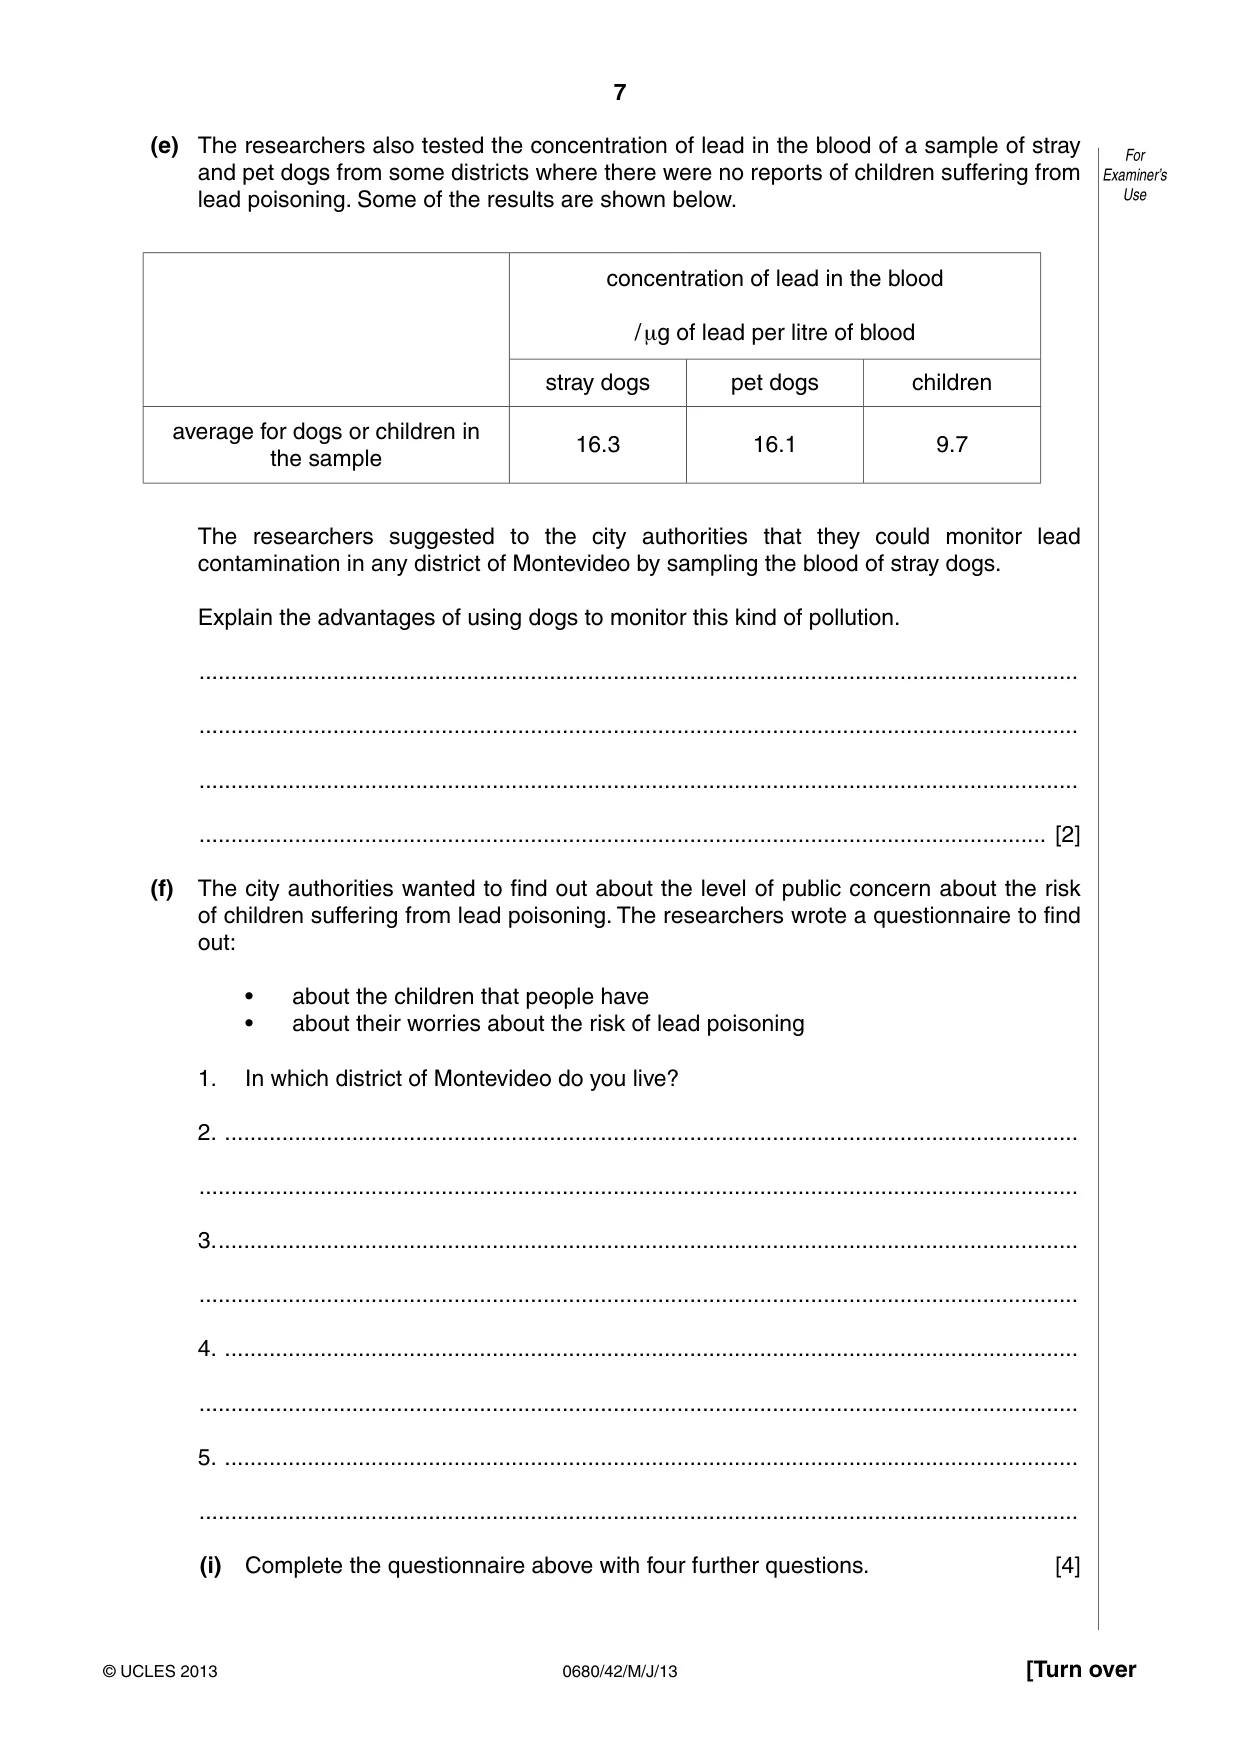
7 0680/42/M/J/13 © UCLES 2013 [Turn over For Examiner’s Use (e) The researchers also tested the concentration of lead in the blood of a sample of stray and pet dogs from some districts where there were no reports of children suffering from lead poisoning. Some of the results are shown below. concentration of lead in the blood / μg of lead per litre of blood stray dogs pet dogs children average for dogs or children in the sample 16.3 16.1 9.7 The researchers suggested to the city authorities that they could monitor lead contamination in any district of Montevideo by sampling the blood of stray dogs. Explain the advantages of using dogs to monitor this kind of pollution. … … … … [2] (f) The city authorities wanted to find out about the level of public concern about the risk of children suffering from lead poisoning. The researchers wrote a questionnaire to find out: • about the children that people have • about their worries about the risk of lead poisoning 1. In which district of Montevideo do you live? 2. … … 3. … … 4. … … 5. … … (i) Complete the questionnaire above with four further questions. [4]
Question paper, page 8
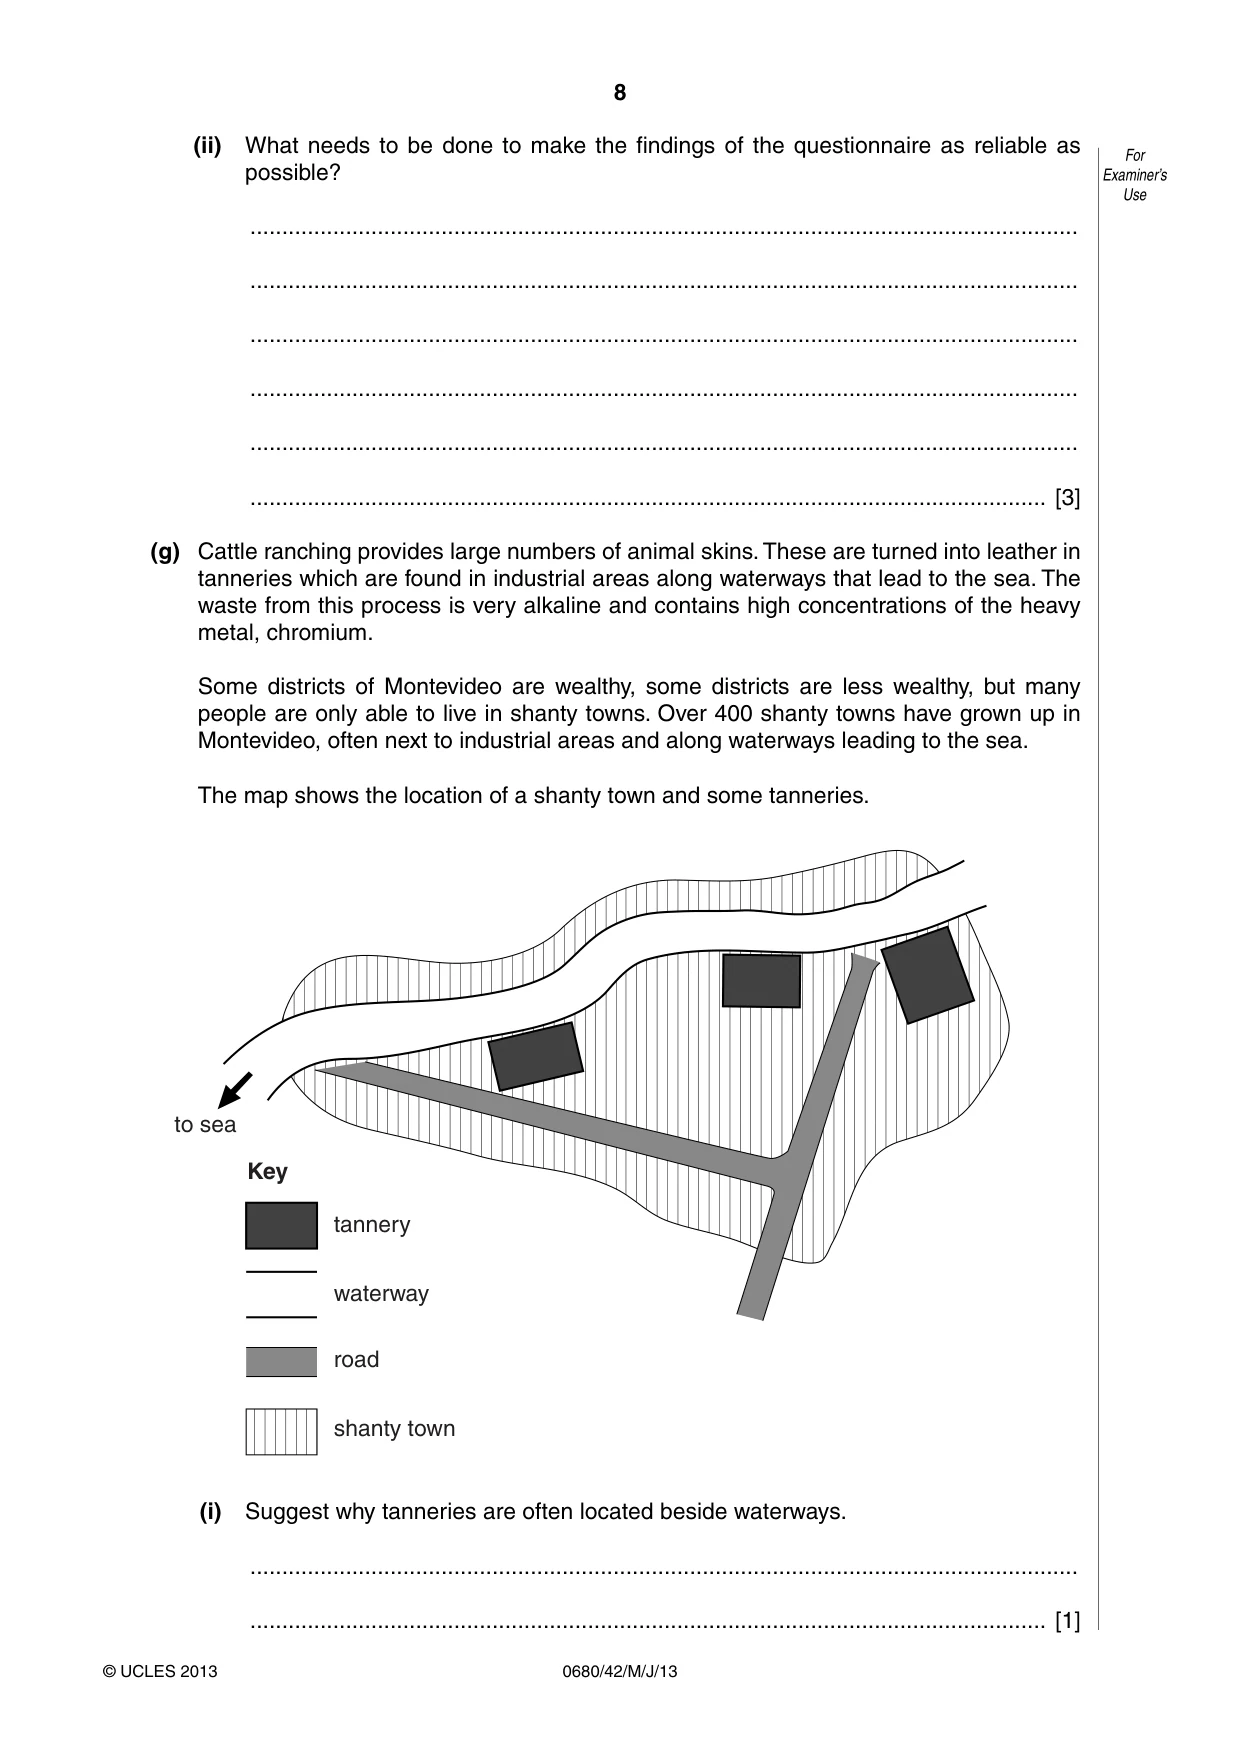
8 0680/42/M/J/13 © UCLES 2013 For Examiner’s Use (ii) What needs to be done to make the findings of the questionnaire as reliable as possible? … … … … … … [3] (g) Cattle ranching provides large numbers of animal skins. These are turned into leather in tanneries which are found in industrial areas along waterways that lead to the sea. The waste from this process is very alkaline and contains high concentrations of the heavy metal, chromium. Some districts of Montevideo are wealthy, some districts are less wealthy, but many people are only able to live in shanty towns. Over 400 shanty towns have grown up in Montevideo, often next to industrial areas and along waterways leading to the sea. The map shows the location of a shanty town and some tanneries. tannery to sea waterway road shanty town Key (i) Suggest why tanneries are often located beside waterways. … … [1]
Question paper, page 9
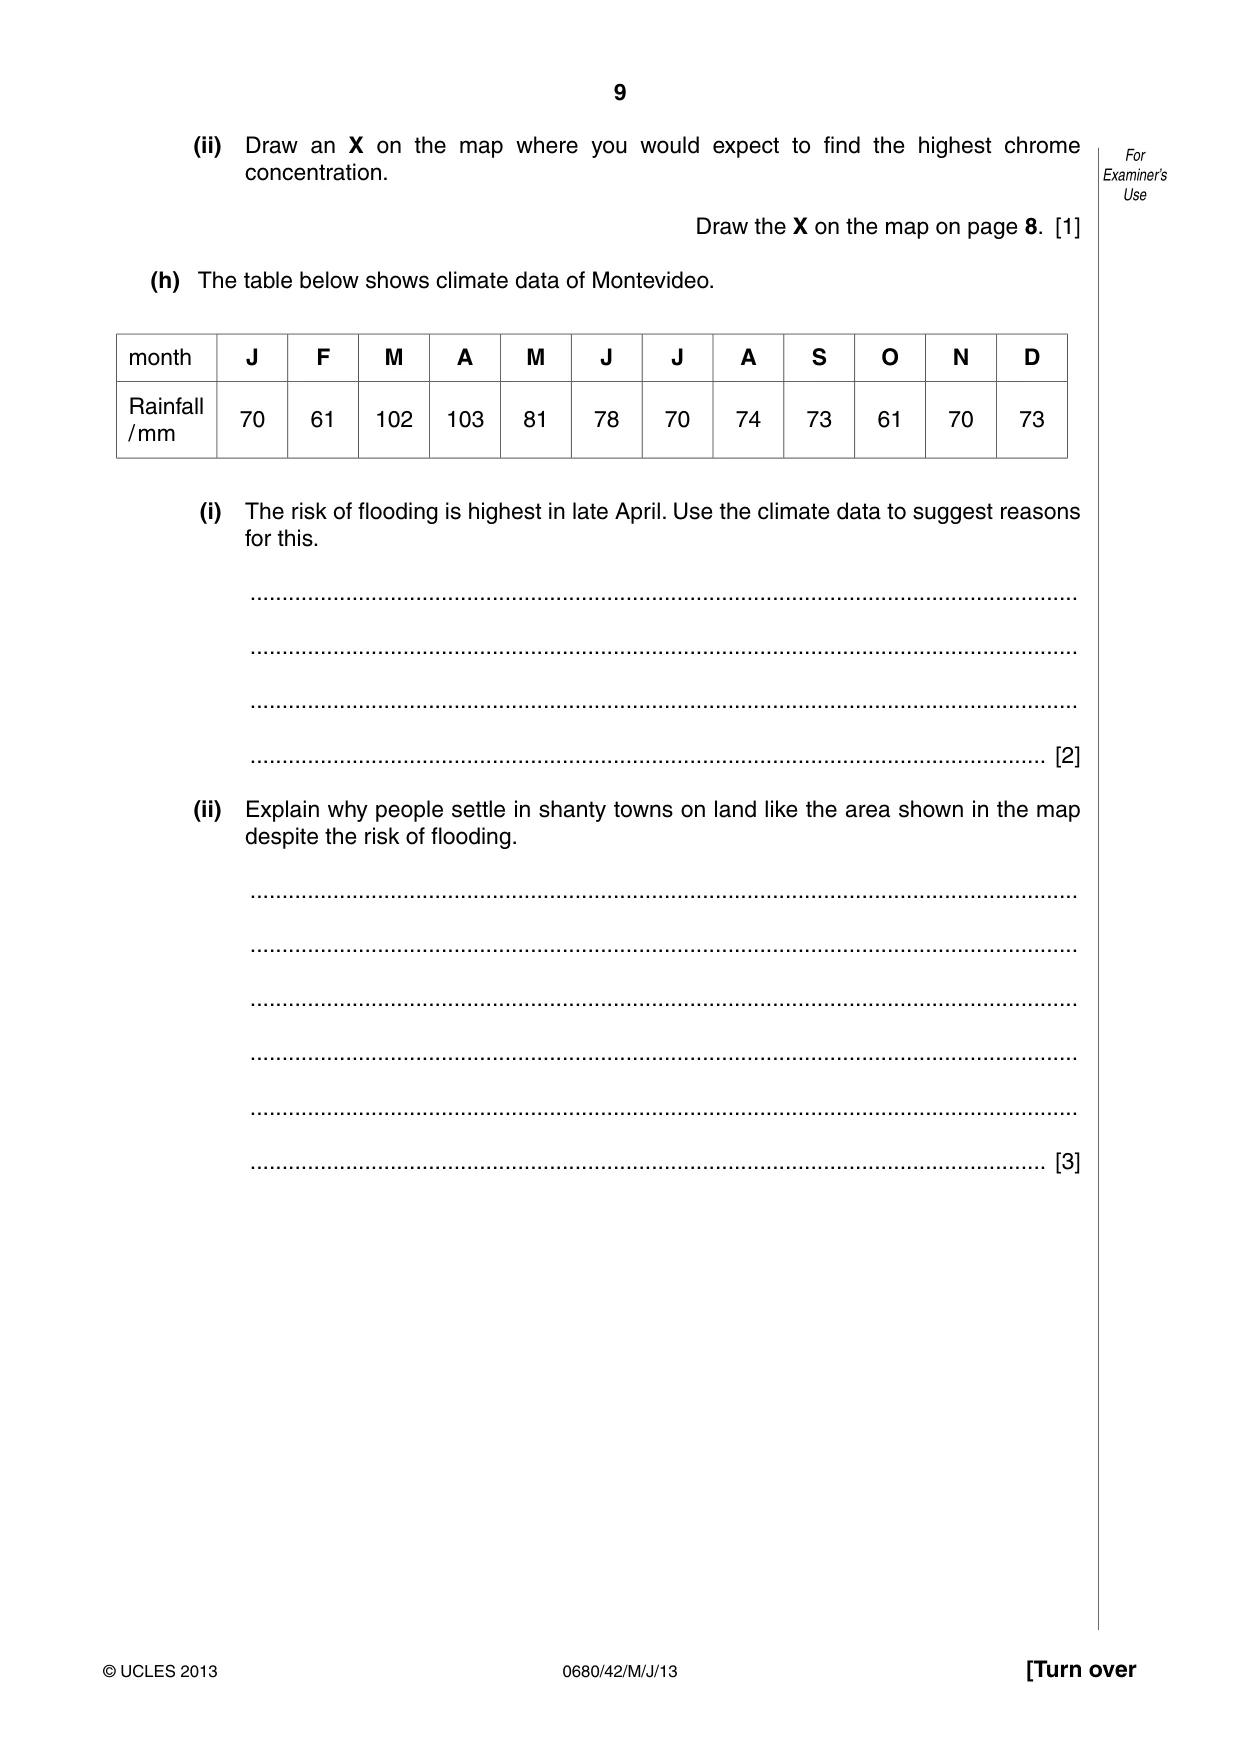
9 0680/42/M/J/13 © UCLES 2013 [Turn over For Examiner’s Use (ii) Draw an X on the map where you would expect to find the highest chrome concentration. Draw the X on the map on page 8. [1] (h) The table below shows climate data of Montevideo. month J F M A M J J A S O N D Rainfall / mm 70 61 102 103 81 78 70 74 73 61 70 73 (i) The risk of flooding is highest in late April. Use the climate data to suggest reasons for this. … … … … [2] (ii) Explain why people settle in shanty towns on land like the area shown in the map despite the risk of flooding. … … … … … … [3]
Question paper, page 10
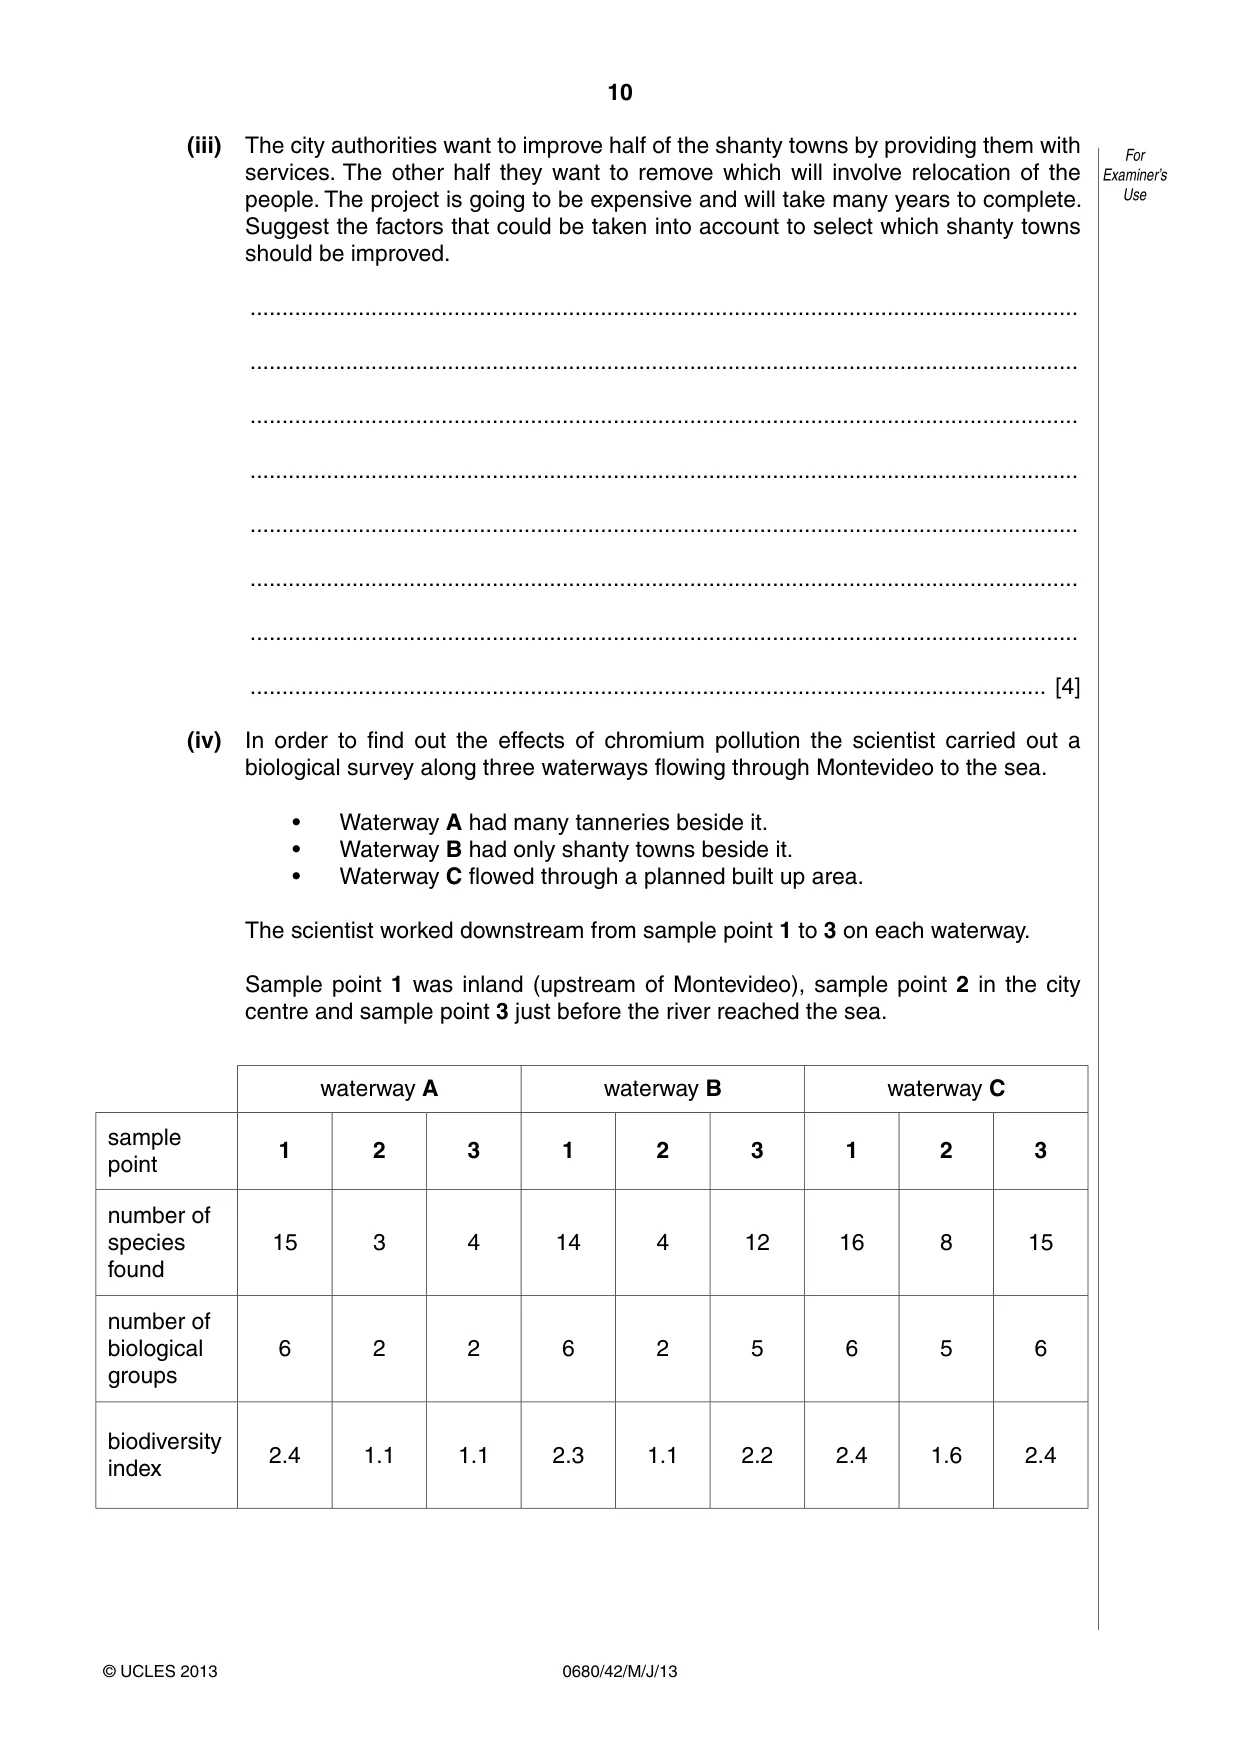
10 0680/42/M/J/13 © UCLES 2013 For Examiner’s Use (iii) The city authorities want to improve half of the shanty towns by providing them with services. The other half they want to remove which will involve relocation of the people. The project is going to be expensive and will take many years to complete. Suggest the factors that could be taken into account to select which shanty towns should be improved. … … … … … … … … [4] (iv) In order to find out the effects of chromium pollution the scientist carried out a biological survey along three waterways flowing through Montevideo to the sea. • Waterway A had many tanneries beside it. • Waterway B had only shanty towns beside it. • Waterway C flowed through a planned built up area. The scientist worked downstream from sample point 1 to 3 on each waterway. Sample point 1 was inland (upstream of Montevideo), sample point 2 in the city centre and sample point 3 just before the river reached the sea. waterway A waterway B waterway C sample point 1 2 3 1 2 3 1 2 3 number of species found 15 3 4 14 4 12 16 8 15 number of biological groups 6 2 2 6 2 5 6 5 6 biodiversity index 2.4 1.1 1.1 2.3 1.1 2.2 2.4 1.6 2.4
Question paper, page 11
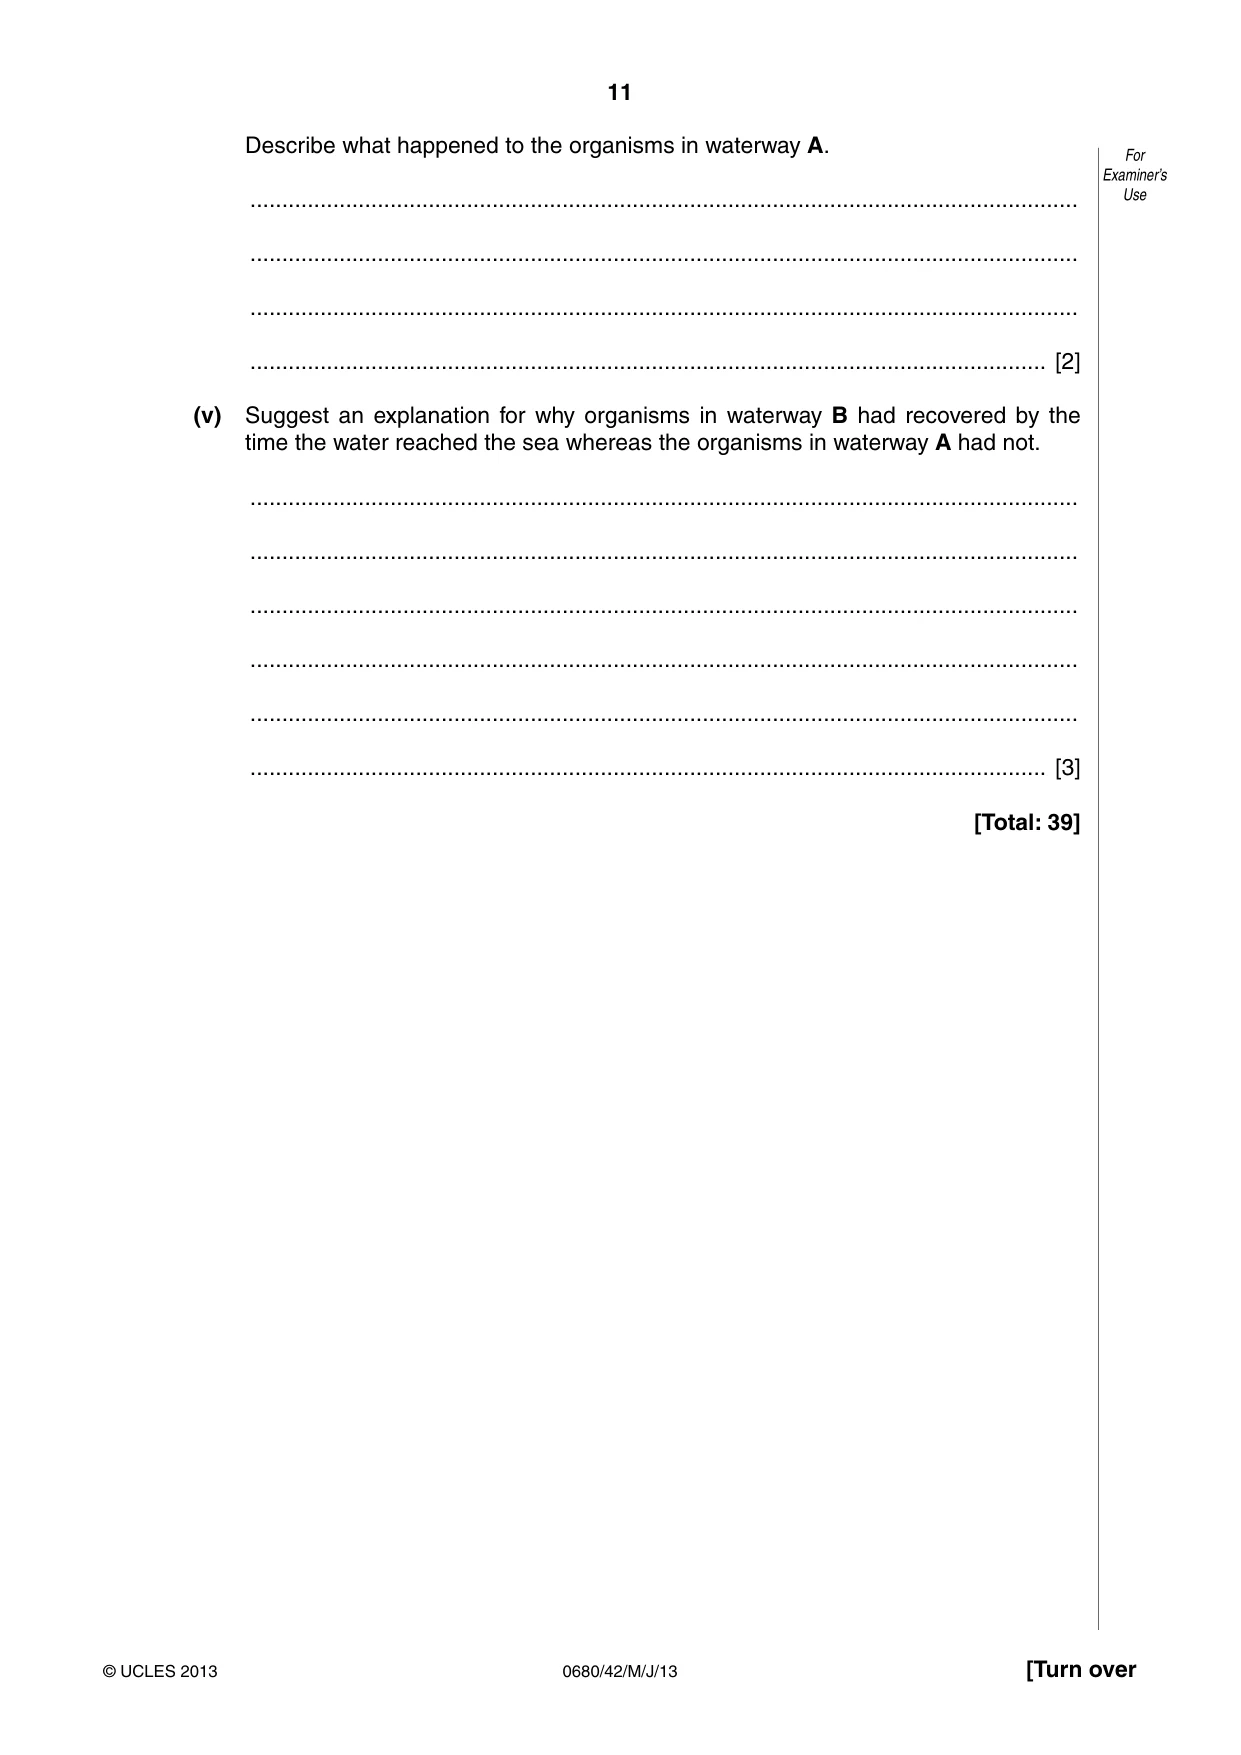
11 0680/42/M/J/13 © UCLES 2013 [Turn over For Examiner’s Use Describe what happened to the organisms in waterway A. … … … … [2] (v) Suggest an explanation for why organisms in waterway B had recovered by the time the water reached the sea whereas the organisms in waterway A had not. … … … … … … [3] [Total: 39]
Question paper, page 12
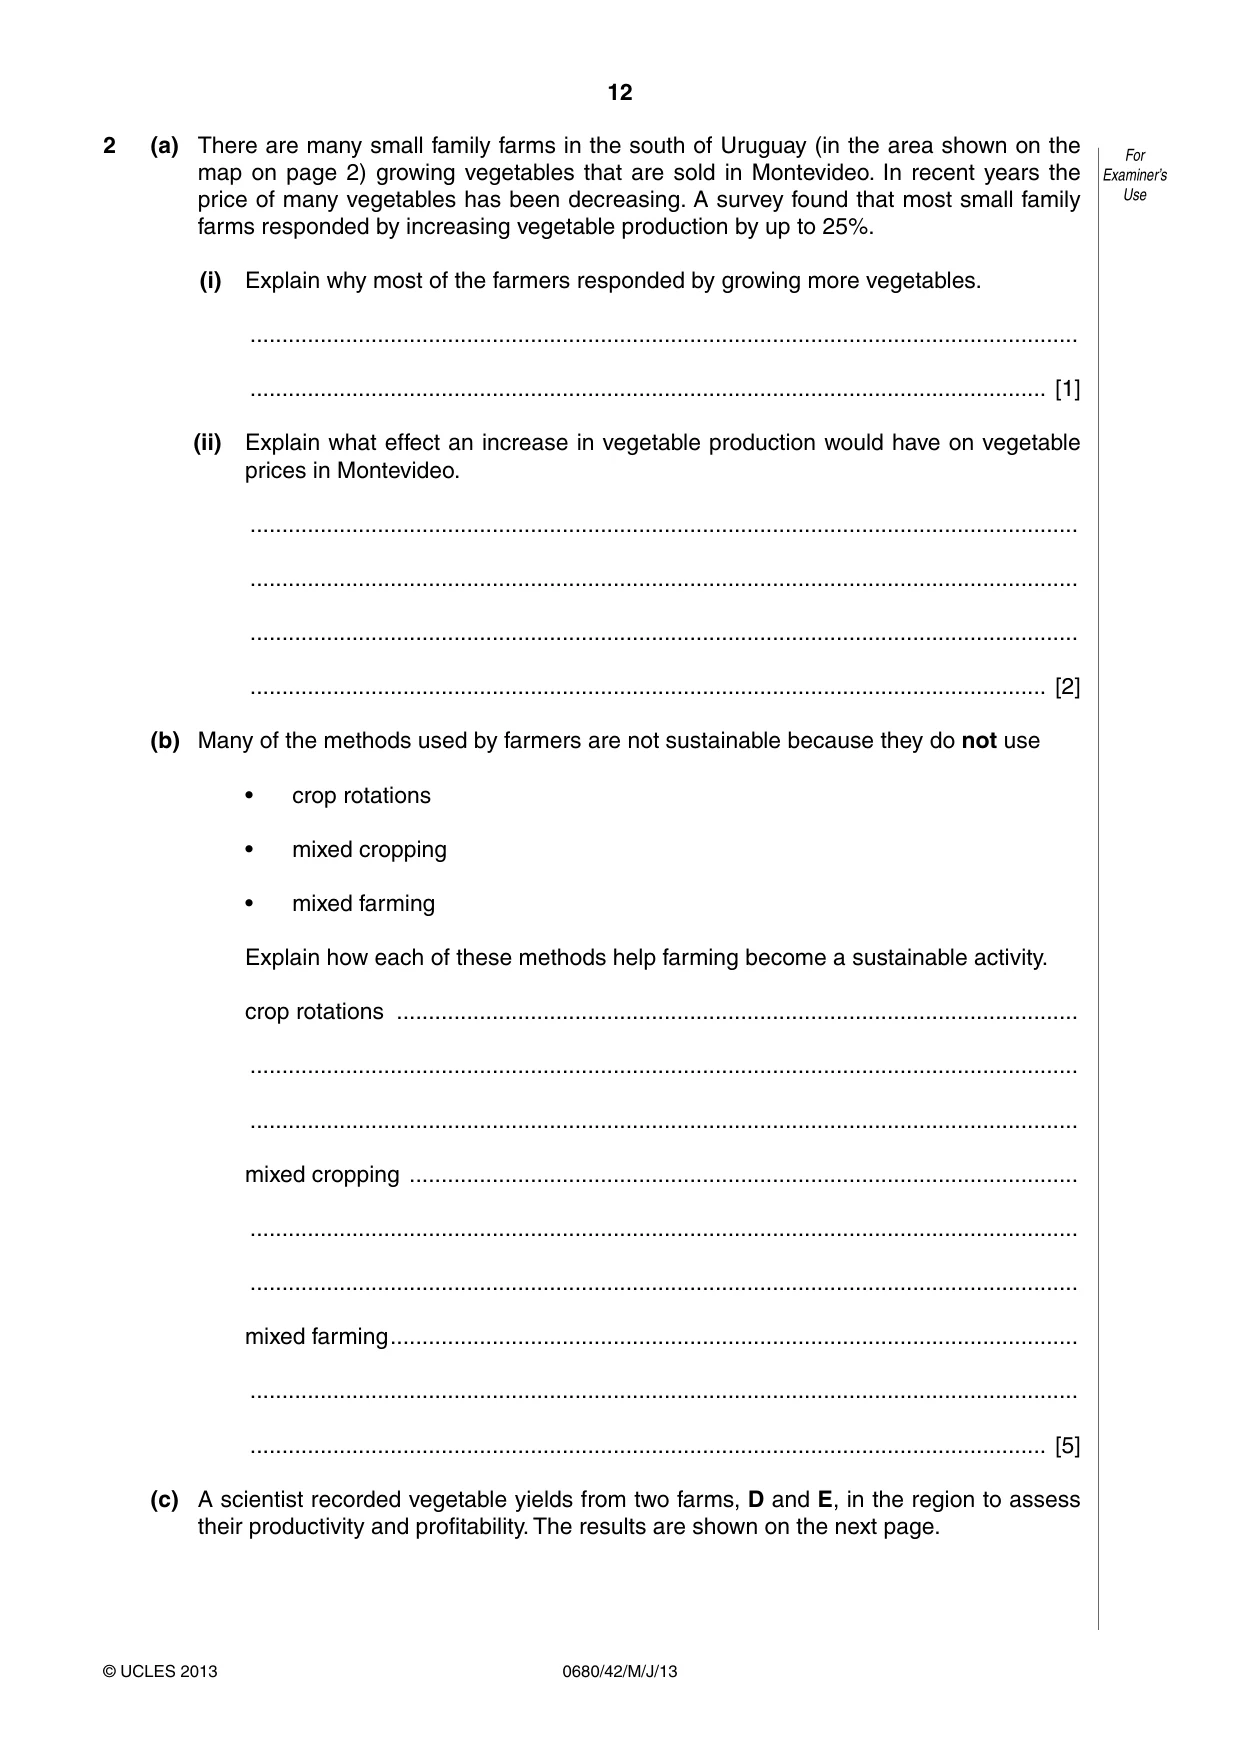
12 0680/42/M/J/13 © UCLES 2013 For Examiner’s Use 2 (a) There are many small family farms in the south of Uruguay (in the area shown on the map on page 2) growing vegetables that are sold in Montevideo. In recent years the price of many vegetables has been decreasing. A survey found that most small family farms responded by increasing vegetable production by up to 25%. (i) Explain why most of the farmers responded by growing more vegetables. … … [1] (ii) Explain what effect an increase in vegetable production would have on vegetable prices in Montevideo. … … … … [2] (b) Many of the methods used by farmers are not sustainable because they do not use • crop rotations • mixed cropping • mixed farming Explain how each of these methods help farming become a sustainable activity. crop rotations … … … mixed cropping … … … mixed farming … … … [5] (c) A scientist recorded vegetable yields from two farms, D and E, in the region to assess their productivity and profitability. The results are shown on the next page.
Question paper, page 13
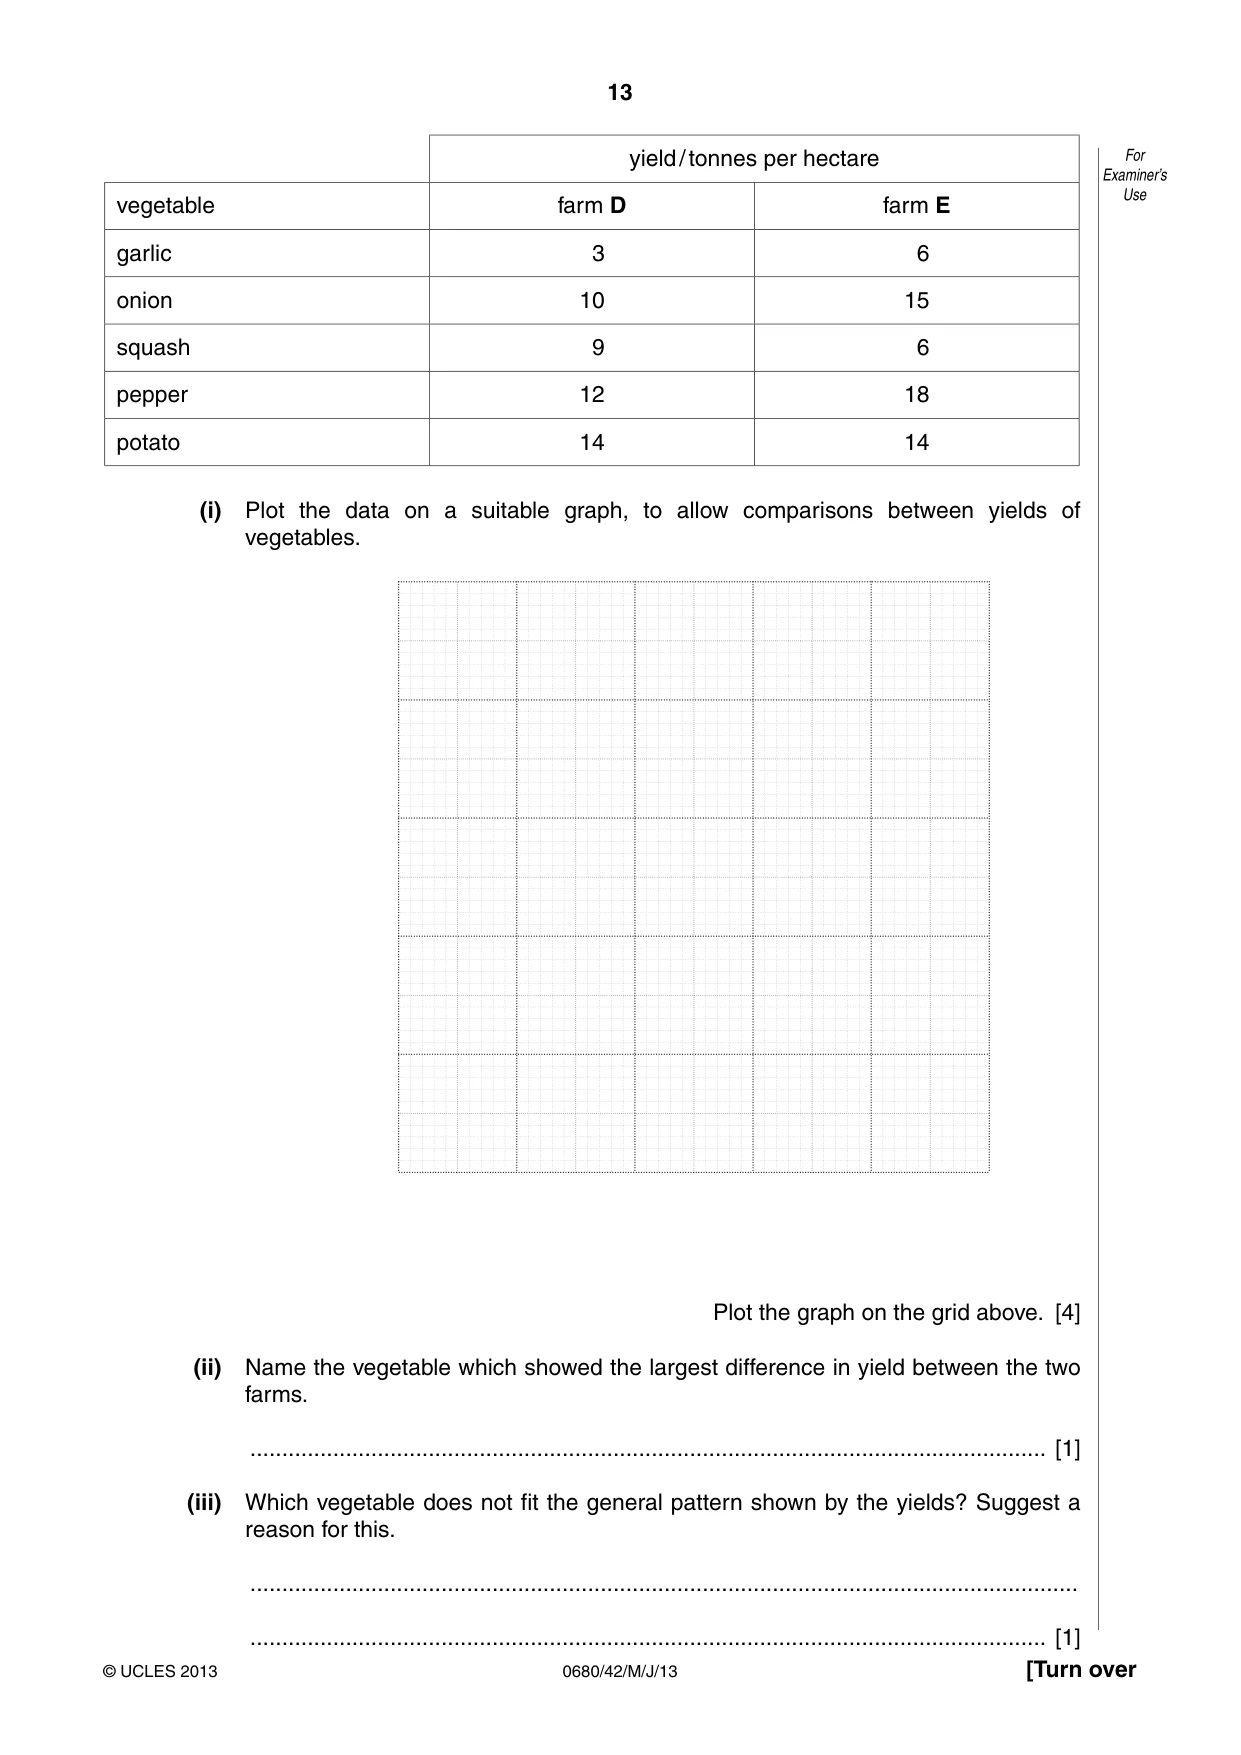
13 0680/42/M/J/13 © UCLES 2013 [Turn over For Examiner’s Use yield / tonnes per hectare vegetable farm D farm E garlic 3 6 onion 10 15 squash 9 6 pepper 12 18 potato 14 14 (i) Plot the data on a suitable graph, to allow comparisons between yields of vegetables. Plot the graph on the grid above. [4] (ii) Name the vegetable which showed the largest difference in yield between the two farms. … [1] (iii) Which vegetable does not fit the general pattern shown by the yields? Suggest a reason for this. … … [1]
Question paper, page 14
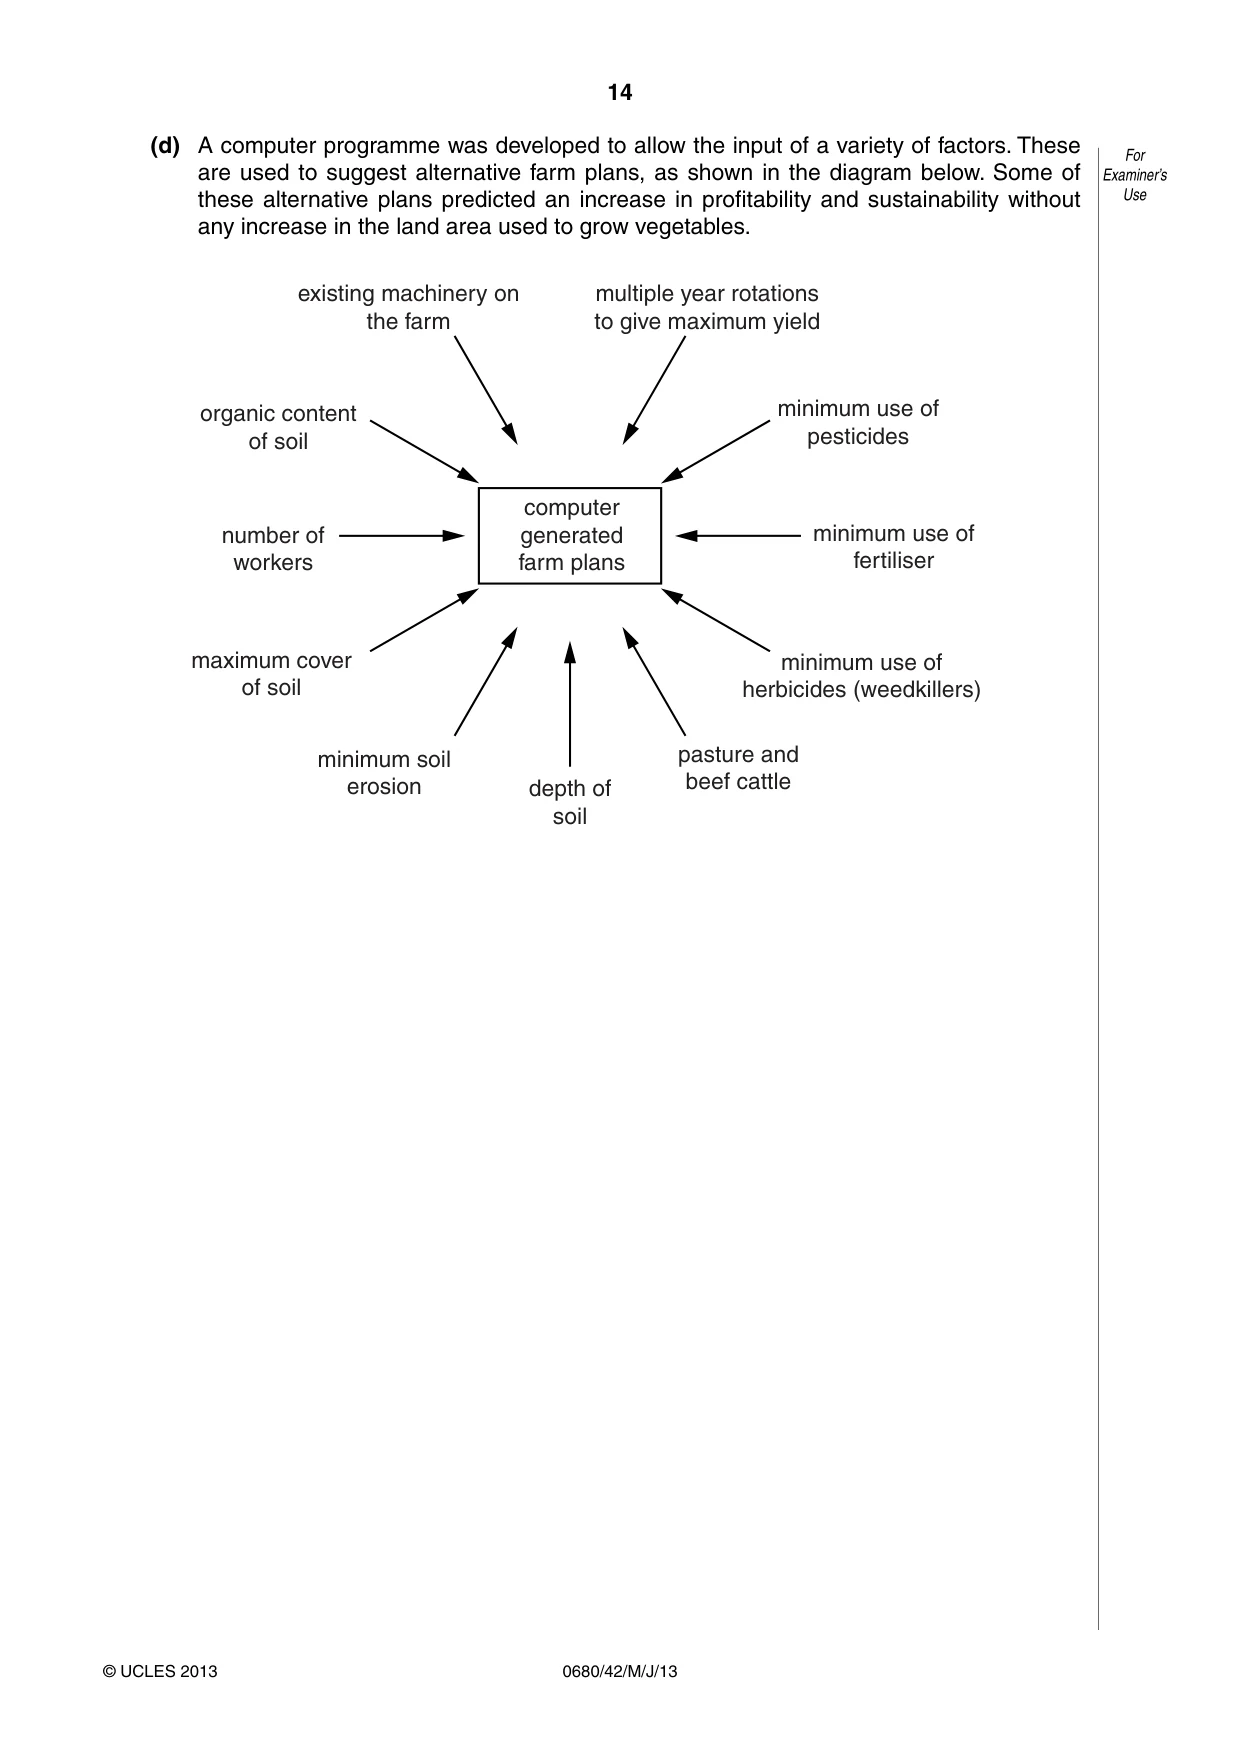
14 0680/42/M/J/13 © UCLES 2013 For Examiner’s Use (d) A computer programme was developed to allow the input of a variety of factors. These are used to suggest alternative farm plans, as shown in the diagram below. Some of these alternative plans predicted an increase in profitability and sustainability without any increase in the land area used to grow vegetables. existing machinery on the farm organic content of soil number of workers maximum cover of soil minimum soil erosion depth of soil pasture and beef cattle minimum use of herbicides (weedkillers) minimum use of fertiliser minimum use of pesticides multiple year rotations to give maximum yield computer generated farm plans
Question paper, page 15
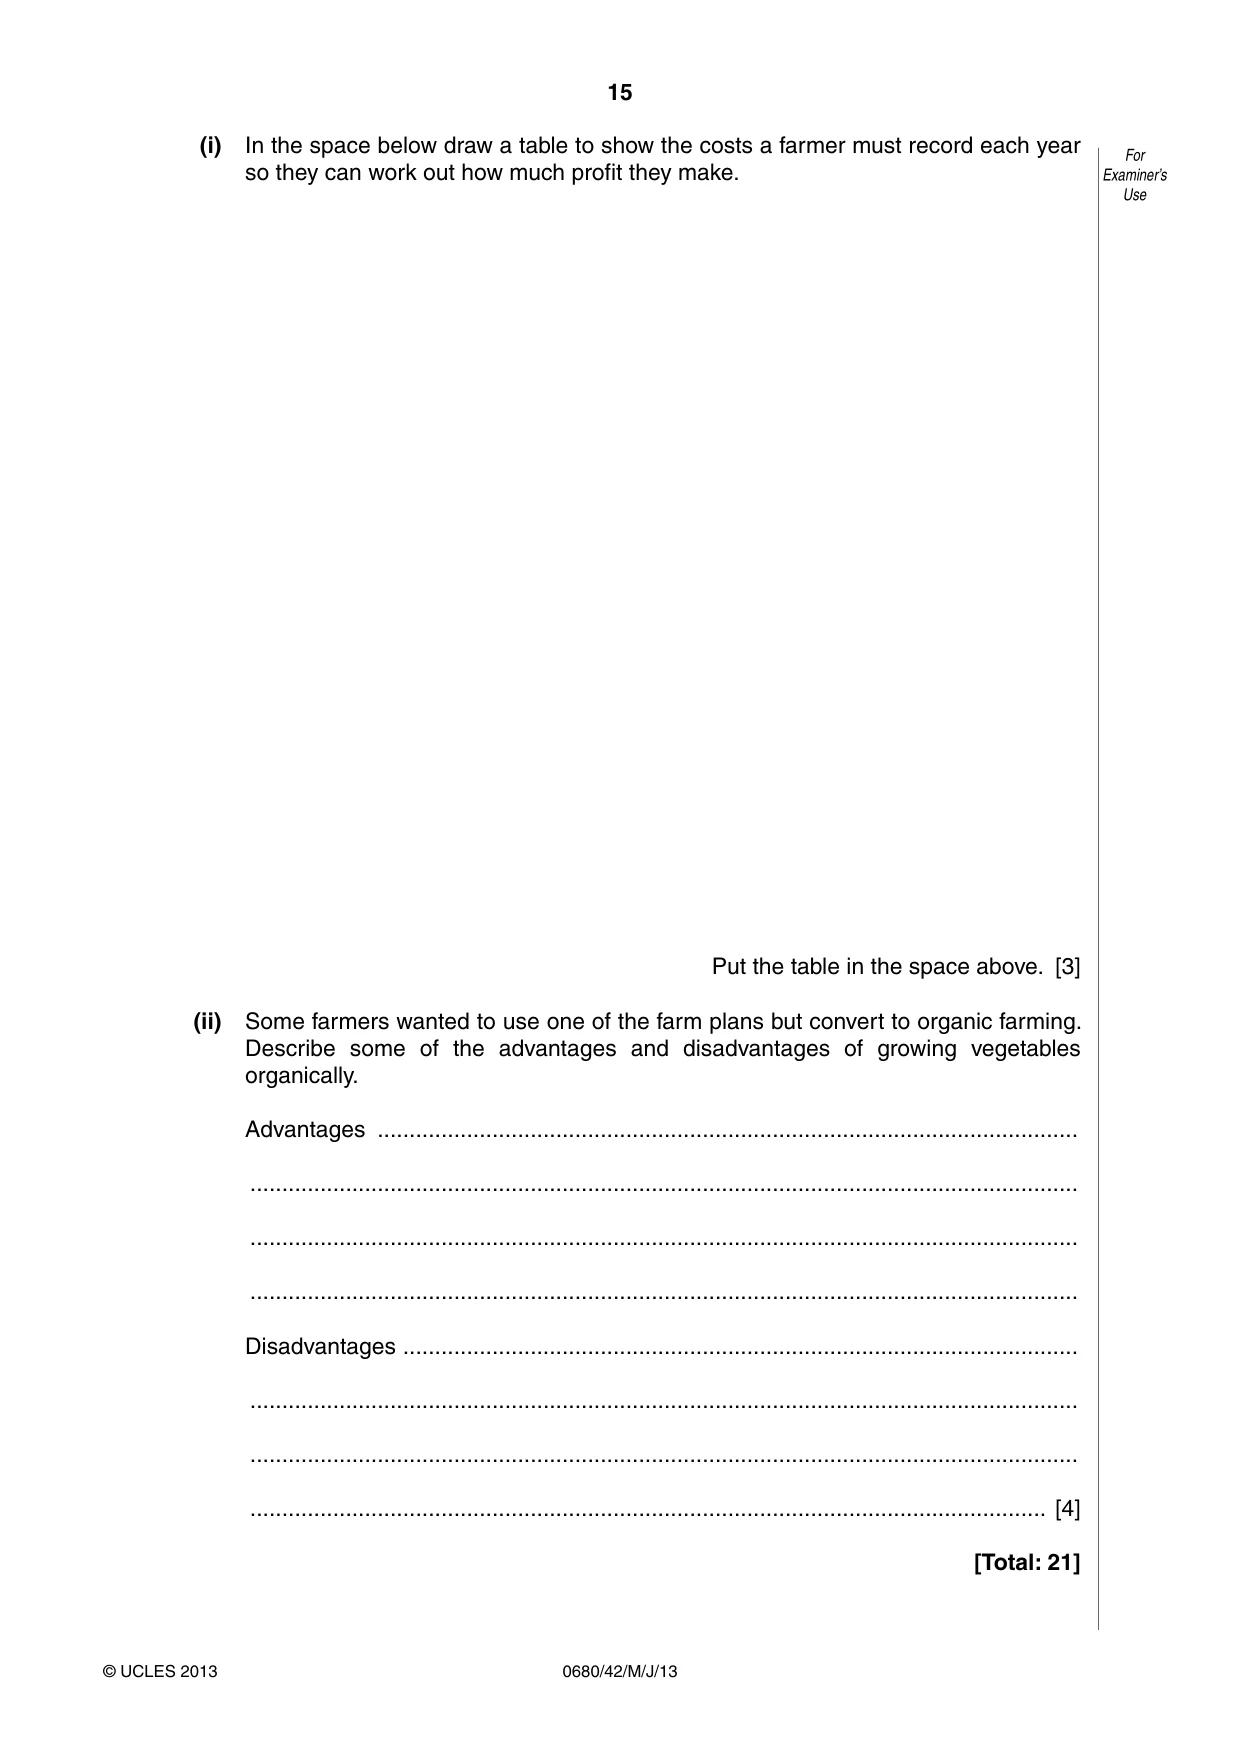
15 0680/42/M/J/13 © UCLES 2013 For Examiner’s Use (i) In the space below draw a table to show the costs a farmer must record each year so they can work out how much profit they make. Put the table in the space above. [3] (ii) Some farmers wanted to use one of the farm plans but convert to organic farming. Describe some of the advantages and disadvantages of growing vegetables organically. Advantages … … … … Disadvantages … … … … [4] [Total: 21]
Question paper, page 16
16 0680/42/M/J/13 © UCLES 2013 Permission to reproduce items where third-party owned material protected by copyright is included has been sought and cleared where possible. Every reasonable effort has been made by the publisher (UCLES) to trace copyright holders, but if any items requiring clearance have unwittingly been included, the publisher will be pleased to make amends at the earliest possible opportunity. University of Cambridge International Examinations is part of the Cambridge Assessment Group. Cambridge Assessment is the brand name of University of Cambridge Local Examinations Syndicate (UCLES), which is itself a department of the University of Cambridge. BLANK PAGE
Mark scheme, page 1
CAMBRIDGE INTERNATIONAL EXAMINATIONS International General Certificate of Secondary Education MARK SCHEME for the May/June 2013 series 0680 ENVIRONMENTAL MANAGEMENT 0680/42 Paper 4 (Alternative to Coursework), maximum raw mark 60 This mark scheme is published as an aid to teachers and candidates, to indicate the requirements of the examination. It shows the basis on which Examiners were instructed to award marks. It does not indicate the details of the discussions that took place at an Examiners’ meeting before marking began, which would have considered the acceptability of alternative answers. Mark schemes should be read in conjunction with the question paper and the Principal Examiner Report for Teachers. Cambridge will not enter into discussions about these mark schemes. Cambridge is publishing the mark schemes for the May/June 2013 series for most IGCSE, GCE Advanced Level and Advanced Subsidiary Level components and some Ordinary Level components.
Mark scheme, page 2
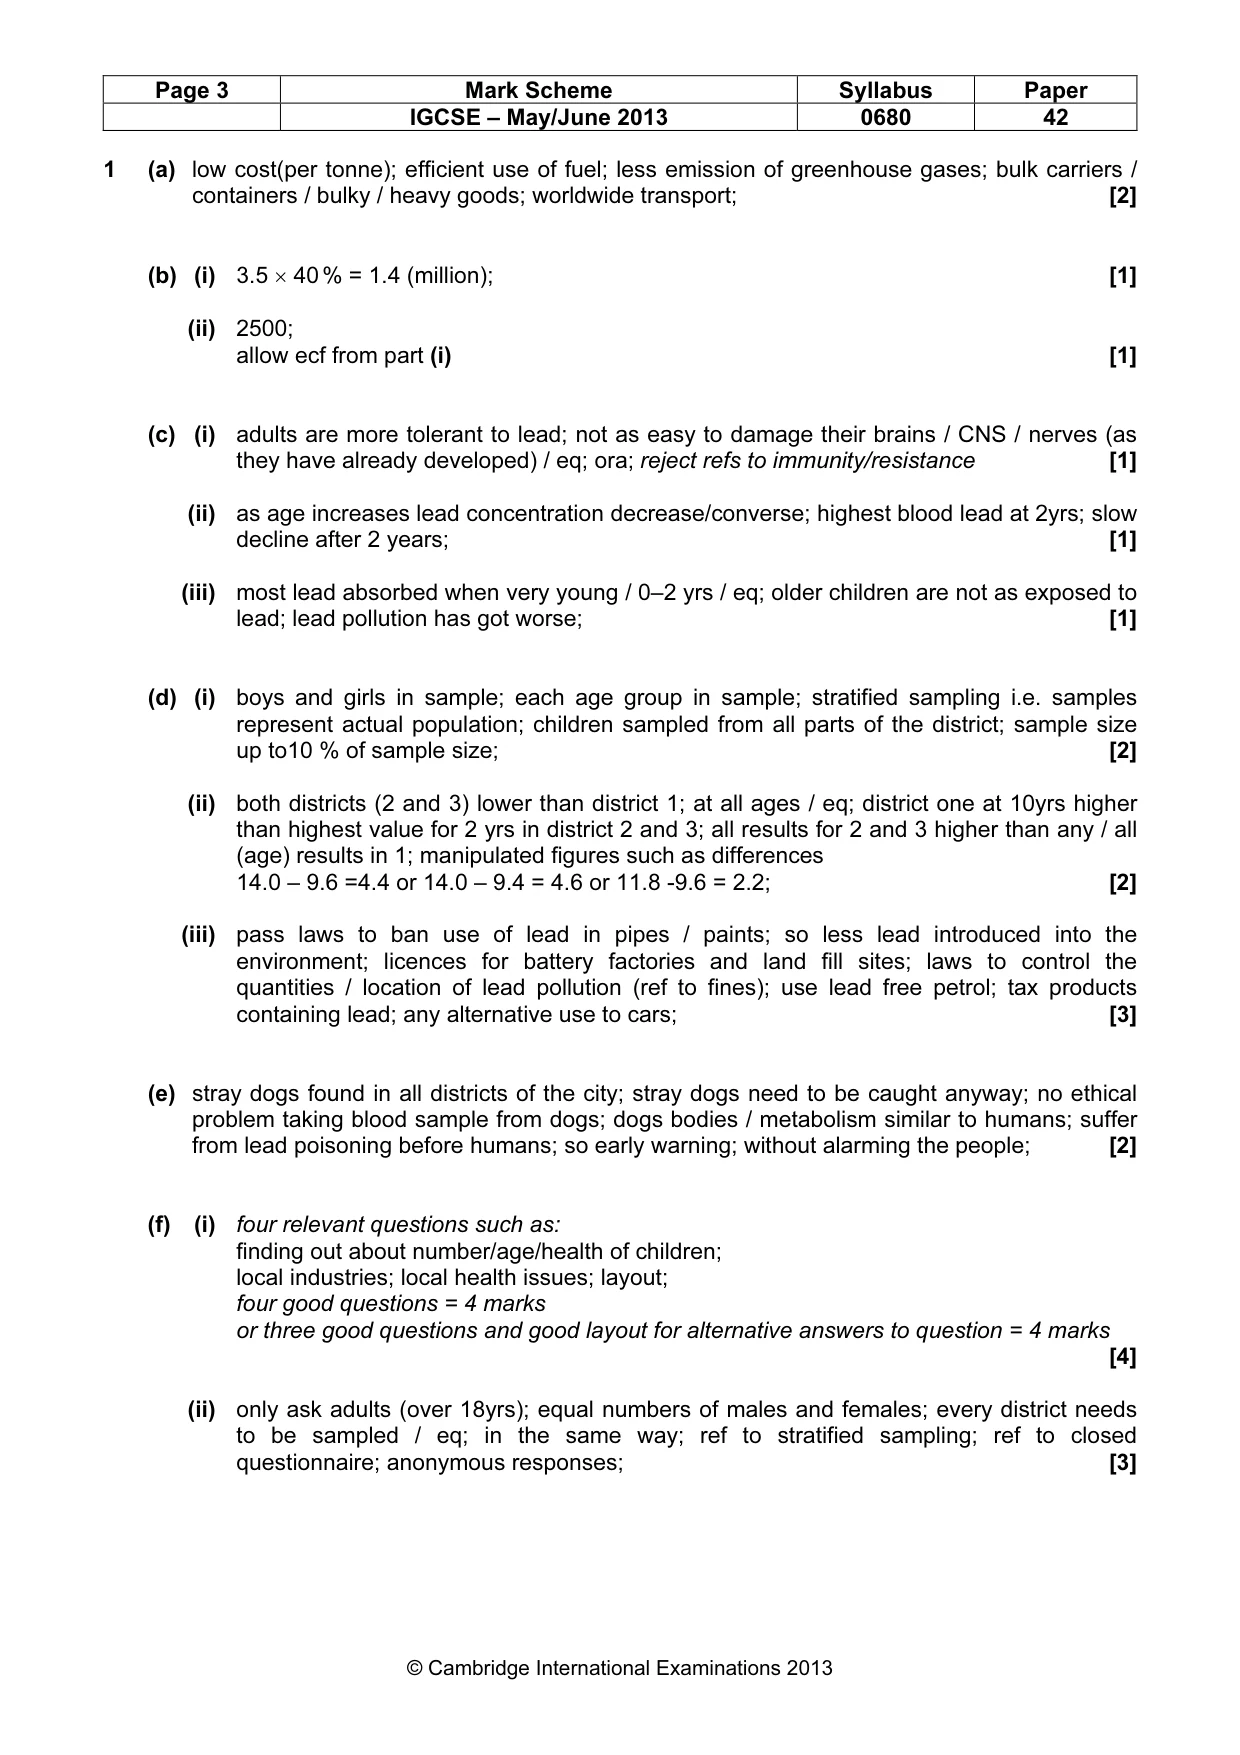
Page 2 Mark Scheme Syllabus Paper IGCSE – May/June 2013 0680 42 © Cambridge International Examinations 2013 General notes Symbols used in Environmental Management mark schemes. / separates alternatives for a marking point – other valid ways of expressing the same idea are also credited ; separates points for the award of a mark [3] indicates the number of marks available Italic indicates that this is information about the marking points and is not required to gain credit italic text is also used for comments about alternatives that should be accepted, ignored or rejected. ora or reverse argument – shows that an argument from an alternative viewpoint will be credited AW alternative wording, sometimes called ‘or words to that effect’ – AW is used when there are many different ways of expressing the same idea ( ) the word / phrase in brackets is not required to gain marks but sets the context of the response for credit volcanic underlined words –the answer must contain exactly this word ecf error carried forward – if an incorrect answer is given to part of a question, and this answer is subsequently used by a candidate in later parts of the question, this indicates that the candidate’s incorrect answer will be used as a starting point for marking the later parts of the question
Mark scheme, page 3
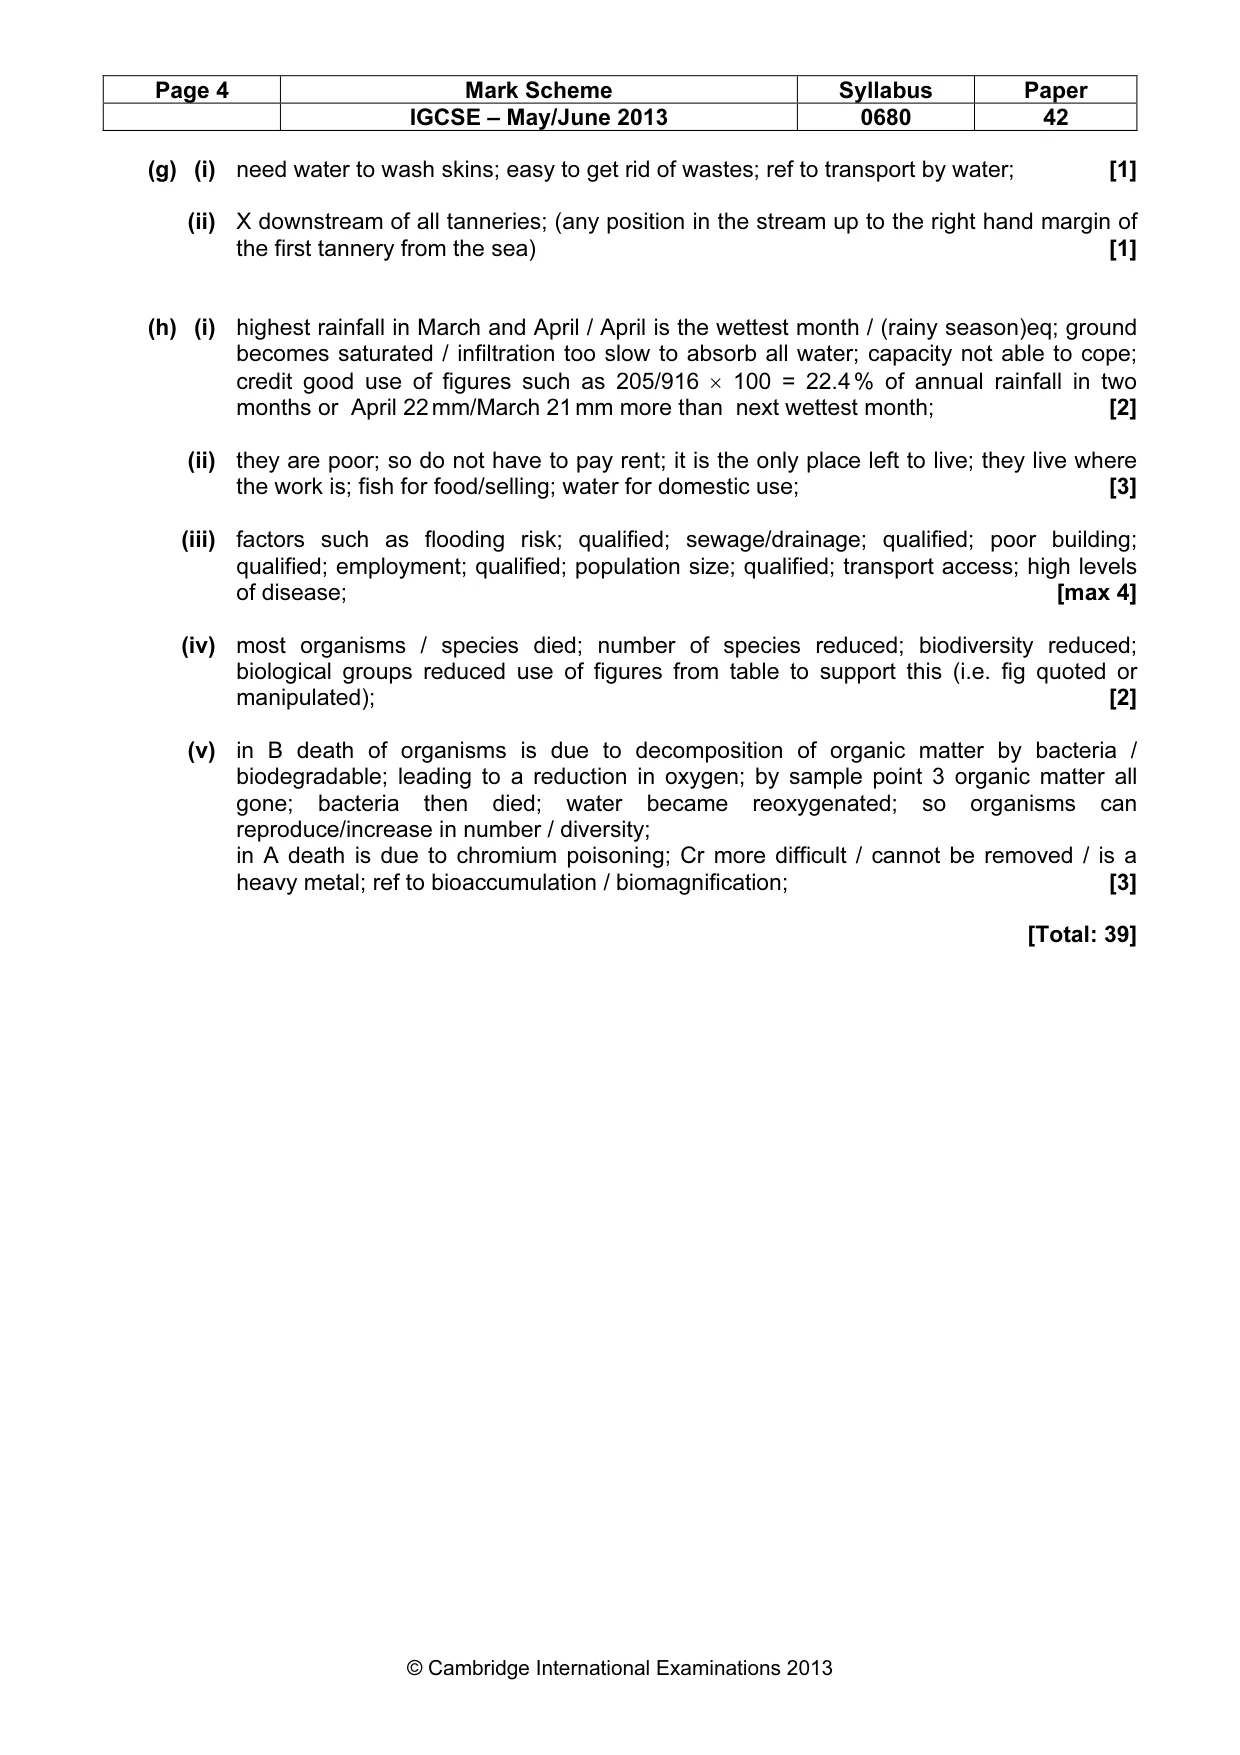
Page 3 Mark Scheme Syllabus Paper IGCSE – May/June 2013 0680 42 © Cambridge International Examinations 2013 1 (a) low cost(per tonne); efficient use of fuel; less emission of greenhouse gases; bulk carriers / containers / bulky / heavy goods; worldwide transport; [2] (b) (i) 3.5 × 40 % = 1.4 (million); [1] (ii) 2500; allow ecf from part (i) [1] (c) (i) adults are more tolerant to lead; not as easy to damage their brains / CNS / nerves (as they have already developed) / eq; ora; reject refs to immunity/resistance [1] (ii) as age increases lead concentration decrease/converse; highest blood lead at 2yrs; slow decline after 2 years; [1] (iii) most lead absorbed when very young / 0–2 yrs / eq; older children are not as exposed to lead; lead pollution has got worse; [1] (d) (i) boys and girls in sample; each age group in sample; stratified sampling i.e. samples represent actual population; children sampled from all parts of the district; sample size up to10 % of sample size; [2] (ii) both districts (2 and 3) lower than district 1; at all ages / eq; district one at 10yrs higher than highest value for 2 yrs in district 2 and 3; all results for 2 and 3 higher than any / all (age) results in 1; manipulated figures such as differences 14.0 – 9.6 =4.4 or 14.0 – 9.4 = 4.6 or 11.8 -9.6 = 2.2; [2] (iii) pass laws to ban use of lead in pipes / paints; so less lead introduced into the environment; licences for battery factories and land fill sites; laws to control the quantities / location of lead pollution (ref to fines); use lead free petrol; tax products containing lead; any alternative use to cars; [3] (e) stray dogs found in all districts of the city; stray dogs need to be caught anyway; no ethical problem taking blood sample from dogs; dogs bodies / metabolism similar to humans; suffer from lead poisoning before humans; so early warning; without alarming the people; [2] (f) (i) four relevant questions such as: finding out about number/age/health of children; local industries; local health issues; layout; four good questions = 4 marks or three good questions and good layout for alternative answers to question = 4 marks [4] (ii) only ask adults (over 18yrs); equal numbers of males and females; every district needs to be sampled / eq; in the same way; ref to stratified sampling; ref to closed questionnaire; anonymous responses; [3]
Mark scheme, page 4
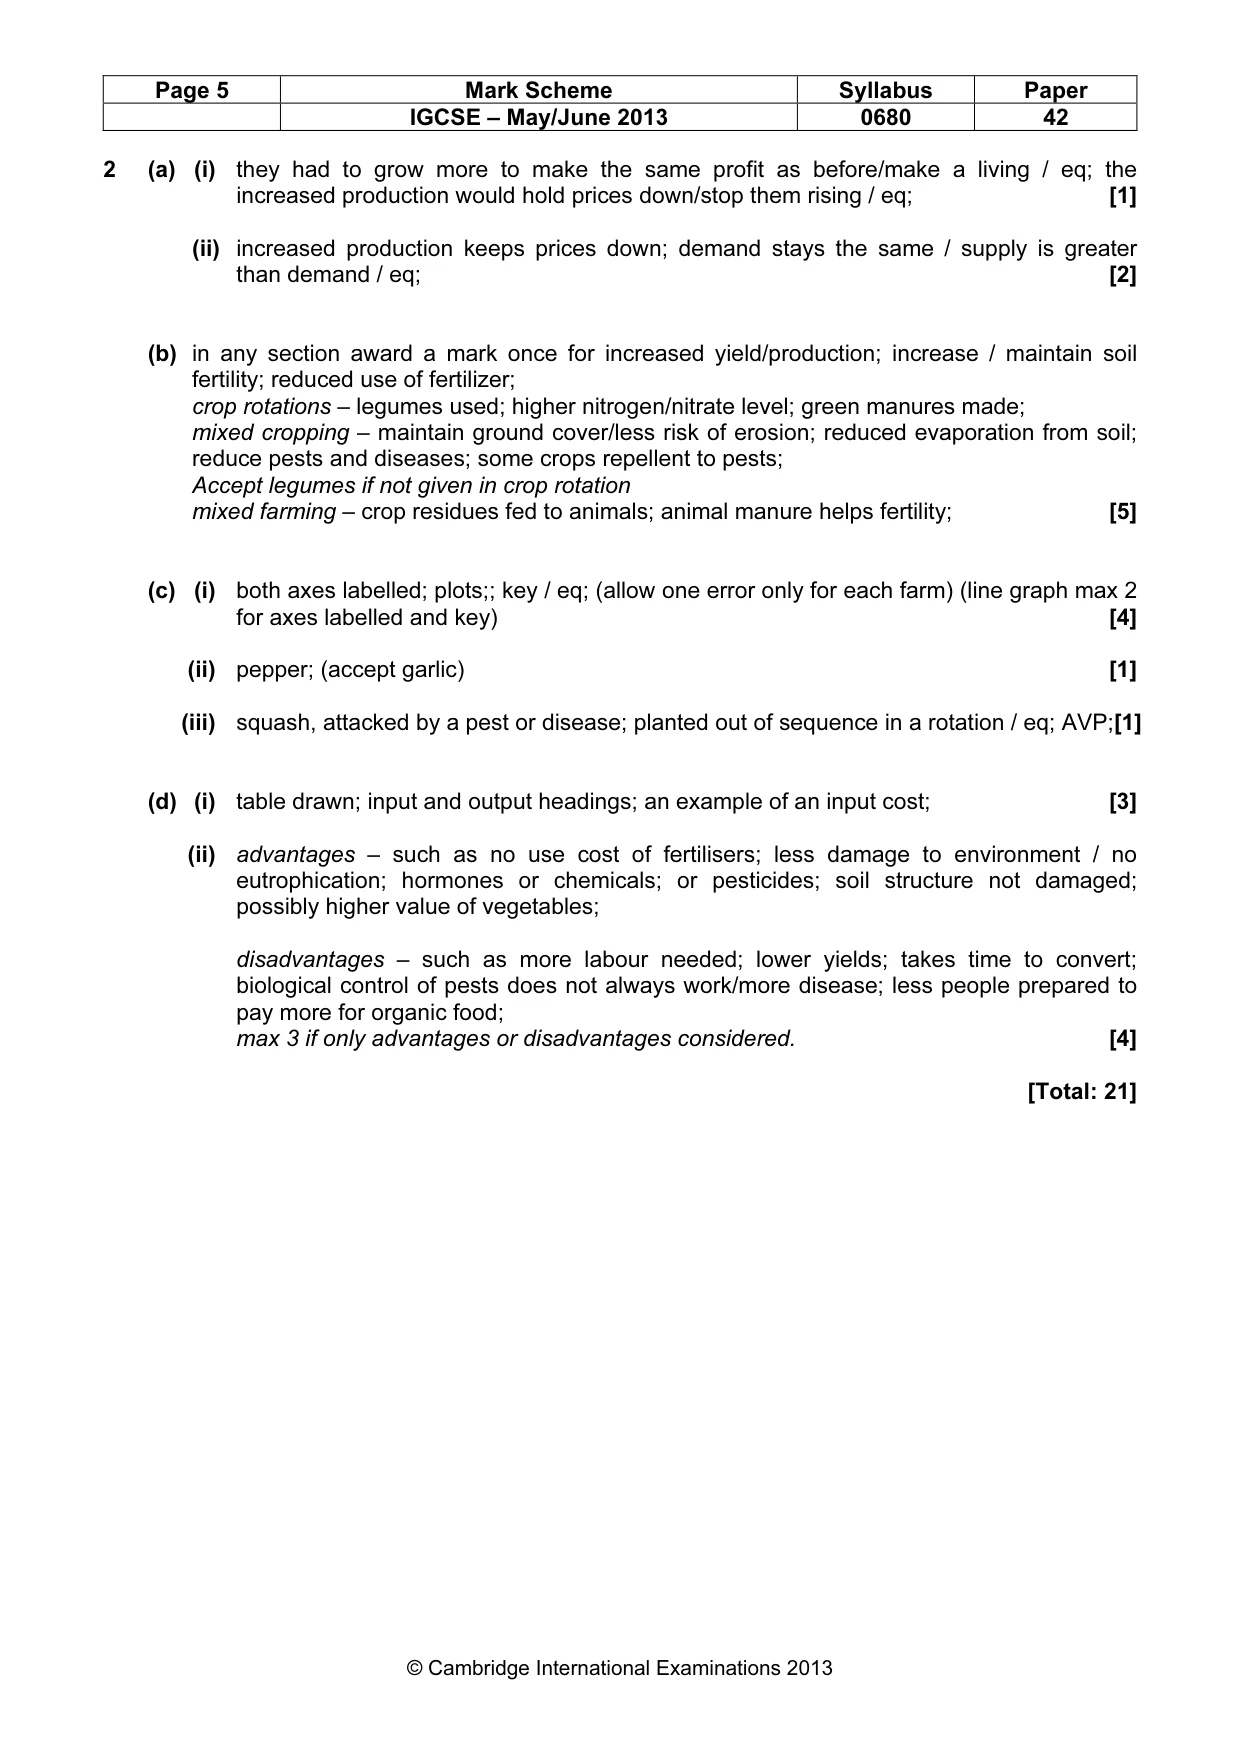
Page 4 Mark Scheme Syllabus Paper IGCSE – May/June 2013 0680 42 © Cambridge International Examinations 2013 (g) (i) need water to wash skins; easy to get rid of wastes; ref to transport by water; [1] (ii) X downstream of all tanneries; (any position in the stream up to the right hand margin of the first tannery from the sea) [1] (h) (i) highest rainfall in March and April / April is the wettest month / (rainy season)eq; ground becomes saturated / infiltration too slow to absorb all water; capacity not able to cope; credit good use of figures such as 205/916 × 100 = 22.4 % of annual rainfall in two months or April 22 mm/March 21 mm more than next wettest month; [2] (ii) they are poor; so do not have to pay rent; it is the only place left to live; they live where the work is; fish for food/selling; water for domestic use; [3] (iii) factors such as flooding risk; qualified; sewage/drainage; qualified; poor building; qualified; employment; qualified; population size; qualified; transport access; high levels of disease; [max 4] (iv) most organisms / species died; number of species reduced; biodiversity reduced; biological groups reduced use of figures from table to support this (i.e. fig quoted or manipulated); [2] (v) in B death of organisms is due to decomposition of organic matter by bacteria / biodegradable; leading to a reduction in oxygen; by sample point 3 organic matter all gone; bacteria then died; water became reoxygenated; so organisms can reproduce/increase in number / diversity; in A death is due to chromium poisoning; Cr more difficult / cannot be removed / is a heavy metal; ref to bioaccumulation / biomagnification; [3] [Total: 39]
Mark scheme, page 5
Page 5 Mark Scheme Syllabus Paper IGCSE – May/June 2013 0680 42 © Cambridge International Examinations 2013 2 (a) (i) they had to grow more to make the same profit as before/make a living / eq; the increased production would hold prices down/stop them rising / eq; [1] (ii) increased production keeps prices down; demand stays the same / supply is greater than demand / eq; [2] (b) in any section award a mark once for increased yield/production; increase / maintain soil fertility; reduced use of fertilizer; crop rotations – legumes used; higher nitrogen/nitrate level; green manures made; mixed cropping – maintain ground cover/less risk of erosion; reduced evaporation from soil; reduce pests and diseases; some crops repellent to pests; Accept legumes if not given in crop rotation mixed farming – crop residues fed to animals; animal manure helps fertility; [5] (c) (i) both axes labelled; plots;; key / eq; (allow one error only for each farm) (line graph max 2 for axes labelled and key) [4] (ii) pepper; (accept garlic) [1] (iii) squash, attacked by a pest or disease; planted out of sequence in a rotation / eq; AVP;[1] (d) (i) table drawn; input and output headings; an example of an input cost; [3] (ii) advantages – such as no use cost of fertilisers; less damage to environment / no eutrophication; hormones or chemicals; or pesticides; soil structure not damaged; possibly higher value of vegetables; disadvantages – such as more labour needed; lower yields; takes time to convert; biological control of pests does not always work/more disease; less people prepared to pay more for organic food; max 3 if only advantages or disadvantages considered. [4] [Total: 21]
What you needed in this session
Cambridge’s own grade thresholds for 2013 May/June, Paper 4 · Variant 2. A higher threshold means an easier paper — the bar moves with how the cohort did.