Cambridge IGCSE Environmental Management 0680 — 2011 May/June Paper 2 · Variant 2
0680/22/M/J/11 · 80 marks · ≈90 min
The question paper and its mark scheme, free to read here and free to download. This is Cambridge’s own paper, exactly as it was sat.
Question paper16 pages

Mark scheme9 pages
Answers below. Sit the paper first if you are practising.
Paper as text
Question paper, page 1
* 1 2 3 0 9 0 9 0 8 1 * This document consists of 15 printed pages and 1 blank page. DC (CW/JG) 32679/6 © UCLES 2011 [Turn over UNIVERSITY OF CAMBRIDGE INTERNATIONAL EXAMINATIONS International General Certificate of Secondary Education READ THESE INSTRUCTIONS FIRST Write your Centre number, candidate number and name on all the work you hand in. Write in dark blue or black pen. You may use a soft pencil for any diagrams, graphs or rough working. Do not use staples, paper clips, highlighters, glue or correction fluid. DO NOT WRITE IN ANY BARCODES. Answer both questions. At the end of the examination, fasten all your work securely together. The number of marks is given in brackets [ ] at the end of each question or part question. ENVIRONMENTAL MANAGEMENT 0680/22 Paper 2 May/June 2011 1 hour 45 minutes Candidates answer on the Question Paper. Additional Materials: Ruler For Examiner’s Use 1 2 Total www.XtremePapers.com
Question paper, page 2
2 0680/22/M/J/11 © UCLES 2011 BLANK PAGE
Question paper, page 3
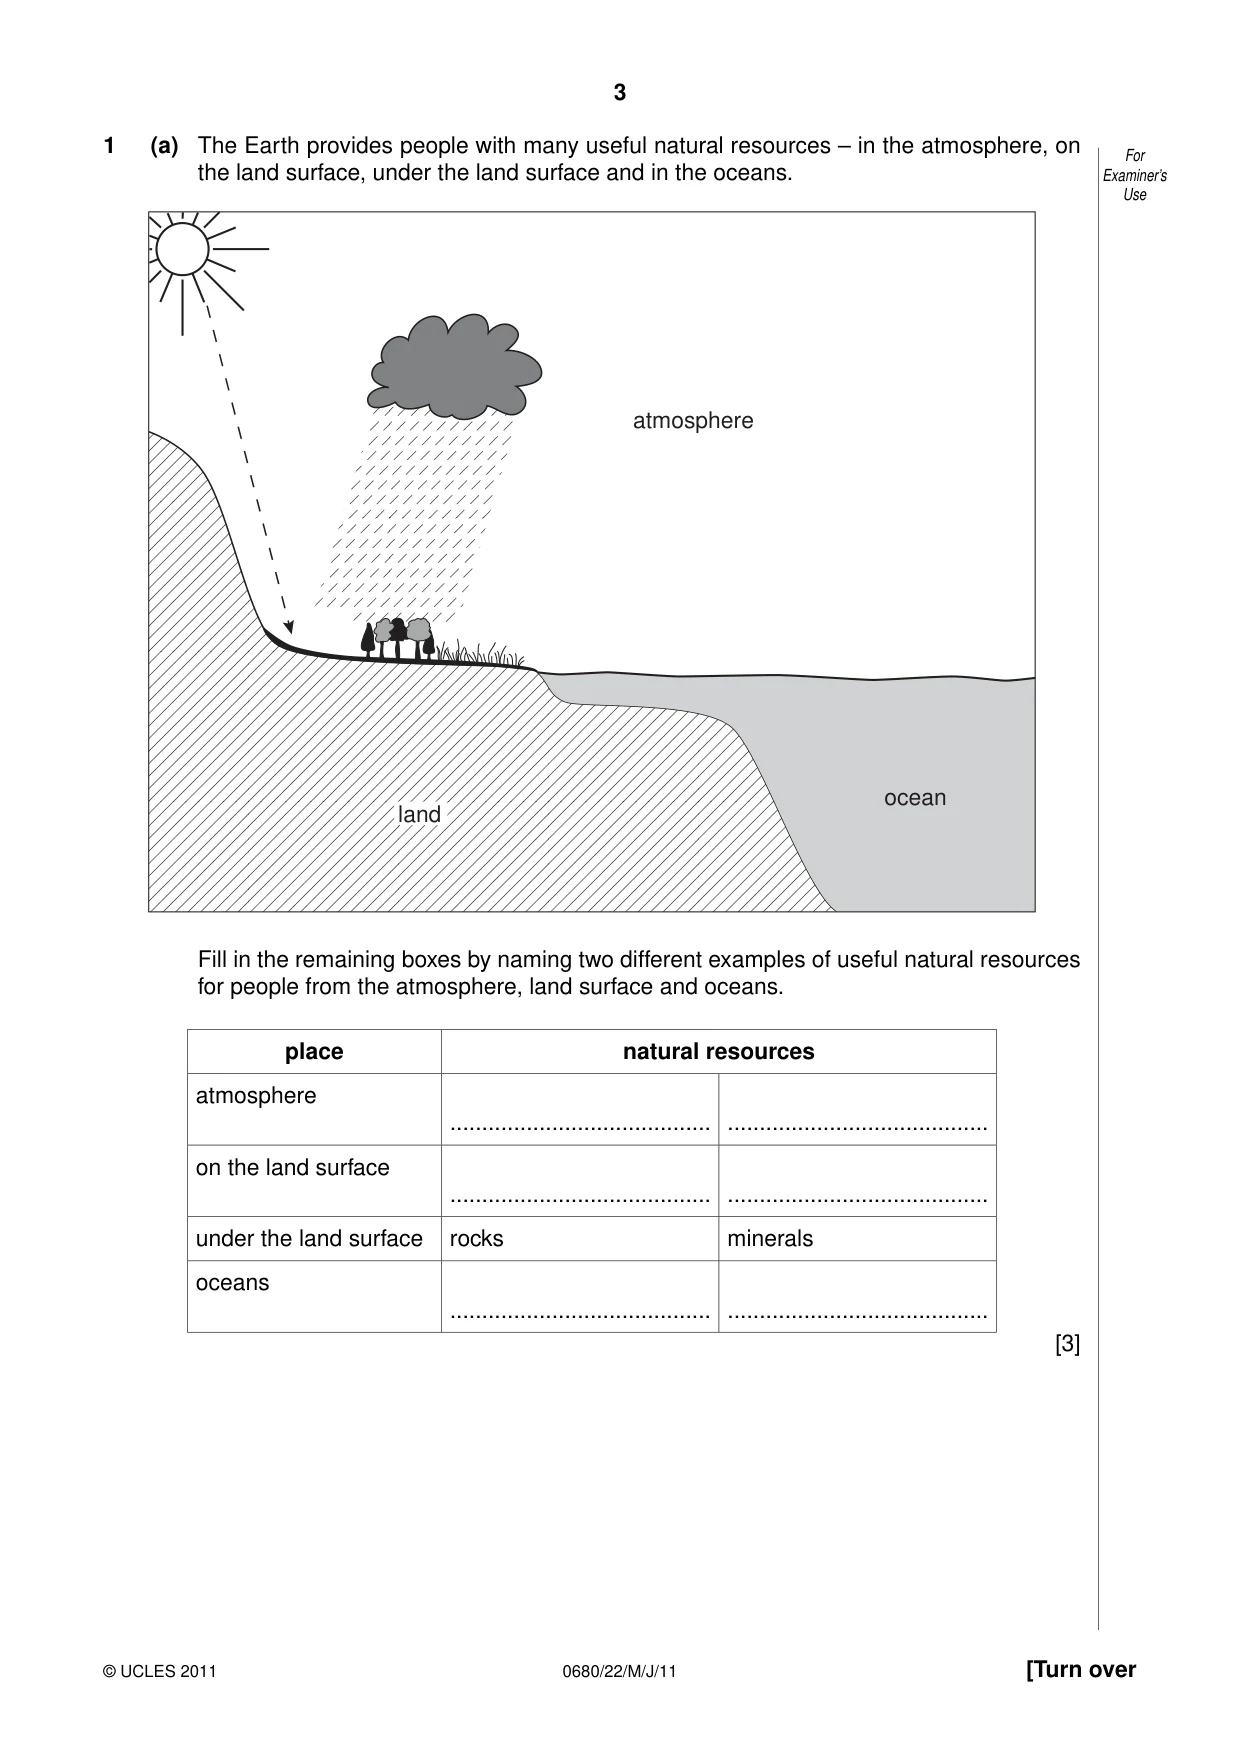
3 0680/22/M/J/11 © UCLES 2011 [Turn over For Examiner’s Use 1 (a) The Earth provides people with many useful natural resources – in the atmosphere, on the land surface, under the land surface and in the oceans. land ocean atmosphere Fill in the remaining boxes by naming two different examples of useful natural resources for people from the atmosphere, land surface and oceans. place natural resources atmosphere … … on the land surface … … under the land surface rocks minerals oceans … … [3]
Question paper, page 4
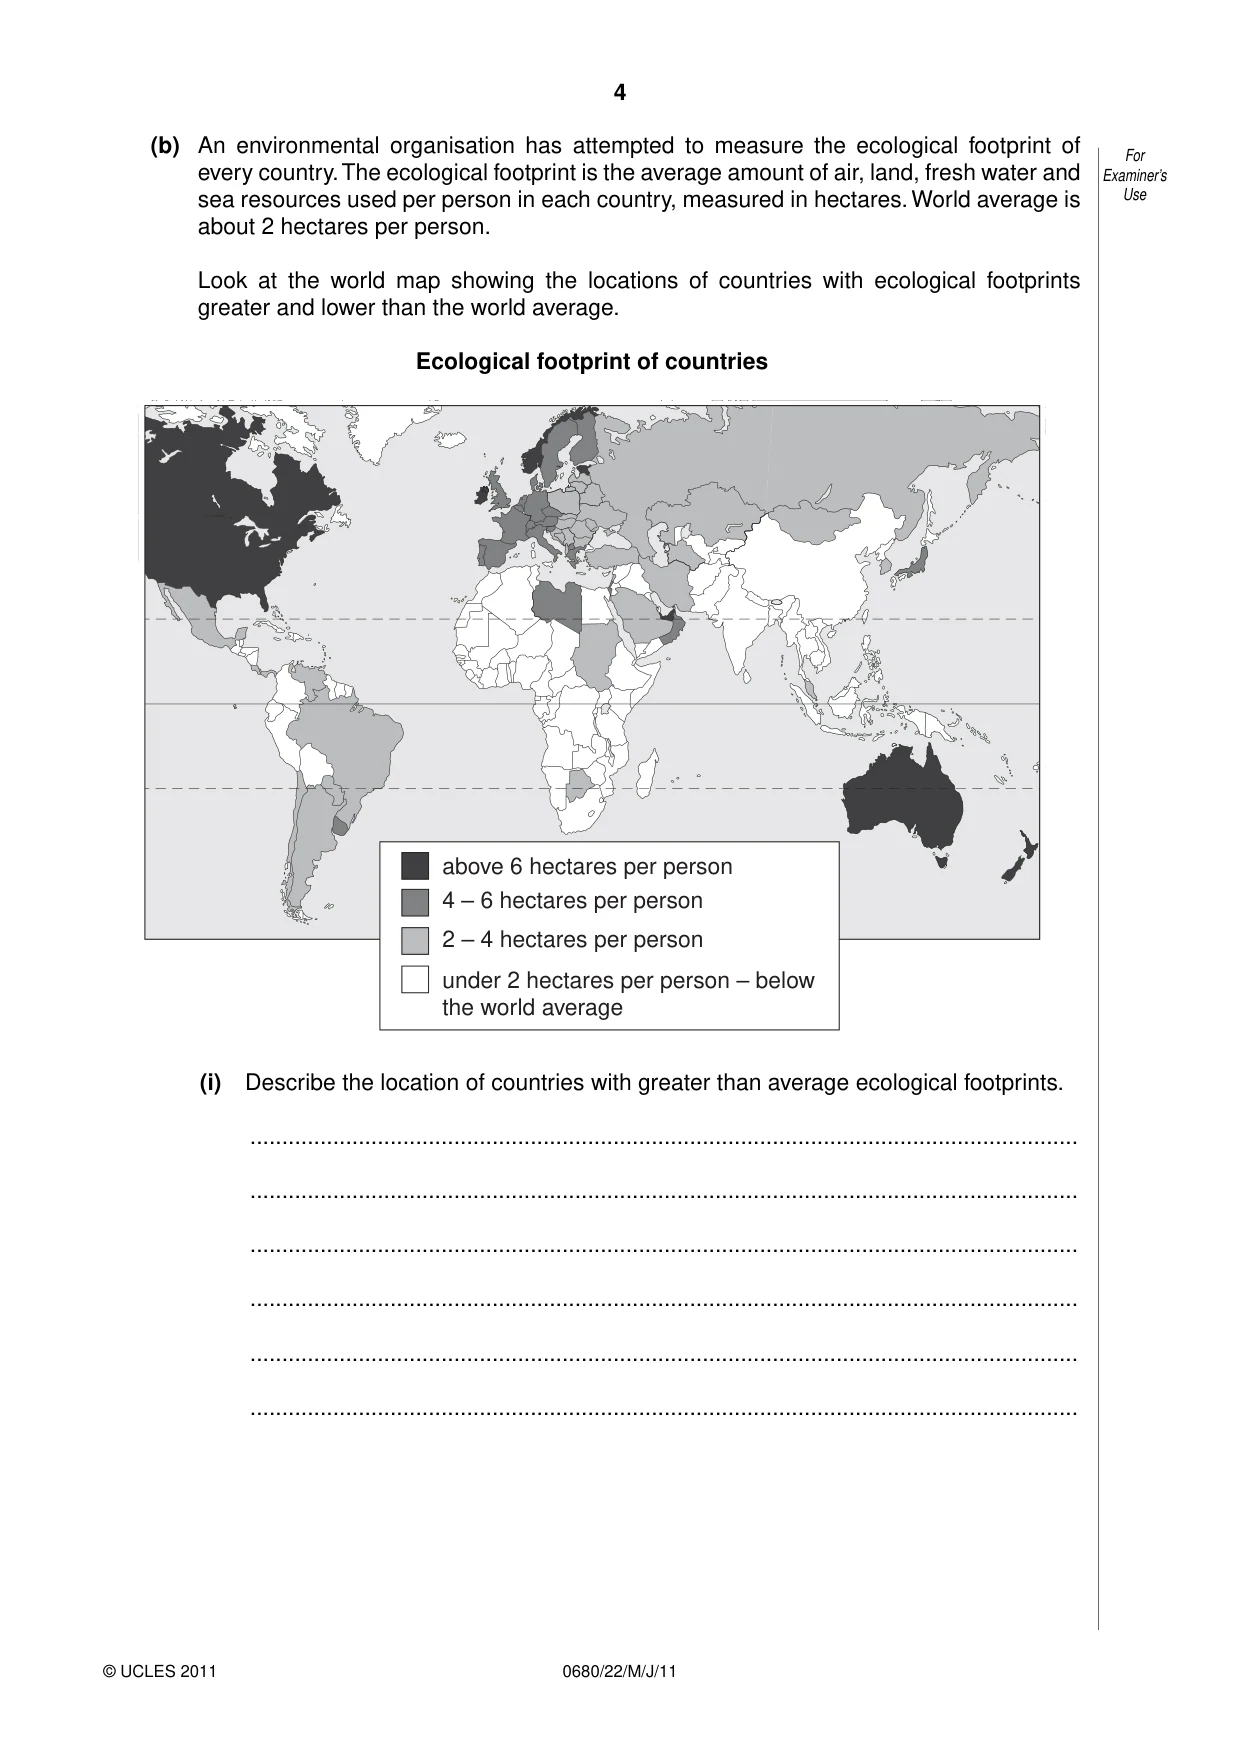
4 0680/22/M/J/11 © UCLES 2011 For Examiner’s Use (b) An environmental organisation has attempted to measure the ecological footprint of every country. The ecological footprint is the average amount of air, land, fresh water and sea resources used per person in each country, measured in hectares. World average is about 2 hectares per person. Look at the world map showing the locations of countries with ecological footprints greater and lower than the world average. Ecological footprint of countries above 6 hectares per person 4 – 6 hectares per person 2 – 4 hectares per person under 2 hectares per person – below the world average (i) Describe the location of countries with greater than average ecological footprints. … … … … … …
Question paper, page 5
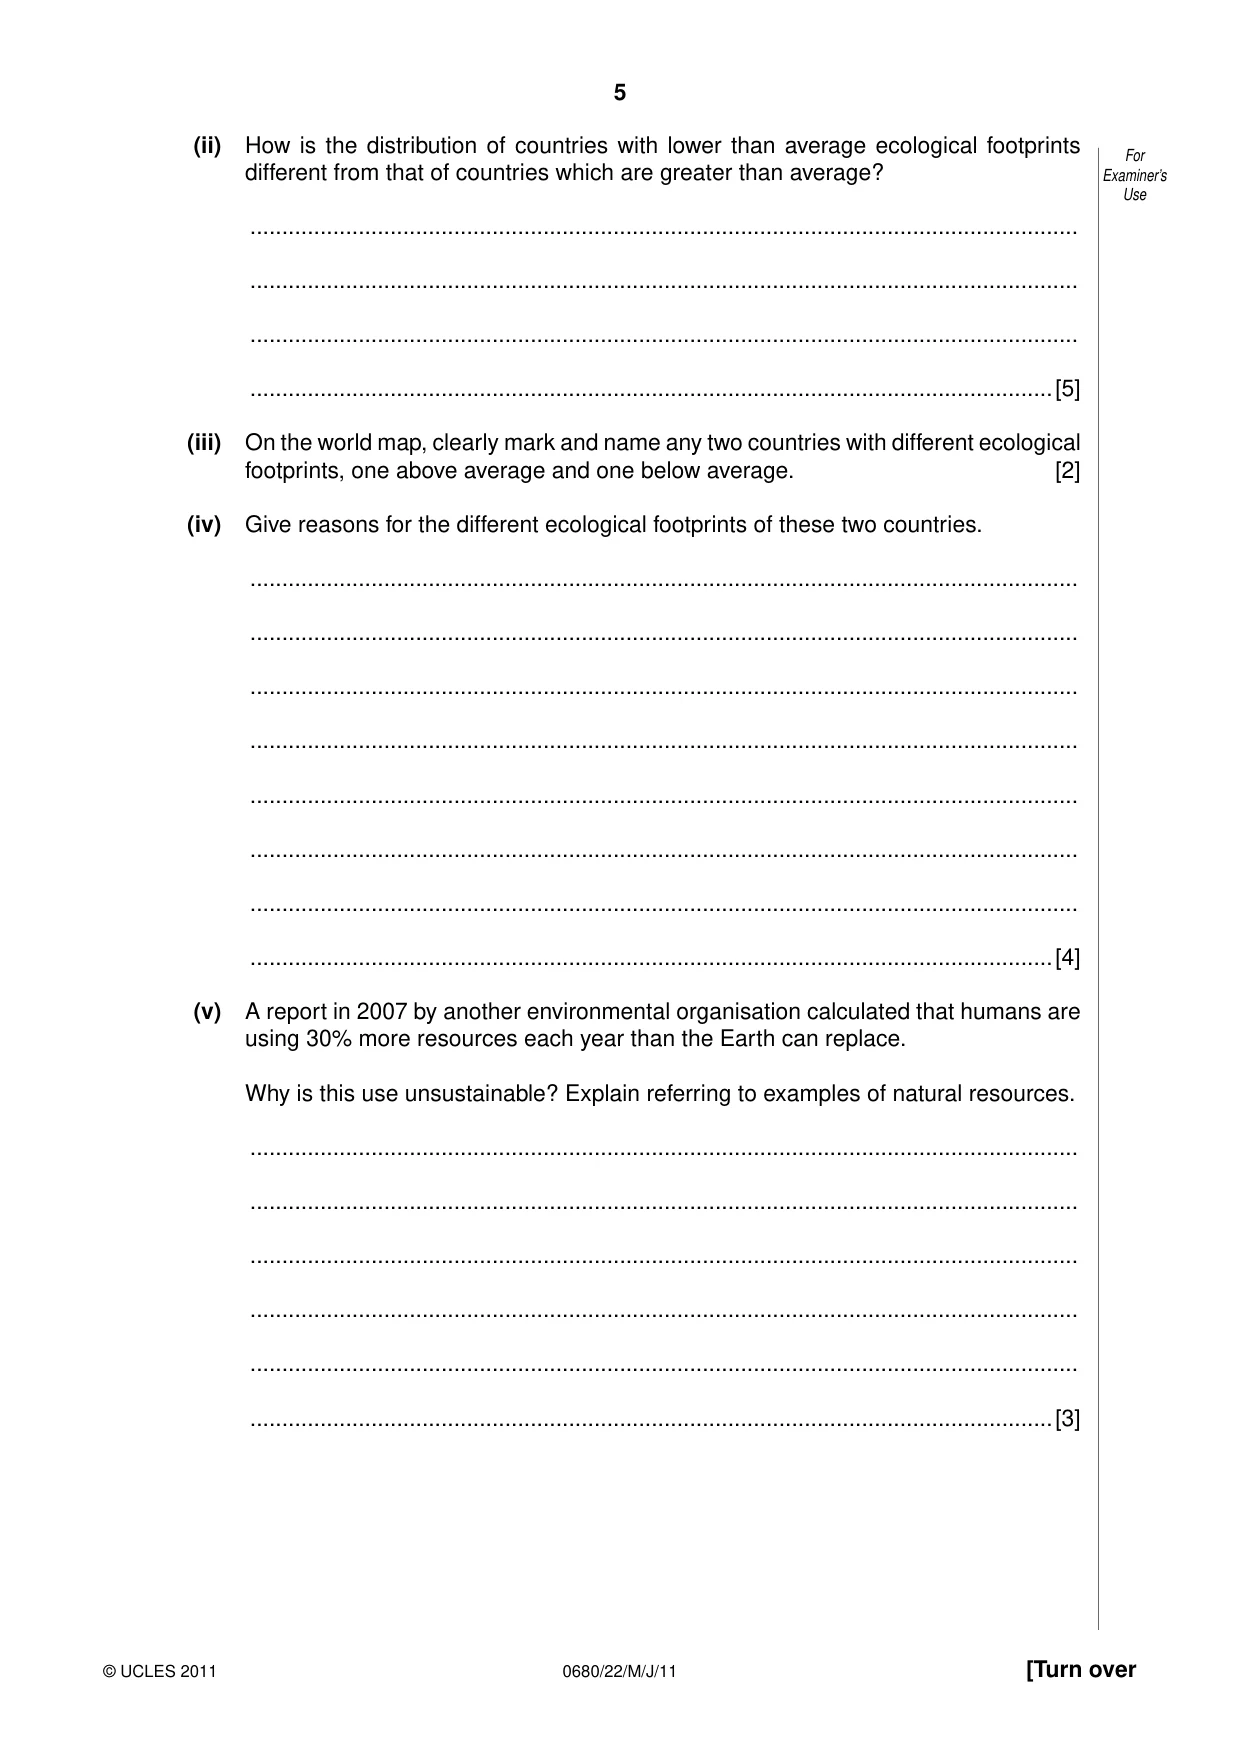
5 0680/22/M/J/11 © UCLES 2011 [Turn over For Examiner’s Use (ii) How is the distribution of countries with lower than average ecological footprints different from that of countries which are greater than average? … … … …[5] (iii) On the world map, clearly mark and name any two countries with different ecological footprints, one above average and one below average. [2] (iv) Give reasons for the different ecological footprints of these two countries. … … … … … … … …[4] (v) A report in 2007 by another environmental organisation calculated that humans are using 30% more resources each year than the Earth can replace. Why is this use unsustainable? Explain referring to examples of natural resources. … … … … … …[3]
Question paper, page 6
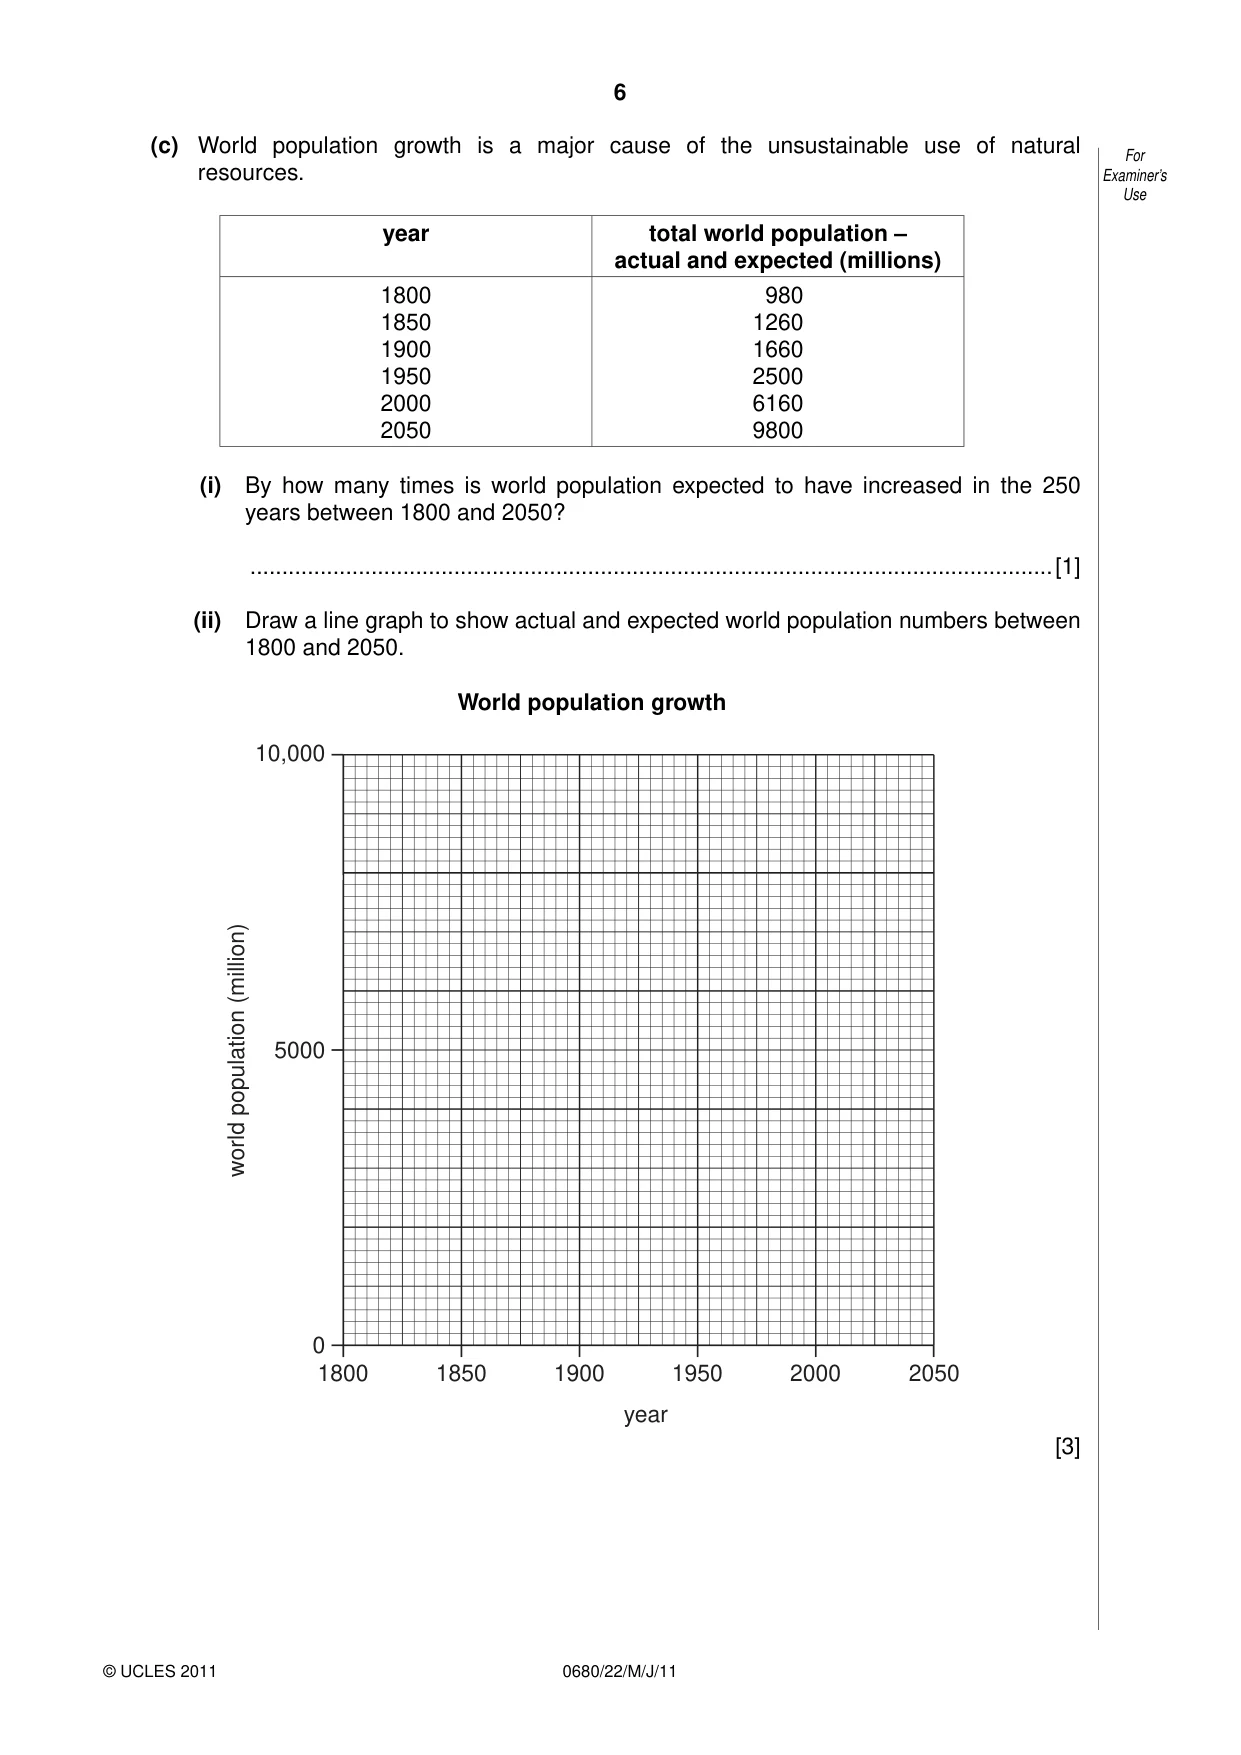
6 0680/22/M/J/11 © UCLES 2011 For Examiner’s Use (c) World population growth is a major cause of the unsustainable use of natural resources. year total world population – actual and expected (millions) 1800 1850 1900 1950 2000 2050 980 1260 1660 2500 6160 9800 (i) By how many times is world population expected to have increased in the 250 years between 1800 and 2050? …[1] (ii) Draw a line graph to show actual and expected world population numbers between 1800 and 2050. World population growth 10,000 world population (million) 0 5000 1800 1850 1900 year 1950 2000 2050 [3]
Question paper, page 7
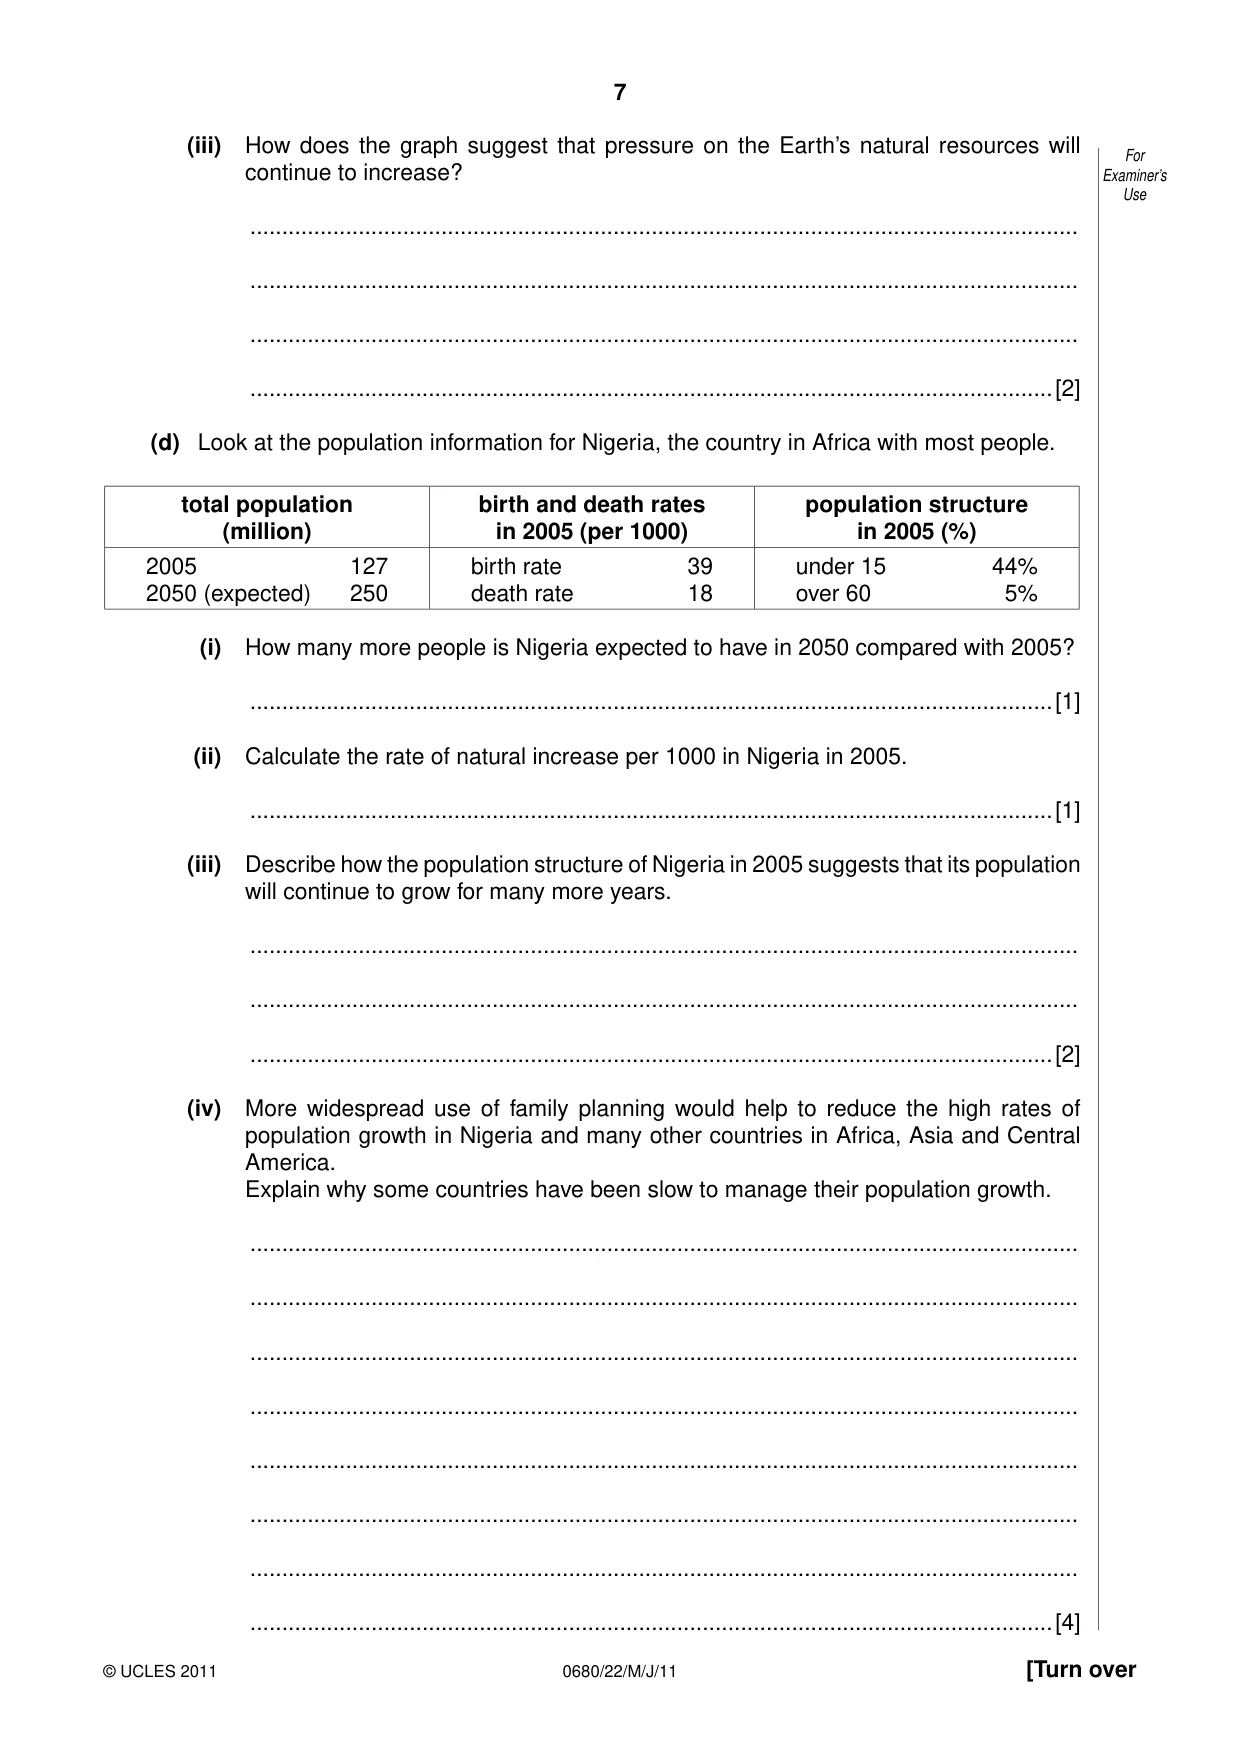
7 0680/22/M/J/11 © UCLES 2011 [Turn over For Examiner’s Use (iii) How does the graph suggest that pressure on the Earth’s natural resources will continue to increase? … … … …[2] (d) Look at the population information for Nigeria, the country in Africa with most people. total population (million) birth and death rates in 2005 (per 1000) population structure in 2005 (%) 2005 127 2050 (expected) 250 birth rate 39 death rate 18 under 15 44% over 60 5% (i) How many more people is Nigeria expected to have in 2050 compared with 2005? …[1] (ii) Calculate the rate of natural increase per 1000 in Nigeria in 2005. …[1] (iii) Describe how the population structure of Nigeria in 2005 suggests that its population will continue to grow for many more years. … … …[2] (iv) More widespread use of family planning would help to reduce the high rates of population growth in Nigeria and many other countries in Africa, Asia and Central America. Explain why some countries have been slow to manage their population growth. … … … … … … … …[4]
Question paper, page 8
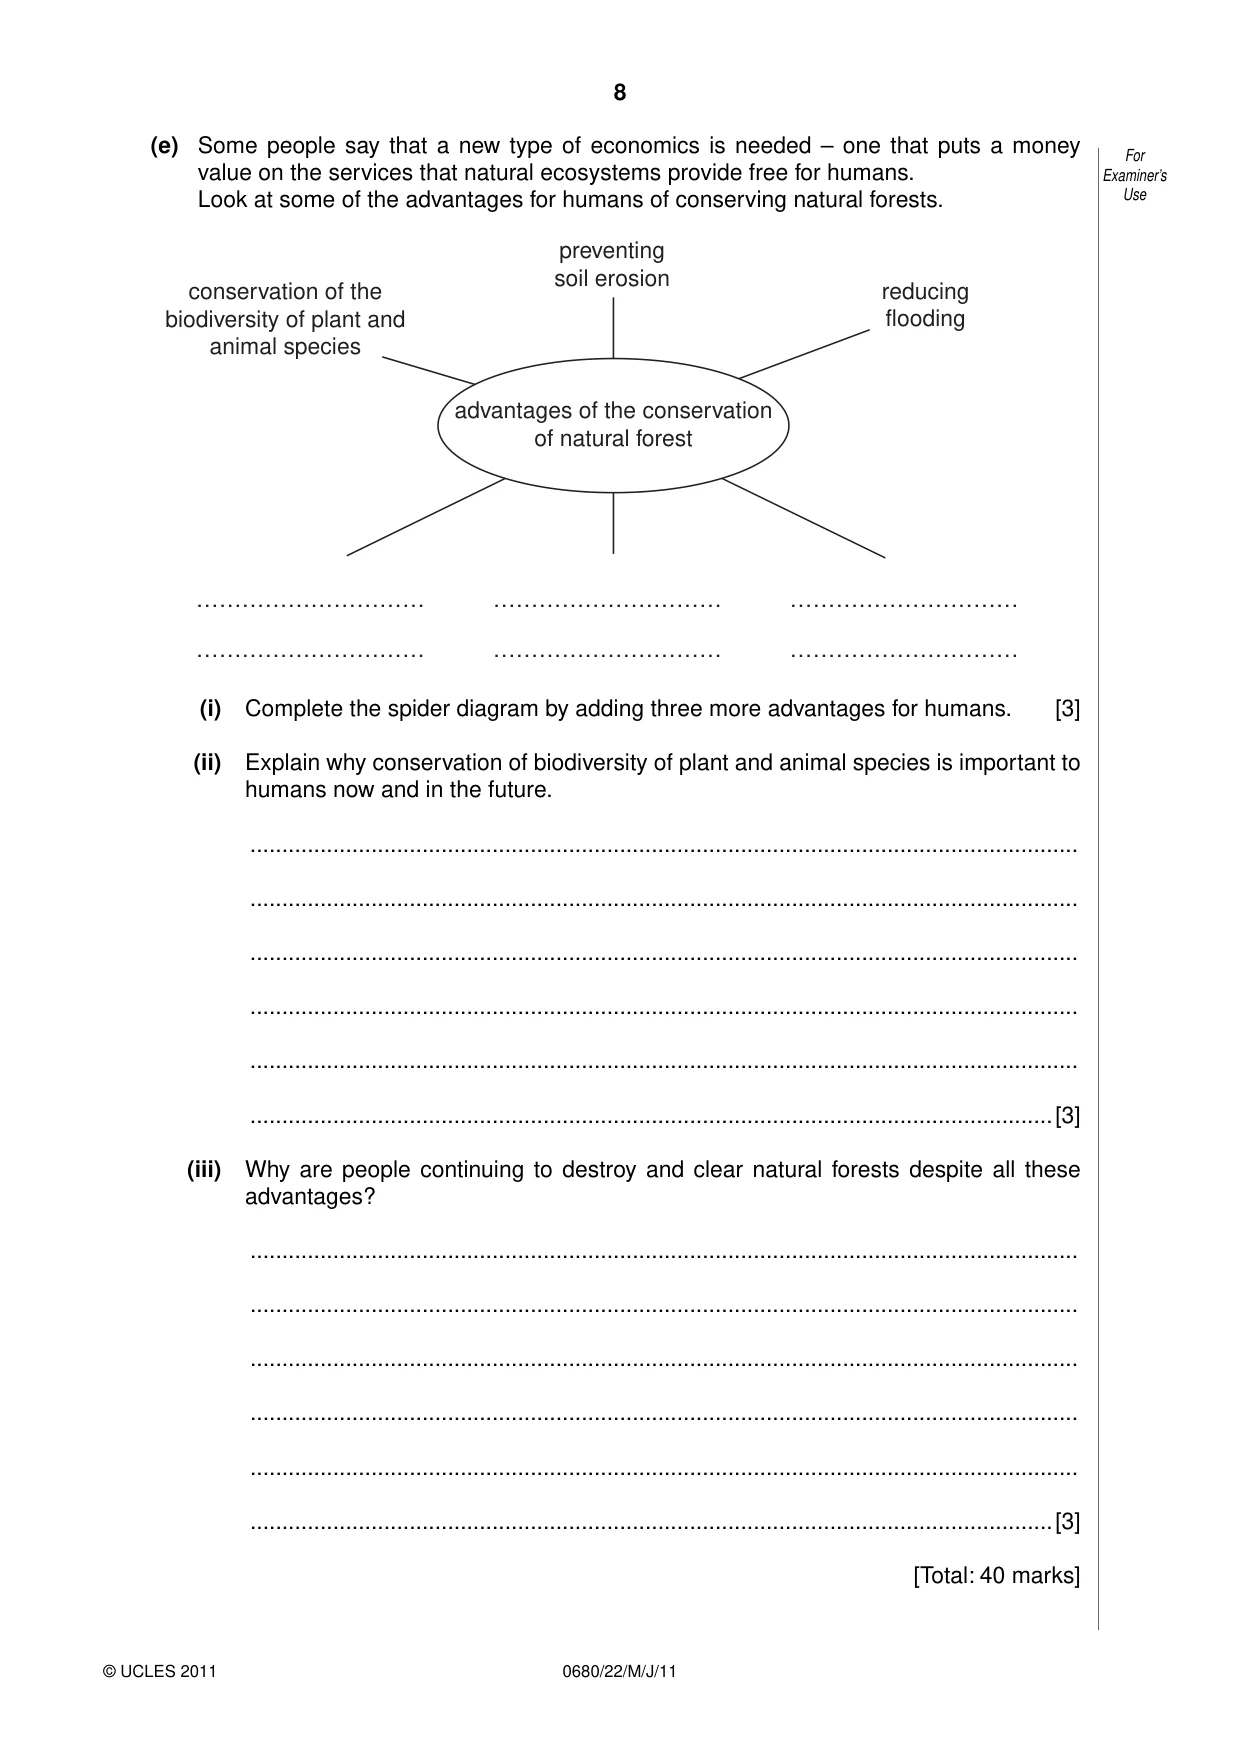
8 0680/22/M/J/11 © UCLES 2011 For Examiner’s Use (e) Some people say that a new type of economics is needed – one that puts a money value on the services that natural ecosystems provide free for humans. Look at some of the advantages for humans of conserving natural forests. advantages of the conservation of natural forest conservation of the biodiversity of plant and animal species preventing soil erosion reducing flooding ………………………… ………………………… ………………………… ………………………… ………………………… ………………………… (i) Complete the spider diagram by adding three more advantages for humans. [3] (ii) Explain why conservation of biodiversity of plant and animal species is important to humans now and in the future. … … … … … …[3] (iii) Why are people continuing to destroy and clear natural forests despite all these advantages? … … … … … …[3] [Total: 40 marks]
Question paper, page 9
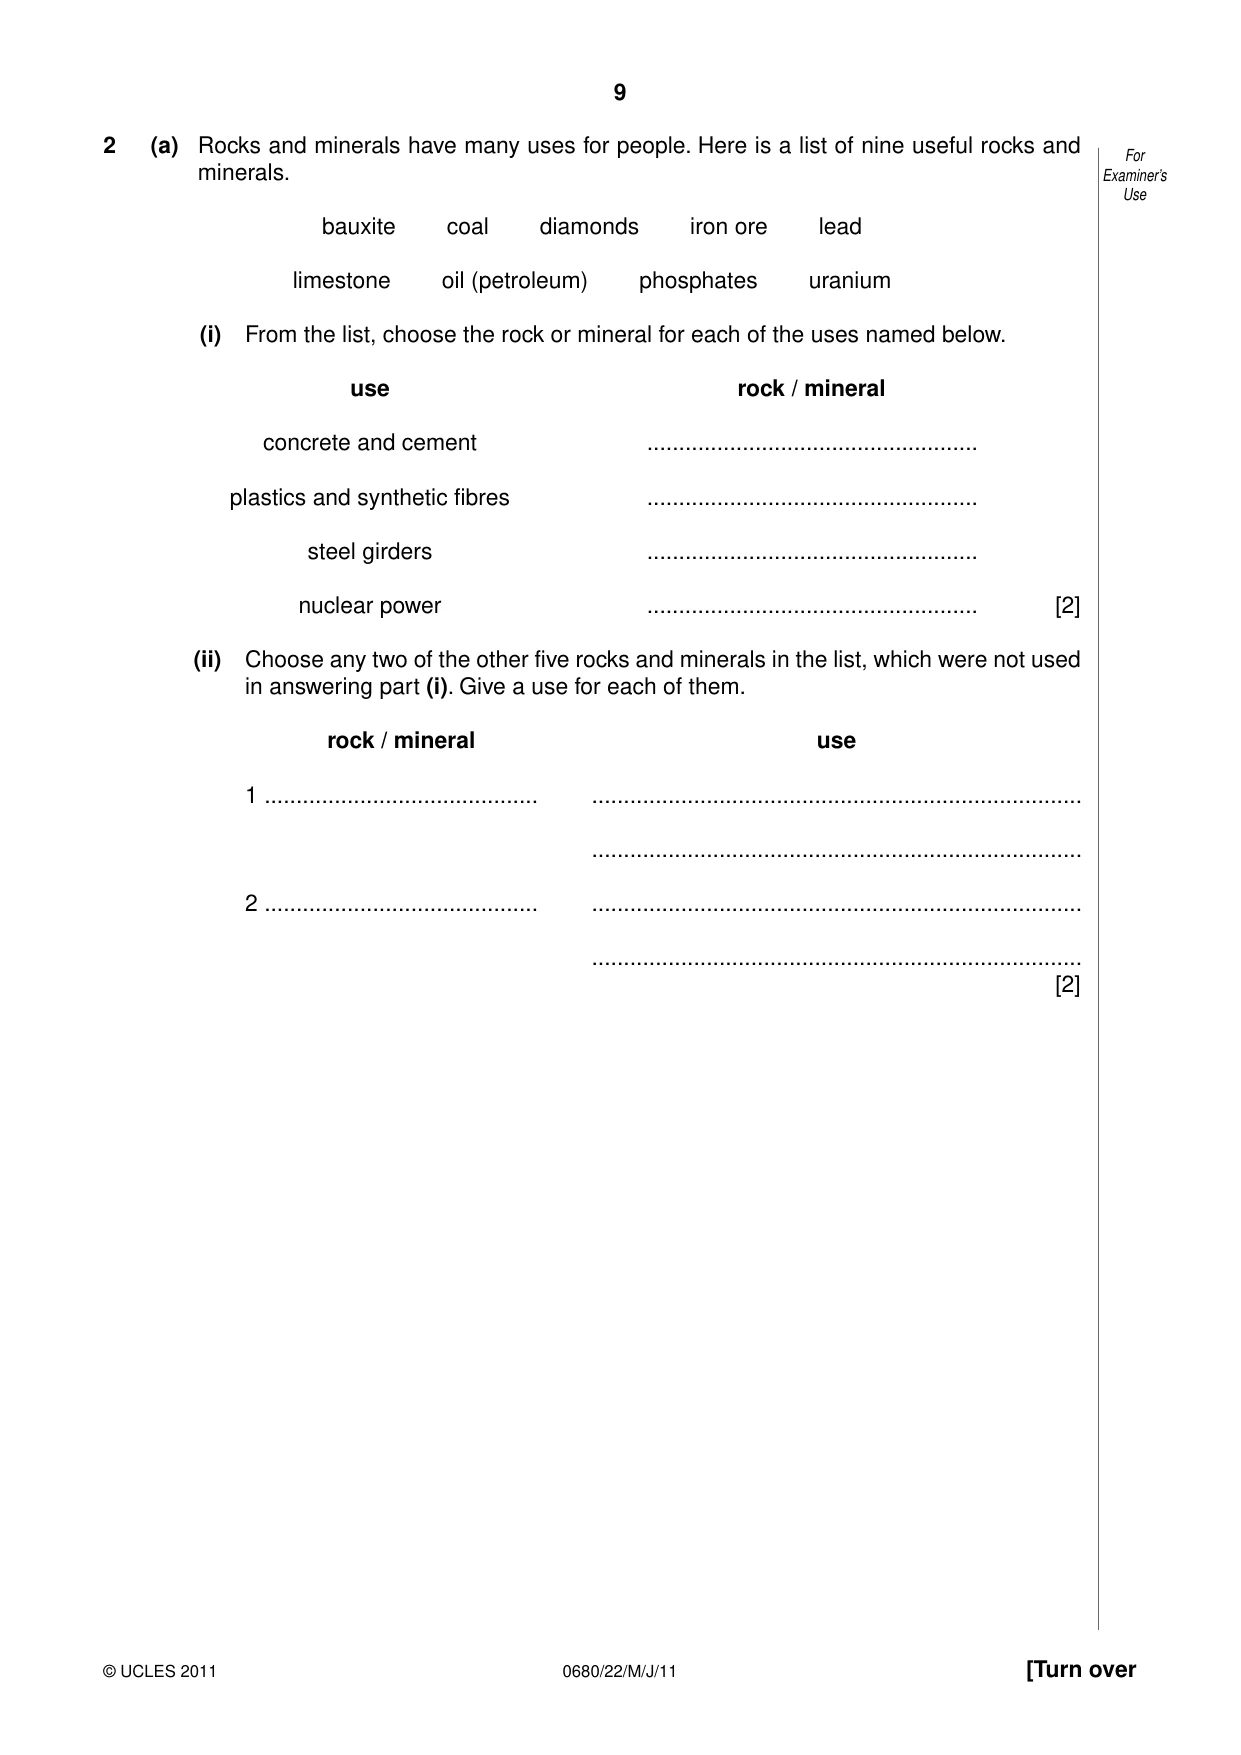
9 0680/22/M/J/11 © UCLES 2011 [Turn over For Examiner’s Use 2 (a) Rocks and minerals have many uses for people. Here is a list of nine useful rocks and minerals. bauxite coal diamonds iron ore lead limestone oil (petroleum) phosphates uranium (i) From the list, choose the rock or mineral for each of the uses named below. use rock / mineral concrete and cement … plastics and synthetic fibres … steel girders … nuclear power … [2] (ii) Choose any two of the other five rocks and minerals in the list, which were not used in answering part (i). Give a use for each of them. rock / mineral use 1 … … … 2 … … … [2]
Question paper, page 10
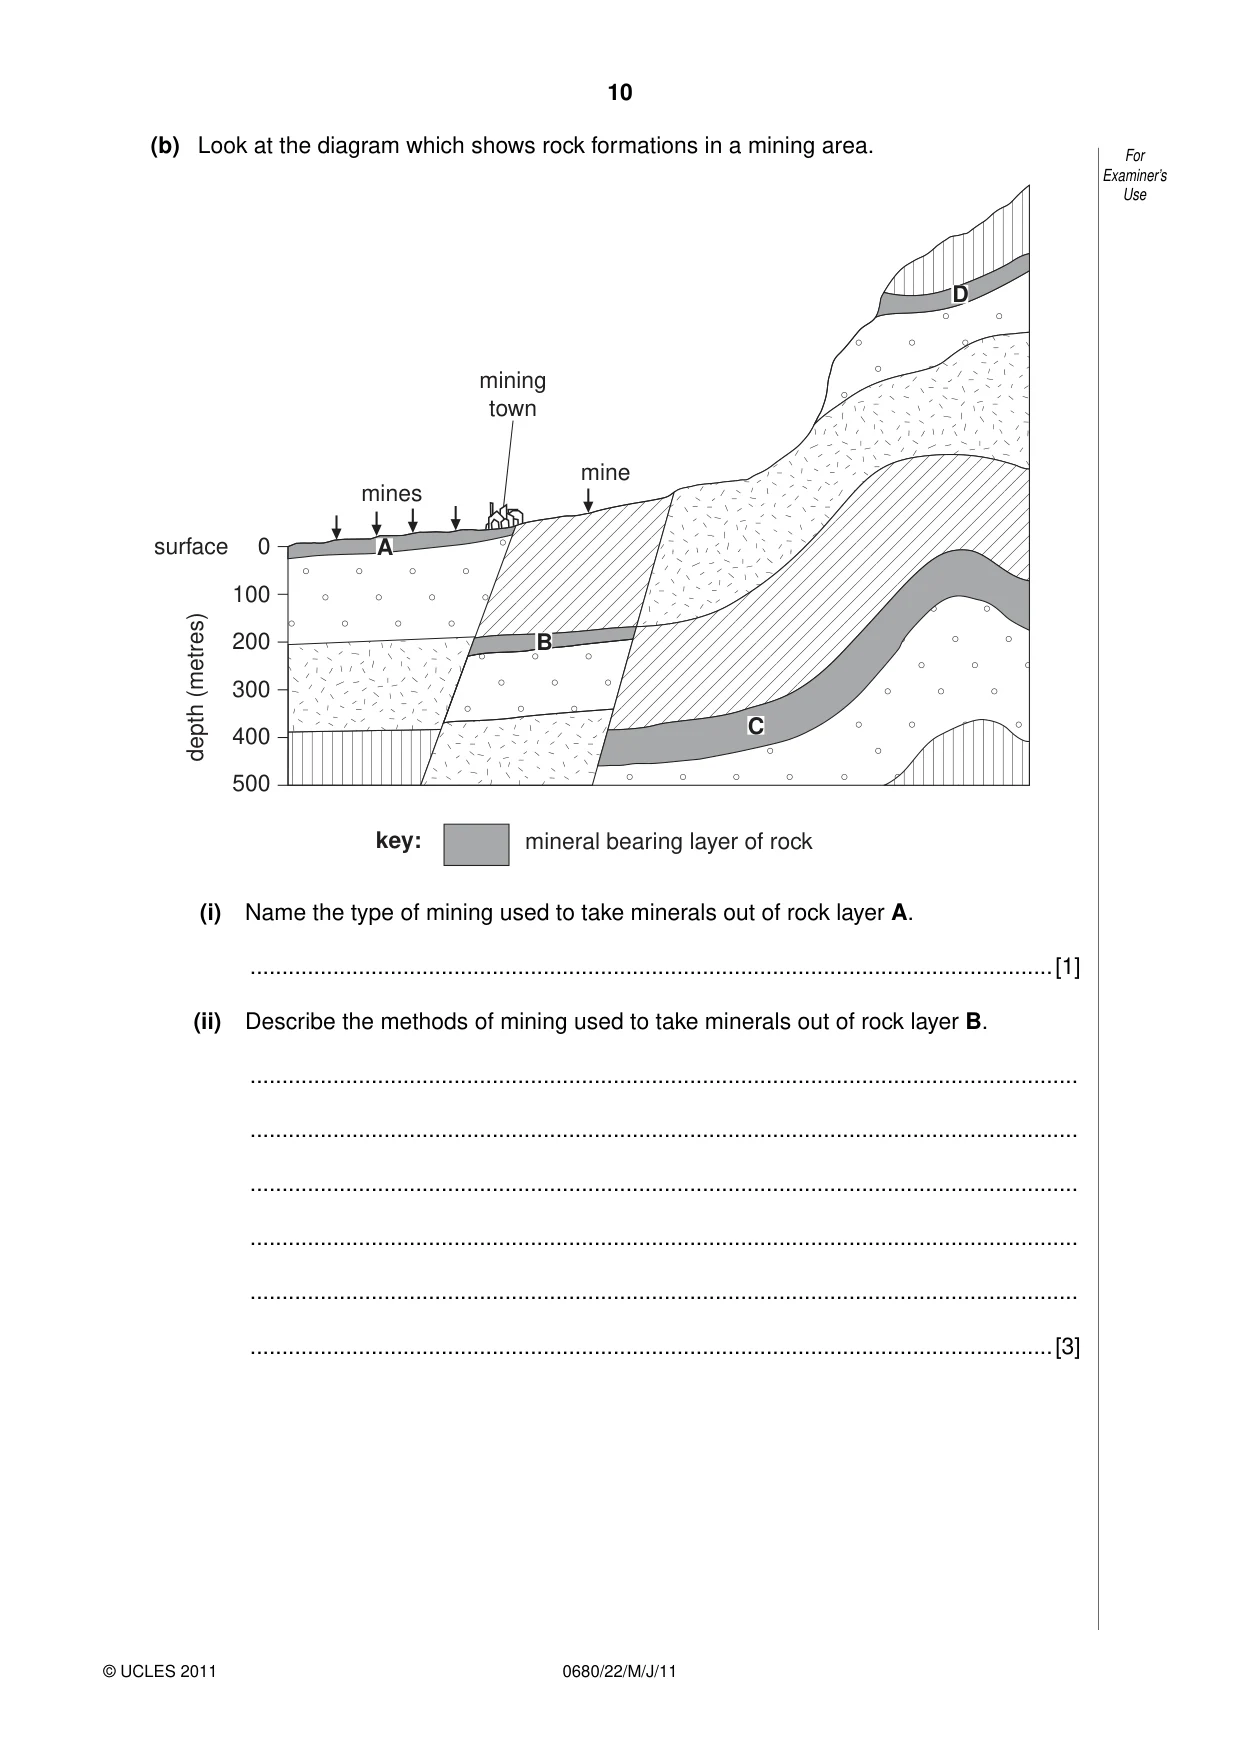
10 0680/22/M/J/11 © UCLES 2011 For Examiner’s Use (b) Look at the diagram which shows rock formations in a mining area. surface A B C D 100 0 200 300 400 500 depth (metres) key: mineral bearing layer of rock mines mine mining town (i) Name the type of mining used to take minerals out of rock layer A. …[1] (ii) Describe the methods of mining used to take minerals out of rock layer B. … … … … … …[3]
Question paper, page 11
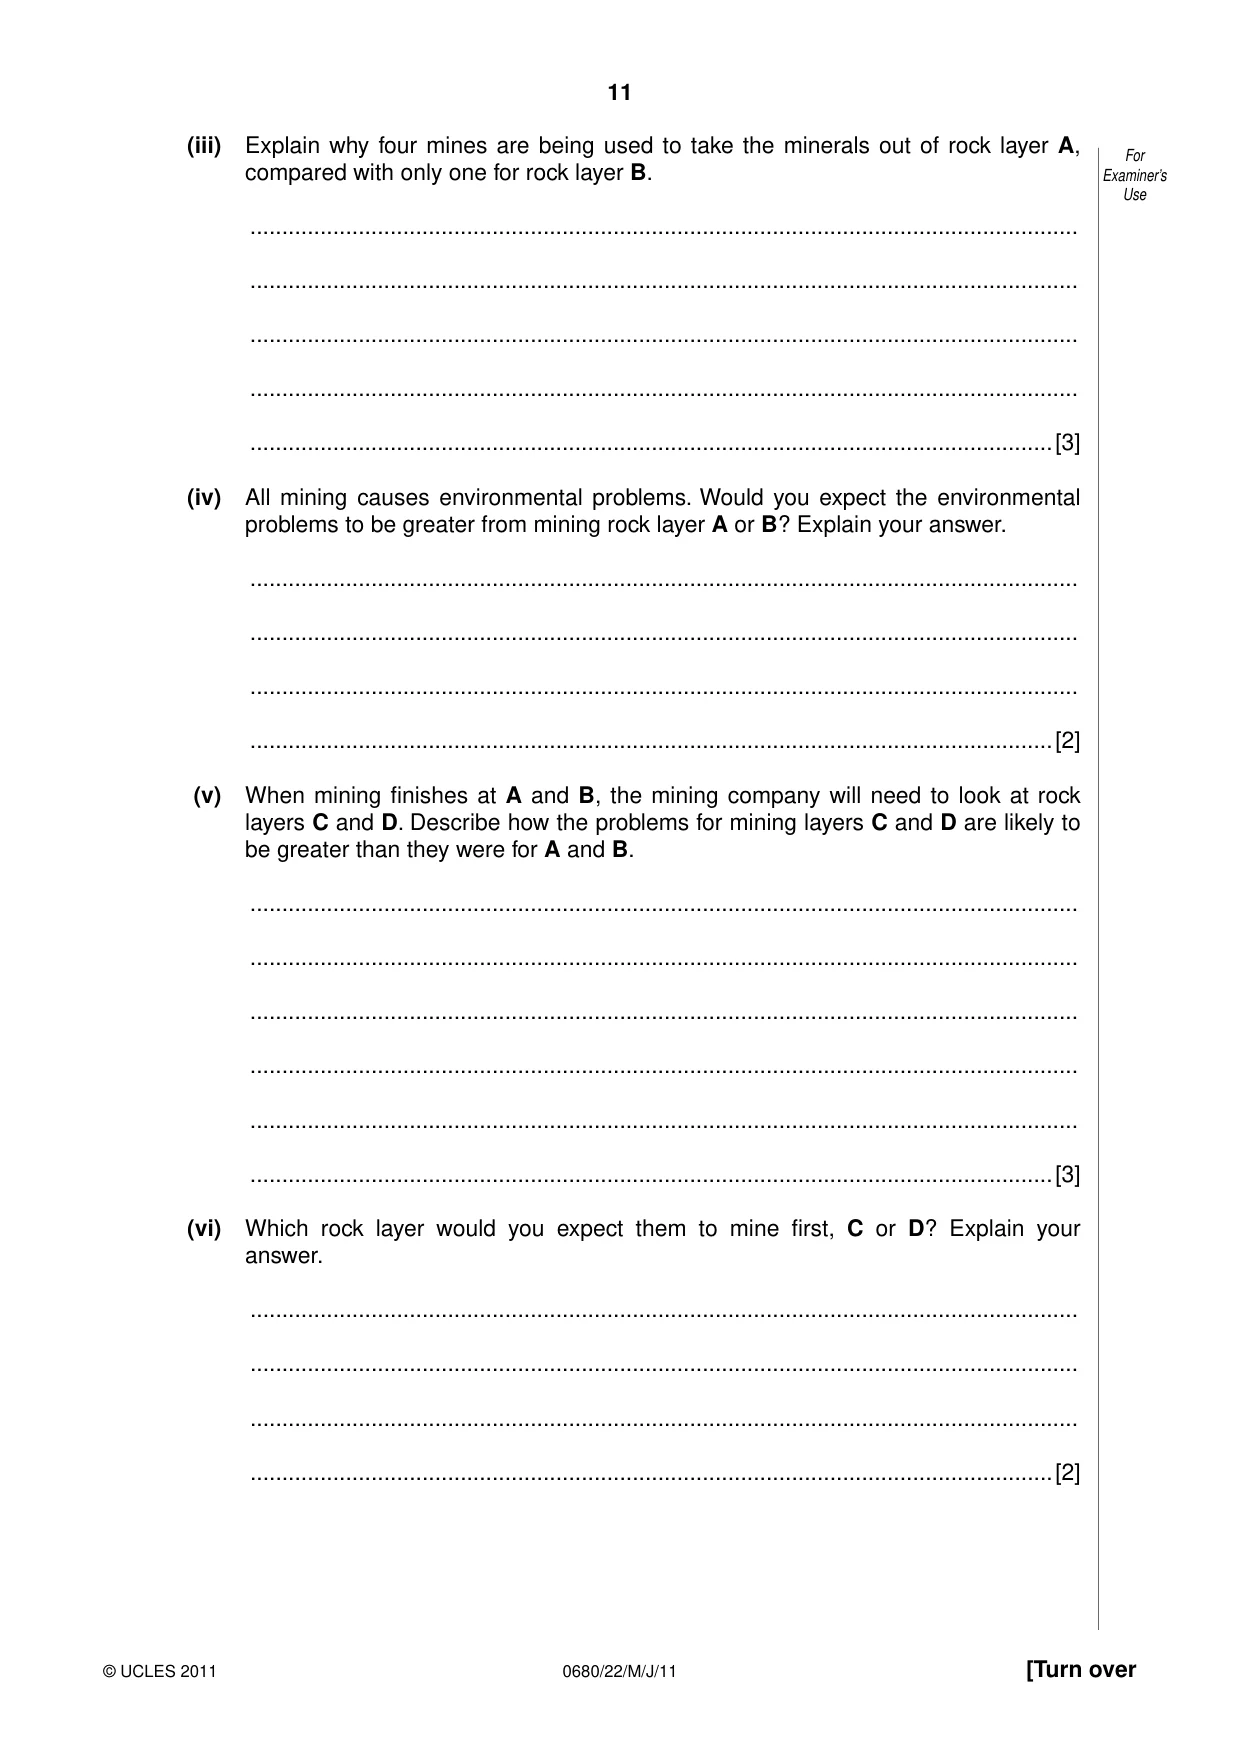
11 0680/22/M/J/11 © UCLES 2011 [Turn over For Examiner’s Use (iii) Explain why four mines are being used to take the minerals out of rock layer A, compared with only one for rock layer B. … … … … …[3] (iv) All mining causes environmental problems. Would you expect the environmental problems to be greater from mining rock layer A or B? Explain your answer. … … … …[2] (v) When mining finishes at A and B, the mining company will need to look at rock layers C and D. Describe how the problems for mining layers C and D are likely to be greater than they were for A and B. … … … … … …[3] (vi) Which rock layer would you expect them to mine first, C or D? Explain your answer. … … … …[2]
Question paper, page 12
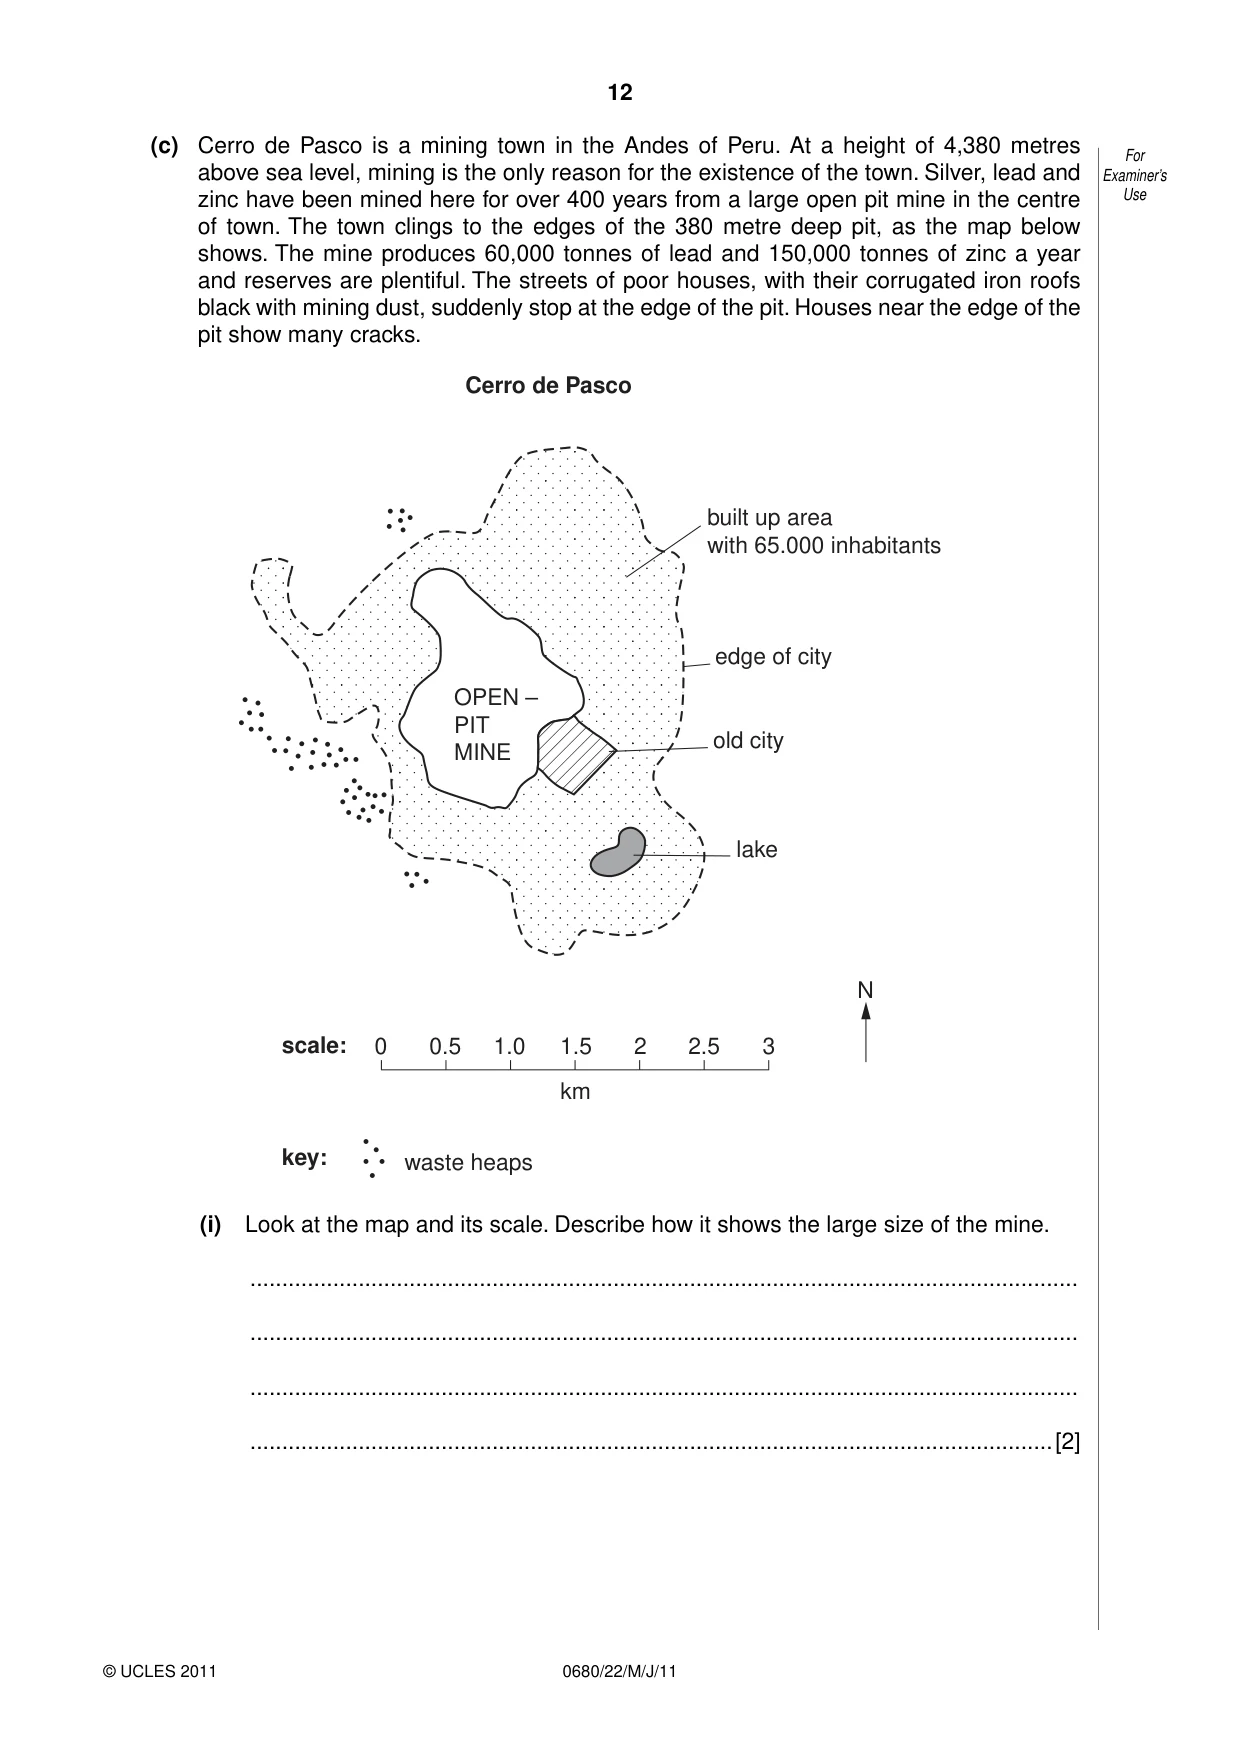
12 0680/22/M/J/11 © UCLES 2011 For Examiner’s Use (c) Cerro de Pasco is a mining town in the Andes of Peru. At a height of 4,380 metres above sea level, mining is the only reason for the existence of the town. Silver, lead and zinc have been mined here for over 400 years from a large open pit mine in the centre of town. The town clings to the edges of the 380 metre deep pit, as the map below shows. The mine produces 60,000 tonnes of lead and 150,000 tonnes of zinc a year and reserves are plentiful. The streets of poor houses, with their corrugated iron roofs black with mining dust, suddenly stop at the edge of the pit. Houses near the edge of the pit show many cracks. 0 0.5 1.0 1.5 2 2.5 3 N km waste heaps scale: key: Cerro de Pasco built up area with 65.000 inhabitants edge of city old city lake OPEN – PIT MINE (i) Look at the map and its scale. Describe how it shows the large size of the mine. … … … …[2]
Question paper, page 13
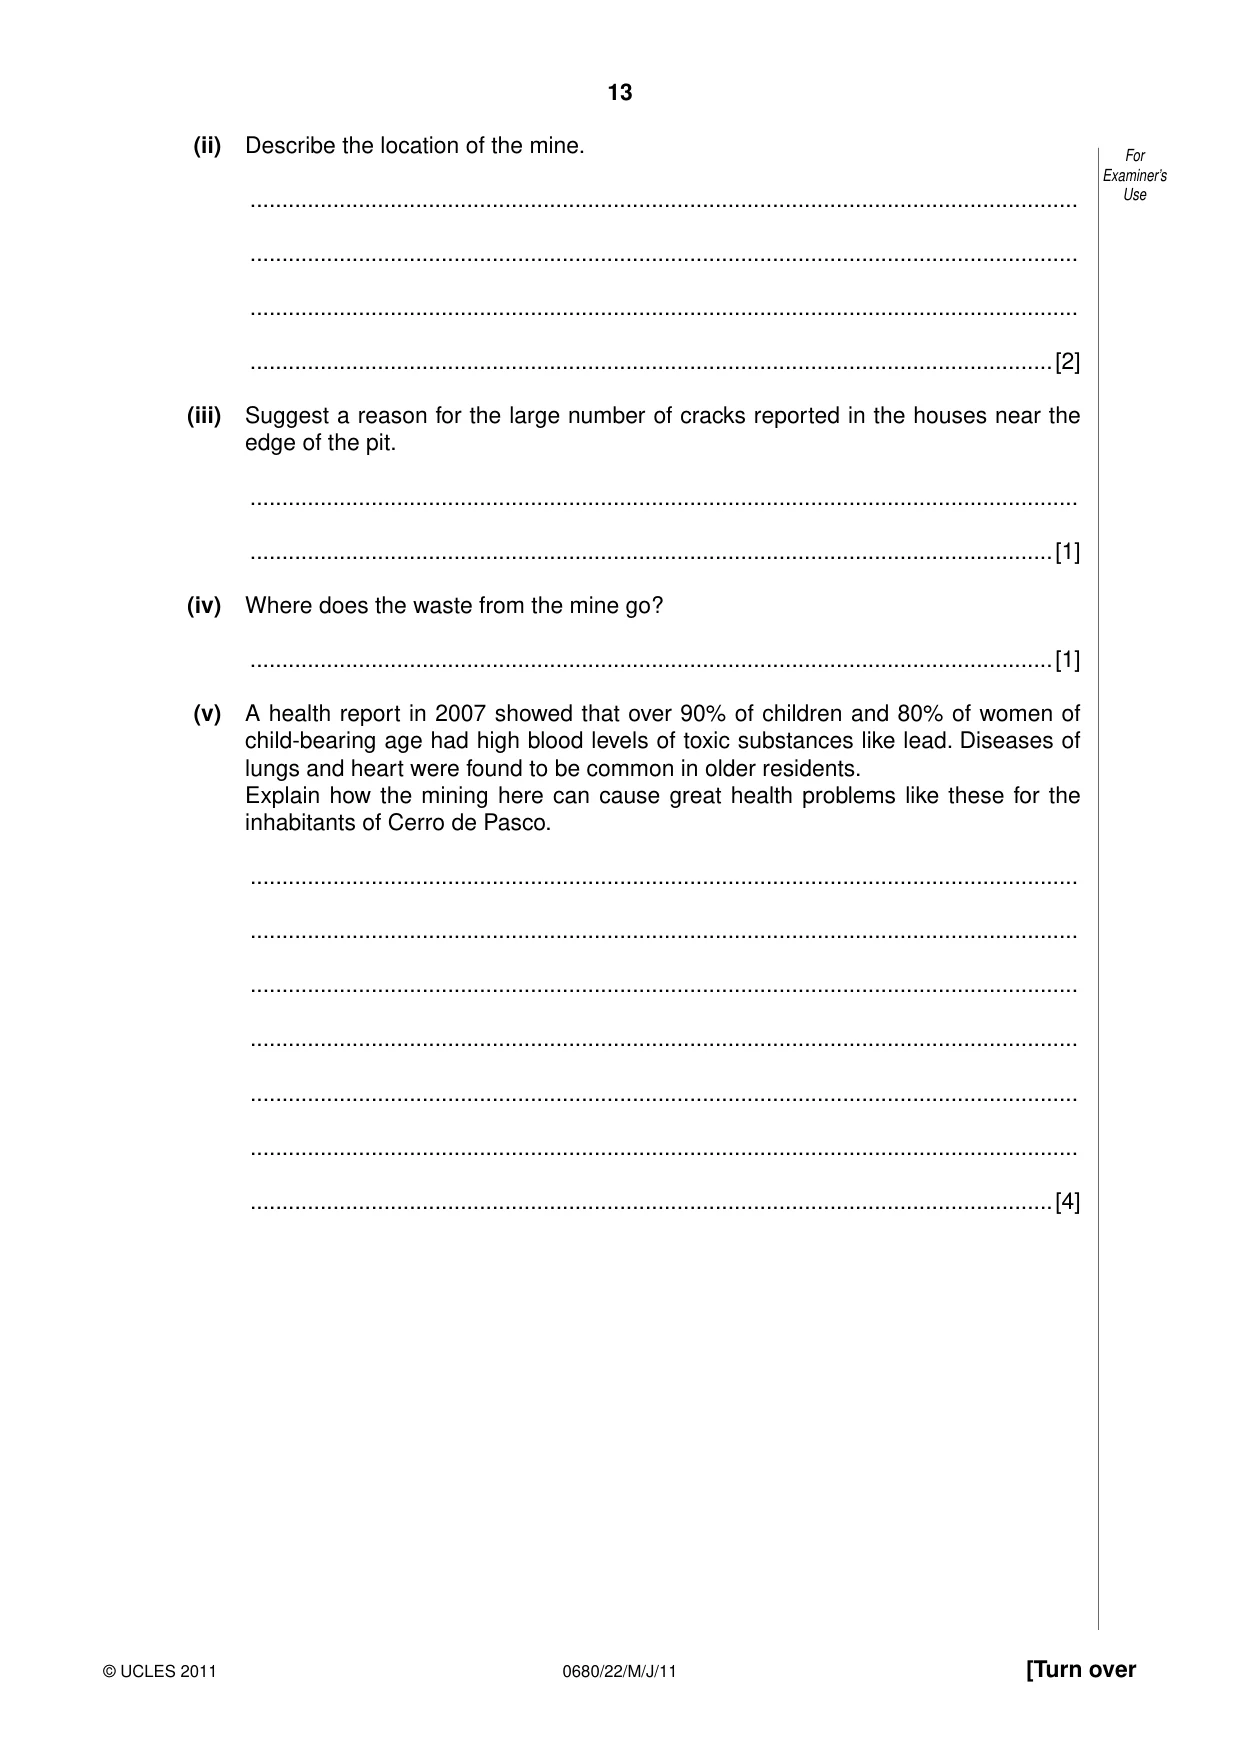
13 0680/22/M/J/11 © UCLES 2011 [Turn over For Examiner’s Use (ii) Describe the location of the mine. … … … …[2] (iii) Suggest a reason for the large number of cracks reported in the houses near the edge of the pit. … …[1] (iv) Where does the waste from the mine go? …[1] (v) A health report in 2007 showed that over 90% of children and 80% of women of child-bearing age had high blood levels of toxic substances like lead. Diseases of lungs and heart were found to be common in older residents. Explain how the mining here can cause great health problems like these for the inhabitants of Cerro de Pasco. … … … … … … …[4]
Question paper, page 14
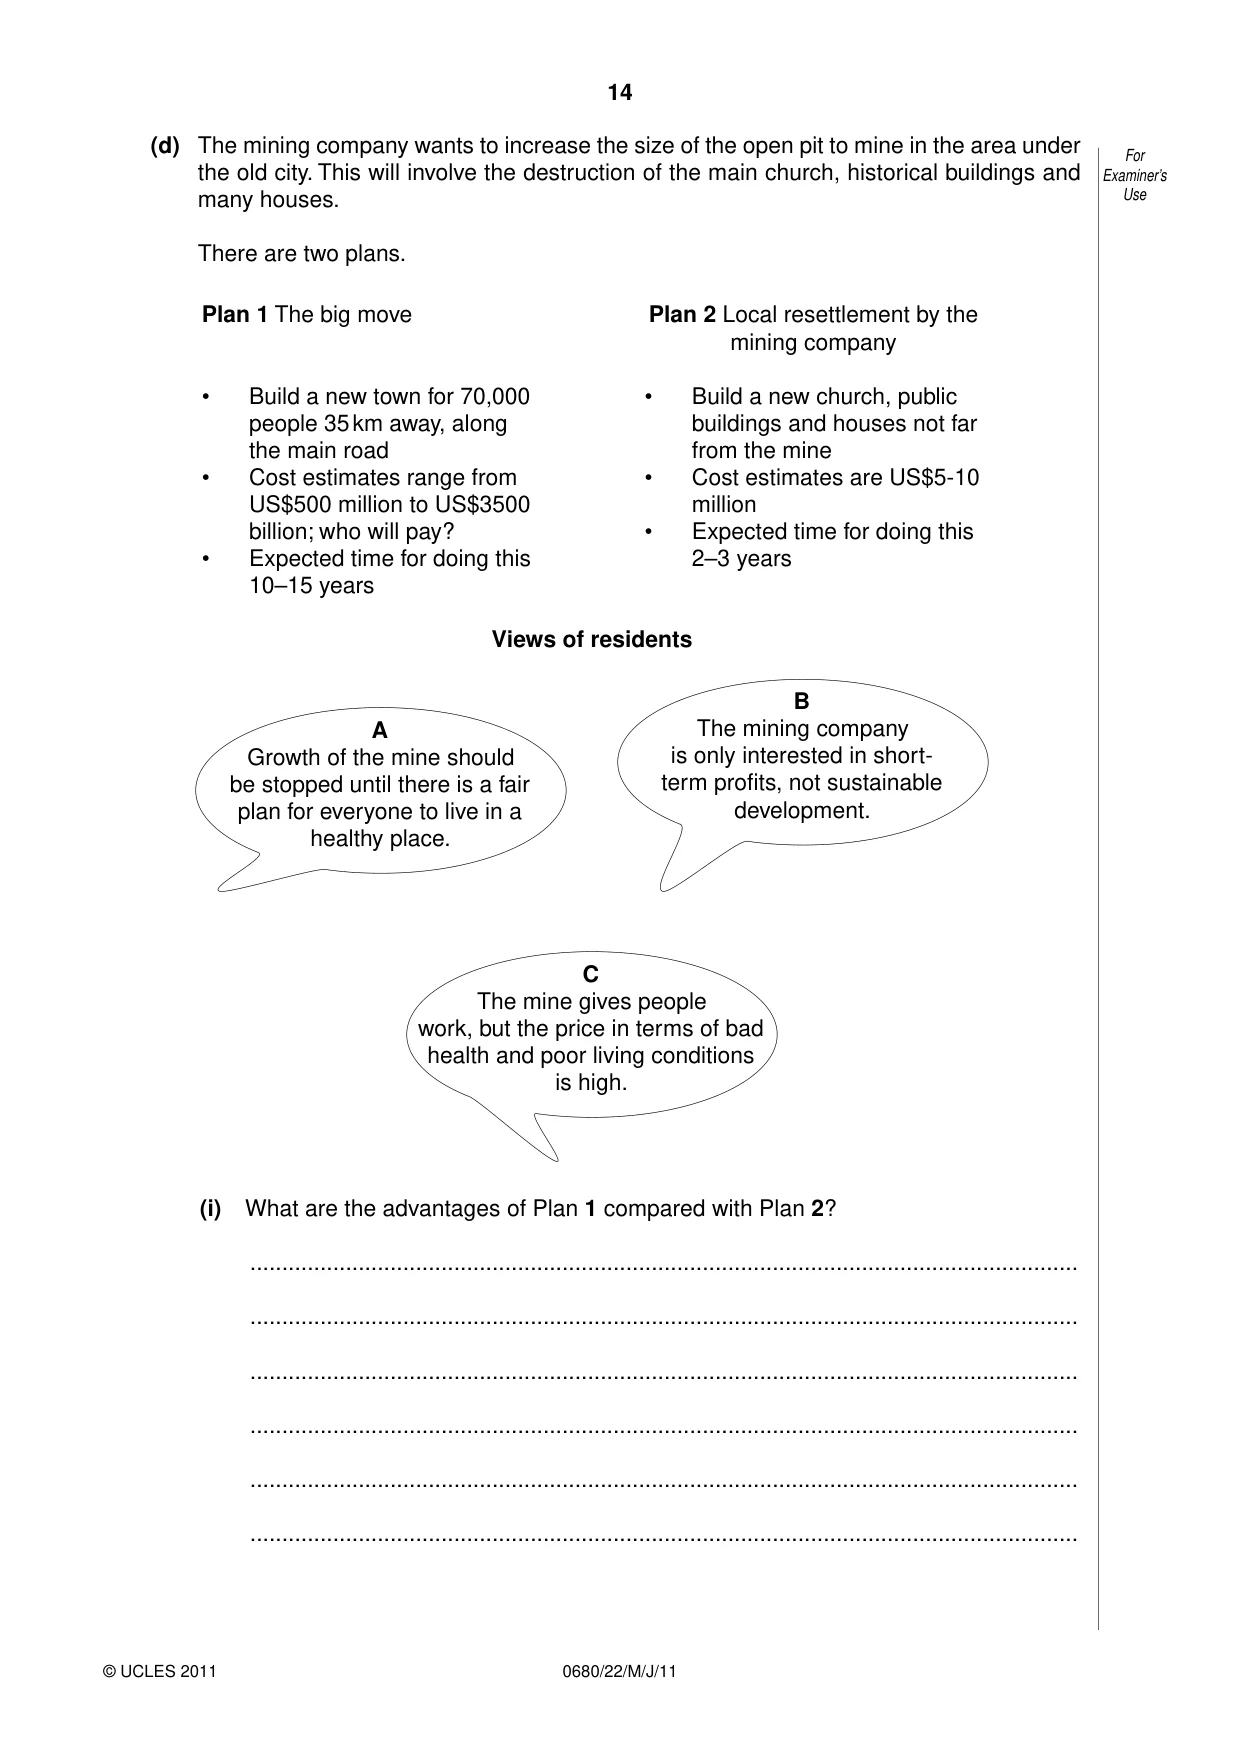
14 0680/22/M/J/11 © UCLES 2011 For Examiner’s Use (d) The mining company wants to increase the size of the open pit to mine in the area under the old city. This will involve the destruction of the main church, historical buildings and many houses. There are two plans. Plan 1 The big move • Build a new town for 70,000 people 35 km away, along the main road • Cost estimates range from US$500 million to US$3500 billion; who will pay? • Expected time for doing this 10–15 years Plan 2 Local resettlement by the mining company • Build a new church, public buildings and houses not far from the mine • Cost estimates are US$5-10 million • Expected time for doing this 2–3 years Views of residents A Growth of the mine should be stopped until there is a fair plan for everyone to live in a healthy place. B The mining company is only interested in short- term profits, not sustainable development. C The mine gives people work, but the price in terms of bad health and poor living conditions is high. (i) What are the advantages of Plan 1 compared with Plan 2? … … … … … …
Question paper, page 15
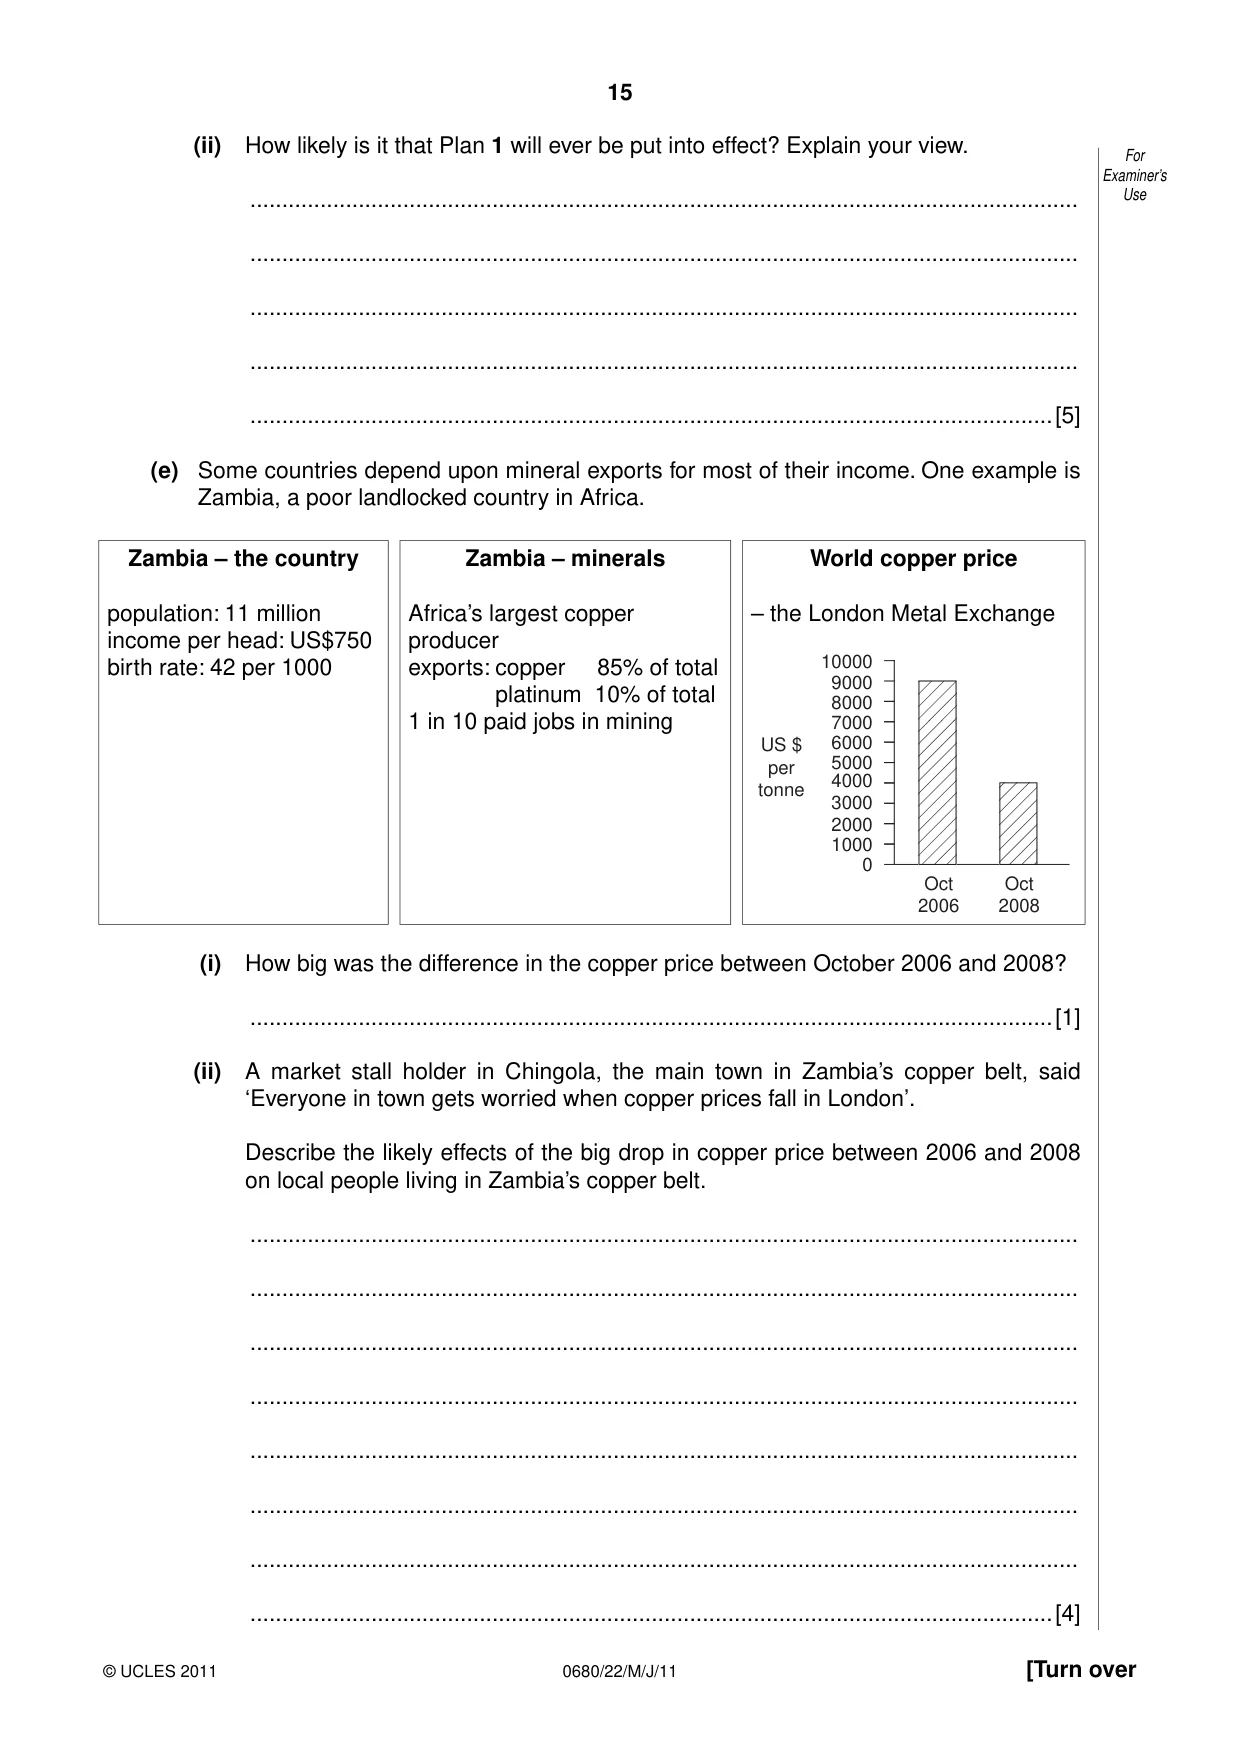
15 0680/22/M/J/11 © UCLES 2011 [Turn over For Examiner’s Use (ii) How likely is it that Plan 1 will ever be put into effect? Explain your view. … … … … …[5] (e) Some countries depend upon mineral exports for most of their income. One example is Zambia, a poor landlocked country in Africa. Zambia – the country population: 11 million income per head: US$750 birth rate: 42 per 1000 Zambia – minerals Africa’s largest copper producer exports: copper 85% of total platinum 10% of total 1 in 10 paid jobs in mining World copper price – the London Metal Exchange 10000 9000 8000 7000 6000 5000 4000 2000 1000 3000 0 Oct 2006 Oct 2008 US $ per tonne (i) How big was the difference in the copper price between October 2006 and 2008? …[1] (ii) A market stall holder in Chingola, the main town in Zambia’s copper belt, said ‘Everyone in town gets worried when copper prices fall in London’. Describe the likely effects of the big drop in copper price between 2006 and 2008 on local people living in Zambia’s copper belt. … … … … … … … …[4]
Question paper, page 16
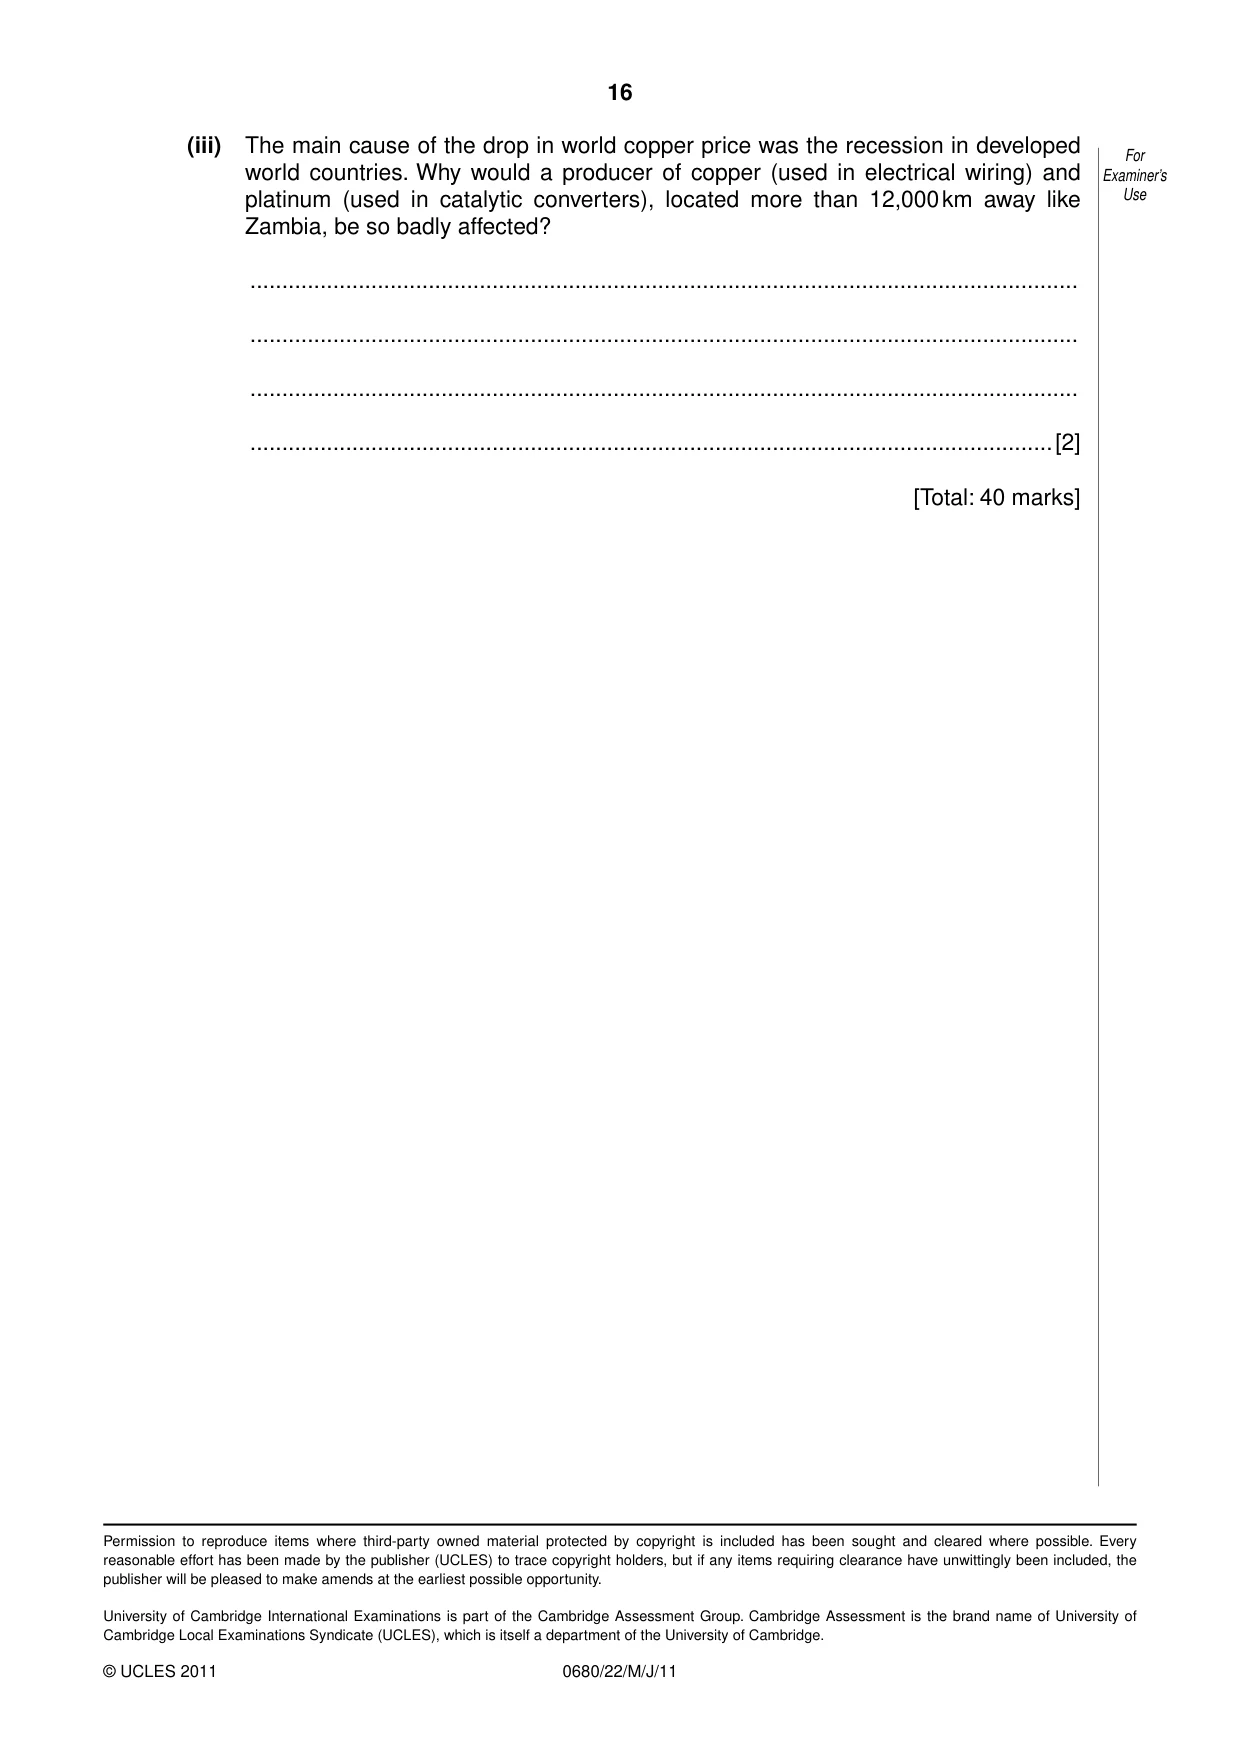
16 0680/22/M/J/11 © UCLES 2011 For Examiner’s Use (iii) The main cause of the drop in world copper price was the recession in developed world countries. Why would a producer of copper (used in electrical wiring) and platinum (used in catalytic converters), located more than 12,000 km away like Zambia, be so badly affected? … … … …[2] [Total: 40 marks] Permission to reproduce items where third-party owned material protected by copyright is included has been sought and cleared where possible. Every reasonable effort has been made by the publisher (UCLES) to trace copyright holders, but if any items requiring clearance have unwittingly been included, the publisher will be pleased to make amends at the earliest possible opportunity. University of Cambridge International Examinations is part of the Cambridge Assessment Group. Cambridge Assessment is the brand name of University of Cambridge Local Examinations Syndicate (UCLES), which is itself a department of the University of Cambridge.
Mark scheme, page 1
UNIVERSITY OF CAMBRIDGE INTERNATIONAL EXAMINATIONS International General Certificate of Secondary Education MARK SCHEME for the May/June 2011 question paper for the guidance of teachers 0680 ENVIRONMENTAL MANAGEMENT 0680/22 Paper 2, maximum raw mark 80 This mark scheme is published as an aid to teachers and candidates, to indicate the requirements of the examination. It shows the basis on which Examiners were instructed to award marks. It does not indicate the details of the discussions that took place at an Examiners’ meeting before marking began, which would have considered the acceptability of alternative answers. Mark schemes must be read in conjunction with the question papers and the report on the examination. • Cambridge will not enter into discussions or correspondence in connection with these mark schemes. Cambridge is publishing the mark schemes for the May/June 2011 question papers for most IGCSE, GCE Advanced Level and Advanced Subsidiary Level syllabuses and some Ordinary Level syllabuses. www.XtremePapers.com
Mark scheme, page 2
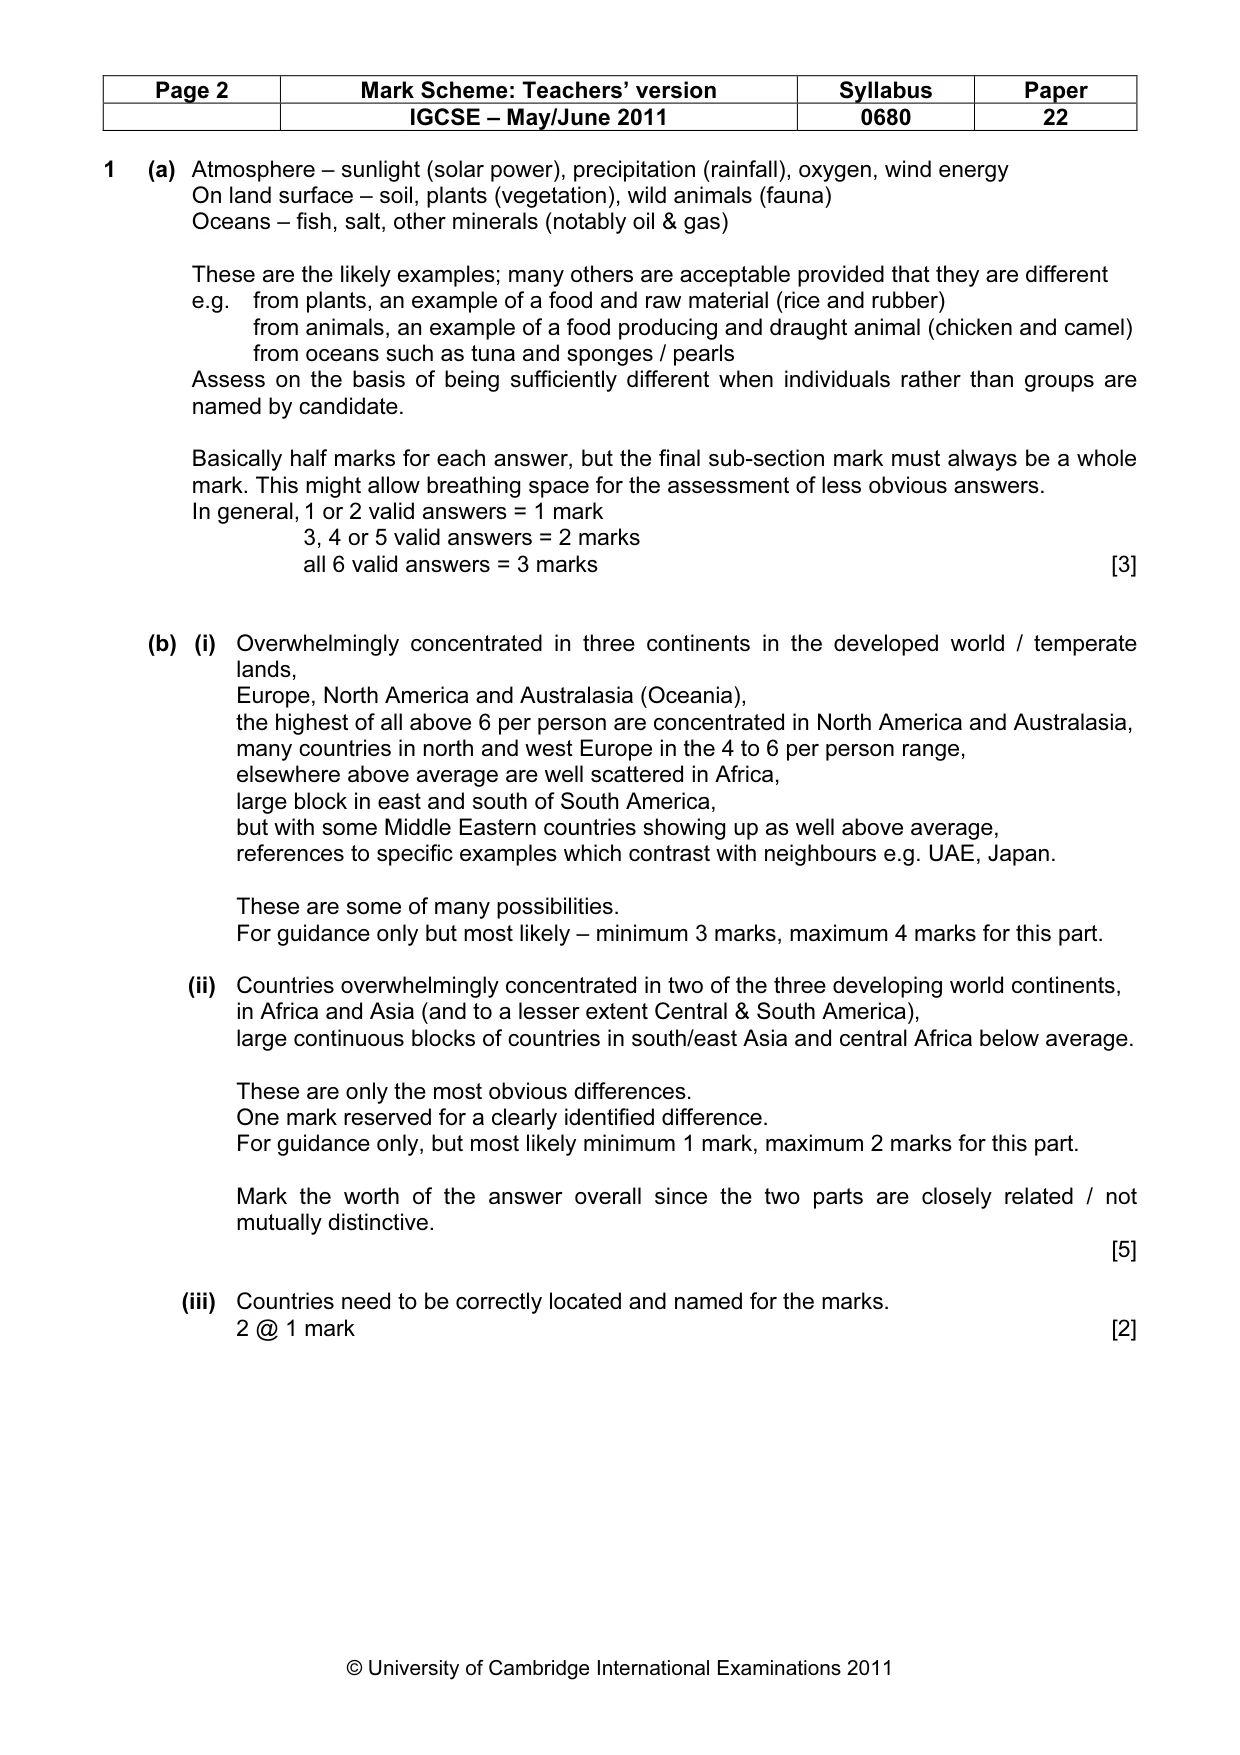
Page 2 Mark Scheme: Teachers’ version Syllabus Paper IGCSE – May/June 2011 0680 22 © University of Cambridge International Examinations 2011 1 (a) Atmosphere – sunlight (solar power), precipitation (rainfall), oxygen, wind energy On land surface – soil, plants (vegetation), wild animals (fauna) Oceans – fish, salt, other minerals (notably oil & gas) These are the likely examples; many others are acceptable provided that they are different e.g. from plants, an example of a food and raw material (rice and rubber) from animals, an example of a food producing and draught animal (chicken and camel) from oceans such as tuna and sponges / pearls Assess on the basis of being sufficiently different when individuals rather than groups are named by candidate. Basically half marks for each answer, but the final sub-section mark must always be a whole mark. This might allow breathing space for the assessment of less obvious answers. In general, 1 or 2 valid answers = 1 mark 3, 4 or 5 valid answers = 2 marks all 6 valid answers = 3 marks [3] (b) (i) Overwhelmingly concentrated in three continents in the developed world / temperate lands, Europe, North America and Australasia (Oceania), the highest of all above 6 per person are concentrated in North America and Australasia, many countries in north and west Europe in the 4 to 6 per person range, elsewhere above average are well scattered in Africa, large block in east and south of South America, but with some Middle Eastern countries showing up as well above average, references to specific examples which contrast with neighbours e.g. UAE, Japan. These are some of many possibilities. For guidance only but most likely – minimum 3 marks, maximum 4 marks for this part. (ii) Countries overwhelmingly concentrated in two of the three developing world continents, in Africa and Asia (and to a lesser extent Central & South America), large continuous blocks of countries in south/east Asia and central Africa below average. These are only the most obvious differences. One mark reserved for a clearly identified difference. For guidance only, but most likely minimum 1 mark, maximum 2 marks for this part. Mark the worth of the answer overall since the two parts are closely related / not mutually distinctive. [5] (iii) Countries need to be correctly located and named for the marks. 2 @ 1 mark [2]
Mark scheme, page 3
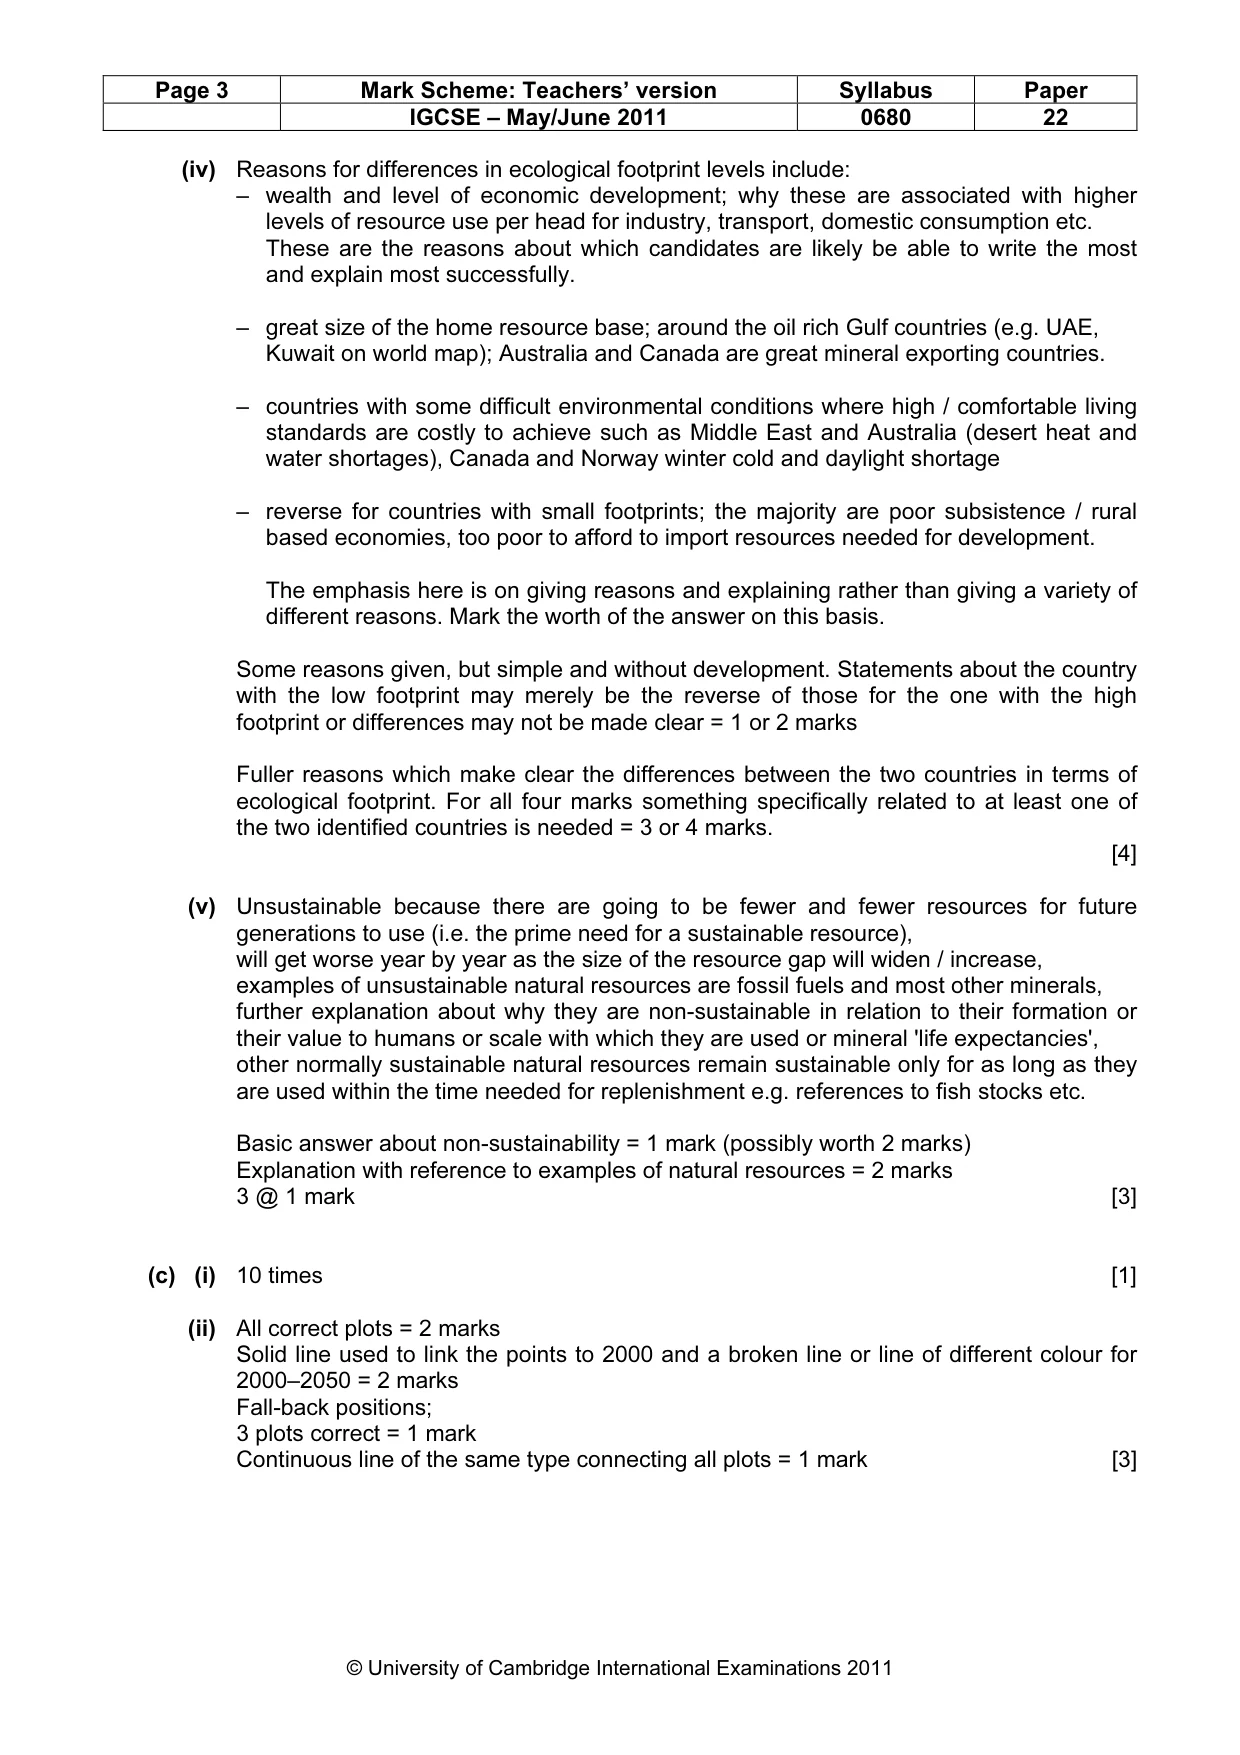
Page 3 Mark Scheme: Teachers’ version Syllabus Paper IGCSE – May/June 2011 0680 22 © University of Cambridge International Examinations 2011 (iv) Reasons for differences in ecological footprint levels include: – wealth and level of economic development; why these are associated with higher levels of resource use per head for industry, transport, domestic consumption etc. These are the reasons about which candidates are likely be able to write the most and explain most successfully. – great size of the home resource base; around the oil rich Gulf countries (e.g. UAE, Kuwait on world map); Australia and Canada are great mineral exporting countries. – countries with some difficult environmental conditions where high / comfortable living standards are costly to achieve such as Middle East and Australia (desert heat and water shortages), Canada and Norway winter cold and daylight shortage – reverse for countries with small footprints; the majority are poor subsistence / rural based economies, too poor to afford to import resources needed for development. The emphasis here is on giving reasons and explaining rather than giving a variety of different reasons. Mark the worth of the answer on this basis. Some reasons given, but simple and without development. Statements about the country with the low footprint may merely be the reverse of those for the one with the high footprint or differences may not be made clear = 1 or 2 marks Fuller reasons which make clear the differences between the two countries in terms of ecological footprint. For all four marks something specifically related to at least one of the two identified countries is needed = 3 or 4 marks. [4] (v) Unsustainable because there are going to be fewer and fewer resources for future generations to use (i.e. the prime need for a sustainable resource), will get worse year by year as the size of the resource gap will widen / increase, examples of unsustainable natural resources are fossil fuels and most other minerals, further explanation about why they are non-sustainable in relation to their formation or their value to humans or scale with which they are used or mineral 'life expectancies', other normally sustainable natural resources remain sustainable only for as long as they are used within the time needed for replenishment e.g. references to fish stocks etc. Basic answer about non-sustainability = 1 mark (possibly worth 2 marks) Explanation with reference to examples of natural resources = 2 marks 3 @ 1 mark [3] (c) (i) 10 times [1] (ii) All correct plots = 2 marks Solid line used to link the points to 2000 and a broken line or line of different colour for 2000–2050 = 2 marks Fall-back positions; 3 plots correct = 1 mark Continuous line of the same type connecting all plots = 1 mark [3]
Mark scheme, page 4
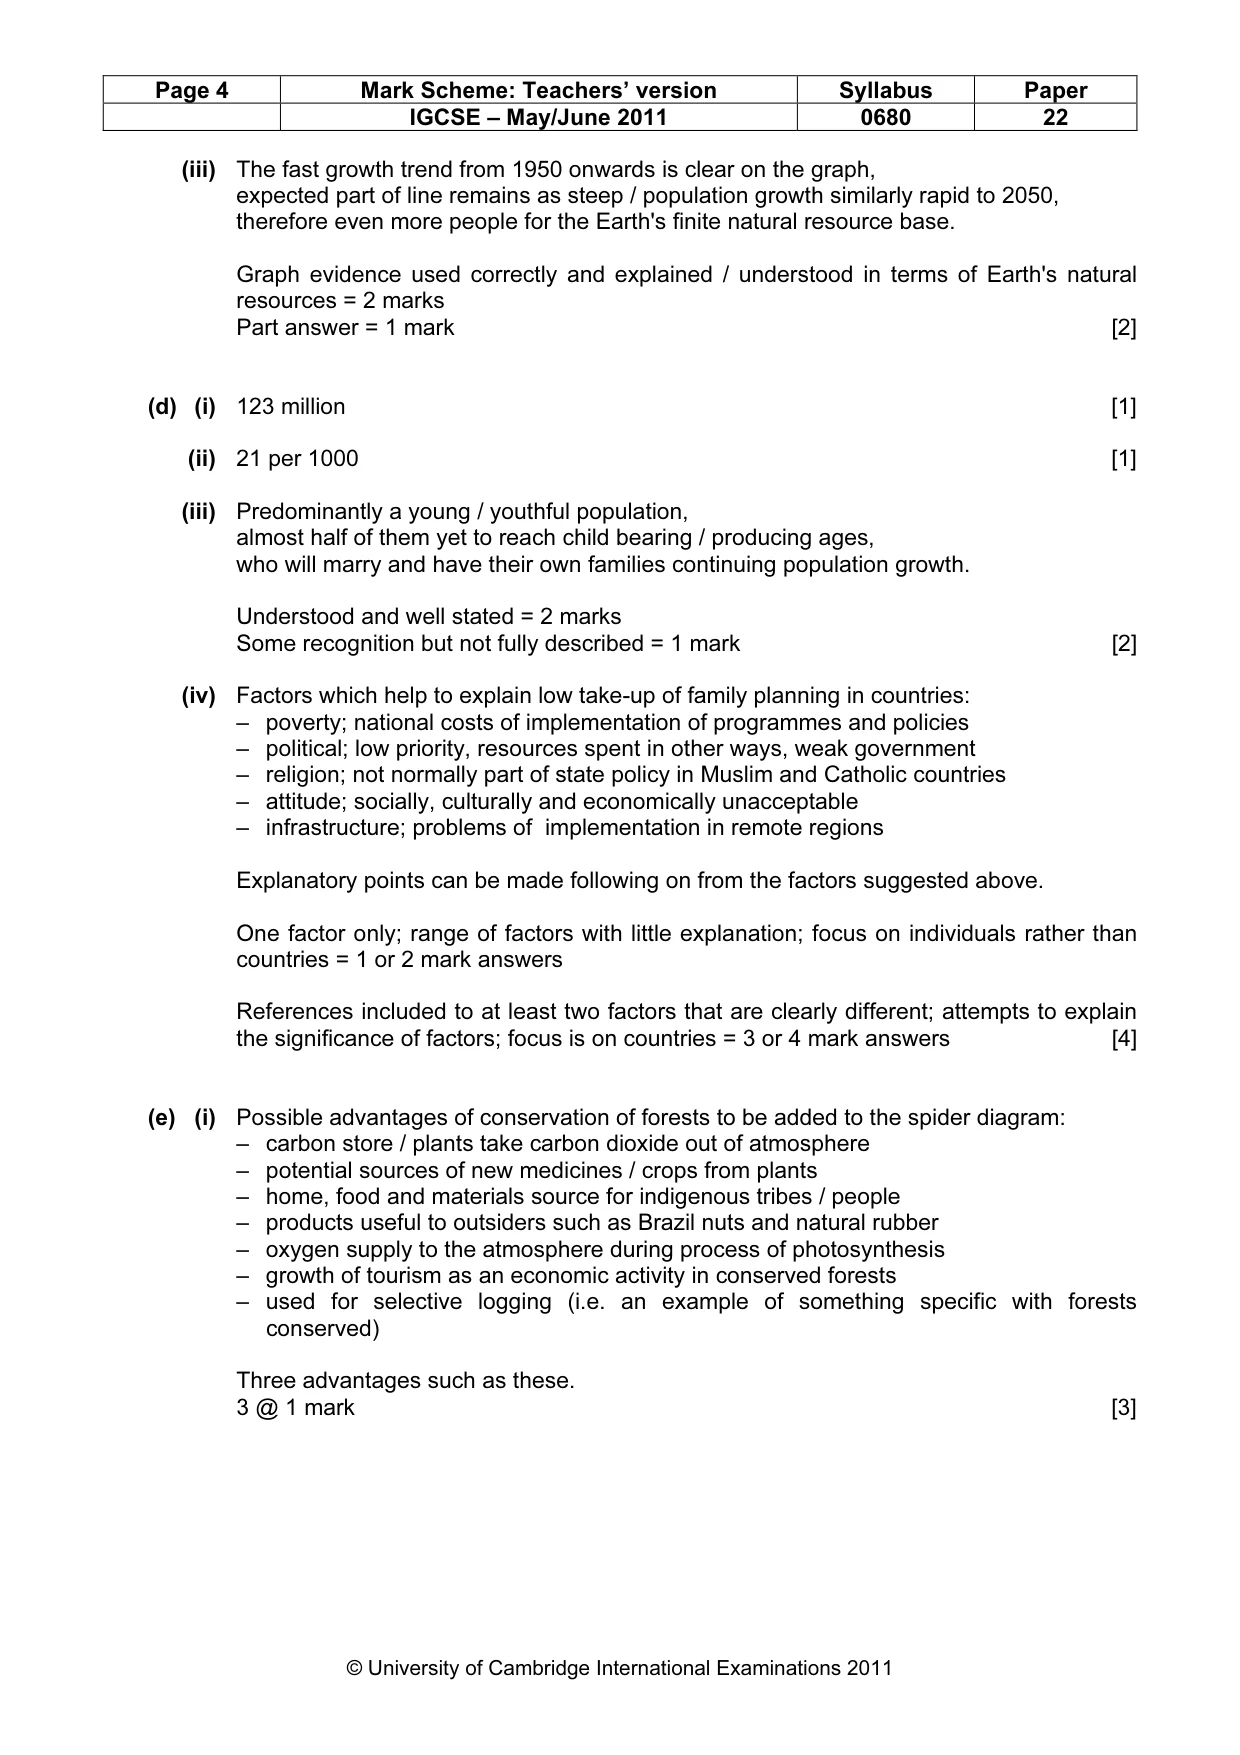
Page 4 Mark Scheme: Teachers’ version Syllabus Paper IGCSE – May/June 2011 0680 22 © University of Cambridge International Examinations 2011 (iii) The fast growth trend from 1950 onwards is clear on the graph, expected part of line remains as steep / population growth similarly rapid to 2050, therefore even more people for the Earth's finite natural resource base. Graph evidence used correctly and explained / understood in terms of Earth's natural resources = 2 marks Part answer = 1 mark [2] (d) (i) 123 million [1] (ii) 21 per 1000 [1] (iii) Predominantly a young / youthful population, almost half of them yet to reach child bearing / producing ages, who will marry and have their own families continuing population growth. Understood and well stated = 2 marks Some recognition but not fully described = 1 mark [2] (iv) Factors which help to explain low take-up of family planning in countries: – poverty; national costs of implementation of programmes and policies – political; low priority, resources spent in other ways, weak government – religion; not normally part of state policy in Muslim and Catholic countries – attitude; socially, culturally and economically unacceptable – infrastructure; problems of implementation in remote regions Explanatory points can be made following on from the factors suggested above. One factor only; range of factors with little explanation; focus on individuals rather than countries = 1 or 2 mark answers References included to at least two factors that are clearly different; attempts to explain the significance of factors; focus is on countries = 3 or 4 mark answers [4] (e) (i) Possible advantages of conservation of forests to be added to the spider diagram: – carbon store / plants take carbon dioxide out of atmosphere – potential sources of new medicines / crops from plants – home, food and materials source for indigenous tribes / people – products useful to outsiders such as Brazil nuts and natural rubber – oxygen supply to the atmosphere during process of photosynthesis – growth of tourism as an economic activity in conserved forests – used for selective logging (i.e. an example of something specific with forests conserved) Three advantages such as these. 3 @ 1 mark [3]
Mark scheme, page 5
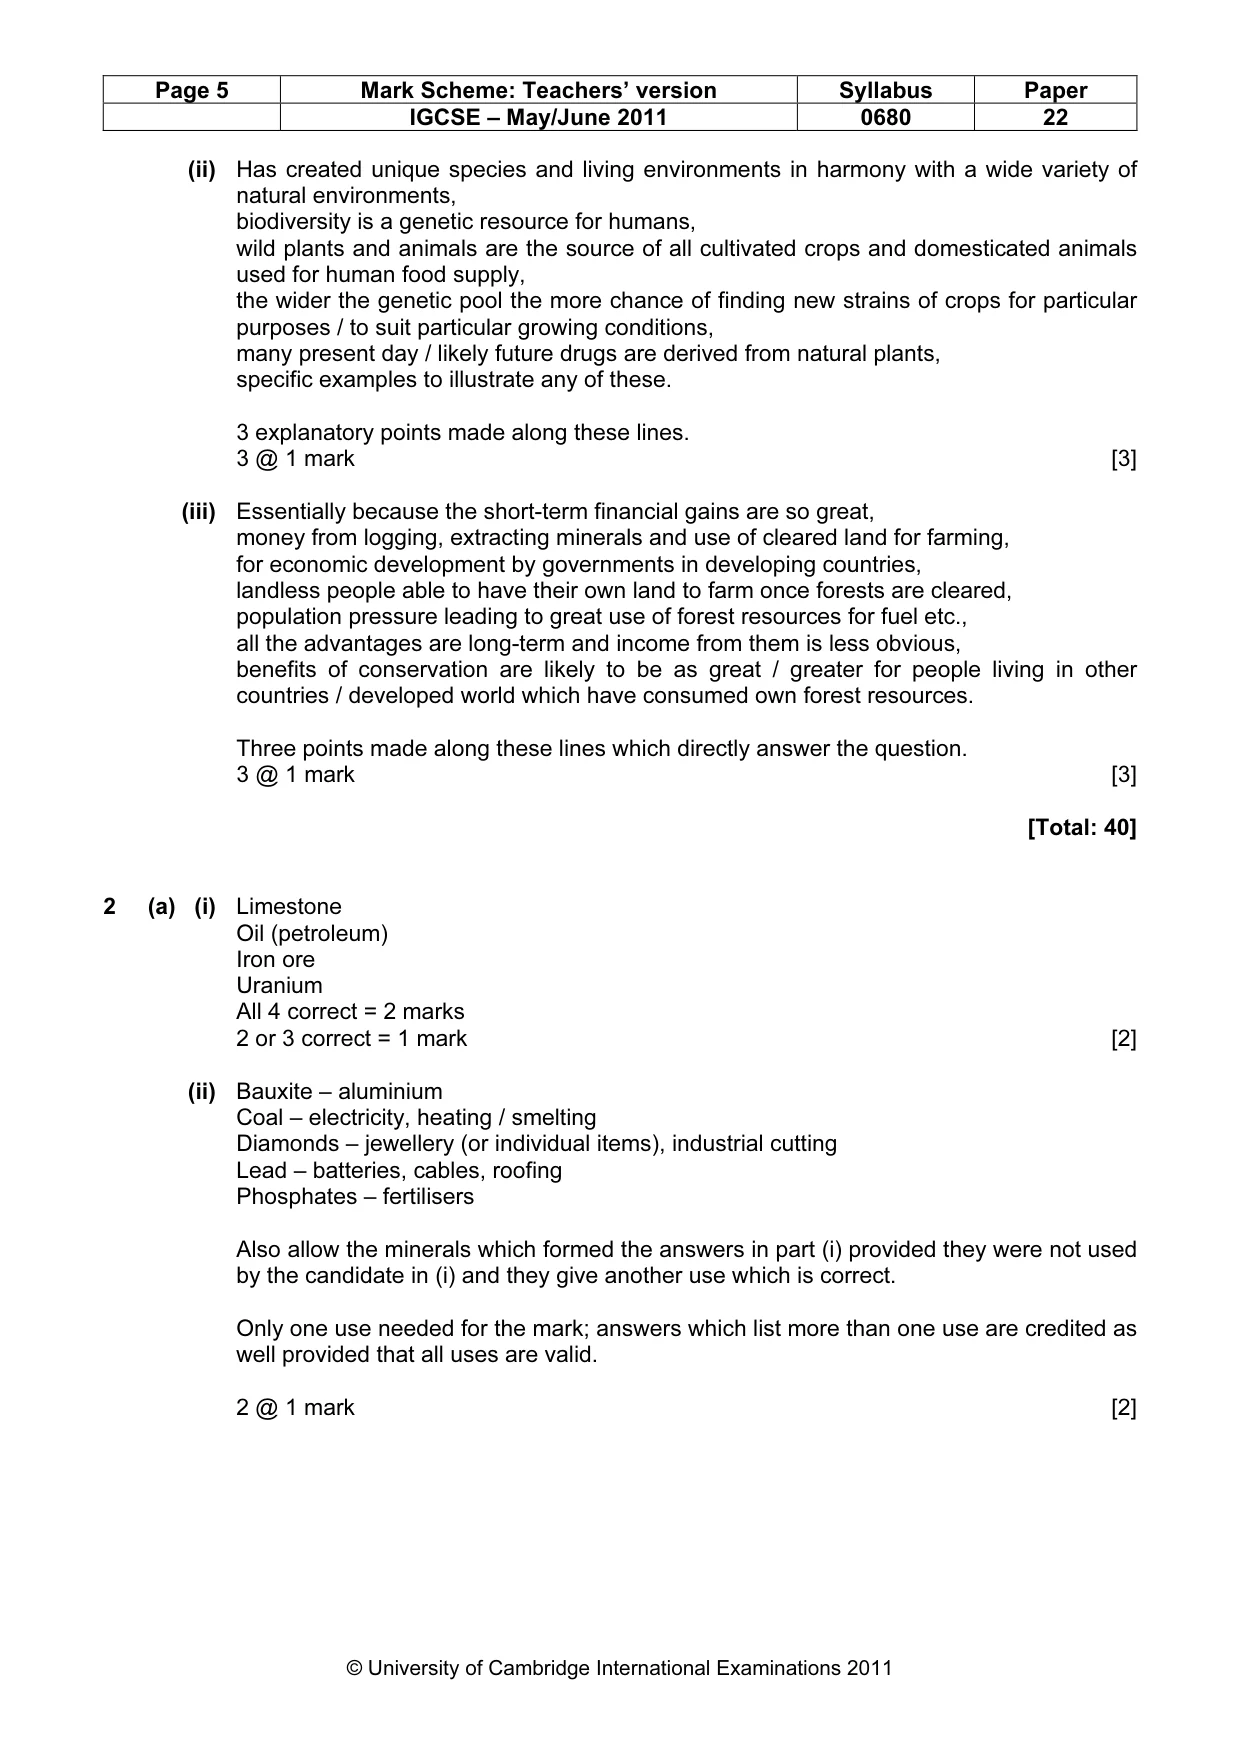
Page 5 Mark Scheme: Teachers’ version Syllabus Paper IGCSE – May/June 2011 0680 22 © University of Cambridge International Examinations 2011 (ii) Has created unique species and living environments in harmony with a wide variety of natural environments, biodiversity is a genetic resource for humans, wild plants and animals are the source of all cultivated crops and domesticated animals used for human food supply, the wider the genetic pool the more chance of finding new strains of crops for particular purposes / to suit particular growing conditions, many present day / likely future drugs are derived from natural plants, specific examples to illustrate any of these. 3 explanatory points made along these lines. 3 @ 1 mark [3] (iii) Essentially because the short-term financial gains are so great, money from logging, extracting minerals and use of cleared land for farming, for economic development by governments in developing countries, landless people able to have their own land to farm once forests are cleared, population pressure leading to great use of forest resources for fuel etc., all the advantages are long-term and income from them is less obvious, benefits of conservation are likely to be as great / greater for people living in other countries / developed world which have consumed own forest resources. Three points made along these lines which directly answer the question. 3 @ 1 mark [3] [Total: 40] 2 (a) (i) Limestone Oil (petroleum) Iron ore Uranium All 4 correct = 2 marks 2 or 3 correct = 1 mark [2] (ii) Bauxite – aluminium Coal – electricity, heating / smelting Diamonds – jewellery (or individual items), industrial cutting Lead – batteries, cables, roofing Phosphates – fertilisers Also allow the minerals which formed the answers in part (i) provided they were not used by the candidate in (i) and they give another use which is correct. Only one use needed for the mark; answers which list more than one use are credited as well provided that all uses are valid. 2 @ 1 mark [2]
Mark scheme, page 6
Page 6 Mark Scheme: Teachers’ version Syllabus Paper IGCSE – May/June 2011 0680 22 © University of Cambridge International Examinations 2011 (b) (i) Opencast mining (or directly equivalent such as open pit mining). [1] (ii) Vertical shaft cut from the surface down to rock layer B, horizontal tunnels made as cutters work along to remove mineral, mineral (and waste) lifted up to the surface through the shaft, further detail of mining processes such as mechanical cutters in modern mines. Points made along these lines. 3 @ 1 mark [3] (iii) Easier and cheaper to build mines on the surface, some description of techniques such as scraping off surface vegetation and soil and then using giant cranes and diggers, can target directly places where the mineral is most available, technically more difficult to build and operate an underground mine, layer B is quite deep at 200 metres which makes it more difficult, much time taken up each day by miners getting to and back from work place. Points made along these lines which show understanding. Credit quality of explanation as well. 3 @ 1 mark [3] (iv) The answer A can be justified by extent of the damage on the surface from four mines instead of just one underground mine; also choice can be explained with reference to the techniques used, the scale of the operations and to the direct destruction of surface vegetation and wildlife habitats. Whereas waste heaps from mine B will be piled up in one place and the rest of area might be untouched. An answer B is harder to support; deep mining in general is more dangerous for humans but less damaging for the surface environment. Much of the dust and dirt remains underground. A deep mine like this one is less likely to have other effects on surface such as underground water polluting surface water courses, subsidence etc. The two marks are for justification, not choice itself. Well supported choice – 2 marks Some support – 1 mark [2] (v) Greater problems for mining rock layer C: – deeper (more than 400m below surface compared with 200m) – mineral bearing rock layer is folded / upfolded instead of being horizontal plus detail about the extra mining problems / expense these will cause Greater problems for mining rock layer D: – more to do with its location than the slight folding – higher up on a steep part of the hill side with access problems this might cause Comment along these lines. Maximum 2 marks for answers without valid points for both C and D. 3 points @ 1 mark [3]
Mark scheme, page 7
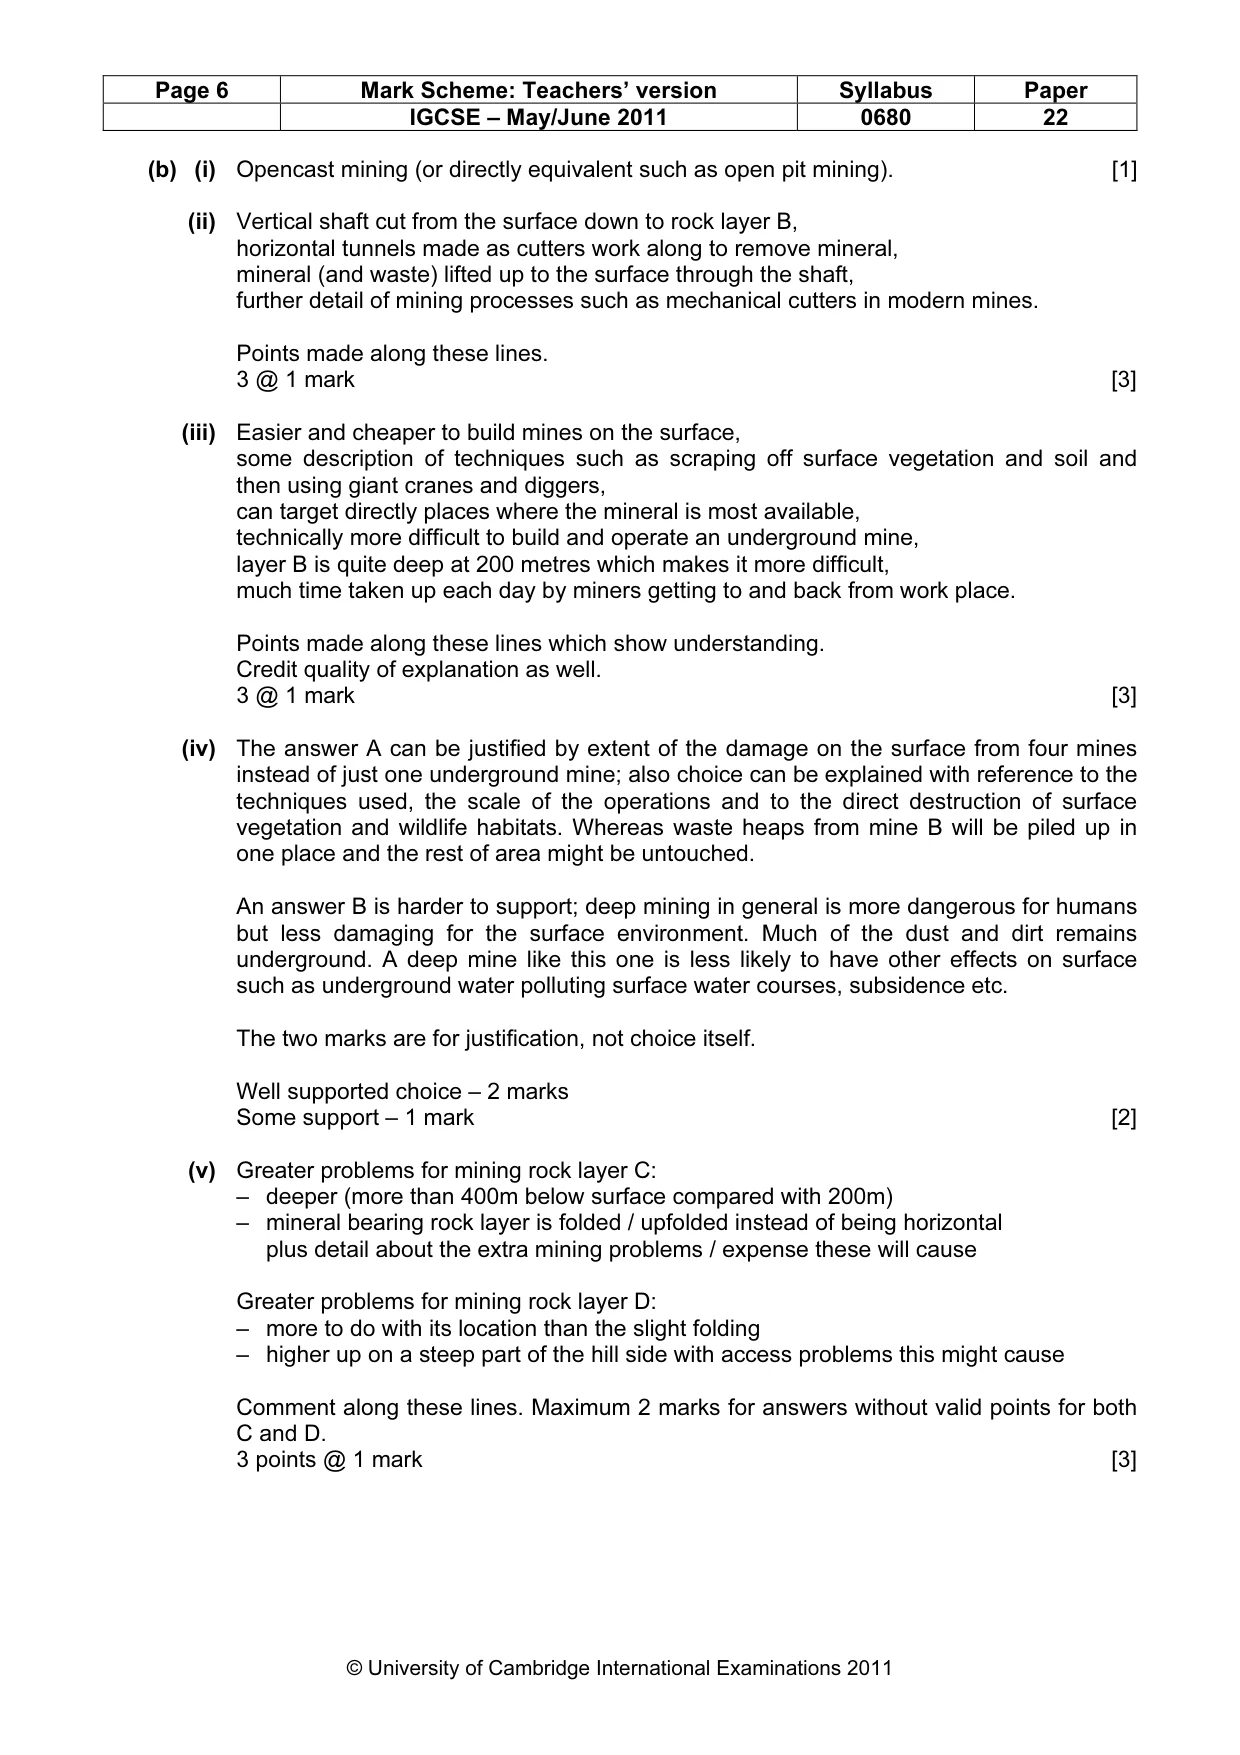
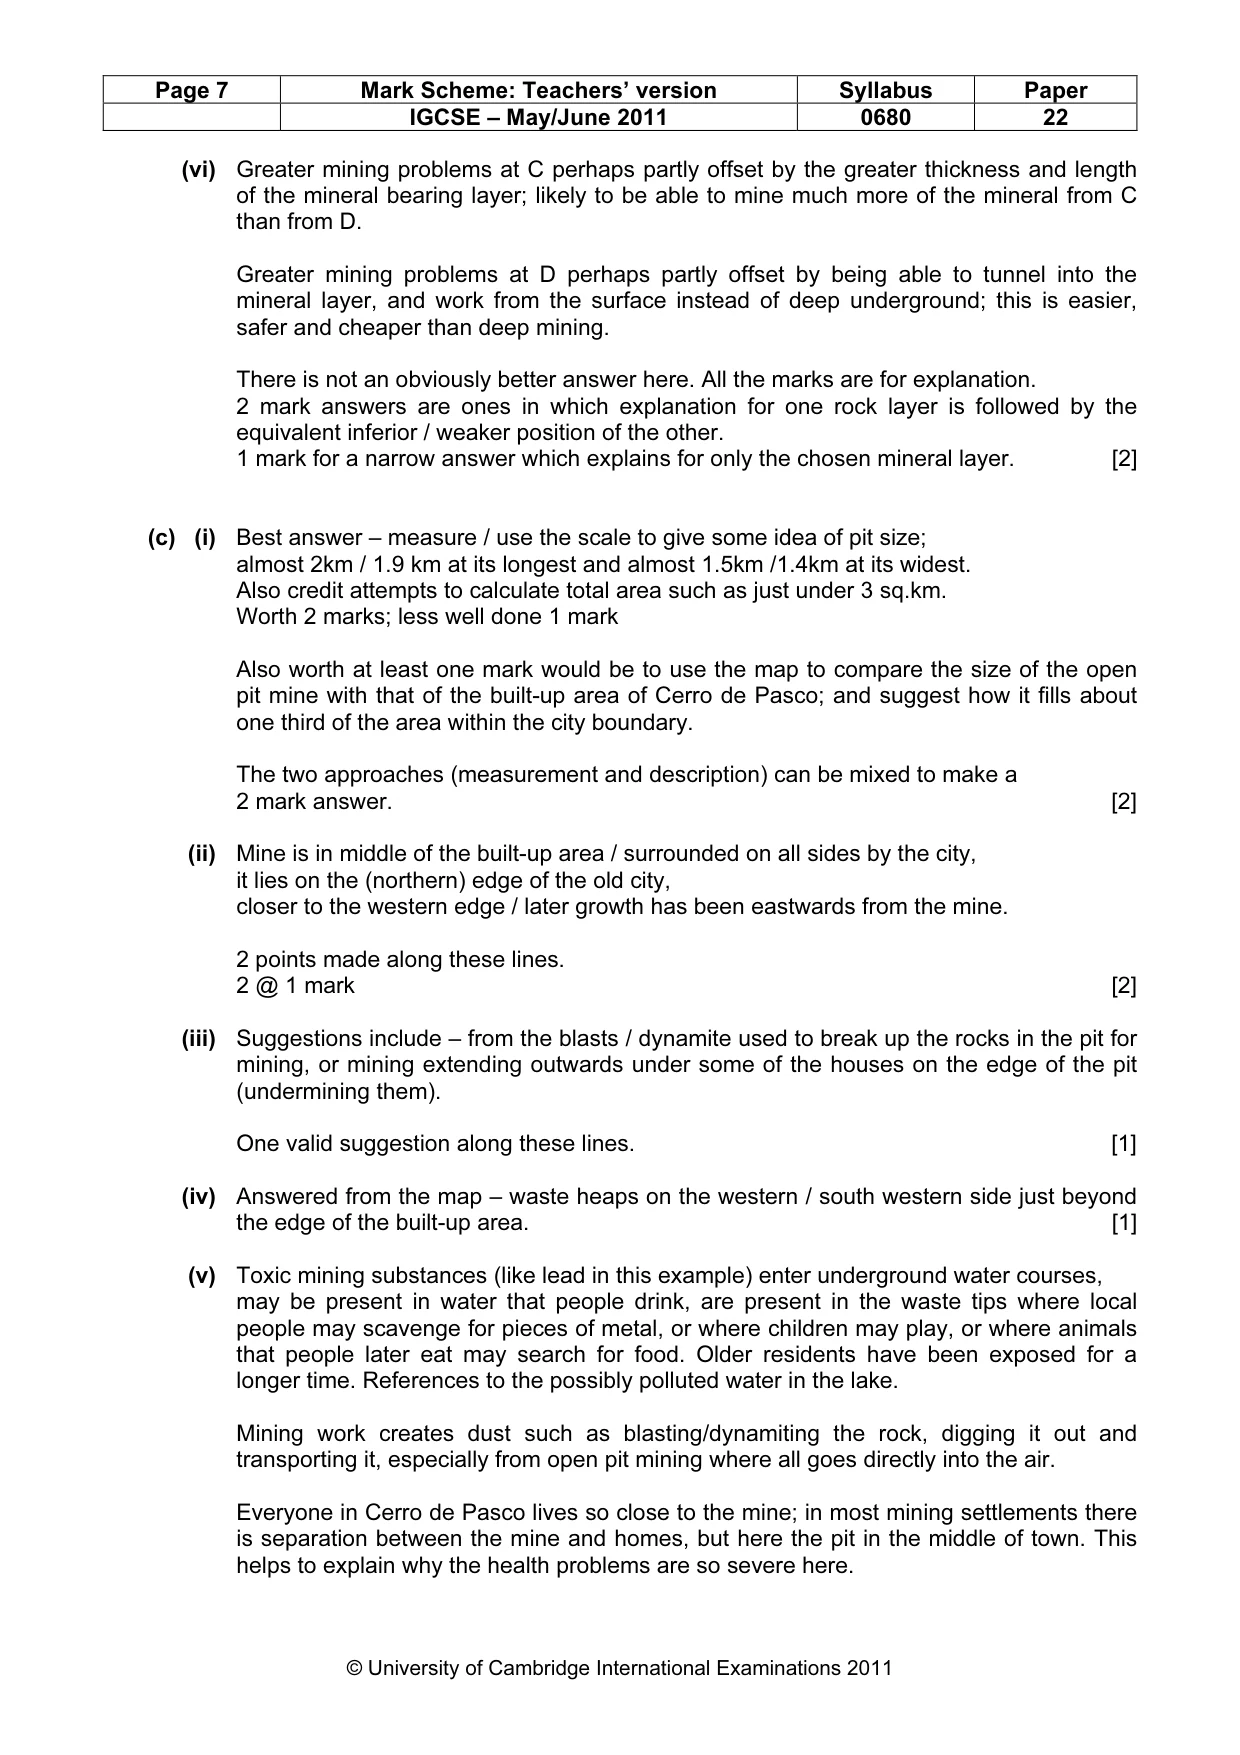
Page 7 Mark Scheme: Teachers’ version Syllabus Paper IGCSE – May/June 2011 0680 22 © University of Cambridge International Examinations 2011 (vi) Greater mining problems at C perhaps partly offset by the greater thickness and length of the mineral bearing layer; likely to be able to mine much more of the mineral from C than from D. Greater mining problems at D perhaps partly offset by being able to tunnel into the mineral layer, and work from the surface instead of deep underground; this is easier, safer and cheaper than deep mining. There is not an obviously better answer here. All the marks are for explanation. 2 mark answers are ones in which explanation for one rock layer is followed by the equivalent inferior / weaker position of the other. 1 mark for a narrow answer which explains for only the chosen mineral layer. [2] (c) (i) Best answer – measure / use the scale to give some idea of pit size; almost 2km / 1.9 km at its longest and almost 1.5km /1.4km at its widest. Also credit attempts to calculate total area such as just under 3 sq.km. Worth 2 marks; less well done 1 mark Also worth at least one mark would be to use the map to compare the size of the open pit mine with that of the built-up area of Cerro de Pasco; and suggest how it fills about one third of the area within the city boundary. The two approaches (measurement and description) can be mixed to make a 2 mark answer. [2] (ii) Mine is in middle of the built-up area / surrounded on all sides by the city, it lies on the (northern) edge of the old city, closer to the western edge / later growth has been eastwards from the mine. 2 points made along these lines. 2 @ 1 mark [2] (iii) Suggestions include – from the blasts / dynamite used to break up the rocks in the pit for mining, or mining extending outwards under some of the houses on the edge of the pit (undermining them). One valid suggestion along these lines. [1] (iv) Answered from the map – waste heaps on the western / south western side just beyond the edge of the built-up area. [1] (v) Toxic mining substances (like lead in this example) enter underground water courses, may be present in water that people drink, are present in the waste tips where local people may scavenge for pieces of metal, or where children may play, or where animals that people later eat may search for food. Older residents have been exposed for a longer time. References to the possibly polluted water in the lake. Mining work creates dust such as blasting/dynamiting the rock, digging it out and transporting it, especially from open pit mining where all goes directly into the air. Everyone in Cerro de Pasco lives so close to the mine; in most mining settlements there is separation between the mine and homes, but here the pit in the middle of town. This helps to explain why the health problems are so severe here.
Mark scheme, page 8
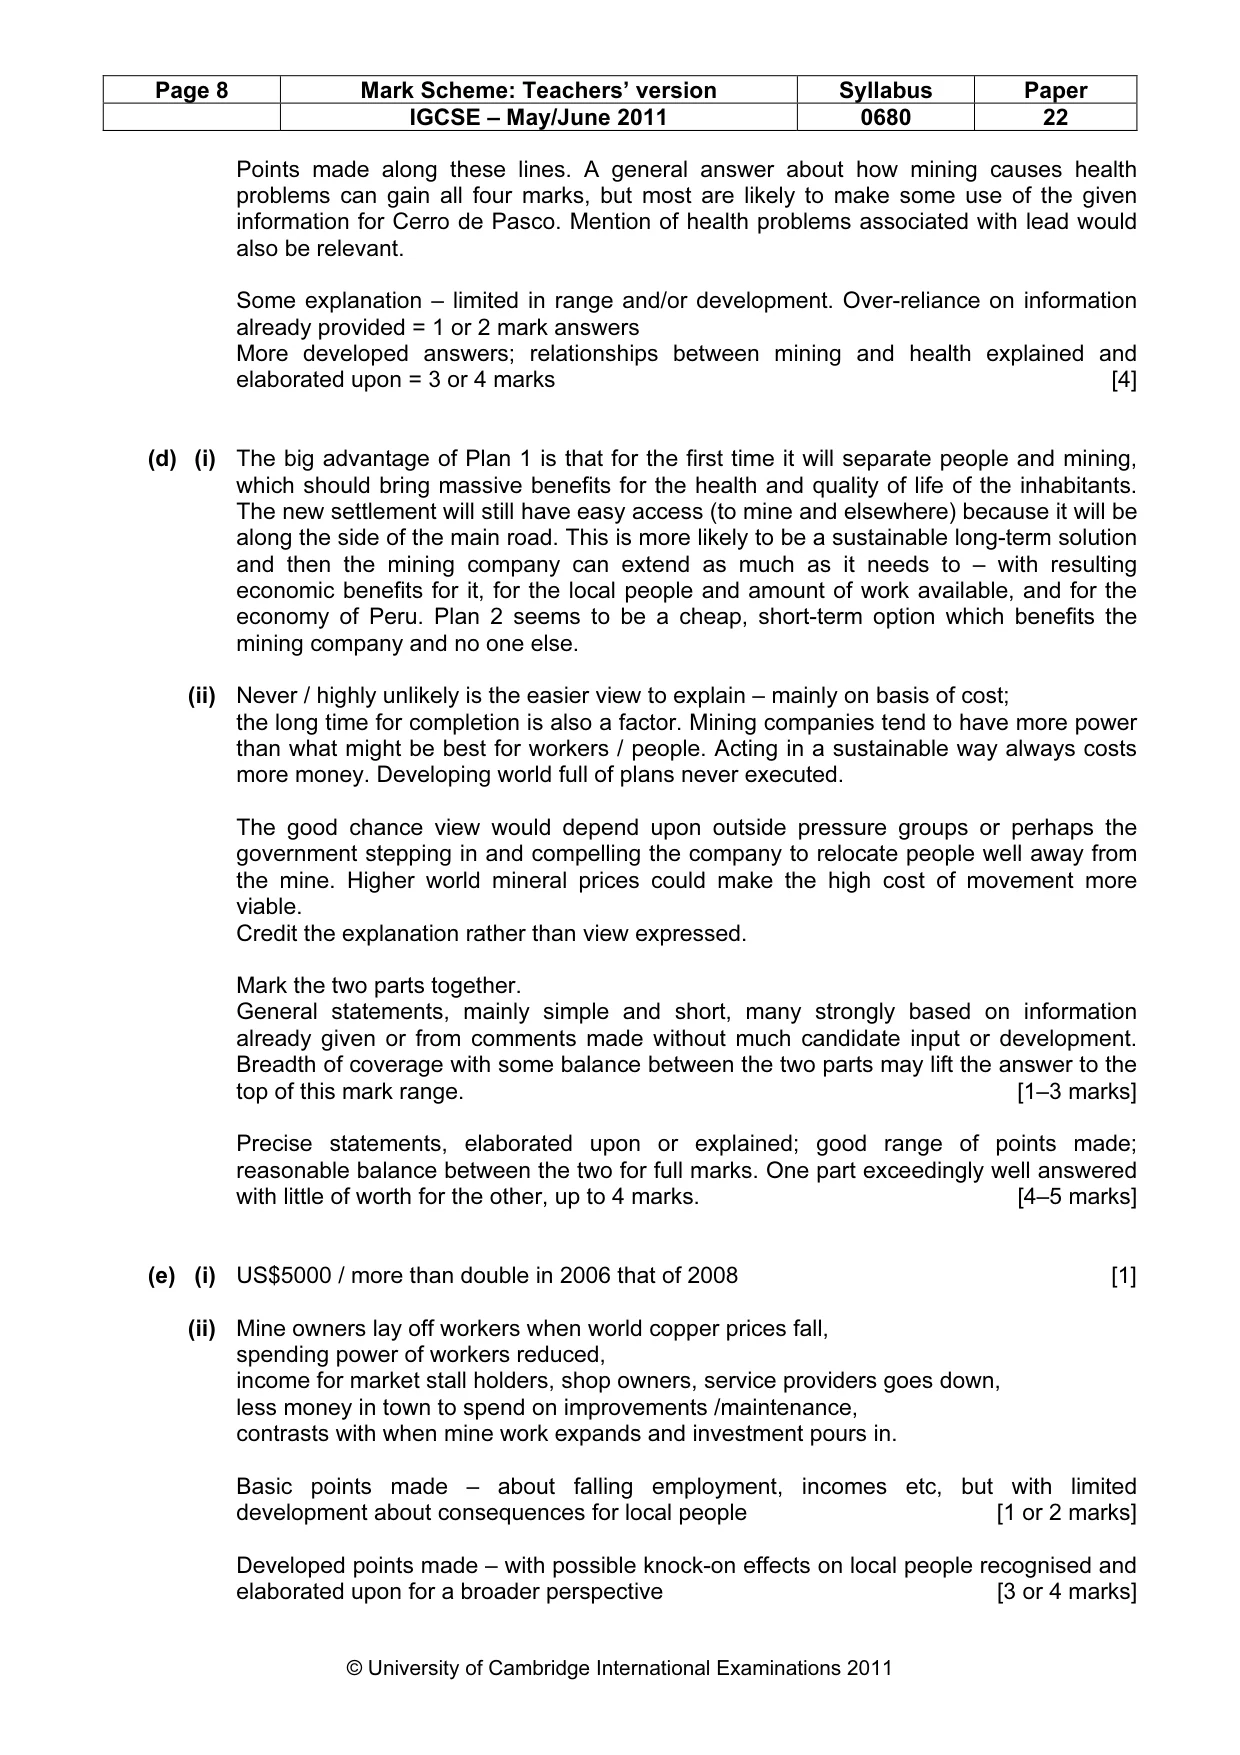
Page 8 Mark Scheme: Teachers’ version Syllabus Paper IGCSE – May/June 2011 0680 22 © University of Cambridge International Examinations 2011 Points made along these lines. A general answer about how mining causes health problems can gain all four marks, but most are likely to make some use of the given information for Cerro de Pasco. Mention of health problems associated with lead would also be relevant. Some explanation – limited in range and/or development. Over-reliance on information already provided = 1 or 2 mark answers More developed answers; relationships between mining and health explained and elaborated upon = 3 or 4 marks [4] (d) (i) The big advantage of Plan 1 is that for the first time it will separate people and mining, which should bring massive benefits for the health and quality of life of the inhabitants. The new settlement will still have easy access (to mine and elsewhere) because it will be along the side of the main road. This is more likely to be a sustainable long-term solution and then the mining company can extend as much as it needs to – with resulting economic benefits for it, for the local people and amount of work available, and for the economy of Peru. Plan 2 seems to be a cheap, short-term option which benefits the mining company and no one else. (ii) Never / highly unlikely is the easier view to explain – mainly on basis of cost; the long time for completion is also a factor. Mining companies tend to have more power than what might be best for workers / people. Acting in a sustainable way always costs more money. Developing world full of plans never executed. The good chance view would depend upon outside pressure groups or perhaps the government stepping in and compelling the company to relocate people well away from the mine. Higher world mineral prices could make the high cost of movement more viable. Credit the explanation rather than view expressed. Mark the two parts together. General statements, mainly simple and short, many strongly based on information already given or from comments made without much candidate input or development. Breadth of coverage with some balance between the two parts may lift the answer to the top of this mark range. [1–3 marks] Precise statements, elaborated upon or explained; good range of points made; reasonable balance between the two for full marks. One part exceedingly well answered with little of worth for the other, up to 4 marks. [4–5 marks] (e) (i) US$5000 / more than double in 2006 that of 2008 [1] (ii) Mine owners lay off workers when world copper prices fall, spending power of workers reduced, income for market stall holders, shop owners, service providers goes down, less money in town to spend on improvements /maintenance, contrasts with when mine work expands and investment pours in. Basic points made – about falling employment, incomes etc, but with limited development about consequences for local people [1 or 2 marks] Developed points made – with possible knock-on effects on local people recognised and elaborated upon for a broader perspective [3 or 4 marks]
Mark scheme, page 9
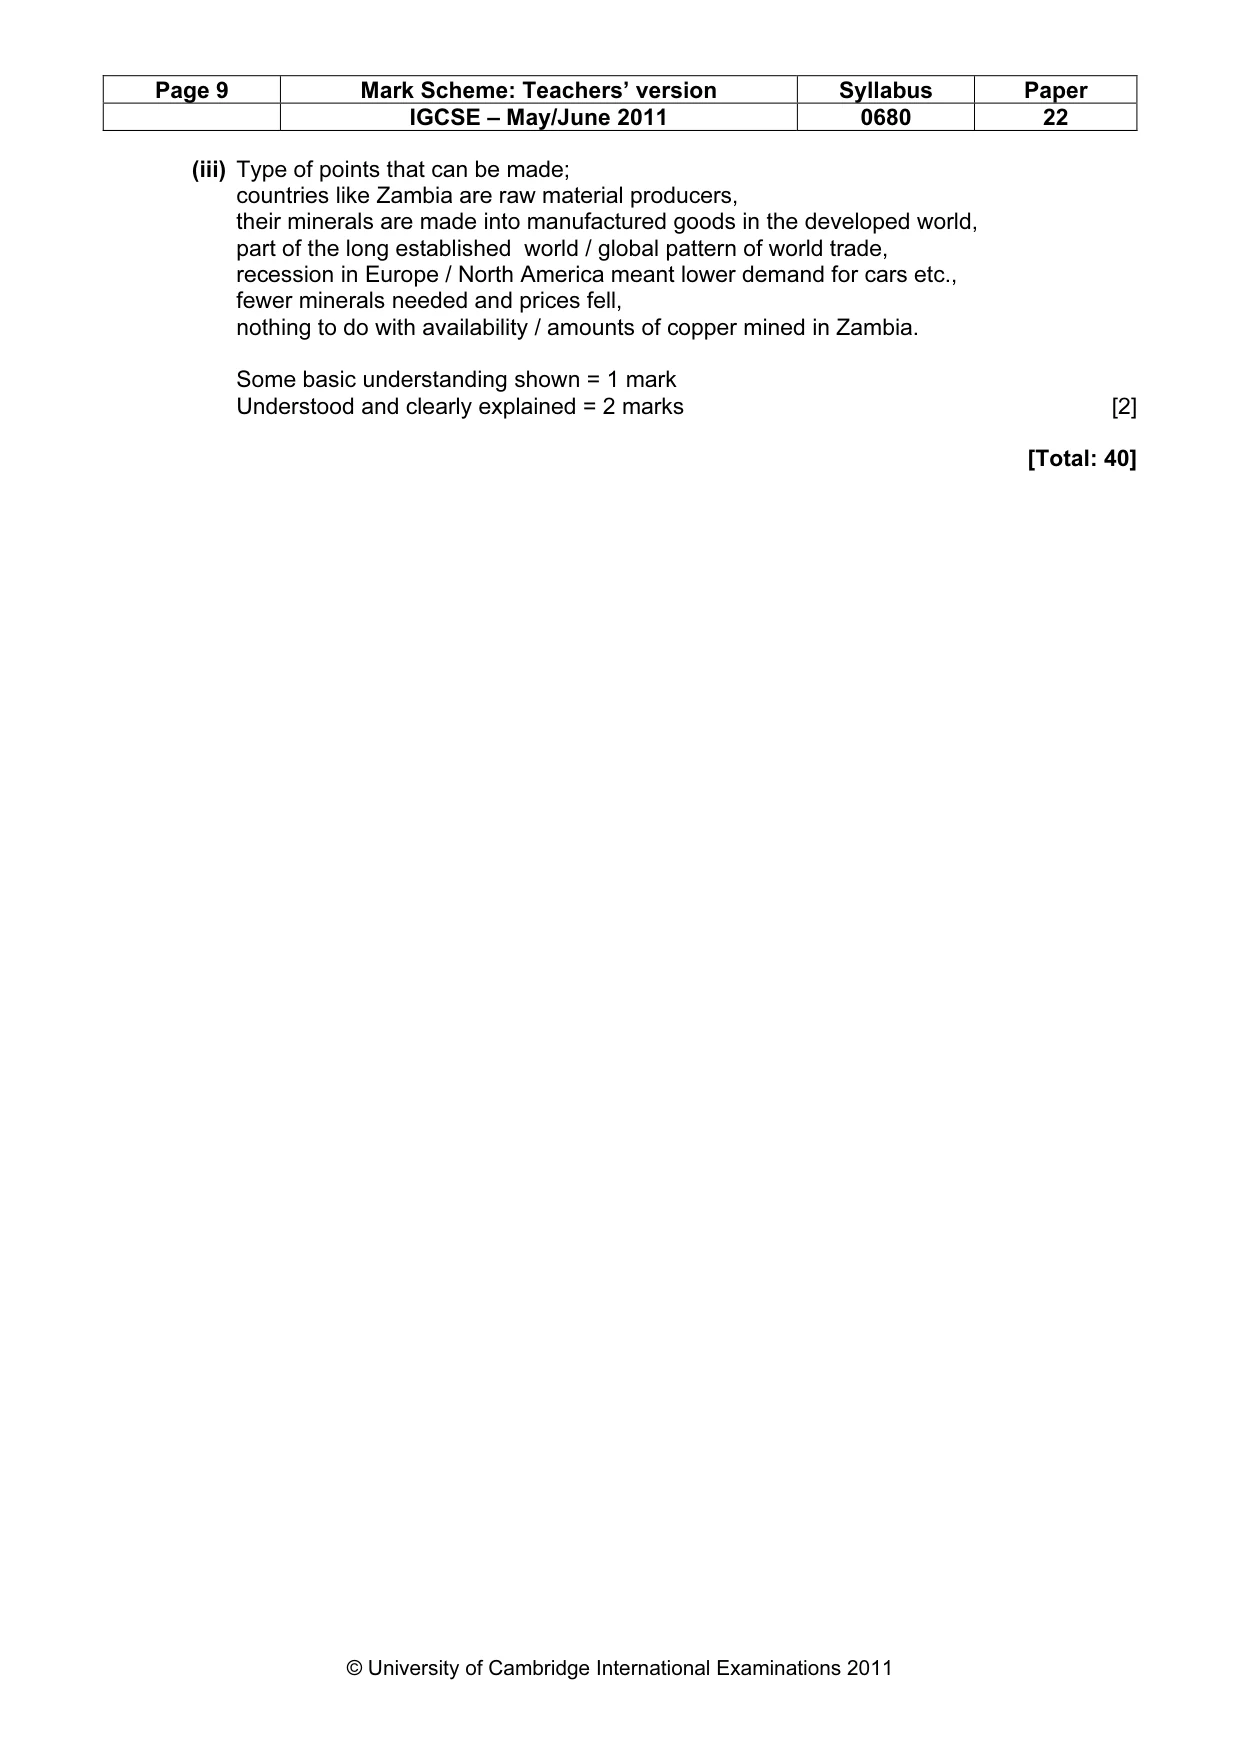
Page 9 Mark Scheme: Teachers’ version Syllabus Paper IGCSE – May/June 2011 0680 22 © University of Cambridge International Examinations 2011 (iii) Type of points that can be made; countries like Zambia are raw material producers, their minerals are made into manufactured goods in the developed world, part of the long established world / global pattern of world trade, recession in Europe / North America meant lower demand for cars etc., fewer minerals needed and prices fell, nothing to do with availability / amounts of copper mined in Zambia. Some basic understanding shown = 1 mark Understood and clearly explained = 2 marks [2] [Total: 40]
What you needed in this session
Cambridge’s own grade thresholds for 2011 May/June, Paper 2 · Variant 2. A higher threshold means an easier paper — the bar moves with how the cohort did.