Cambridge IGCSE Environmental Management 0680 — 2011 May/June Paper 2 · Variant 1
0680/21/M/J/11 · 80 marks · ≈90 min
The question paper and its mark scheme, free to read here and free to download. This is Cambridge’s own paper, exactly as it was sat.
Question paper16 pages
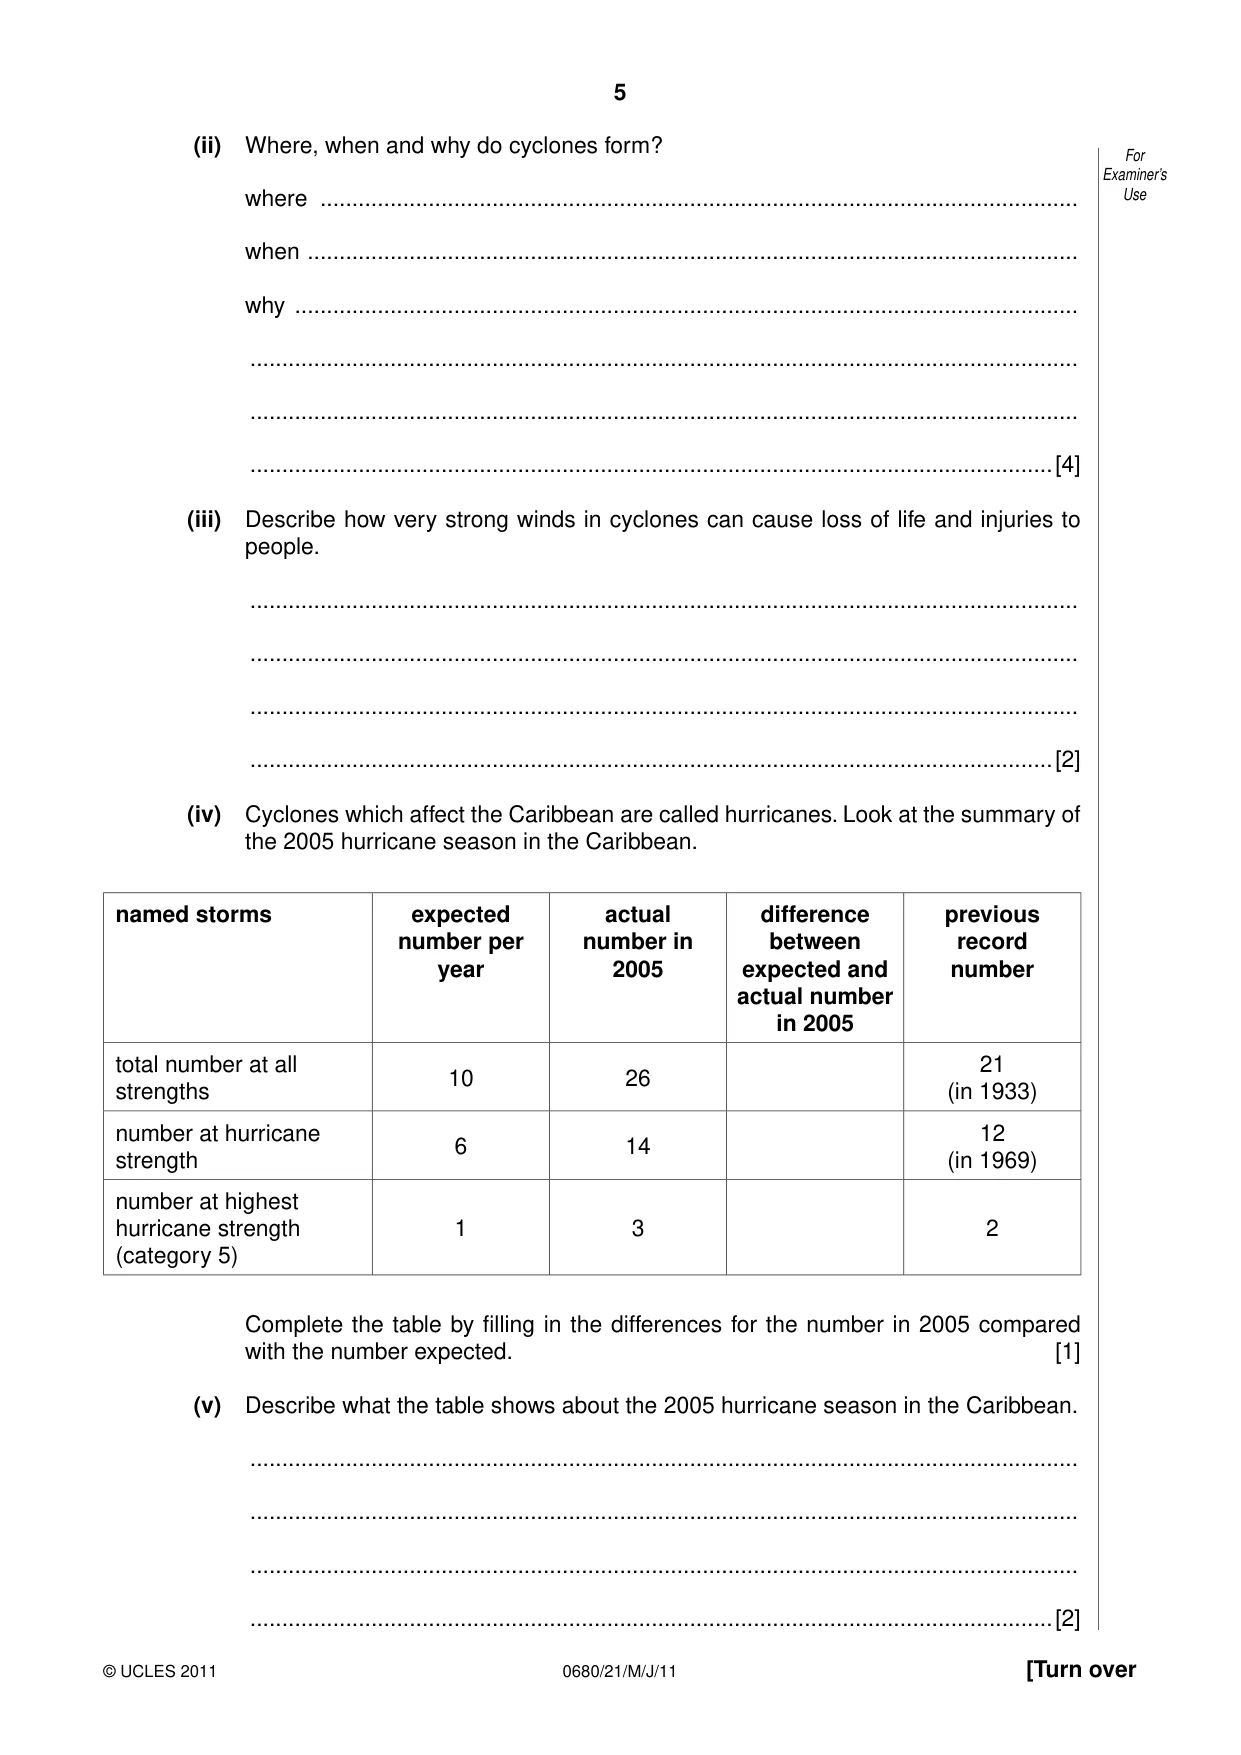
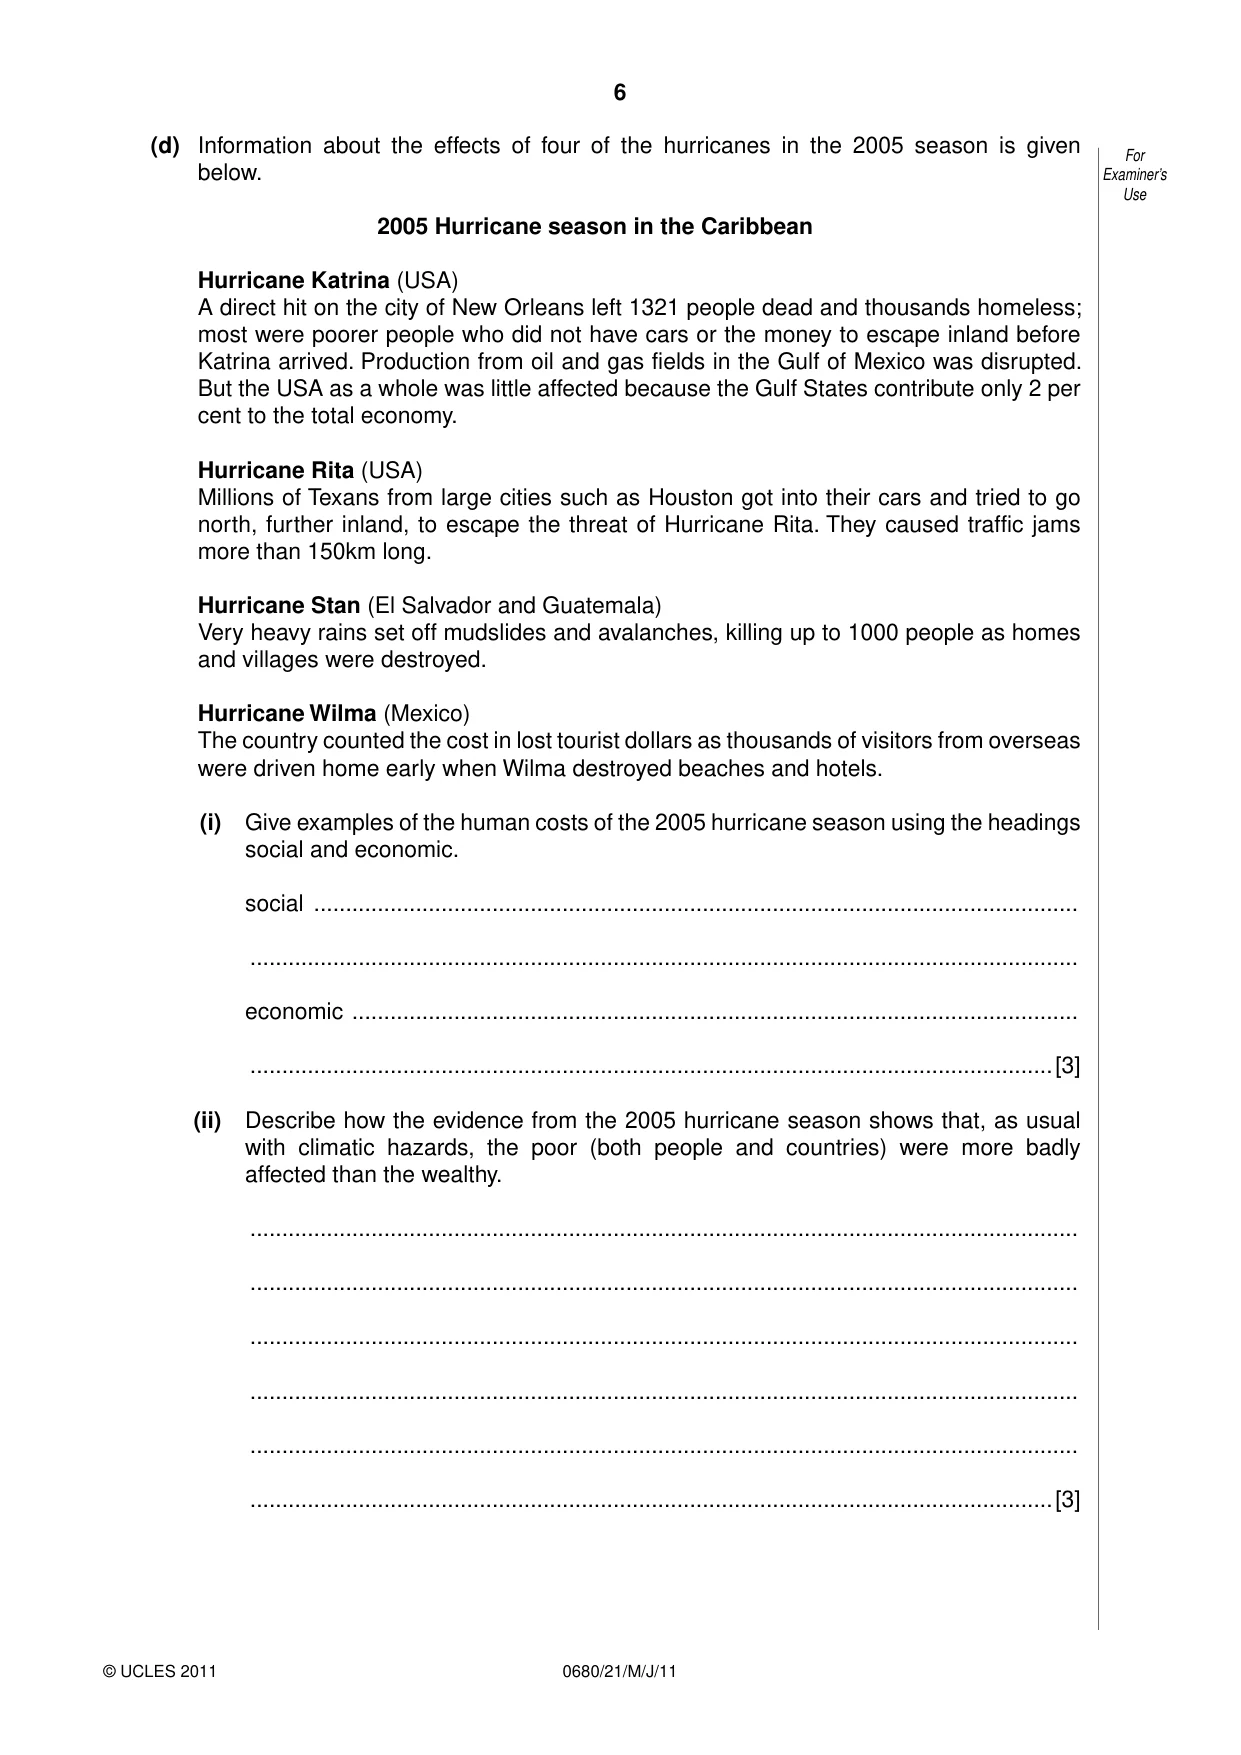
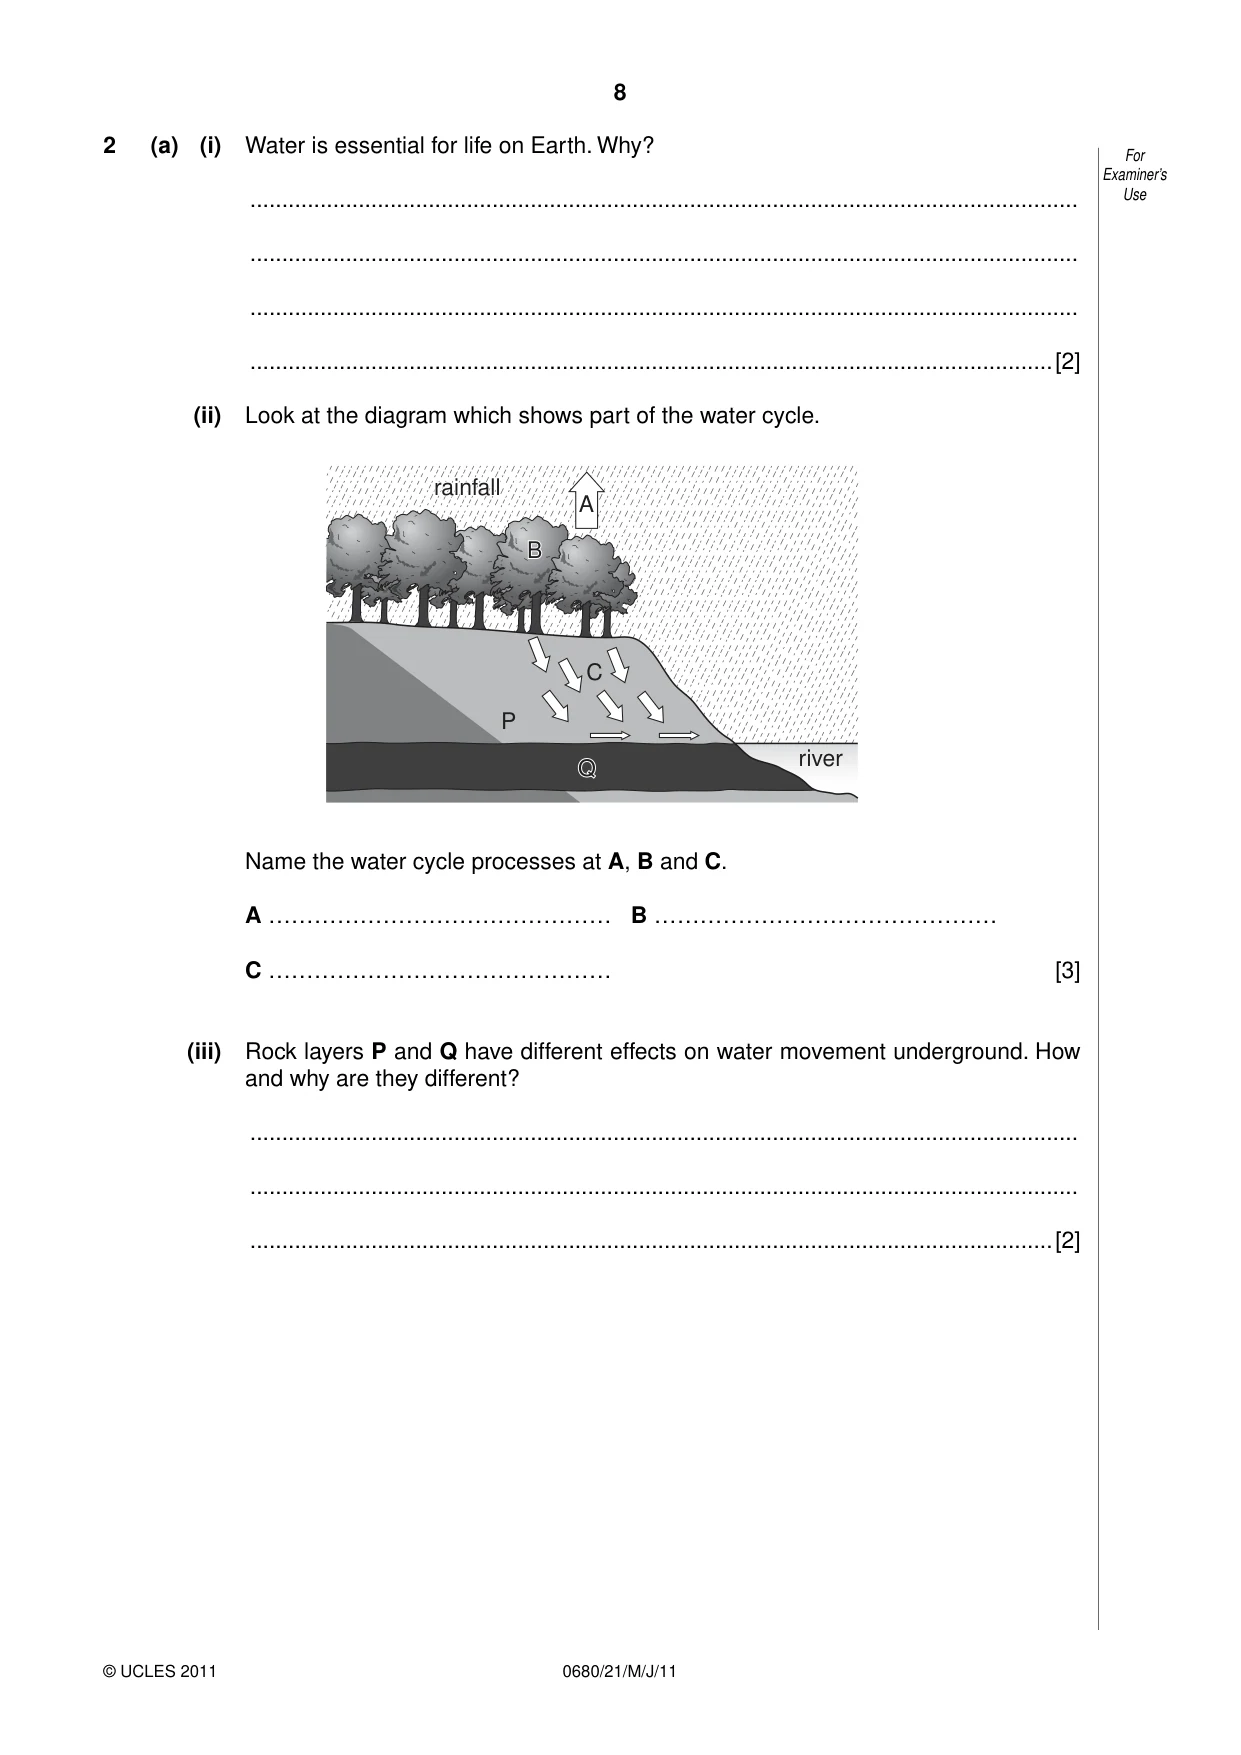
Mark scheme7 pages
Answers below. Sit the paper first if you are practising.
Paper as text
Question paper, page 1
This document consists of 15 printed pages and 1 blank page. DC (SJF/CGW) 32637/3 © UCLES 2011 [Turn over UNIVERSITY OF CAMBRIDGE INTERNATIONAL EXAMINATIONS International General Certificate of Secondary Education READ THESE INSTRUCTIONS FIRST Write your Centre number, candidate number and name on all the work you hand in. Write in dark blue or black pen. You may use a soft pencil for any diagrams, graphs or rough working. Do not use staples, paper clips, highlighters, glue or correction fluid. DO NOT WRITE IN ANY BARCODES. Answer both questions. At the end of the examination, fasten all your work securely together. The number of marks is given in brackets [ ] at the end of each question or part question. * 4 6 1 6 6 5 9 8 1 4 * ENVIRONMENTAL MANAGEMENT 0680/21 Paper 2 May/June 2011 1 hour 45 minutes Candidates answer on the Question Paper. Additional Materials: Ruler For Examiner’s Use 1 2 Total www.XtremePapers.com
Question paper, page 2
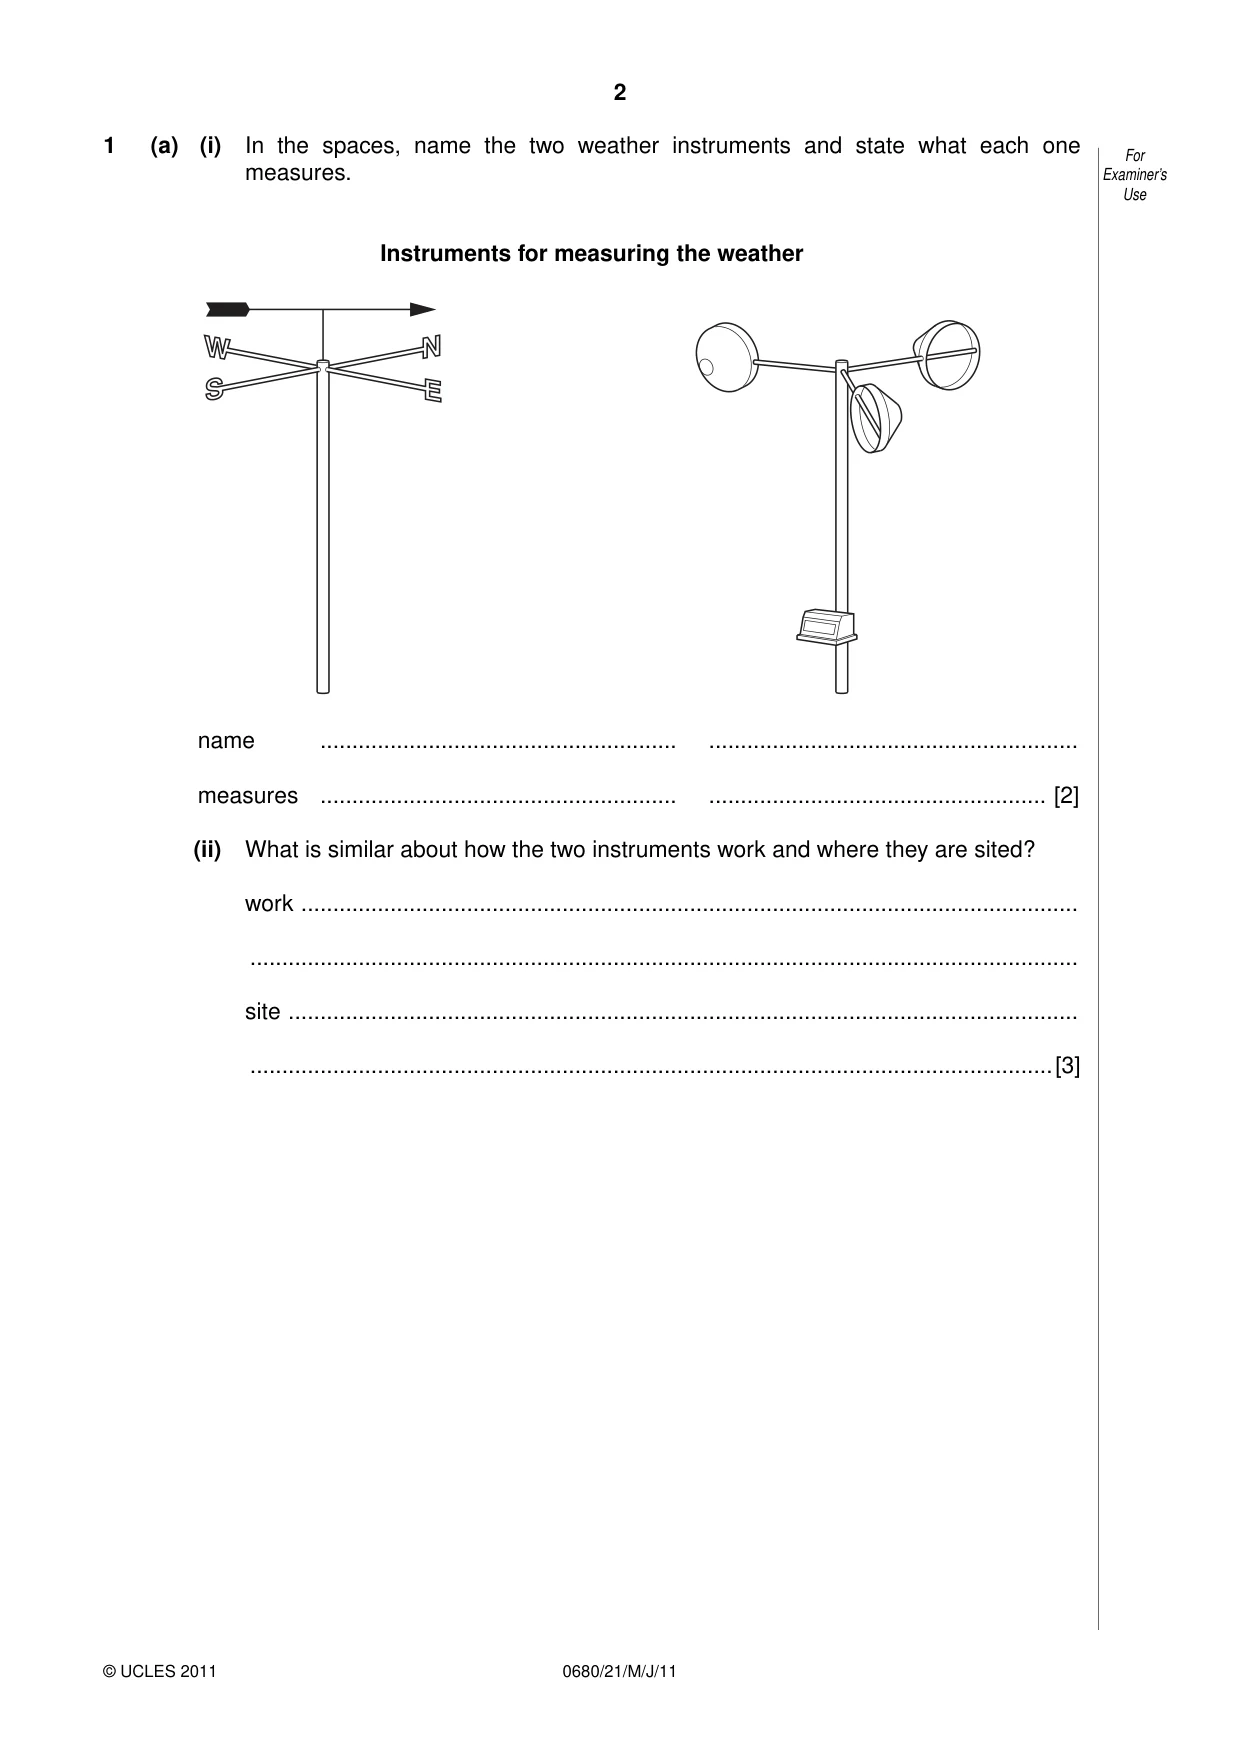
2 0680/21/M/J/11 © UCLES 2011 For Examiner’s Use 1 (a) (i) In the spaces, name the two weather instruments and state what each one measures. Instruments for measuring the weather name … … measures … … [2] (ii) What is similar about how the two instruments work and where they are sited? work … … site … …[3]
Question paper, page 3
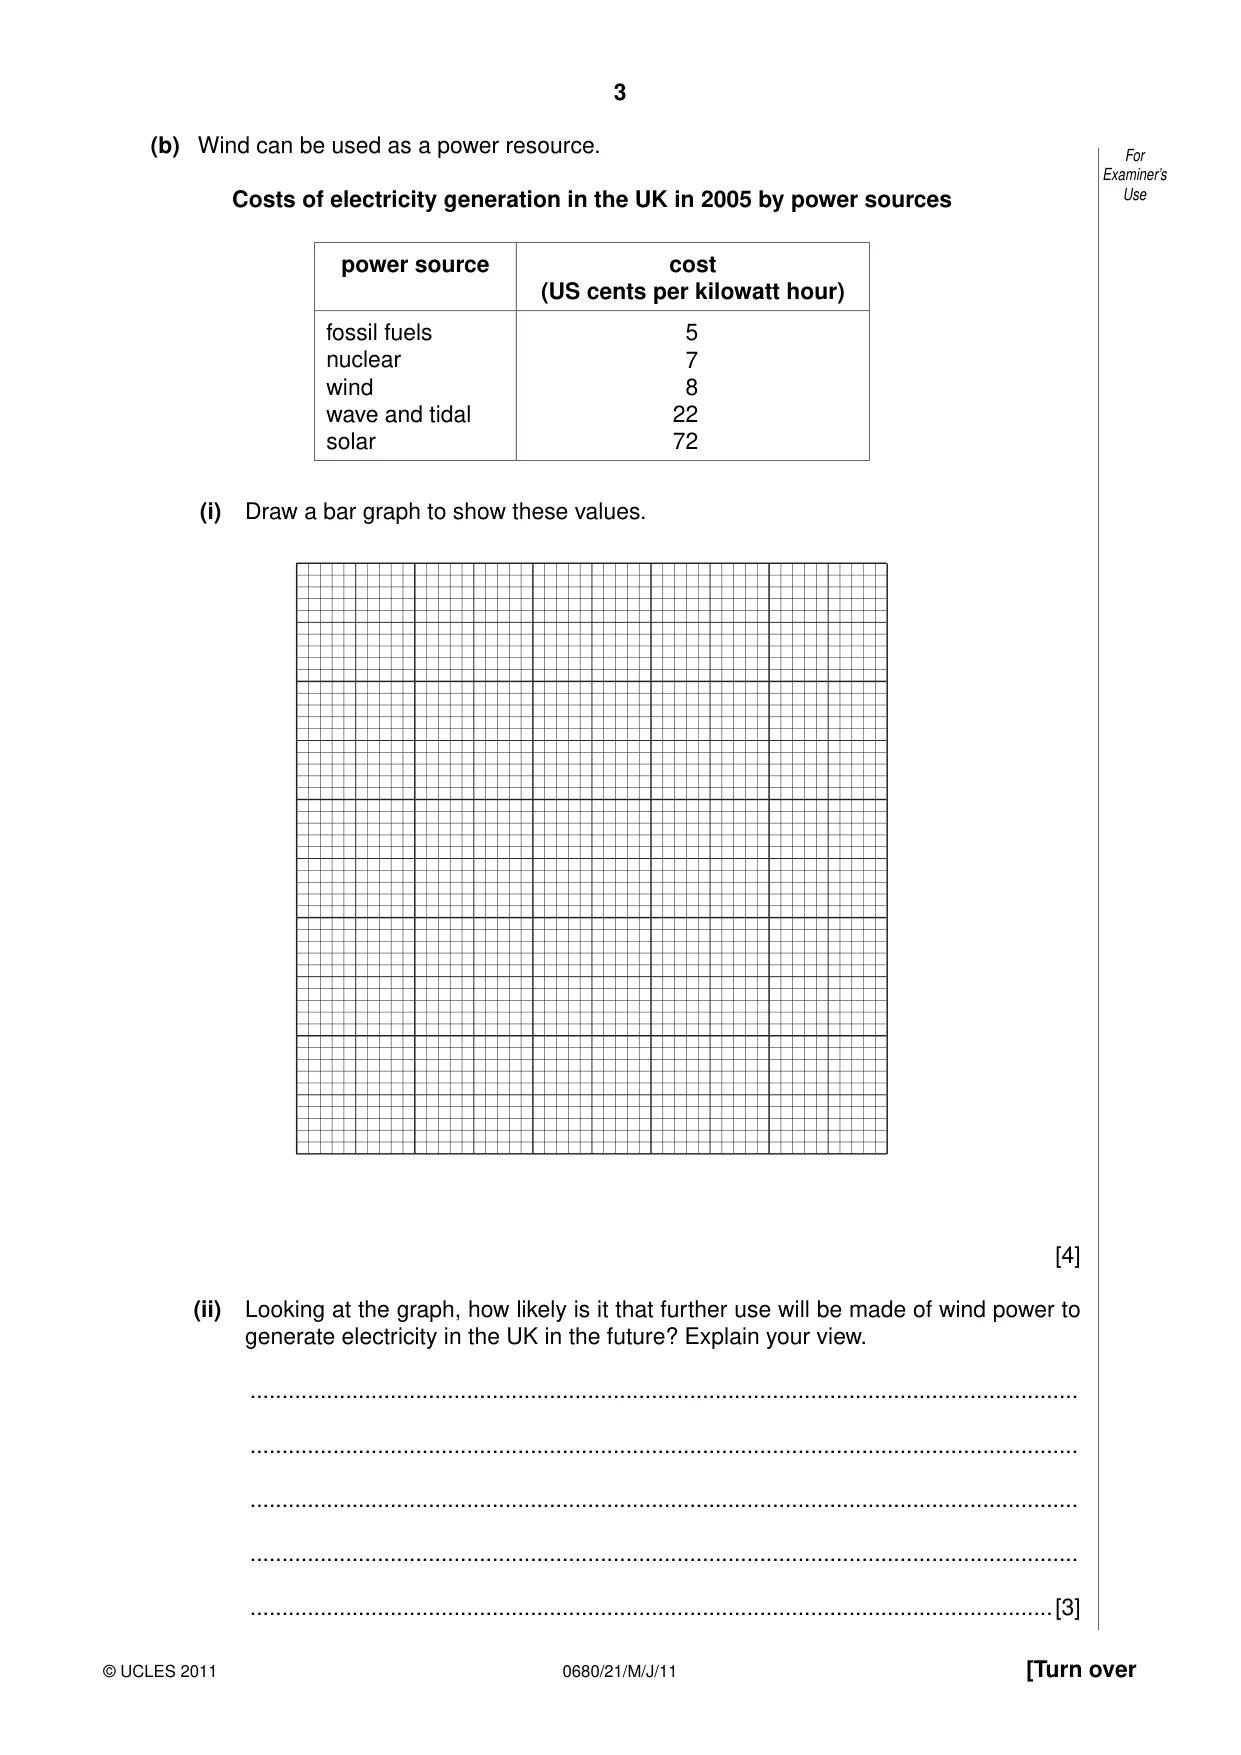
3 0680/21/M/J/11 © UCLES 2011 [Turn over For Examiner’s Use (b) Wind can be used as a power resource. Costs of electricity generation in the UK in 2005 by power sources power source cost (US cents per kilowatt hour) fossil fuels nuclear wind wave and tidal solar 5 7 8 22 72 (i) Draw a bar graph to show these values. [4] (ii) Looking at the graph, how likely is it that further use will be made of wind power to generate electricity in the UK in the future? Explain your view. … … … … …[3]
Question paper, page 4
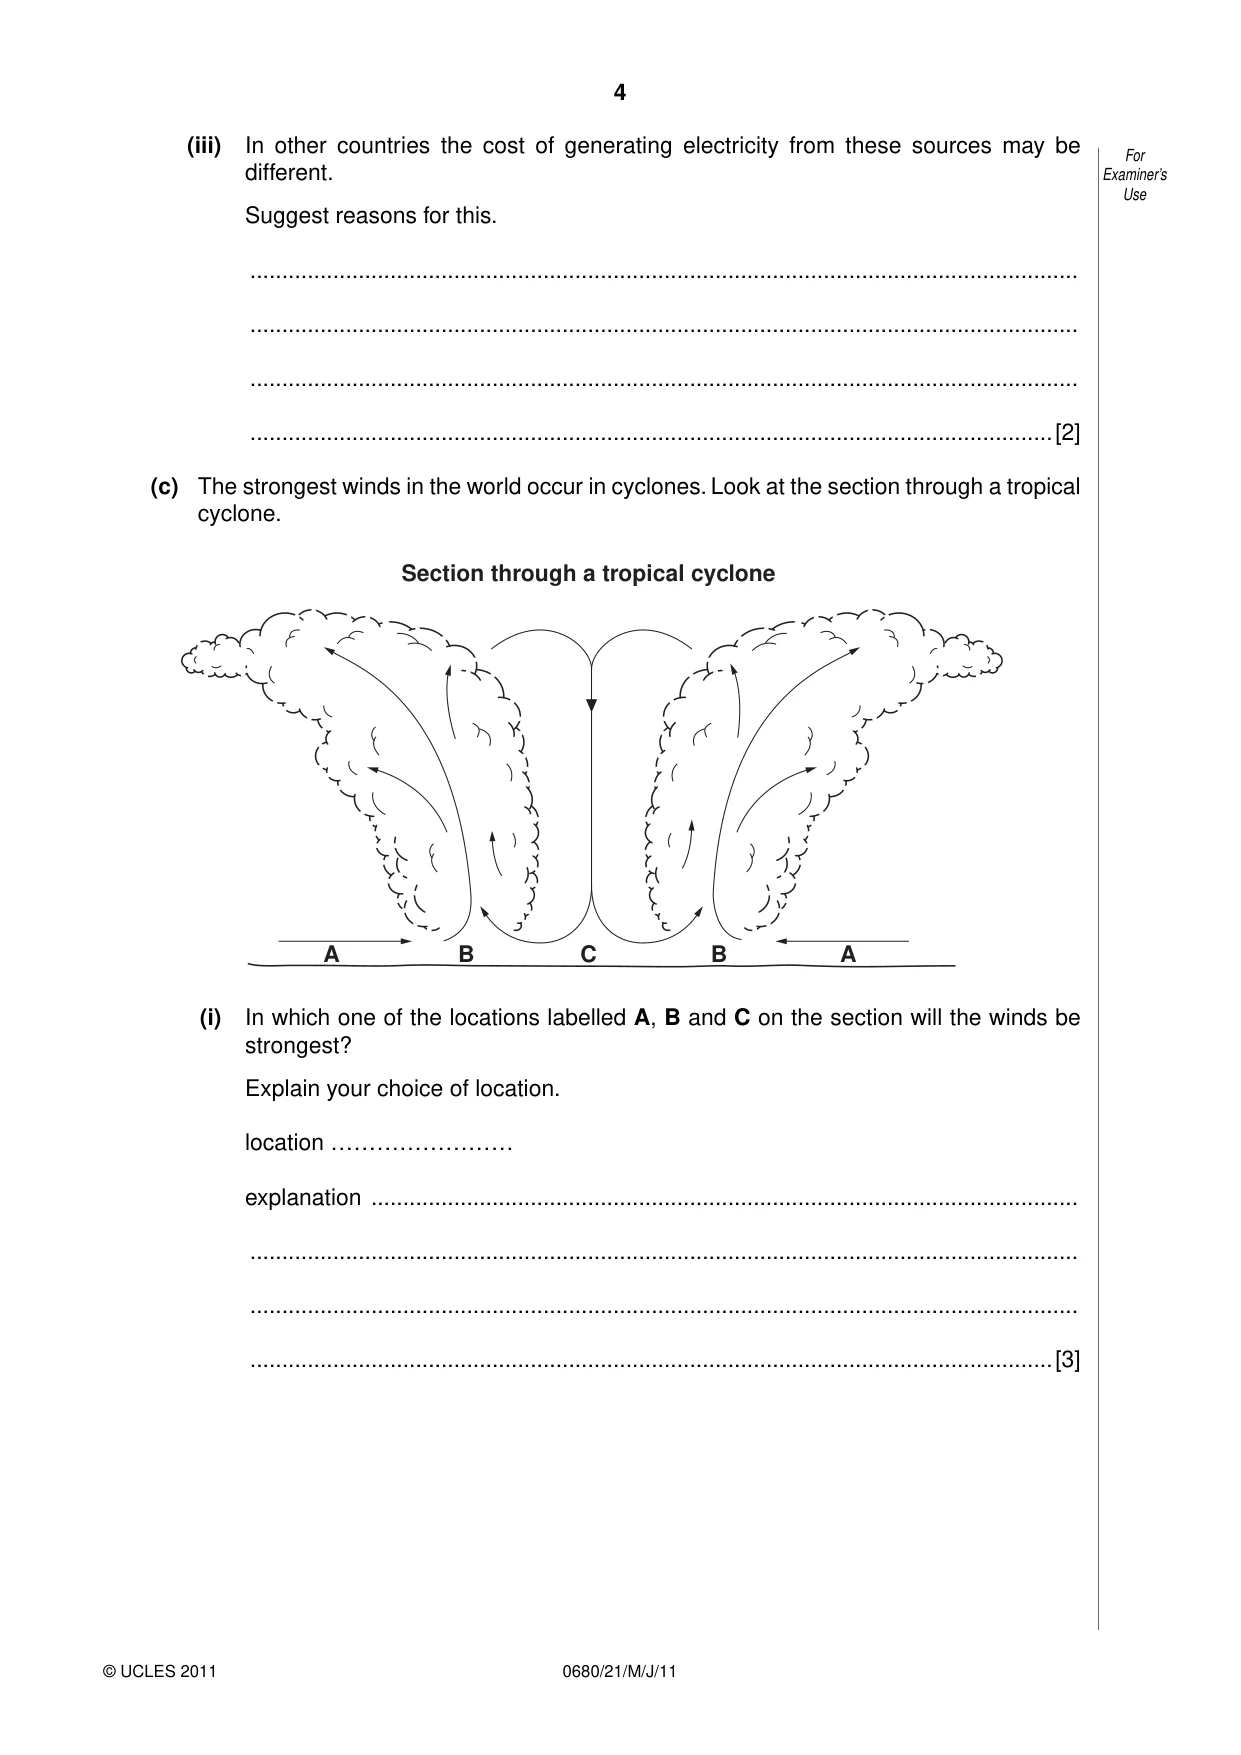
4 0680/21/M/J/11 © UCLES 2011 For Examiner’s Use (iii) In other countries the cost of generating electricity from these sources may be different. Suggest reasons for this. … … … …[2] (c) The strongest winds in the world occur in cyclones. Look at the section through a tropical cyclone. A A B B C Section through a tropical cyclone (i) In which one of the locations labelled A, B and C on the section will the winds be strongest? Explain your choice of location. location …………………… explanation … … … …[3]
Question paper, page 5
5 0680/21/M/J/11 © UCLES 2011 [Turn over For Examiner’s Use (ii) Where, when and why do cyclones form? where … when … why … … … …[4] (iii) Describe how very strong winds in cyclones can cause loss of life and injuries to people. … … … …[2] (iv) Cyclones which affect the Caribbean are called hurricanes. Look at the summary of the 2005 hurricane season in the Caribbean. named storms expected number per year actual number in 2005 difference between expected and actual number in 2005 previous record number total number at all strengths 10 26 21 (in 1933) number at hurricane strength 6 14 12 (in 1969) number at highest hurricane strength (category 5) 1 3 2 Complete the table by filling in the differences for the number in 2005 compared with the number expected. [1] (v) Describe what the table shows about the 2005 hurricane season in the Caribbean. … … … …[2]
Question paper, page 6
6 0680/21/M/J/11 © UCLES 2011 For Examiner’s Use (d) Information about the effects of four of the hurricanes in the 2005 season is given below. 2005 Hurricane season in the Caribbean Hurricane Katrina (USA) A direct hit on the city of New Orleans left 1321 people dead and thousands homeless; most were poorer people who did not have cars or the money to escape inland before Katrina arrived. Production from oil and gas fields in the Gulf of Mexico was disrupted. But the USA as a whole was little affected because the Gulf States contribute only 2 per cent to the total economy. Hurricane Rita (USA) Millions of Texans from large cities such as Houston got into their cars and tried to go north, further inland, to escape the threat of Hurricane Rita. They caused traffic jams more than 150km long. Hurricane Stan (El Salvador and Guatemala) Very heavy rains set off mudslides and avalanches, killing up to 1000 people as homes and villages were destroyed. Hurricane Wilma (Mexico) The country counted the cost in lost tourist dollars as thousands of visitors from overseas were driven home early when Wilma destroyed beaches and hotels. (i) Give examples of the human costs of the 2005 hurricane season using the headings social and economic. social … … economic … …[3] (ii) Describe how the evidence from the 2005 hurricane season shows that, as usual with climatic hazards, the poor (both people and countries) were more badly affected than the wealthy. … … … … … …[3]
Question paper, page 7
7 0680/21/M/J/11 © UCLES 2011 [Turn over For Examiner’s Use (iii) How can the negative impact of climatic hazards be reduced? Describe strategies that can be used before the hazard happens. … … … … … … …[4] (iv) Is it ever going to be possible to stop people dying from the effects of climatic hazards? Give your views on this and explain them as fully as you can. … … … … … … … …[4] [Total: 40 marks]
Question paper, page 8
8 0680/21/M/J/11 © UCLES 2011 For Examiner’s Use 2 (a) (i) Water is essential for life on Earth. Why? … … … …[2] (ii) Look at the diagram which shows part of the water cycle. rainfall rainfall river A B C P Q B Q Name the water cycle processes at A, B and C. A ……………………………………… B ……………………………………… C ……………………………………… [3] (iii) Rock layers P and Q have different effects on water movement underground. How and why are they different? … … …[2]
Question paper, page 9
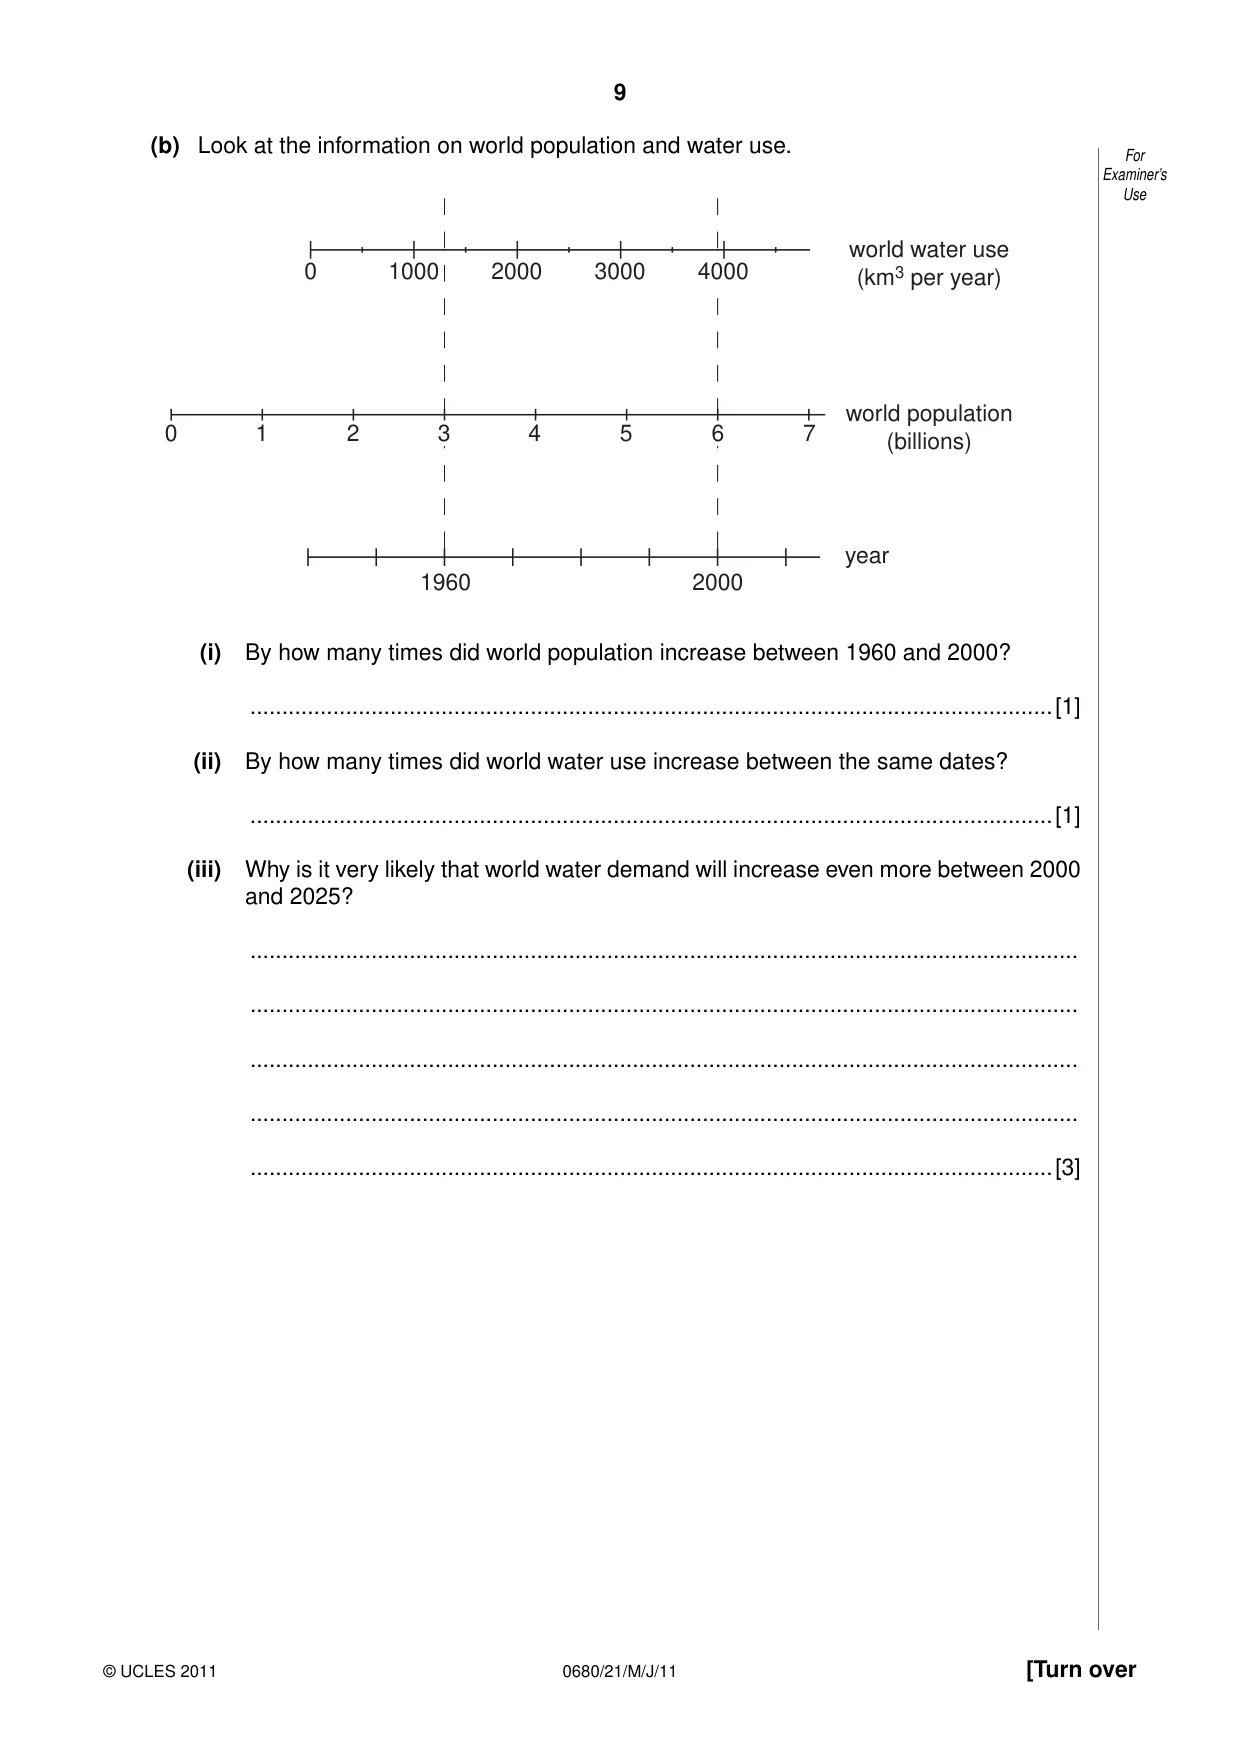
9 0680/21/M/J/11 © UCLES 2011 [Turn over For Examiner’s Use (b) Look at the information on world population and water use. 0 1 2 4 5 7 world water use (km3 per year) world population (billions) year 2000 1960 0 1000 2000 3000 3 6 4000 (i) By how many times did world population increase between 1960 and 2000? …[1] (ii) By how many times did world water use increase between the same dates? …[1] (iii) Why is it very likely that world water demand will increase even more between 2000 and 2025? … … … … …[3]
Question paper, page 10
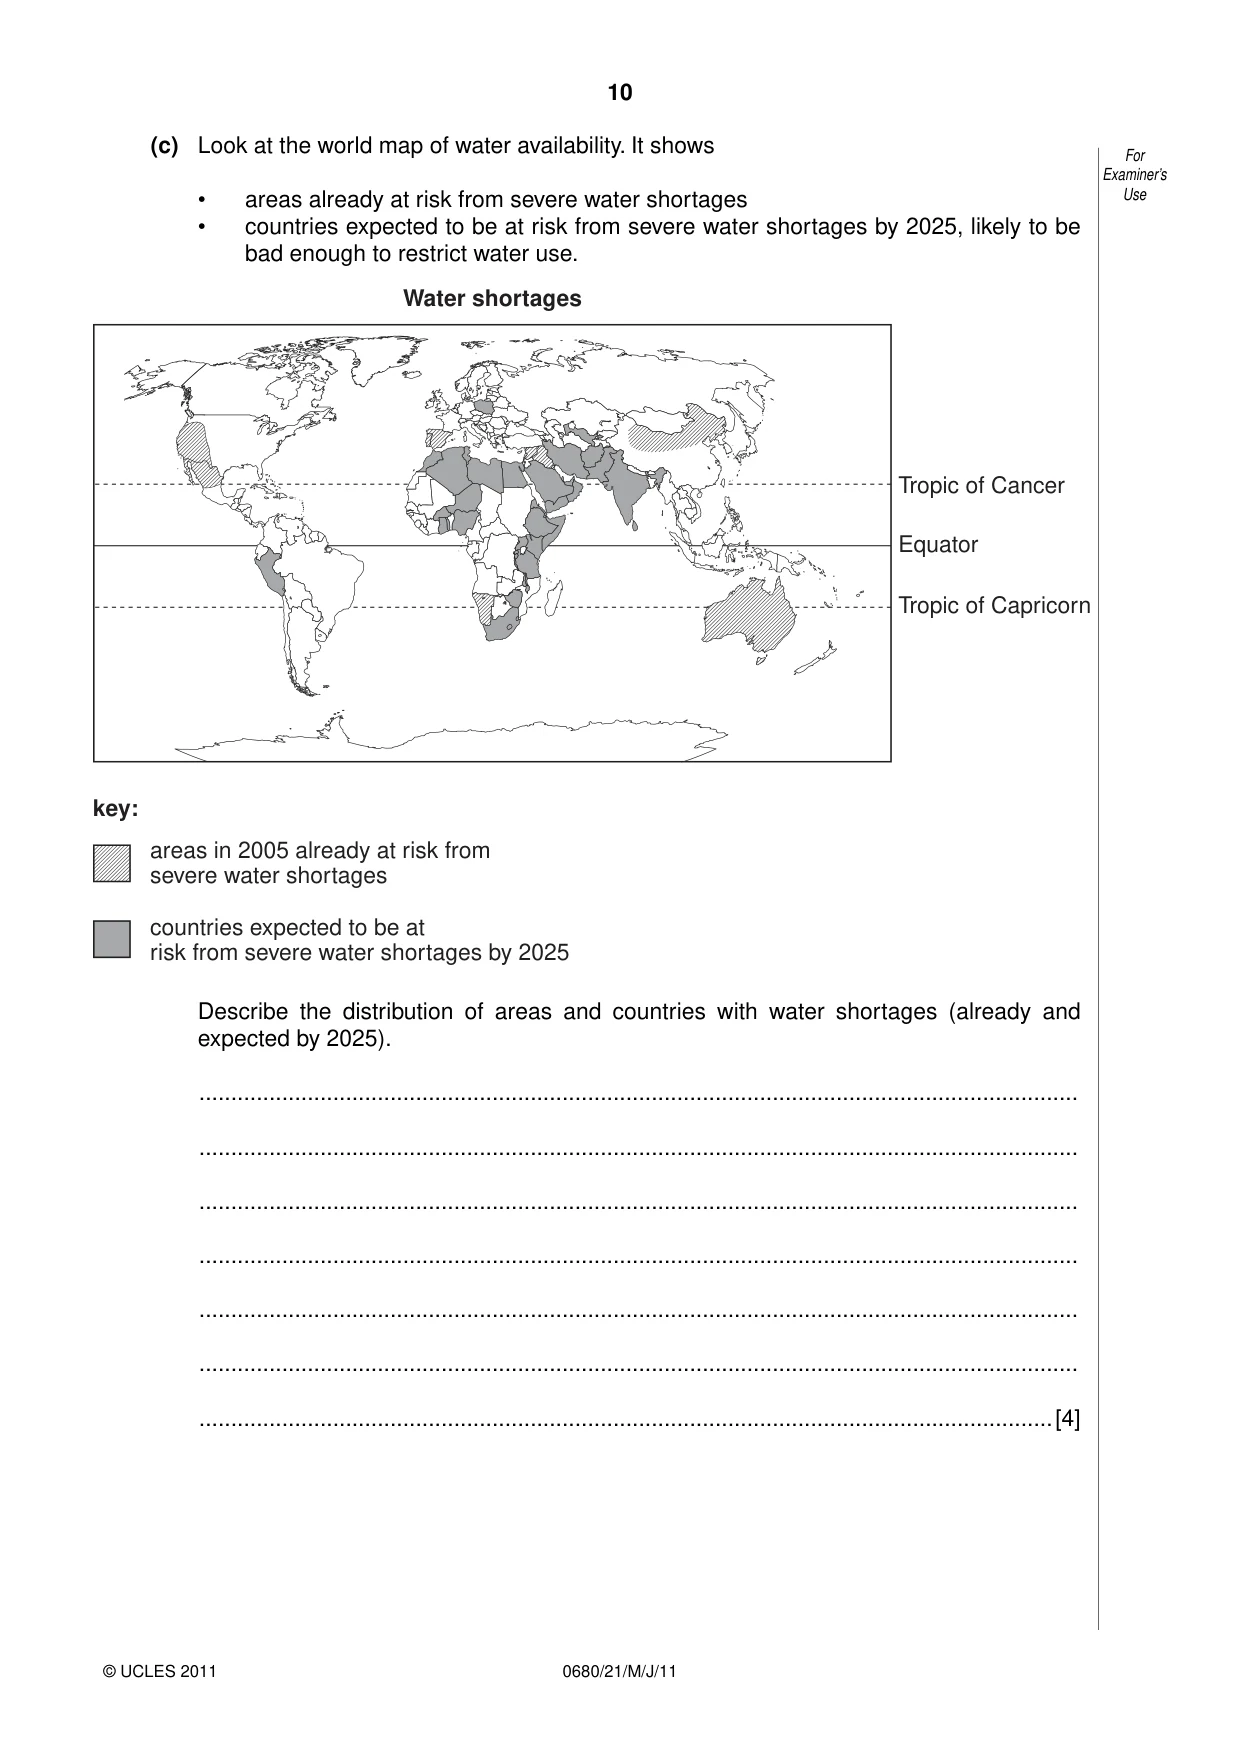
10 0680/21/M/J/11 © UCLES 2011 For Examiner’s Use (c) Look at the world map of water availability. It shows • areas already at risk from severe water shortages • countries expected to be at risk from severe water shortages by 2025, likely to be bad enough to restrict water use. Tropic of Cancer key: areas in 2005 already at risk from severe water shortages countries expected to be at risk from severe water shortages by 2025 Equator Water shortages Tropic of Capricorn Describe the distribution of areas and countries with water shortages (already and expected by 2025). … … … … … … …[4]
Question paper, page 11
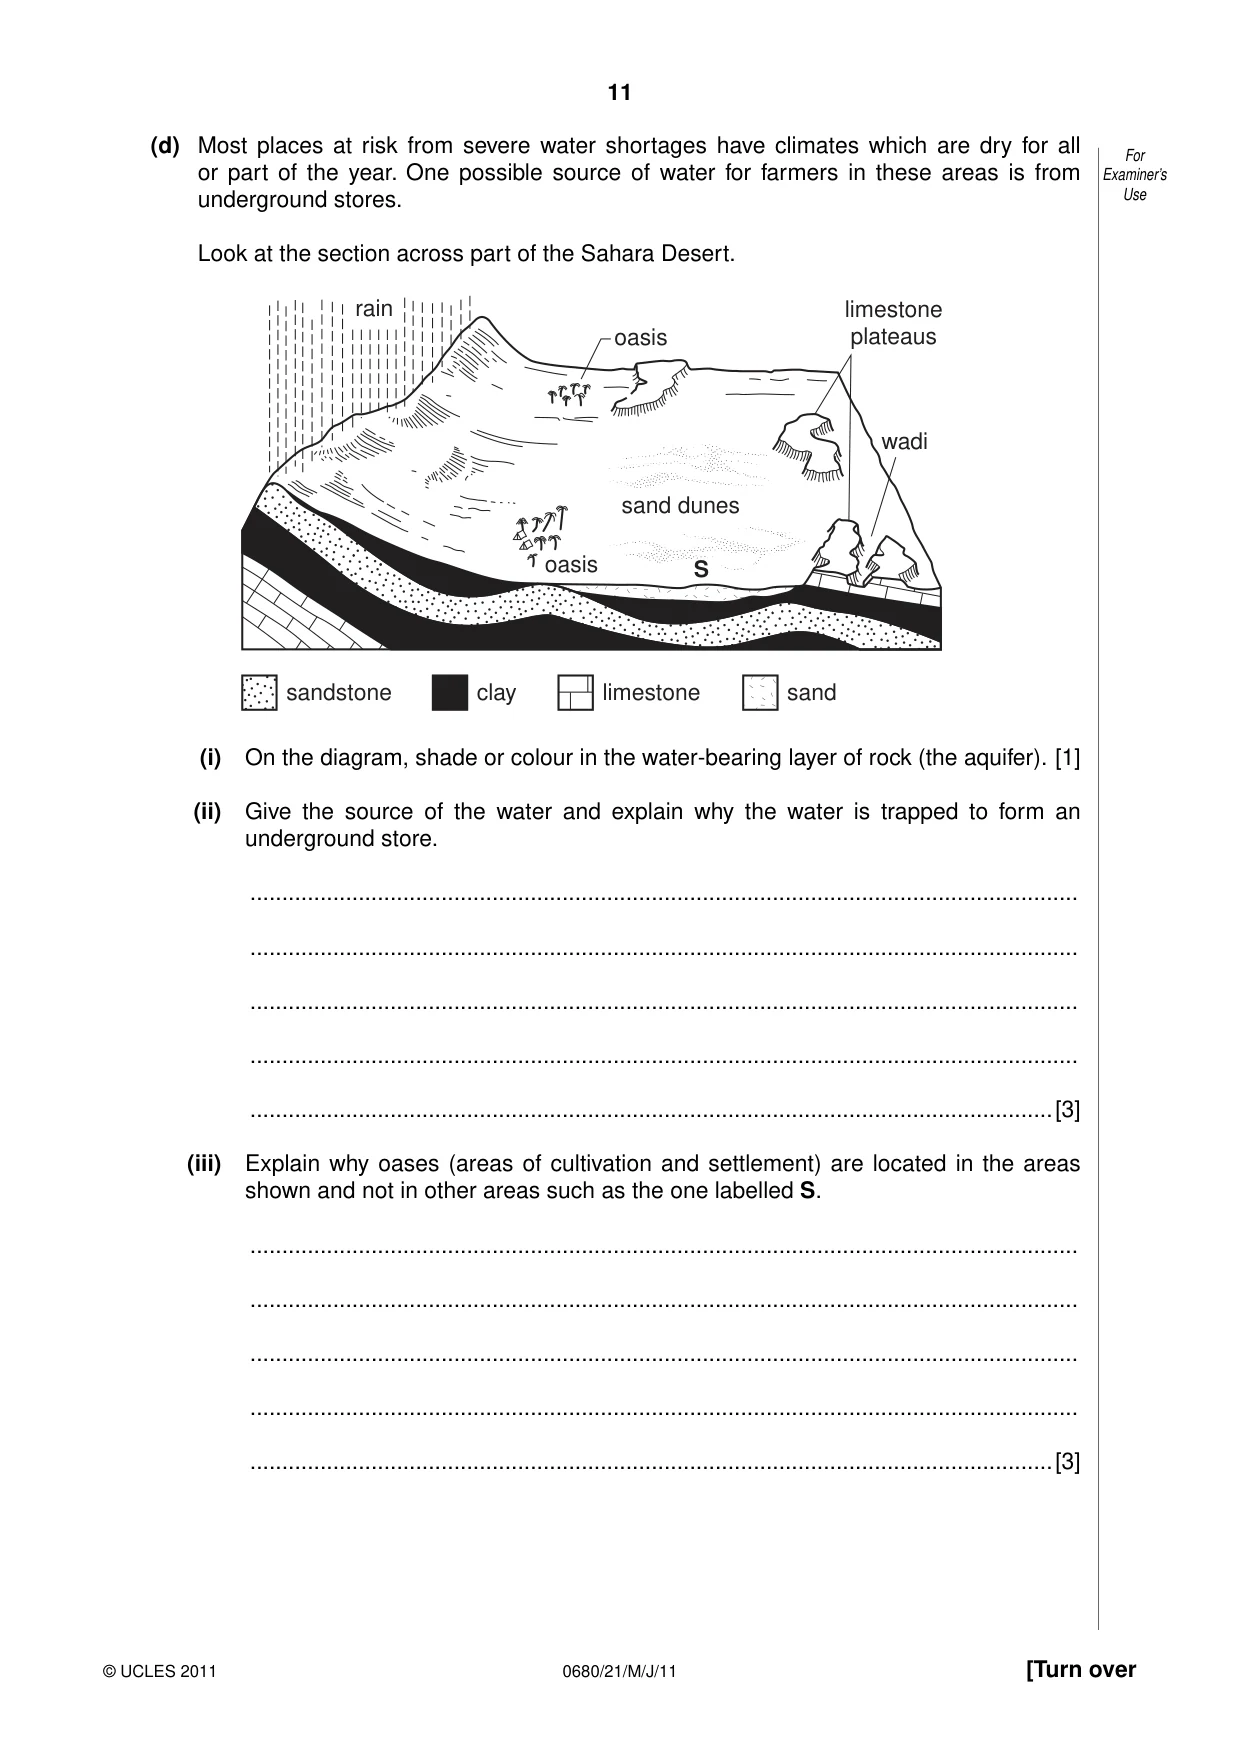
11 0680/21/M/J/11 © UCLES 2011 [Turn over For Examiner’s Use (d) Most places at risk from severe water shortages have climates which are dry for all or part of the year. One possible source of water for farmers in these areas is from underground stores. Look at the section across part of the Sahara Desert. S oasis sandstone oasis limestone plateaus wadi rain sand dunes clay limestone sand (i) On the diagram, shade or colour in the water-bearing layer of rock (the aquifer). [1] (ii) Give the source of the water and explain why the water is trapped to form an underground store. … … … … …[3] (iii) Explain why oases (areas of cultivation and settlement) are located in the areas shown and not in other areas such as the one labelled S. … … … … …[3]
Question paper, page 12
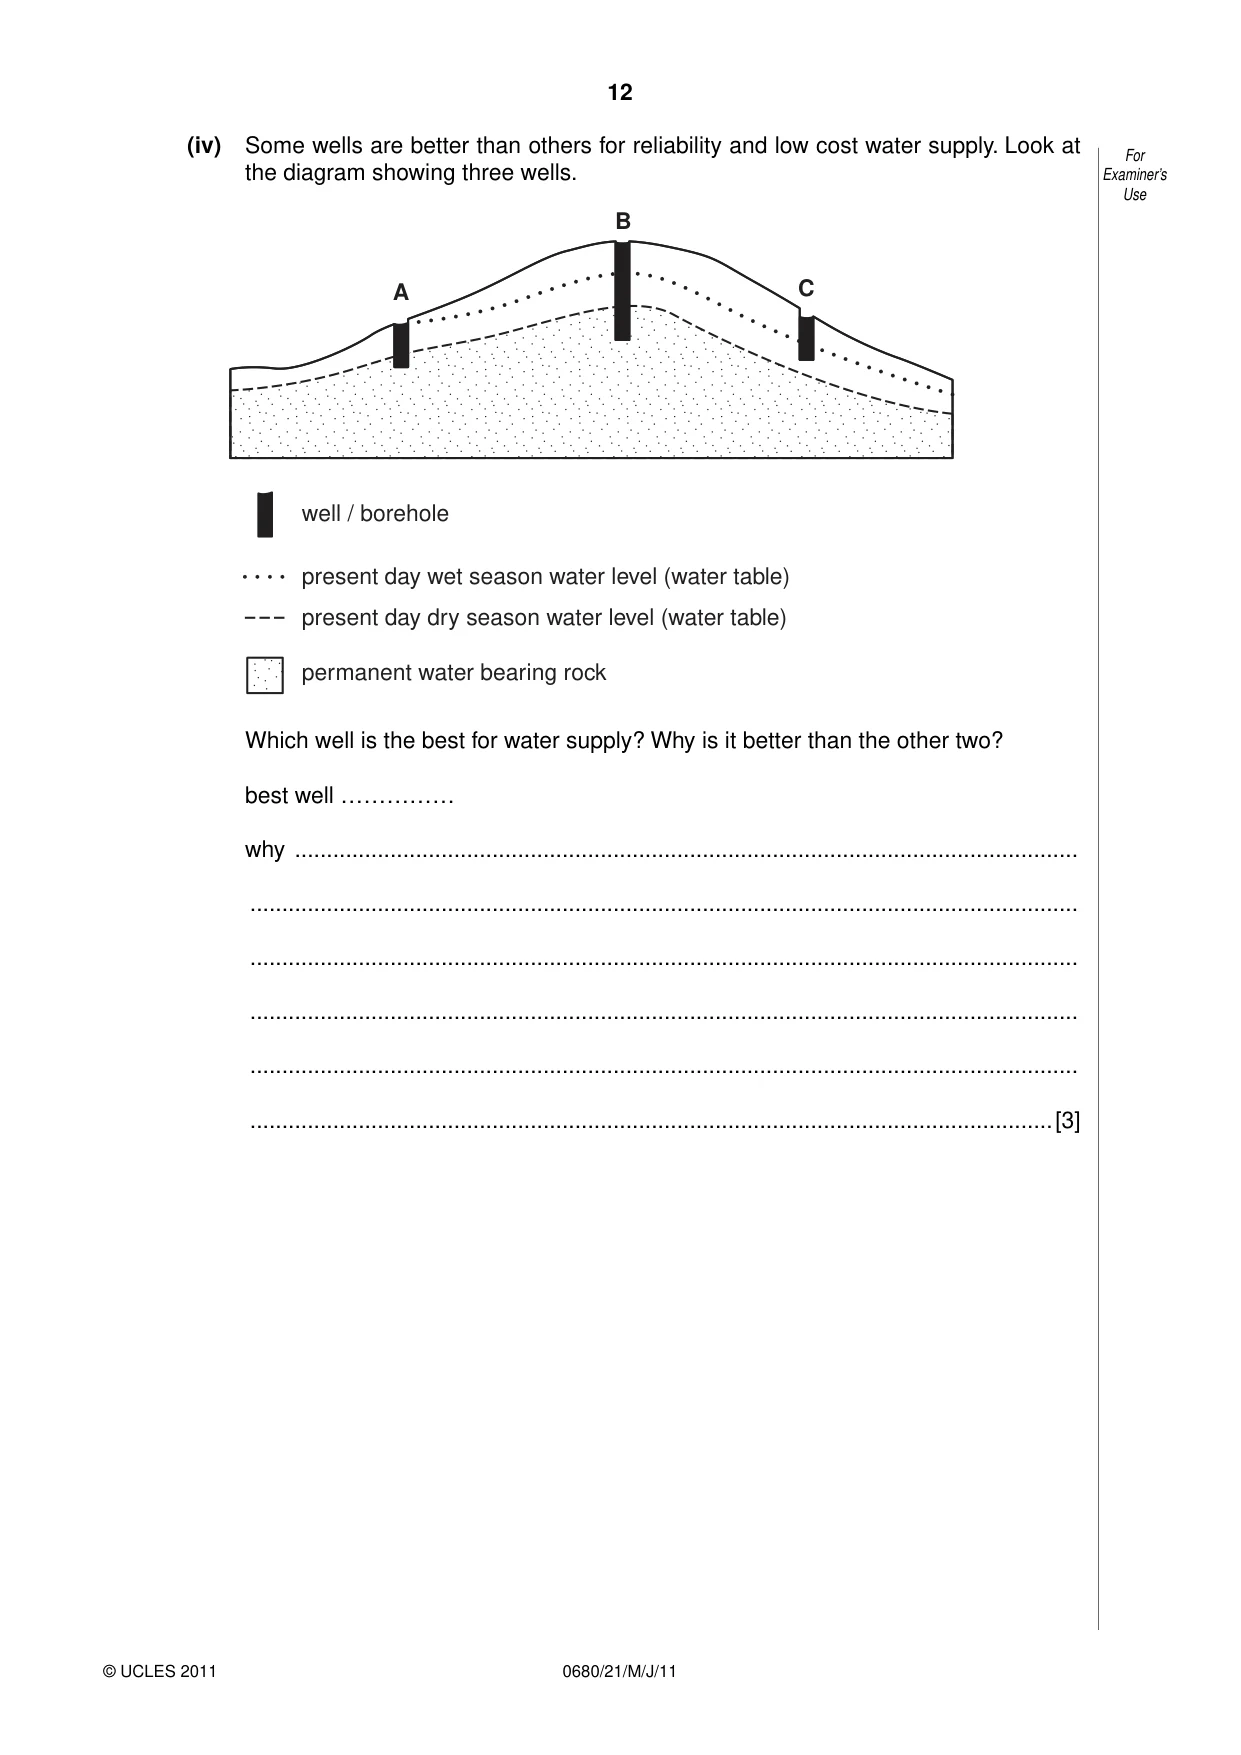
12 0680/21/M/J/11 © UCLES 2011 For Examiner’s Use (iv) Some wells are better than others for reliability and low cost water supply. Look at the diagram showing three wells. A B C well / borehole permanent water bearing rock present day wet season water level (water table) present day dry season water level (water table) Which well is the best for water supply? Why is it better than the other two? best well …………… why … … … … … …[3]
Question paper, page 13
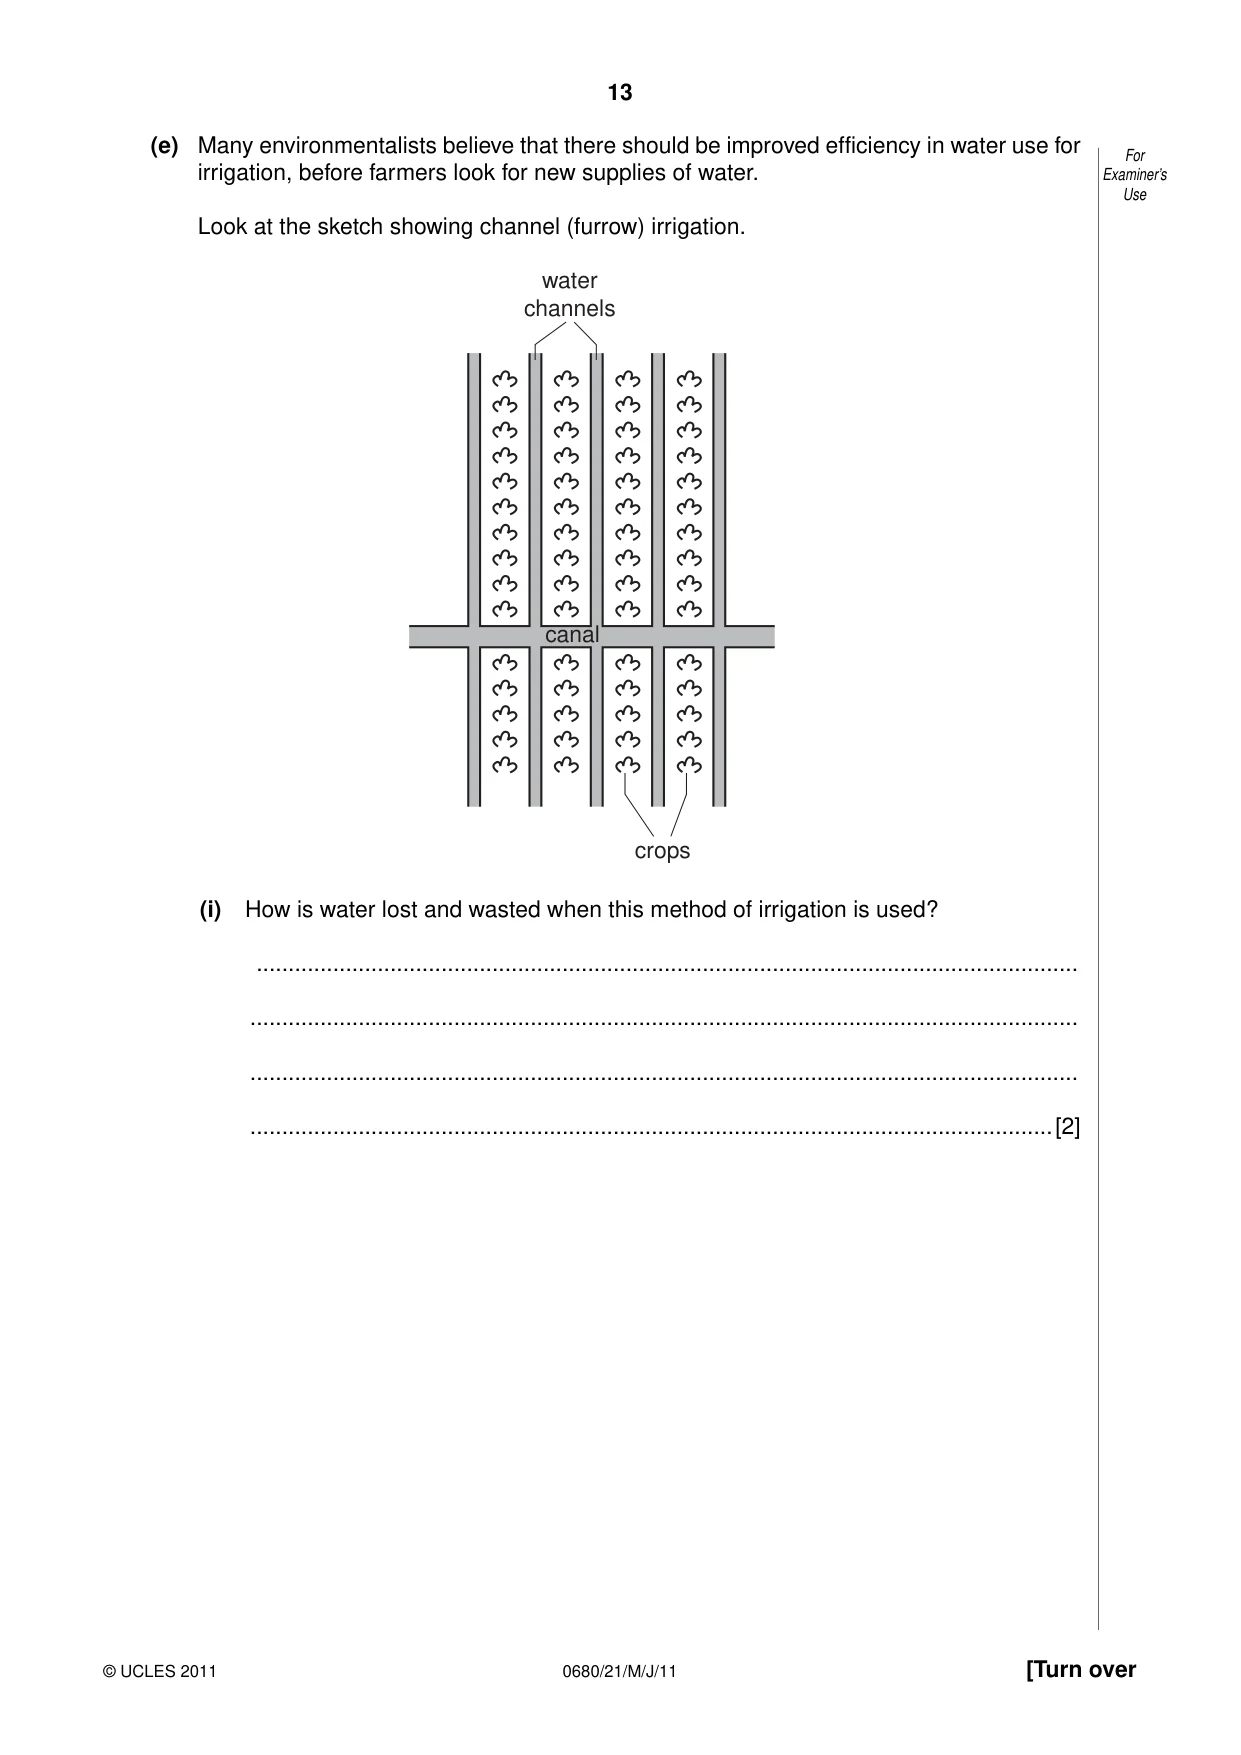
13 0680/21/M/J/11 © UCLES 2011 [Turn over For Examiner’s Use (e) Many environmentalists believe that there should be improved efficiency in water use for irrigation, before farmers look for new supplies of water. Look at the sketch showing channel (furrow) irrigation. water channels crops canal (i) How is water lost and wasted when this method of irrigation is used? … … … …[2]
Question paper, page 14
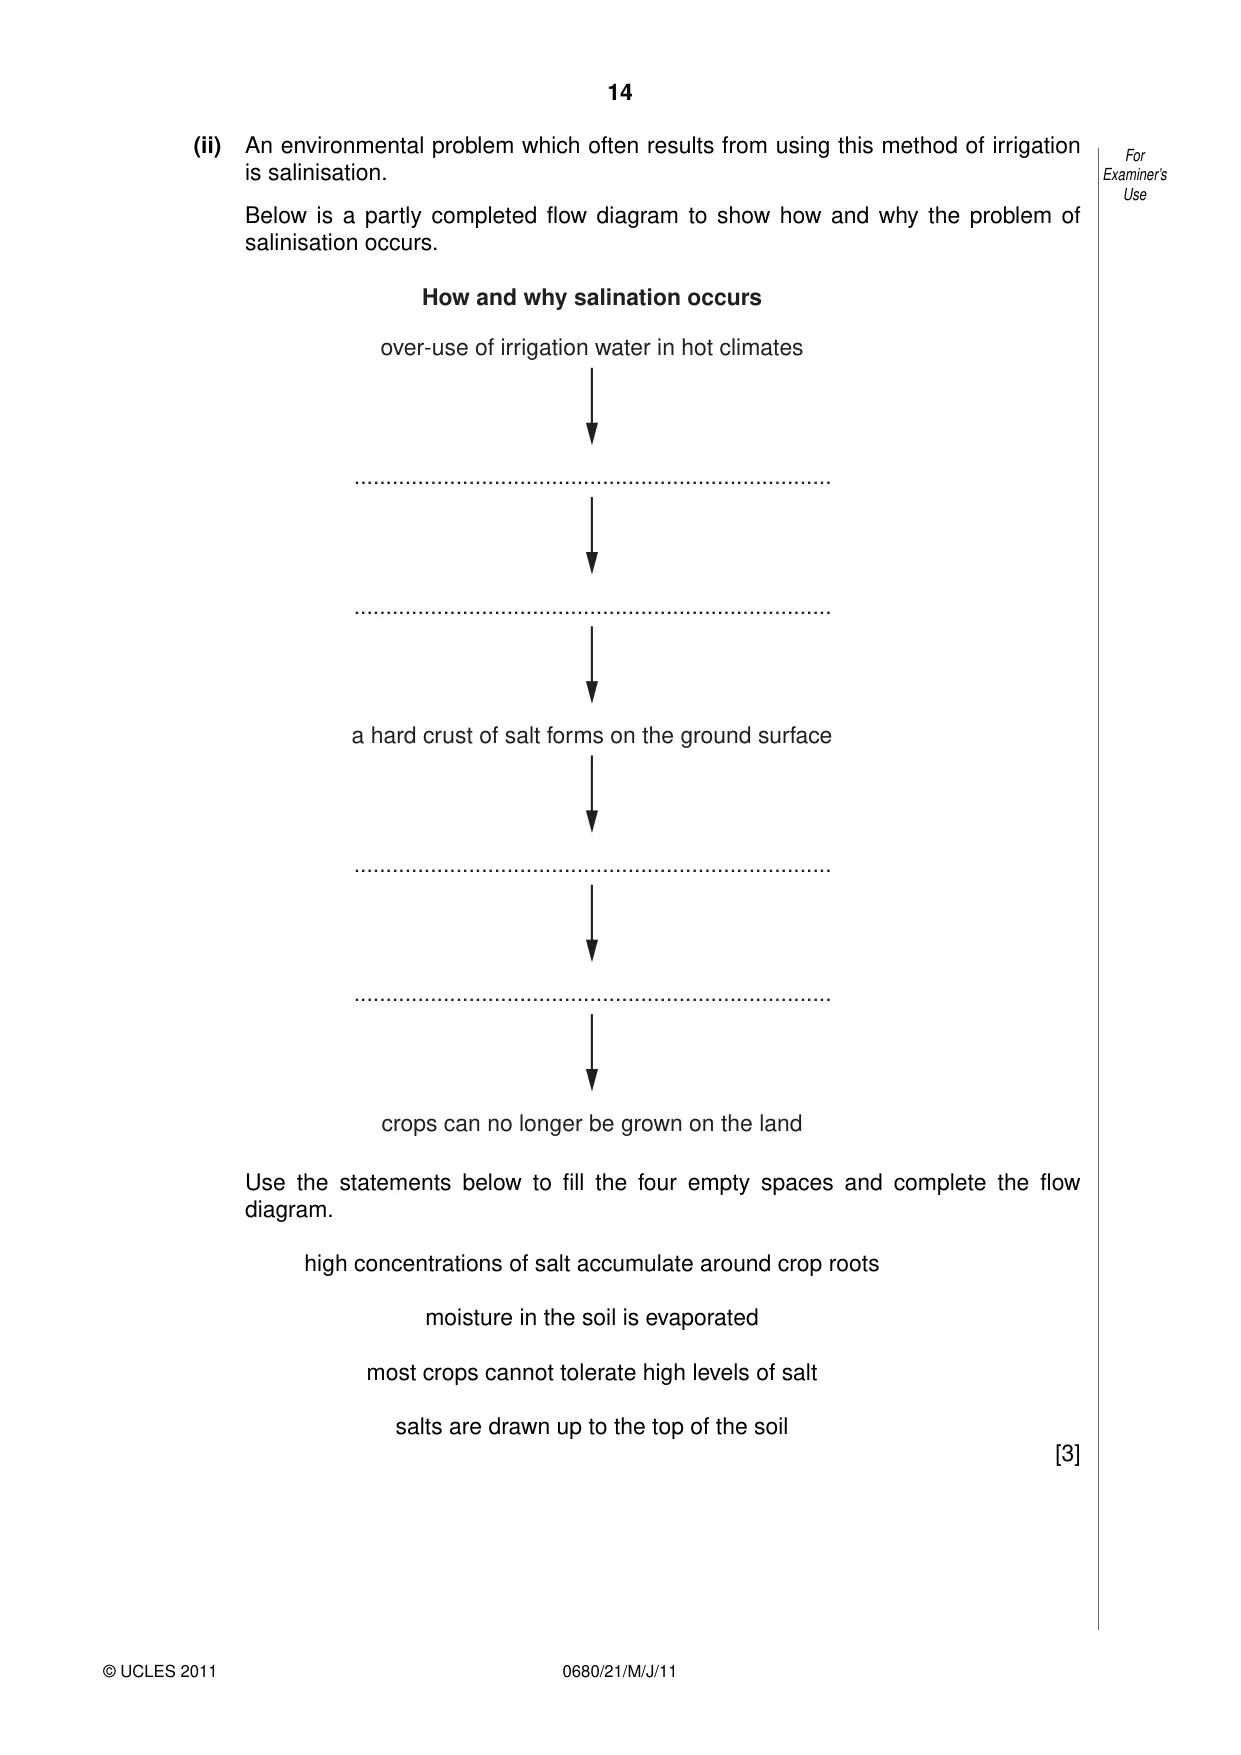
14 0680/21/M/J/11 © UCLES 2011 For Examiner’s Use (ii) An environmental problem which often results from using this method of irrigation is salinisation. Below is a partly completed flow diagram to show how and why the problem of salinisation occurs. How and why salination occurs over-use of irrigation water in hot climates … … a hard crust of salt forms on the ground surface … … crops can no longer be grown on the land Use the statements below to fill the four empty spaces and complete the flow diagram. high concentrations of salt accumulate around crop roots moisture in the soil is evaporated most crops cannot tolerate high levels of salt salts are drawn up to the top of the soil [3]
Question paper, page 15
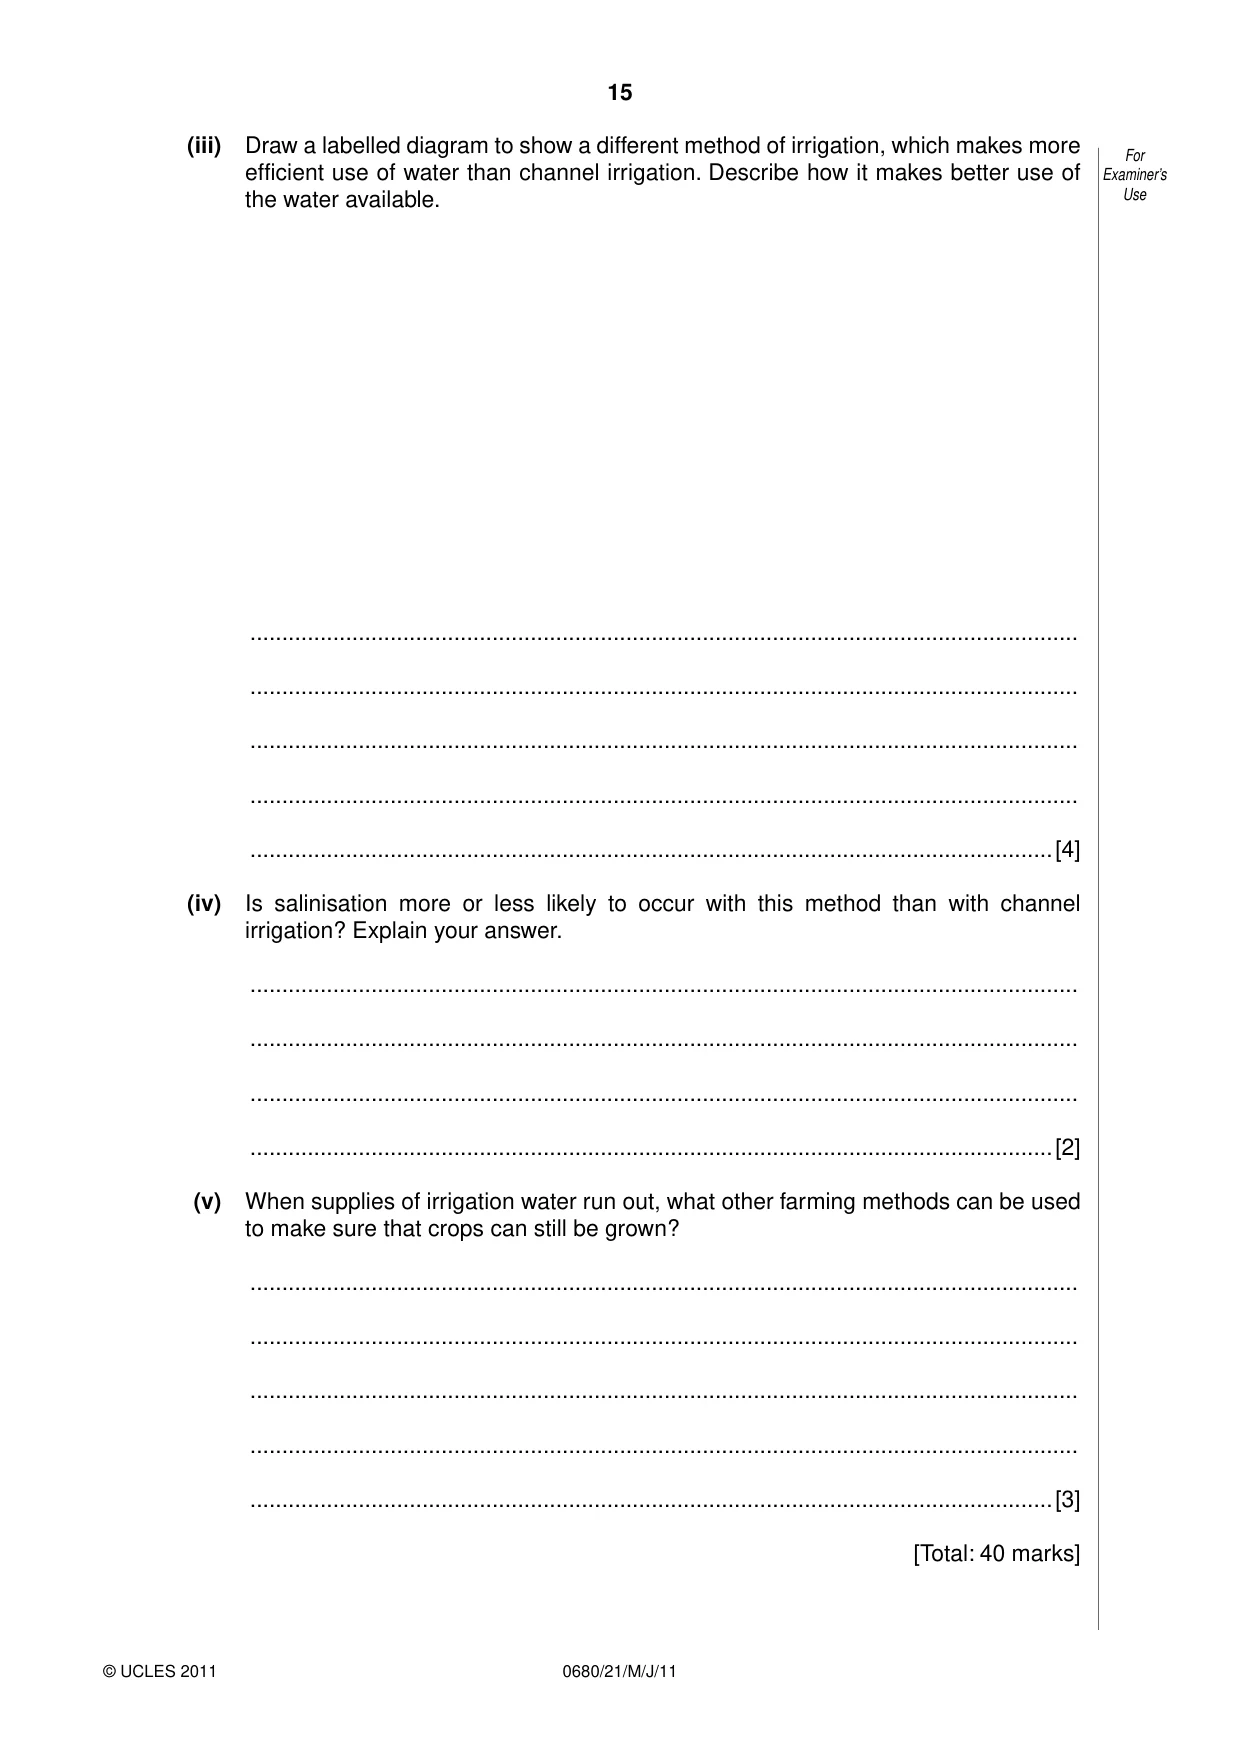
15 0680/21/M/J/11 © UCLES 2011 For Examiner’s Use (iii) Draw a labelled diagram to show a different method of irrigation, which makes more efficient use of water than channel irrigation. Describe how it makes better use of the water available. … … … … …[4] (iv) Is salinisation more or less likely to occur with this method than with channel irrigation? Explain your answer. … … … …[2] (v) When supplies of irrigation water run out, what other farming methods can be used to make sure that crops can still be grown? … … … … …[3] [Total: 40 marks]
Question paper, page 16
16 0680/21/M/J/11 © UCLES 2011 Copyright Acknowledgements: Question 2d © adaptation from: R B Bunnett; Physical Geography in Diagrams; Longman; 1976. Permission to reproduce items where third-party owned material protected by copyright is included has been sought and cleared where possible. Every reasonable effort has been made by the publisher (UCLES) to trace copyright holders, but if any items requiring clearance have unwittingly been included, the publisher will be pleased to make amends at the earliest possible opportunity. University of Cambridge International Examinations is part of the Cambridge Assessment Group. Cambridge Assessment is the brand name of University of Cambridge Local Examinations Syndicate (UCLES), which is itself a department of the University of Cambridge. BLANK PAGE
Mark scheme, page 1
UNIVERSITY OF CAMBRIDGE INTERNATIONAL EXAMINATIONS International General Certificate of Secondary Education MARK SCHEME for the May/June 2011 question paper for the guidance of teachers 0680 ENVIRONMENTAL MANAGEMENT 0680/21 Paper 2, maximum raw mark 80 This mark scheme is published as an aid to teachers and candidates, to indicate the requirements of the examination. It shows the basis on which Examiners were instructed to award marks. It does not indicate the details of the discussions that took place at an Examiners’ meeting before marking began, which would have considered the acceptability of alternative answers. Mark schemes must be read in conjunction with the question papers and the report on the examination. • Cambridge will not enter into discussions or correspondence in connection with these mark schemes. Cambridge is publishing the mark schemes for the May/June 2011 question papers for most IGCSE, GCE Advanced Level and Advanced Subsidiary Level syllabuses and some Ordinary Level syllabuses. www.XtremePapers.com
Mark scheme, page 2
Page 2 Mark Scheme: Teachers’ version Syllabus Paper IGCSE – May/June 2011 0680 21 © University of Cambridge International Examinations 2011 1 (a) (i) Wind vane – wind direction Anemometer – wind speed 2 @ 1 mark One correct, or both names without correct measures, or both measures without names = 1 mark [2] (ii) Work – both have arms rotated by the wind, fixed high up at the top of a long pole Site – in an open space / on top of buildings, away from the shelter of trees / buildings At least one similarity for each needed for full marks. 3 @ 1 mark [3] (b) (i) Axes drawn and labelled (vertical for costs and horizontal for power sources), accurate plots = 2 marks (at least two correct = 1 mark), overall appearance / effectiveness / completeness. 4 @ 1 mark [4] (ii) Wind power is much cheaper than other renewables (wave, tidal, solar), wave/tidal is about three times more expensive and solar nine times, but more expensive than longer established sources such as fossil fuels and nuclear, although not by large amount with fewer environmental effects. Conclusion – costs given suggest a greater likelihood of further use than from other renewables in the UK. Up to two marks for valid points made about relative costs of wind power. One mark for overall comment relating to the question. [3] (iii) Costs of obtaining raw materials are different e.g. local oil in the Middle East, so fossil fuel cost of production lower = one approach to answering up to 2 marks. Renewables listed rely upon nature – other countries will have more sun / less wind than the UK, desert countries / tropics more and hotter sunshine = another approach up to 2 marks. One mark for each of the two approaches also possible. [2]
Mark scheme, page 3
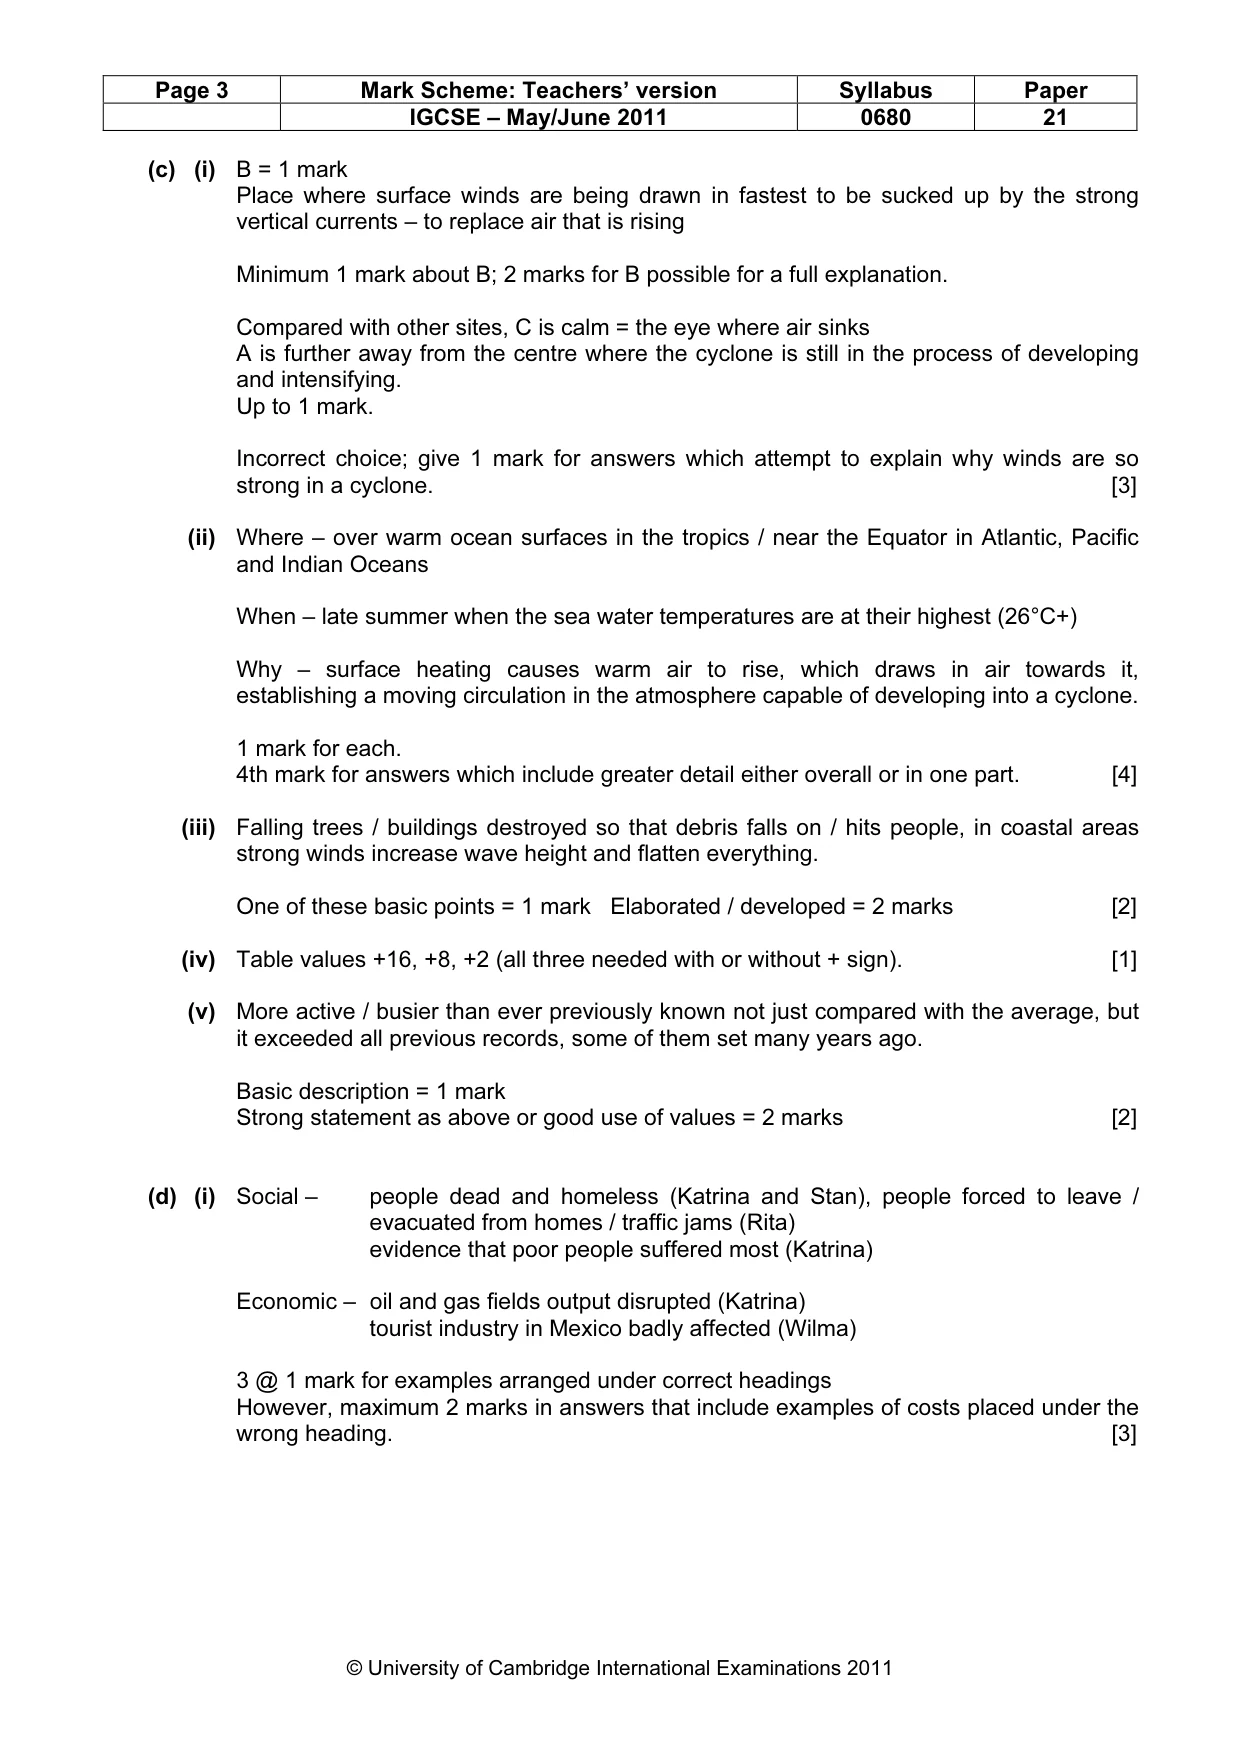
Page 3 Mark Scheme: Teachers’ version Syllabus Paper IGCSE – May/June 2011 0680 21 © University of Cambridge International Examinations 2011 (c) (i) B = 1 mark Place where surface winds are being drawn in fastest to be sucked up by the strong vertical currents – to replace air that is rising Minimum 1 mark about B; 2 marks for B possible for a full explanation. Compared with other sites, C is calm = the eye where air sinks A is further away from the centre where the cyclone is still in the process of developing and intensifying. Up to 1 mark. Incorrect choice; give 1 mark for answers which attempt to explain why winds are so strong in a cyclone. [3] (ii) Where – over warm ocean surfaces in the tropics / near the Equator in Atlantic, Pacific and Indian Oceans When – late summer when the sea water temperatures are at their highest (26°C+) Why – surface heating causes warm air to rise, which draws in air towards it, establishing a moving circulation in the atmosphere capable of developing into a cyclone. 1 mark for each. 4th mark for answers which include greater detail either overall or in one part. [4] (iii) Falling trees / buildings destroyed so that debris falls on / hits people, in coastal areas strong winds increase wave height and flatten everything. One of these basic points = 1 mark Elaborated / developed = 2 marks [2] (iv) Table values +16, +8, +2 (all three needed with or without + sign). [1] (v) More active / busier than ever previously known not just compared with the average, but it exceeded all previous records, some of them set many years ago. Basic description = 1 mark Strong statement as above or good use of values = 2 marks [2] (d) (i) Social – people dead and homeless (Katrina and Stan), people forced to leave / evacuated from homes / traffic jams (Rita) evidence that poor people suffered most (Katrina) Economic – oil and gas fields output disrupted (Katrina) tourist industry in Mexico badly affected (Wilma) 3 @ 1 mark for examples arranged under correct headings However, maximum 2 marks in answers that include examples of costs placed under the wrong heading. [3]
Mark scheme, page 4
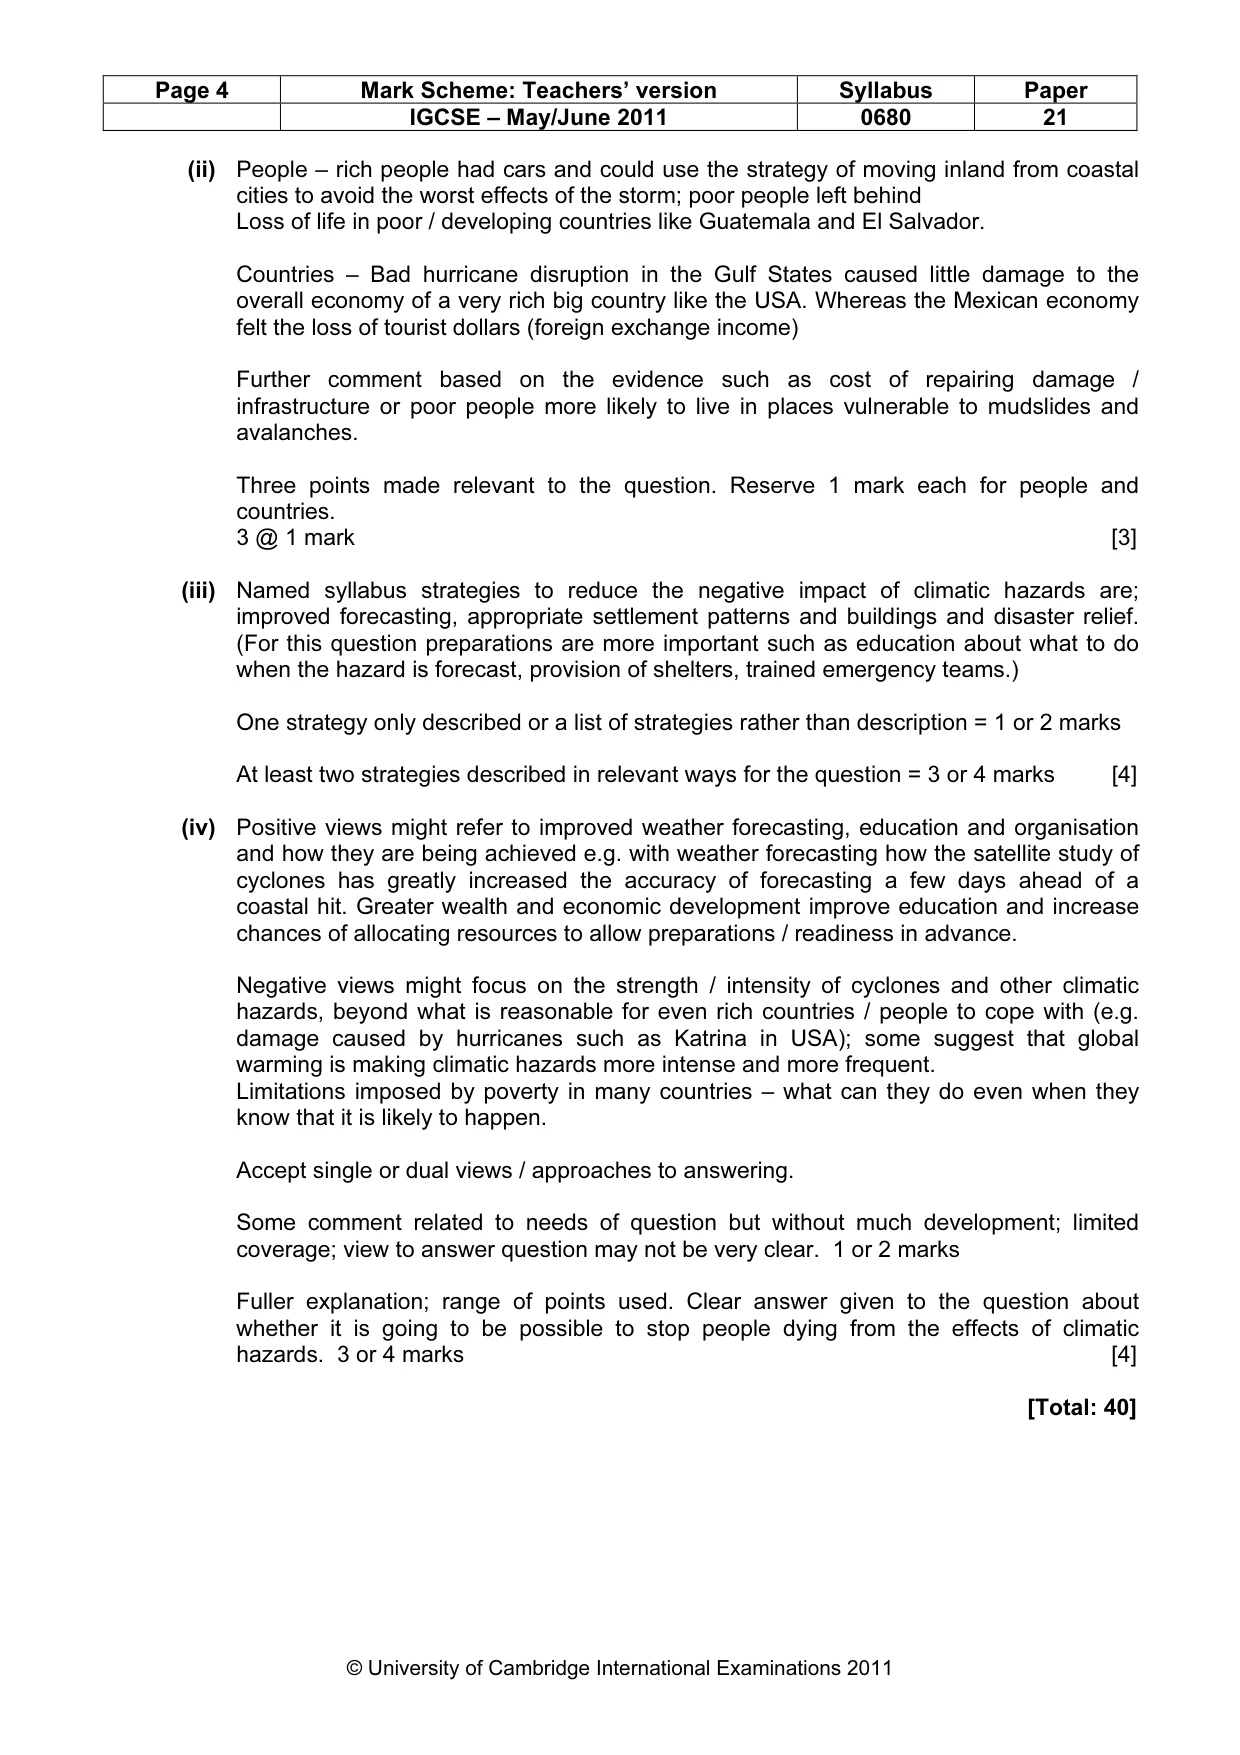
Page 4 Mark Scheme: Teachers’ version Syllabus Paper IGCSE – May/June 2011 0680 21 © University of Cambridge International Examinations 2011 (ii) People – rich people had cars and could use the strategy of moving inland from coastal cities to avoid the worst effects of the storm; poor people left behind Loss of life in poor / developing countries like Guatemala and El Salvador. Countries – Bad hurricane disruption in the Gulf States caused little damage to the overall economy of a very rich big country like the USA. Whereas the Mexican economy felt the loss of tourist dollars (foreign exchange income) Further comment based on the evidence such as cost of repairing damage / infrastructure or poor people more likely to live in places vulnerable to mudslides and avalanches. Three points made relevant to the question. Reserve 1 mark each for people and countries. 3 @ 1 mark [3] (iii) Named syllabus strategies to reduce the negative impact of climatic hazards are; improved forecasting, appropriate settlement patterns and buildings and disaster relief. (For this question preparations are more important such as education about what to do when the hazard is forecast, provision of shelters, trained emergency teams.) One strategy only described or a list of strategies rather than description = 1 or 2 marks At least two strategies described in relevant ways for the question = 3 or 4 marks [4] (iv) Positive views might refer to improved weather forecasting, education and organisation and how they are being achieved e.g. with weather forecasting how the satellite study of cyclones has greatly increased the accuracy of forecasting a few days ahead of a coastal hit. Greater wealth and economic development improve education and increase chances of allocating resources to allow preparations / readiness in advance. Negative views might focus on the strength / intensity of cyclones and other climatic hazards, beyond what is reasonable for even rich countries / people to cope with (e.g. damage caused by hurricanes such as Katrina in USA); some suggest that global warming is making climatic hazards more intense and more frequent. Limitations imposed by poverty in many countries – what can they do even when they know that it is likely to happen. Accept single or dual views / approaches to answering. Some comment related to needs of question but without much development; limited coverage; view to answer question may not be very clear. 1 or 2 marks Fuller explanation; range of points used. Clear answer given to the question about whether it is going to be possible to stop people dying from the effects of climatic hazards. 3 or 4 marks [4] [Total: 40]
Mark scheme, page 5
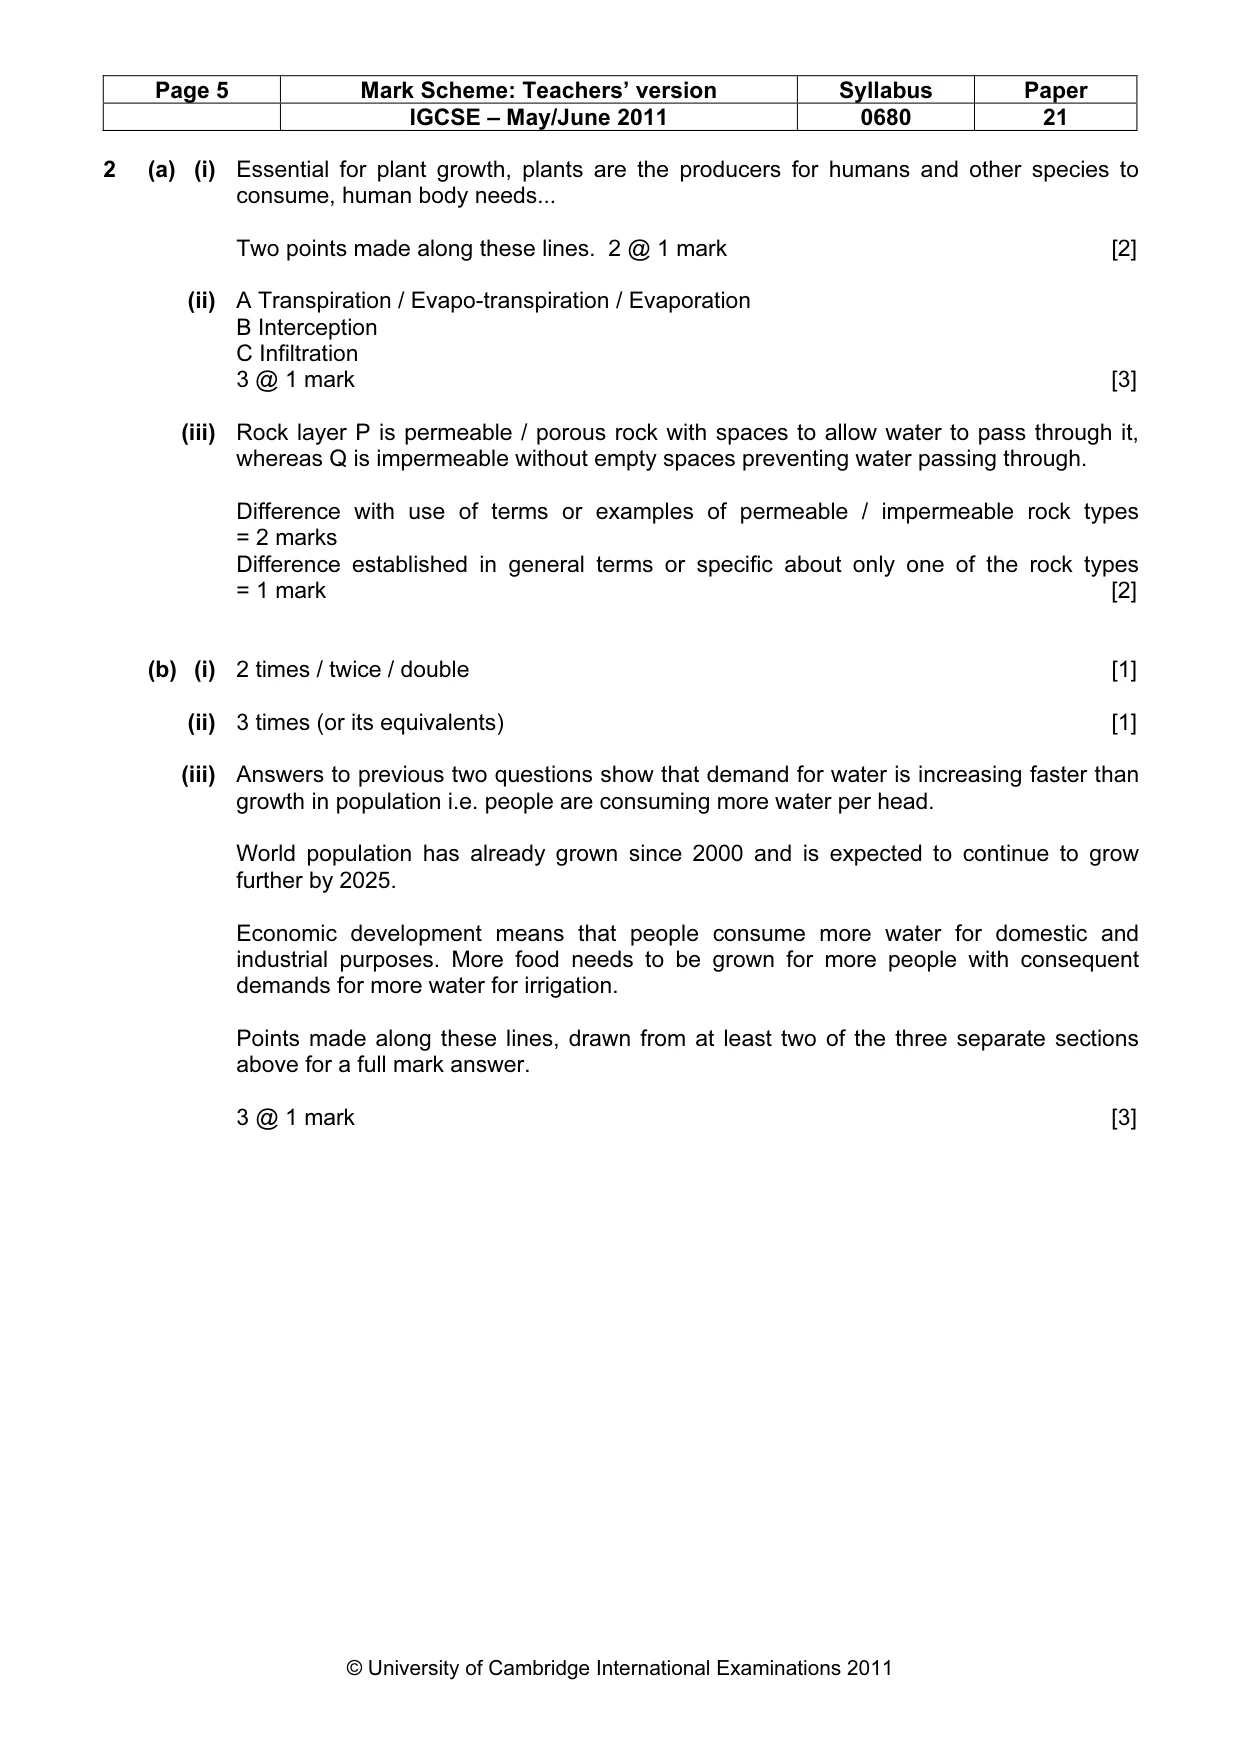
Page 5 Mark Scheme: Teachers’ version Syllabus Paper IGCSE – May/June 2011 0680 21 © University of Cambridge International Examinations 2011 2 (a) (i) Essential for plant growth, plants are the producers for humans and other species to consume, human body needs... Two points made along these lines. 2 @ 1 mark [2] (ii) A Transpiration / Evapo-transpiration / Evaporation B Interception C Infiltration 3 @ 1 mark [3] (iii) Rock layer P is permeable / porous rock with spaces to allow water to pass through it, whereas Q is impermeable without empty spaces preventing water passing through. Difference with use of terms or examples of permeable / impermeable rock types = 2 marks Difference established in general terms or specific about only one of the rock types = 1 mark [2] (b) (i) 2 times / twice / double [1] (ii) 3 times (or its equivalents) [1] (iii) Answers to previous two questions show that demand for water is increasing faster than growth in population i.e. people are consuming more water per head. World population has already grown since 2000 and is expected to continue to grow further by 2025. Economic development means that people consume more water for domestic and industrial purposes. More food needs to be grown for more people with consequent demands for more water for irrigation. Points made along these lines, drawn from at least two of the three separate sections above for a full mark answer. 3 @ 1 mark [3]
Mark scheme, page 6
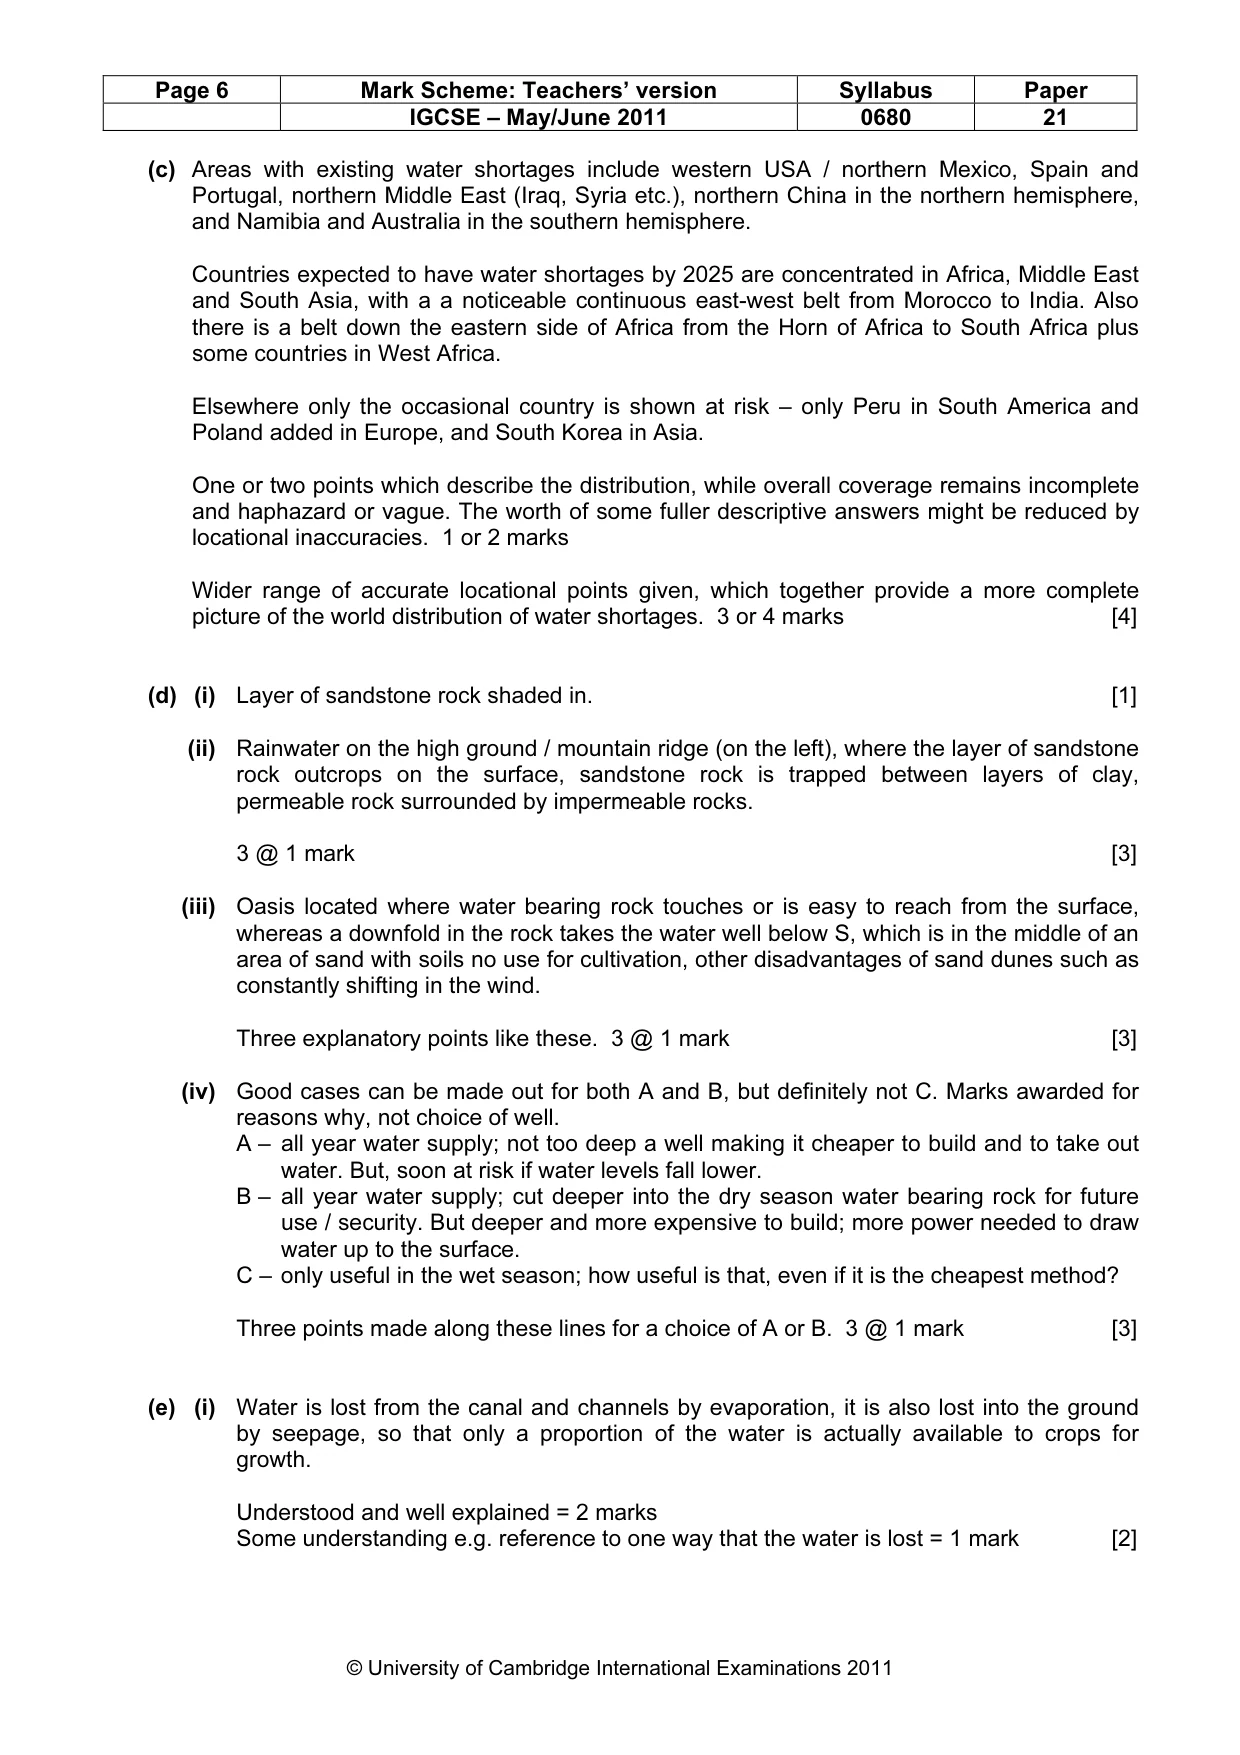
Page 6 Mark Scheme: Teachers’ version Syllabus Paper IGCSE – May/June 2011 0680 21 © University of Cambridge International Examinations 2011 (c) Areas with existing water shortages include western USA / northern Mexico, Spain and Portugal, northern Middle East (Iraq, Syria etc.), northern China in the northern hemisphere, and Namibia and Australia in the southern hemisphere. Countries expected to have water shortages by 2025 are concentrated in Africa, Middle East and South Asia, with a a noticeable continuous east-west belt from Morocco to India. Also there is a belt down the eastern side of Africa from the Horn of Africa to South Africa plus some countries in West Africa. Elsewhere only the occasional country is shown at risk – only Peru in South America and Poland added in Europe, and South Korea in Asia. One or two points which describe the distribution, while overall coverage remains incomplete and haphazard or vague. The worth of some fuller descriptive answers might be reduced by locational inaccuracies. 1 or 2 marks Wider range of accurate locational points given, which together provide a more complete picture of the world distribution of water shortages. 3 or 4 marks [4] (d) (i) Layer of sandstone rock shaded in. [1] (ii) Rainwater on the high ground / mountain ridge (on the left), where the layer of sandstone rock outcrops on the surface, sandstone rock is trapped between layers of clay, permeable rock surrounded by impermeable rocks. 3 @ 1 mark [3] (iii) Oasis located where water bearing rock touches or is easy to reach from the surface, whereas a downfold in the rock takes the water well below S, which is in the middle of an area of sand with soils no use for cultivation, other disadvantages of sand dunes such as constantly shifting in the wind. Three explanatory points like these. 3 @ 1 mark [3] (iv) Good cases can be made out for both A and B, but definitely not C. Marks awarded for reasons why, not choice of well. A – all year water supply; not too deep a well making it cheaper to build and to take out water. But, soon at risk if water levels fall lower. B – all year water supply; cut deeper into the dry season water bearing rock for future use / security. But deeper and more expensive to build; more power needed to draw water up to the surface. C – only useful in the wet season; how useful is that, even if it is the cheapest method? Three points made along these lines for a choice of A or B. 3 @ 1 mark [3] (e) (i) Water is lost from the canal and channels by evaporation, it is also lost into the ground by seepage, so that only a proportion of the water is actually available to crops for growth. Understood and well explained = 2 marks Some understanding e.g. reference to one way that the water is lost = 1 mark [2]
Mark scheme, page 7
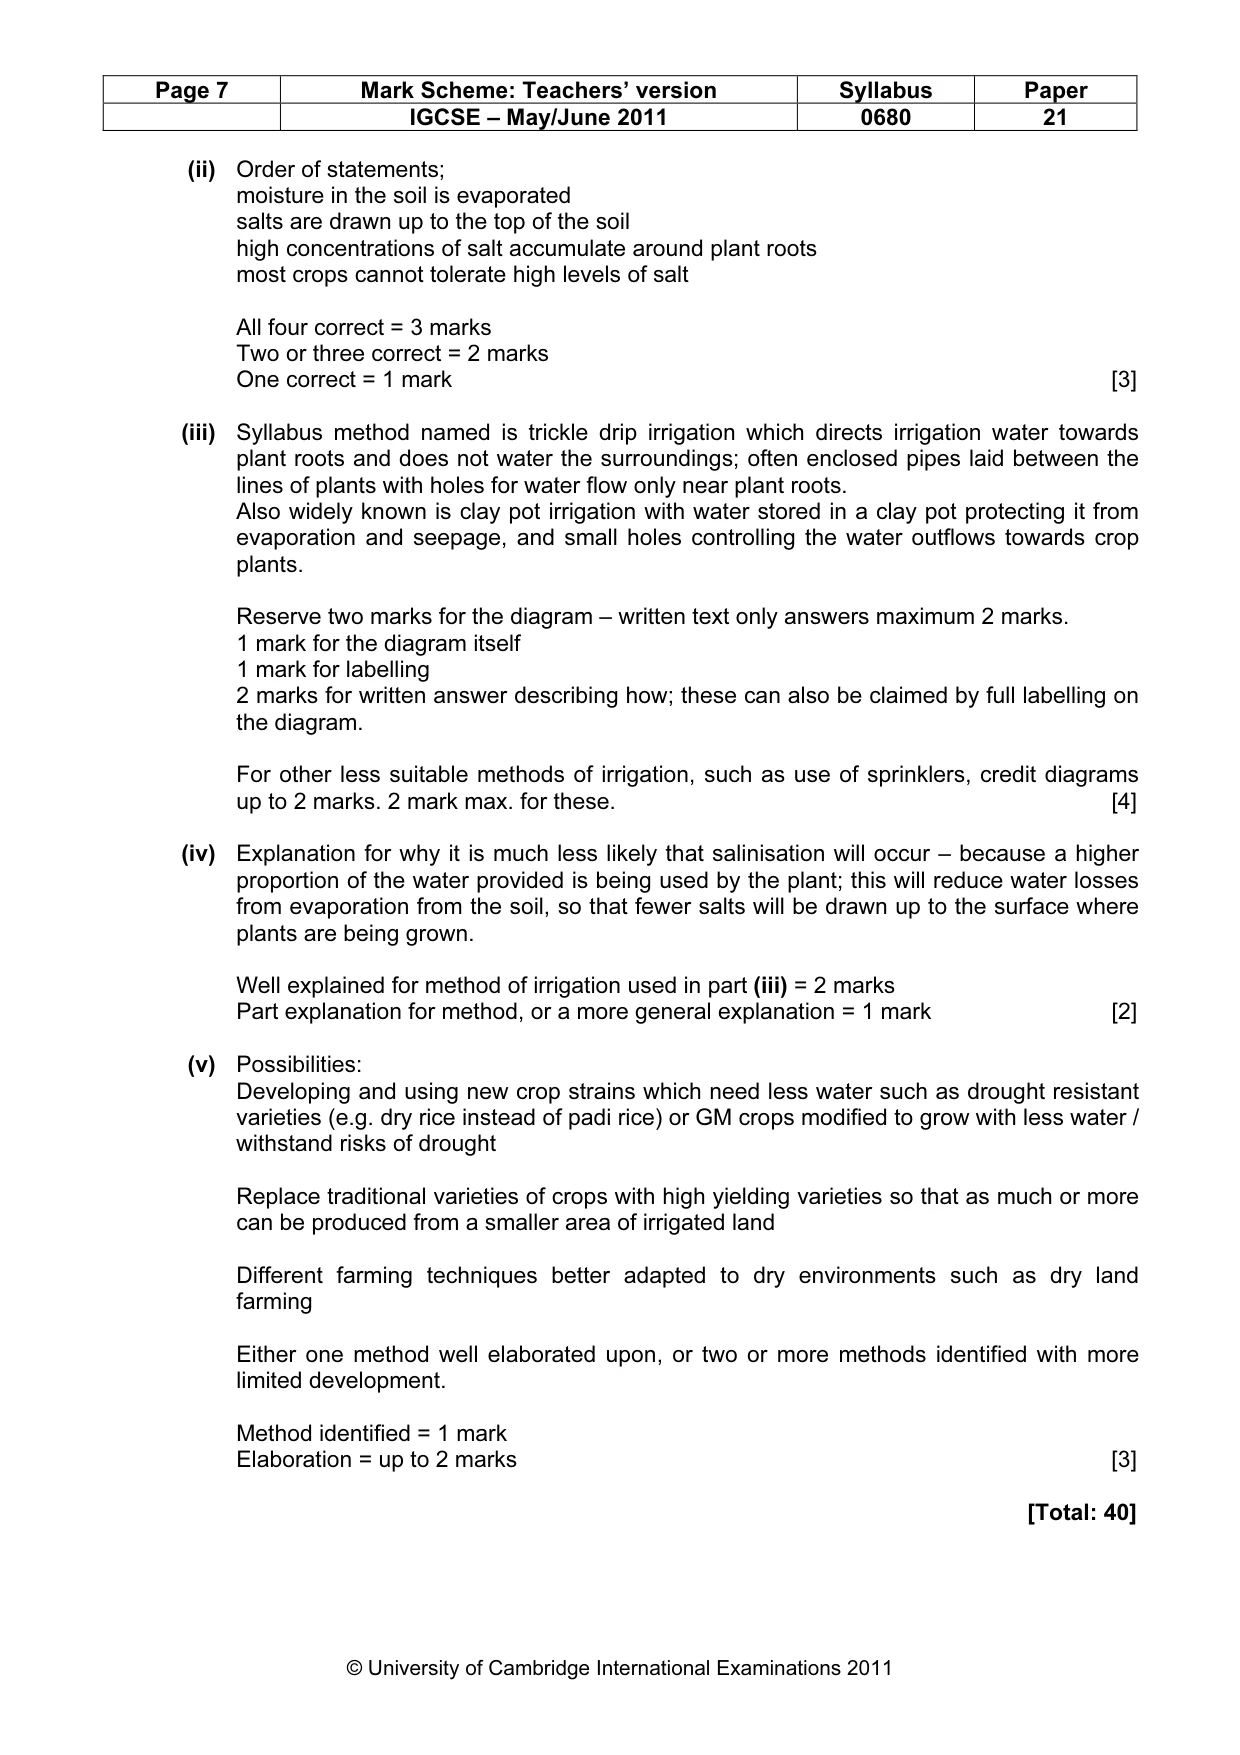
Page 7 Mark Scheme: Teachers’ version Syllabus Paper IGCSE – May/June 2011 0680 21 © University of Cambridge International Examinations 2011 (ii) Order of statements; moisture in the soil is evaporated salts are drawn up to the top of the soil high concentrations of salt accumulate around plant roots most crops cannot tolerate high levels of salt All four correct = 3 marks Two or three correct = 2 marks One correct = 1 mark [3] (iii) Syllabus method named is trickle drip irrigation which directs irrigation water towards plant roots and does not water the surroundings; often enclosed pipes laid between the lines of plants with holes for water flow only near plant roots. Also widely known is clay pot irrigation with water stored in a clay pot protecting it from evaporation and seepage, and small holes controlling the water outflows towards crop plants. Reserve two marks for the diagram – written text only answers maximum 2 marks. 1 mark for the diagram itself 1 mark for labelling 2 marks for written answer describing how; these can also be claimed by full labelling on the diagram. For other less suitable methods of irrigation, such as use of sprinklers, credit diagrams up to 2 marks. 2 mark max. for these. [4] (iv) Explanation for why it is much less likely that salinisation will occur – because a higher proportion of the water provided is being used by the plant; this will reduce water losses from evaporation from the soil, so that fewer salts will be drawn up to the surface where plants are being grown. Well explained for method of irrigation used in part (iii) = 2 marks Part explanation for method, or a more general explanation = 1 mark [2] (v) Possibilities: Developing and using new crop strains which need less water such as drought resistant varieties (e.g. dry rice instead of padi rice) or GM crops modified to grow with less water / withstand risks of drought Replace traditional varieties of crops with high yielding varieties so that as much or more can be produced from a smaller area of irrigated land Different farming techniques better adapted to dry environments such as dry land farming Either one method well elaborated upon, or two or more methods identified with more limited development. Method identified = 1 mark Elaboration = up to 2 marks [3] [Total: 40]
What you needed in this session
Cambridge’s own grade thresholds for 2011 May/June, Paper 2 · Variant 1. A higher threshold means an easier paper — the bar moves with how the cohort did.