Questions as text
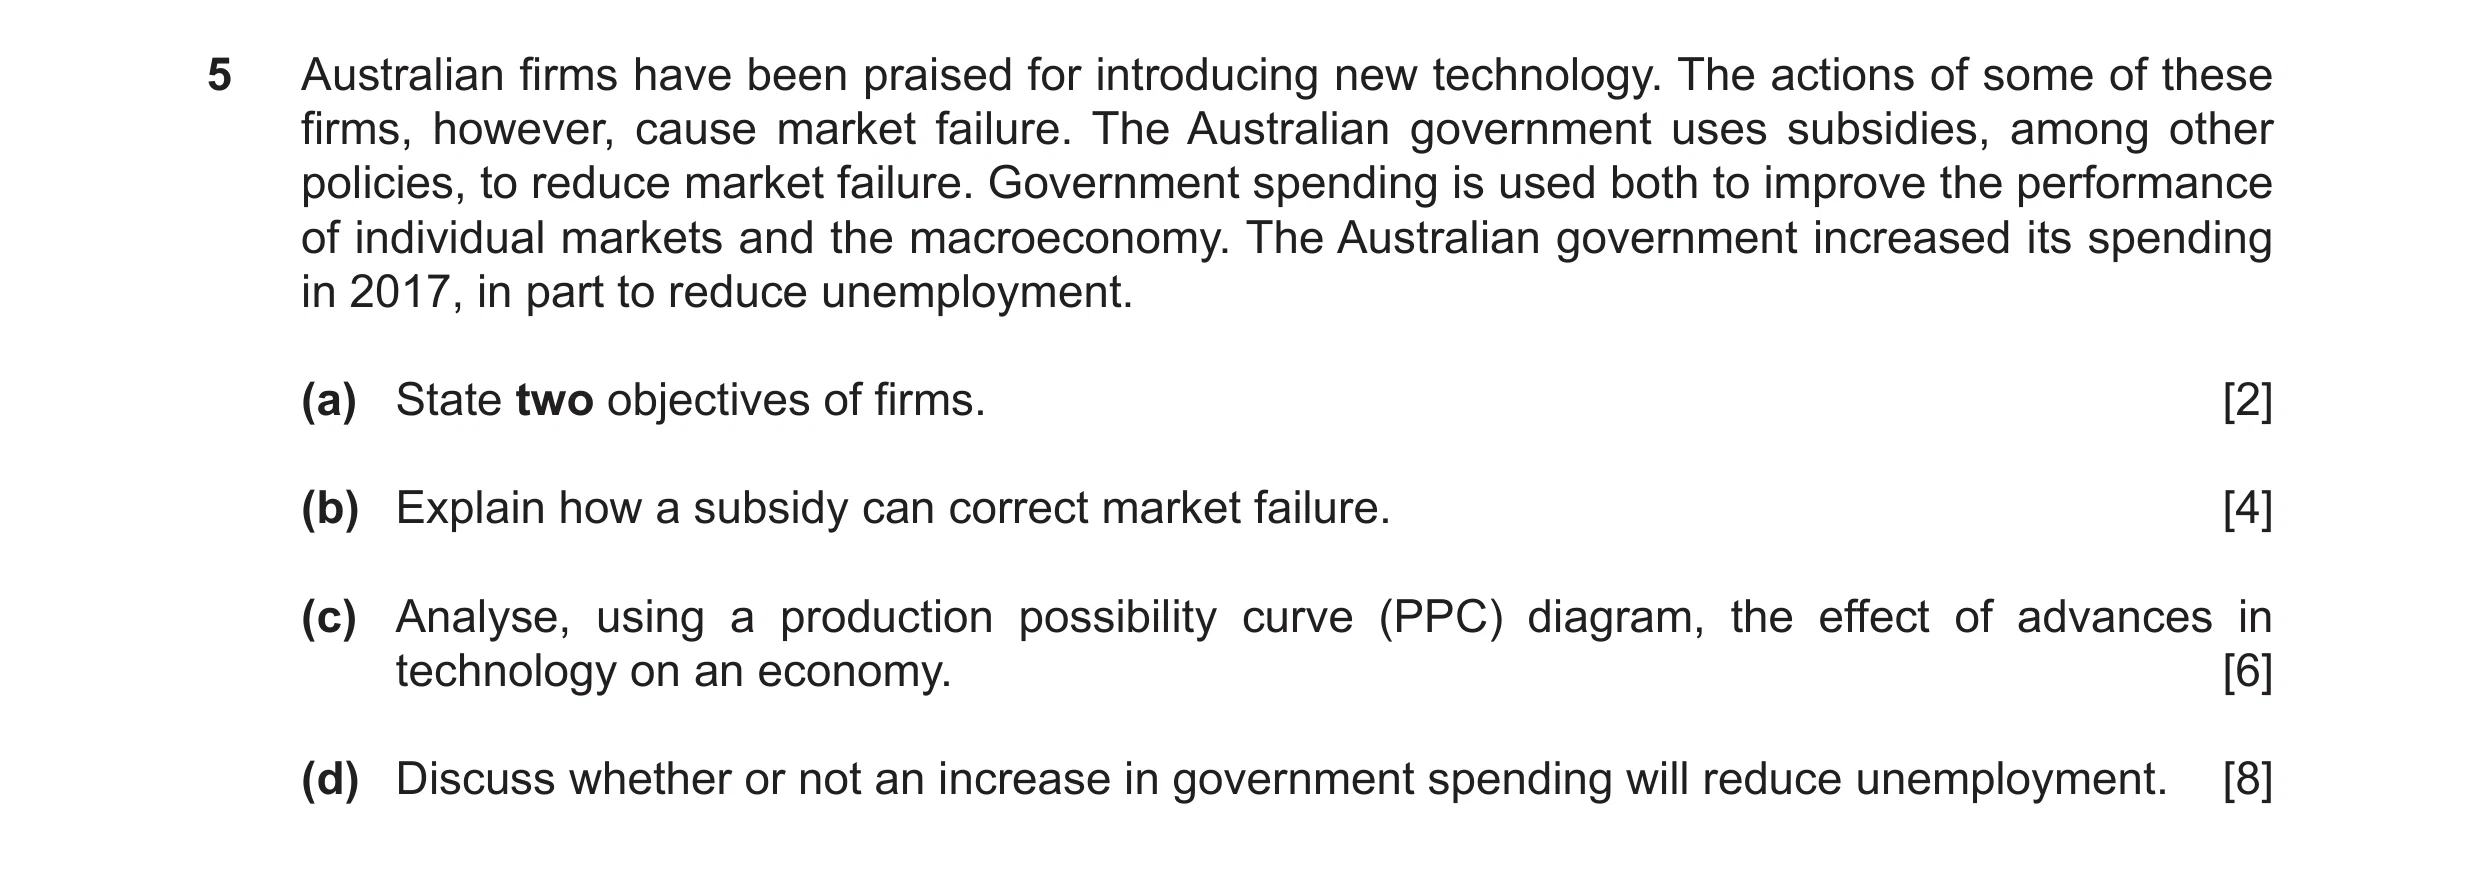
Q1 · Australian firms have been praised for introducing new technology 0987/21 May/June 2020
5 Australian firms have been praised for introducing new technology. The actions of some of these firms, however, cause market failure. The Australian government uses subsidies, among other policies, to reduce market failure. Government spending is used both to improve the performance of individual markets and the macroeconomy. The Australian government increased its spending in 2017, in part to reduce unemployment. (a) State two objectives of firms. [2] (b) Explain how a subsidy can correct market failure. [4] (c) Analyse, using a production possibility curve (PPC) diagram, the effect of advances in technology on an economy. [6] (d) Discuss whether or not an increase in government spending will reduce unemployment. [8]
20 marks
Mark scheme: 5(a) State two objectives of firms. 2 One mark each for two from: survival, social welfare, profit maximisation and growth. 5(b) Explain how a subsidy can correct market failure. 4 Logical explanation which might include: A payment to increase production (1) and lower price (1) can increase consumption of merit goods (1) products with positive externalities (1) which are under-consumed if left to market forces (1) can be paid to private sector firms to produce public goods (1) would not be produced if left to market forces (1). 5(c) Analyse, using a production possibility curve (PPC) diagram, the effect 6 of advances in technology on an economy. Up to 4 marks for the diagram: Axes correctly drawn (1). Initial curve drawn as a curve or a downward sloping line to the axes (1). New curve drawn as a curve or a downward sloping line to the axes (1). Shift to the right indicated by arrow or lettering (1). Up to 2 marks for logical analysis: Advances in technology raise the quality of capital (1) increase productive capacity (1). 5(d) Discuss whether or not an increase in government spending will 8 reduce unemployment. In assessing each answer, use the table below. Level Description Marks 3 A reasoned discussion which accurately examines both 6–8 sides of the economic argument, making use of economic information and clear and logical analysis to evaluate economic issues and situations. One side of the argument may have more depth than the other but, overall, both sides of the argument are considered and developed. There is thoughtful evaluation of economic concepts, terminology, information and/or data appropriate to the question. The discussion may also point out the possible uncertainties of alternative decisions and outcomes. 2 A reasoned discussion which makes use of economic 3–5 information and clear analysis to evaluate economic issues and situations. The answer may lack some depth and development may be one-sided. There is relevant use of economic concepts, terminology, information and data appropriate to the question. 1 There is a simple attempt at using economic definitions 1–2 and terminology. Some reference may be made to economic theory, with occasional understanding. 0 A mark of zero should be awarded for no creditable 0 content. Why it might: • may raise total (aggregate) demand, encouraging firms to hire more workers • may be spent on education which may increase people’s skills • may be spent on healthcare which may make people fitter and more employable • may be spent on subsidies to firms which will encourage them to increase output and take on more workers. Why it might not: • if spent on unemployment benefits, it may encourage some people to leave their jobs • if there is full employment, it will just cause inflation • spending on education may be ineffective e.g. develop the wrong skills • higher total (aggregate) demand may encourage firms to use more capital goods rather than labour.
This question in 0987/21 May/June 2020
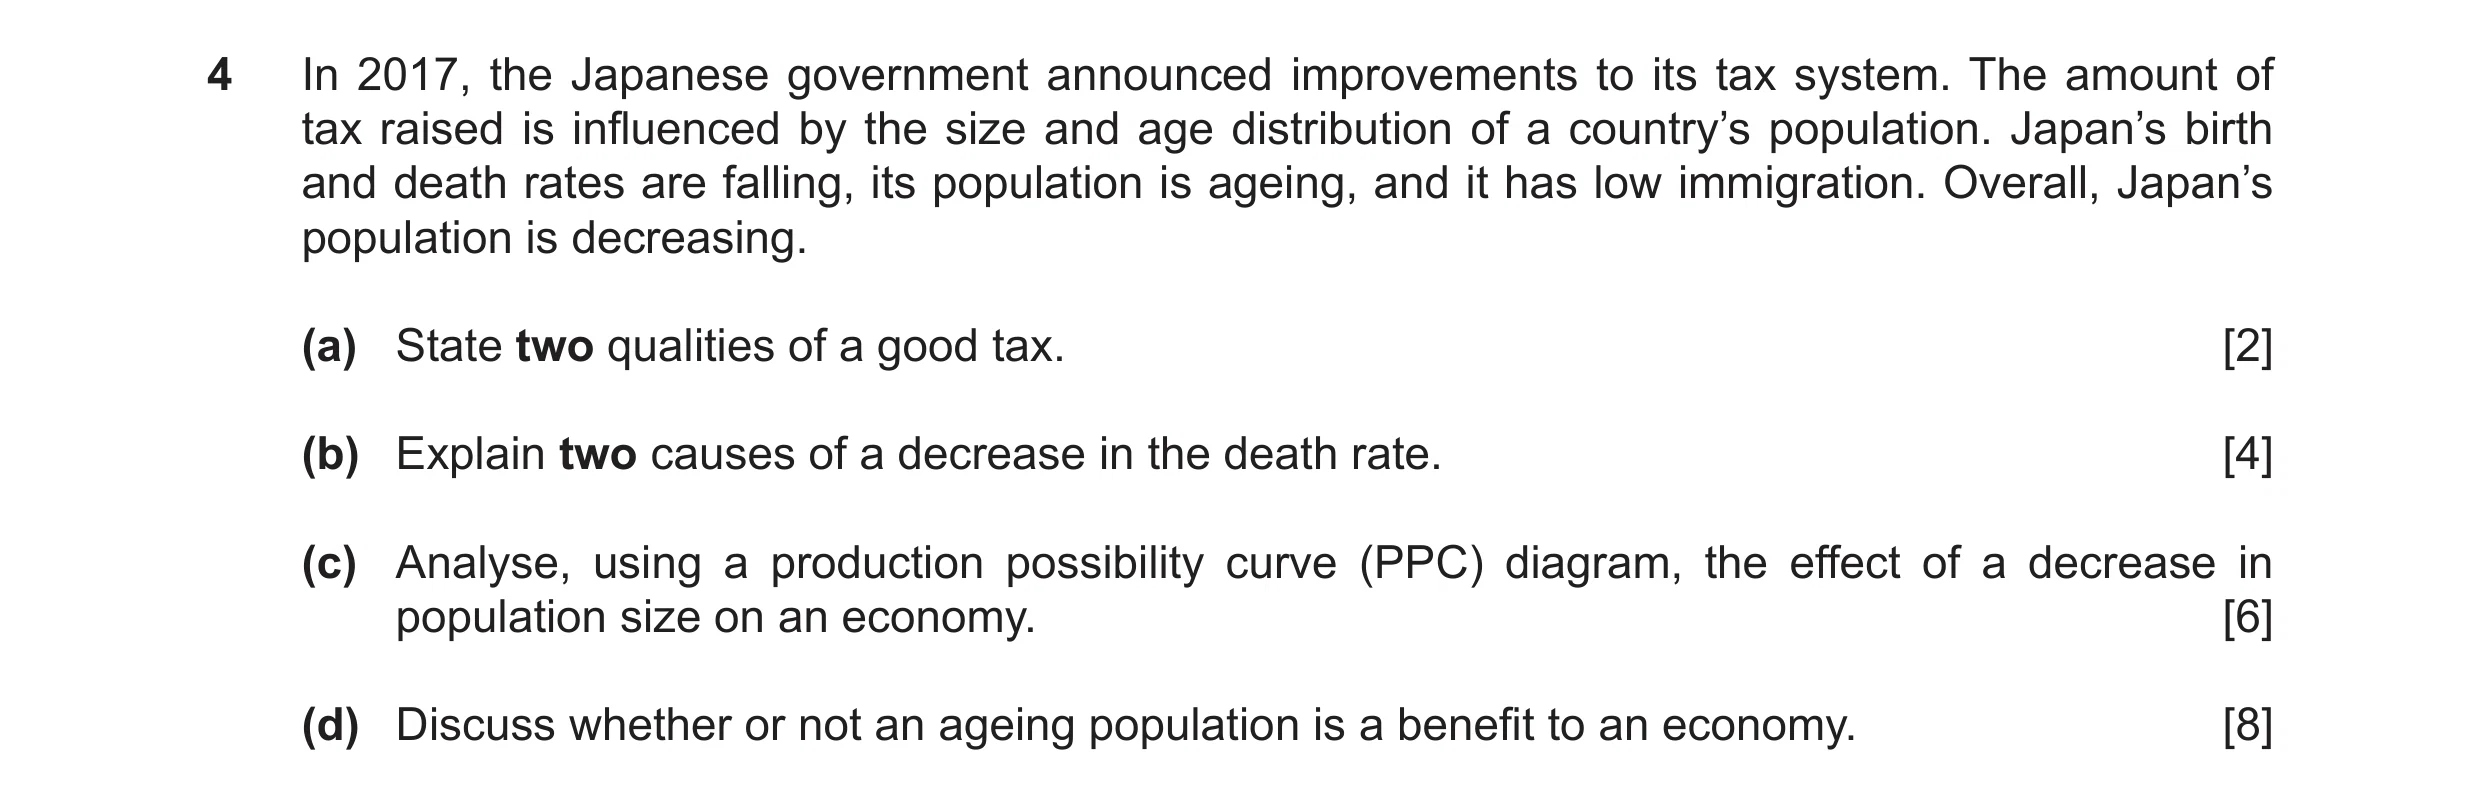
Q2 · In 2017, the Japanese government announced improvements to its tax system 0987/22 May/June 2020
4 In 2017, the Japanese government announced improvements to its tax system. The amount of tax raised is influenced by the size and age distribution of a country’s population. Japan’s birth and death rates are falling, its population is ageing, and it has low immigration. Overall, Japan’s population is decreasing. (a) State two qualities of a good tax. [2] (b) Explain two causes of a decrease in the death rate. [4] (c) Analyse, using a production possibility curve (PPC) diagram, the effect of a decrease in population size on an economy. [6] (d) Discuss whether or not an ageing population is a benefit to an economy. [8]
20 marks
Mark scheme: 4(a) State two qualities of a good tax. 2 One mark each for two from: convenient, equitable, certain, efficient, flexible. 4(b) Explain two causes of a decrease in the death rate. 4 Logical explanation which might include: Rises in income (1) leading to better living standards (1). Better education (1) resulting in e.g. better nutrition (1). Better healthcare (1) due to e.g. advances in medical technology (1). Reduction in crime/end of a war (1) fewer people dying violently (1). 4(c) Analyse, using a production possibility curve (PPC) diagram, the effect 6 of a decrease in population size on an economy. Up to 4 marks for the diagram: Axes correctly drawn (1). Initial curve drawn as a curve / line sloping downward to the axes (1). New curve drawn as a curve / line sloping downward to the axes (1). Shift to the left indicated by arrow or letter (1). Up to 2 marks for coherent analysis which might include: A decrease in population size may decrease the size of the labour force (1) decrease productive capacity (1). 4(d) Discuss whether or not an ageing population is a benefit to an 8 economy. In assessing each answer, use the table below. Level Description Marks 3 A reasoned discussion which accurately examines both 6–8 sides of the economic argument, making use of economic information and clear and logical analysis to evaluate economic issues and situations. One side of the argument may have more depth than the other but, overall, both sides of the argument are considered and developed. There is thoughtful evaluation of economic concepts, terminology, information and/or data appropriate to the question. The discussion may also point out the possible uncertainties of alternative decisions and outcomes. 2 A reasoned discussion which makes use of economic 3–5 information and clear analysis to evaluate economic issues and situations. The answer may lack some depth and development may be one-sided. There is relevant use of economic concepts, terminology, information and data appropriate to the question. 1 There is a simple attempt at using economic definitions 1–2 and terminology. Some reference may be made to economic theory, with occasional understanding. 0 A mark of zero should be awarded for no creditable 0 content. Why it might: • older people may be an economic asset through their knowledge and experience • the retirement age may be raised so that the labour force may increase • in some countries, an increase in the average age of the population may mean more people are in the labour force and may reduce the dependency ratio • may indicate a good standard of living increasing life expectancy. Why it might not: • may be an increase in the dependency ratio with a smaller proportion of workers to support a higher proportion of retired • any increased spending on healthcare and pensions will involve an opportunity cost • taxes may have to be increased to finance increased costs of healthcare and pensions • any shortage of workers may drive up wages and cause cost-push inflation • older workers may not be up to date with new technology and new ideas
This question in 0987/22 May/June 2020
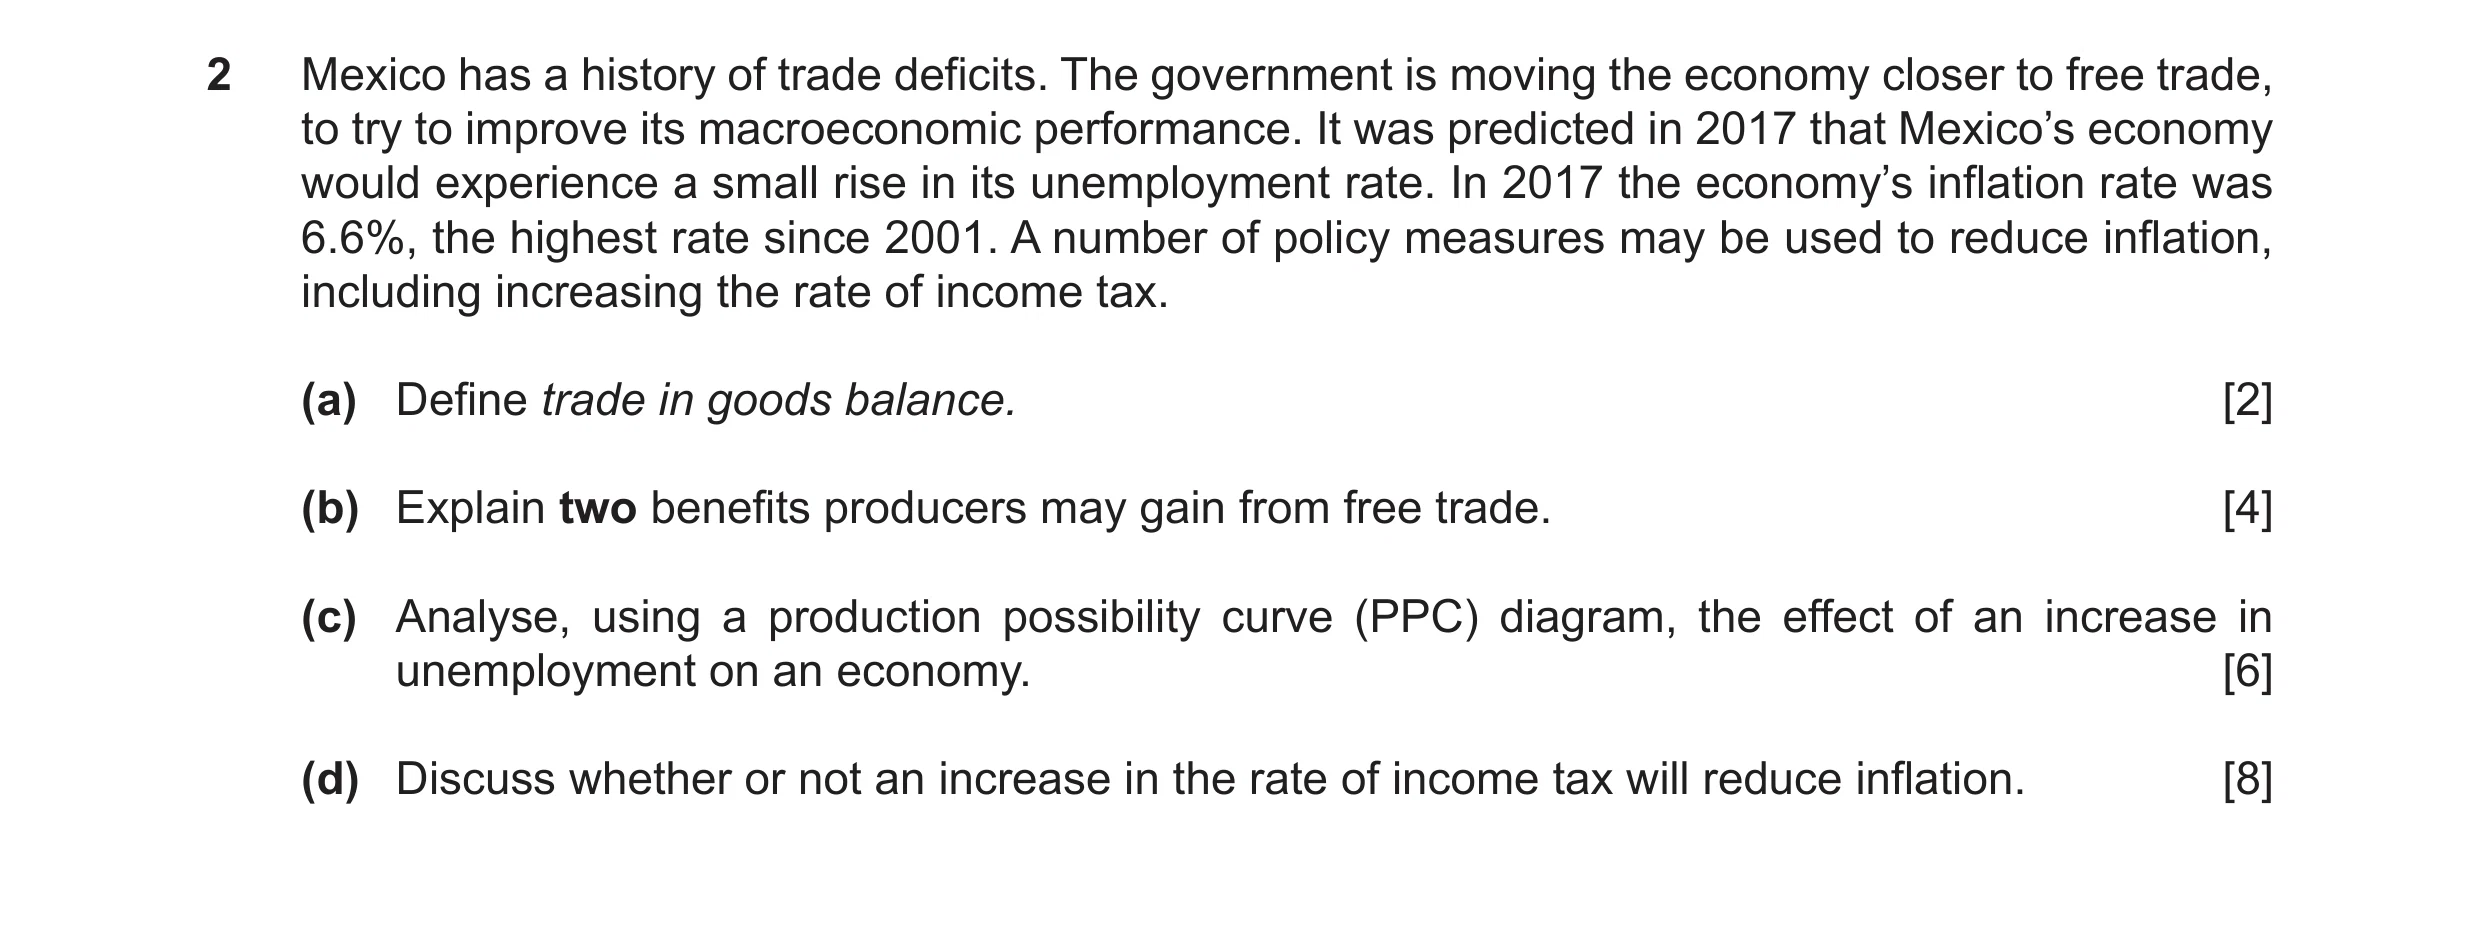
Q3 · Mexico has a history of trade deficits 0987/22 Oct/Nov 2020
2 Mexico has a history of trade deficits. The government is moving the economy closer to free trade, to try to improve its macroeconomic performance. It was predicted in 2017 that Mexico’s economy would experience a small rise in its unemployment rate. In 2017 the economy’s inflation rate was 6.6%, the highest rate since 2001. A number of policy measures may be used to reduce inflation, including increasing the rate of income tax. (a) Define trade in goods balance. [2] (b) Explain two benefits producers may gain from free trade. [4] (c) Analyse, using a production possibility curve (PPC) diagram, the effect of an increase in unemployment on an economy. [6] (d) Discuss whether or not an increase in the rate of income tax will reduce inflation. [8]
20 marks
Mark scheme: 2(a) Define trade in goods balance. Value of exports of goods / revenue earned from exports minus value of imports of goods / expenditure on imports of goods (2). Exports minus imports (1) of goods / visible items (1). 2 Accept exports (of goods) = imports of (goods) for 1 mark 2(b) Explain two benefits producers may gain from free trade. Logical explanation which might include: Availability of larger/global market (1) may increase revenue/profit (1). Ability to produce on a larger scale / higher output (1) take advantage of economies of scale (1) specialise (1). Access to cheaper / better quality raw materials / raw materials without tariffs imposed on them (1) lowering costs of production/raising quality of products produced/lowering price (1). Access to advanced technology/ideas from abroad (1) resulting in improved methods of production/new products (1). Increased competitive pressure (1) which may raise efficiency (1). 4 One mark for each of two benefits identified and one mark for each of two explanations. Question Answer Marks Guidance 2(c) Analyse, using a production possibility curve (PPC) diagram, the effect of an increase in unemployment on an economy. Up to 4 marks for the diagram: Axes correctly labelled (1). Curve drawn as a curve or downward sloping line to the axes (1). Two production points shown – one on or to left of PPC and the other further to the left of the PPC (1). Movement of the production point inwards indicated by arrow or lettering (1). Up to 2 marks for coherent analysis which might include: Unemployment means resources are not used (1) there is inefficiency (1) reduces output/GDP / causes a recession (1). 6 For analysis, only accept a PPC shifted inwards if logical justification is given i.e. an increase in unemployment may cause some workers to leave the labour force – ‘unemployment causing unemployment’. capital goods O consumer goods A B Question Answer Marks Guidance 2(d) Discuss whether or not an increase in the rate of income tax will reduce inflation. In assessing each answer, use the table opposite. Why it might: • reduce disposable income/purchasing power • consumer expenditure likely to fall • investment may fall • total (aggregate) demand may fall • demand-pull inflation may decrease • higher government revenue may increase government spending on supply-side policy measures. Why it might not: • workers may seek higher wages • higher wages may increase costs of production • cost-push inflation/wage-price spiral may occur • higher tax revenue may increase government spending • higher government spending may offset lower consumer expenditure leaving total (aggregate) demand unchanged • people may be very confident about the future so they cut back on savings rather than spending. 8 Level Descriptors Mark 3 A reasoned discussion which accurately examines both sides of the economic argument, making use of economic information and clear and logical analysis to evaluate economic issues and situations. One side of the argument may have more depth than the other, but overall both sides of the argument are considered and developed. There is thoughtful evaluation of economic concepts, terminology, information and/or data appropriate to the question. The discussion may also point out the possible uncertainties of alternative decisions and outcomes. 6–8 2 A reasoned discussion which makes use of economic information and clear analysis to evaluate economic issues and situations. The answer may lack some depth and development or may be one-sided. There is relevant use of economic concepts, terminology, information and data appropriate to the question. 3–5 1 There is a simple attempt at using economic definitions and terminology. Some reference may be made to economic theory, with occasional understanding. 1–2 0 A mark of zero should be awarded for no creditable content. 0 Question Answer Marks Guidance 2(d) Example of L3 answer: Due to an increase in the rate of income tax, inflation may fall as disposable income will fall. People will have less money to spend so they may spend less and total demand will fall. A fall in demand will cause prices to fall as producers will not be able to sell as many goods and services. They will want to keep their market share. Demand-pull inflation will decrease. However, an increase in income tax may not cause inflation to fall. Workers may force up the wage rate. Firms’ labour cost and costs of production will increase so firms may push up prices to maintain profits. This can cause cost-push inflation and a wage price spiral. Plus, government revenue from high taxes will rise and government spending may rise. This may offset the fall in consumer expenditure and inflation may not fall. Principal Examiner comment: Strong on both sides. Example of L1 answer: Inflation refers to the fall in the purchasing power of money. Income tax is a payment to the government. The increase in direct tax will definitely help the government. This may help the government solve the problem of inflation and will increase the purchasing power of money. Principal Examiner comment: Definitions given but the answer does not explain why inflation may, or may not, be reduced.
This question in 0987/22 Oct/Nov 2020
Q4 · A number of countries, including Morocco, capture water from fog 0987/22 Oct/Nov 2021
2 A number of countries, including Morocco, capture water from fog. Water is used in the primary, secondary and tertiary sectors. In recent years, Morocco has increased the quantity and quality of its resources and has moved more of them into the tertiary sector. The quantity, quality and composition of a country’s resources are influenced by a number of factors, including its birth rate. Morocco’s birth rate fell from 19.9 in 2016 to 18.7 in 2018. (a) Define a free good. [2] (b) Explain, with examples, the difference between the secondary sector and the tertiary sector. [4] (c) Analyse, using a production possibility curve (PPC), the effect of an increase in the quality of its resources on an economy. [6] (d) Discuss whether or not a fall in a country’s birth rate will benefit an economy. [8]
20 marks
Mark scheme: 2(a) Define a free good. No opportunity cost (1) a good that takes no resources/factors of production to produce / naturally abundant in supply / does not use scarce resources (1). 2(b) Explain, with examples, the difference between the secondary sector and the tertiary sector. Logical explanation which might include: Secondary sector covers manufacturing (and construction) / converts primary products into finished goods (1) e.g. car industry (1). Tertiary sector covers services / final stage of production (1) e.g. insurance (1). 4 For tertiary sector, it is not sufficient to just have the sector which sells products as this is only part of the sector. But for the tertiary sector example accept the sale of a product e.g. the sale of jewellery. Question Answer Marks Guidance 2(c) Analyse, using a production possibility curve (PPC), the effect of an increase in the quality of its resources on an economy. Up to 4 marks for the diagram: Axes correctly labelled with different outputs (1). Initial curve drawn as a curve / line sloping downward to the axes (1). New curve drawn as a curve / line sloping downward to the axes (1). Shift indicated by arrow or letter (1). Up to 2 marks for coherent analysis which might include: Better quality resources will increase productivity (1) enable more of both types of goods to be produced (1) with a given quantity of resources (1) increase productive potential / productive capacity / total supply (1) cause economic growth (1). 6 Nothing for higher output, higher GDP as this is uncertain. Question Answer Marks Guidance 2(d) Discuss whether or not a fall in a country’s birth rate will benefit an economy. In assessing each answer, use the table opposite. Why it might: • reduce the number of dependents • fewer workers away from work to bring up children • enable resources to be used to increase economic growth / raise living standards • reduce pressure on the environment • move towards the optimum population Why it might not: • reduce the size of the labour force in the longer term • reduce labour mobility • create an ageing population • reduce size of markets 8 Level Description Marks 3 A reasoned discussion which accurately examines both sides of the economic argument, making use of economic information and clear and logical analysis to evaluate economic issues and situations. One side of the argument may have more depth than the other, but overall, both sides of the argument are considered and developed. There is thoughtful evaluation of economic concepts, terminology, information and/or data appropriate to the question. The discussion may also point out the possible uncertainties of alternative decisions and outcomes. 6–8 2 A reasoned discussion which makes use of economic information and clear analysis to evaluate economic issues and situations. The answer may lack some depth and development may be one-sided. There is relevant use of economic concepts, terminology, information and data appropriate to the question. 3–5 1 There is a simple attempt at u sing economic definitions and terminology. Some reference may be made to economic theory, with occasional understanding. 1–2 Question Answer Marks Guidance 2(d) Level Description Marks 0 A mark of zero should be awarded for no creditable content. 0
This question in 0987/22 Oct/Nov 2021
Q5 · Calculate the number of births in Cyprus in 2019 0987/21 May/June 2022
1 (a) Calculate the number of births in Cyprus in 2019. [1] (b) Identify two indicators of living standards. [2] (c) State why the global market for grapes was in disequilibrium in 2019. [2] (d) Explain two reasons why more well-educated workers tend to work past retirement age than less-educated workers. [4] (e) Analyse how a rise in a country’s retirement age is likely to affect its government’s budget. [4] (f) Analyse the relationship between inflation rates and current account balances. [5] (g) Discuss whether or not, after 2019, Cyprus’s production possibility curve (PPC) is likely to shift to the right. [6] (h) Discuss whether or not adopting capital-intensive production will benefit consumers. [6]
30 marks
Mark scheme: 1(a) Calculate the number of births in Cyprus in 2019. 12 240 (1) 1 1(b) Identify two indicators of living standards. GDP per head / per capita (1). HDI (1). Life expectancy / healthy people (1). Proportion of people in primary sector (1). Level of education / qualifications (1). 2 Do not reward GDP 1(c) State why the global market for grapes was in disequilibrium in 2019. Bad weather / failure of the grape harvest (1) there was a shortage (1) which means demand exceeded supply (1). 2 1(d) Explain two reasons why more well-educated workers tend to work past retirement age than less-educated workers. Logical explanation which might include: Well-paid / good work benefits (1) which provides an incentive to work for longer / high job satisfaction / enter workforce late (1). Healthy (1) and so more able to work for longer / remain productive (1). Work in jobs which do not require physical strength / less tiring (1) older workers tend to be less strong / allows them to continue working as long as remain fit (1). 4 One mark for each of two reasons identified and one mark for each explanation. Question Answer Marks Guidance 1(e) Analyse how a rise in a country’s retirement age is likely to affect its government’s budget. Coherent analysis which might include: A rise in the retirement age / less people retired will reduce the cost of pensions (1) may reduce government spending / government may spend on alternatives e.g., infrastructure, education or health (1). More people in work will increase incomes / businesses expand production (1) raise direct tax revenue (1) spending will increase (1) raise indirect tax revenue (1). 4 Question Answer Marks Guidance 1(f) Analyse the relationship between inflation rates and current account balances. Coherent analysis which might include: Overview: Generally, an inverse relationship / the lower the inflation rate, the higher the current account surplus or the higher the inflation rate, the higher the current account deficit (1). Supporting evidencemax of 2 marks Mongolia has the highest inflation rate (1) and the largest current account deficit (1) Mongolia / Kenya / Nepal have the highest inflation rates (1) all have a current account deficit (1). Iceland / Slovenia have a low rate of inflation (1) but have a current balance of payments surplus (1) Exception: Cyprus lowest inflation rate (1) but a current account deficit / 3rd highest current account deficit (1). Comments: Most of the table shows the expected relationship. (1) Low inflation rates may make products more price competitive / high inflation rates may make prices less price competitive (1) 5 Do not accept current account balance is high or low. Answers need to refer to size of surplus or deficit. Simply using data without explanation is description rather than analysis. Question Answer Marks Guidance 1(g) Discuss whether or not, after 2019, Cyprus’s production possibility curve (PPC) is to shift to the right. Award up to 4 marks for logical reasons why it might, which may include: Quantity / quality of resources may have increased (1) retirement age may have increased (1) people living longer (1) so labour force is likely to have increased (1). Investment may have increased (1) due to low interest rates (1) more capital goods would increase productive capacity (1). Award up to 4 marks for logical reasons why it might not, which may include: Quantity and quality of resources may have decreased (1) land quality is decreasing (1) which will reduce the productivity of land (1). Entrepreneurs may emigrate (1) reducing the supply of enterprise / skilled workers (1). Birth rate is falling (1) size of workforce may fall in future (1) Covid19 may have reduced productivity (1). For recognising that any of these reasons could result in PPC shifting to the left / stay unchanged (1). 6 Apply this example to all questions with the command word DISCUSS (1g, 1h, 2d, 3d, 4d and 5d) Each point may be credited only once, on either side of an argument, but separate development as to how/why the outcome may differ is rewarded. Generic example Marks Tax revenue may decrease 1 because of reason e.g., incomes may be lower. 1 Tax revenue may increase because incomes may be higher i.e., reverse of a previous argument. 0 Tax revenue may increase because of a different reason i.e., not the reverse of a previous argument e.g., government spending on subsidies may stimulate the economy more than spending on education. 1 Question Answer Marks Guidance 1(h) Discuss whether or not adopting capital-intensive production will benefit consumers. Award up to 4 marks for logical reasons why it might, which may include: It may reduce costs of production / more efficient / may result in economies of scale (1) lower costs may reduce prices (1). It may avoid disruption to supply (1) as no industrial action / strikes (1). It may be quicker / faster (1) to respond to changes in consumer demand (1) It may raise quality (1) as absence of human error (1). Award up to 4 marks for logical reasons why it might not, which may include: Products may be standardised / lack variety (1) individual wants may not be met (1). Capital equipment may break down / costly to maintain (1) causing delays in production (1). Initial high cost of capital equipment (1) may push up prices (1). 6
This question in 0987/21 May/June 2022
Q6 · In 2019, France produced inside its production possibility curve (PPC) 0987/22 May/June 2022
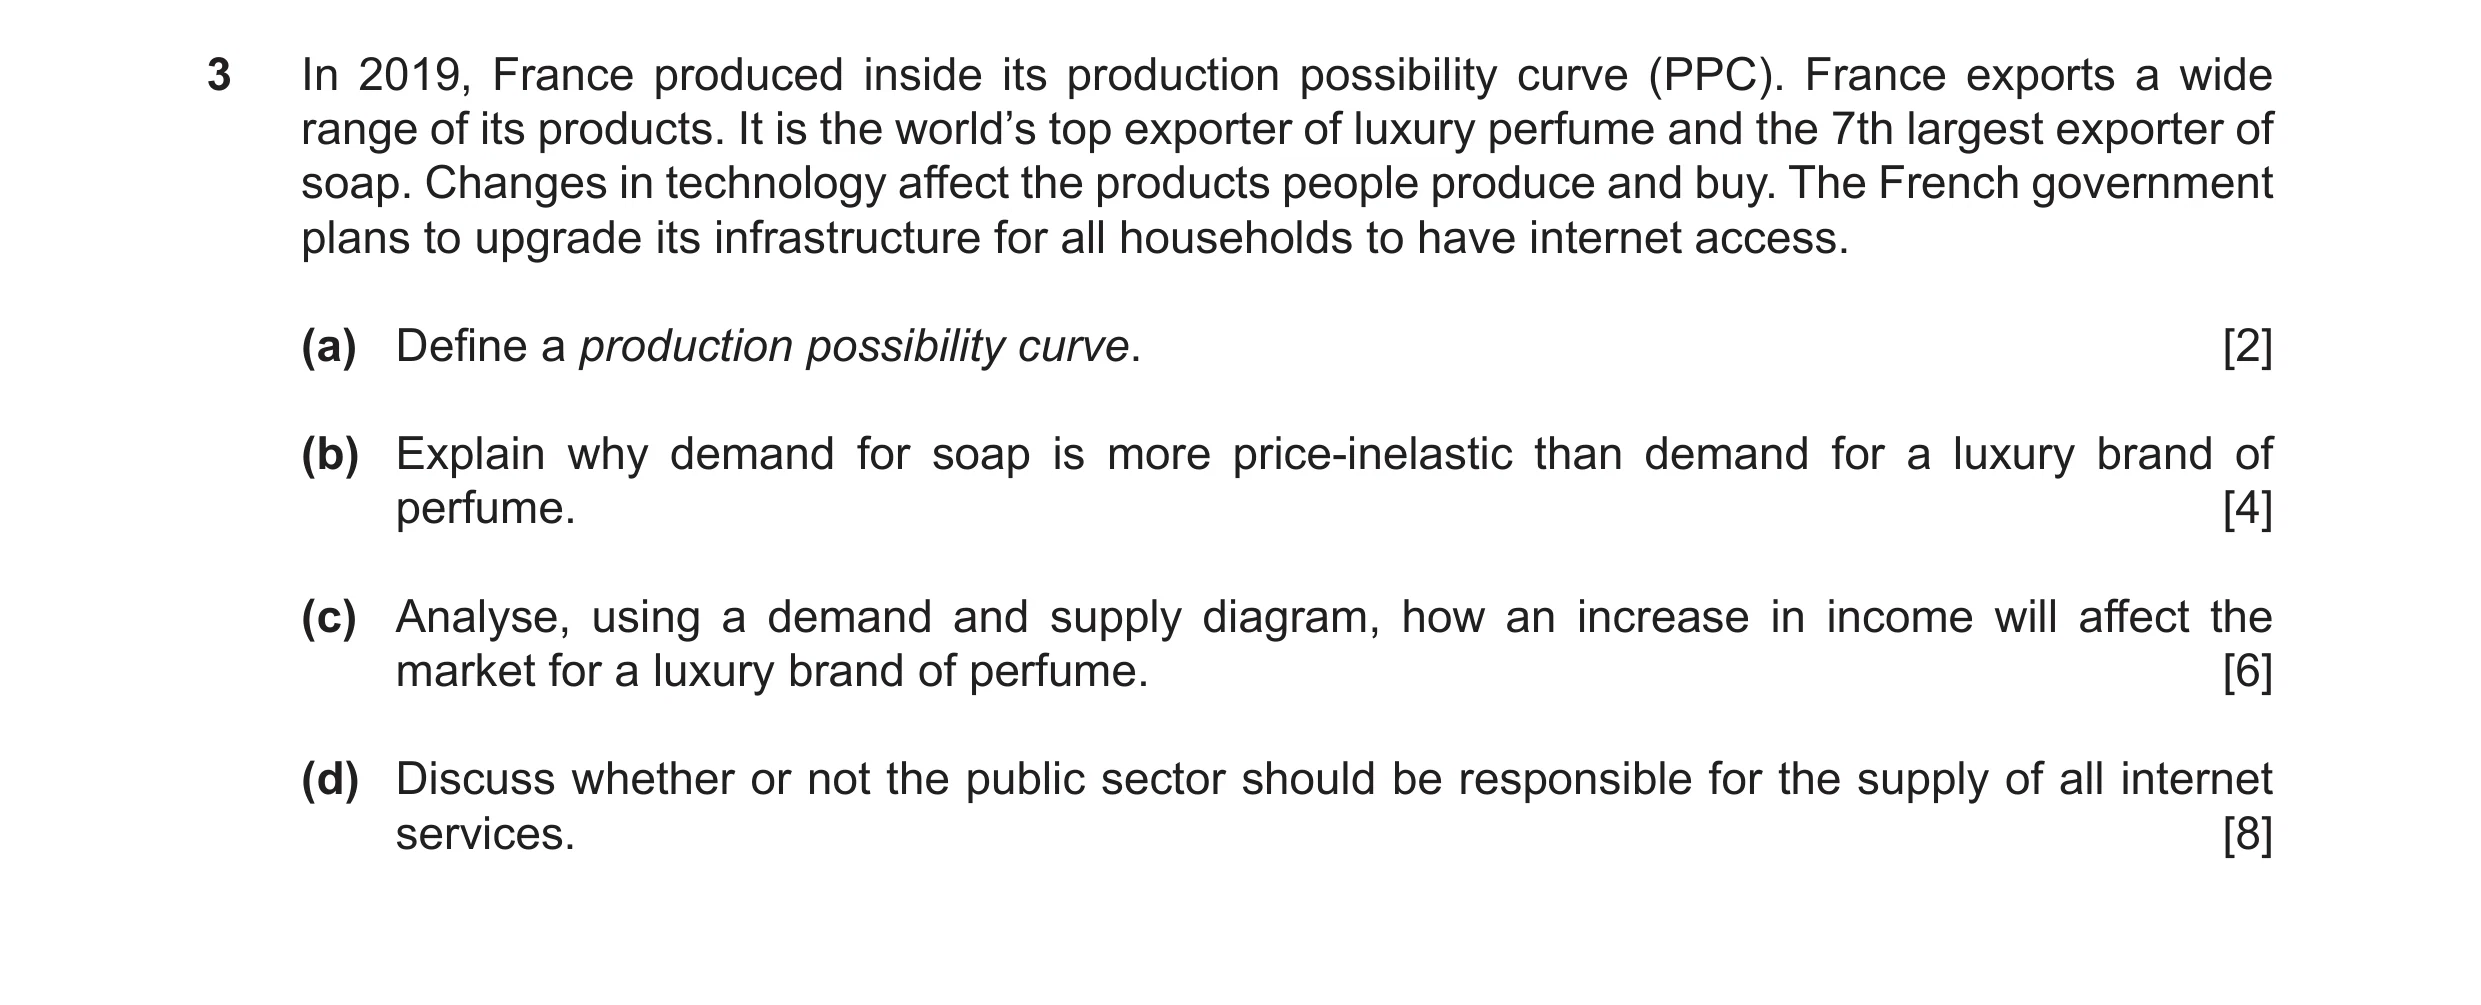
3 In 2019, France produced inside its production possibility curve (PPC). France exports a wide range of its products. It is the world’s top exporter of luxury perfume and the 7th largest exporter of soap. Changes in technology affect the products people produce and buy. The French government plans to upgrade its infrastructure for all households to have internet access. (a) Define a production possibility curve. [2] (b) Explain why demand for soap is more price-inelastic than demand for a luxury brand of perfume. [4] (c) Analyse, using a demand and supply diagram, how an increase in income will affect the market for a luxury brand of perfume. [6] (d) Discuss whether or not the public sector should be responsible for the supply of all internet services. [8]
20 marks
Mark scheme: 3(a) Define a production possibility curve. A diagram showing maximum output / possible combinations (1) of two types of products / of capital and consumer goods (1) with given resources / given technology / in a given time period (1) shows opportunity cost (1). 2 Nothing for a diagram, 3(b) Explain why demand for soap is more price-inelastic than demand for a luxury brand of perfume. Logical explanation which might include: Soap is more essential / necessary than a luxury brand of perfume (2) OR soap is a necessity (1) luxury brand of perfume does not have to be purchased / not essential / a want (1). Soap has fewer substitutes than a luxury brand of perfume (2) OR soap does not have close substitutes (1) whereas a luxury brand of perfume may have close substitutes (1). Soap is likely to take up a smaller proportion of income than a luxury brand of soap (2) OR soap is likely to take only a small proportion of income (1) whereas a luxury brand of perfume is likely to take up a large proportion (1). It is harder to delay the purchase of soap than the purchase of a luxury brand of perfume OR the purchase of soap cannot be delayed (1) while the purchase of a luxury brand of perfume can be (1). 4 Question Answer Marks Guidance 3(c) Analyse, using a demand and supply diagram, how an increase in income will affect the market for a luxury brand of perfume. Coherent analysis which might include: Up to 4 marks for the diagram: D and S diagram: Axes correctly labelled – price and quantity or p and q (1). Original demand and supply curves correctly labelled (1). New demand curve shifted to the right (1). Equilibriums – shown by lines or equilibrium points (1). Up to 2 marks for written analysis which might include: Luxury perfume will be more affordable / greater purchasing power / luxury perfume will take a smaller proportion of income / more will be demanded at the same price (1) price will rise / quantity traded will increase (1). 6 Written analysis An increase in income will cause an increase in demand for luxury perfume is not sufficient for a mark. Reward but do not expect reference to a luxury brand of perfume being a normal good. Question Answer Marks Guidance 3(d) Discuss whether or not the public sector should be responsible for the supply of all internet services. In assessing each answer, use the table opposite. Why it might: government may charge a low price enable poor to gain access to the internet, help children with education government may base decisions on social costs and benefits government can control what is on the internet may be more able to take advantage of economies of scale avoidance of wasteful duplication government may take a longer-term view on investing. Why it might not: opportunity cost – could have spent the money on e.g. healthcare private sector may invest more private sector may be more efficient / have lower costs of production profit incentive may encourage private sector to raise quality private sector may make decisions quicker. 8 Level Description Marks 3 A reasoned discussion which accurately examines both sides of the economic argument, making use of economic information and clear and logical analysis to evaluate economic issues and situations. One side of the argument may have more depth than the other, but overall, both sides of the argument are considered and developed. There is thoughtful evaluation of economic concepts, terminology, information and/or data appropriate to the question. The discussion may also point out the possible uncertainties of alternative decisions and outcomes. 68 Question Answer Marks Guidance 3(d) 2 A reasoned discussion which makes use of economic information and clear analysis to evaluate economic issues and situations. The answer may lack some depth and development may be one-sided. There is relevant use of economic concepts, terminology, information and data appropriate to the question. 35 1 There is a simple attempt at using economic definitions and terminology. Some reference may be made to economic theory, with occasional understanding. 12 0 A mark of zero should be awarded for no creditable content. 0
This question in 0987/22 May/June 2022
Q7 · In Greece, rich households spend more than the average household 0987/21 May/June 2023
5 In Greece, rich households spend more than the average household. The amount of spending in an economy influences whether its production point is on or inside its production possibility curve (PPC). In 2020, household spending in Greece fell. This affected some firms’ plans to merge. It also increased unemployment. More than half of those unemployed in Greece had been unemployed for more than a year. (a) Identify two reasons why rich households spend more than the average household. [2] (b) Explain the significance of a production point inside a PPC and a production point on its PPC. [4] (c) Analyse why someone who has been unemployed for more than a year may not get another job. [6] (d) Discuss whether or not a government should encourage firms to merge. [8]
20 marks
Mark scheme: 5(a) Identify two reasons why rich households spend more than the average household. Two from: higher incomes find it easier to borrow more confidence more savings / more wealth high cost of luxury goods and services maintaining / showing status rich households may choose to have large families 2 If more than two reasons are given, consider the first three. 5(b) Explain the significance of a production point inside a PPC and a production point on its PPC. Logical explanation which might include: A point inside a PPC means output is lower than potentially achievable (1) there are unemployed resources / there is inefficient use of resources (1). A point on a PPC means output is at its maximum (1) all resources are employed / full employment / there is efficient use of resources (1). A production point shows a combination of goods produced (1) example e.g. X capital goods and Y consumer goods (1). 4 One mark each for each of two significances identified and one mark each for each of two explanations. Question Answer Marks Guidance 5(c) Analyse why someone who has been unemployed for more than a year may not get another job. Coherent analysis which might include: May lose skills (1) qualifications may become out of date (1) may experience ill-health (1) lack of recent job experience (1) high cost of retraining (1) may become less attractive to employers (1). Skills may be outdated (1) industry in decline (1) will need retraining (1). Economy could be in recession (1) with high number of people unemployed and few vacancies (1). May lose confidence / become discouraged / depressed (1) put less effort into finding another job (1). Unemployed workers may be occupationally immobile (1) geographically immobile (1). Unemployment/welfare benefits may be high (1) may be above low wages / maybe sufficient to live on (1). May face discrimination (1) on grounds of e.g. age (1). May retire (1) and leave the labour force (1). 6 Question Answer Marks Guidance 5(d) Discuss whether or not a government should encourage firms to merge. In assessing each answer, use the table opposite. Why it should: may result in economies of scale lower average costs of production lower prices for consumers raise quality of products increase international competitiveness and improve current account improved performance may increase profits and corporation tax Why it should not: may result in diseconomies of scale may increase monopoly power / reduce competition raise prices may reduce innovation rationalisation may result in some workers losing their jobs should be left to market forces to decide. 8 Level Description Marks 3 A reasoned discussion which accurately examines both sides of the economic argument, making use of economic information and clear and logical analysis to evaluate economic issues and situations. One side of the argument may have more depth than the other, but overall, both sides of the argument are considered and developed. There is thoughtful evaluation of economic concepts, terminology, information and/or data appropriate to the question. The discussion may also point out the possible uncertainties of alternative decisions and outcomes. 6–8 2 A reasoned discussion which makes use of economic information and clear analysis to evaluate economic issues and situations. The answer may lack some depth and development may be one-sided. There is relevant use of economic concepts, terminology, information and data appropriate to the question. 3–5 1 There is a simple attempt at using economic definitions and terminology. Some reference may be made to economic theory, with occasional understanding. 1–2 0 A mark of zero should be awarded for no creditable content. 0
This question in 0987/21 May/June 2023
Q8 · In 2020, Singapore experienced a decrease in both its population size and its labour force 0987/22 Oct/Nov 2023
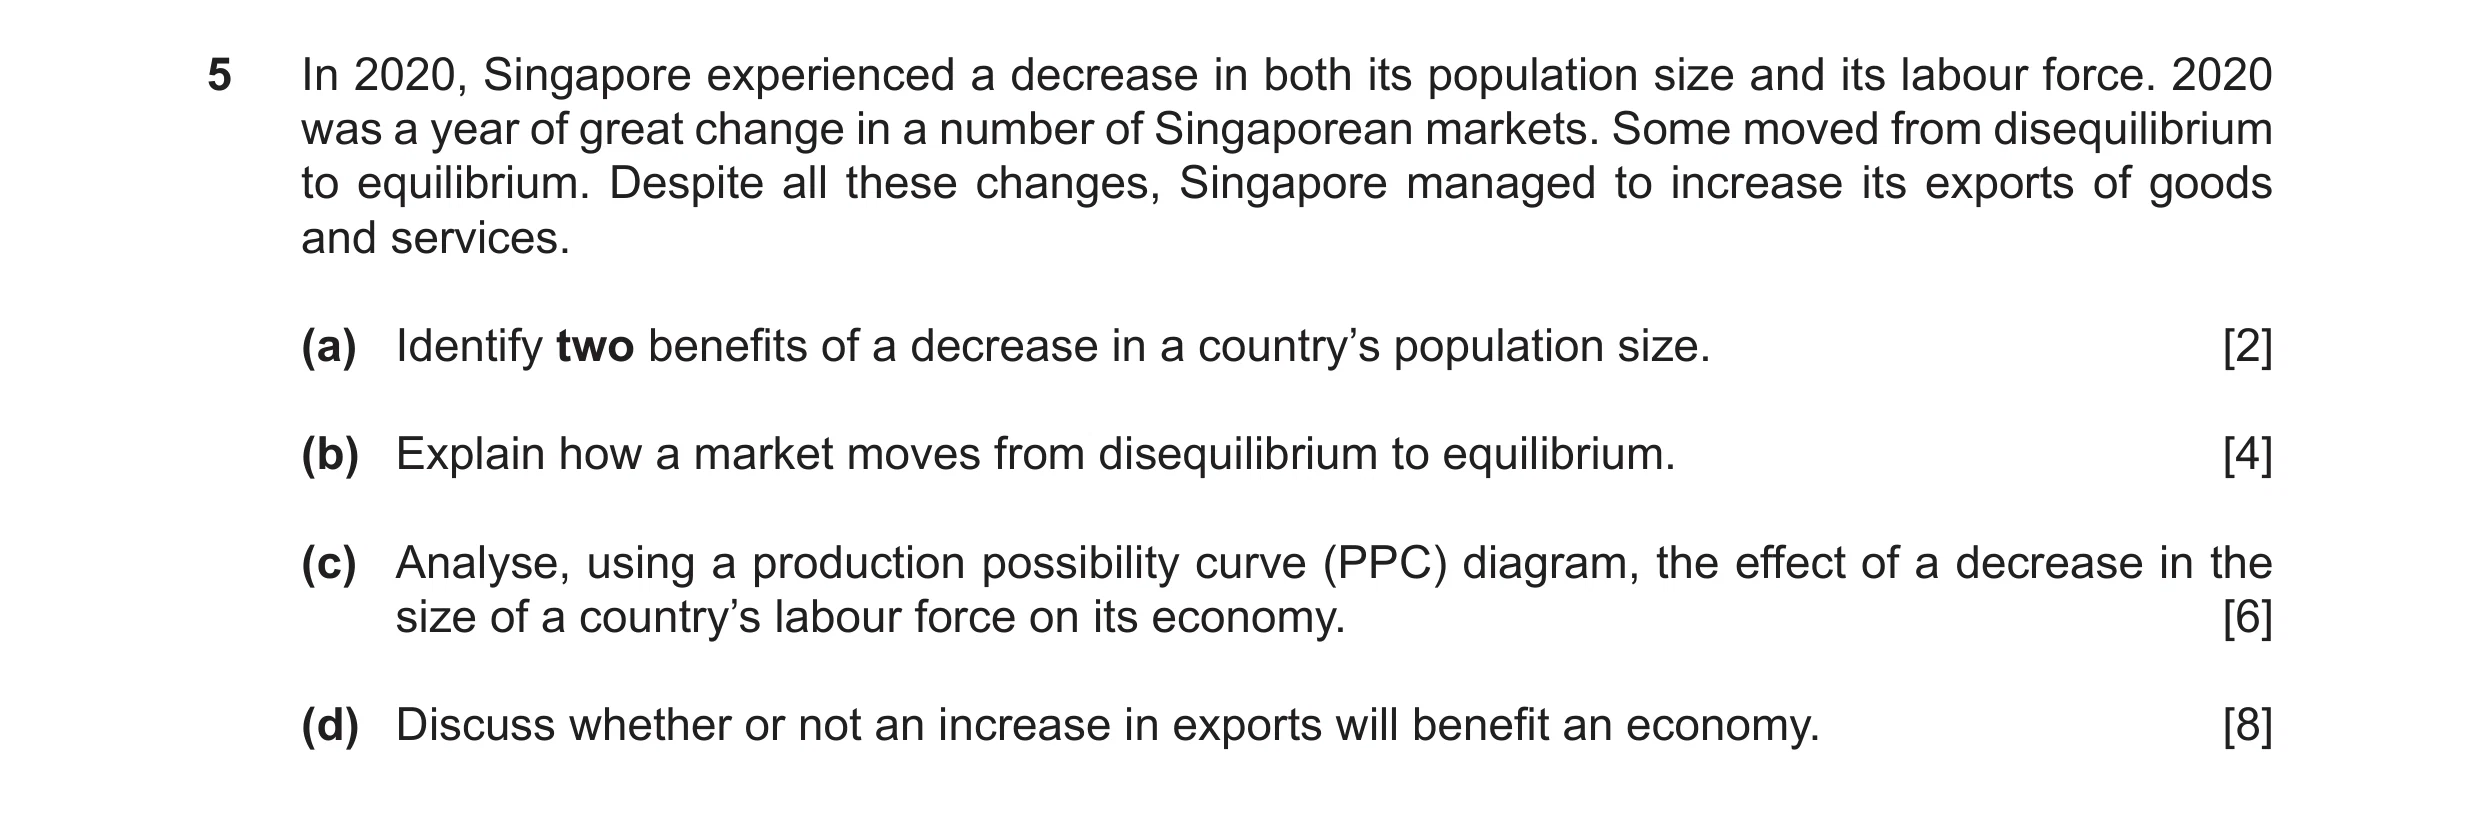
5 In 2020, Singapore experienced a decrease in both its population size and its labour force. 2020 was a year of great change in a number of Singaporean markets. Some moved from disequilibrium to equilibrium. Despite all these changes, Singapore managed to increase its exports of goods and services. (a) Identify two benefits of a decrease in a country’s population size. [2] (b) Explain how a market moves from disequilibrium to equilibrium. [4] (c) Analyse, using a production possibility curve (PPC) diagram, the effect of a decrease in the size of a country’s labour force on its economy. [6] (d) Discuss whether or not an increase in exports will benefit an economy. [8]
20 marks
Mark scheme: 5(a) Identify two benefits of a decrease in a country’s 2 population size. Two from: • may be fewer dependents • less pressure on resources • less food needed • move population towards the optimum level / reduce overpopulation • reduce overcrowding / more land space • reduce pollution / less negative externalities • lower imports • lower government expenditure (on healthcare/education) • less unemployment / less unemployment benefit • may increase GDP per head. 5(b) Explain how a market moves from disequilibrium to 4 One mark for reference to a change in price. equilibrium. Maximum of 2 marks for diagrams which show initial Logical explanation which might include: disequilibrium and change in price which restores If demand is greater than supply / there is a shortage / equilibrium. excess demand (1) price will rise (1). If supply is greater than demand / there is a surplus / excess supply (1) price will fall (1). Demand will again equal supply / demand would not initially have been equal to supply (1). 5(c) Analyse, using a production possibility curve (PPC) 6 diagram, the effect of a decrease in the size of a country’s labour force on its economy. Up to 4 marks for the diagram: Axes correctly labelled with different outputs (1). Initial curve drawn as a curve/line sloping downward to the axes (1). New curve drawn as a curve/line sloping downward to the axes (1). Shift to the left indicated by arrow or letters (1). Up to 2 marks for coherent analysis which might include: A decrease in the size of the labour force reduces resources / factors of production available (1) this lowers productive capacity / the maximum output that can be produced (1). Note to gain the marks for the curves, these must be drawn to the axes. 5(d) Discuss whether or not an increase in exports will 8 Level Description Marks benefit an economy. 3 A reasoned discussion which accurately 6–8 In assessing each answer, use the table opposite. examines both sides of the economic argument, making use of economic Why it might: information and clear and logical analysis • may increase export revenue, improve the current to evaluate economic issues and account balance situations. One side of the argument may • may increase total demand have more depth than the other, but • may increase investment overall, both sided of the argument are • may increase output / economic growth considered and developed. There is • may reduce unemployment thoughtful evaluation of economic • may increase incomes. concepts, terminology, information and/or data appropriate to the question. The Why it might not: discussion may also point out the • may cause demand-pull inflation possible uncertainties of alternative • opportunity cost of selling more products on the home decisions and outcomes. market 2 A reasoned discussion which makes use 3–5 • may lead to shortages on the home market of economic information and clear • may deplete resources analysis to evaluate economic issues • may push up the exchange rate, reversing the increase and situations. The answer may lack in exports in the long run some depth and development may be • may make the economy more subject to external one-sided. There is relevant use of shocks. economic concepts, terminology, information and data appropriate to the question. 1 There is a simple attempt at using 1–2 economic definitions and terminology. Some reference may be made to economic theory, with occasional understanding. 0 A mark of zero should be awarded for no 0 creditable content.
This question in 0987/22 Oct/Nov 2023
Q9 · In 2021, the production point on the UK’s production possibility curve (PPC) changed 0987/22 Oct/Nov 2024
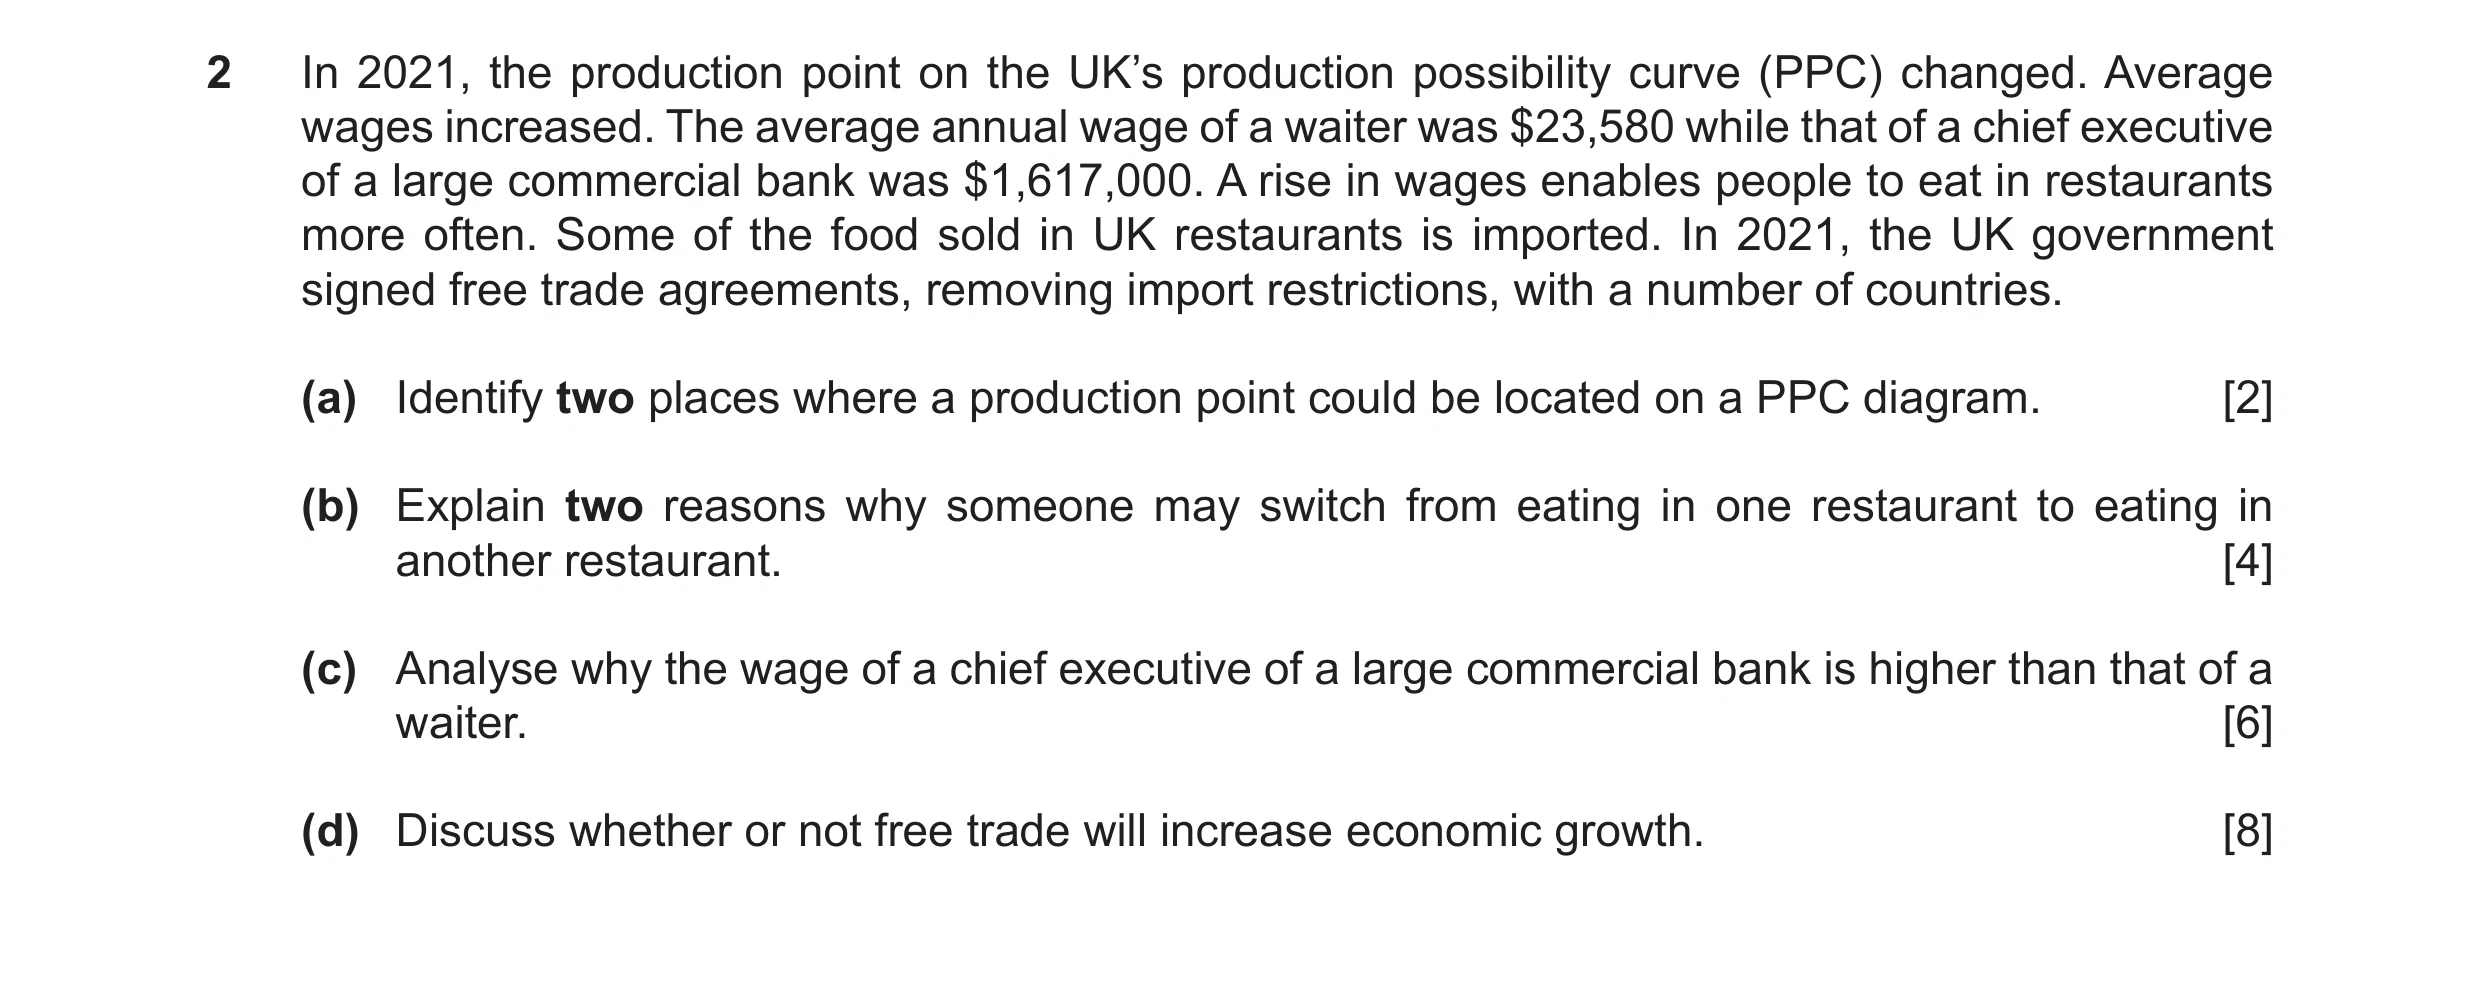
2 In 2021, the production point on the UK’s production possibility curve (PPC) changed. Average wages increased. The average annual wage of a waiter was $23,580 while that of a chief executive of a large commercial bank was $1,617,000. A rise in wages enables people to eat in restaurants more often. Some of the food sold in UK restaurants is imported. In 2021, the UK government signed free trade agreements, removing import restrictions, with a number of countries. (a) Identify two places where a production point could be located on a PPC diagram. [2] (b) Explain two reasons why someone may switch from eating in one restaurant to eating in another restaurant. [4] (c) Analyse why the wage of a chief executive of a large commercial bank is higher than that of a waiter. [6] (d) Discuss whether or not free trade will increase economic growth. [8]
20 marks
Mark scheme: 2(a) Identify two places where a production point could be 2 The points may be identified on a diagram. located on a PPC diagram. Accept below the curve and above the curve. Two from: • point inside the curve / left of the curve • point on the curve / along the curve • point outside the curve / right of the curve 2(b) Explain two reasons why someone may switch from 4 One mark each for each of two reasons identified and one eating in one restaurant to eating in another restaurant. mark for each of two explanations. Logical explanation which might include: (Change in) prices (1) lower price making it more affordable / substitutes / save money (1). (Change in) quality (1) better ingredients / better cleanliness / quicker service / new menu / more satisfaction / better taste / change in staff (1). (Change in) convenience (1) e.g. longer opening hours / / better location (1) (Change in) facilities (1) e.g. better restrooms (1). (Change in) income (1) enabling some to eat in more expensive restaurants (1). (Change in) consumer tastes (1) switch to e.g. vegan restaurant (1) Advertising (1) may attract/persuade customers / increase attractiveness (1). (Change in) quantity provided (1) lower quantity may represent lower value for money (1). 2(c) Analyse why the wage of a chief executive of a large 6 Note: may also be answered from the point of view why the commercial bank is higher than that of a waiter. wage of a waiter may be lower than that of a chief executive. Coherent analysis which might include: No marks here for banks may be more profitable than restaurants as e.g. a cleaner in a bank may have a lower Chief executive may be more qualified / more educated (1) wage than a waiter. received more training (1) more skilled / talented (1) more productive (1) more experienced (1) higher level of responsibility / higher level of stress / more demanding job (1) in shorter supply / harder to replace (1) more inelastic supply (1). Chief executive may be in higher demand (1) more inelastic demand (1). Chief executive may have stronger bargaining power (1) may be more likely to be in a trade union / professional body (1). May be less likely to be in a group that is discriminated against (1) e.g. migrant workers (1). Chief executive may work longer hours (1). 2(d) Discuss whether or not free trade will increase 8 Level Description Marks economic growth. 3 A reasoned discussion which 6–8 In assessing each answer, use the table opposite. accurately examines both sides of the economic argument, making use of Why it might: economic information and clear and • may enable countries to specialise on what they are logical analysis to evaluate economic best at producing issues and situations. One side of the • higher competition may increase productivity and lower argument may have more depth than the other, but overall both sides of the costs of production, increasing demand for their argument are considered and products developed. There is thoughtful • may enable firms to buy raw materials and capital evaluation of economic concepts, goods at a lower price terminology, information and/or data • may give firms access to larger markets, enabling them appropriate to the question. The to expand output. discussion may also point out the possible uncertainties of alternative decisions and outcomes. Why it might not: • may prevent infant industry from growing 2 A reasoned discussion which makes 3–5 • may speed up the closure of declining industries use of economic information and clear • may replace domestic output with imports analysis to evaluate economic issues • may reduce tax revenue and situations. The answer may lack • firms may gain monopoly power and may restrict output some depth and development may be • firms may engage in unfair competition e.g. dumping. one-sided. There is relevant use of economic concepts, terminology, information and data appropriate to the question. 1 There is a simple attempt at using 1–2 economic definitions and terminology. Some reference may be made to economic theory, with occasional understanding. 0 A mark of zero should be awarded for 0 no creditable content.
This question in 0987/22 Oct/Nov 2024
Q10 · In 2022, Paraguay’s production possibility curve (PPC) shifted to the right 0987/22 May/June 2025
3 In 2022, Paraguay’s production possibility curve (PPC) shifted to the right. Paraguay has a mixed economic system. Its government provides merit goods and public goods. The country’s private sector is a major producer of shampoo. The firms in the shampoo industry make use of division of labour. There are several firms in the industry, but the number is declining. There is a possibility that soon there may be just one firm in the industry. (a) Identify what is measured on the axes of a production possibility curve. [2] (b) Explain, with an example of each, the difference between a merit good and a public good. [4] (c) Analyse how division of labour can benefit firms. [6] (d) Discuss whether or not consumers would benefit from only one firm producing shampoo. [8]
20 marks
Mark scheme: 3(a) Identify what is measured on the axes of a production 2 Two types of products may be shown on the axes on a PPC possibility curve. diagram for two marks. (Output of) two types of product (2). If more than two items are given, consider the first three. Output (1) one type of product (1) another type of product (1). 3(b) Explain, with an example of each, the difference 4 One mark for an explanation of a merit good and one mark between a merit good and a public good. for an example of a merit good. One mark for an explanation of a public good and one mark Logical explanation which might include: for an example of a public good. A merit good is under-consumed / underproduced / Accept but do not expect reference to non-rejectable / zero consumers do not appreciate its full value / has external cost of producing an extra unit for a public good. benefits / can be produced by the private sector / can be produced by the private sector and the public sector / is a Allow public park. private good / is rival and excludable (1) e.g. education / healthcare / fruit (1). No mark for roads unless qualified by e.g. uncrowded roads A public good would not be produced by the private sector / with many entry and exit points. is (usually) supplied / produced by the government / funded by the government (1) non-excludable / non-rival (1) e.g. street lighting / defence / flood control (1). 3(c) Analyse how division of labour can benefit firms. 6 Coherent analysis which might include: • Workers can specialise (1) in what they are best at producing (1) save time / speed up production (1) reduce waste (1) reduce mistakes (1) increase productivity /skill / efficiency (1) increase output / supply (1) lower (average) cost (1). • Increase quality (1) lower prices (1) raise demand / increase sales (1) increase revenue (1) increase profits (1). • Make it easier to mechanise production (1) reduce labour required (1). • Reduce training / training costs (1) as reduce tasks undertaken / division of labour involves breaking production down into different tasks (1). 3(d) Discuss whether or not consumers would benefit from 8 Level Description Marks only one firm producing shampoo. 3 A reasoned discussion which accurately 6–8 In assessing each answer, use the table opposite. examines both sides of the economic argument, making use of economic Why they might: information and clear and logical • one firm may be able to benefit from economies of scale analysis to evaluate economic issues • lower average cost may lead to lower prices and situations. One side of the argument • firm may spend a large amount on research and may have more depth than the other, but development due to high profits and security overall both sides of the argument are • quality of product may be high considered and developed. There is • less time / less effort choosing shampoo. thoughtful evaluation of economic concepts, terminology, information Why they might not: and/or data appropriate to the question. • lack of competition may drive up prices The discussion may also point out the • lack of choice possible uncertainties of alternative • if quality is poor, cannot switch to substitutes decisions and outcomes. • firm may experience diseconomies of scale. 2 A reasoned discussion which makes use 3–5 of economic information and clear analysis to evaluate economic issues and situations. The answer may lack some depth and development may be one-sided. There is relevant use of economic concepts, terminology, information and data appropriate to the question. 3(d) Level Description Marks 1 There is a simple attempt at using 1–2 economic definitions and terminology. Some reference may be made to economic theory, with occasional understanding. 0 A mark of zero should be awarded for no 0 creditable content.
This question in 0987/22 May/June 2025
Q11 · Some markets in Belgium are in equilibrium 0987/22 Oct/Nov 2025
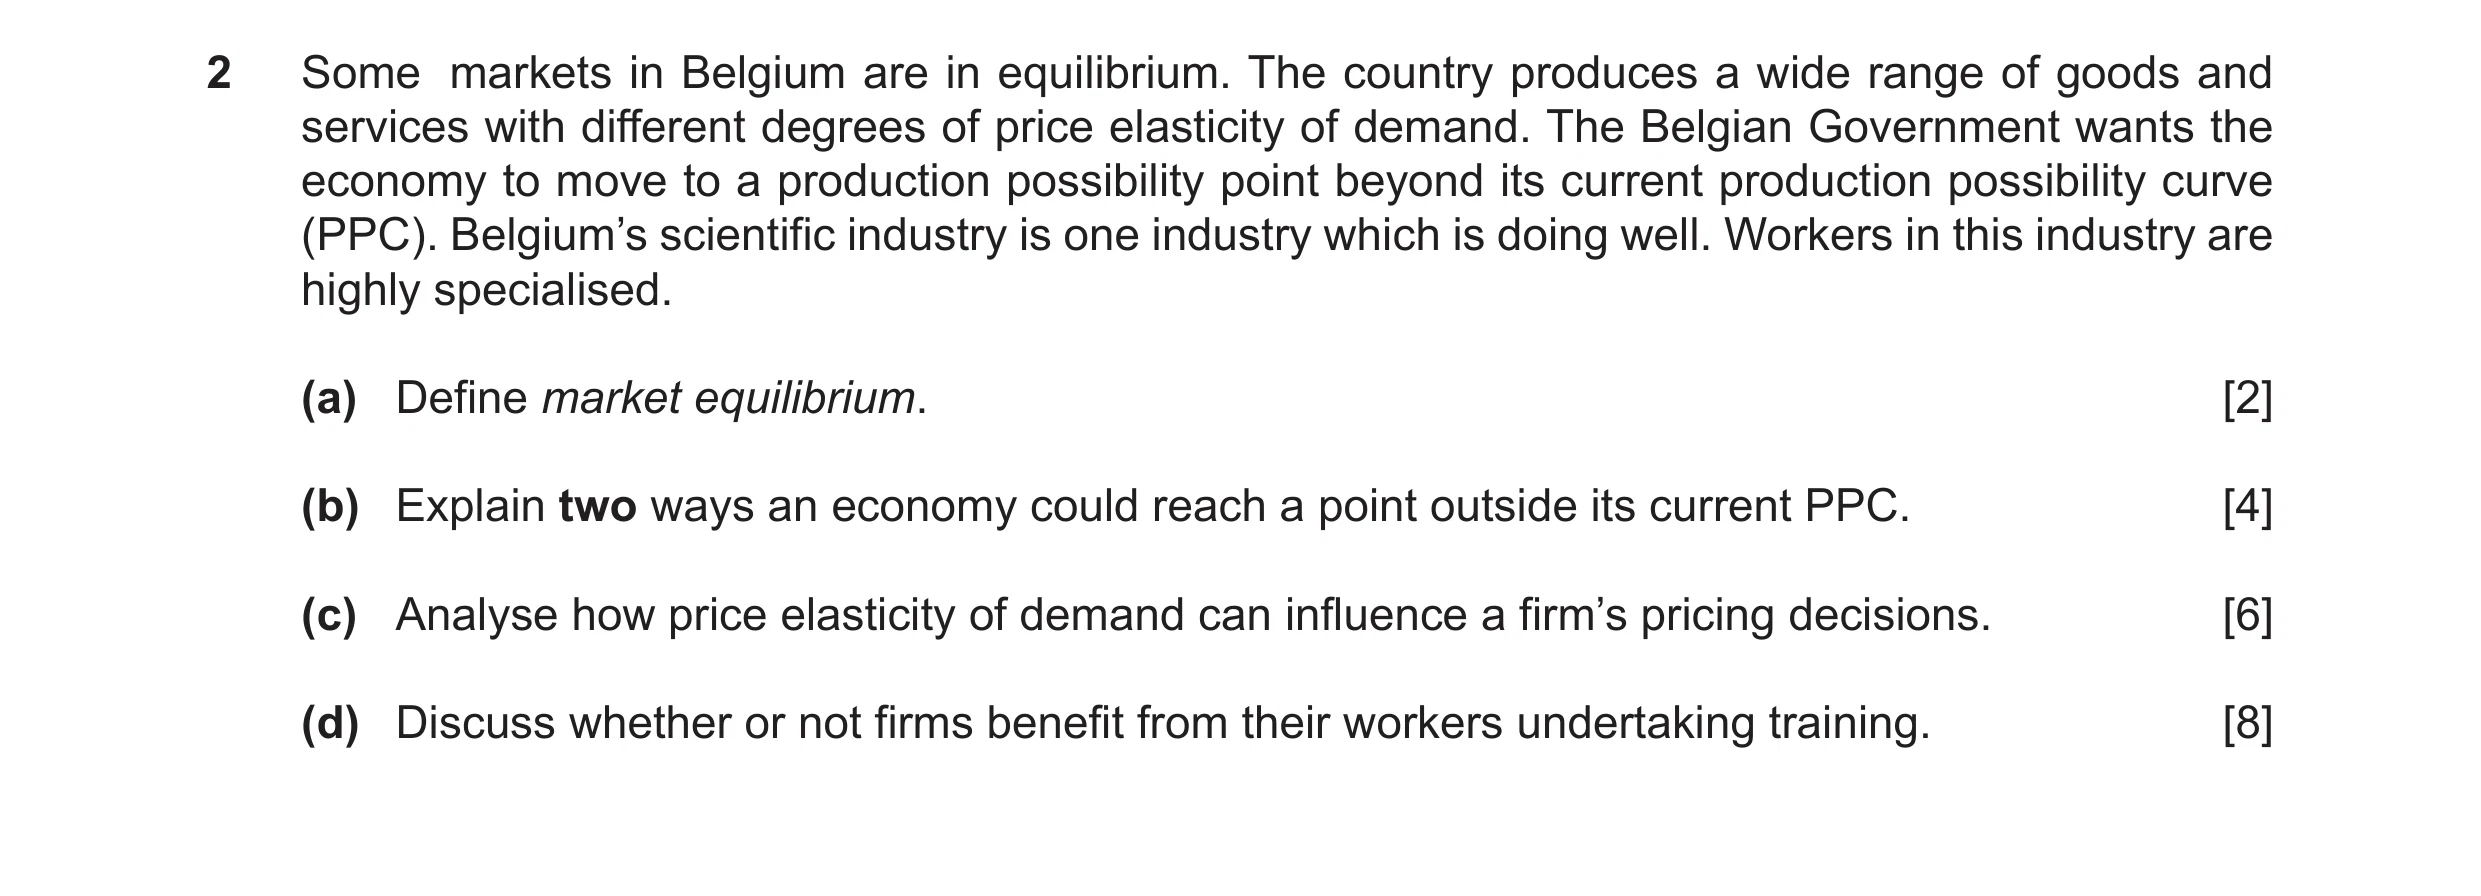
2 Some markets in Belgium are in equilibrium. The country produces a wide range of goods and services with different degrees of price elasticity of demand. The Belgian Government wants the economy to move to a production possibility point beyond its current production possibility curve (PPC). Belgium’s scientific industry is one industry which is doing well. Workers in this industry are highly specialised. (a) Define market equilibrium. [2] (b) Explain two ways an economy could reach a point outside its current PPC. [4] (c) Analyse how price elasticity of demand can influence a firm’s pricing decisions. [6] (d) Discuss whether or not firms benefit from their workers undertaking training. [8]
20 marks
Mark scheme: 2(a) Define market equilibrium. 2 Demand equalling supply (2). No shortage (1) no surplus (1). Balance of demand and supply (2). 2(b) Explain two ways an economy could reach a point 4 One mark each for two ways identified and one mark each outside its current PPC. for two explanations. Logical explanation which might include the following. If more than two reasons are given, consider the first three. • Increase investment (1) devoting more resources to capital goods (1). • Encourage immigration (1) increase size of the labour force (1). • Land reclamation (1) creating more land on which to e.g. grow crops (1). • Increase in education and training (1) raise quality / efficiency / productivity of labour (1). • Increase spending on research and development / new technology (1) increase quality / efficiency / productivity of capital (1). • Discovery of sources of resources (1) example/enables extra output to be produced (1). 2(c) Analyse how price elasticity of demand can influence a 6 Reward, but do not expect: firm’s pricing decisions. Facilitate price discrimination (1) charging higher prices in Coherent analysis which might include the following. markets with inelastic demand (1) valid example, e.g. higher rail fares at peak times (1). Price elasticity of demand is a measure of the responsiveness of demand to a change in price (1). If demand is elastic, a rise in price will cause a greater percentage change in demand (1) may indicate the firm’s product has close substitutes / is not a necessity / takes a significant proportion of consumers’ incomes (1) may encourage firms to lower price (1) raise revenue (1). If demand is inelastic, a rise in price will cause a smaller percentage change in demand (1) may indicate the firm’s product has few substitutes / is a necessity / takes a small proportion of consumers’ incomes (1) may encourage firms to raise prices (1) revenue would increase (1). 2(d) Discuss whether or not firms benefit from their workers 8 Level Description Marks undertaking training. 3 A reasoned discussion which accurately 6–8 In assessing each answer, use the table opposite. examines both sides of the economic argument, making use of economic Why they might: information and clear and logical • may increase productivity analysis to evaluate economic issues • may enable workers to work with more advanced and situations. One side of the technology argument may have more depth than • may lower costs of production the other, but overall, both sides of the • may be able to fill promoted posts argument are considered and • reduce waste developed. There is thoughtful • raise quality of output evaluation of economic concepts, • training may be provided by the government at no direct terminology, information and/or data cost for firms. appropriate to the question. The • increase workers motivation, reducing labour turnover discussion may also point out the • increase flexibility to cover absences. possible uncertainties of alternative decisions and outcomes. Why they might not: • if the firms provide the training, increase costs / 2 A reasoned discussion which makes 3–5 use of economic information and clear opportunity cost • output may fall while workers are being trained analysis to evaluate economic issues and situations. The answer may lack • training may not be successful some depth and development may be • trained workers may demand higher wages one-sided. There is relevant use of • trained workers may leave to work for other firms – economic concepts, terminology, other firms will gain the benefits of the training. information and data appropriate to the question. 2(d) Level Description Marks 1 There is a simple attempt at using 1–2 economic definitions and terminology. Some reference may be made to economic theory, with occasional understanding. 0 A mark of zero should be awarded for 0 no creditable content.
This question in 0987/22 Oct/Nov 2025
 1 / 4
1 / 4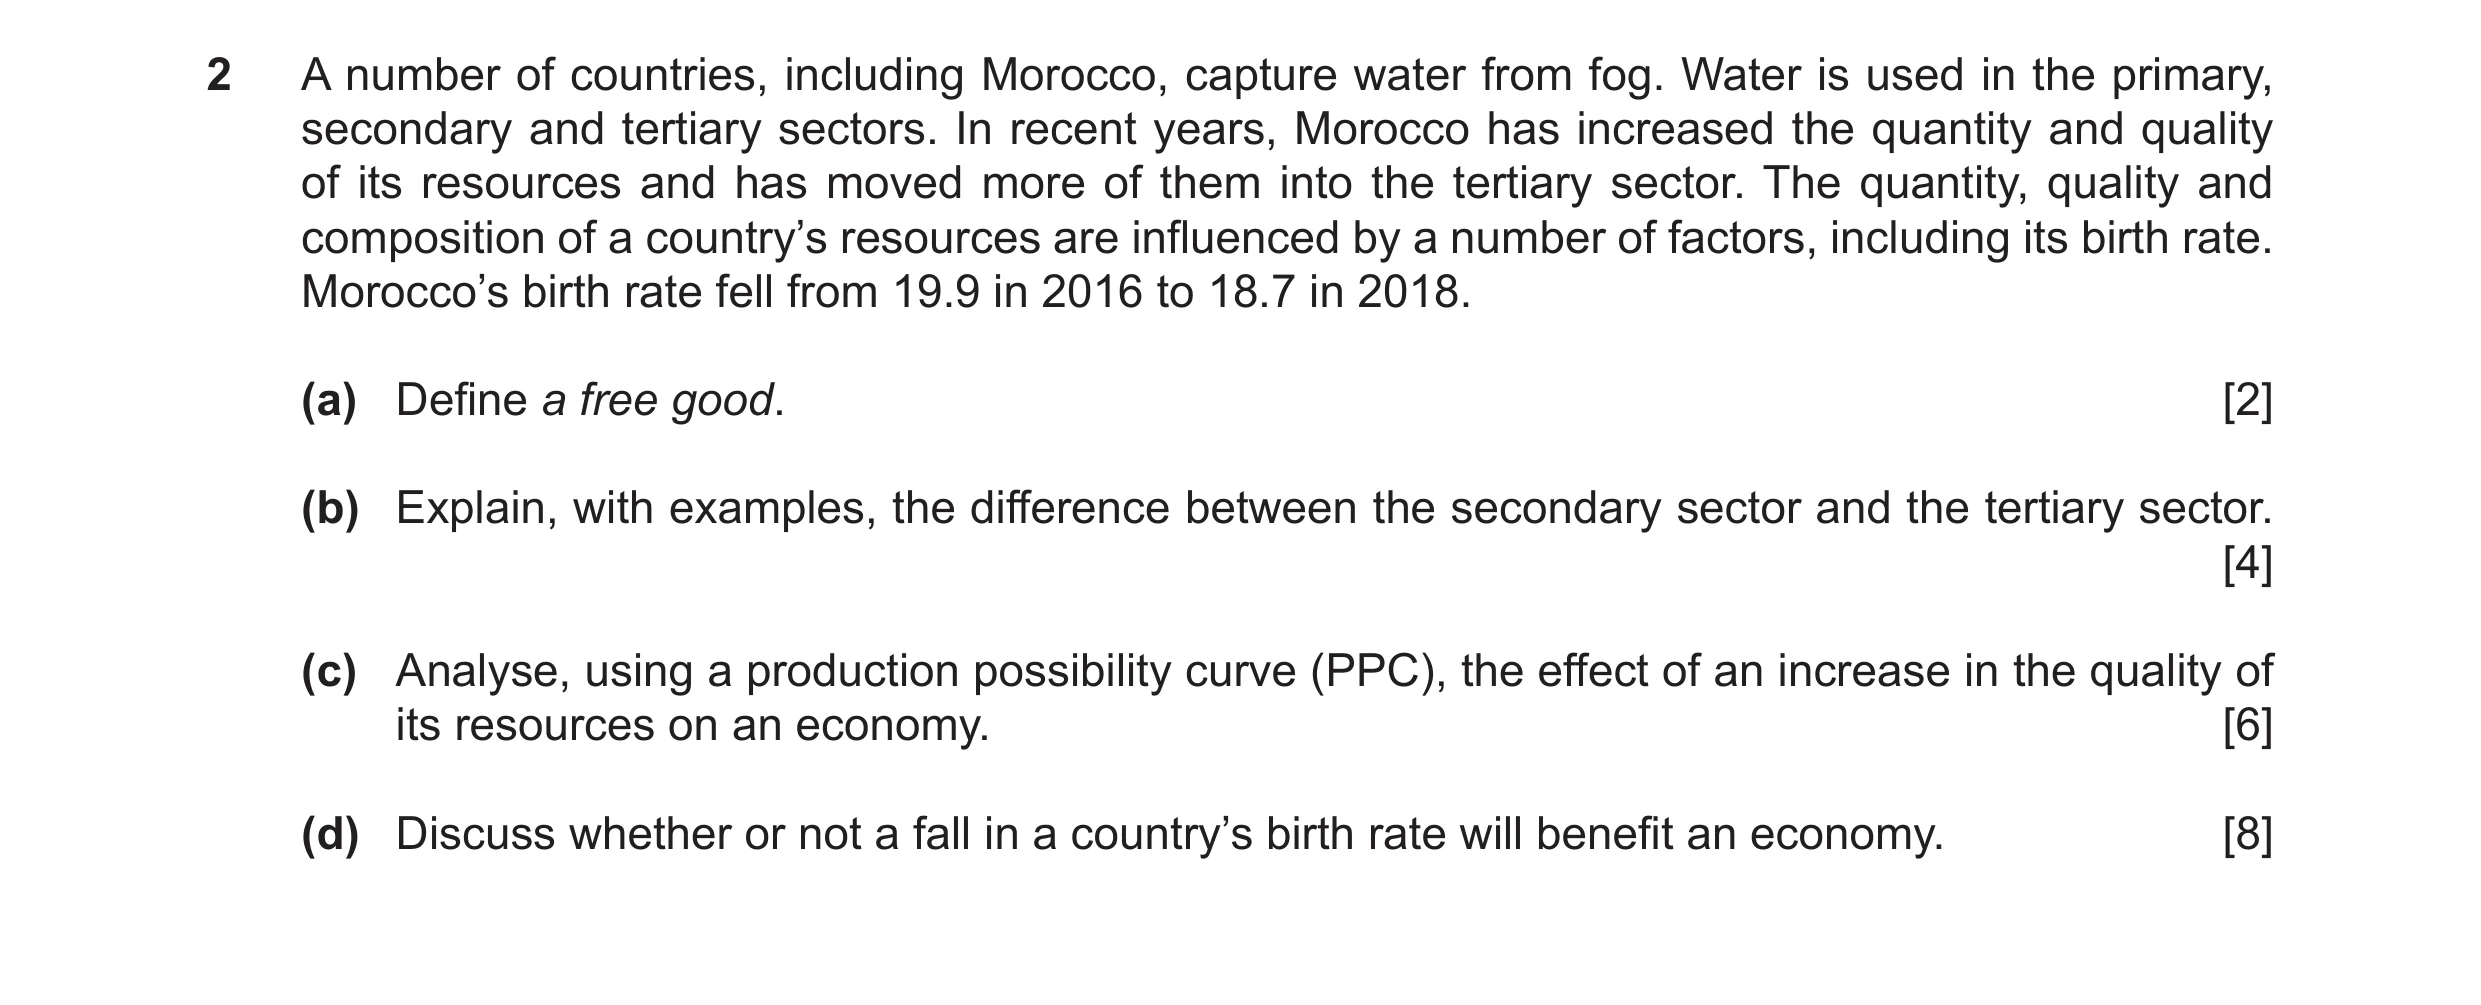
![Question 5: (a) Calculate the number of births in Cyprus in 2019. [1] (b) Identify two indicators of living standards. [2] (c) State why the global mar…](https://img.pastlit.com/crops/ee721f9e-13aa-489b-97d1-8d2a02fbfef0/q1.webp)
 2 / 4
2 / 4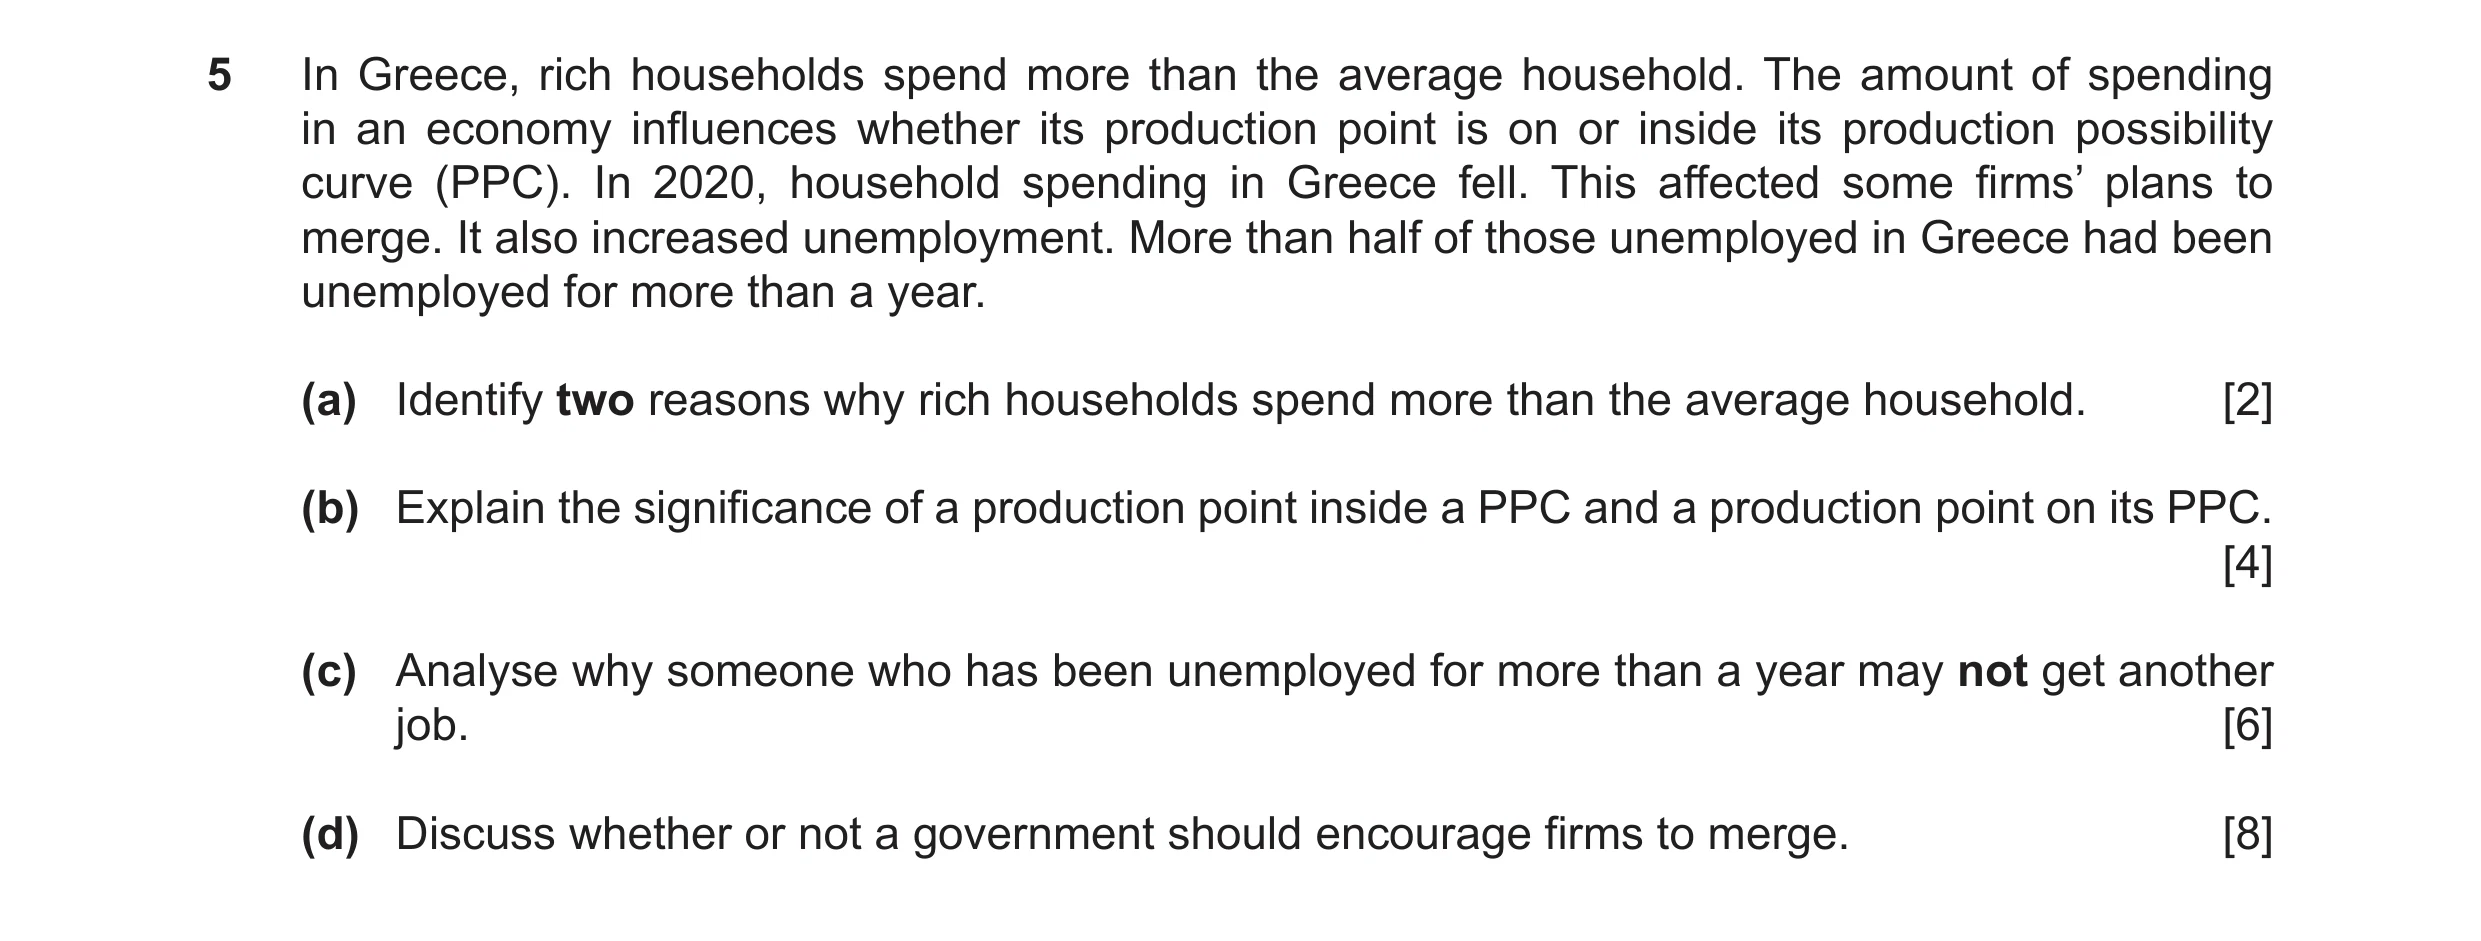
 3 / 4
3 / 4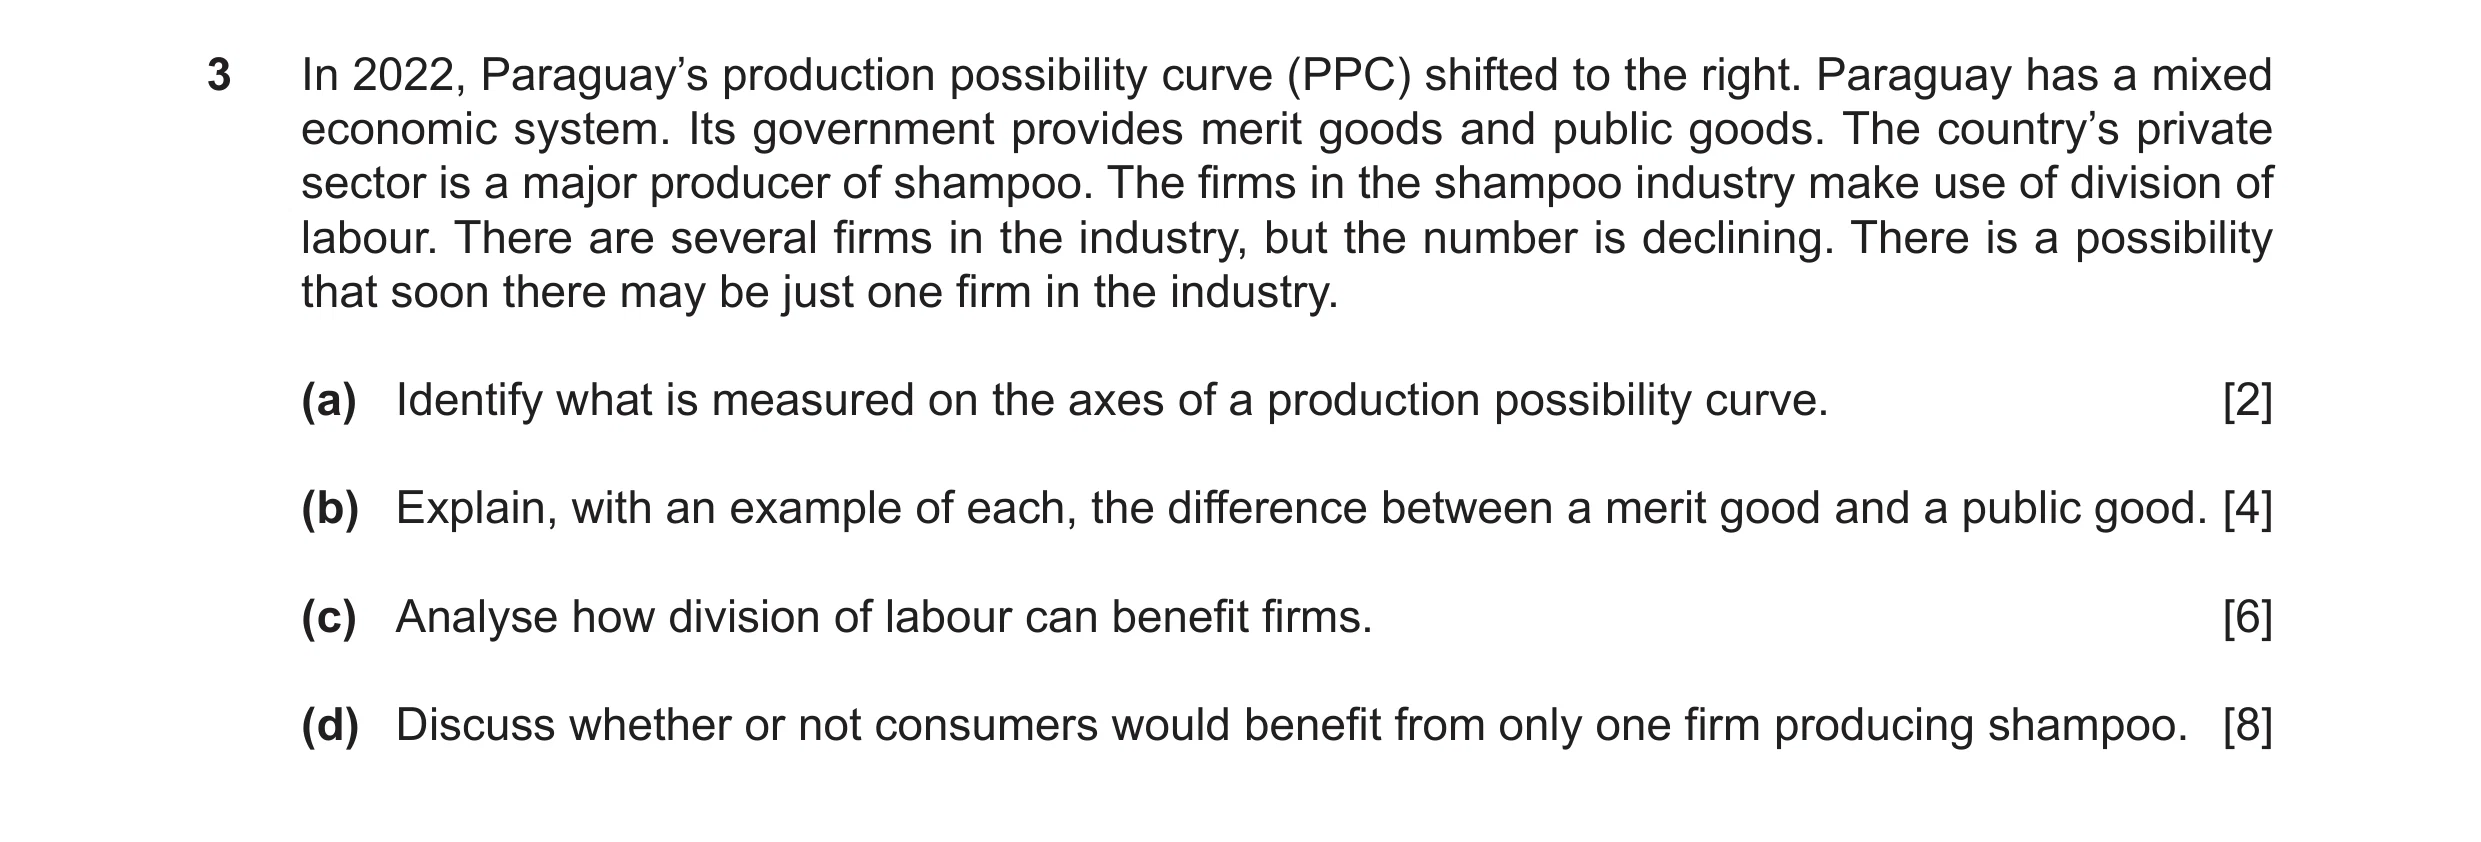
 4 / 4
4 / 4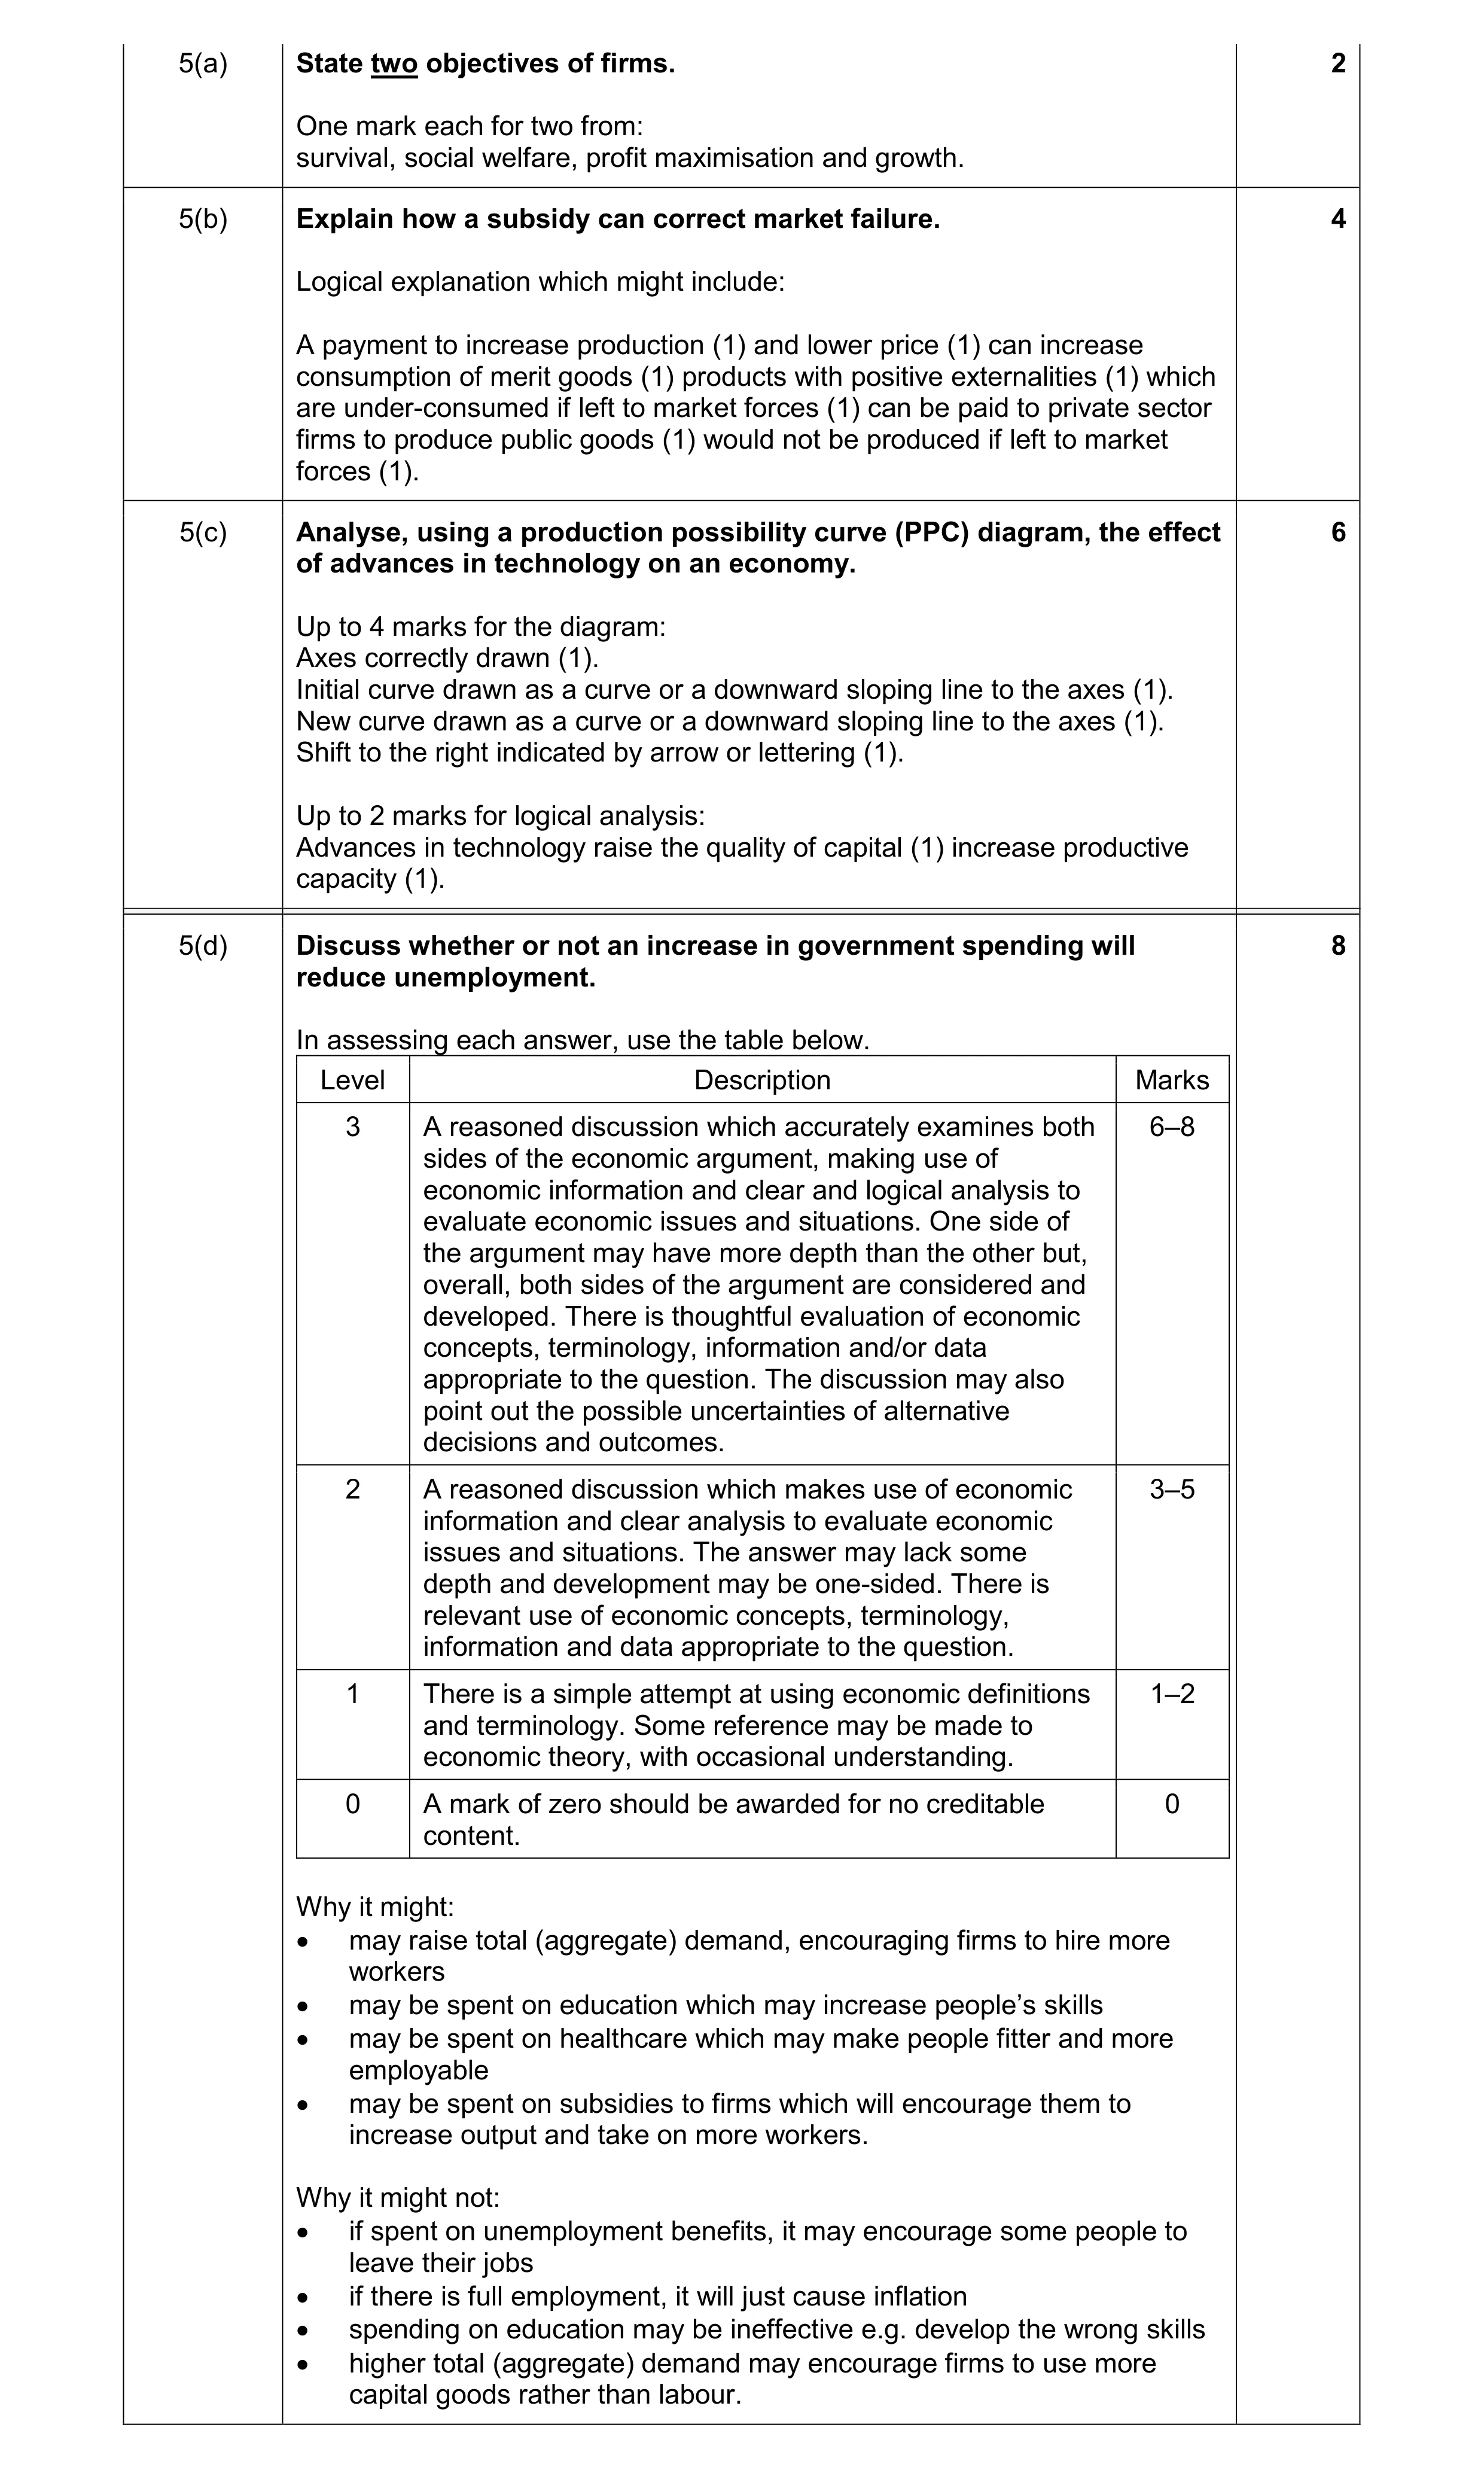 20
20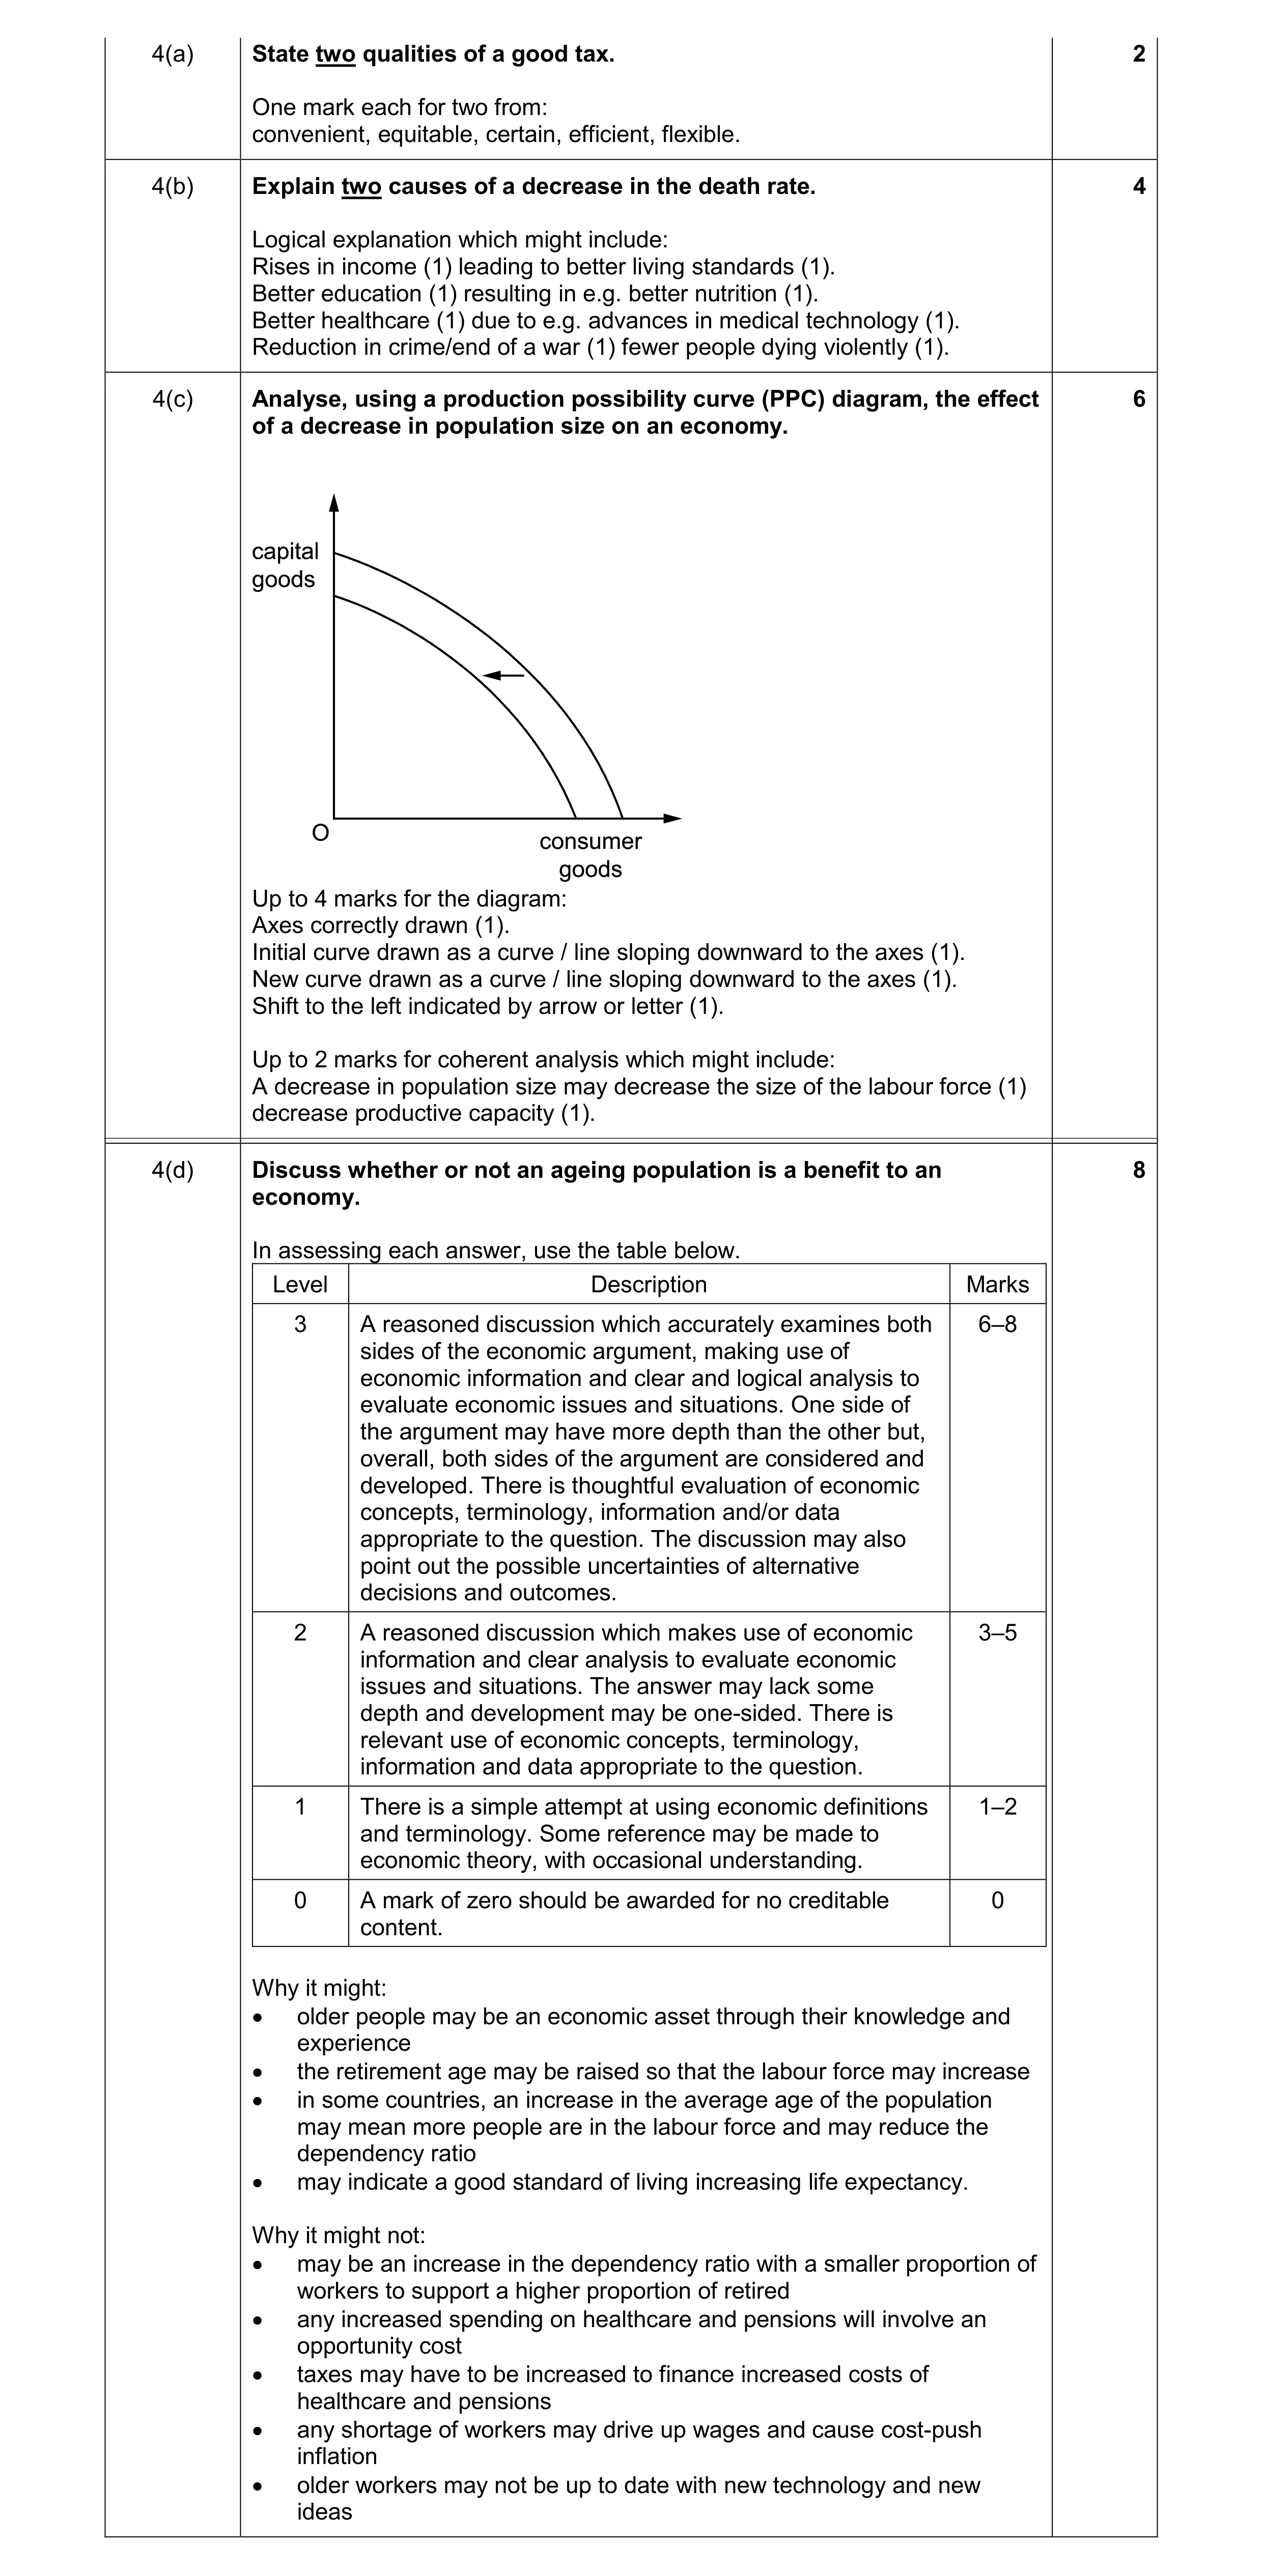 20
20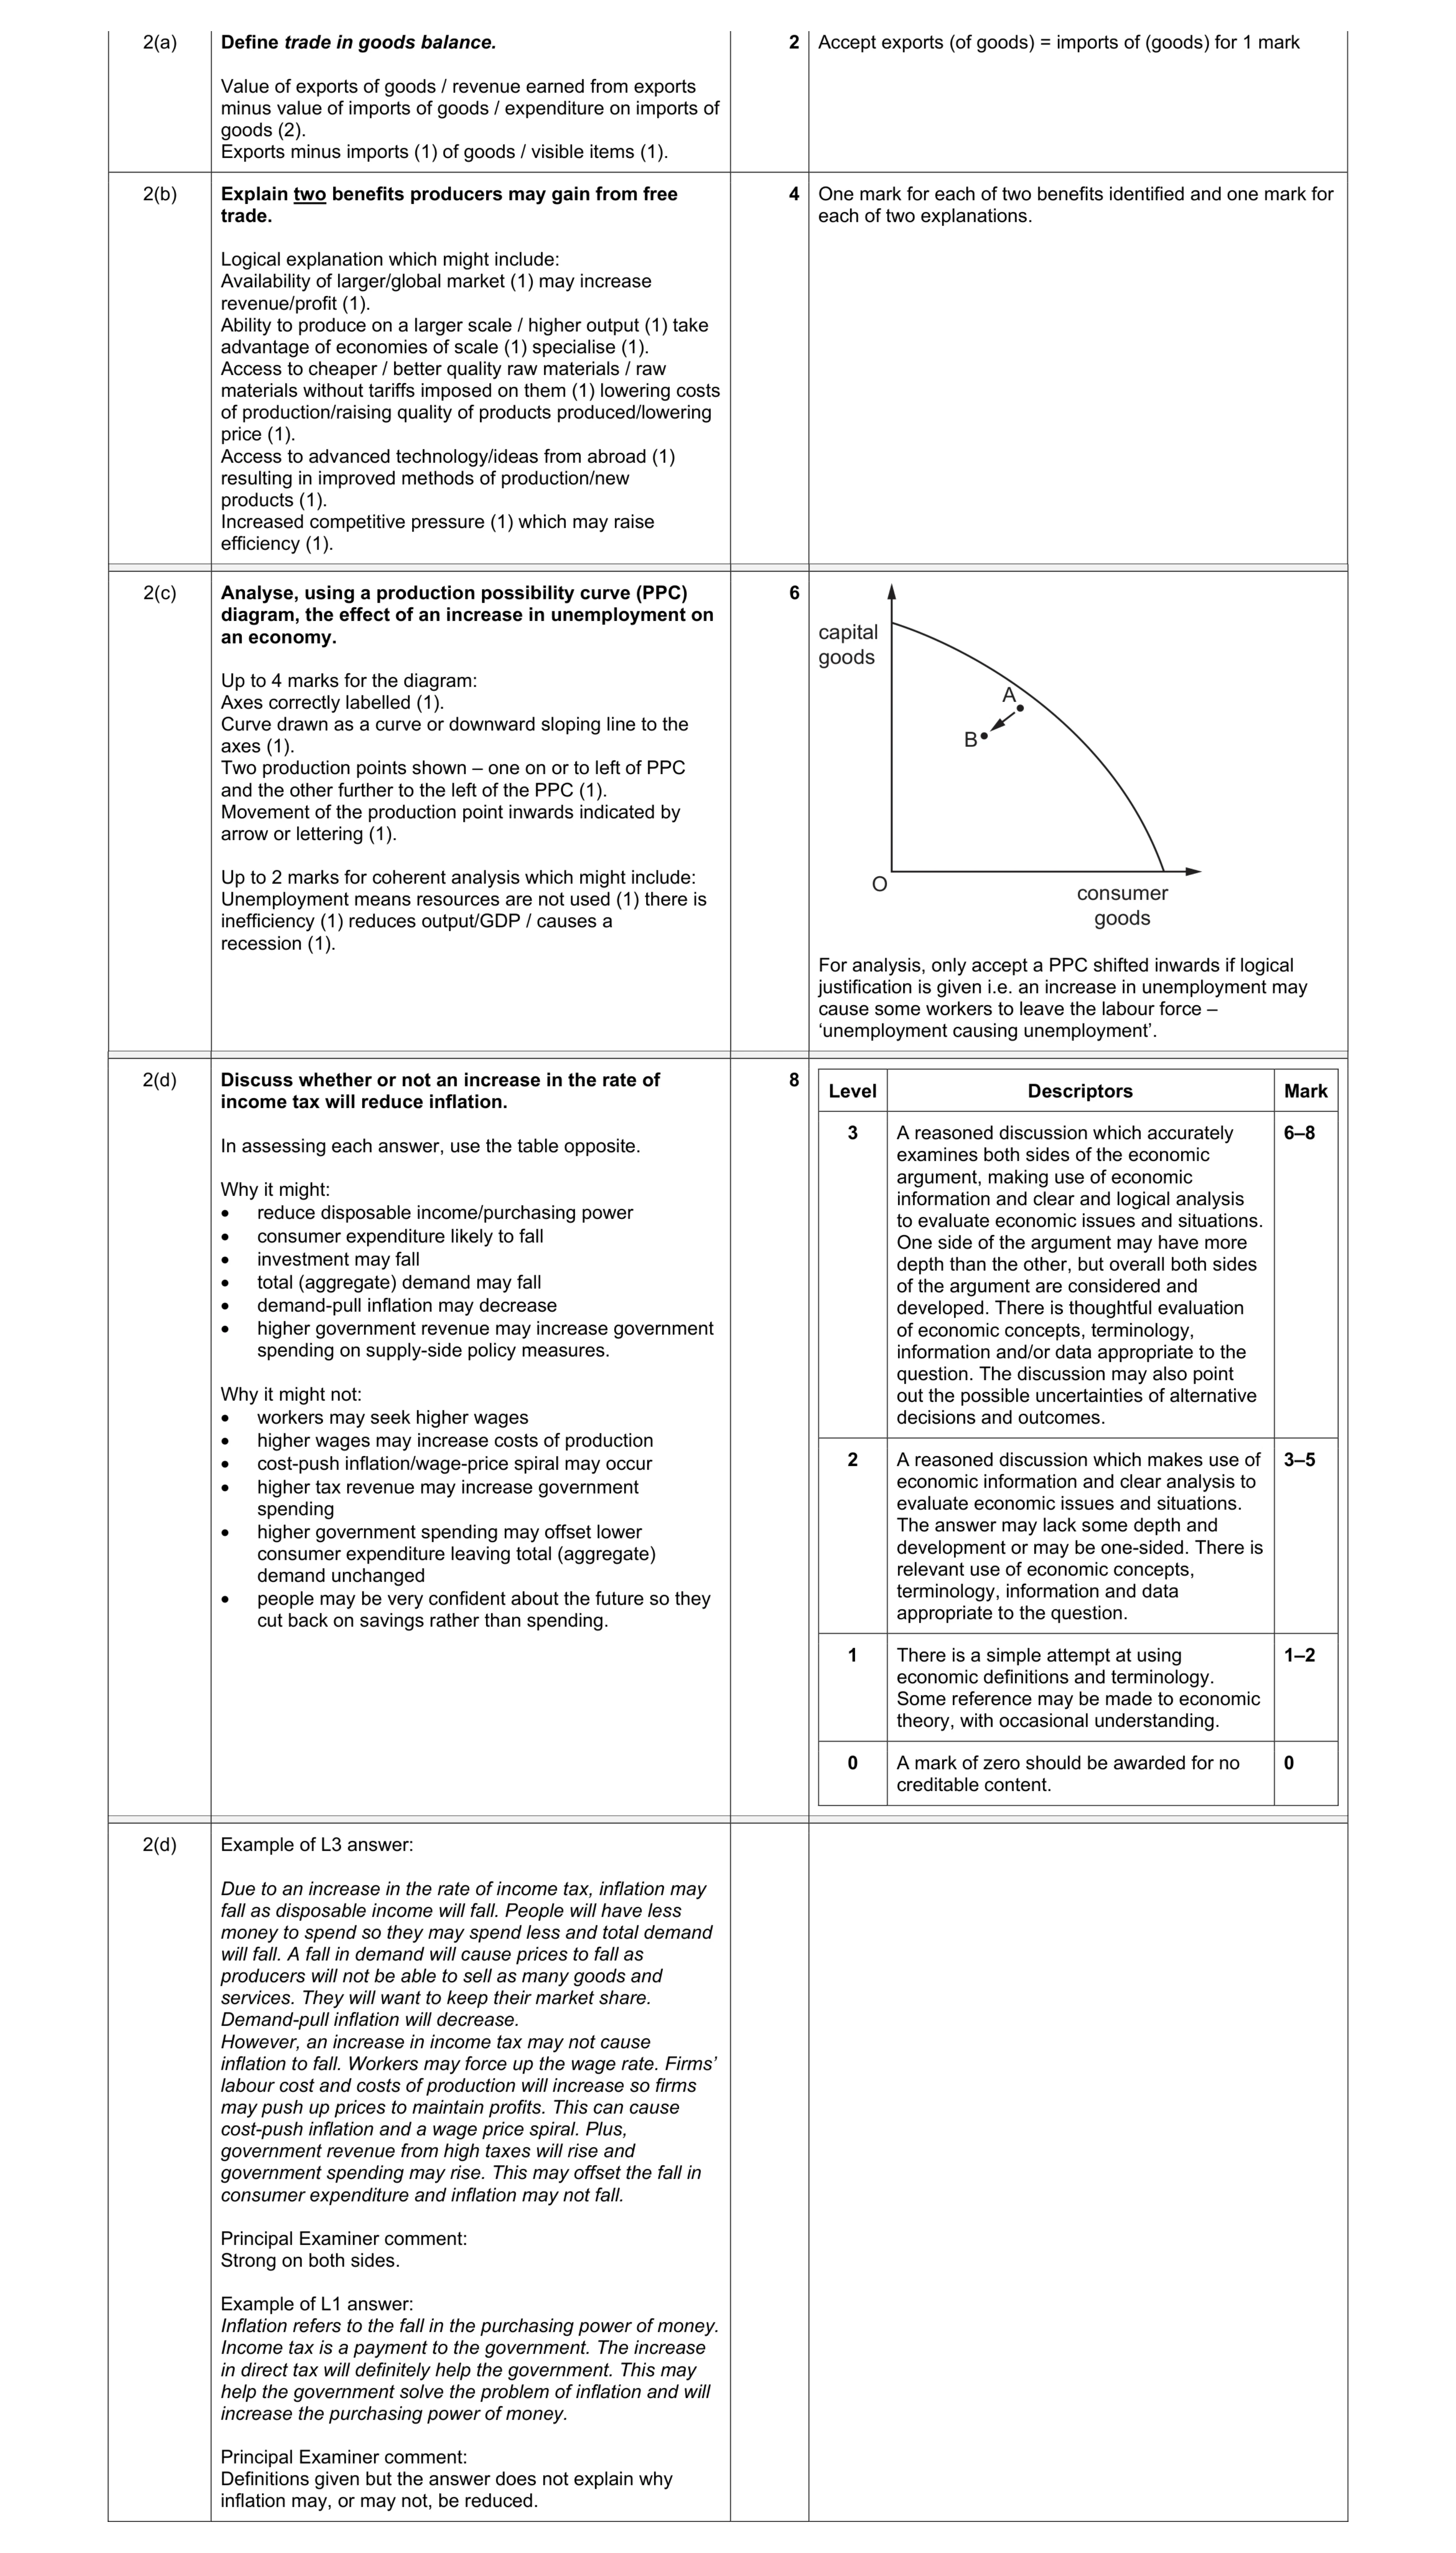 20
20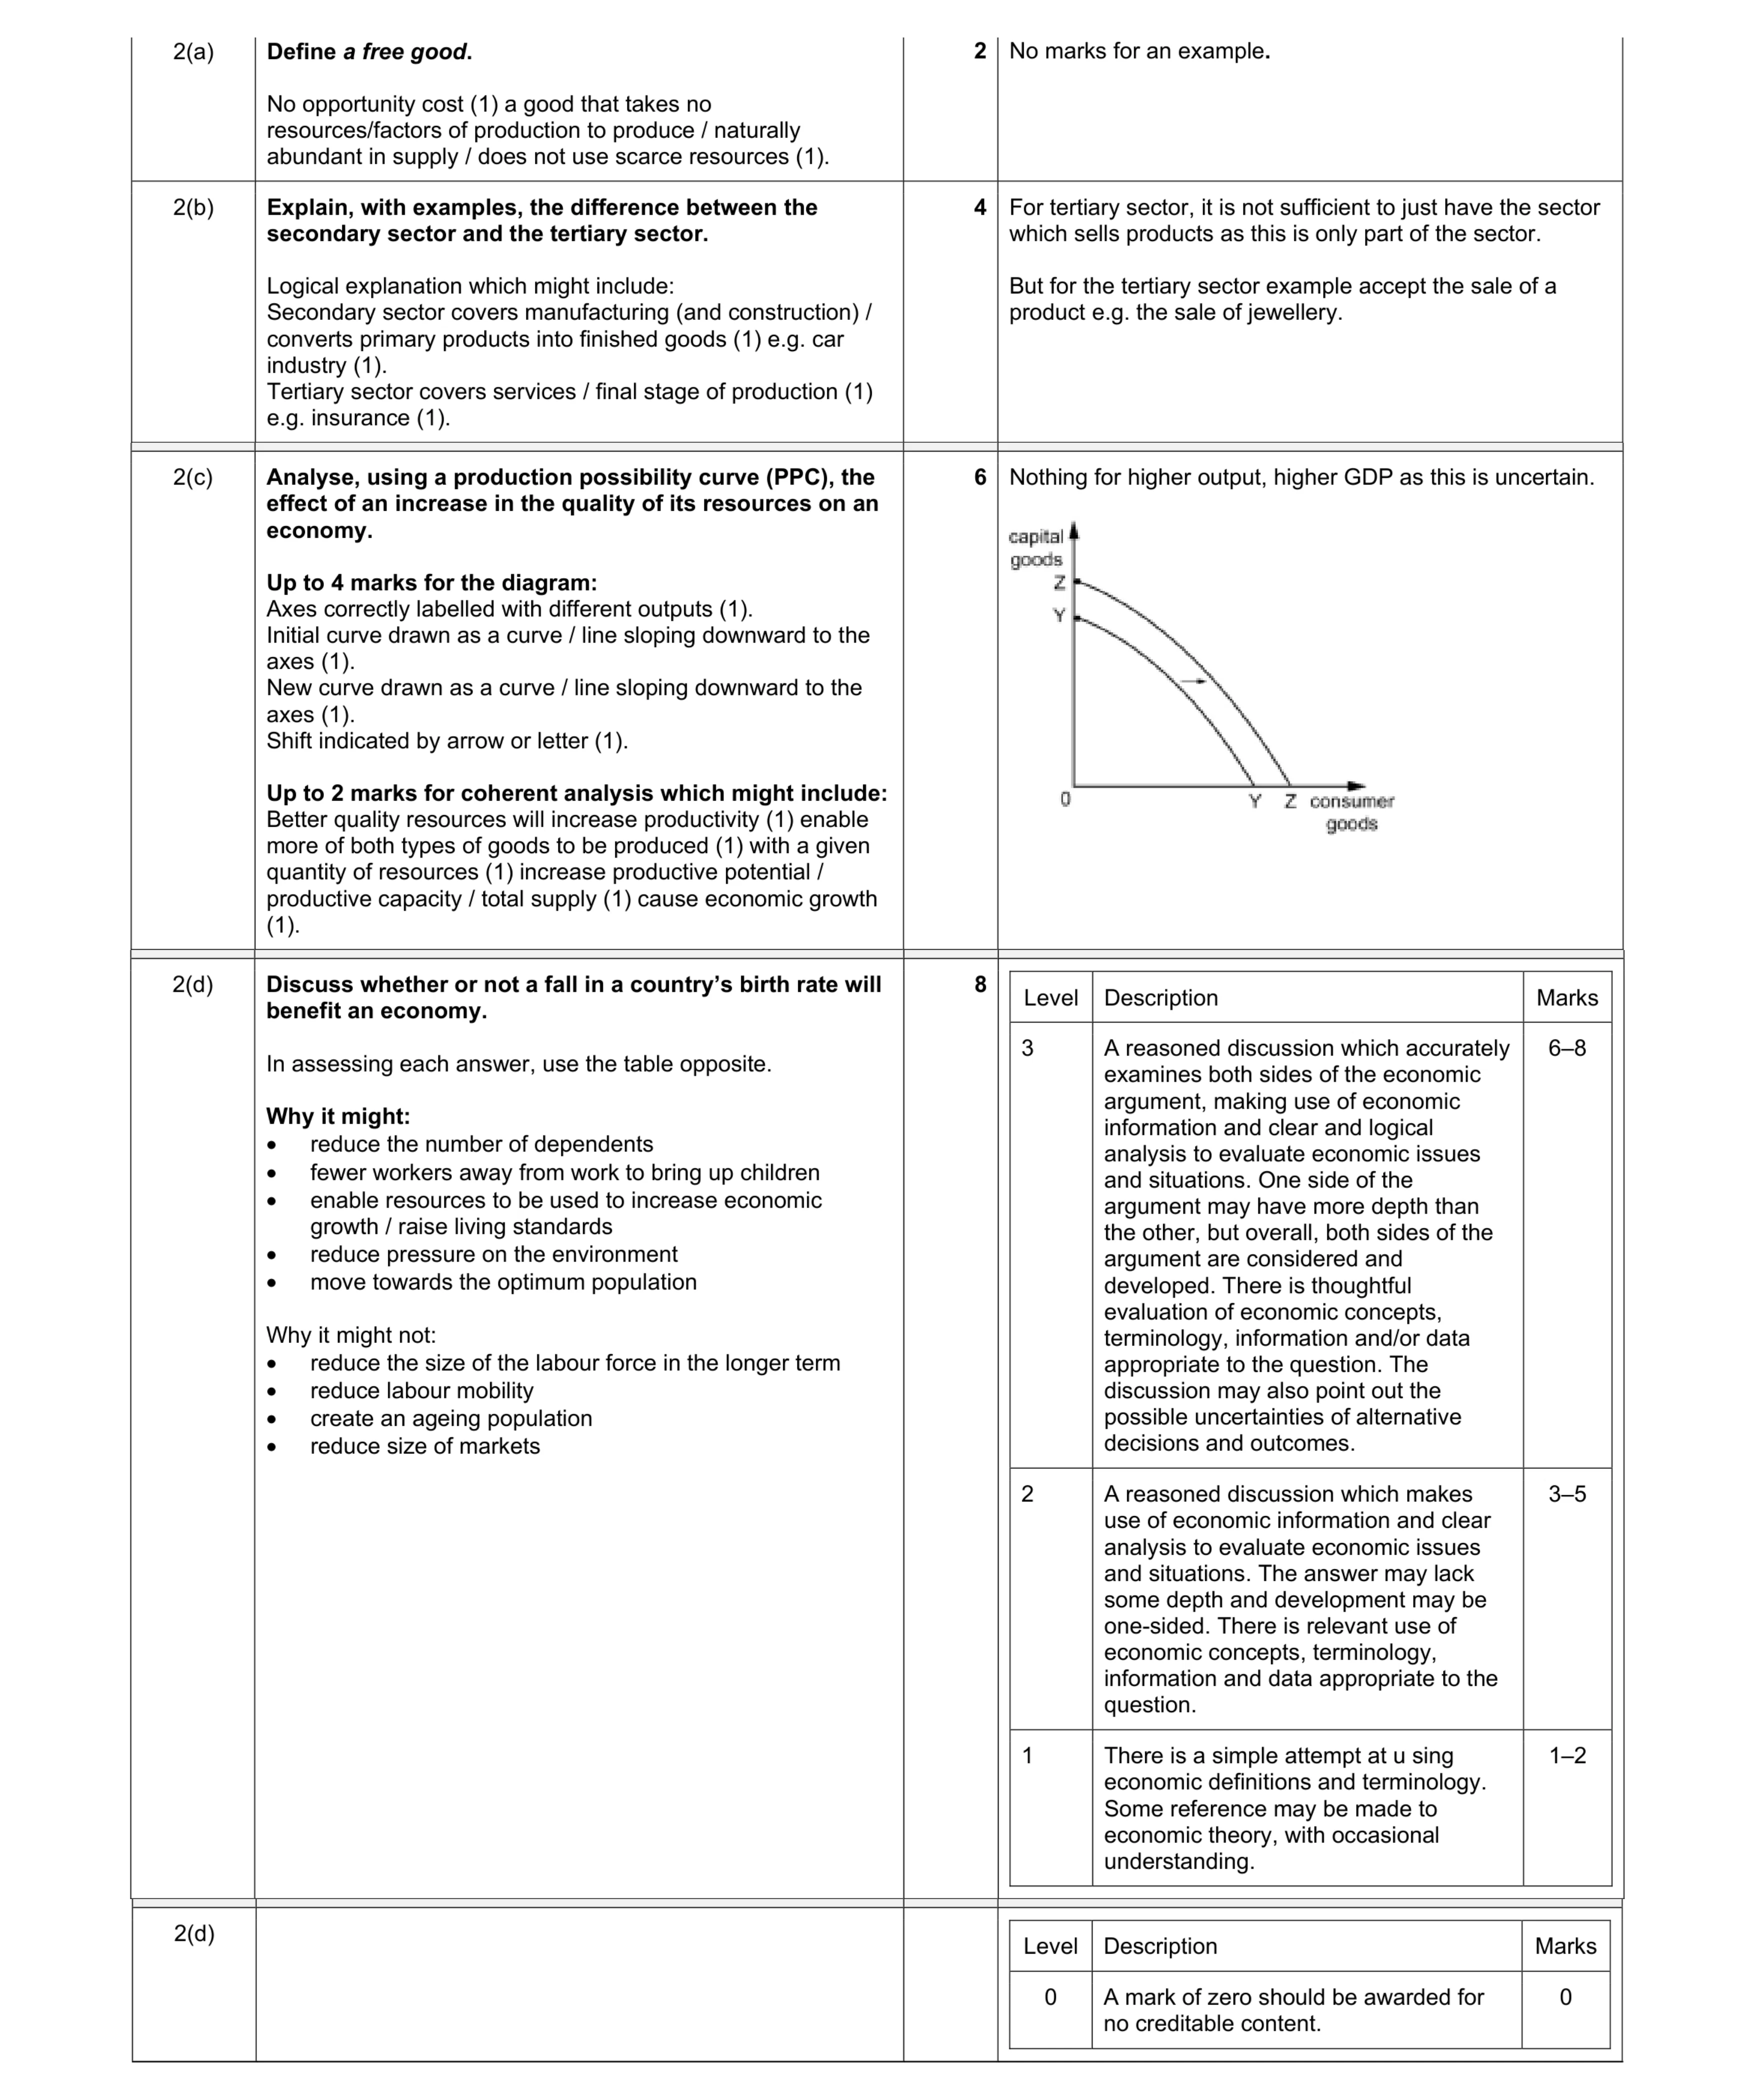 20
20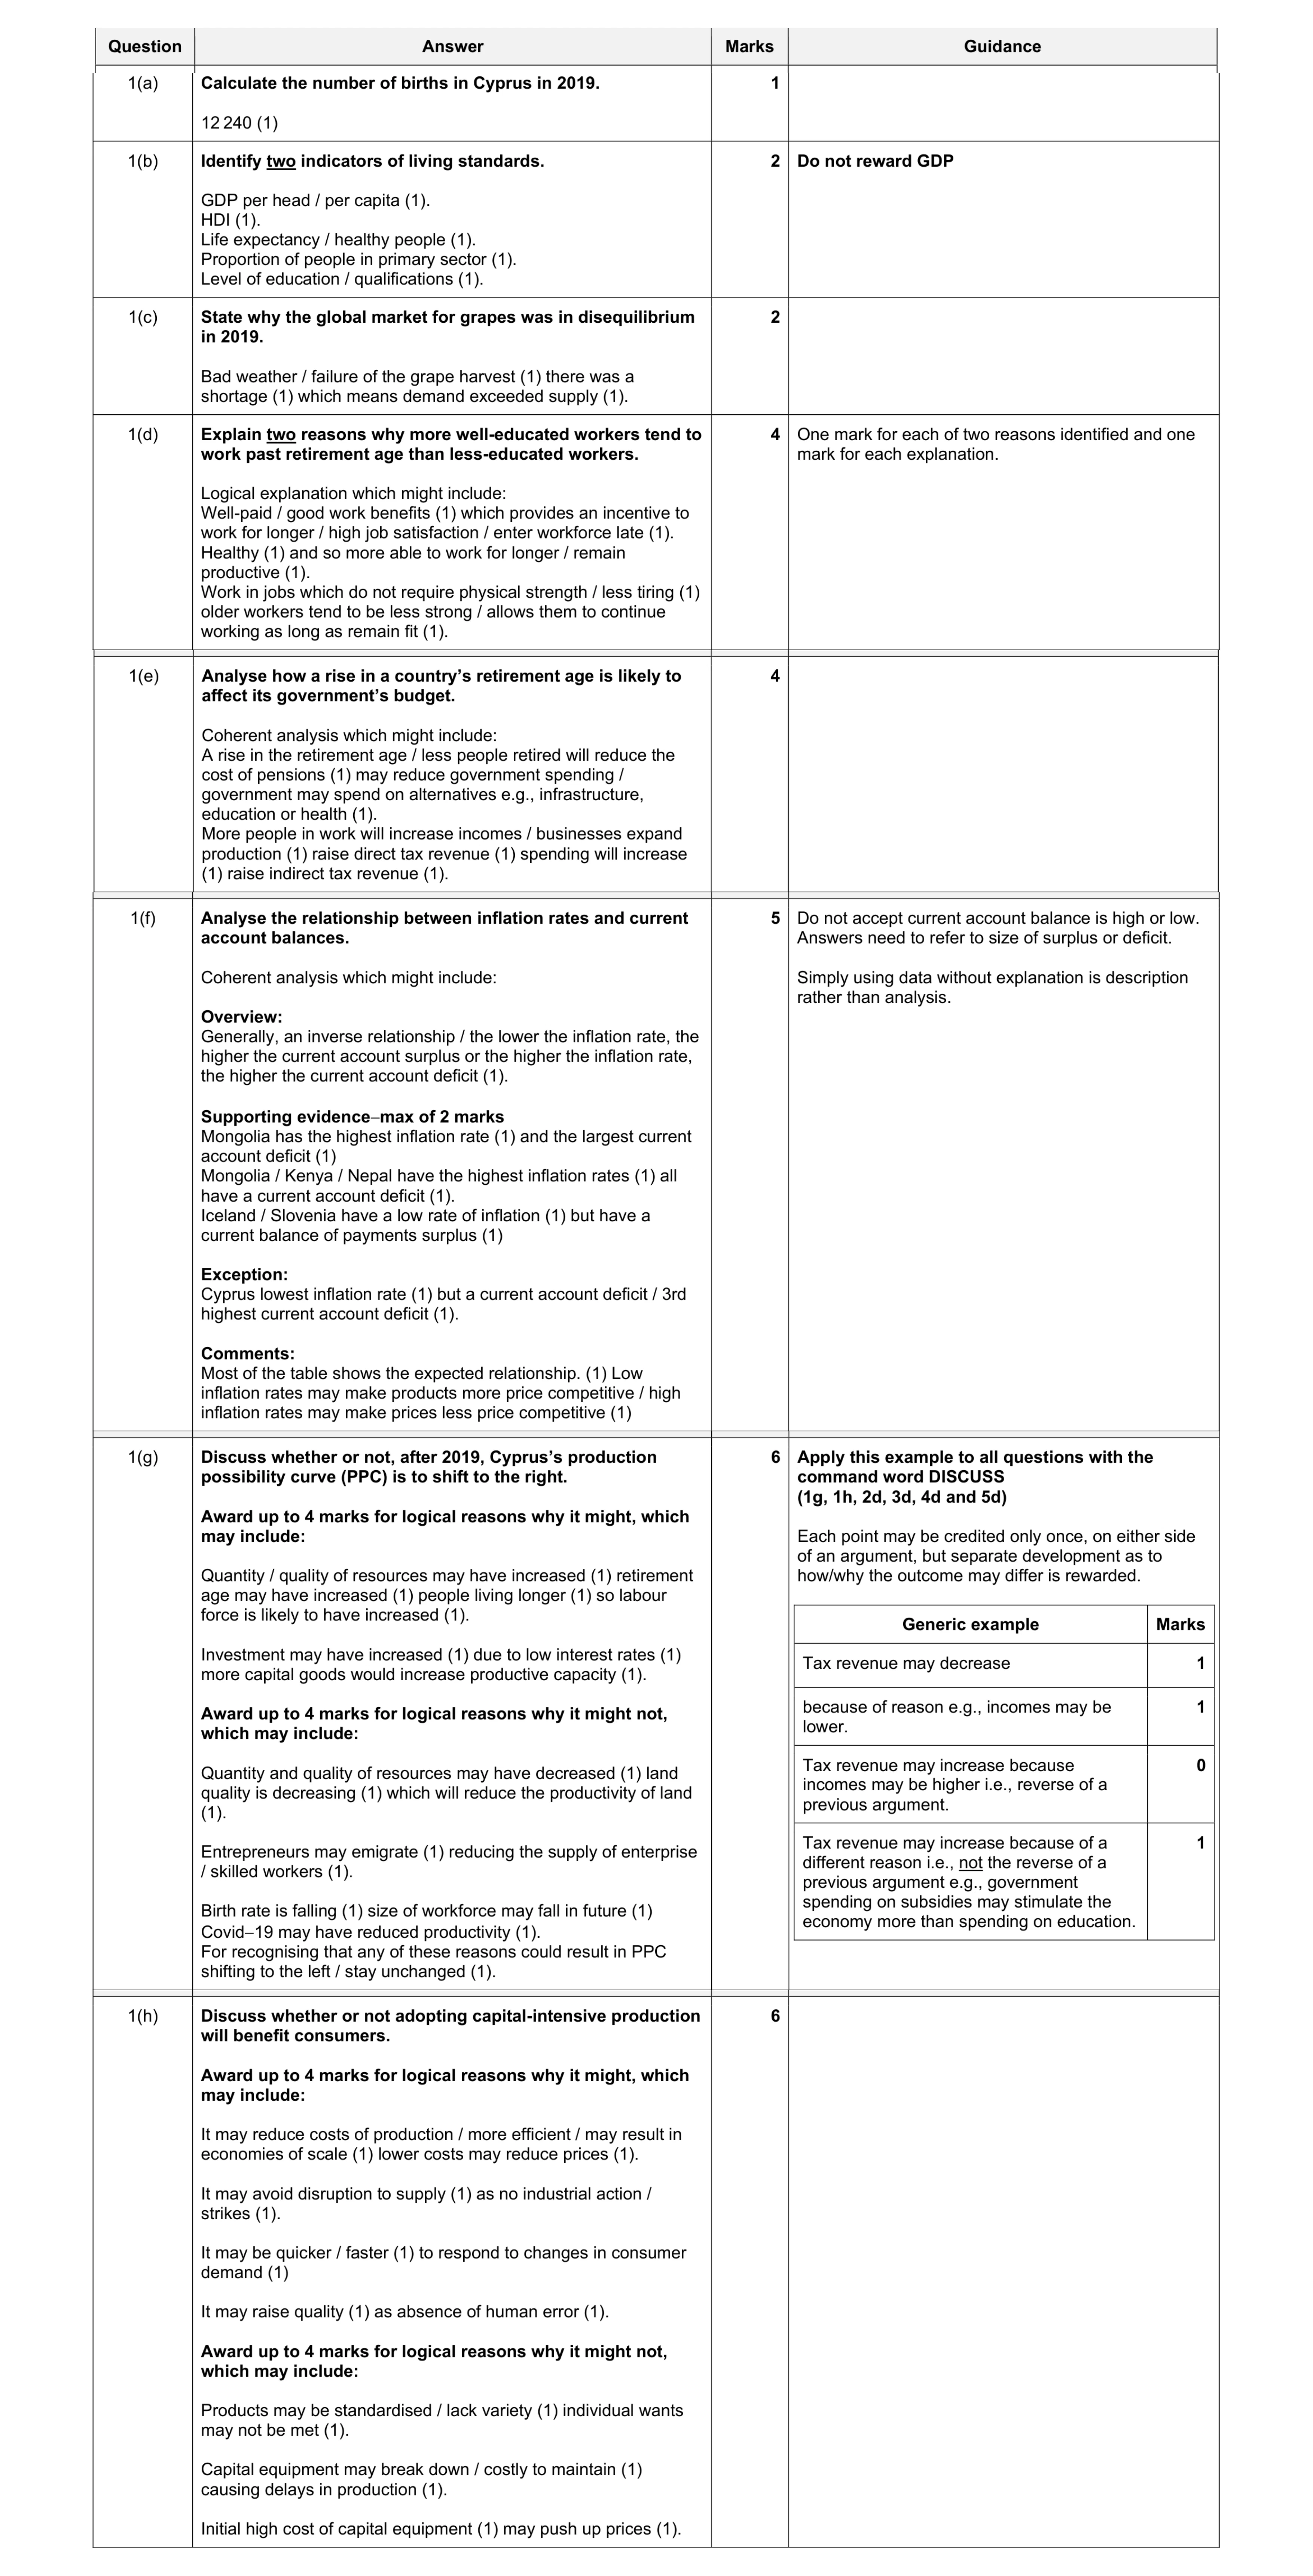 30
30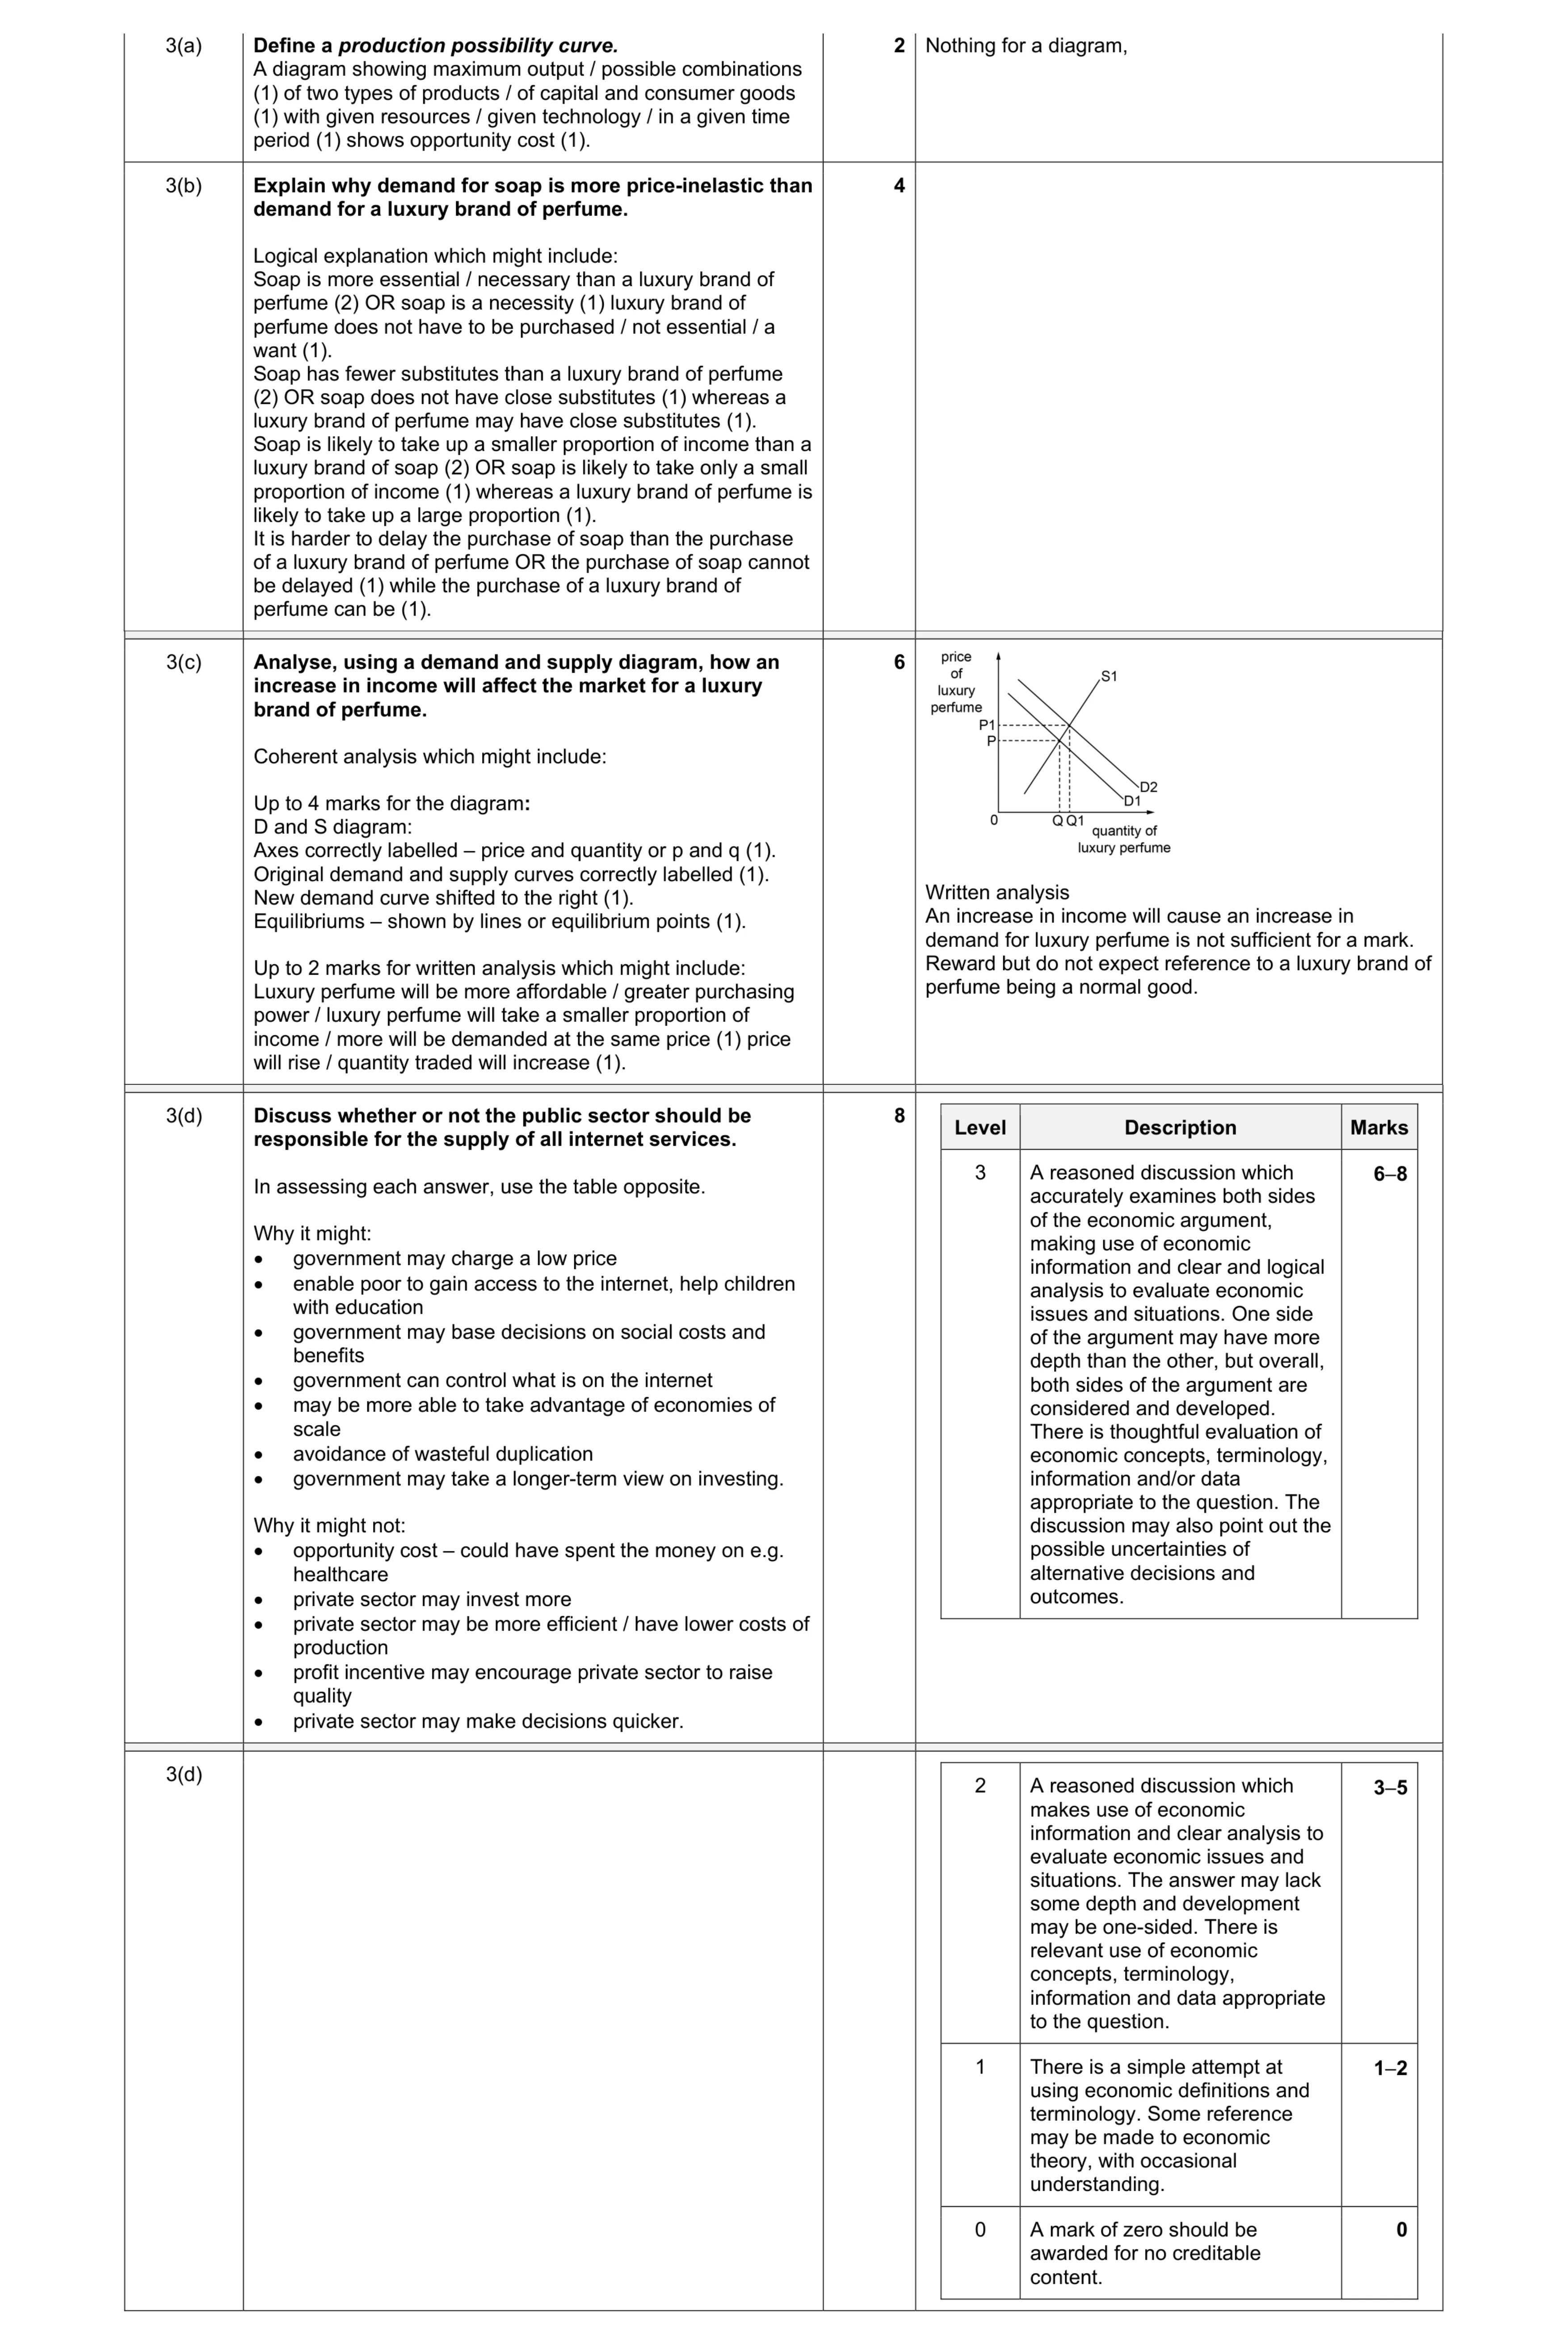 20
20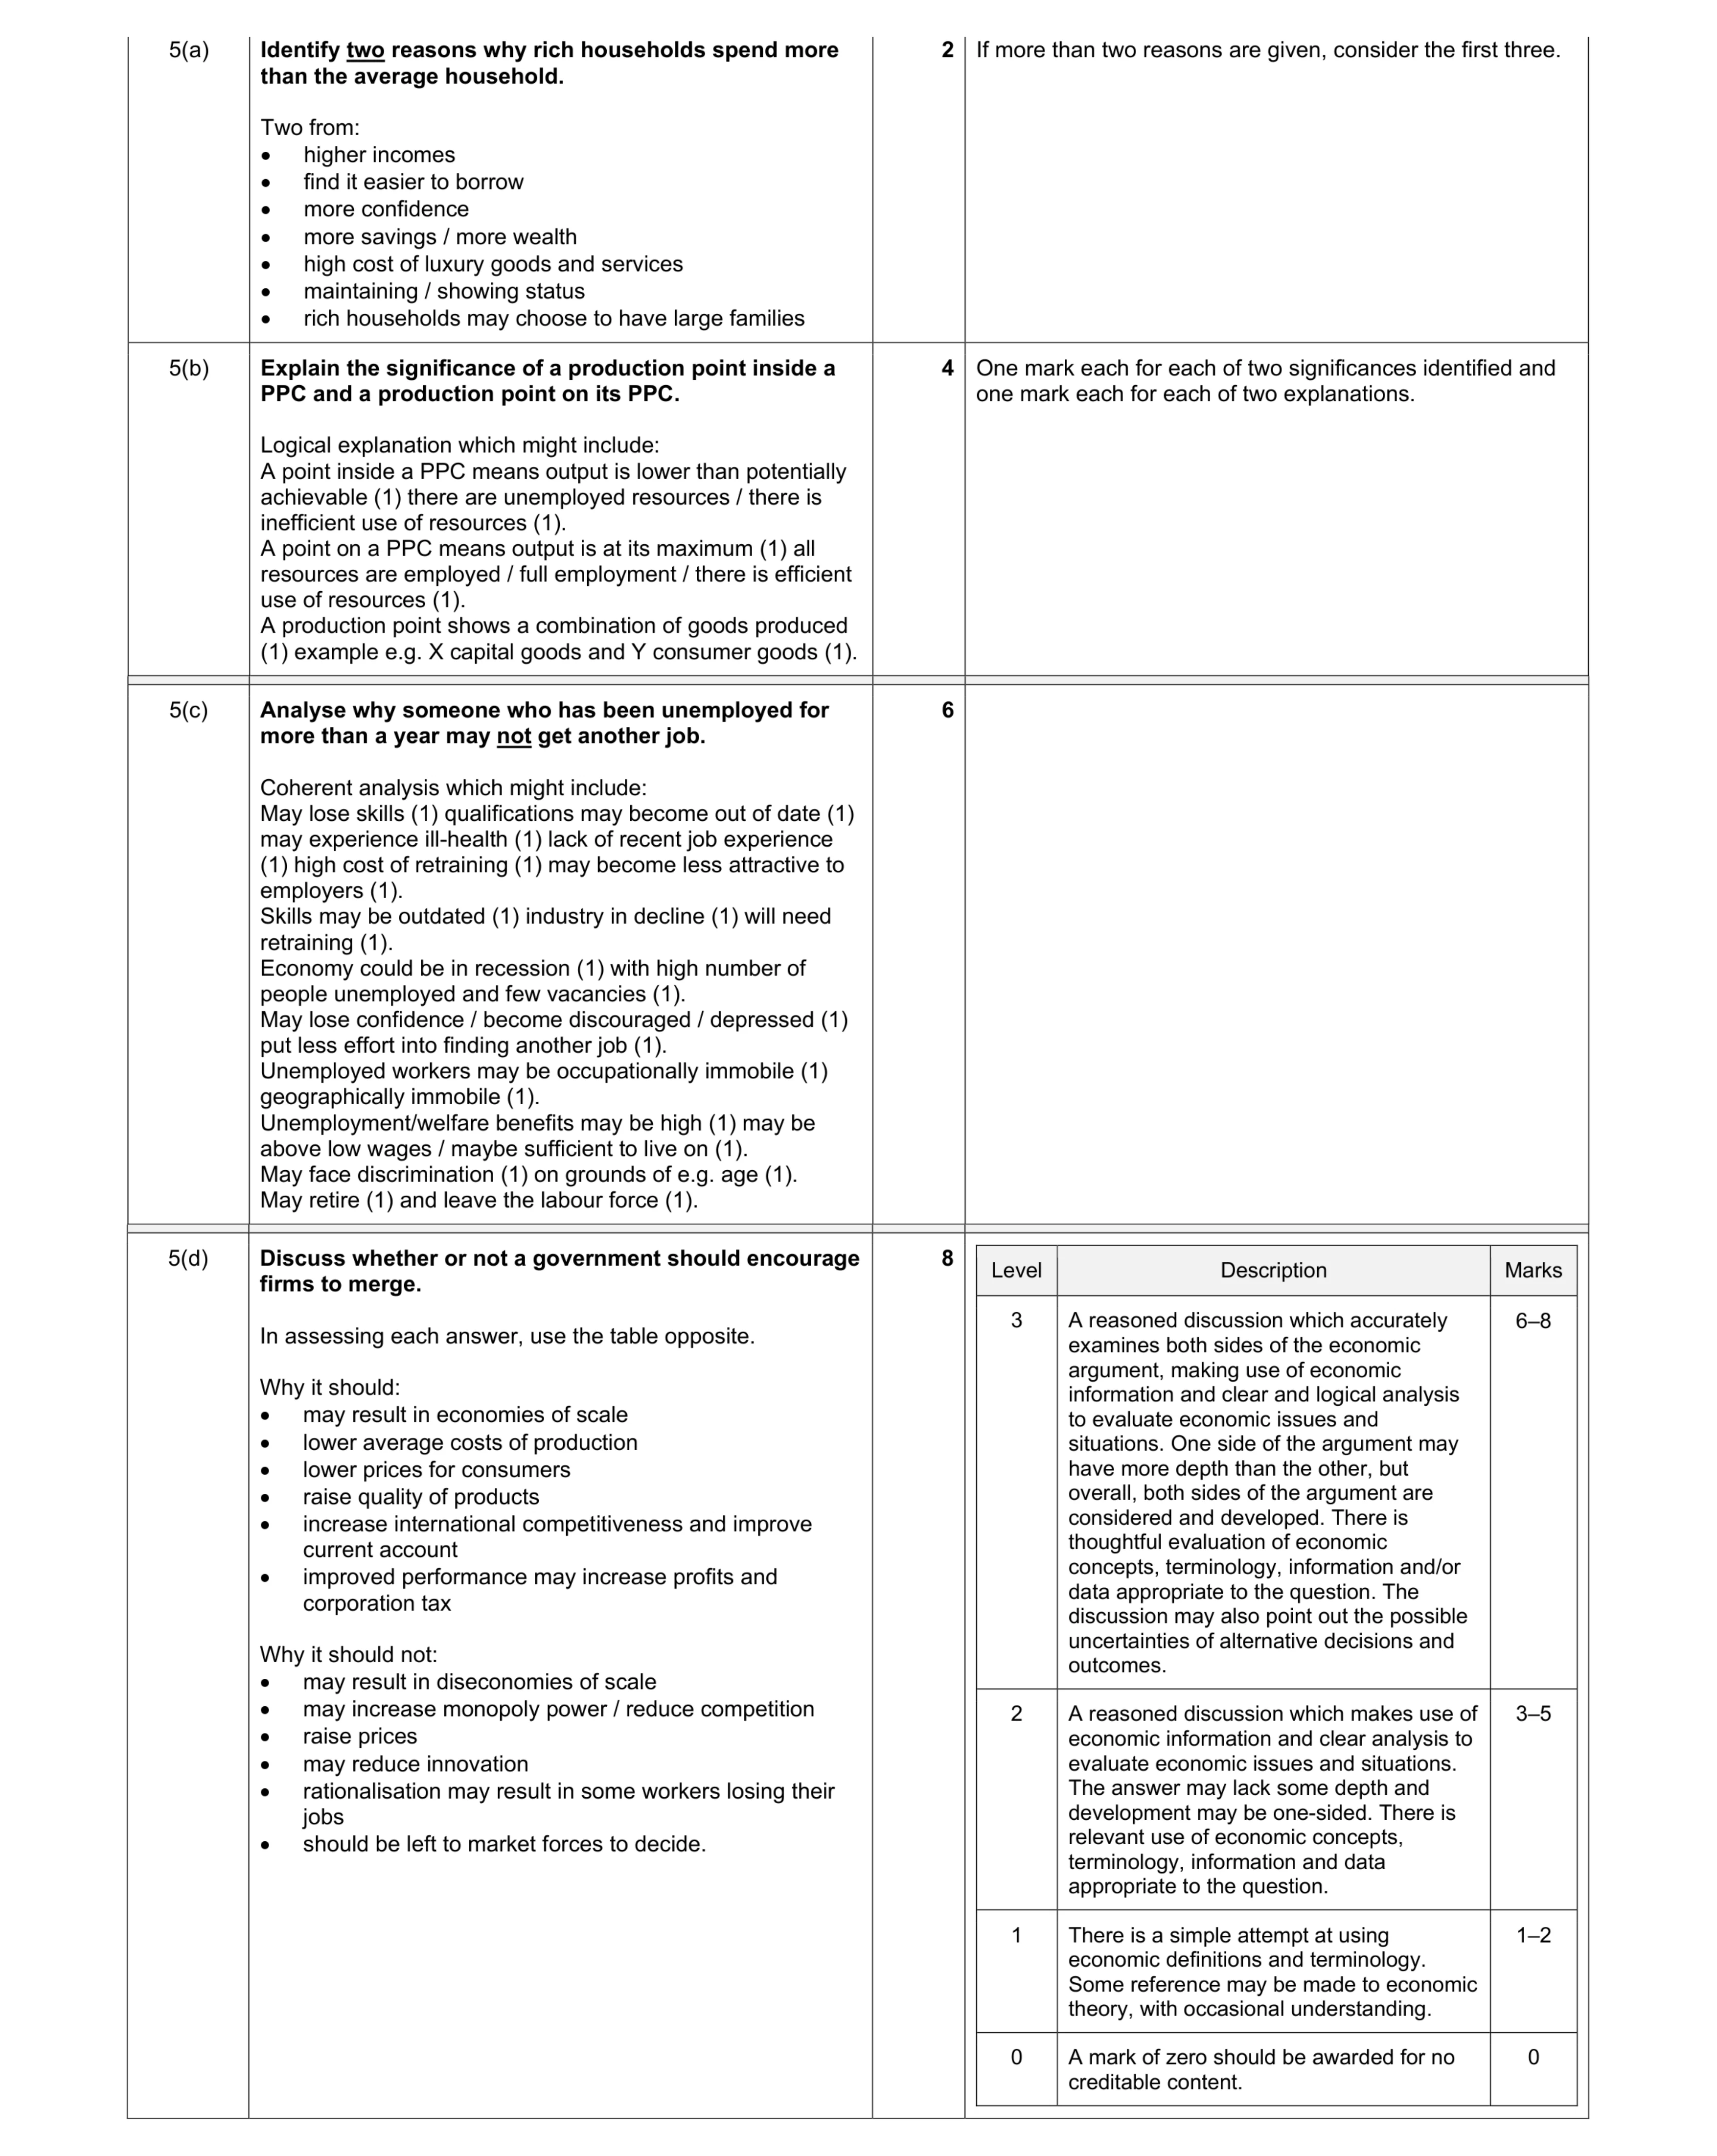 20
20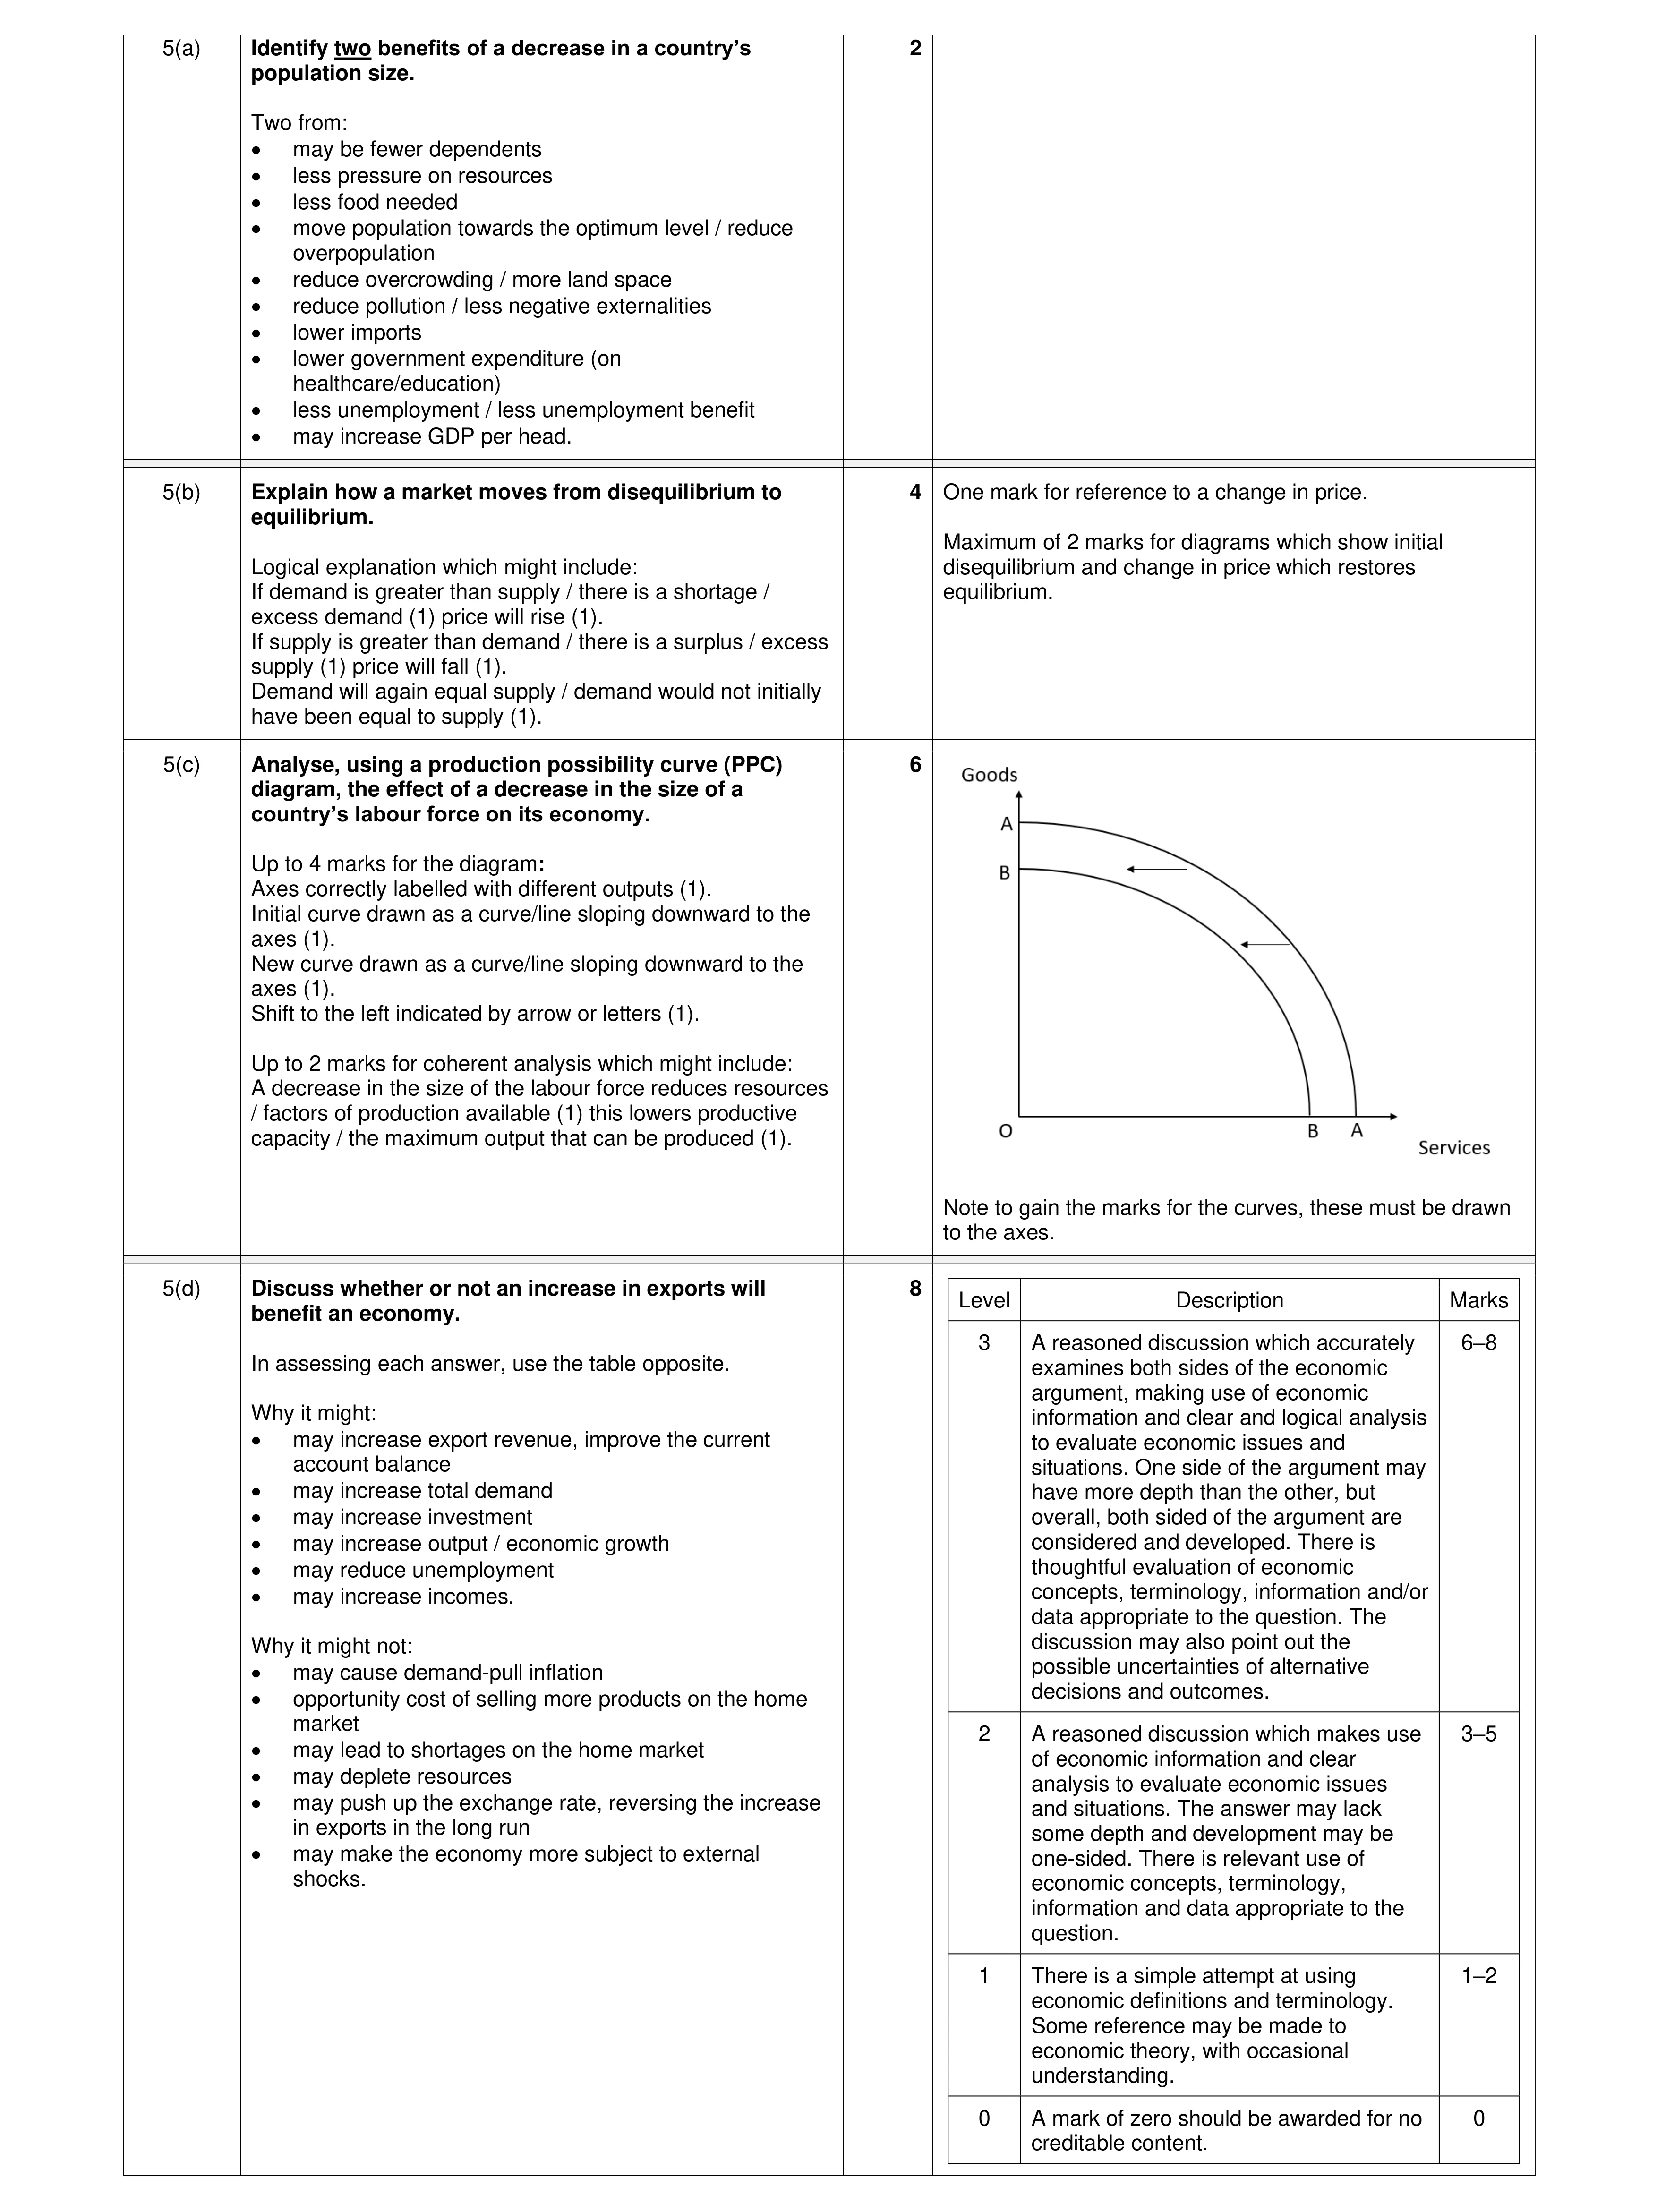 20
20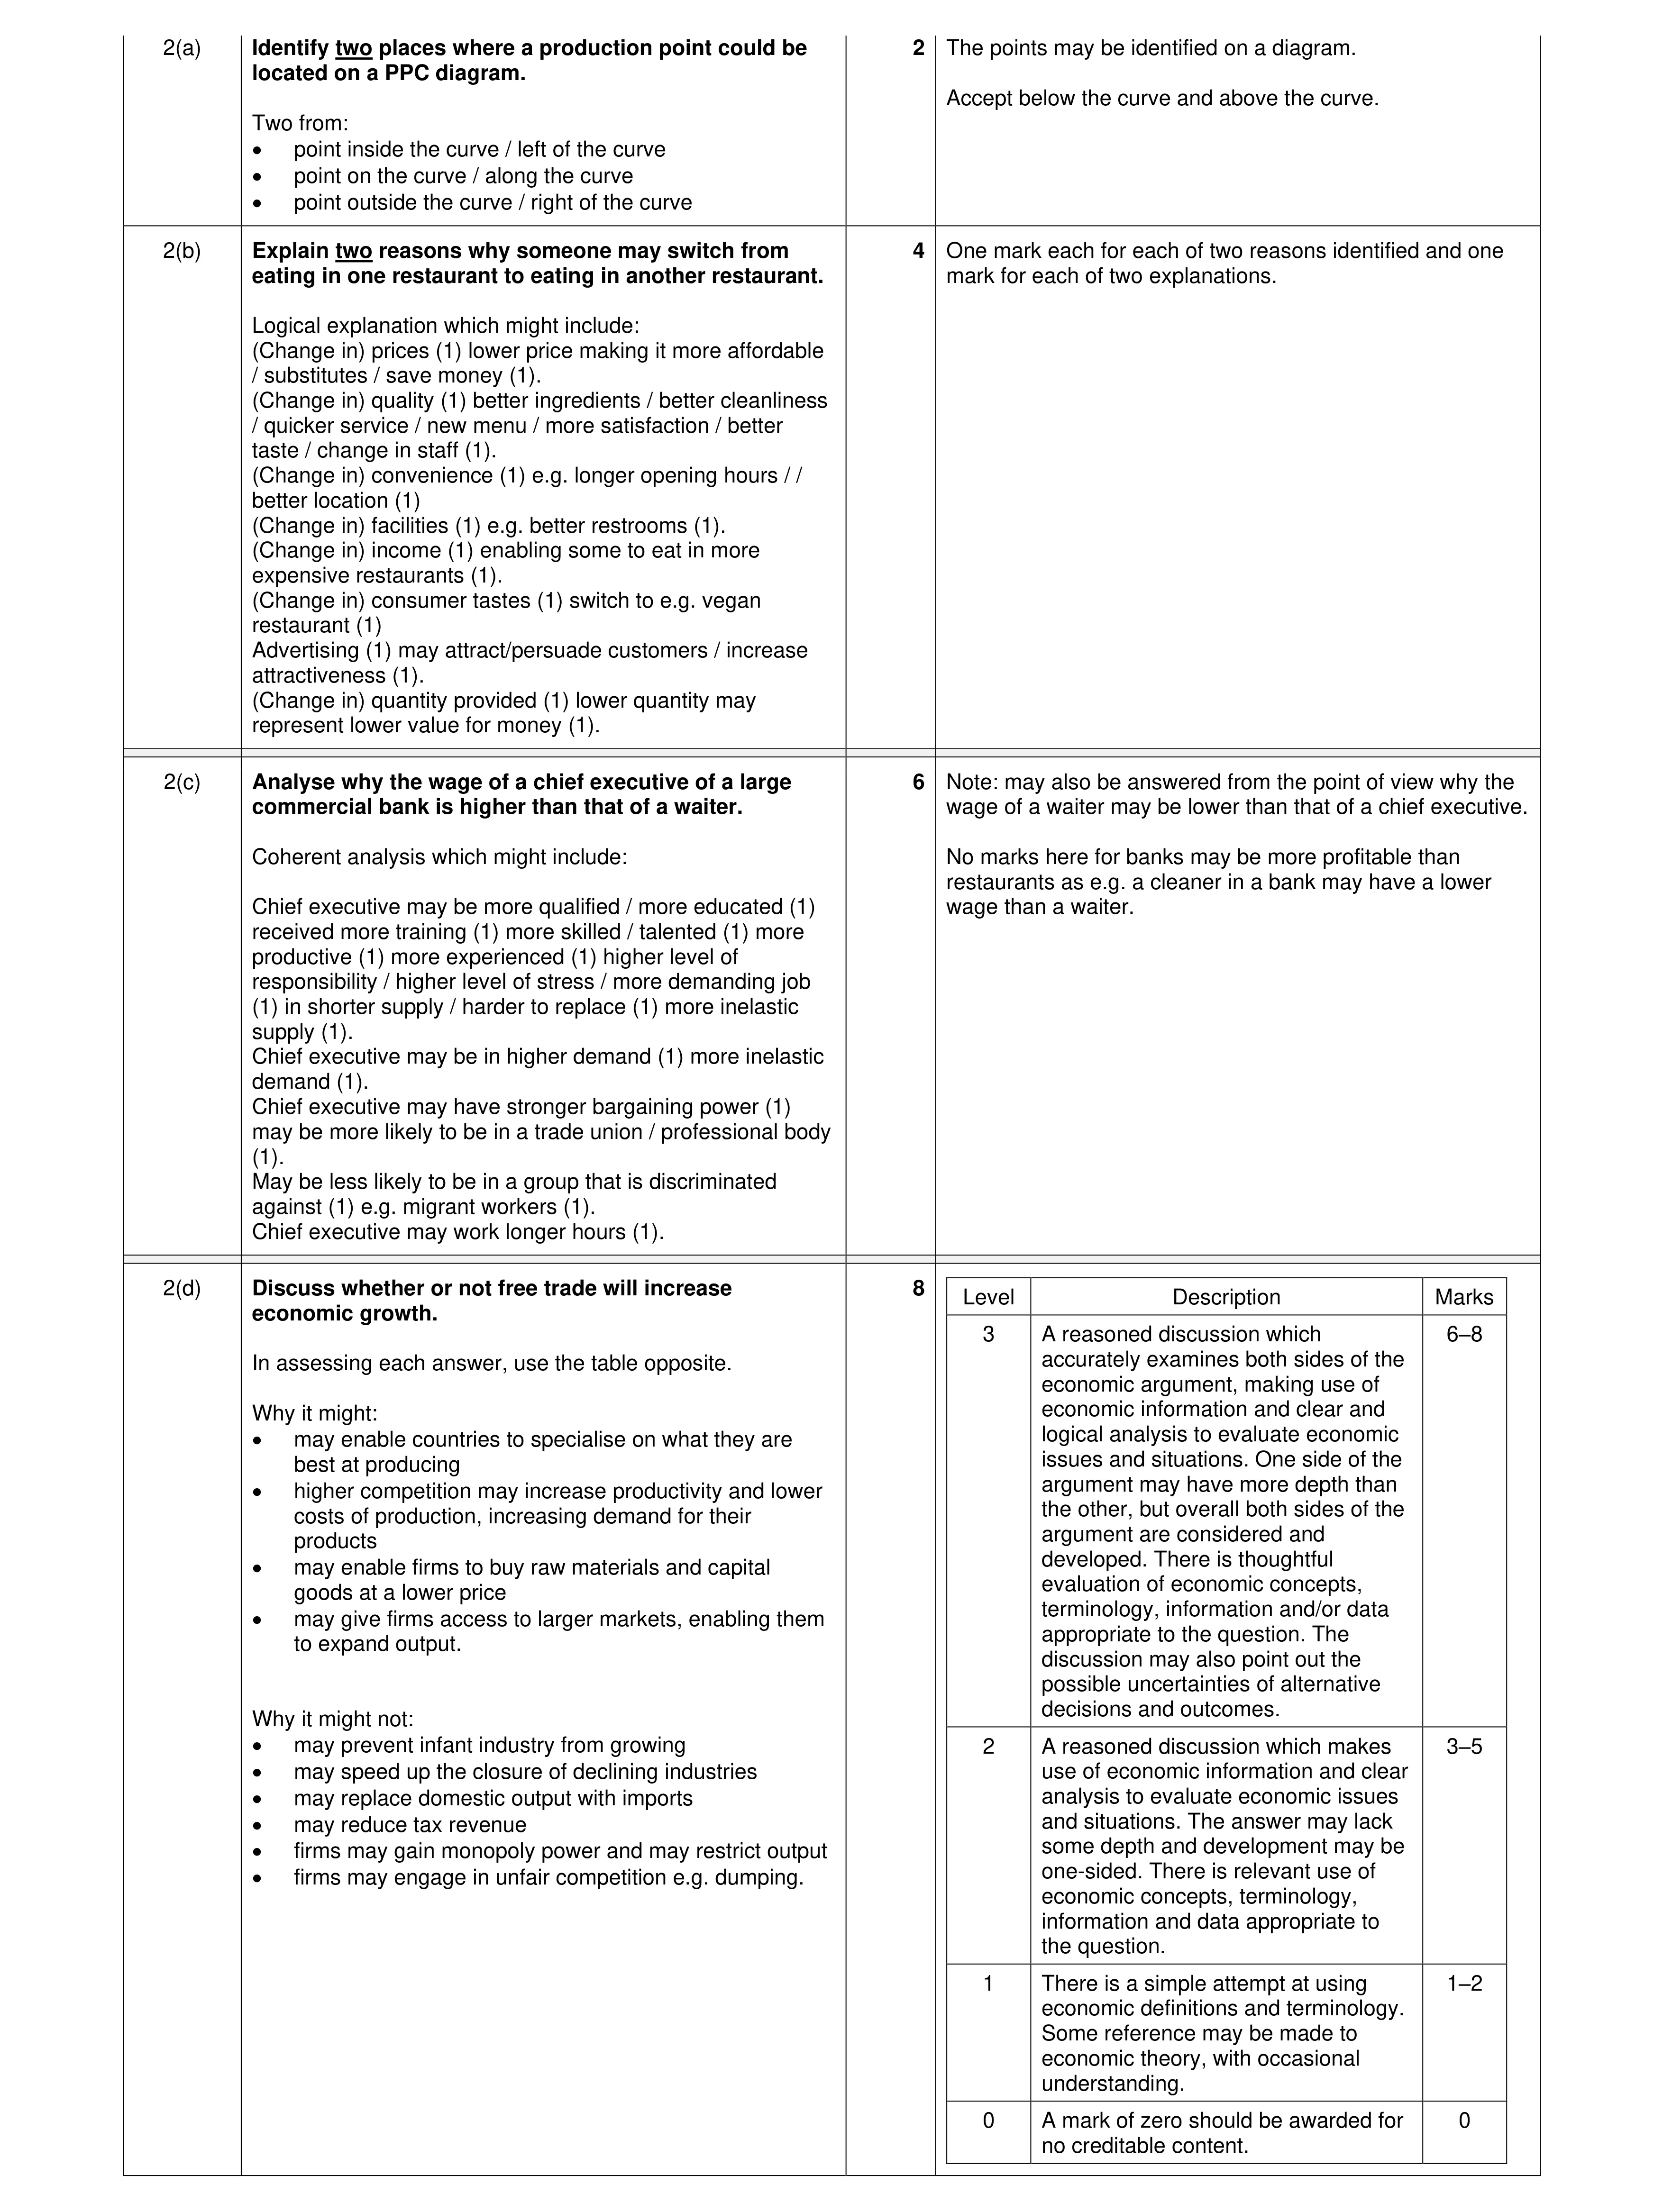 20
20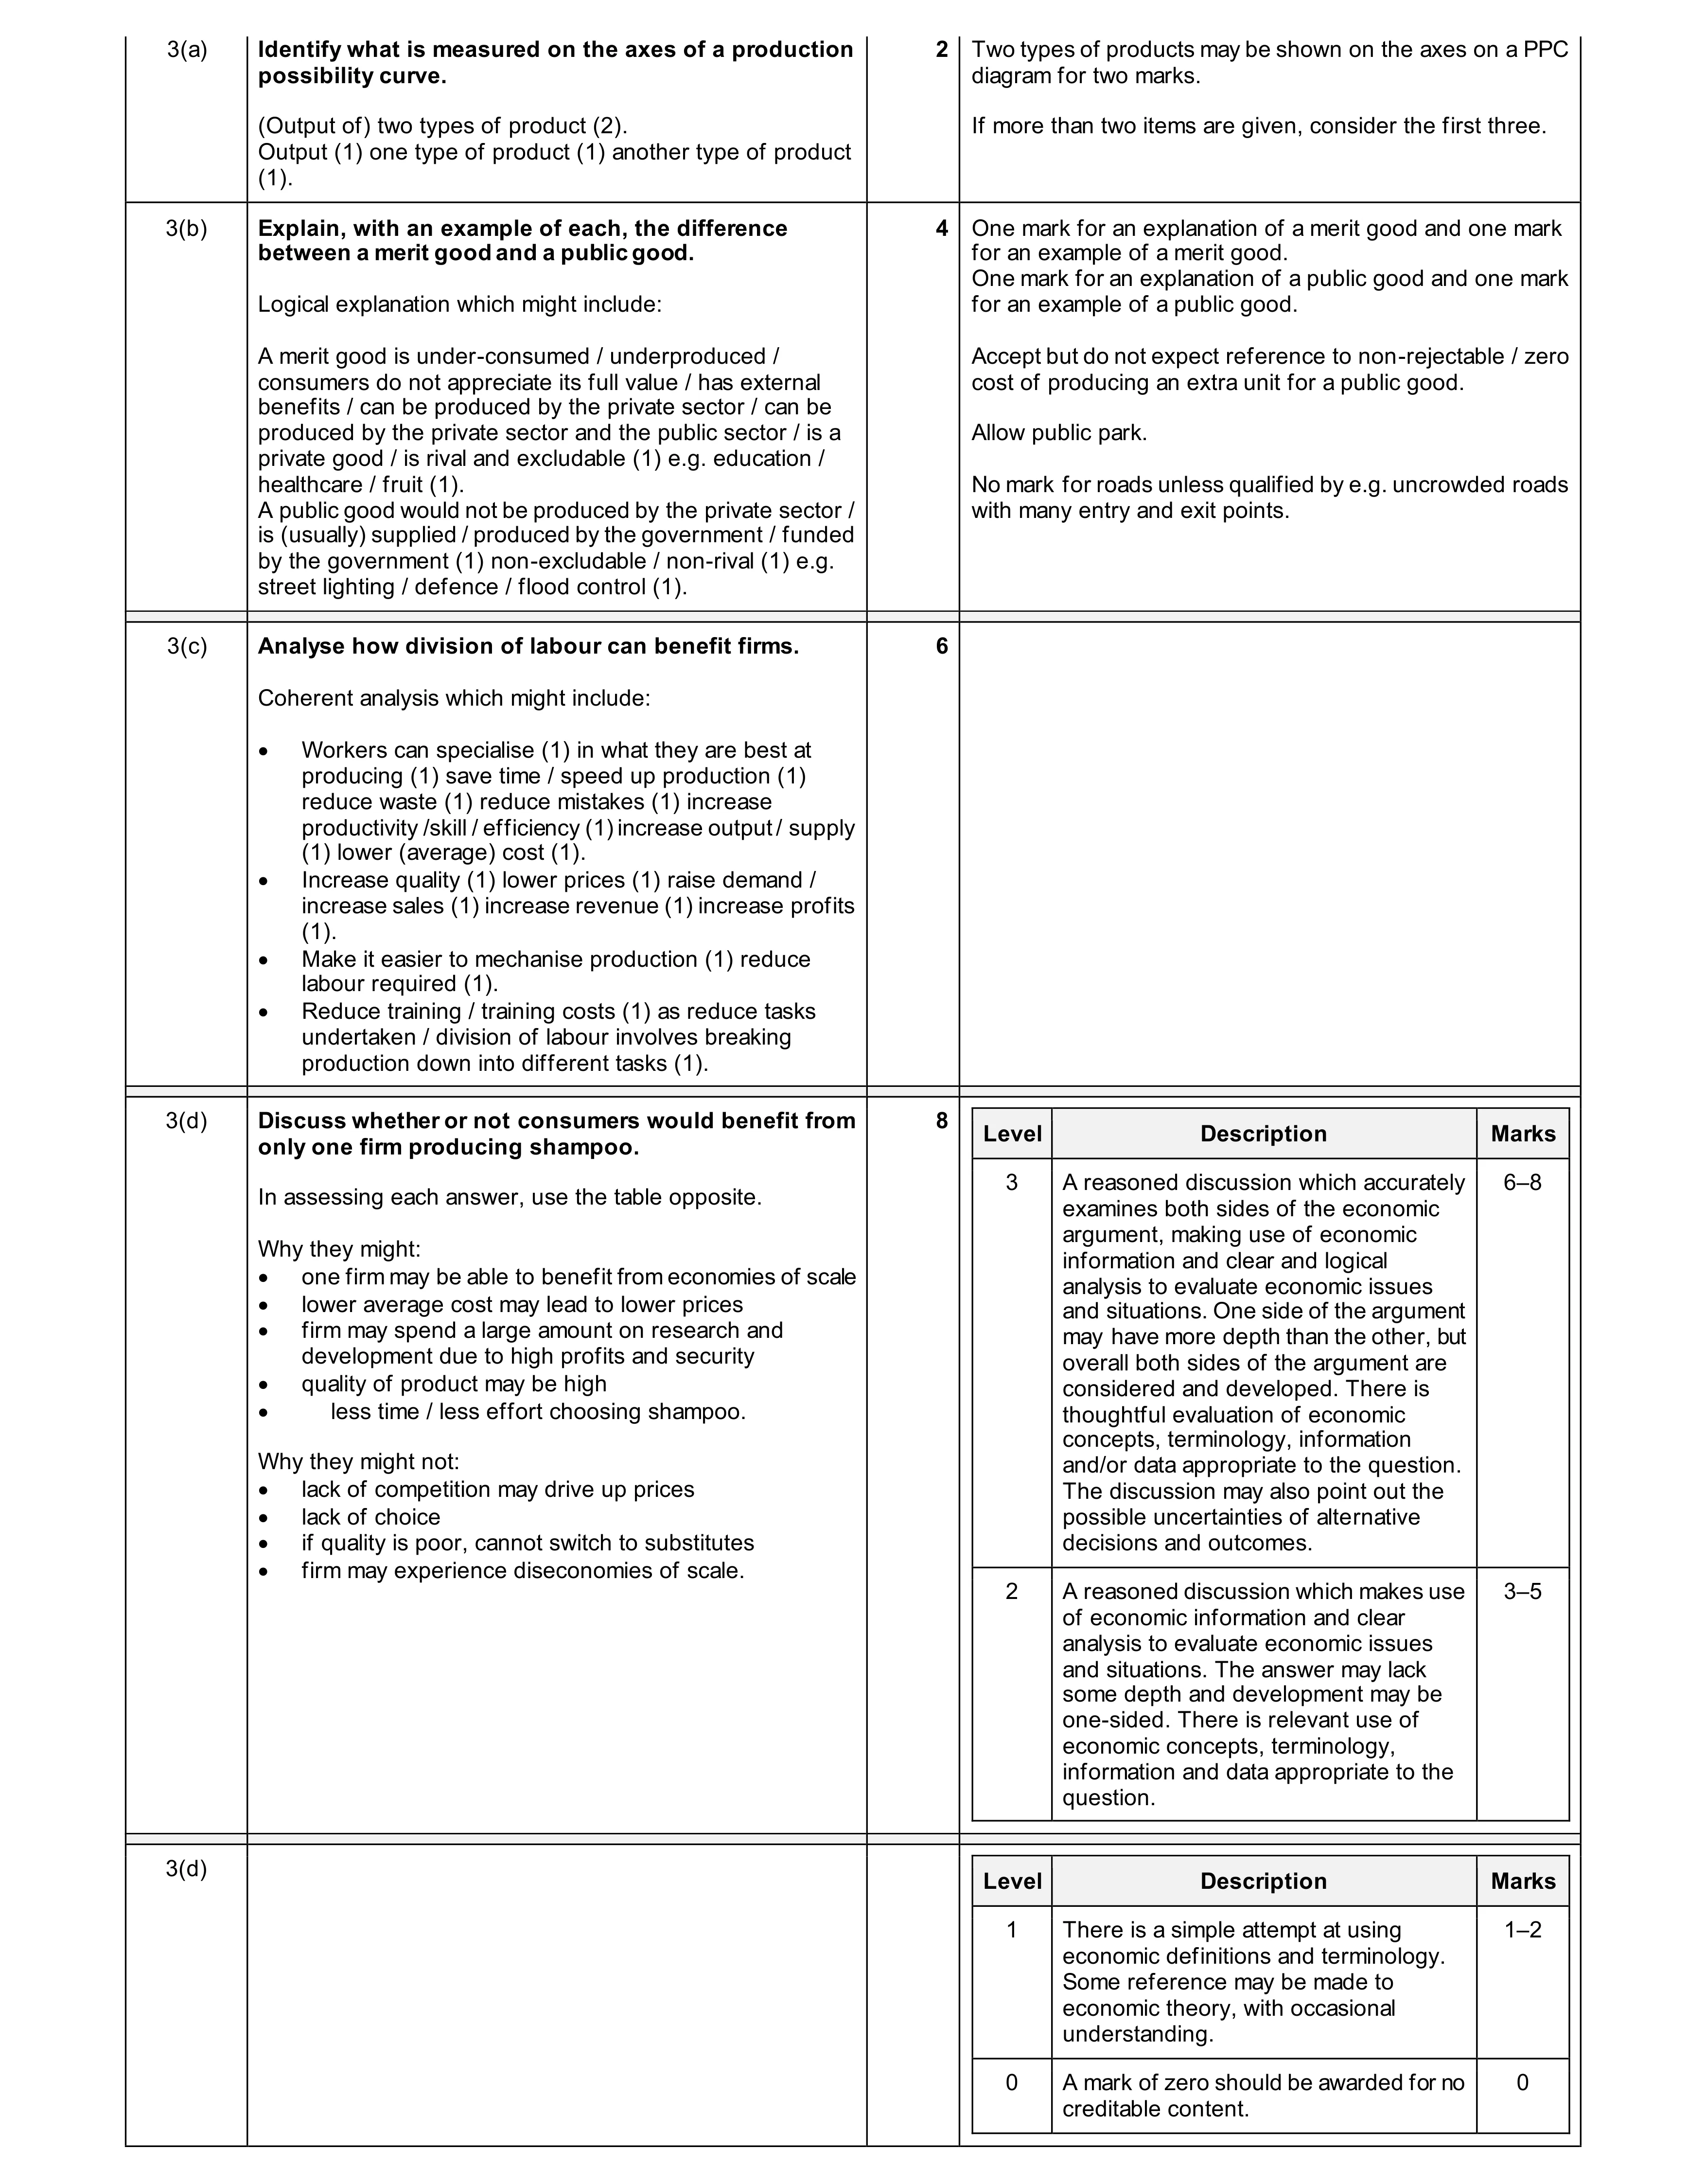 20
20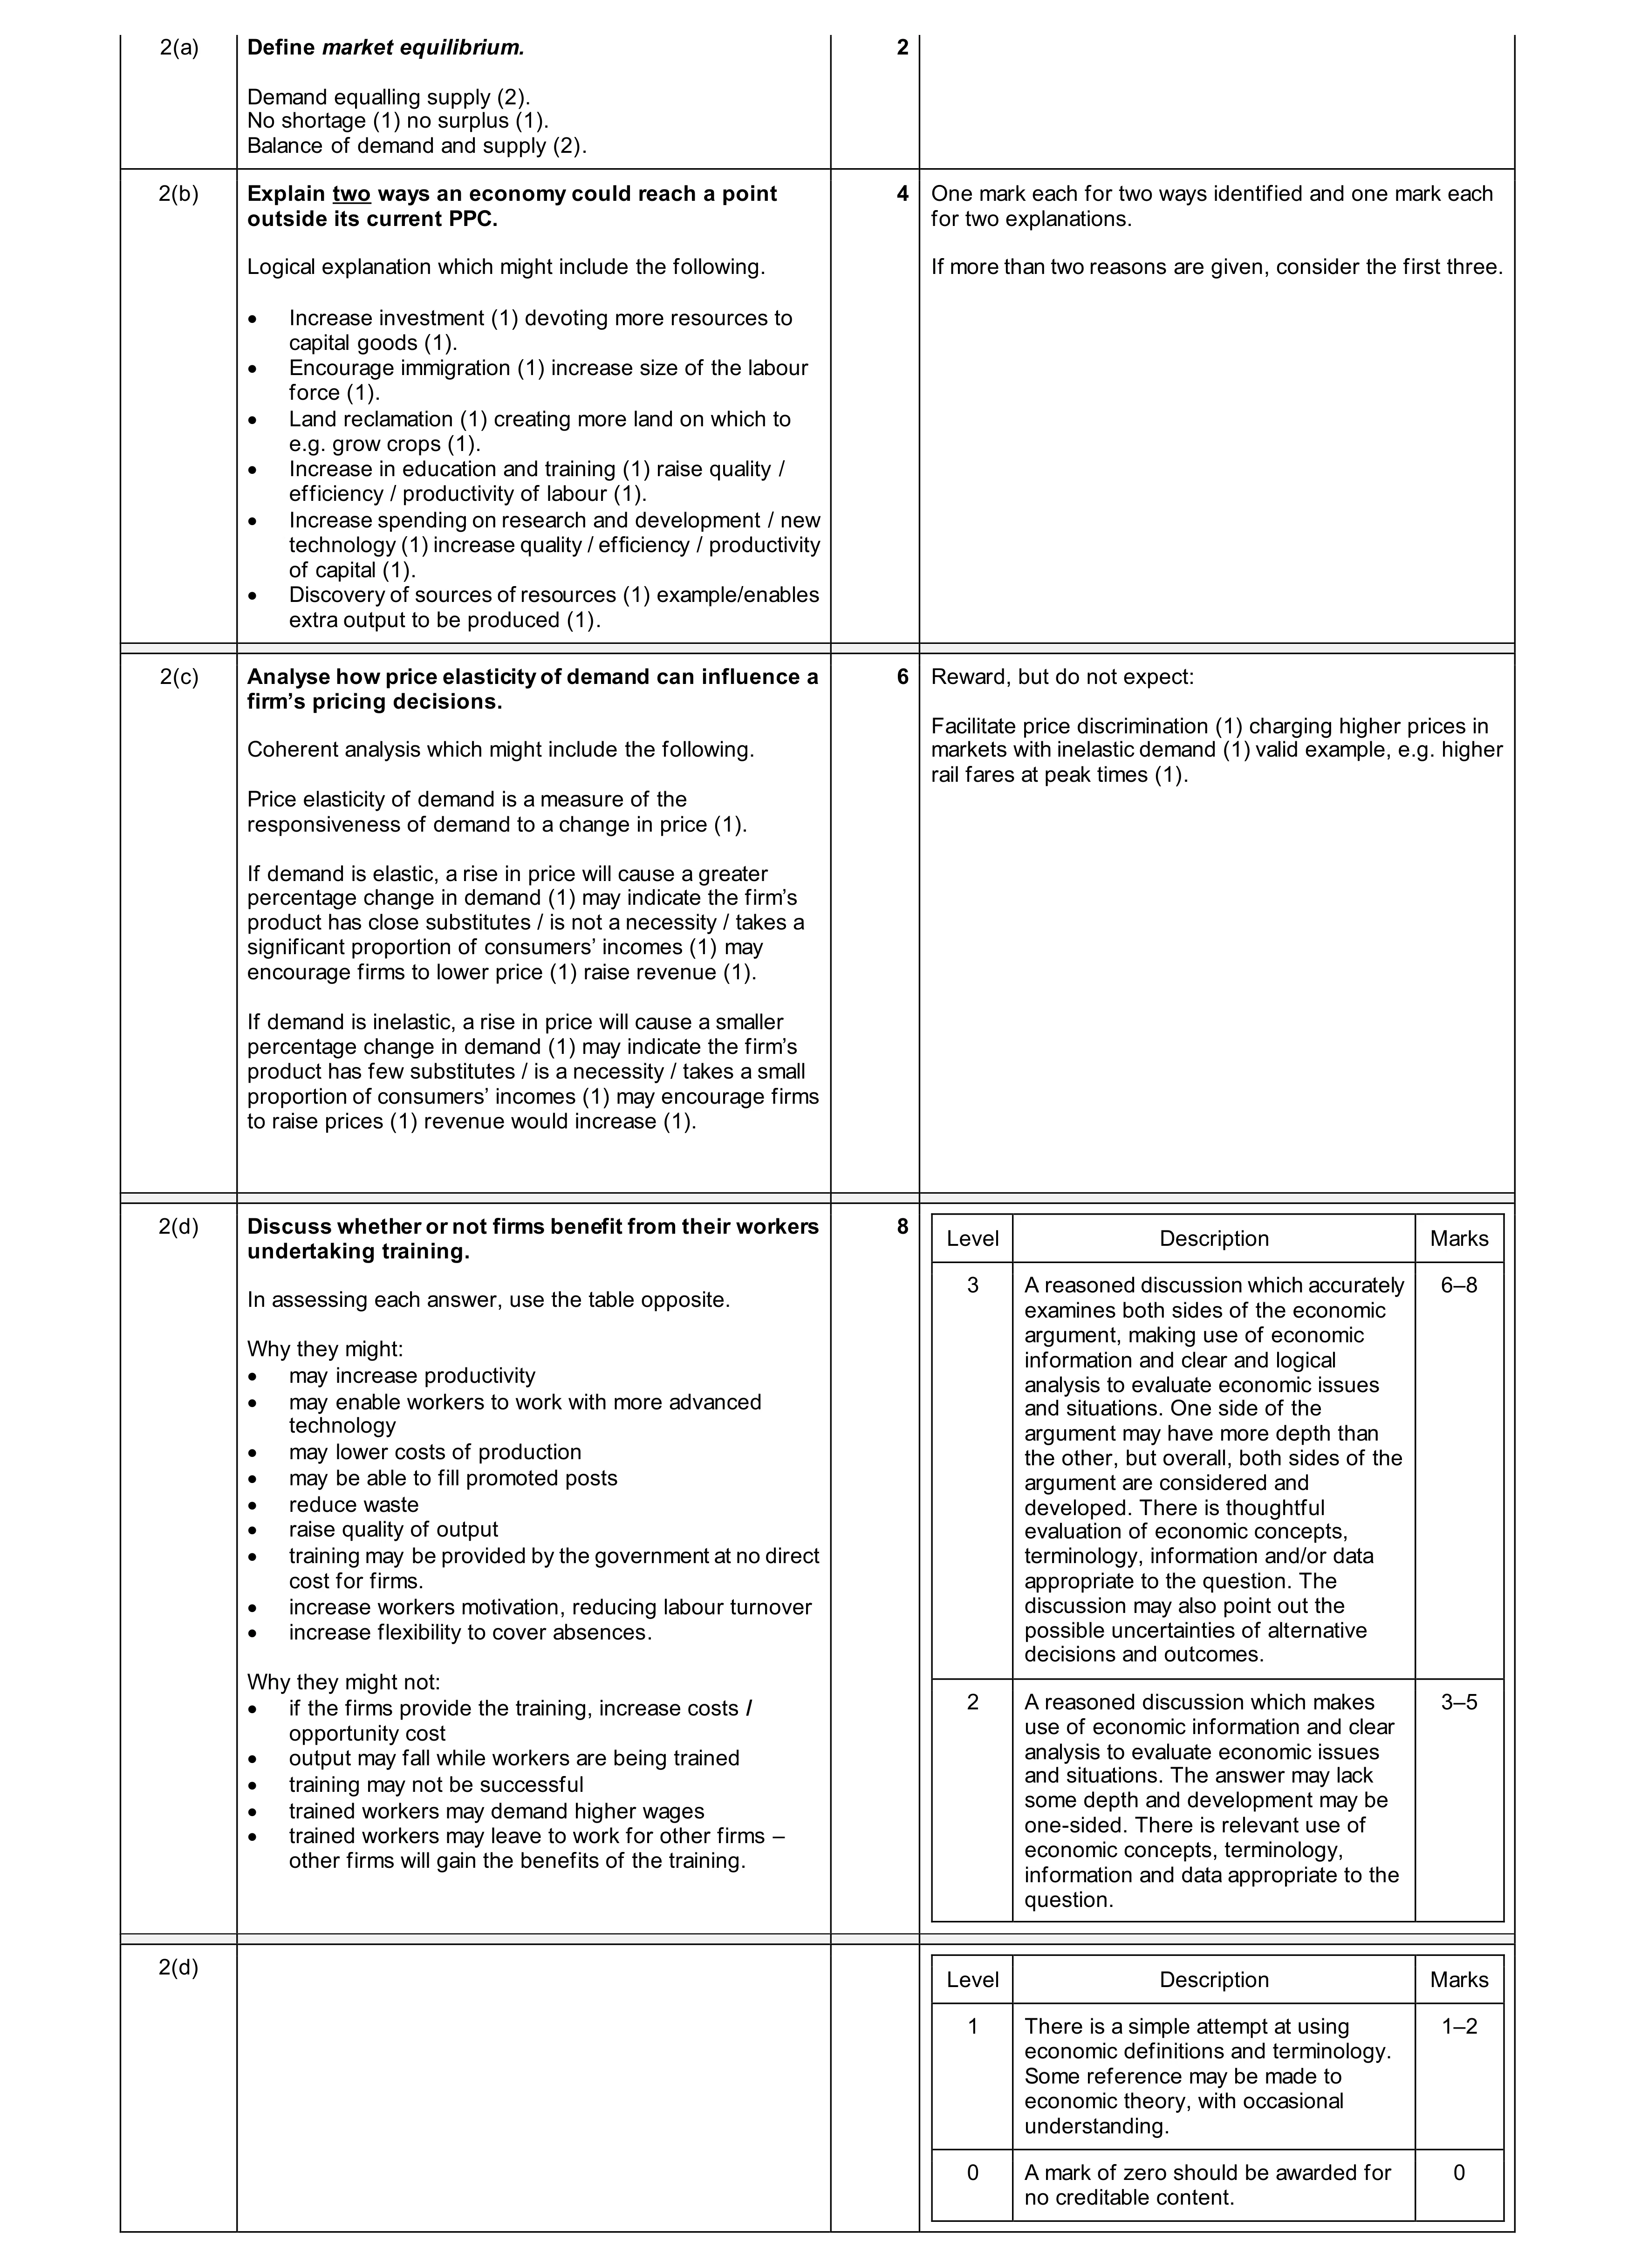 20
20