Questions as text
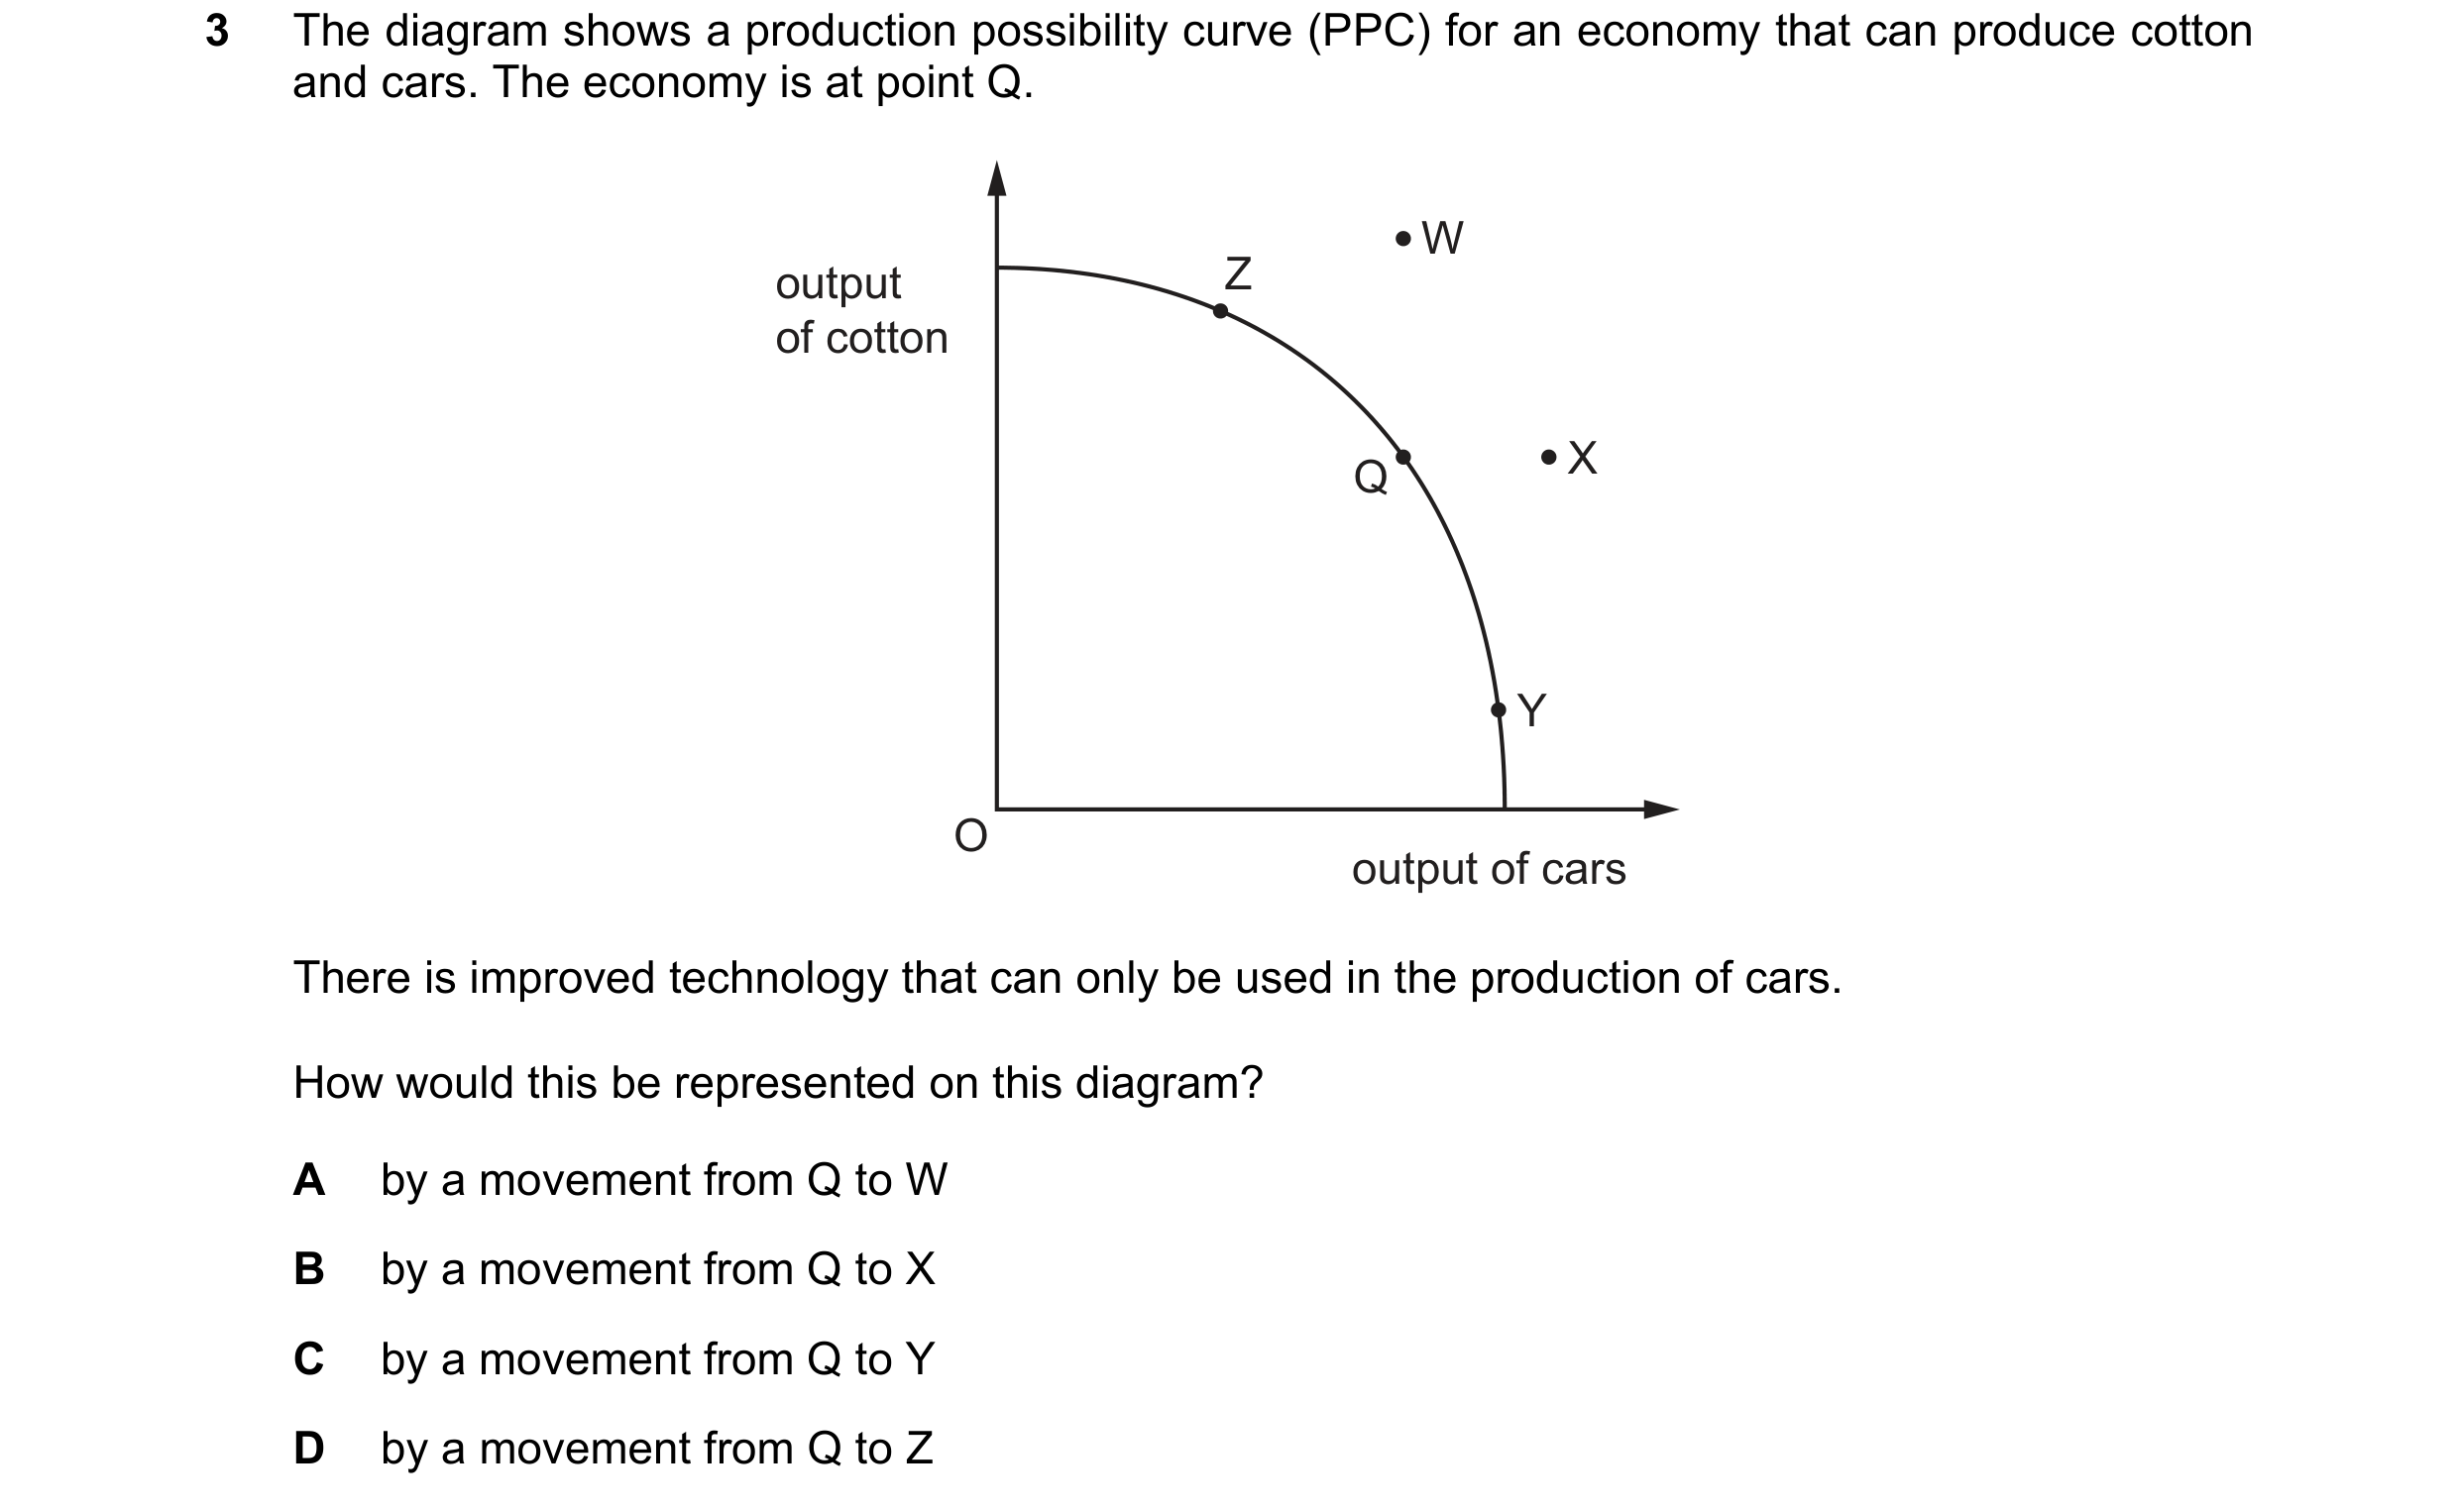
Q1 · The diagram shows a production possibility curve (PPC) for an economy that can produce… 0987/11 May/June 2020
3 The diagram shows a production possibility curve (PPC) for an economy that can produce cotton and cars. The economy is at point Q. W output Z of cotton Q X Y O output of cars There is improved technology that can only be used in the production of cars. How would this be represented on this diagram? A by a movement from Q to W B by a movement from Q to X C by a movement from Q to Y D by a movement from Q to Z
1 marks
Answer: B
This question in 0987/11 May/June 2020
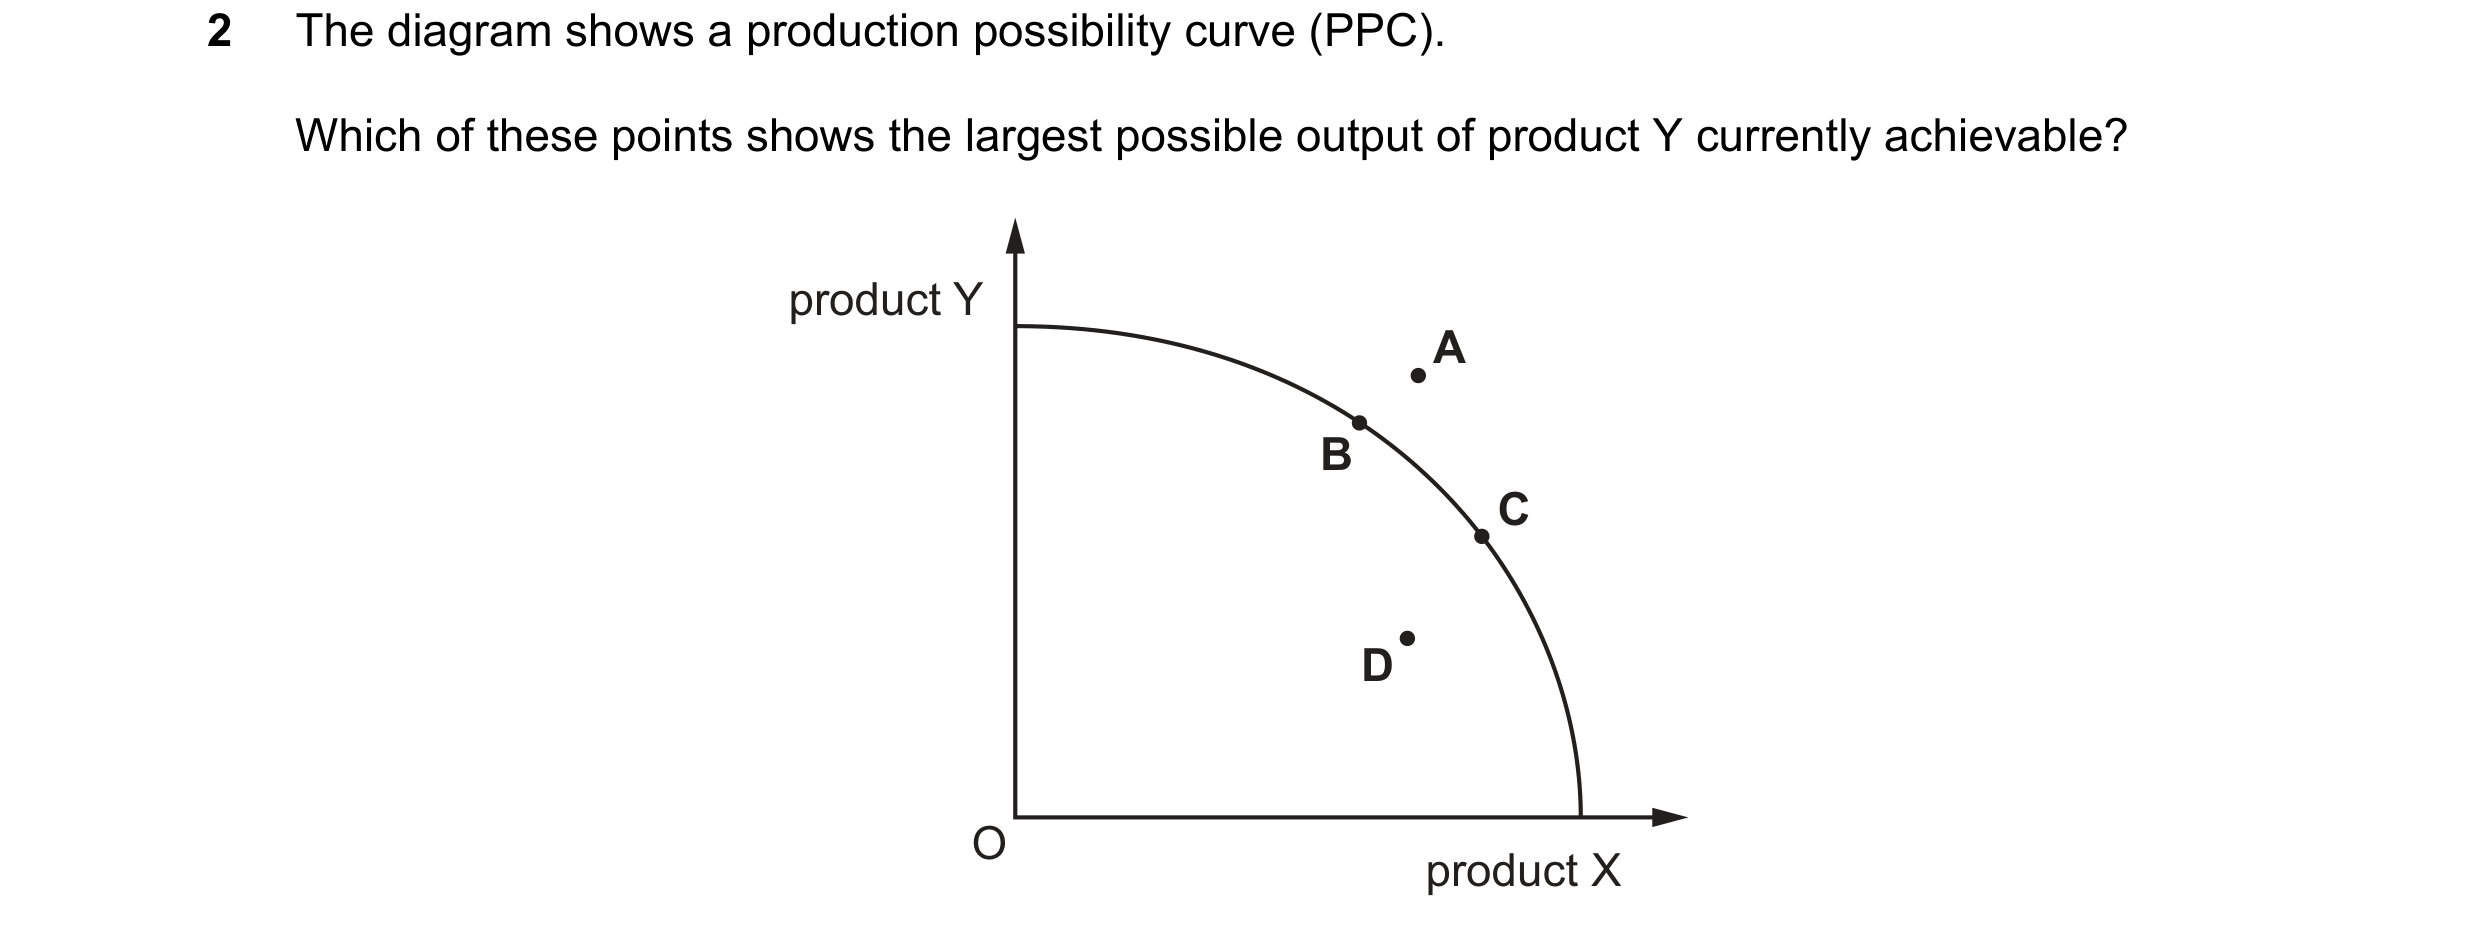
Q2 · The diagram shows a production possibility curve (PPC) 0987/12 May/June 2020
2 The diagram shows a production possibility curve (PPC). Which of these points shows the largest possible output of product Y currently achievable? product Y A B C D O product X
1 marks
Answer: B
This question in 0987/12 May/June 2020
Q3 · The diagram shows a production possibility curve (PPC) for a country 0987/12 Oct/Nov 2020
3 The diagram shows a production possibility curve (PPC) for a country. The country moved from position X to position Y on the PPC. capital goods X Y O consumer goods What is the most likely reason for this change? A Firms have decided to increase investment in technology. B New economic resources have been discovered in the country. C The government has brought about an increase in living standards. D The government has encouraged long-term economic growth.
1 marks
Answer: C
This question in 0987/12 Oct/Nov 2020
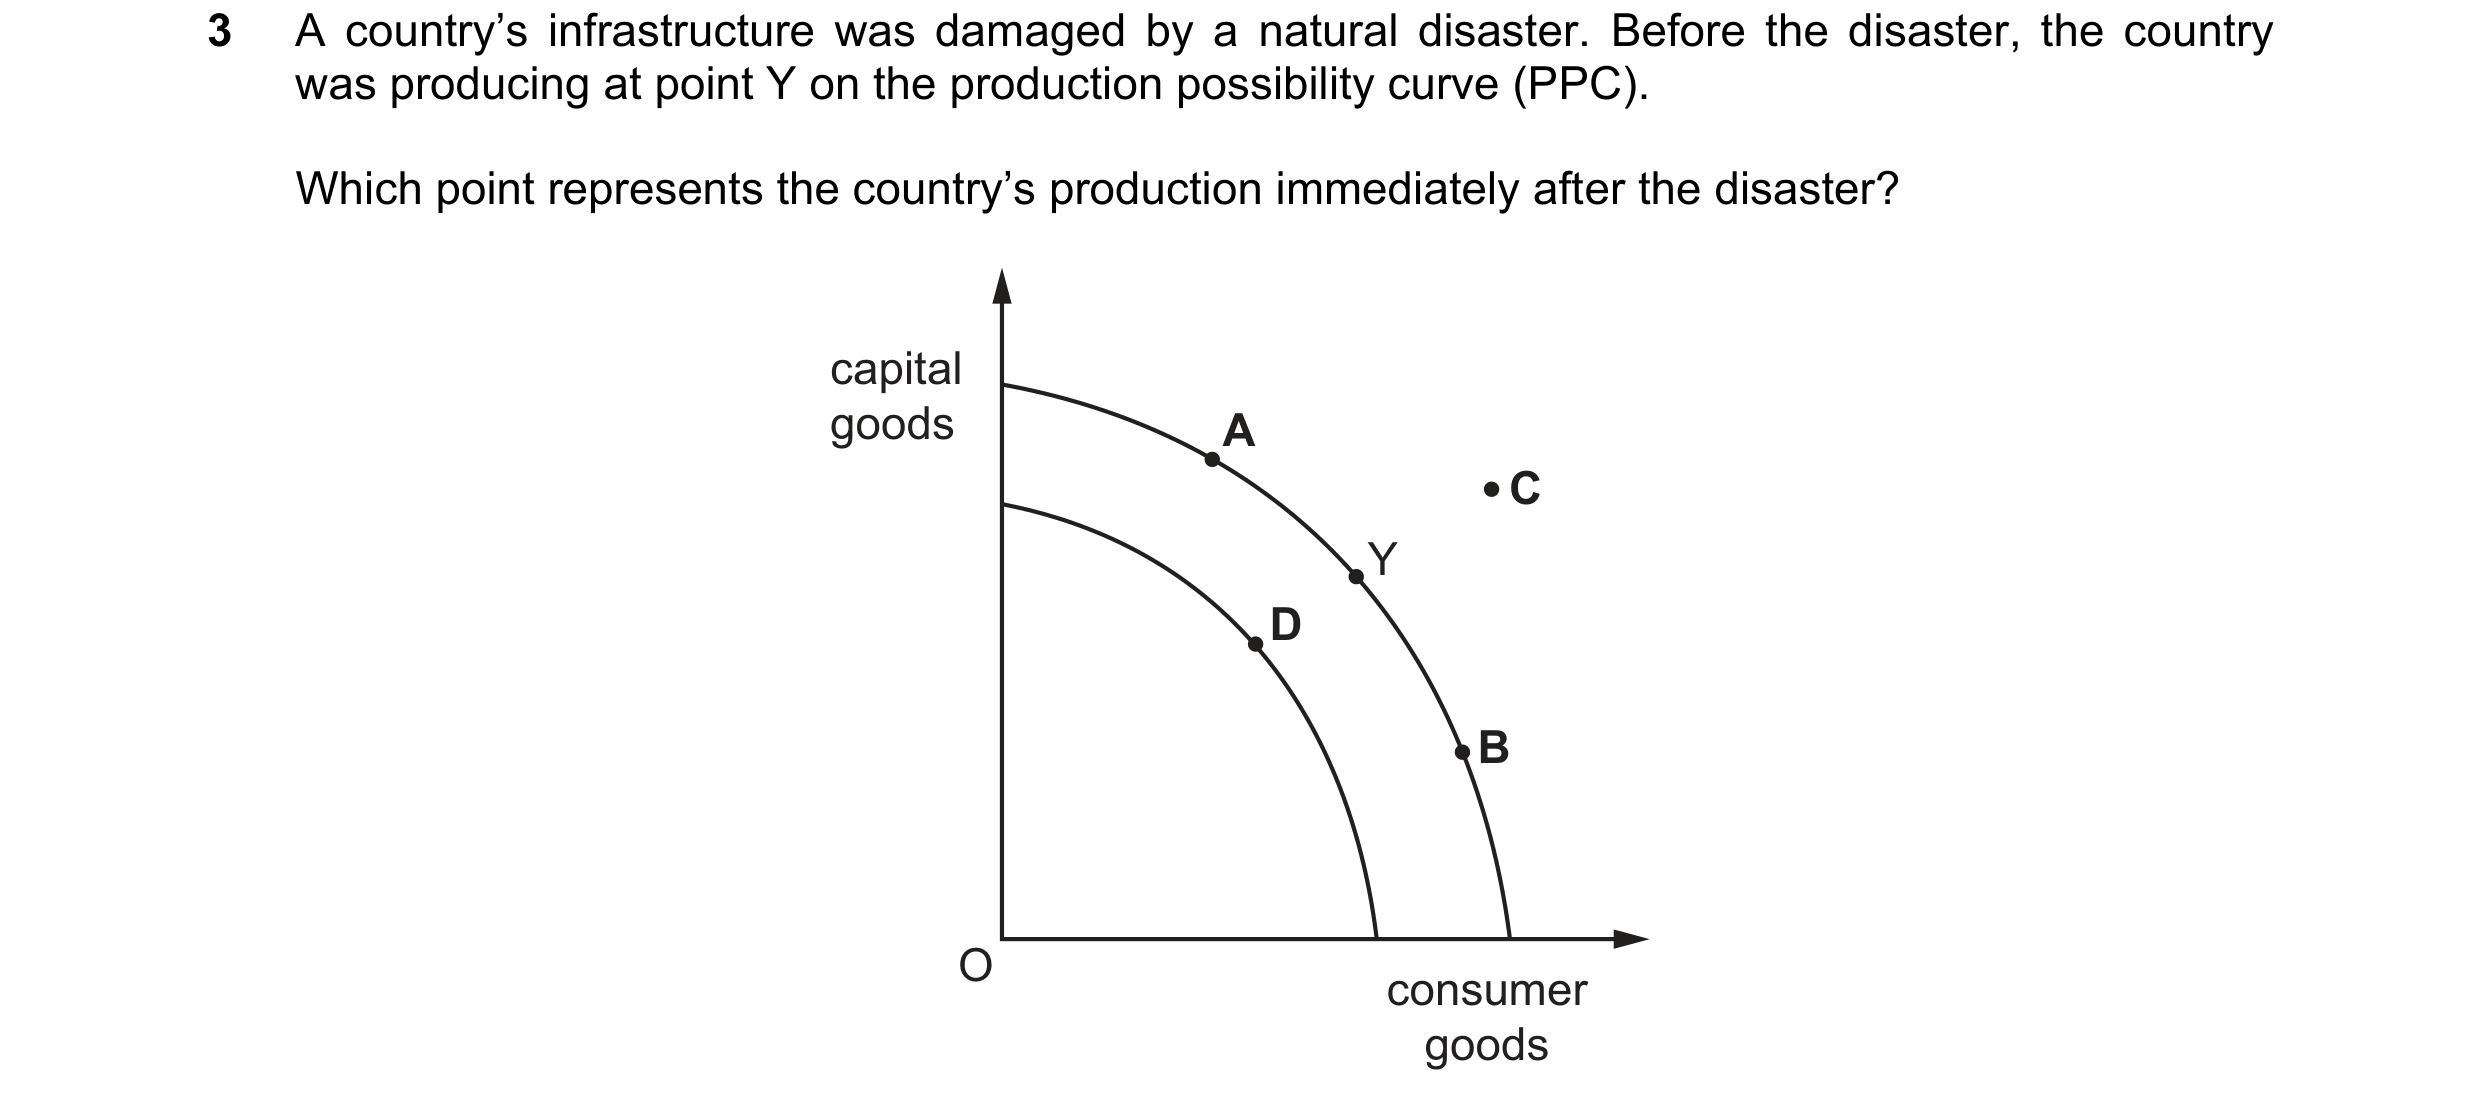
Q4 · A country’s infrastructure was damaged by a natural disaster 0987/11 May/June 2021
3 A country’s infrastructure was damaged by a natural disaster. Before the disaster, the country was producing at point Y on the production possibility curve (PPC). Which point represents the country’s production immediately after the disaster? capital goods A C Y D B O consumer goods
1 marks
Answer: D
This question in 0987/11 May/June 2021
Q5 · An economy experiences a recession and moves from full employment to 5% unemployment 0987/11 May/June 2022
21 An economy experiences a recession and moves from full employment to 5% unemployment. Which movement from X to Y on the PPC diagram shows the consequence for the economy? A B capital capital goods goods X X Y Y O consumer goods O consumer goods C D capital capital goods goods X Y Y X O consumer goods O consumer goods
1 marks
Answer: A
This question in 0987/11 May/June 2022
Q6 · What is the purpose of an economy’s production possibility curve (PPC)? 0987/11 May/June 2022
24 What is the purpose of an economy’s production possibility curve (PPC)? A It answers the question of what to produce in an economy. B It enables microeconomic decisions to be taken by firms. C It measures the supply of goods and services available in an economy. D It shows the productive capacity in an economy at a point in time.
1 marks
Answer: D
This question in 0987/11 May/June 2022
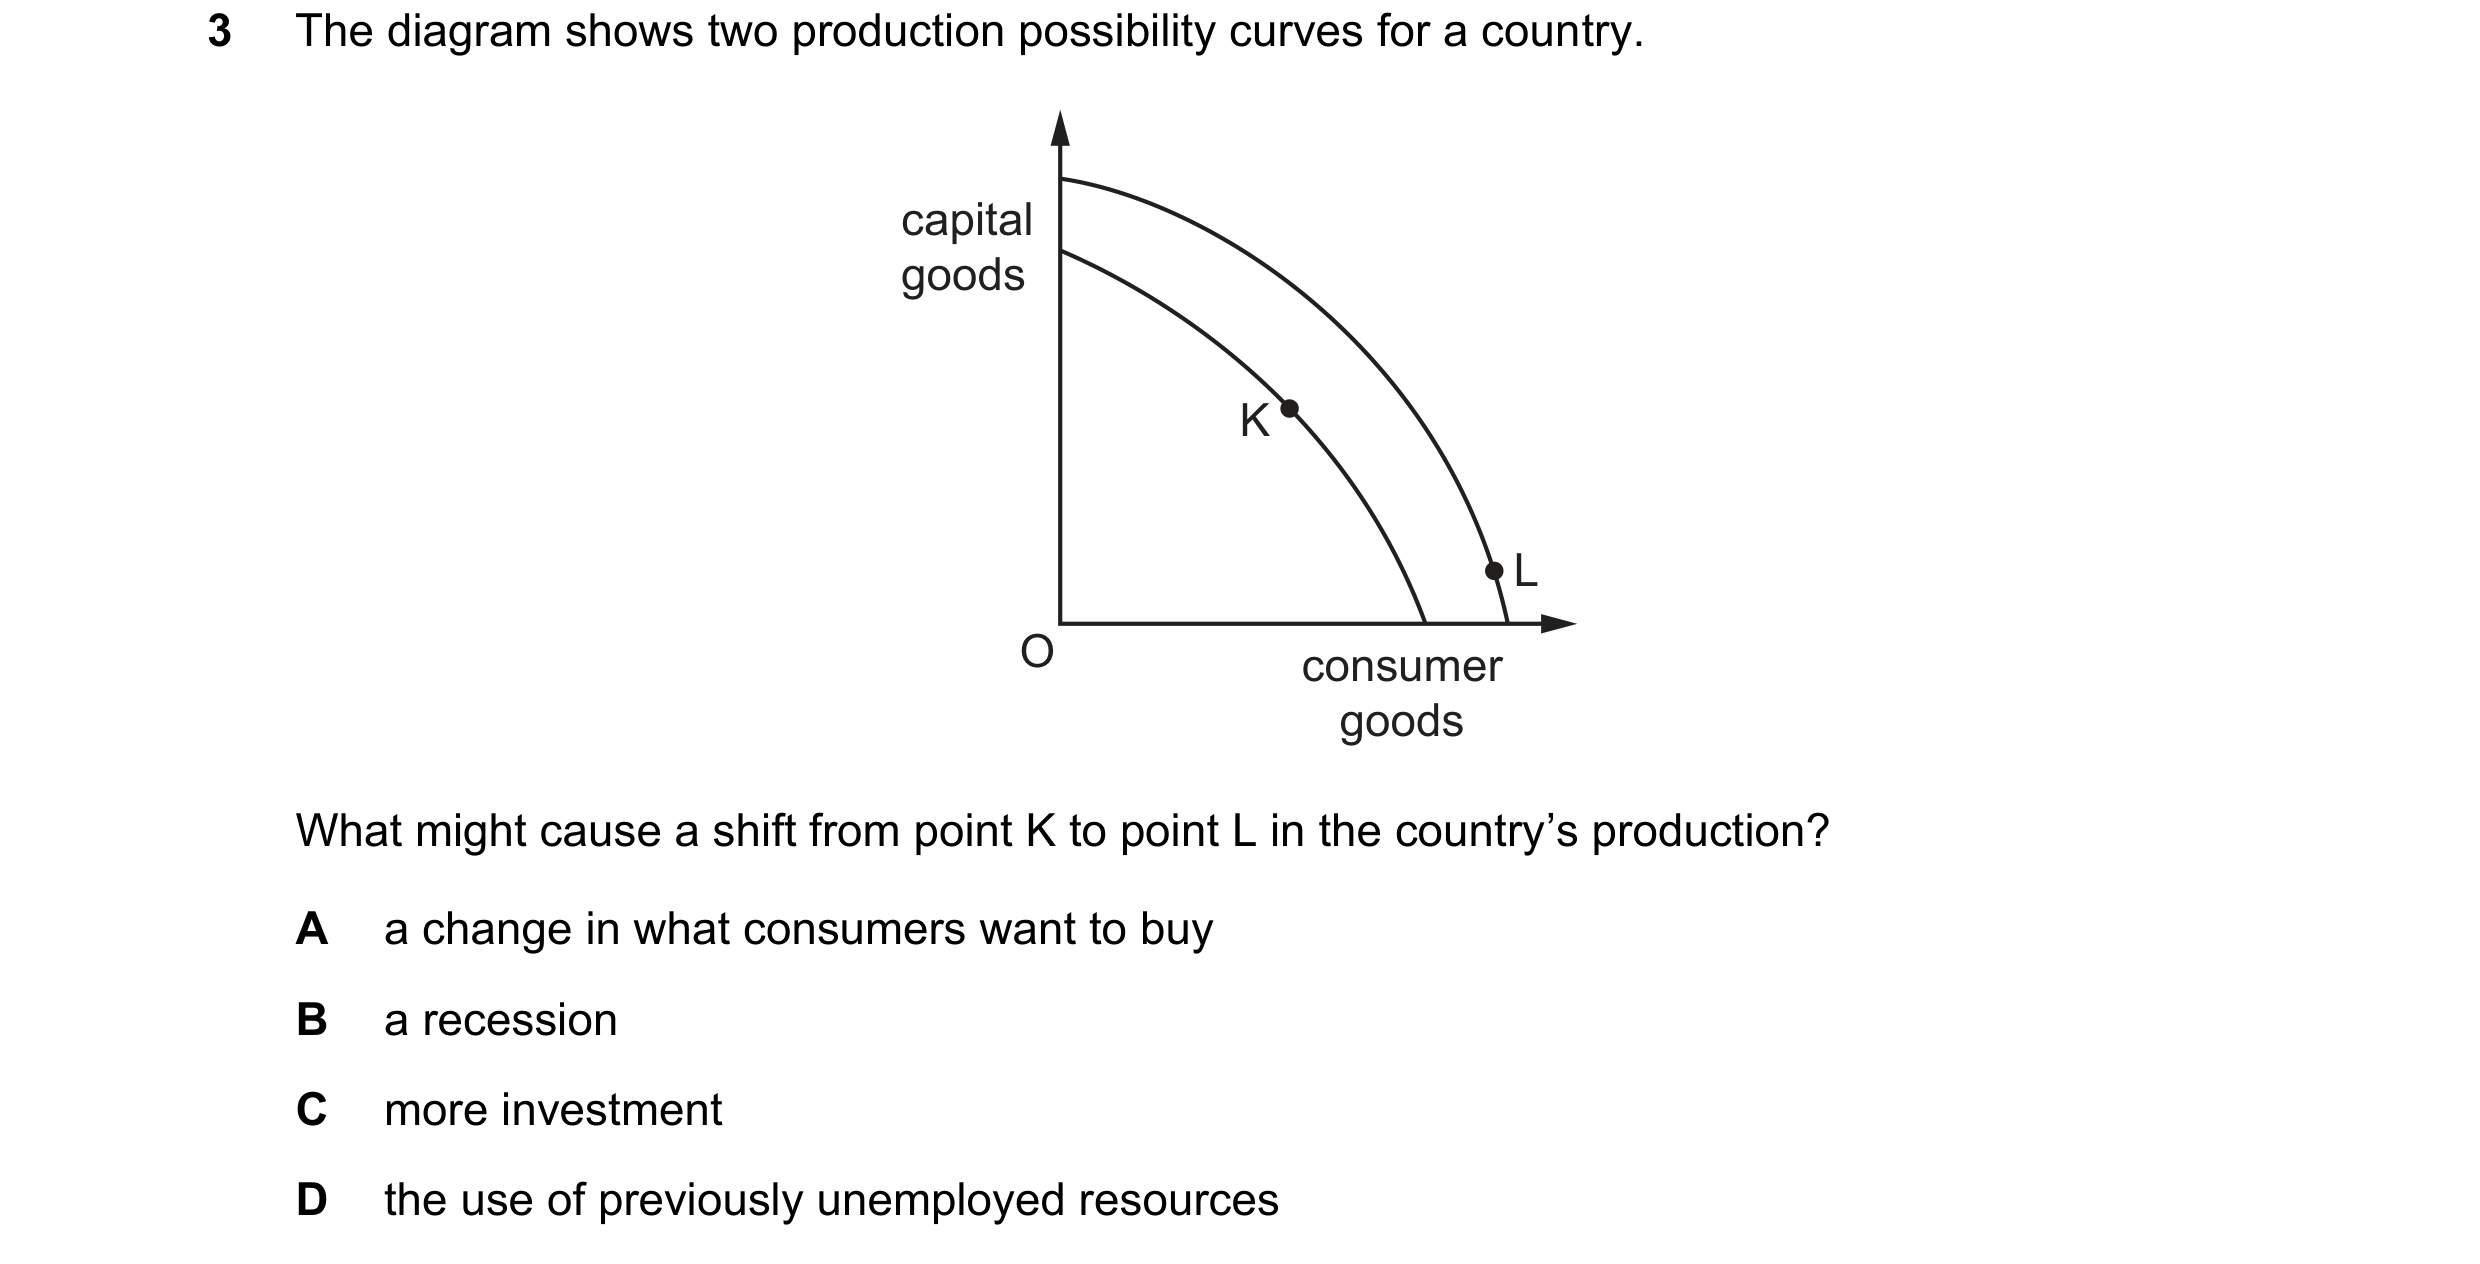
Q7 · The diagram shows two production possibility curves for a country 0987/12 May/June 2022
3 The diagram shows two production possibility curves for a country. capital goods K L O consumer goods What might cause a shift from point K to point L in the country’s production? A a change in what consumers want to buy B a recession C more investment D the use of previously unemployed resources
1 marks
Answer: C
This question in 0987/12 May/June 2022
Q8 · The diagram shows a production possibility curve (PPC) and a number of output… 0987/12 Oct/Nov 2022
3 The diagram shows a production possibility curve (PPC) and a number of output combinations for tea and coffee. output of tea W (tonnes) U X V Y Z O output of coffee (tonnes) Which combinations of tea and coffee could the economy currently produce? A U, V, W, X B U, V, X, Y C U, V, X, Z D V, X, Y, Z
1 marks
Answer: B
This question in 0987/12 Oct/Nov 2022
Q9 · What does a point on a production possibility curve for an economy represent? 0987/11 May/June 2023
2 What does a point on a production possibility curve for an economy represent? A economic growth is falling B inefficient use of resources available C maximum output possible with current technology D total demand for goods and services
1 marks
Answer: C
This question in 0987/11 May/June 2023
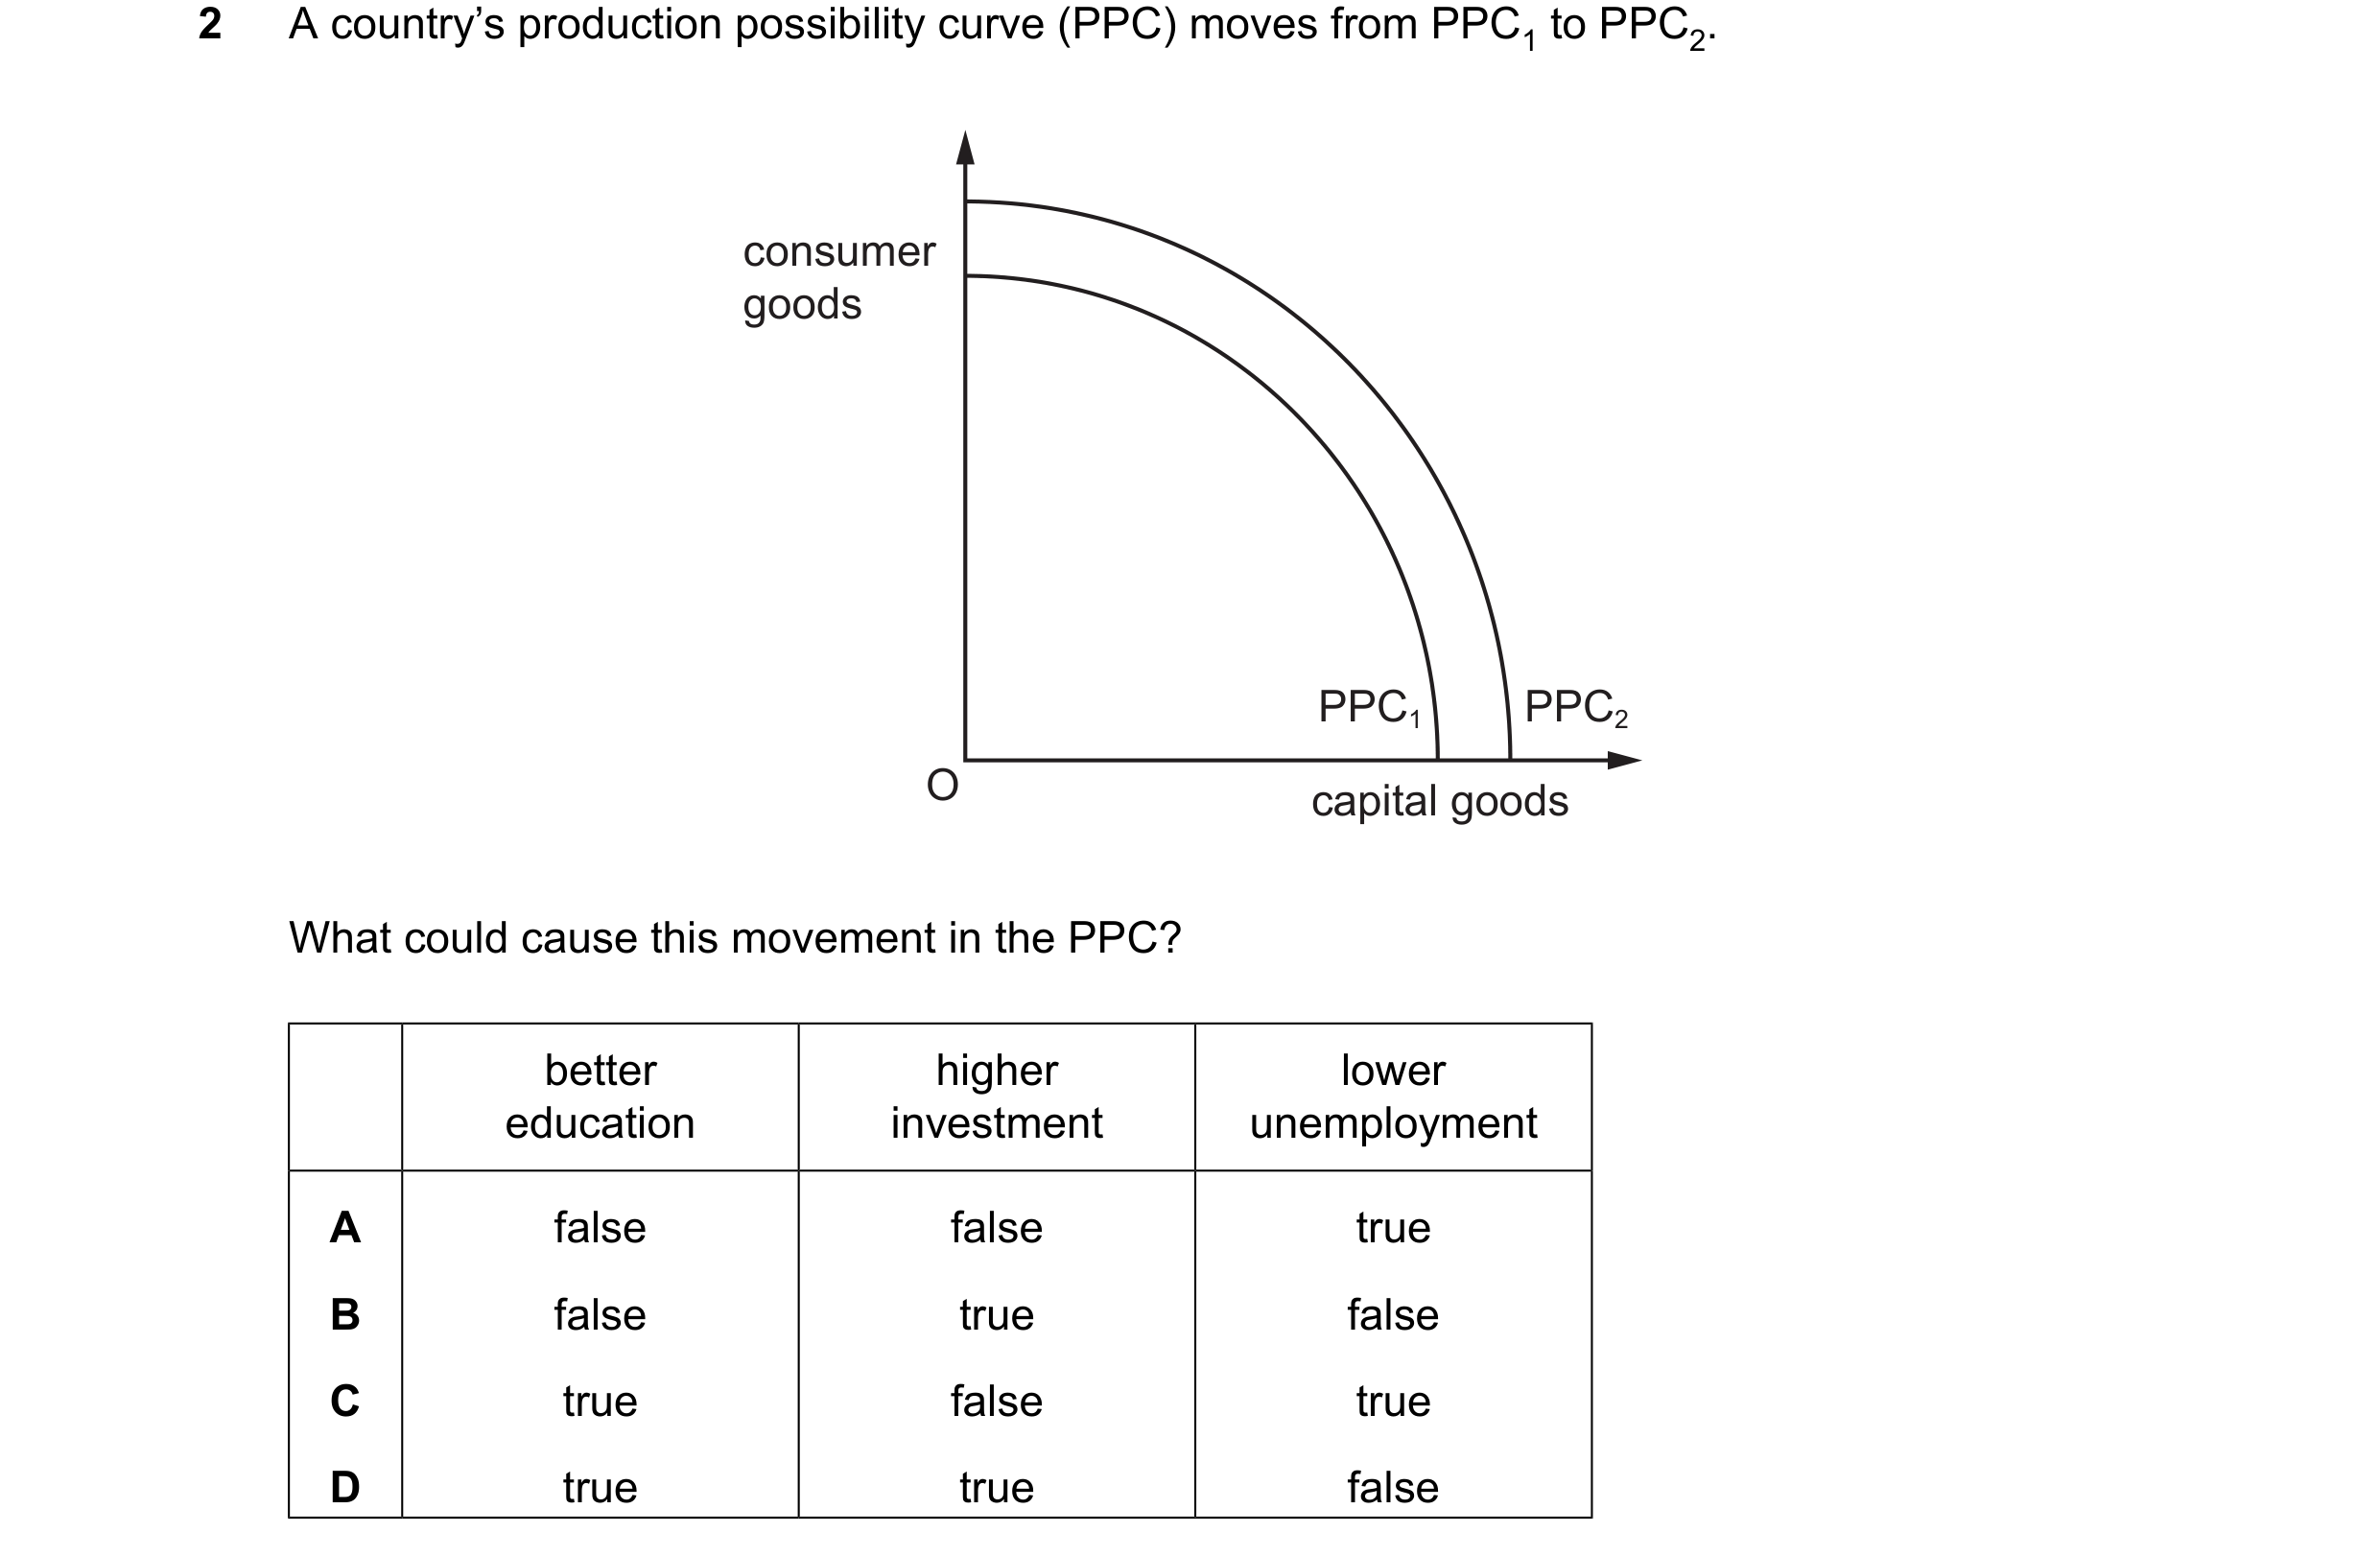
Q10 · A country’s production possibility curve (PPC) moves from PPC1 to PPC2 0987/12 May/June 2023
2 A country’s production possibility curve (PPC) moves from PPC1 to PPC2. consumer goods PPC1 PPC2 O capital goods What could cause this movement in the PPC? better higher lower education investment unemployment A false false true B false true false C true false true D true true false
1 marks
Answer: D
This question in 0987/12 May/June 2023
Q11 · The economy of country X is always on its production possibility curve (PPC) 0987/12 Oct/Nov 2023
2 The economy of country X is always on its production possibility curve (PPC). When will the goods and services produced by country X become more scarce? PPC population size A shifts left increases B shifts right unchanged C unchanged decreases D unchanged unchanged
1 marks
Answer: A
This question in 0987/12 Oct/Nov 2023
Q12 · Capital P goods R U O S V Q consumer goods Which current combination of capital and… 0987/12 May/June 2024
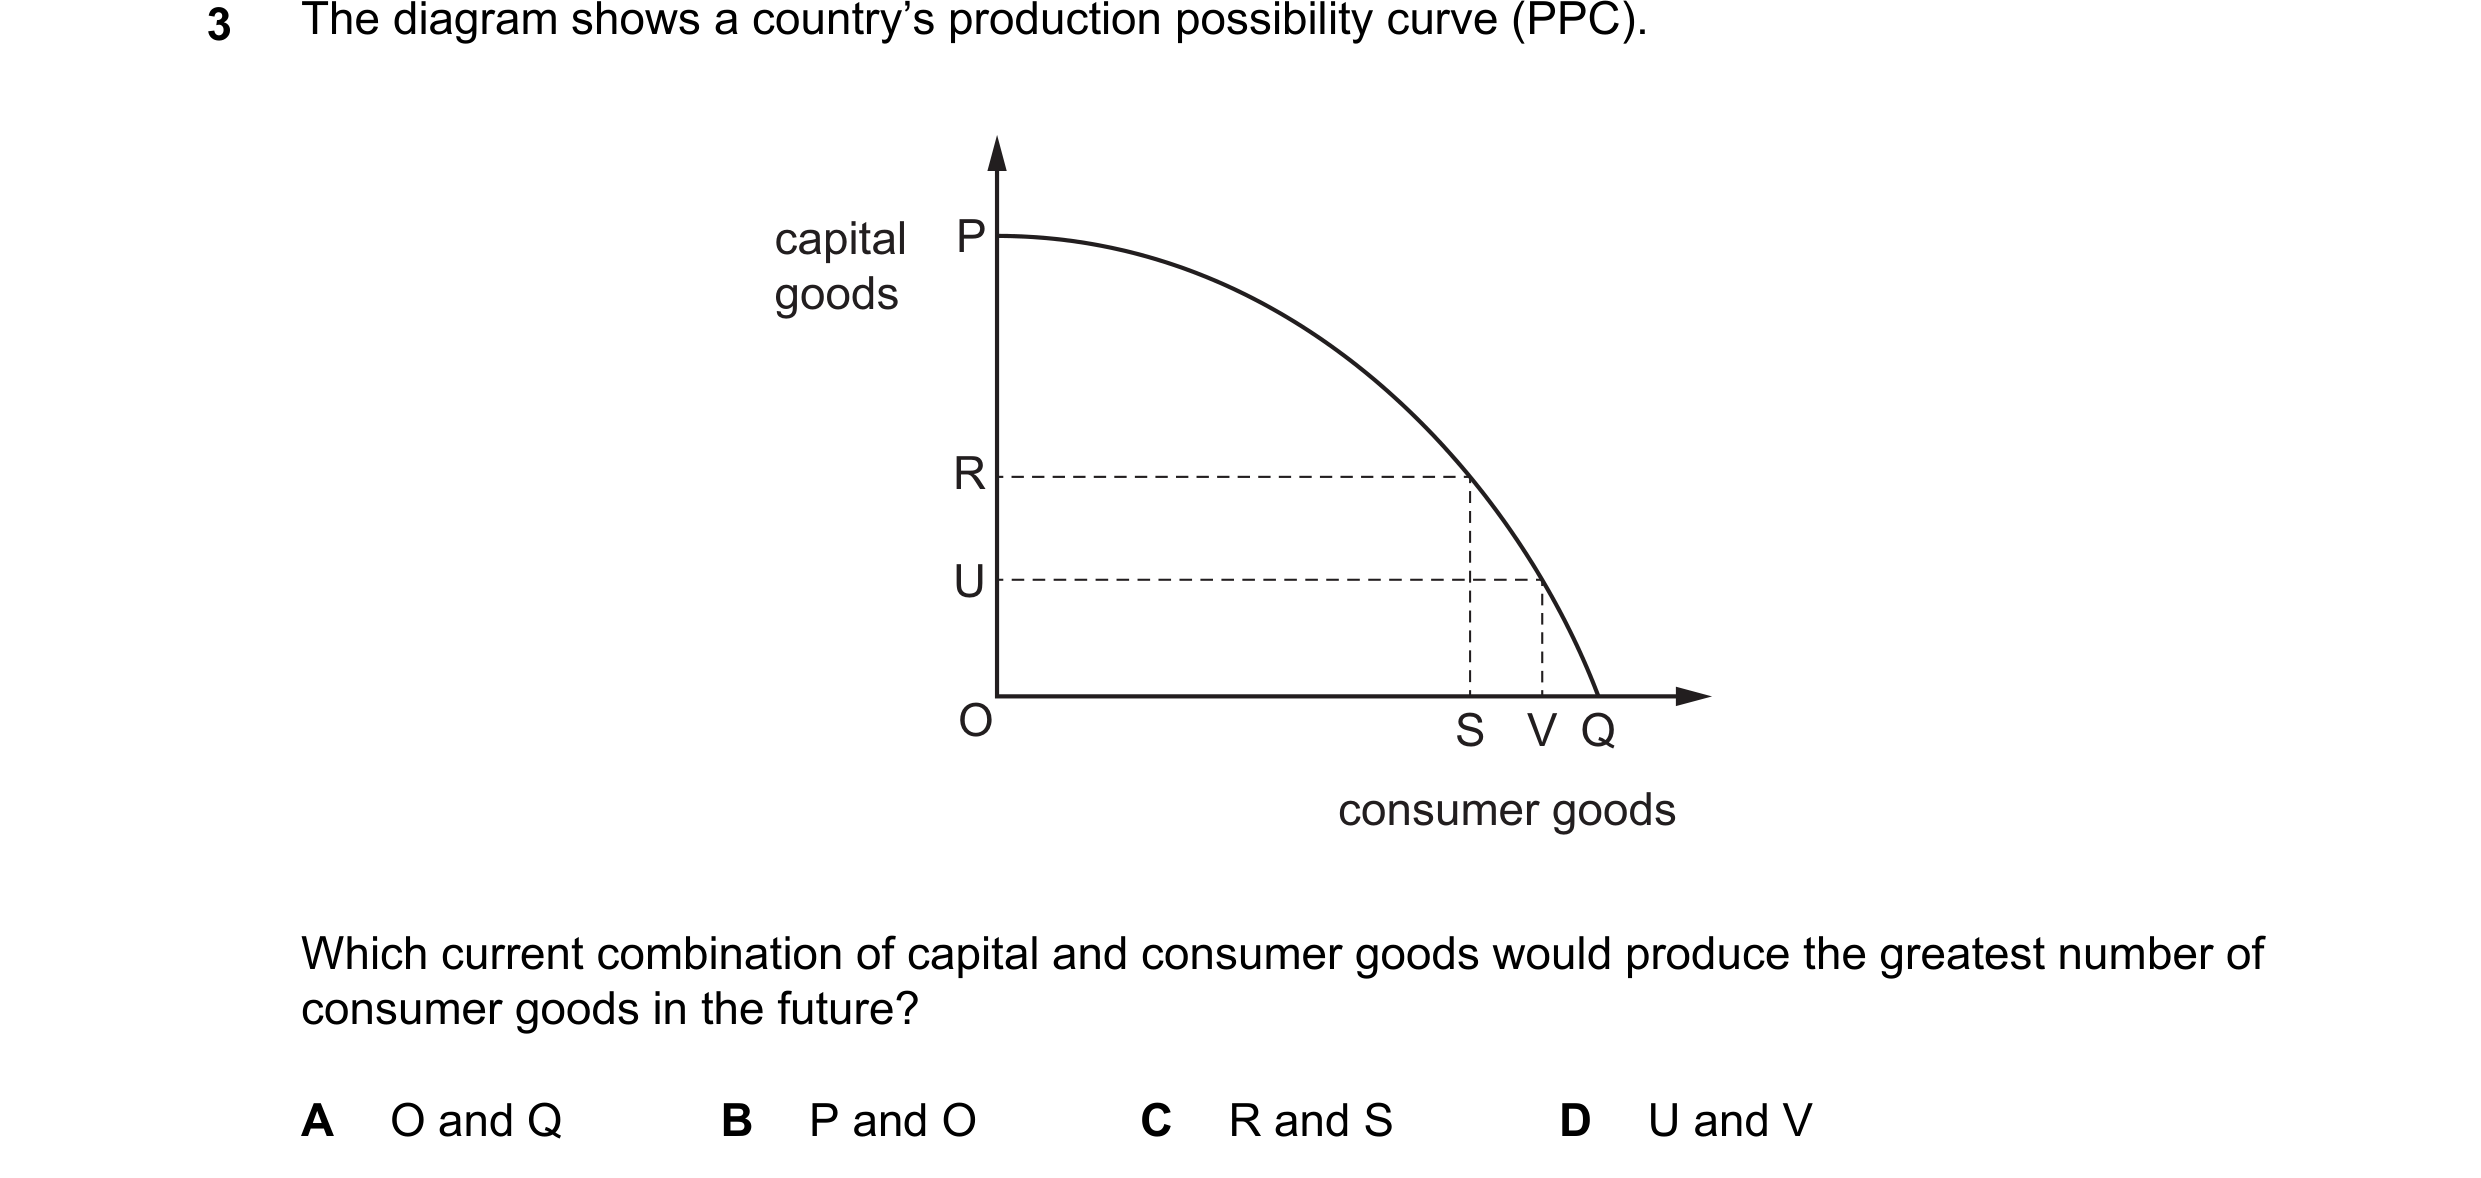
3 capital P goods R U O S V Q consumer goods Which current combination of capital and consumer goods would produce the greatest number of consumer goods in the future? A O and Q B P and O C R and S D U and V
1 marks
Answer: B
This question in 0987/12 May/June 2024
Q13 · The diagram shows a production possibility curve (PPC) for an economy that produces two… 0987/12 Oct/Nov 2024
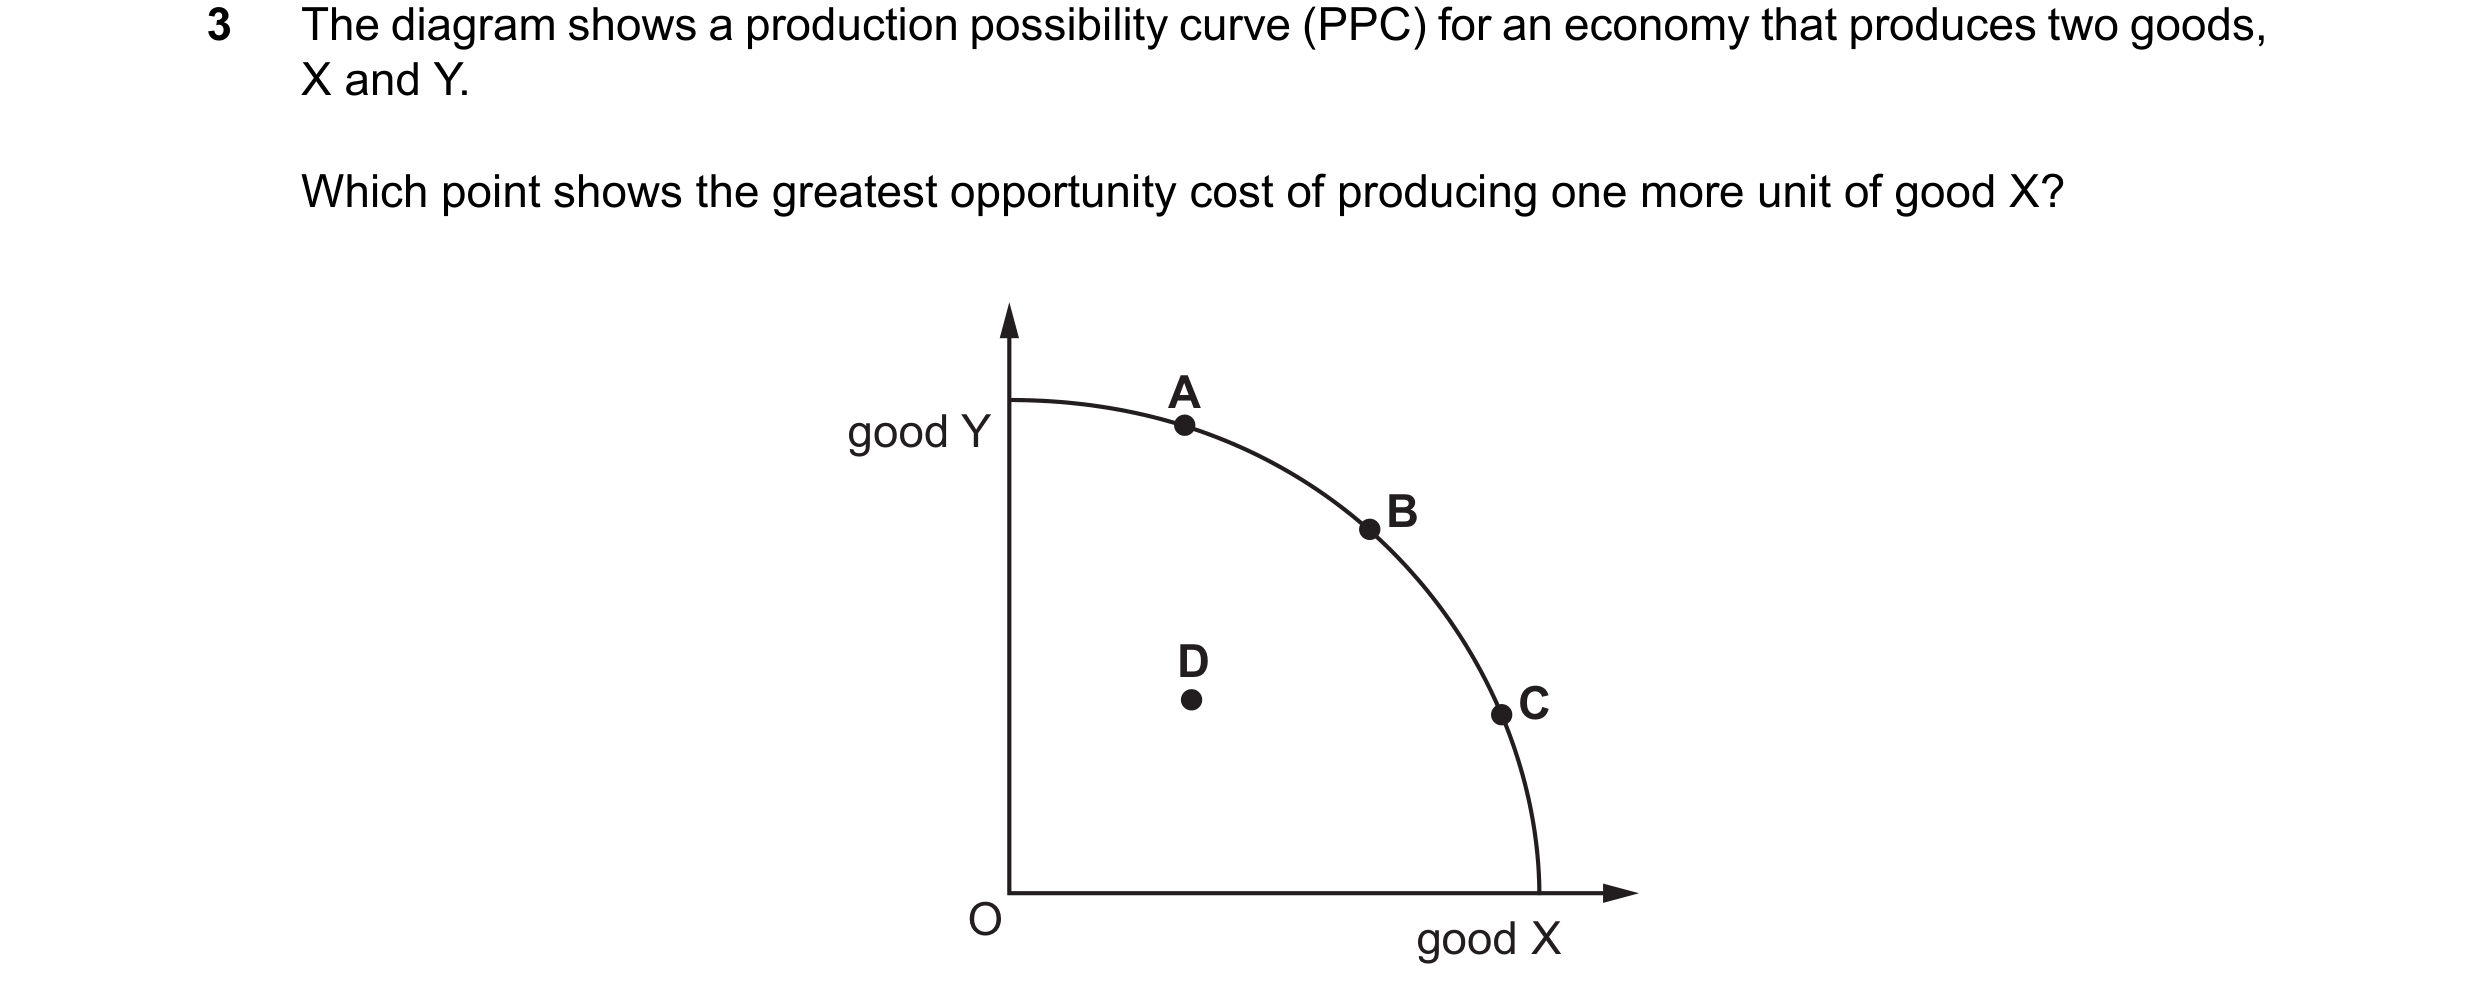
3 The diagram shows a production possibility curve (PPC) for an economy that produces two goods, X and Y. Which point shows the greatest opportunity cost of producing one more unit of good X? A good Y B D C O good X
1 marks
Answer: C
This question in 0987/12 Oct/Nov 2024
Q14 · The diagram shows a production possibility curve (PPC) 0987/11 May/June 2025
3 The diagram shows a production possibility curve (PPC). The economy is using all of its available resources. W Z manufactured goods Y X O agricultural goods A government decides to encourage more production of manufactured goods instead of agricultural goods. Which movement shows this policy change? A W to X B W to Y C X to W D Z to X
1 marks
Answer: C
This question in 0987/11 May/June 2025
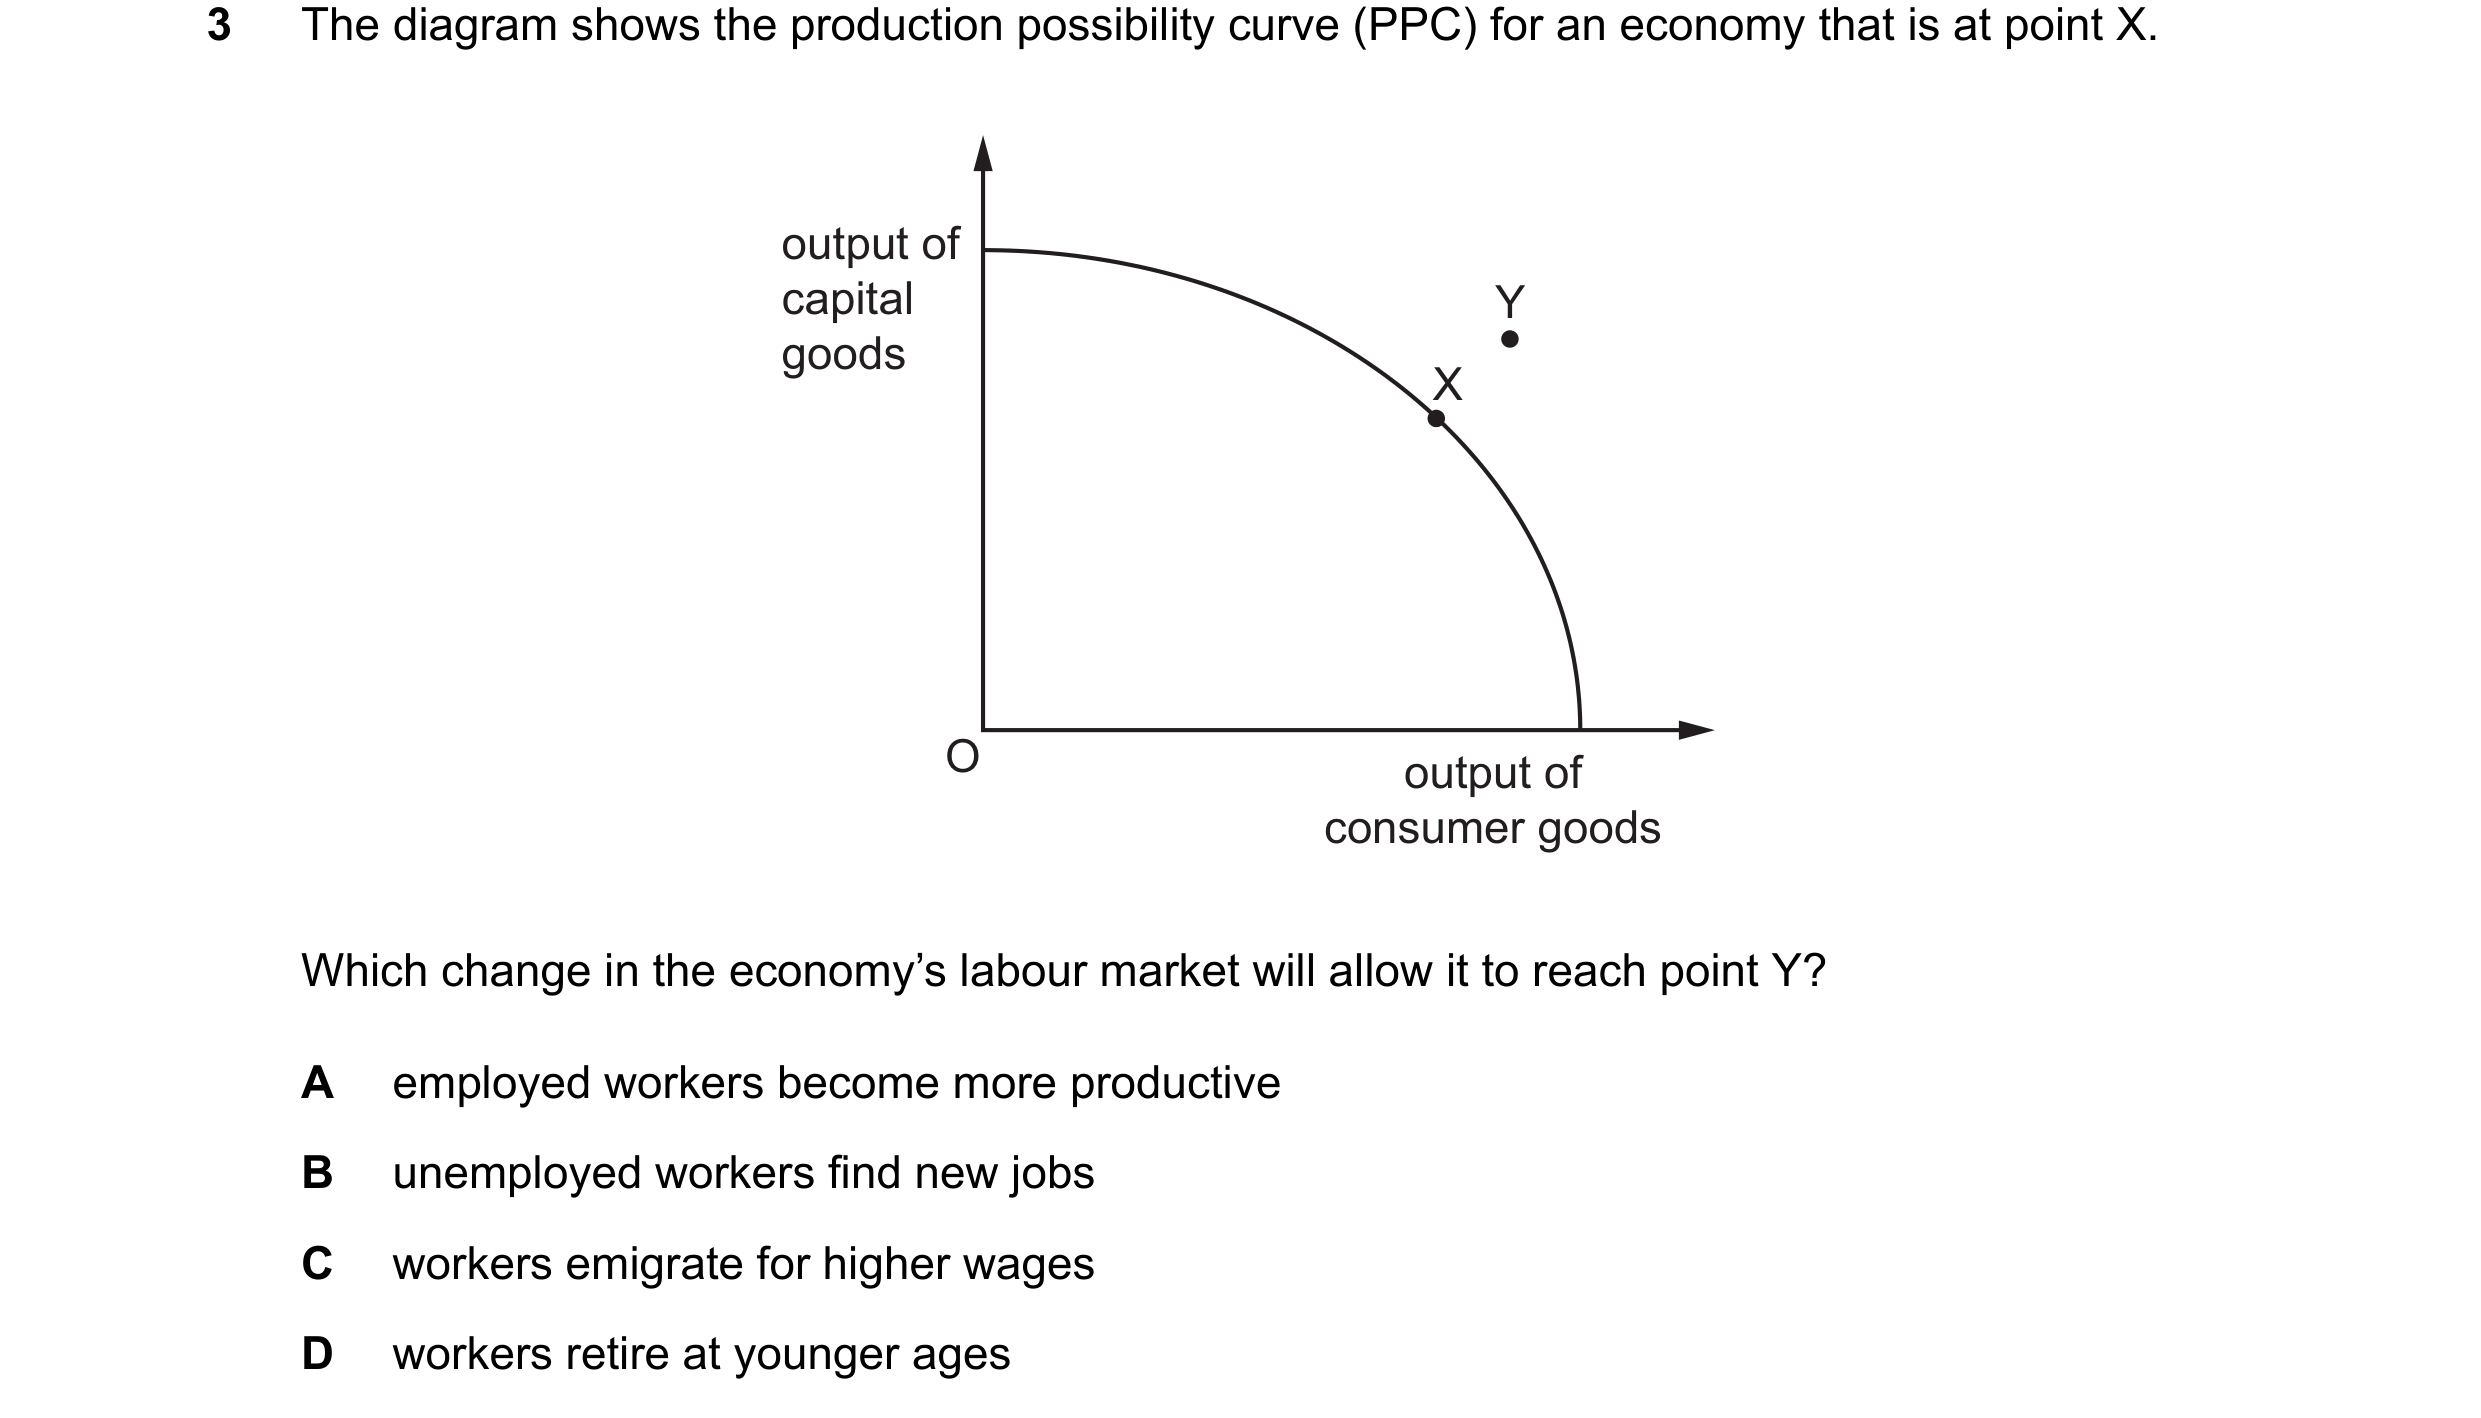
Q15 · The diagram shows the production possibility curve (PPC) for an economy that is at point X 0987/12 May/June 2025
3 The diagram shows the production possibility curve (PPC) for an economy that is at point X. output of capital Y goods X O output of consumer goods Which change in the economy’s labour market will allow it to reach point Y? A employed workers become more productive B unemployed workers find new jobs C workers emigrate for higher wages D workers retire at younger ages
1 marks
Answer: A
This question in 0987/12 May/June 2025
Q16 · A country is producing at point X on its production possibility curve (PPC) which shows… 0987/12 Oct/Nov 2025
3 A country is producing at point X on its production possibility curve (PPC) which shows how it can allocate its production between capital goods and consumer goods. A period of recession then causes some of its factories to close. Which point could represent the country’s new position? capital A B goods X C D O consumer goods
1 marks
Answer: C
This question in 0987/12 Oct/Nov 2025
 1 / 7
1 / 7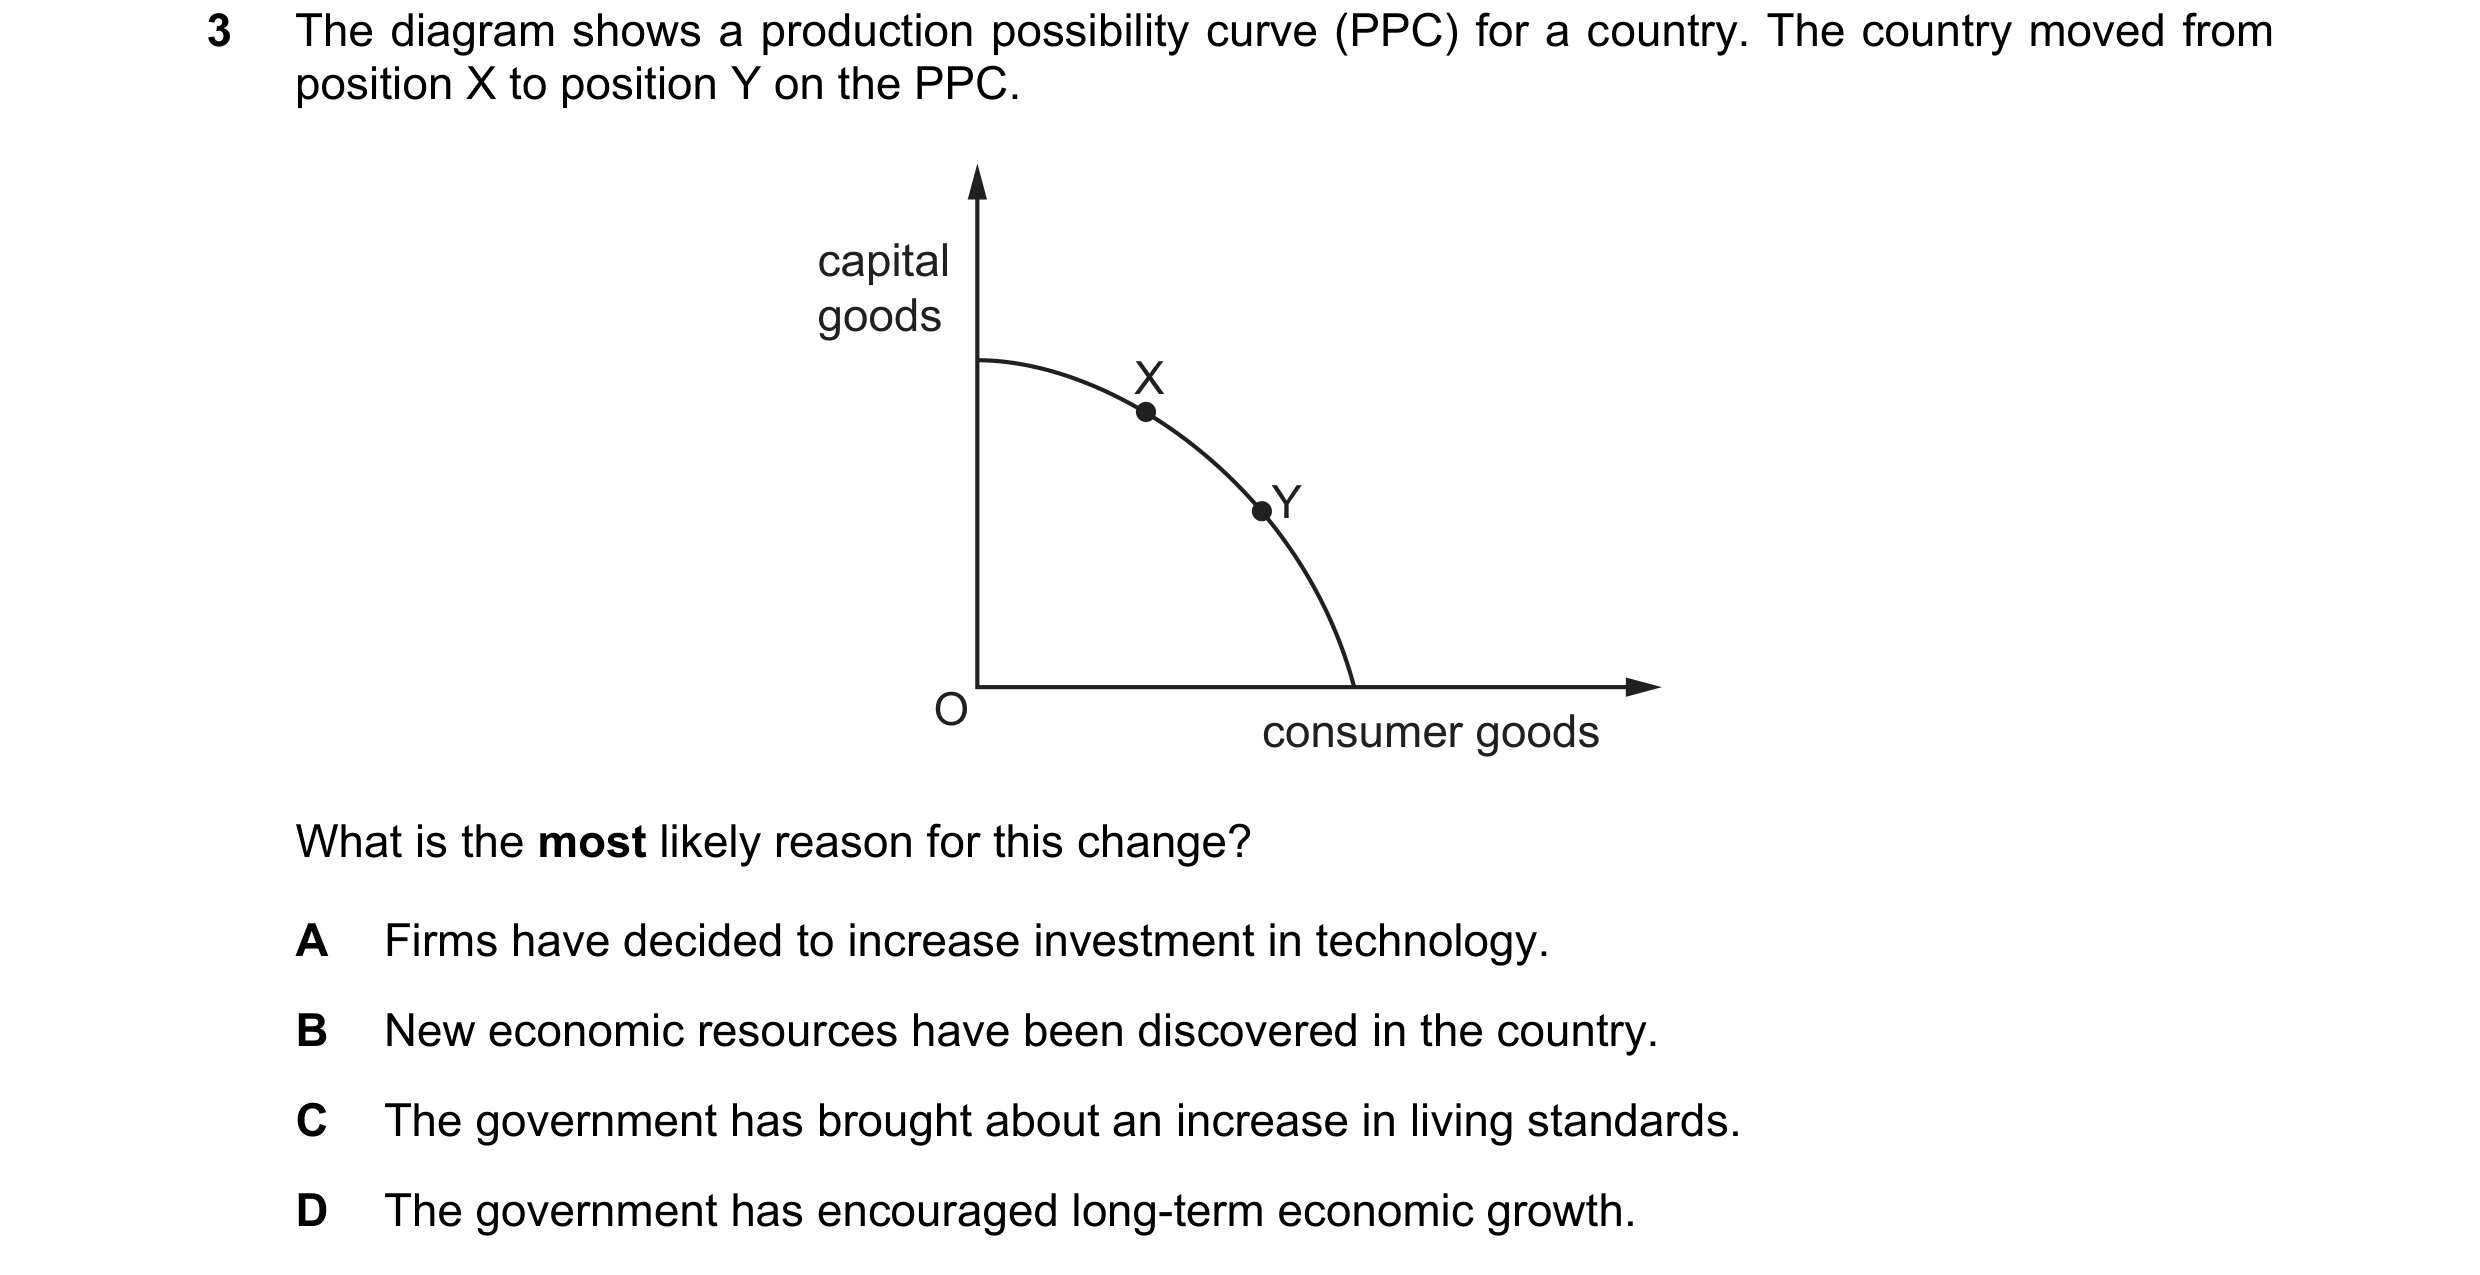
 2 / 7
2 / 7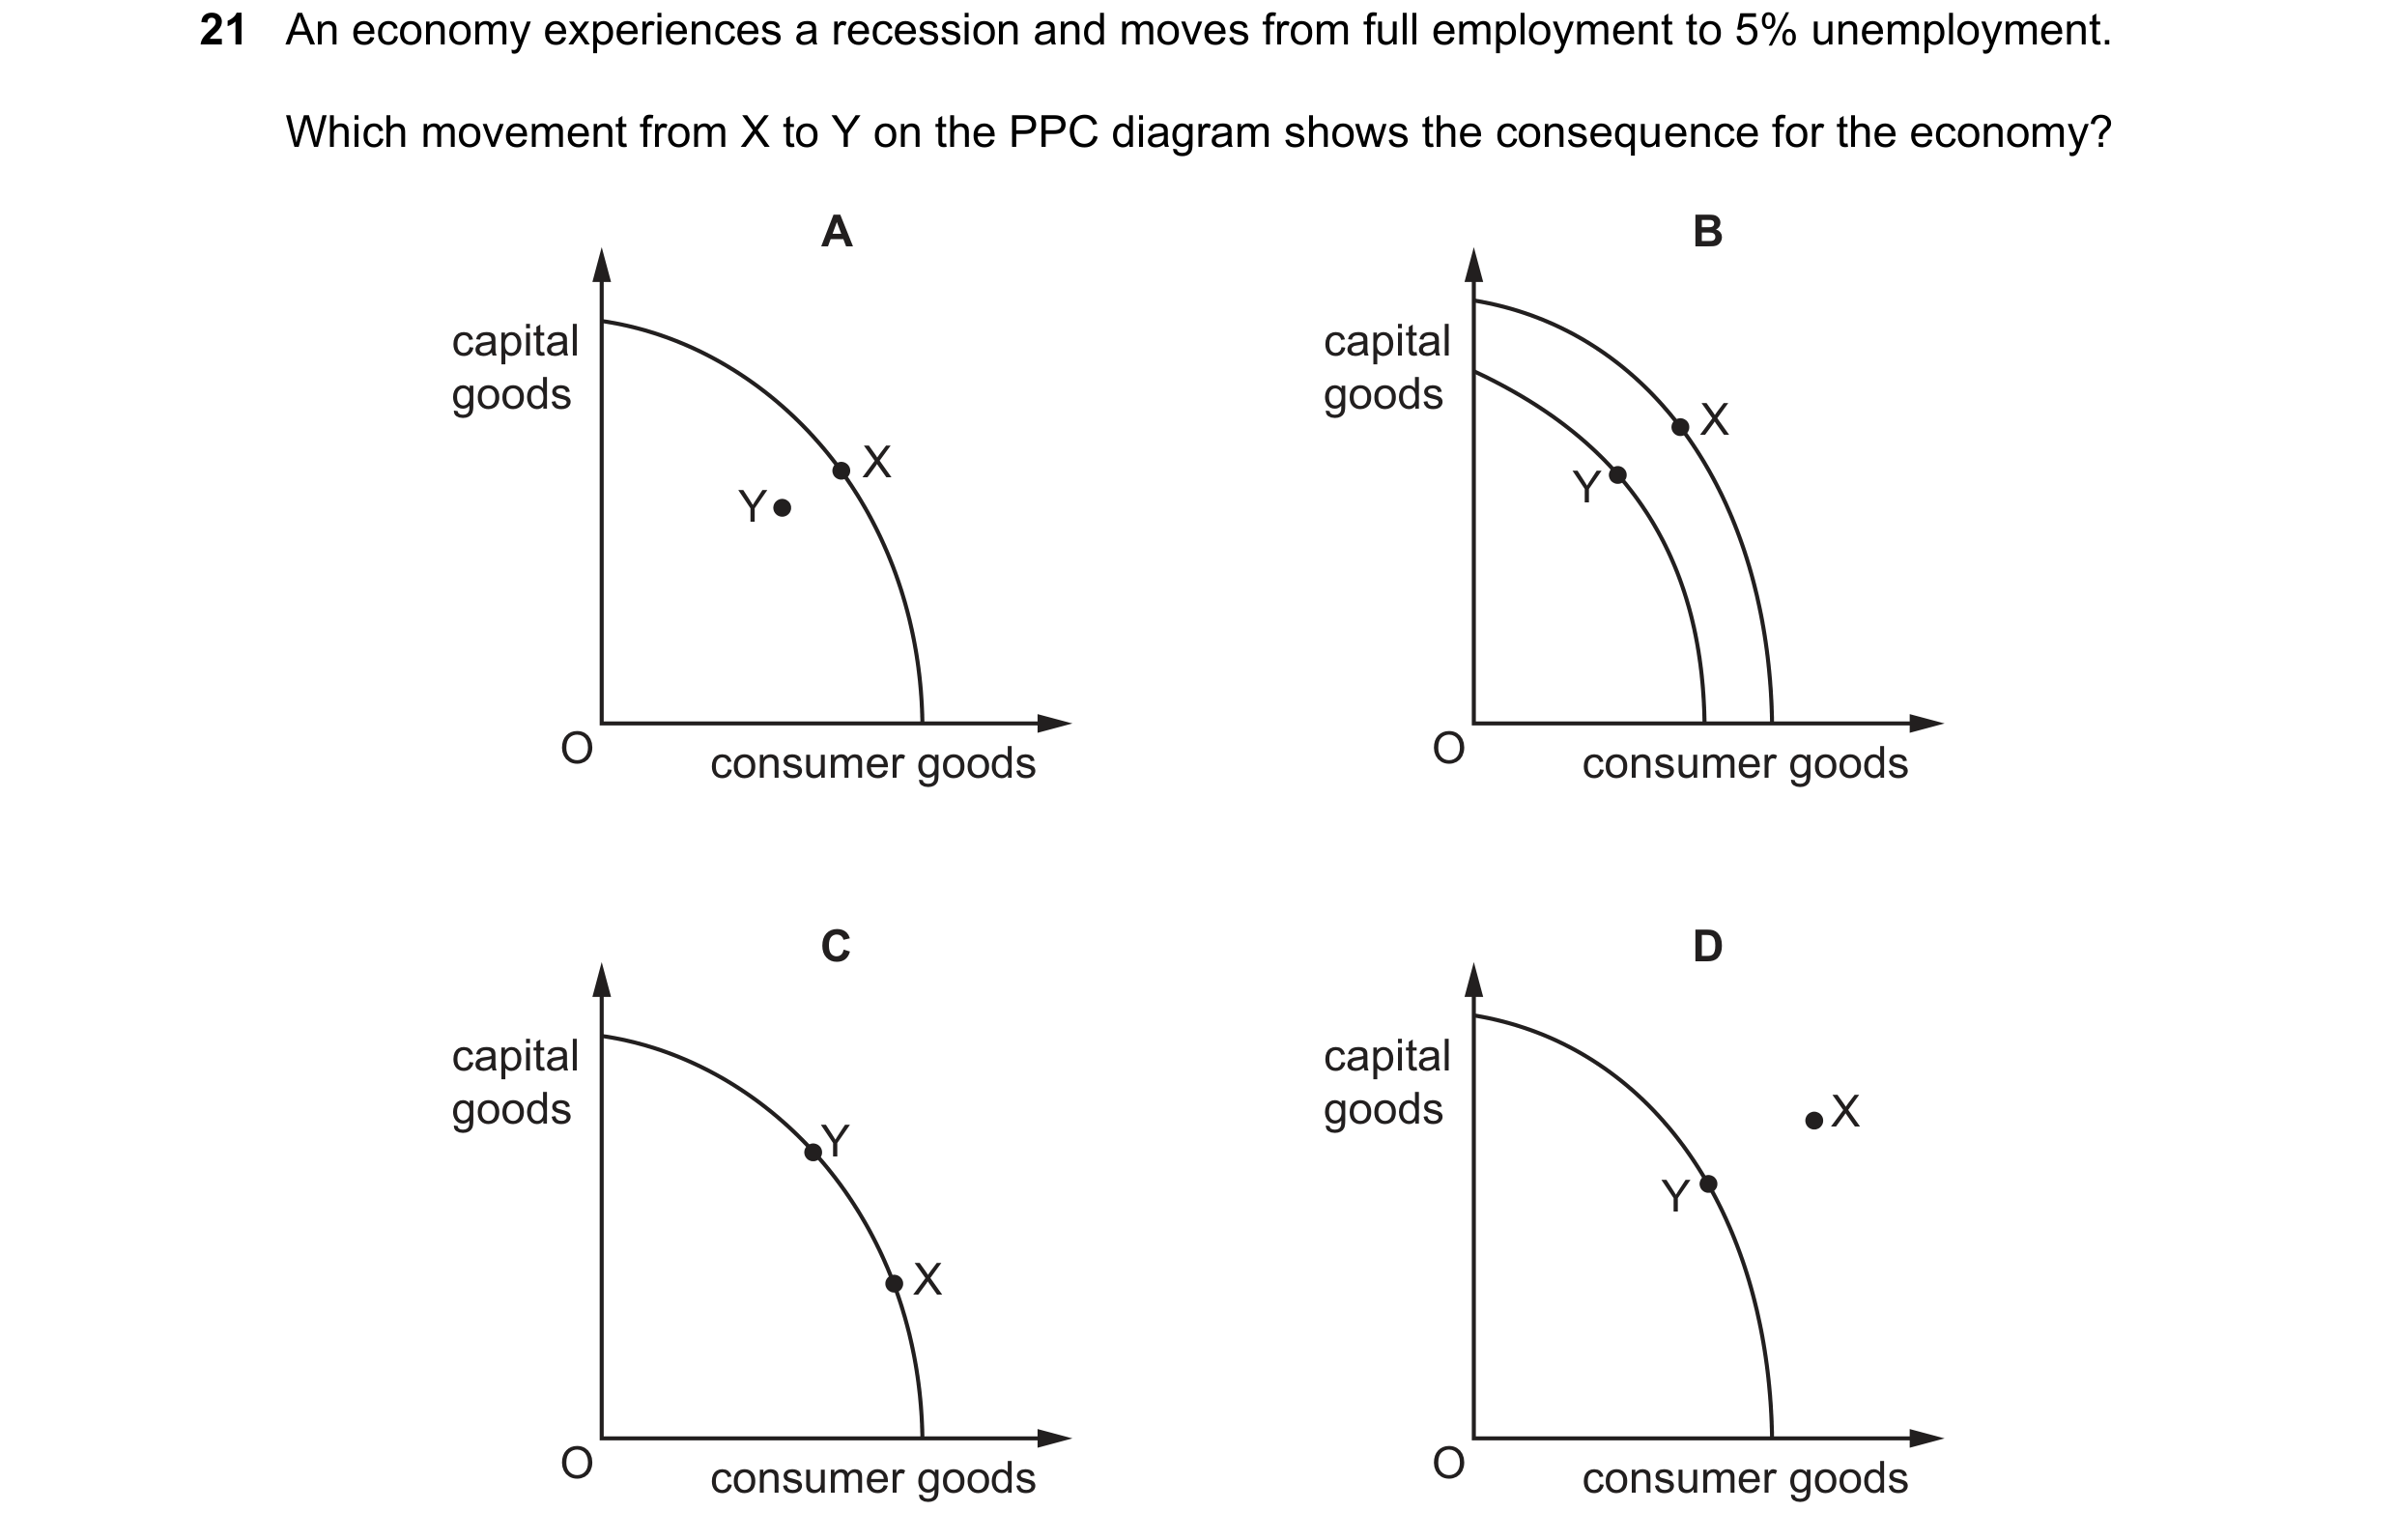

 3 / 7
3 / 7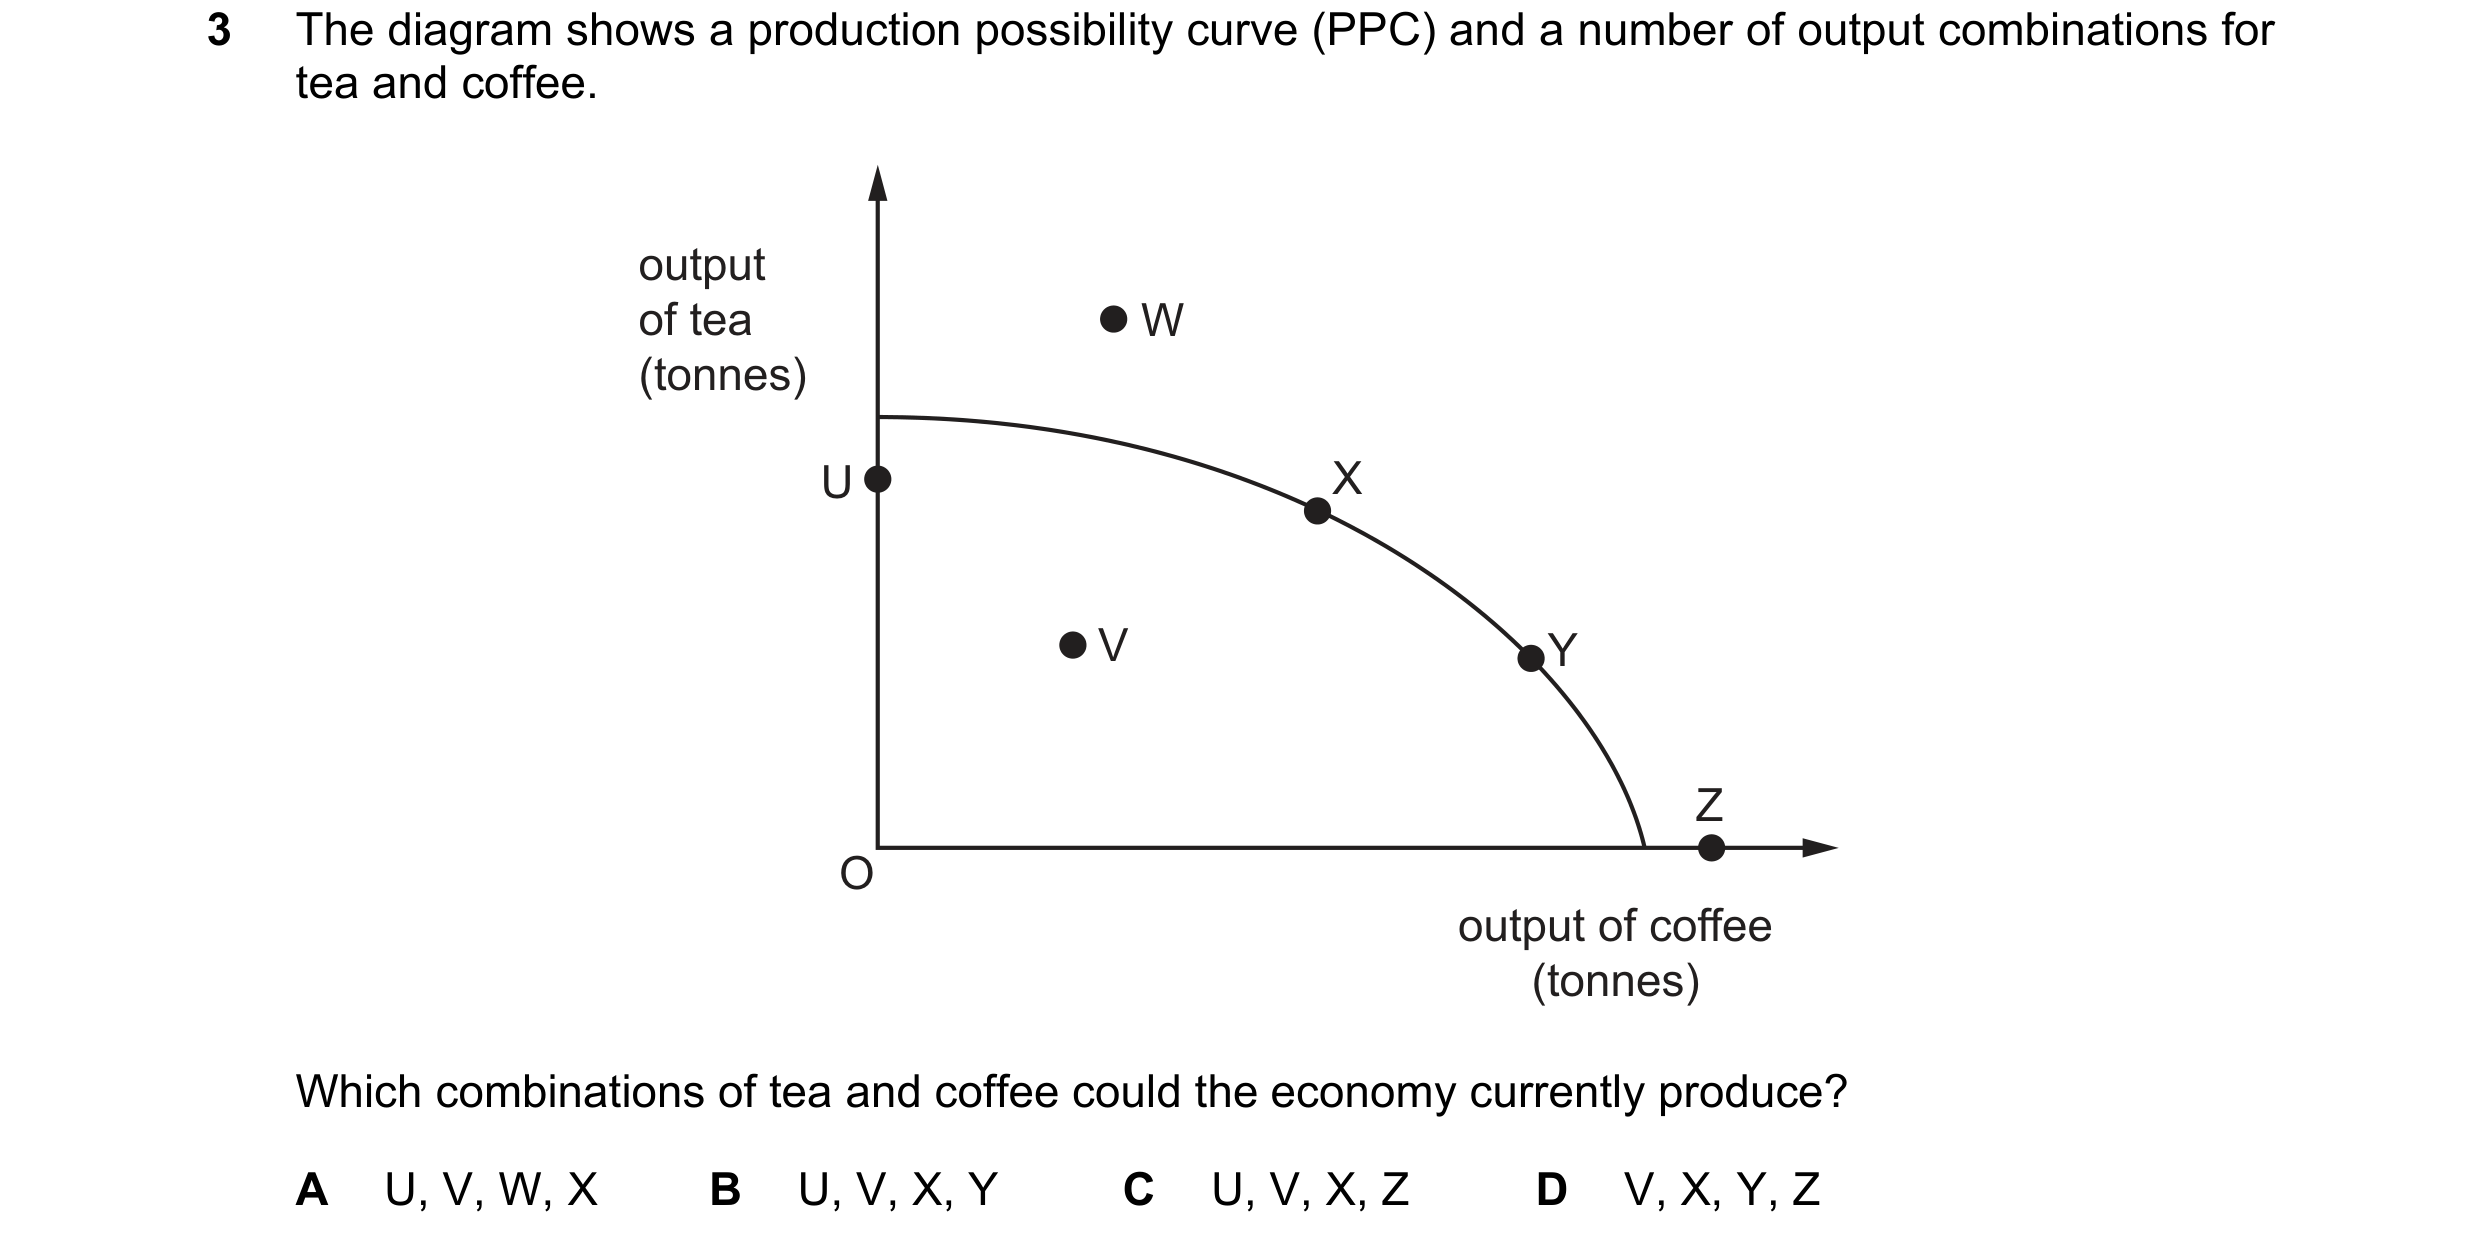

 4 / 7
4 / 7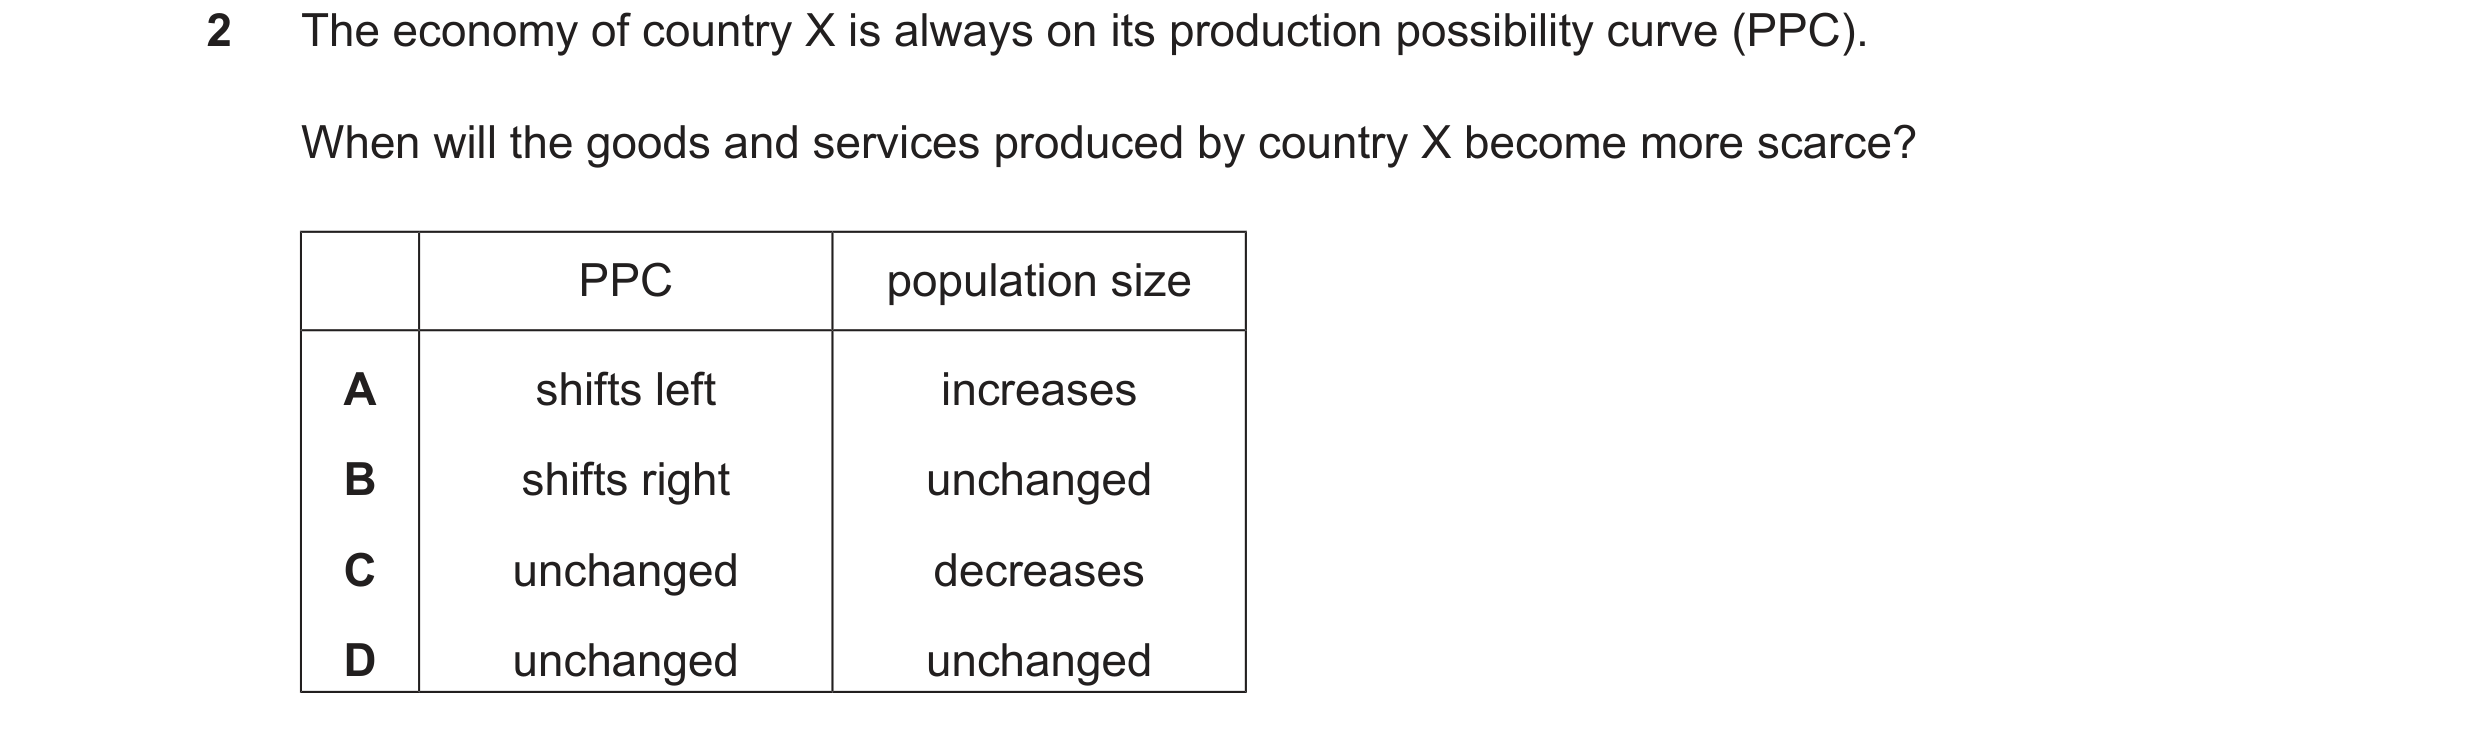
 5 / 7
5 / 7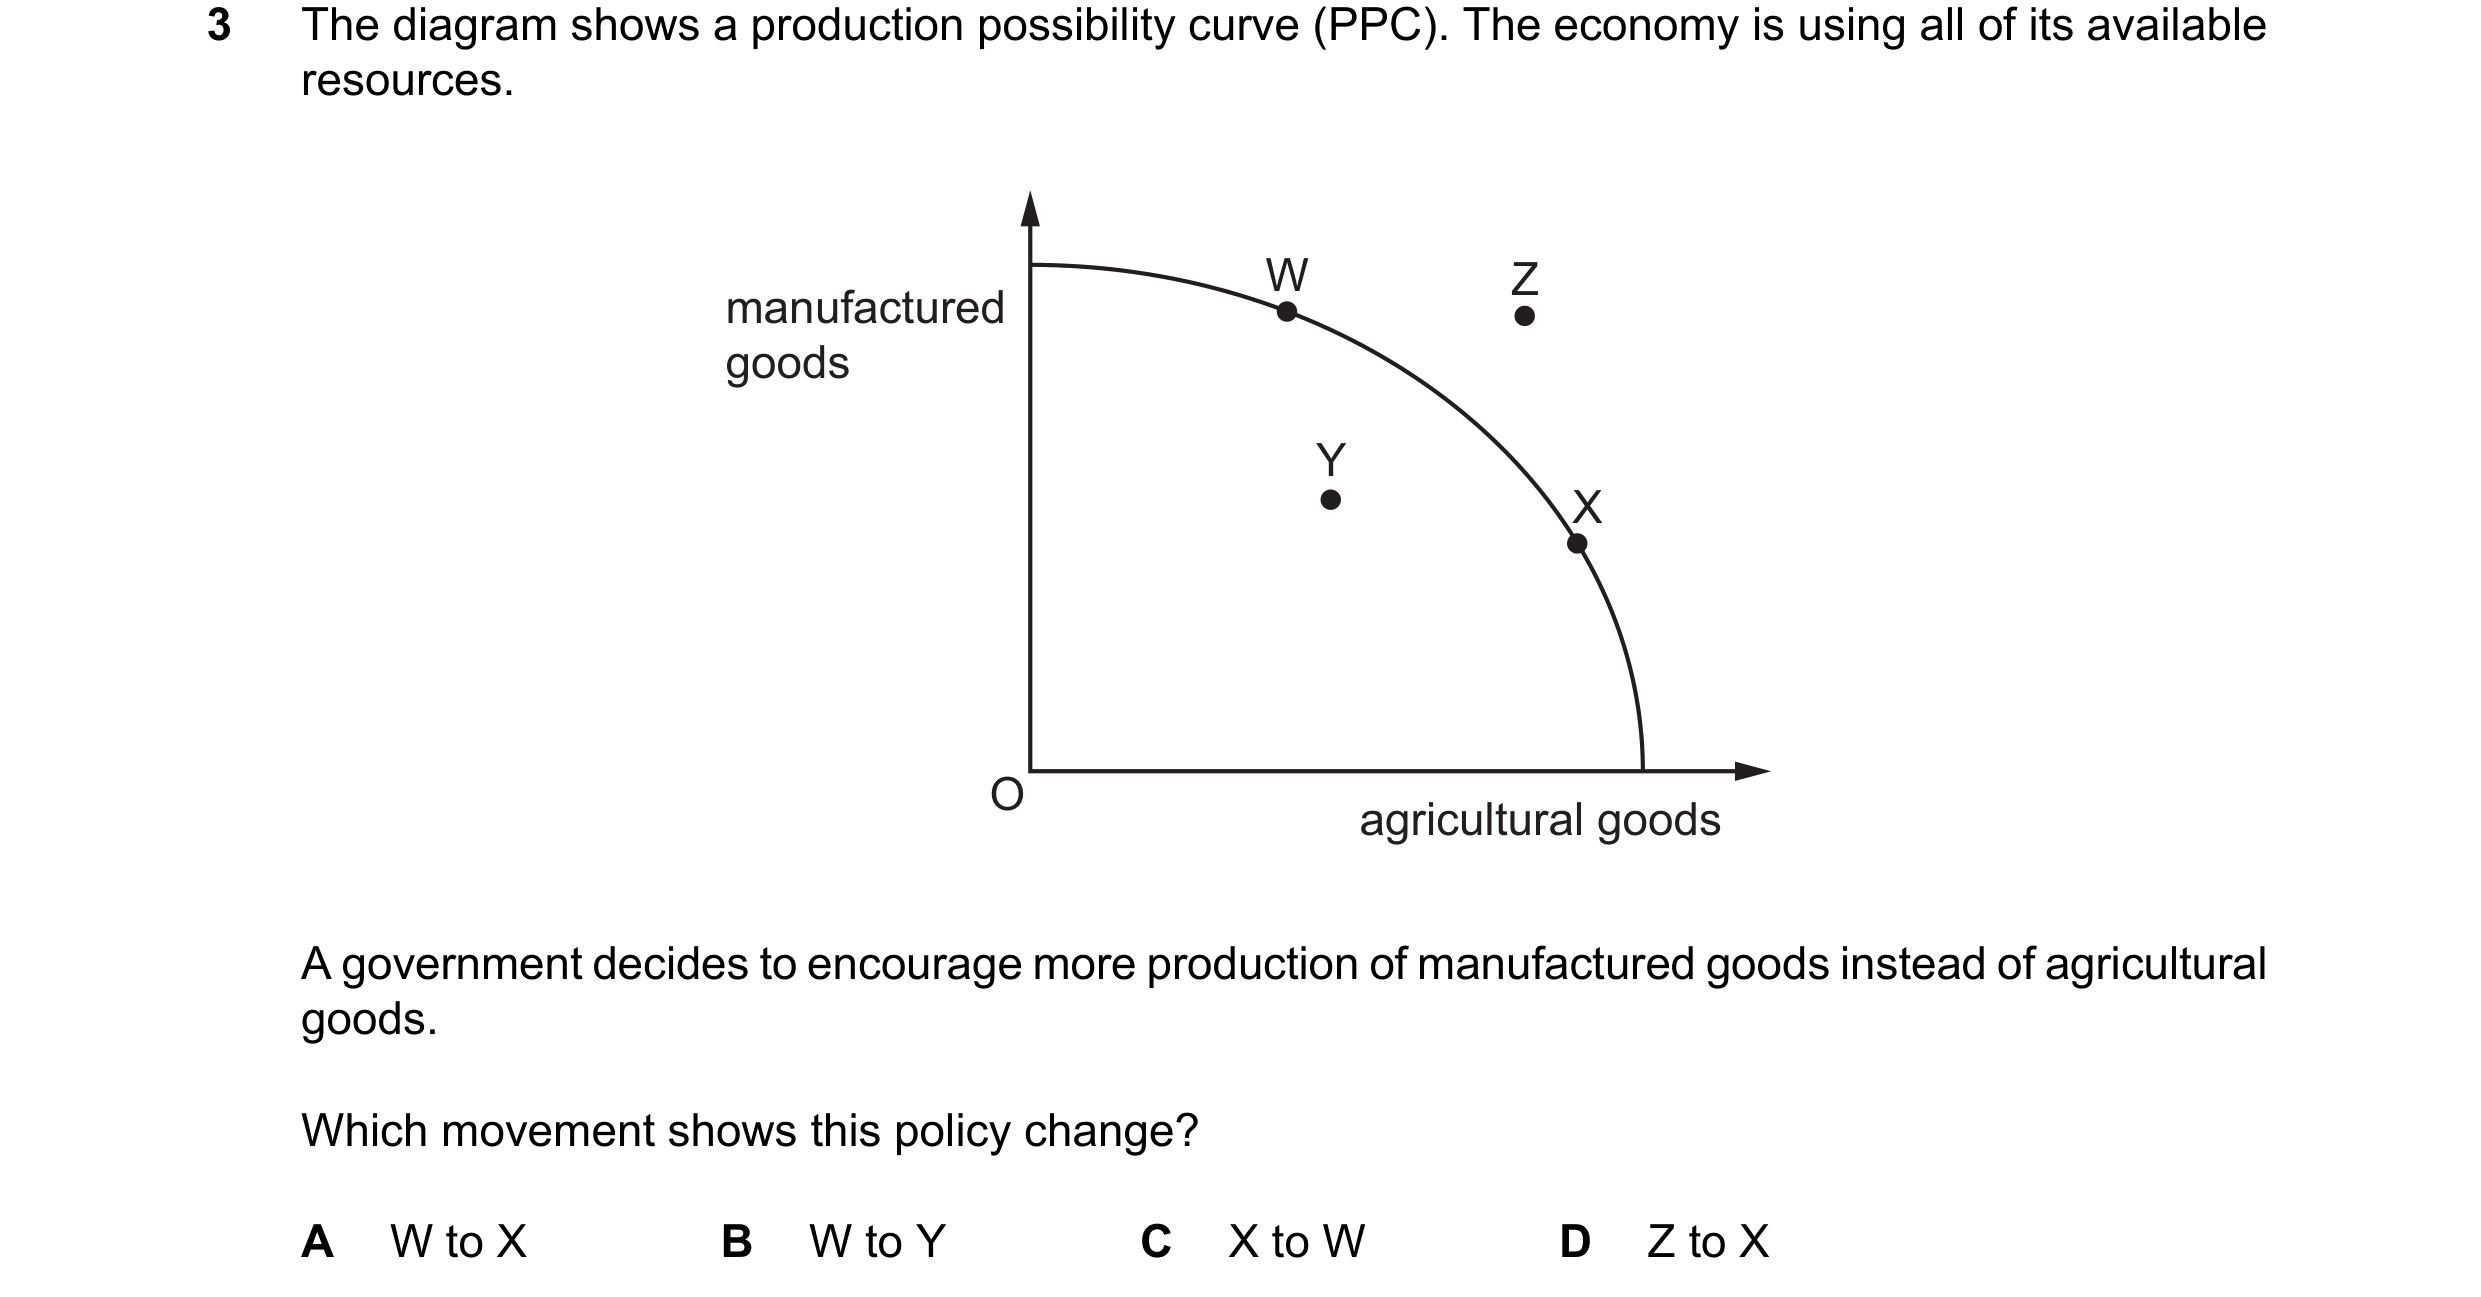
 6 / 7
6 / 7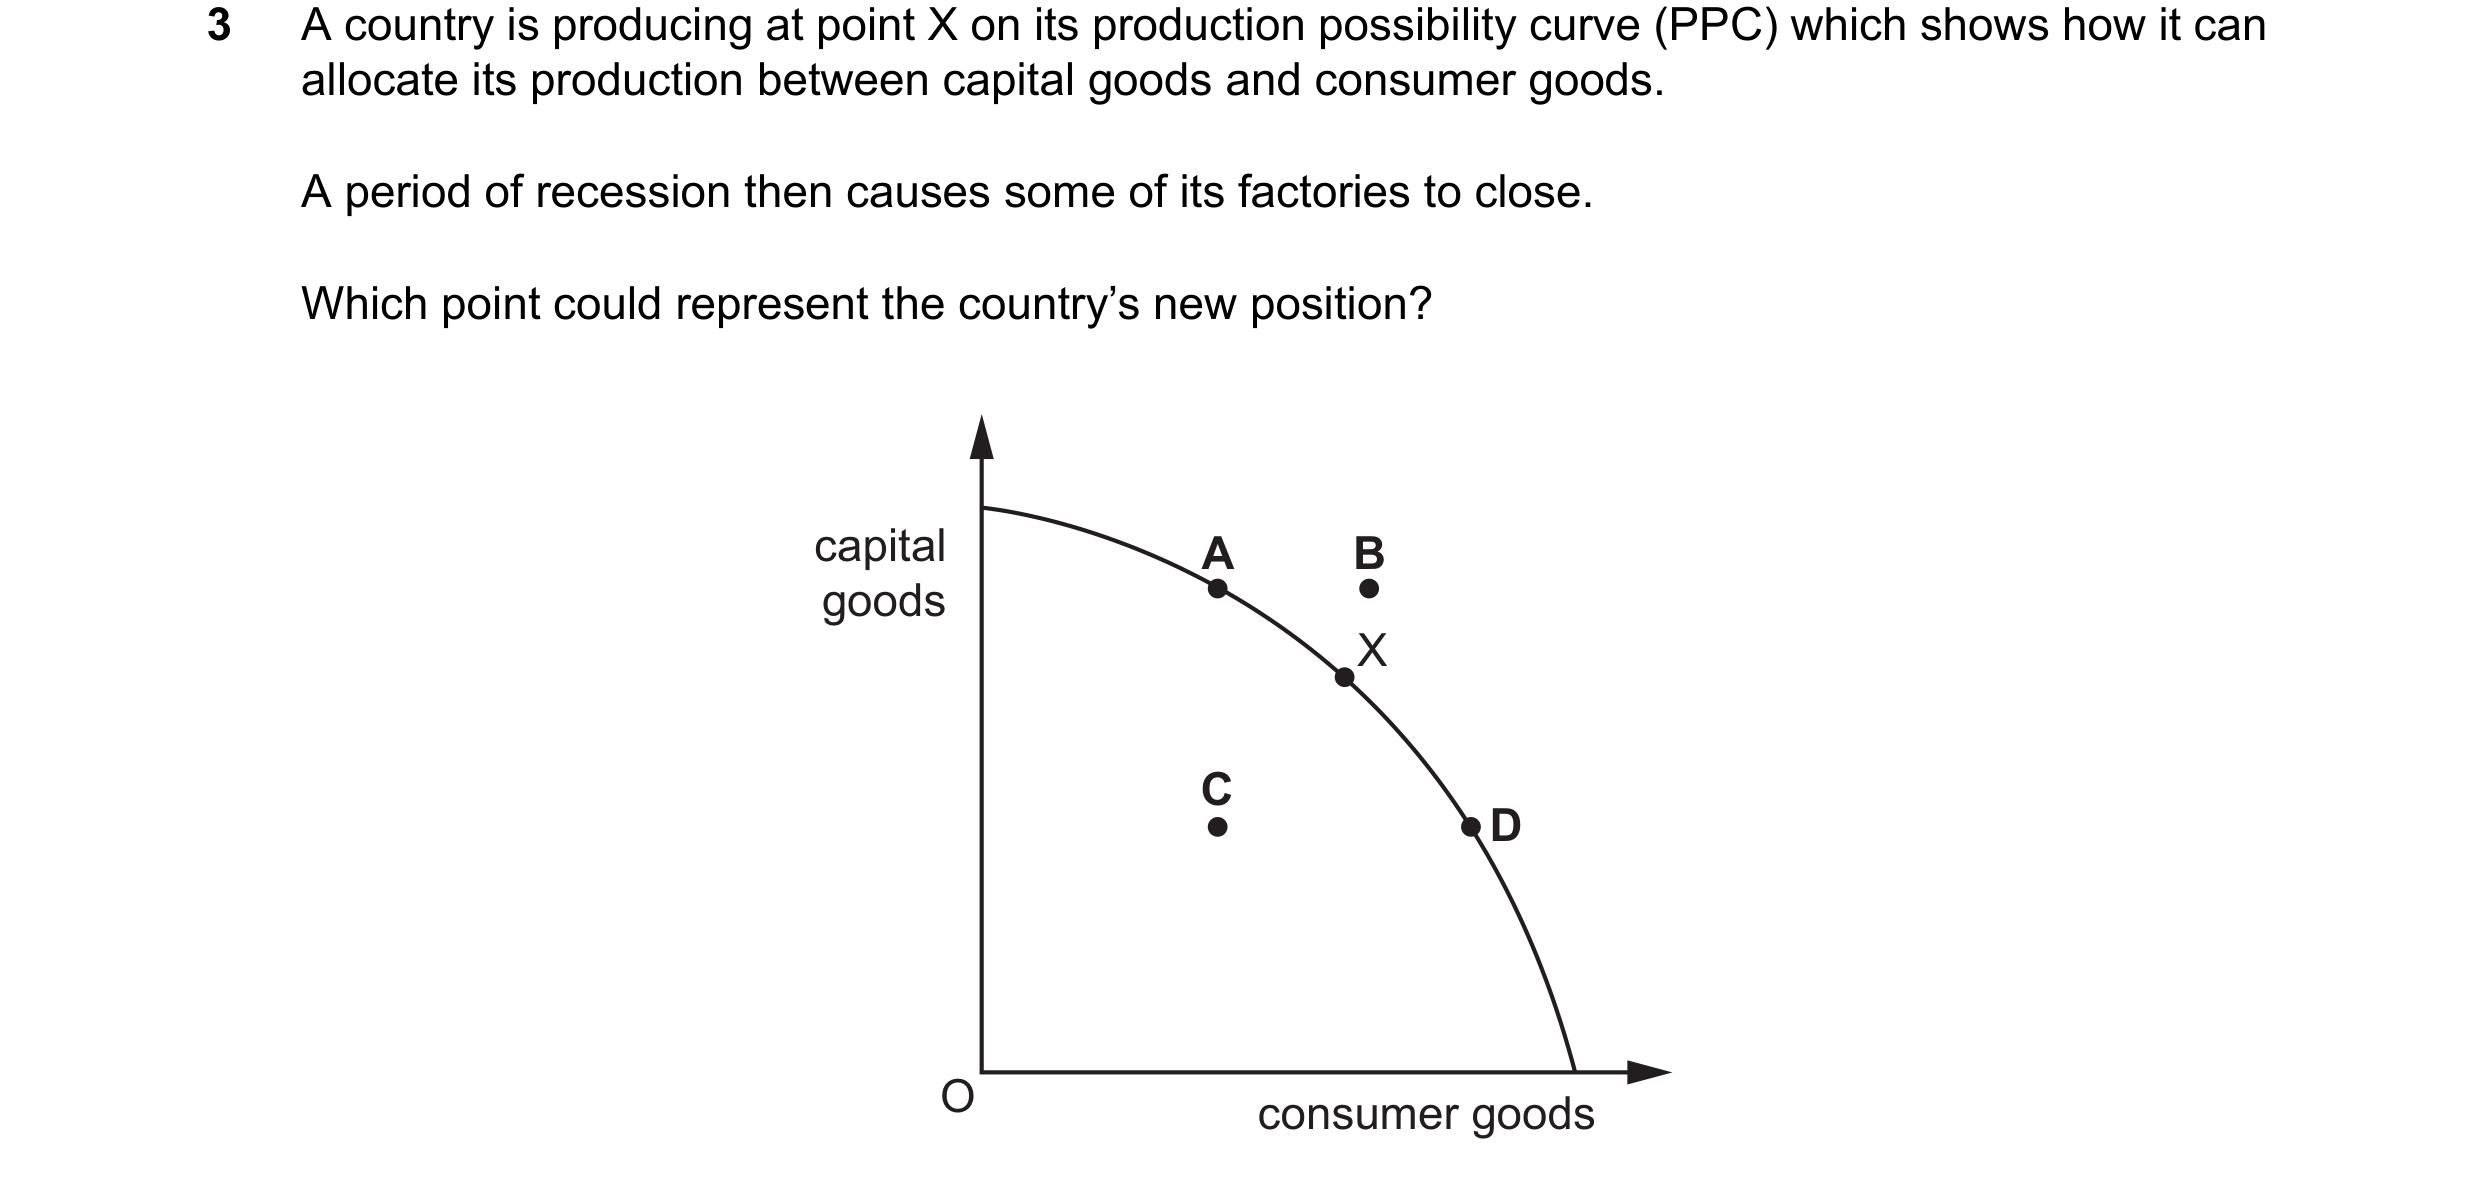 7 / 7
7 / 7