Cambridge IGCSE Economics (9-1) 0987 — 2020 Oct/Nov Paper 1 · Variant 2
0987/12/O/N/20 · 30 questions · 30 marks · ≈34 min
The question paper and its mark scheme, free to read here and free to download. This is Cambridge’s own paper, exactly as it was sat.
Question paper12 pages

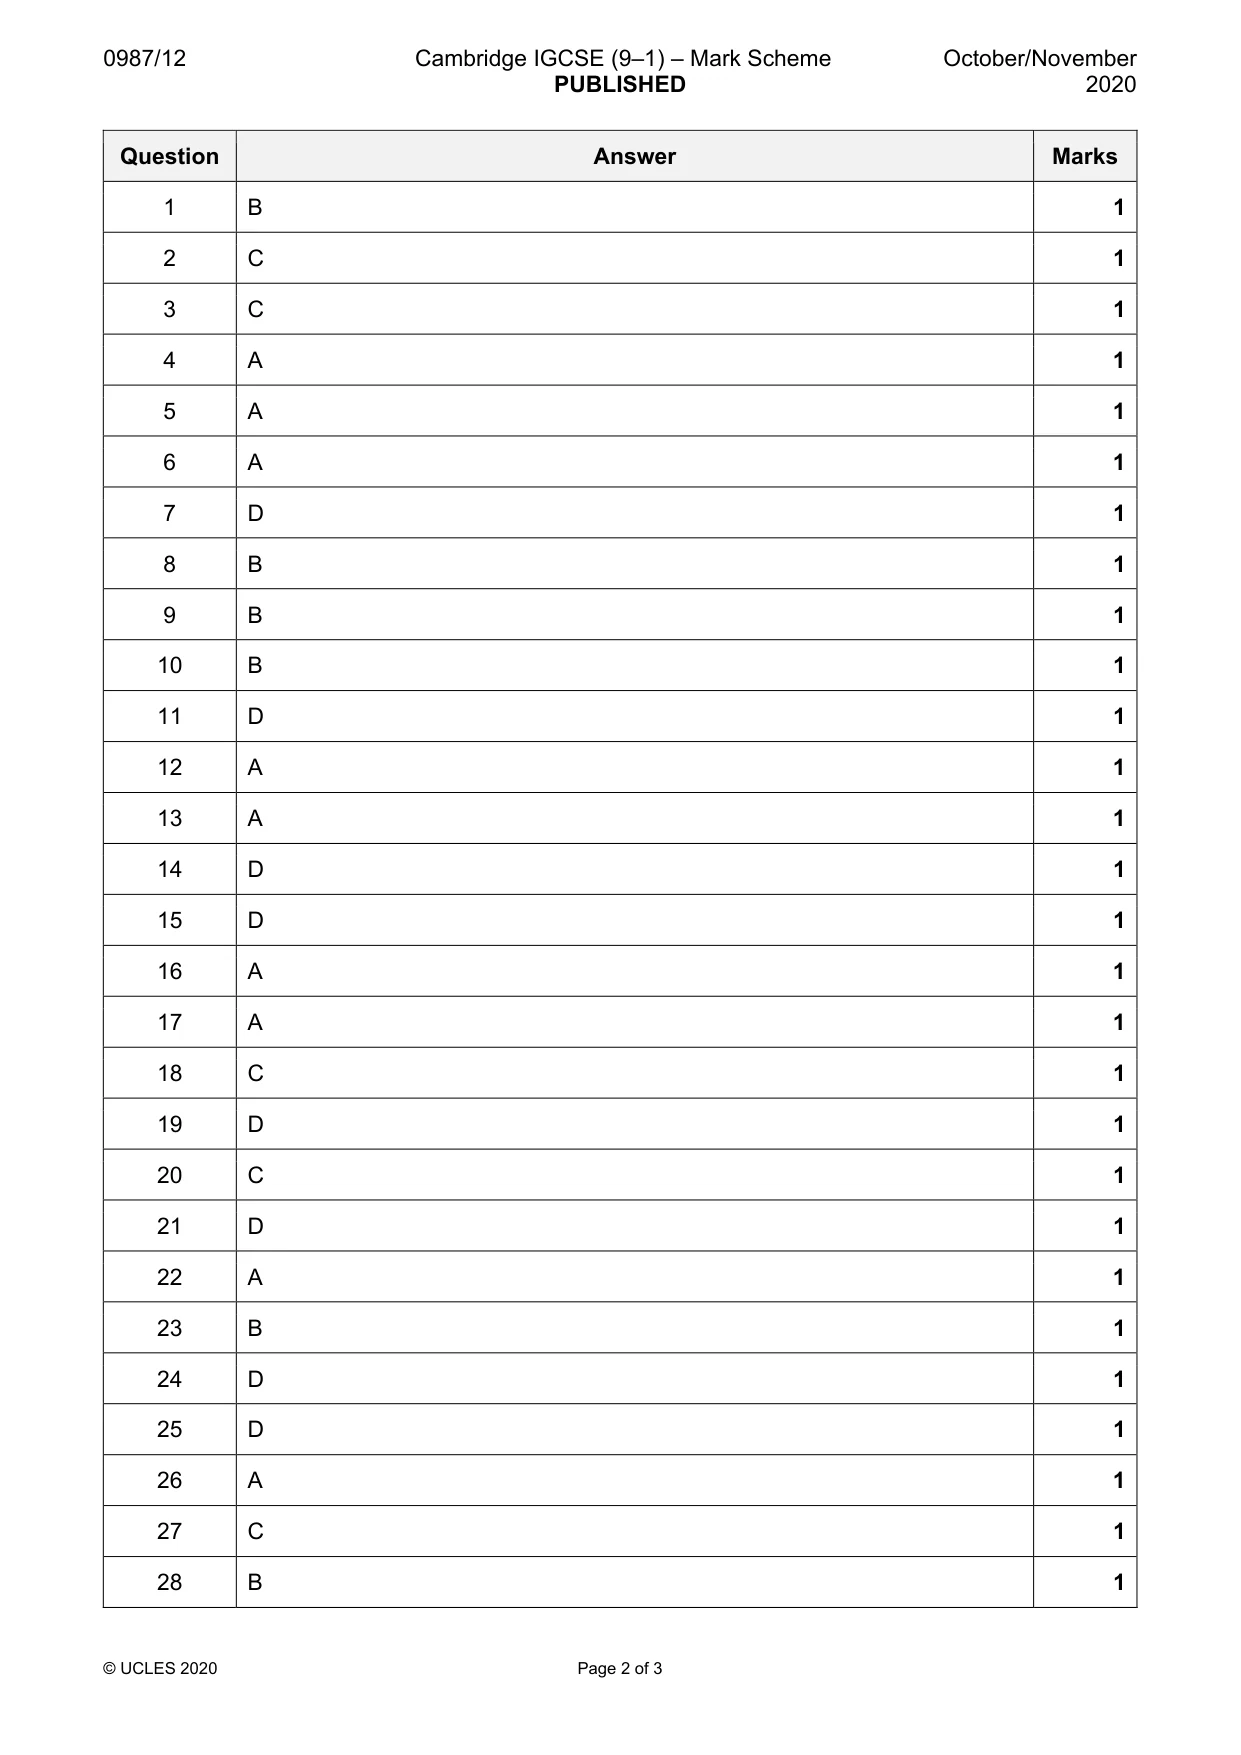
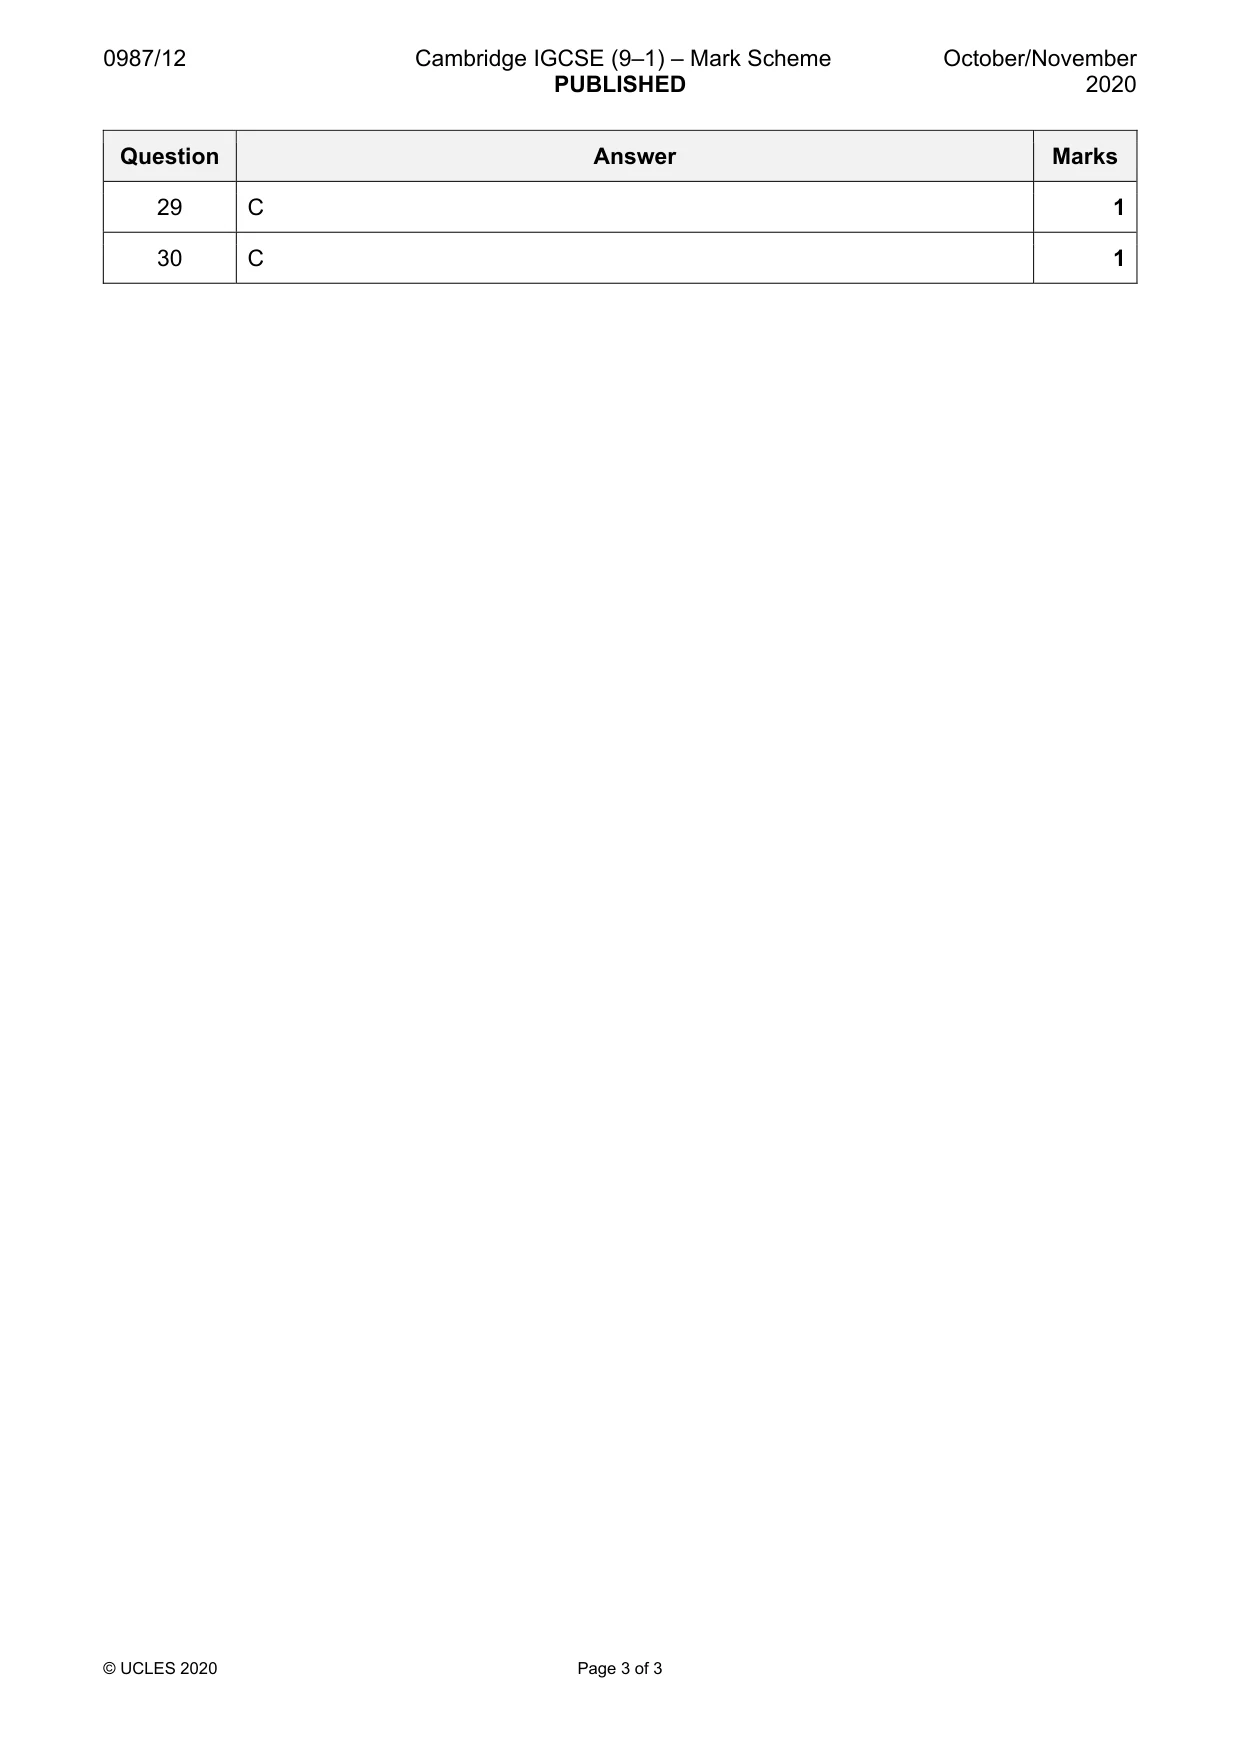
Mark scheme3 pages
Answers below. Sit the paper first if you are practising.
Questions as text
Q1 · What causes economic agents to make choices?
1 What causes economic agents to make choices? A limited needs and wants B the existence of finite resources C the existence of free goods D the market mechanism
Mark scheme: B
Q2 · Which combination of a factor of production and its factor income is not correct?
2 Which combination of a factor of production and its factor income is not correct? factor of factor income production A capital interest B enterprise profit C labour dividends D land rent
Mark scheme: C
Q3 · The diagram shows a production possibility curve (PPC) for a country
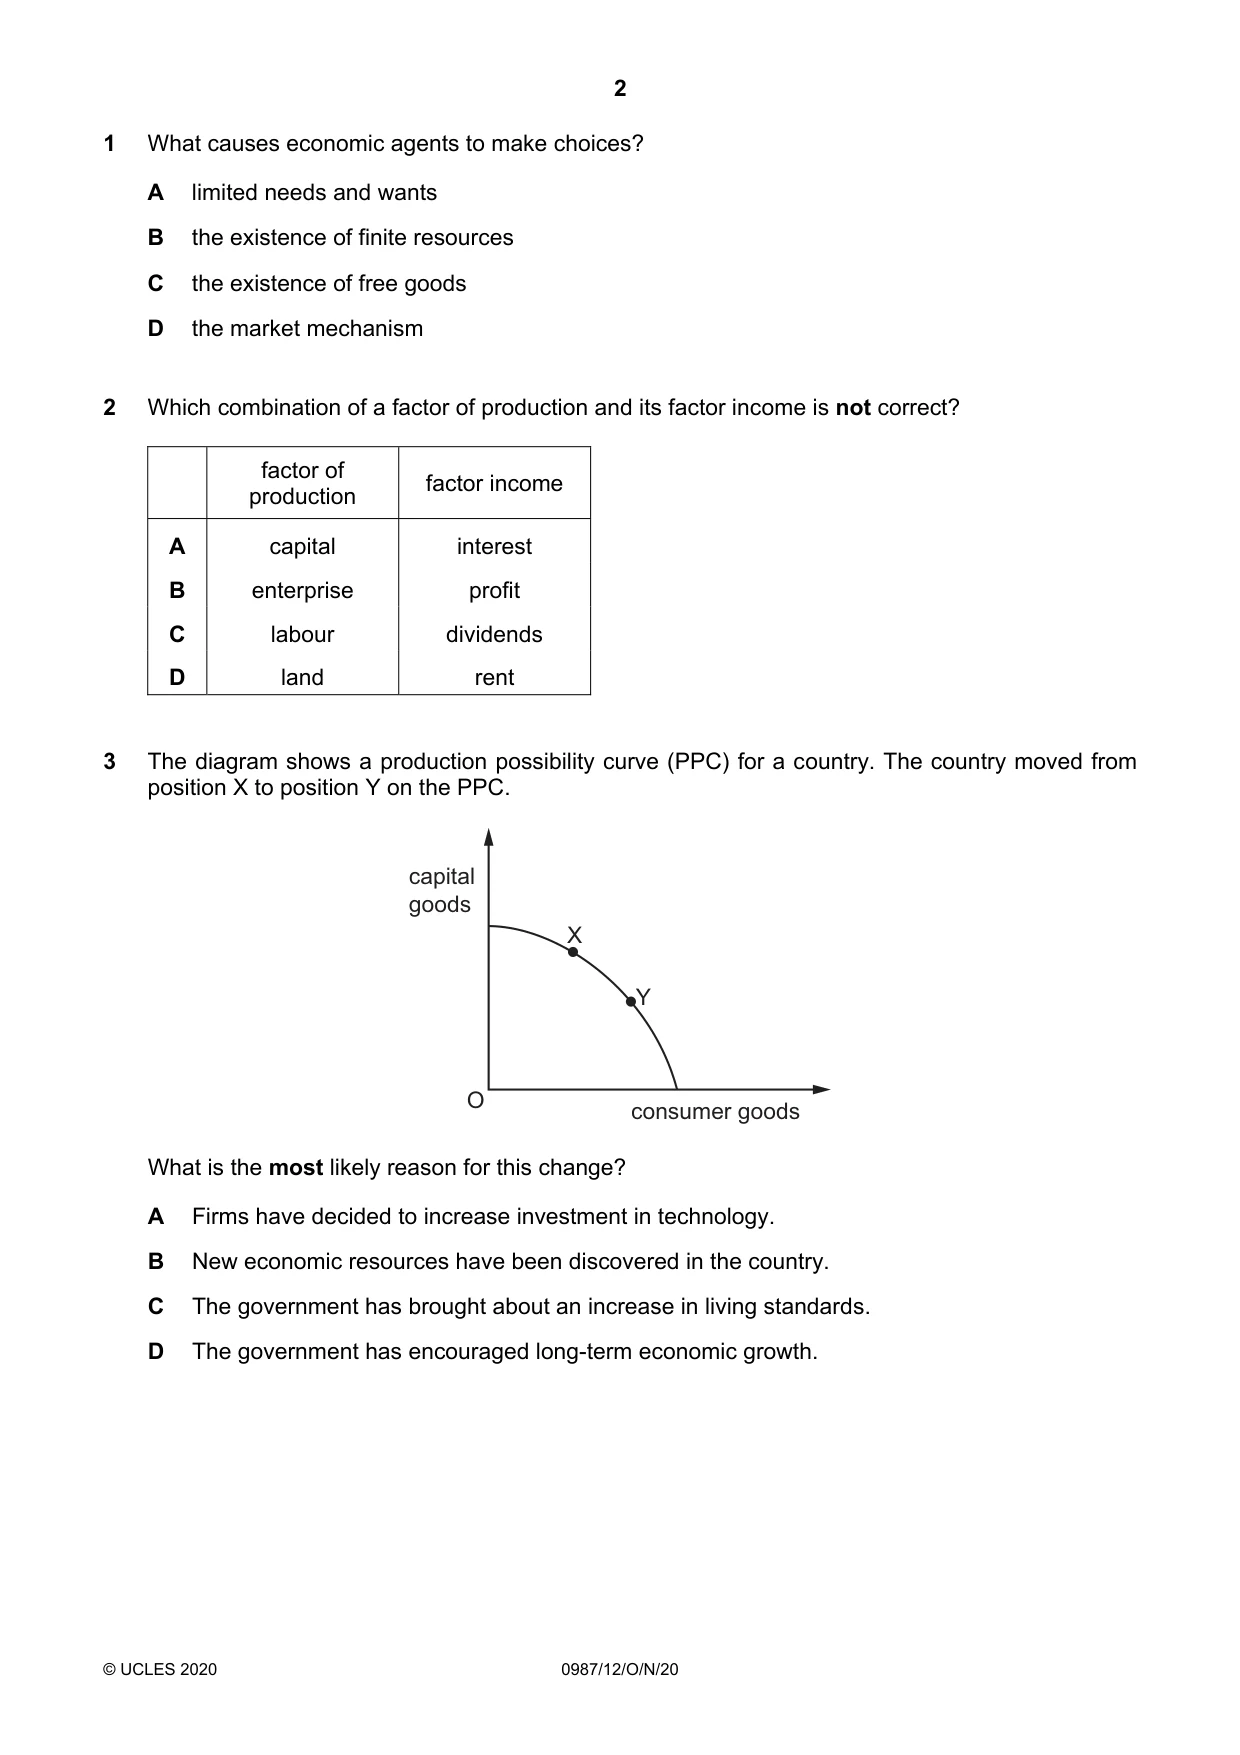
3 The diagram shows a production possibility curve (PPC) for a country. The country moved from position X to position Y on the PPC. capital goods X Y O consumer goods What is the most likely reason for this change? A Firms have decided to increase investment in technology. B New economic resources have been discovered in the country. C The government has brought about an increase in living standards. D The government has encouraged long-term economic growth.
Mark scheme: C
More questions on Production possibility curve (PPC) diagrams
Q4 · What is an example of a macroeconomic aim?
4 What is an example of a macroeconomic aim? A to create and maintain full employment B to improve efficiency in the manufacturing sector of the economy C to provide consumers with greater information when buying goods and services D to encourage greater occupational mobility of labour
Mark scheme: A
Q5 · Why might a market economy fail to achieve the best use of scarce resources?
5 Why might a market economy fail to achieve the best use of scarce resources? A Consumers may lack information about which good to buy. B Demerit goods are underconsumed. C Public goods are overconsumed. D Most resources are owned by the government.
Mark scheme: A
Q6 · The diagram shows the global market for copper with an equilibrium point of X
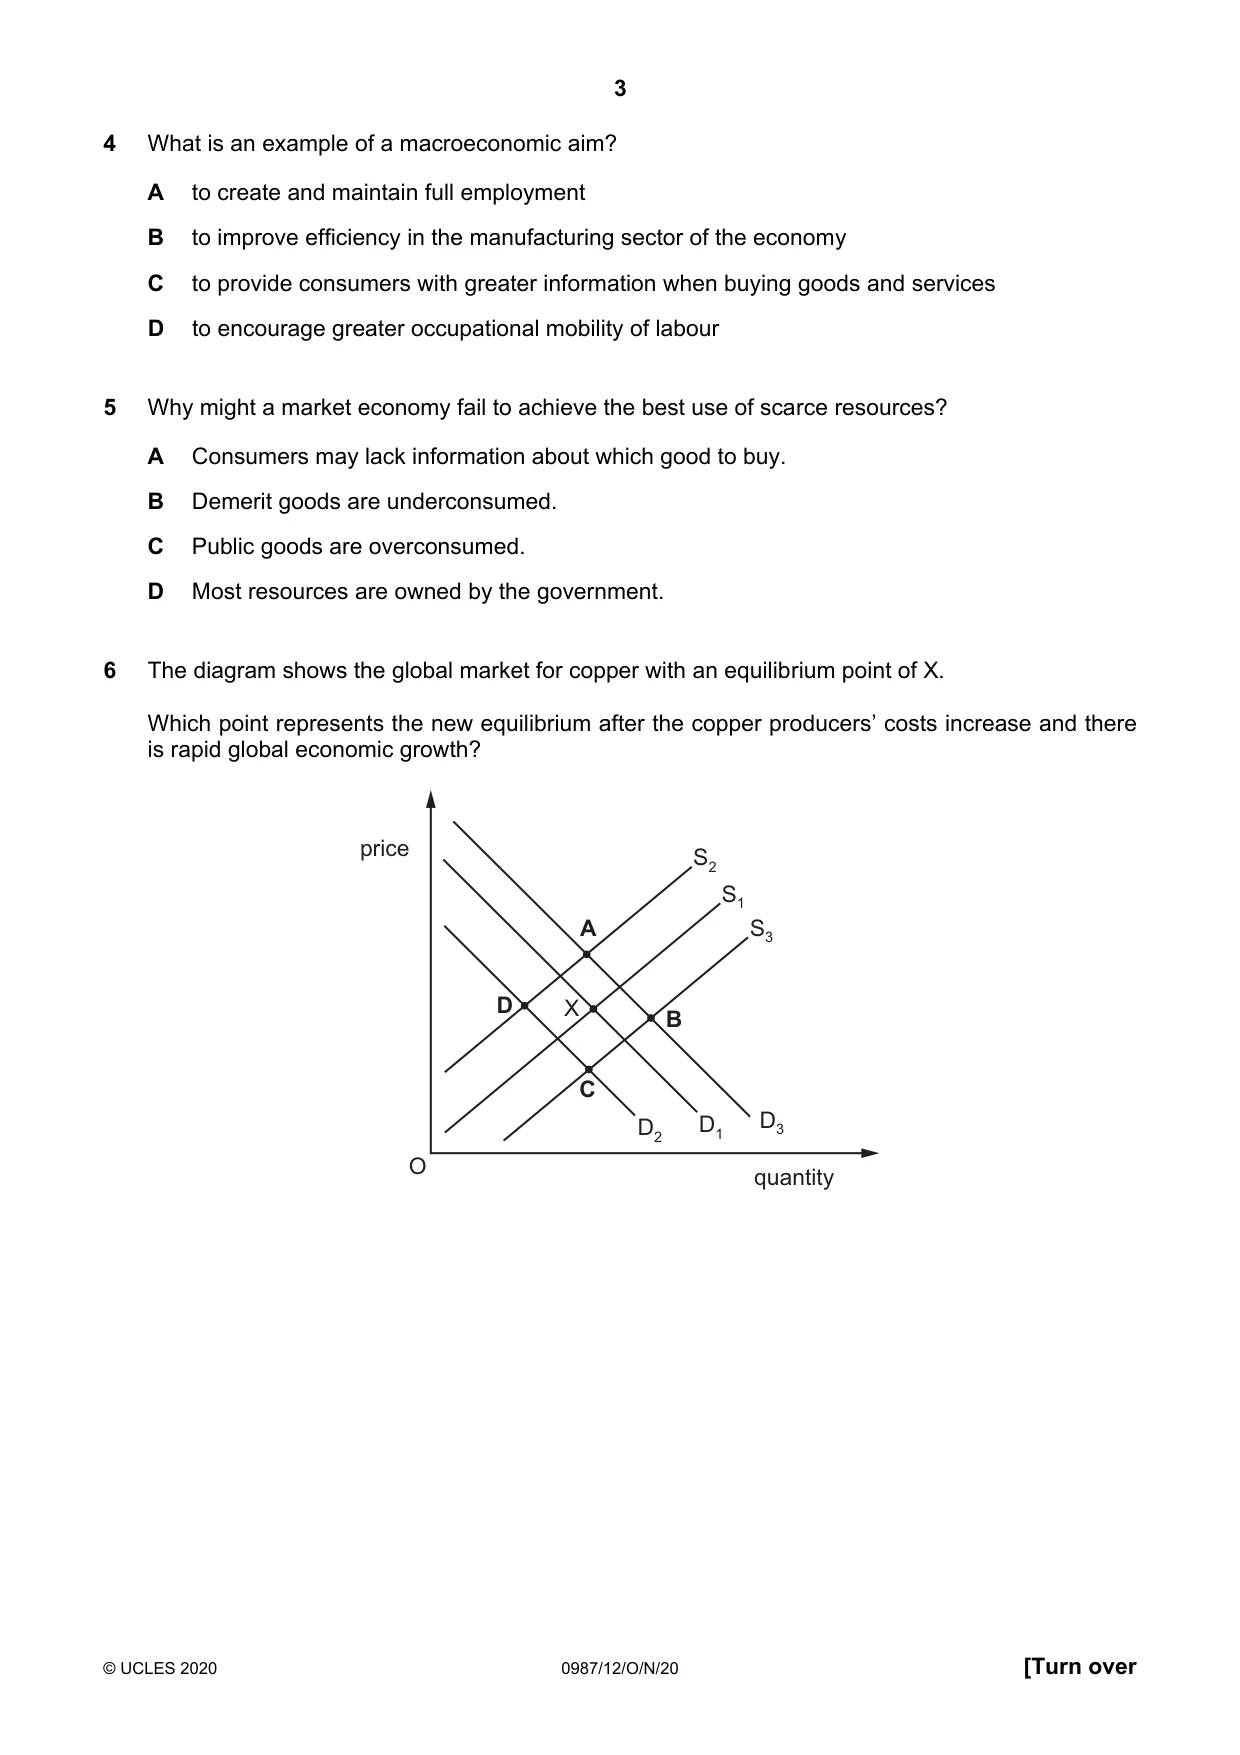
6 The diagram shows the global market for copper with an equilibrium point of X. Which point represents the new equilibrium after the copper producers’ costs increase and there is rapid global economic growth? price S2 S1 A S3 D X B C D2 D1 D3 O quantity
Mark scheme: A
Q7 · The diagram shows the supply curve for a good
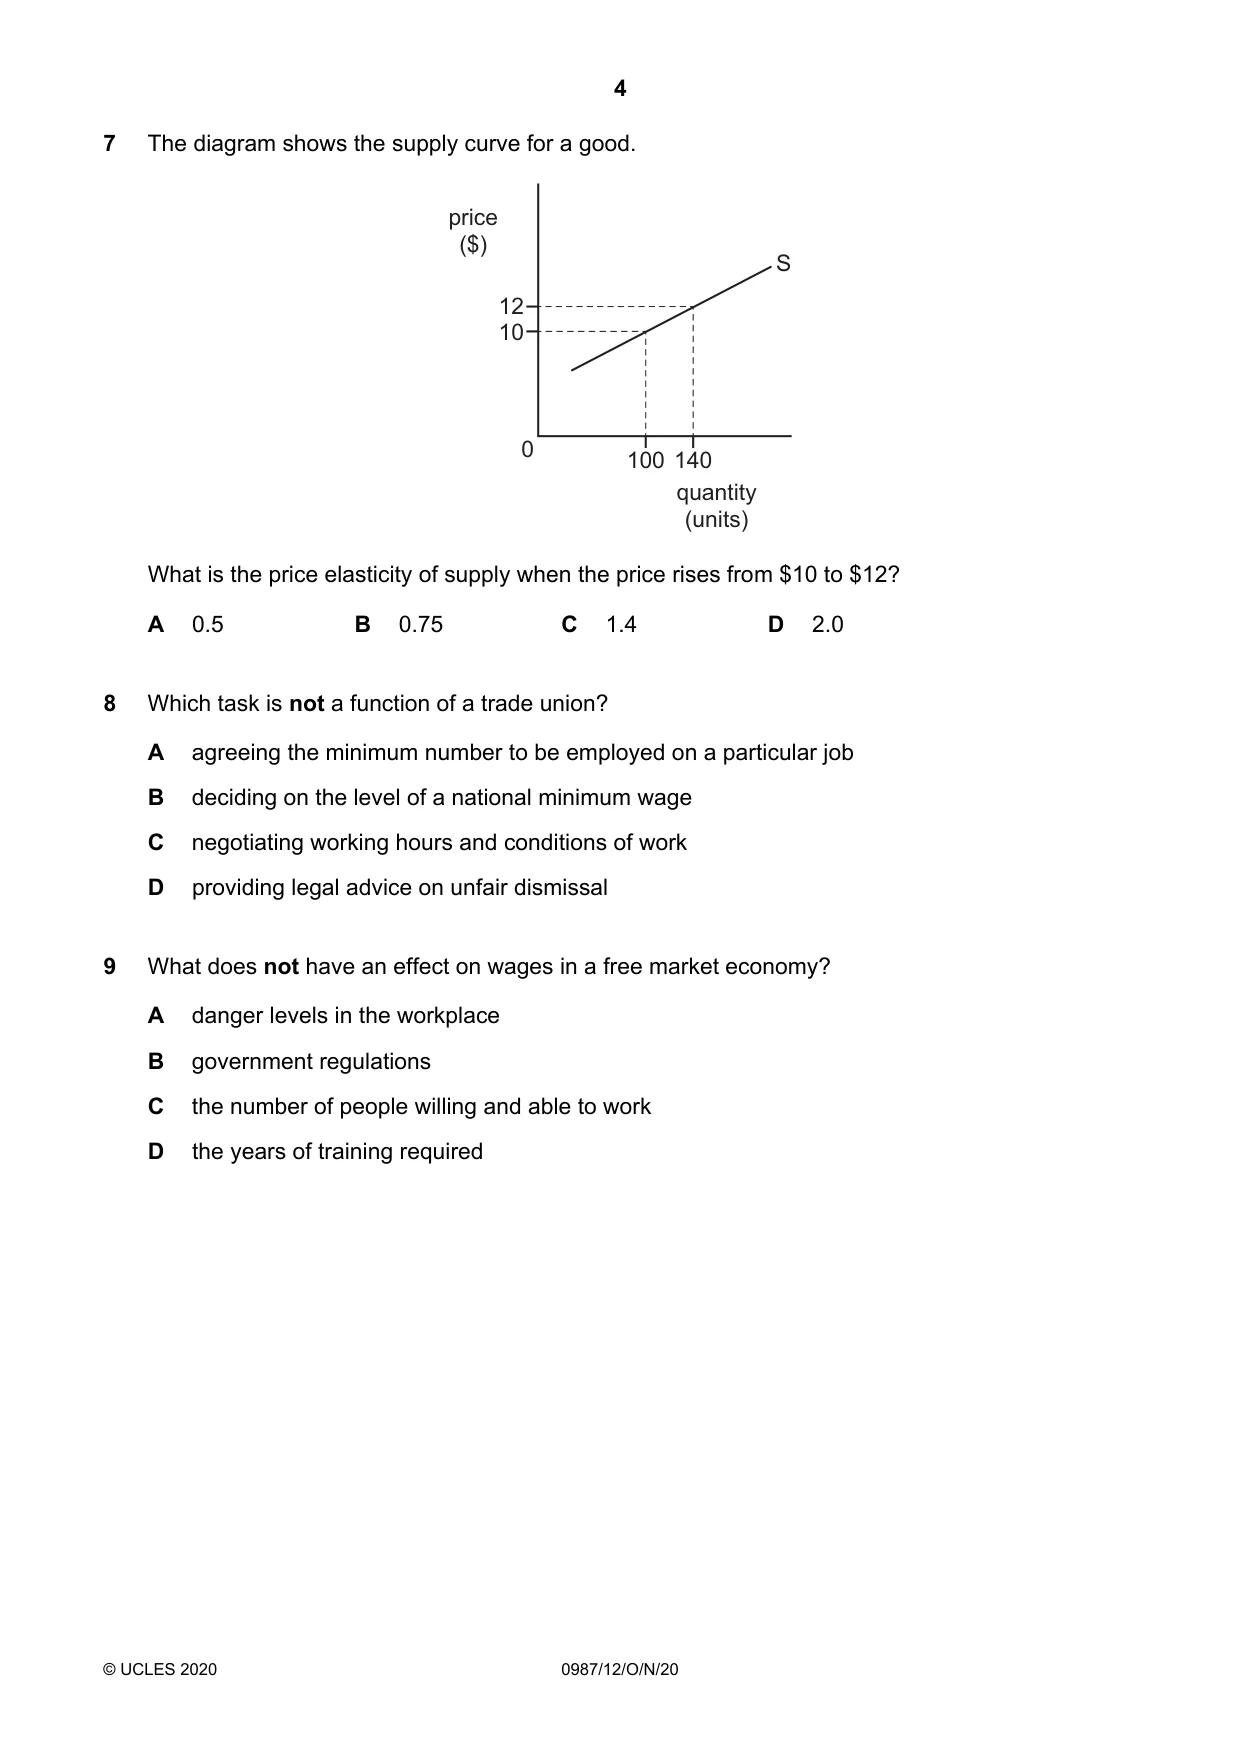
7 The diagram shows the supply curve for a good. price ($) S 12 10 0 100 140 quantity (units) What is the price elasticity of supply when the price rises from $10 to $12? A 0.5 B 0.75 C 1.4 D 2.0
Mark scheme: D
Q8 · Which task is not a function of a trade union?
8 Which task is not a function of a trade union? A agreeing the minimum number to be employed on a particular job B deciding on the level of a national minimum wage C negotiating working hours and conditions of work D providing legal advice on unfair dismissal
Mark scheme: B
Q9 · What does not have an effect on wages in a free market economy?
9 What does not have an effect on wages in a free market economy? A danger levels in the workplace B government regulations C the number of people willing and able to work D the years of training required
Mark scheme: B
Q10 · The table shows how household spending changes with income
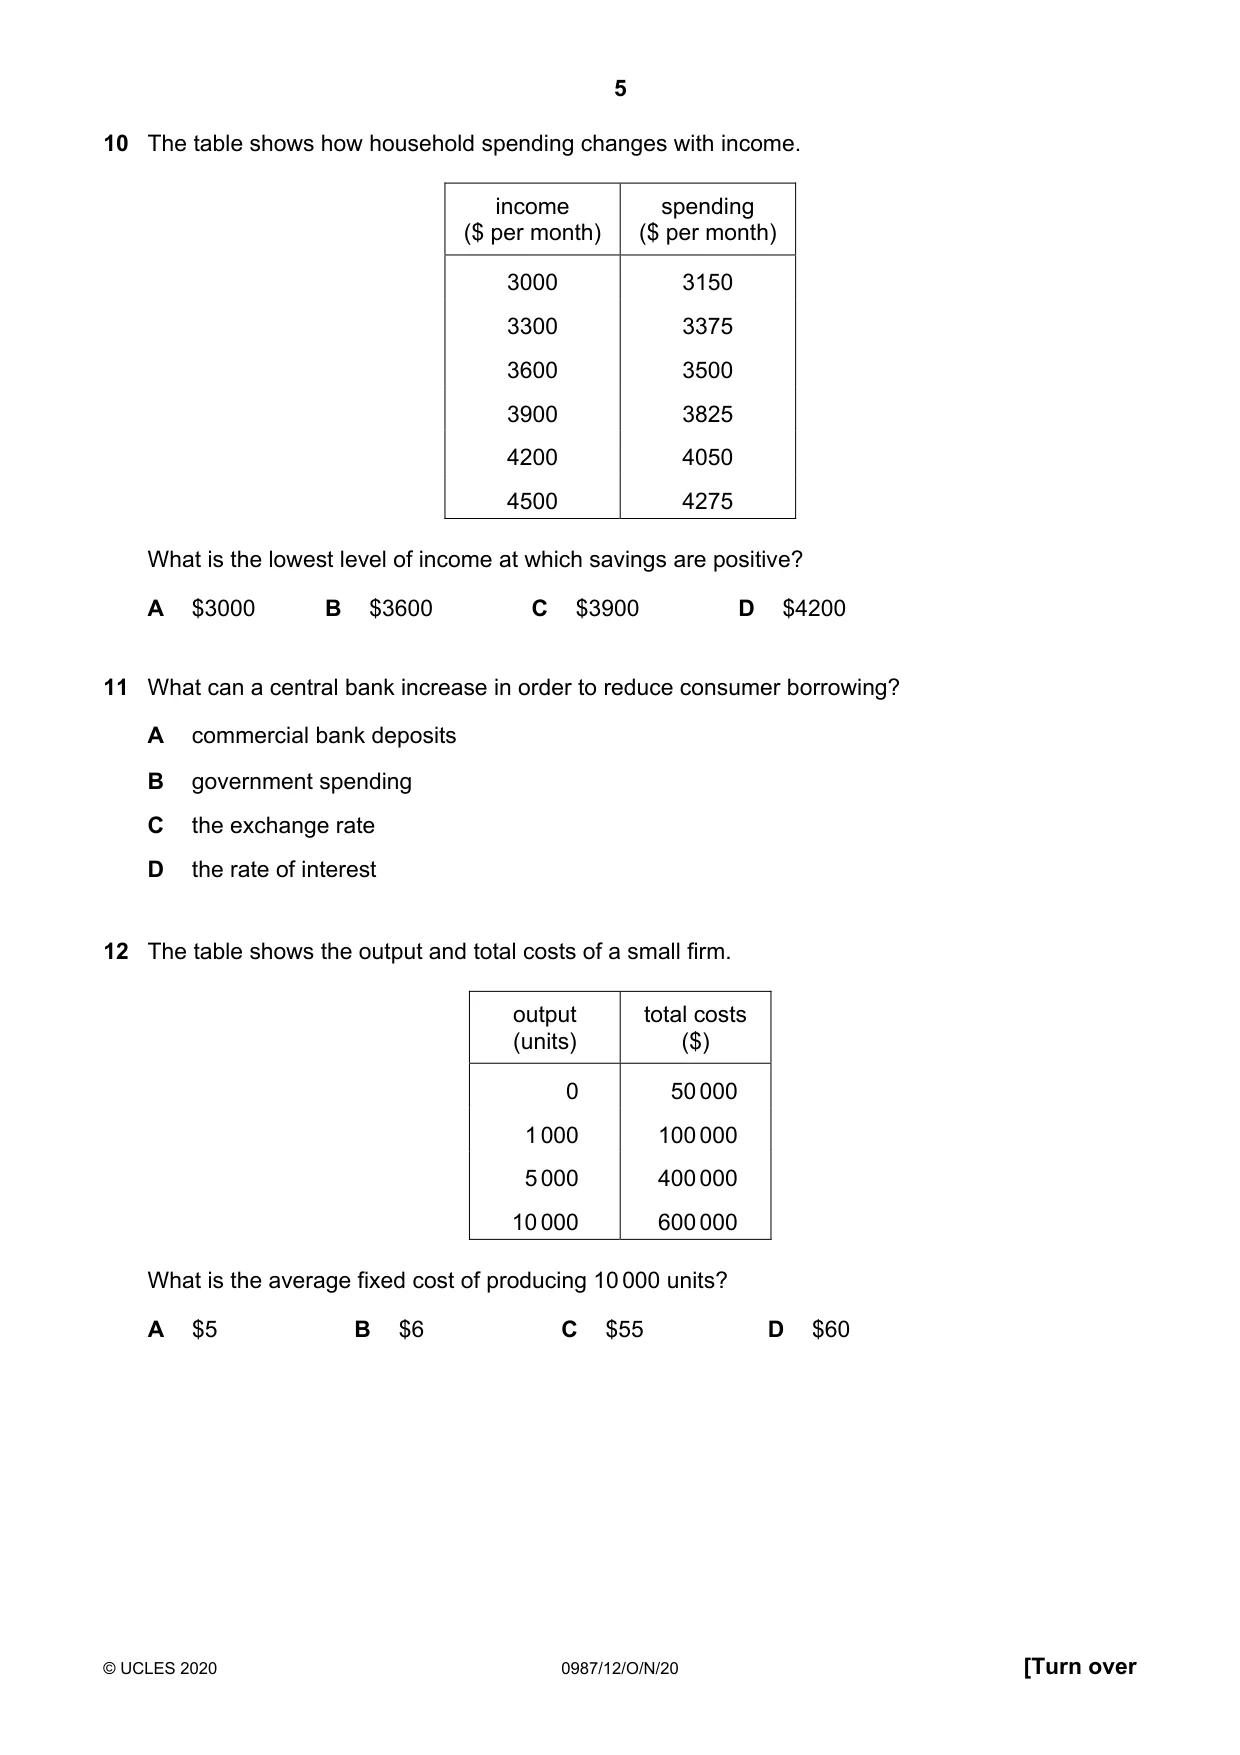
10 The table shows how household spending changes with income. income spending ($ per month) ($ per month) 3000 3150 3300 3375 3600 3500 3900 3825 4200 4050 4500 4275 What is the lowest level of income at which savings are positive? A $3000 B $3600 C $3900 D $4200
Mark scheme: B
Q11 · What can a central bank increase in order to reduce consumer borrowing?
11 What can a central bank increase in order to reduce consumer borrowing? A commercial bank deposits B government spending C the exchange rate D the rate of interest
Mark scheme: D
Q12 · The table shows the output and total costs of a small firm
12 The table shows the output and total costs of a small firm. output total costs (units) ($) 0 50 000 1 000 100 000 5 000 400 000 10 000 600 000 What is the average fixed cost of producing 10 000 units? A $5 B $6 C $55 D $60
Mark scheme: A
Q13 · A firm has fixed costs of $1000
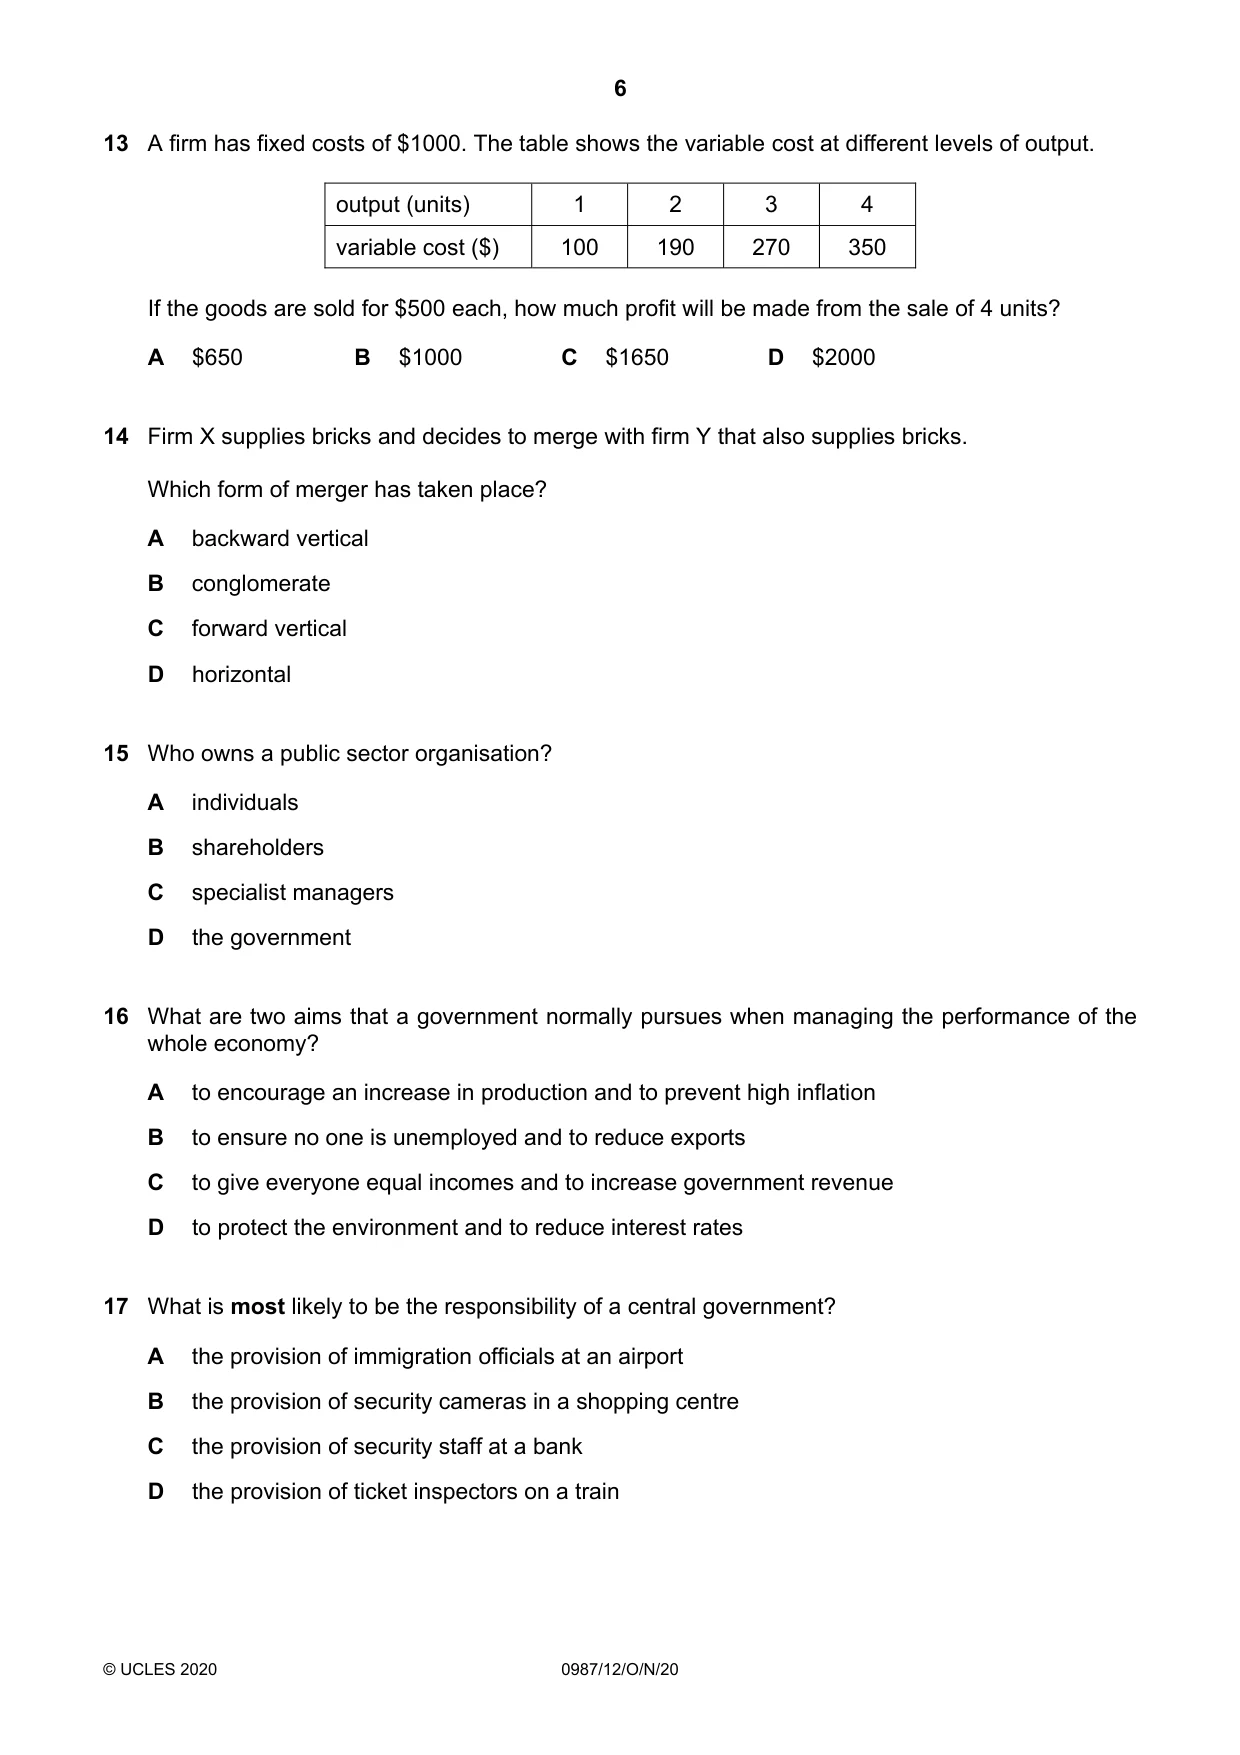
13 A firm has fixed costs of $1000. The table shows the variable cost at different levels of output. output (units) 1 2 3 4 variable cost ($) 100 190 270 350 If the goods are sold for $500 each, how much profit will be made from the sale of 4 units? A $650 B $1000 C $1650 D $2000
Mark scheme: A
Q14 · Firm X supplies bricks and decides to merge with firm Y that also supplies bricks
14 Firm X supplies bricks and decides to merge with firm Y that also supplies bricks. Which form of merger has taken place? A backward vertical B conglomerate C forward vertical D horizontal
Mark scheme: D
Q15 · Who owns a public sector organisation?
15 Who owns a public sector organisation? A individuals B shareholders C specialist managers D the government
Mark scheme: D
Q16 · What are two aims that a government normally pursues when managing the performance of the…
16 What are two aims that a government normally pursues when managing the performance of the whole economy? A to encourage an increase in production and to prevent high inflation B to ensure no one is unemployed and to reduce exports C to give everyone equal incomes and to increase government revenue D to protect the environment and to reduce interest rates
Mark scheme: A
Q17 · What is most likely to be the responsibility of a central government?
17 What is most likely to be the responsibility of a central government? A the provision of immigration officials at an airport B the provision of security cameras in a shopping centre C the provision of security staff at a bank D the provision of ticket inspectors on a train
Mark scheme: A
Q18 · The table shows the tax that an individual would pay at different levels of disposable…
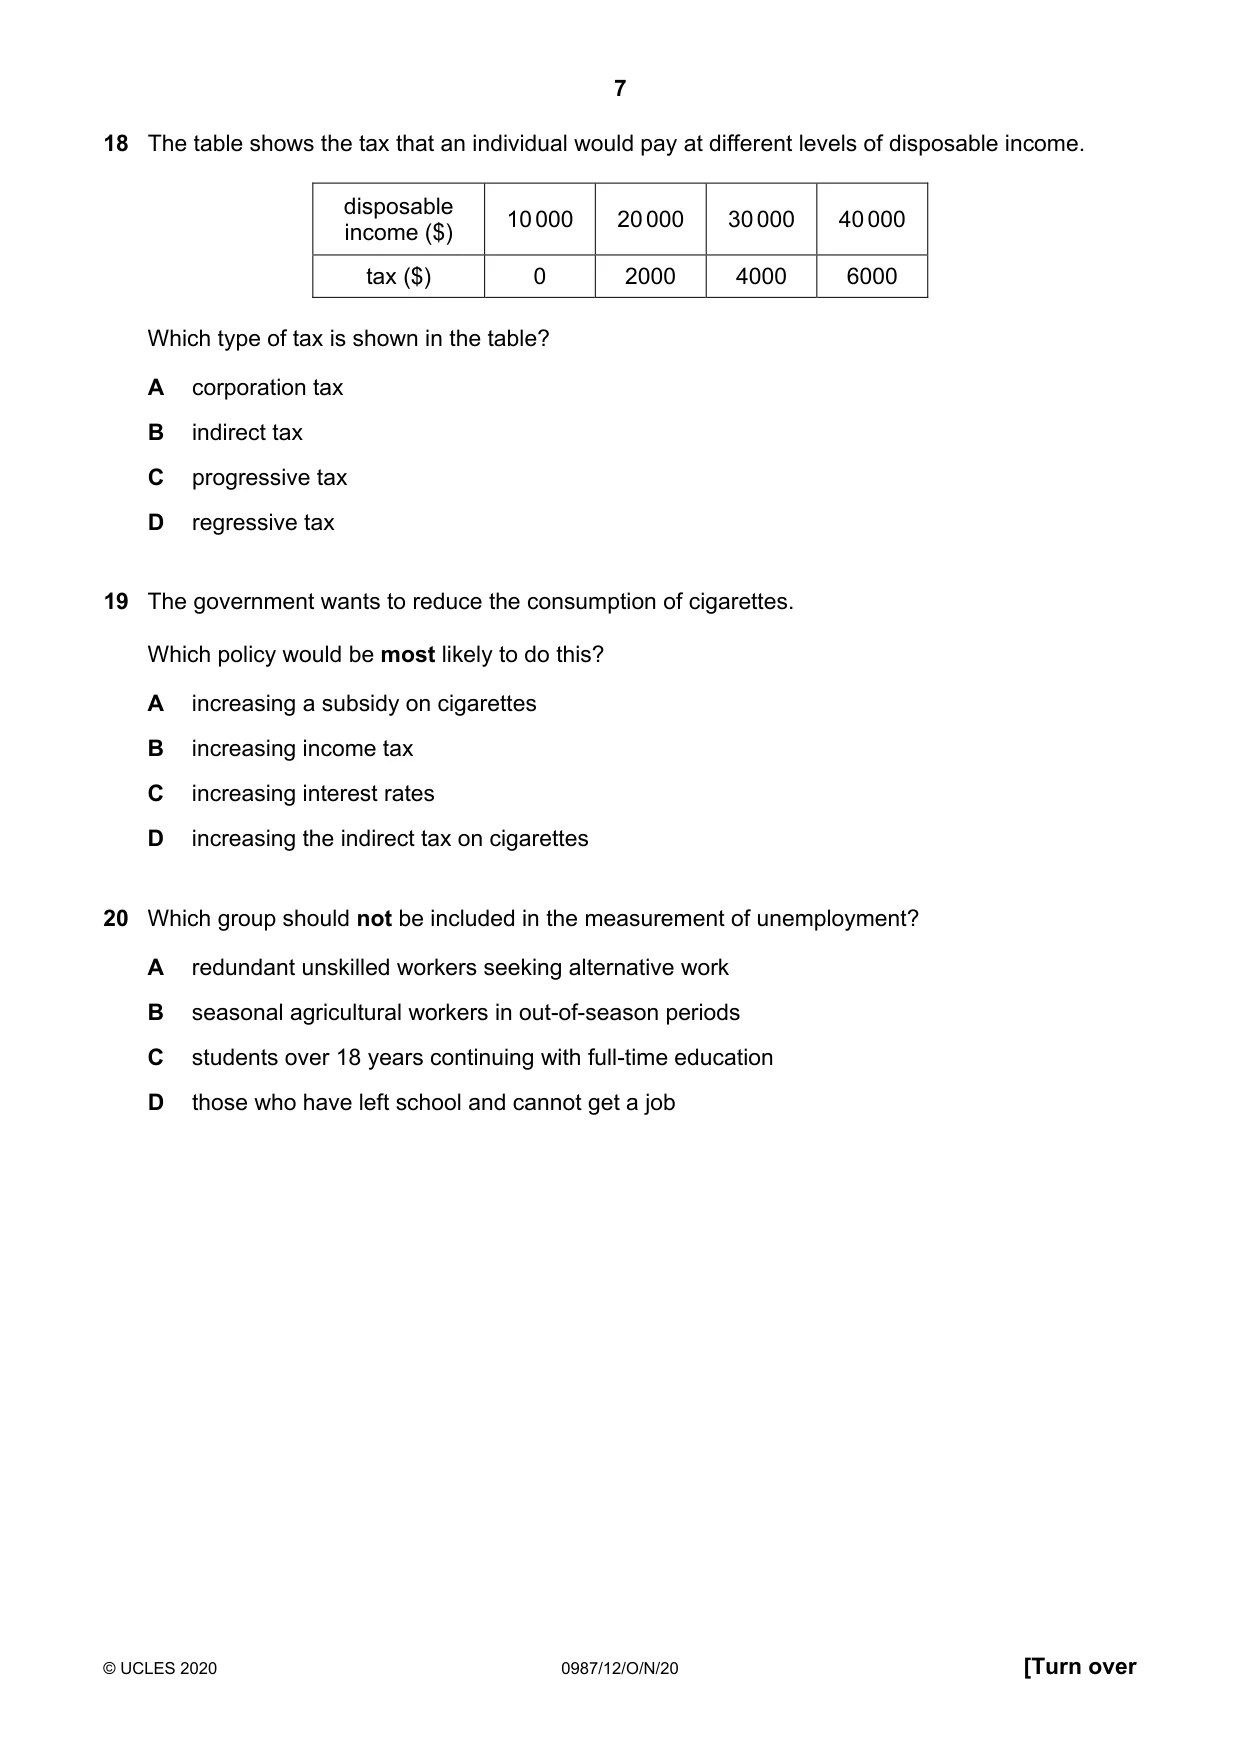
18 The table shows the tax that an individual would pay at different levels of disposable income. disposable 10 000 20 000 30 000 40 000 income ($) tax ($) 0 2000 4000 6000 Which type of tax is shown in the table? A corporation tax B indirect tax C progressive tax D regressive tax
Mark scheme: C
Q19 · The government wants to reduce the consumption of cigarettes
19 The government wants to reduce the consumption of cigarettes. Which policy would be most likely to do this? A increasing a subsidy on cigarettes B increasing income tax C increasing interest rates D increasing the indirect tax on cigarettes
Mark scheme: D
Q20 · Which group should not be included in the measurement of unemployment?
20 Which group should not be included in the measurement of unemployment? A redundant unskilled workers seeking alternative work B seasonal agricultural workers in out-of-season periods C students over 18 years continuing with full-time education D those who have left school and cannot get a job
Mark scheme: C
Q21 · The table shows the rates of unemployment and real GDP growth for an economy in 2014 and…
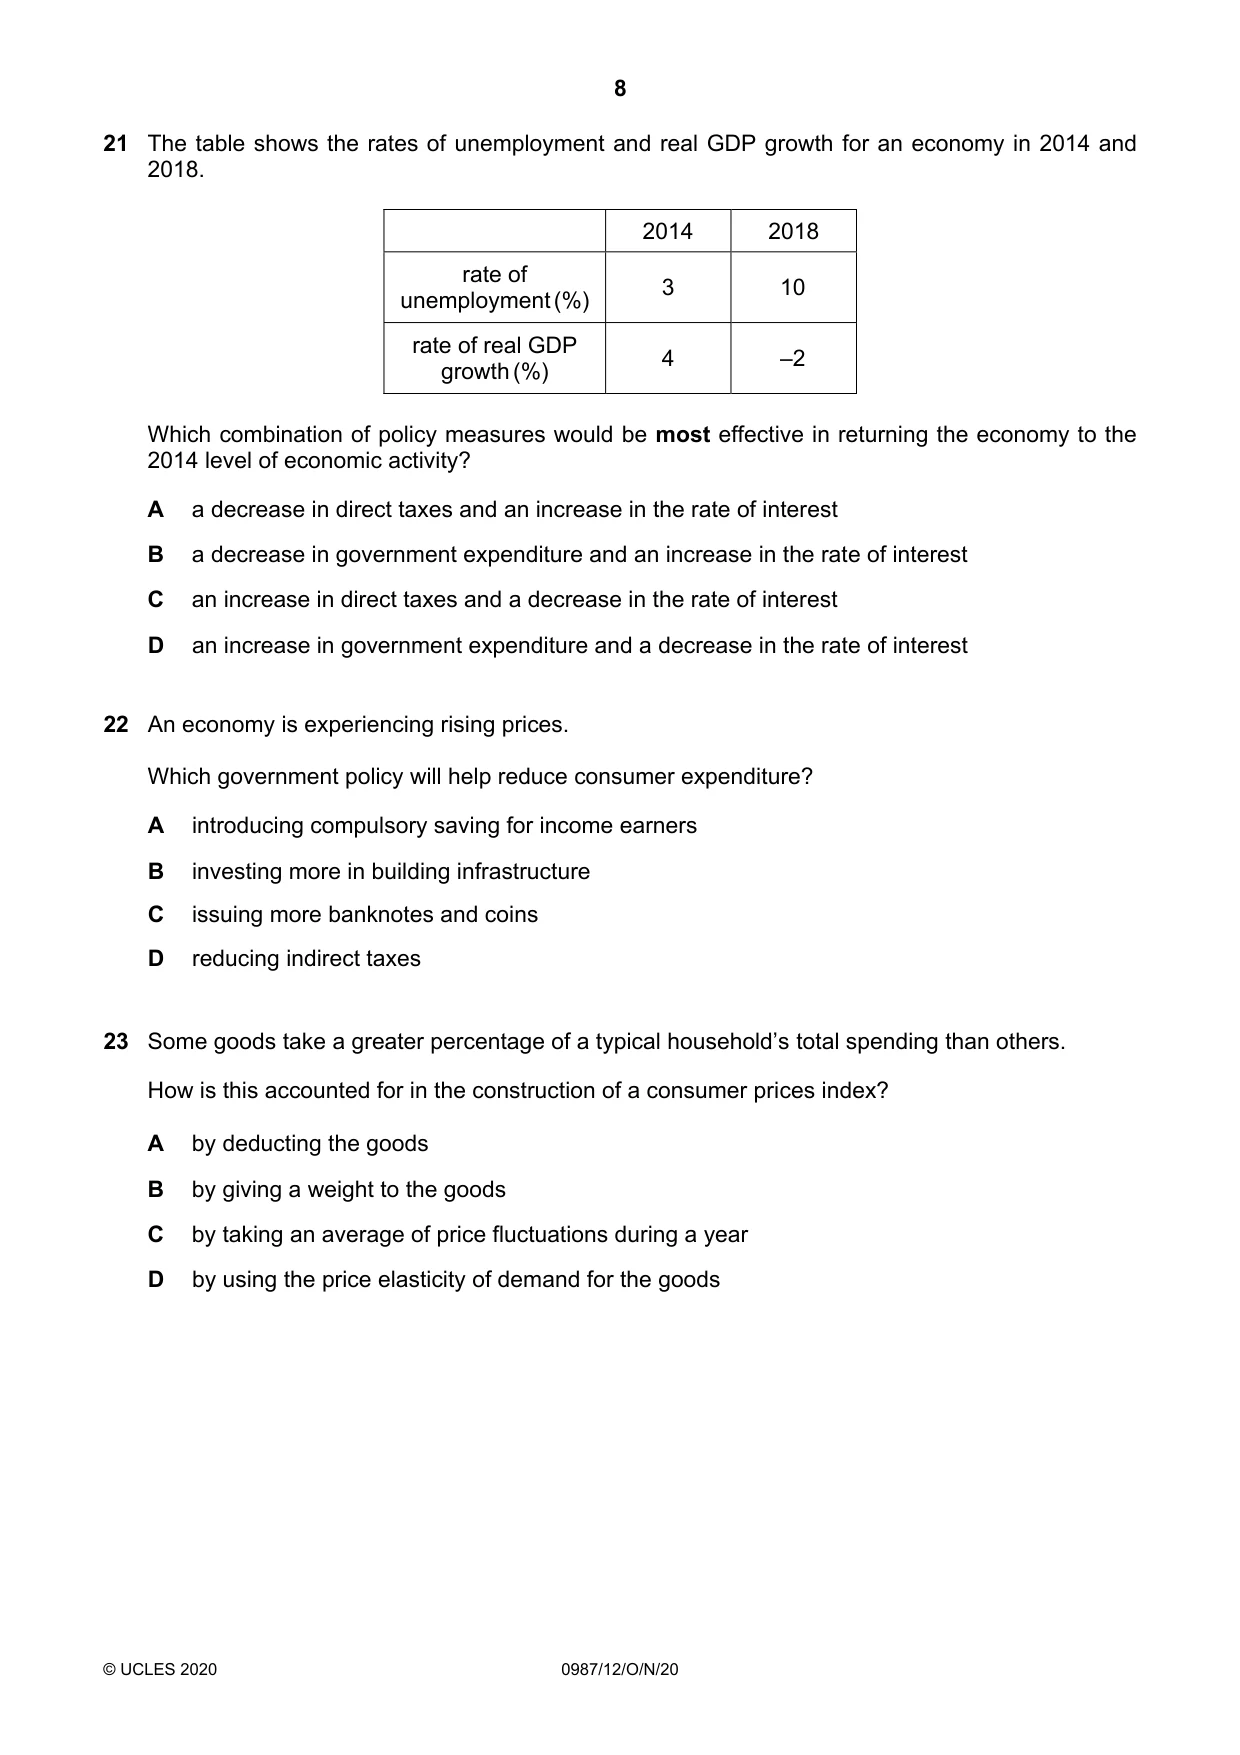
21 The table shows the rates of unemployment and real GDP growth for an economy in 2014 and 2018. 2014 2018 rate of 3 10 unemployment (%) rate of real GDP 4 –2 growth (%) Which combination of policy measures would be most effective in returning the economy to the 2014 level of economic activity? A a decrease in direct taxes and an increase in the rate of interest B a decrease in government expenditure and an increase in the rate of interest C an increase in direct taxes and a decrease in the rate of interest D an increase in government expenditure and a decrease in the rate of interest
Mark scheme: D
Q22 · An economy is experiencing rising prices
22 An economy is experiencing rising prices. Which government policy will help reduce consumer expenditure? A introducing compulsory saving for income earners B investing more in building infrastructure C issuing more banknotes and coins D reducing indirect taxes
Mark scheme: A
Q23 · Some goods take a greater percentage of a typical household’s total spending than others
23 Some goods take a greater percentage of a typical household’s total spending than others. How is this accounted for in the construction of a consumer prices index? A by deducting the goods B by giving a weight to the goods C by taking an average of price fluctuations during a year D by using the price elasticity of demand for the goods
Mark scheme: B
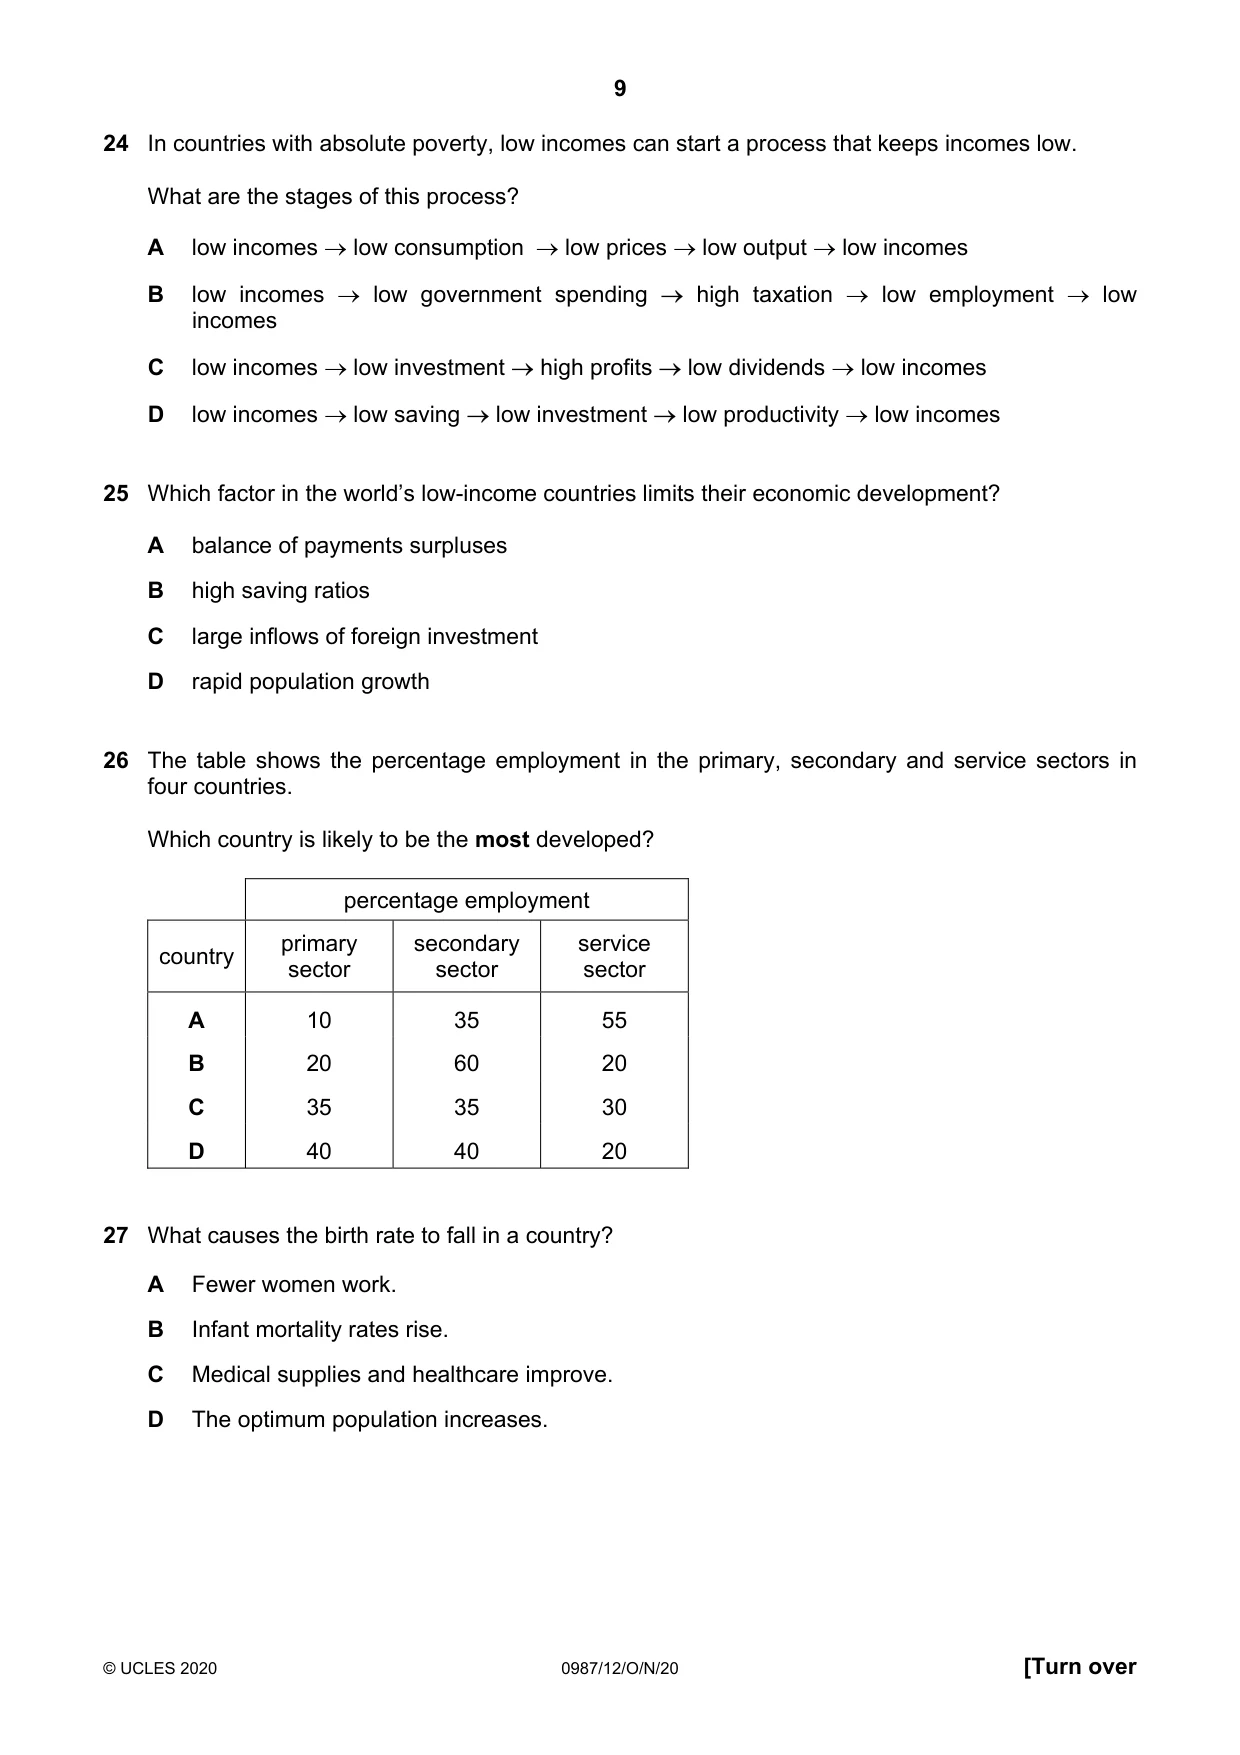
Q24 · In countries with absolute poverty, low incomes can start a process that keeps incomes low
24 In countries with absolute poverty, low incomes can start a process that keeps incomes low. What are the stages of this process? A low incomes low consumption low prices low output low incomes B low incomes low government spending high taxation low employment low incomes C low incomes low investment high profits low dividends low incomes D low incomes low saving low investment low productivity low incomes
Mark scheme: D
Q25 · Which factor in the world’s low-income countries limits their economic development?
25 Which factor in the world’s low-income countries limits their economic development? A balance of payments surpluses B high saving ratios C large inflows of foreign investment D rapid population growth
Mark scheme: D
More questions on Differences in economic development between countries
Q26 · The table shows the percentage employment in the primary, secondary and service sectors…
26 The table shows the percentage employment in the primary, secondary and service sectors in four countries. Which country is likely to be the most developed? percentage employment primary secondary service country sector sector sector A 10 35 55 B 20 60 20 C 35 35 30 D 40 40 20
Mark scheme: A
More questions on Differences in economic development between countries
Q27 · What causes the birth rate to fall in a country?
27 What causes the birth rate to fall in a country? A Fewer women work. B Infant mortality rates rise. C Medical supplies and healthcare improve. D The optimum population increases.
Mark scheme: C
Q28 · A country wishes to increase a current account surplus on the balance of payments
28 A country wishes to increase a current account surplus on the balance of payments. Which action would it take? A abolish an import quota B increase import tariffs C remove export subsidies D tax export producers
Mark scheme: B
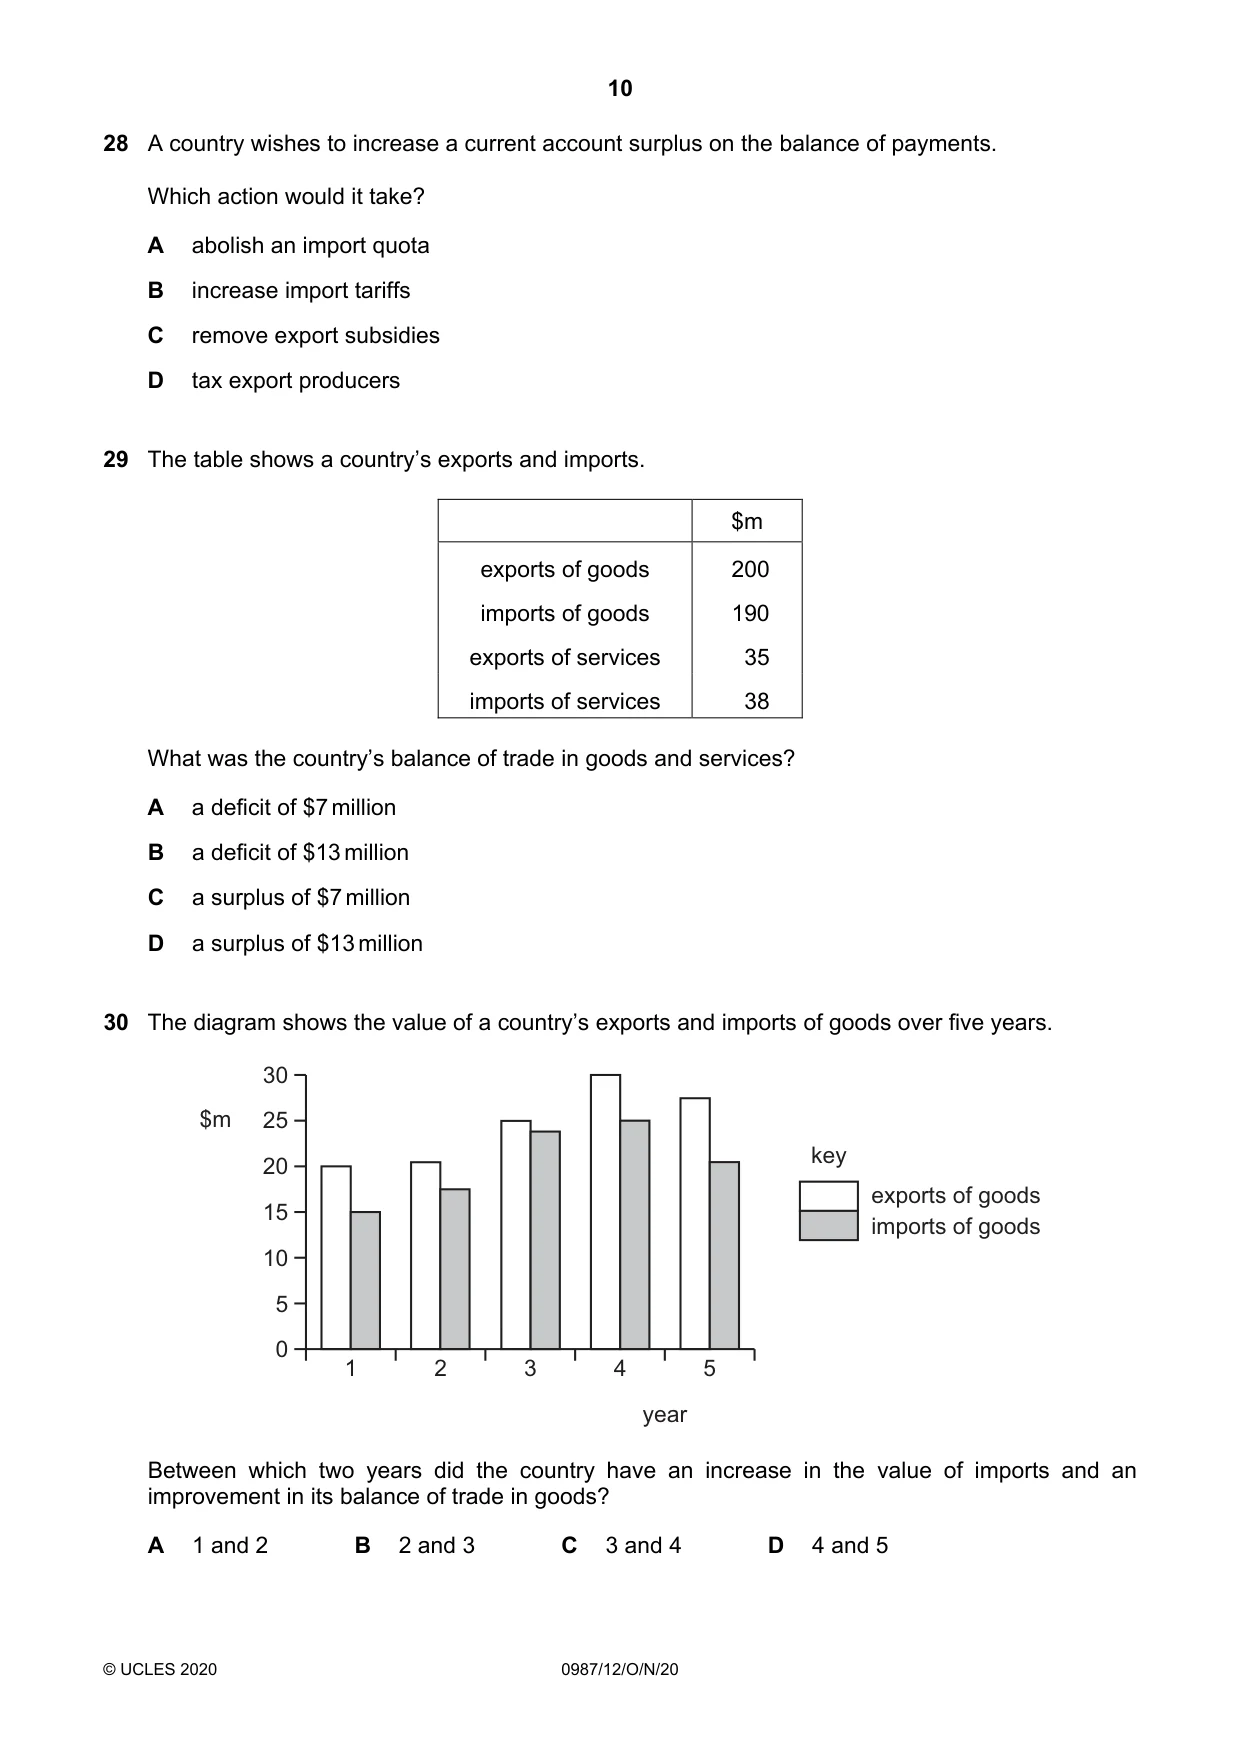
Q29 · The table shows a country’s exports and imports
29 The table shows a country’s exports and imports. $m exports of goods 200 imports of goods 190 exports of services 35 imports of services 38 What was the country’s balance of trade in goods and services? A a deficit of $7 million B a deficit of $13 million C a surplus of $7 million D a surplus of $13 million
Mark scheme: C
More questions on Current account of the balance of payments
Q30 · The diagram shows the value of a country’s exports and imports of goods over five years
30 The diagram shows the value of a country’s exports and imports of goods over five years. 30 $m 25 key 20 exports of goods 15 imports of goods 10 5 0 1 2 3 4 5 year Between which two years did the country have an increase in the value of imports and an improvement in its balance of trade in goods? A 1 and 2 B 2 and 3 C 3 and 4 D 4 and 5
Mark scheme: C
More questions on Current account of the balance of payments
What was in this paper
The subtopics covered by these 30 questions, and how many questions each got. Open one in a new tab to see every Cambridge question on it.
5Current account of the balance of payments2Differences in economic development between countries2Firms’ costs, revenue and objectives2Fiscal policy2Workers2Employment and unemployment1Factors of production1Firms1Globalisation and trade restrictions1Households1Inflation1Market failure1Mixed economic system1Monetary policy1Population1Poverty1Price changes1Price elasticity of supply (PES)1Production possibility curve (PPC) diagrams1The nature of the basic economic problem1What you needed in this session
Cambridge’s own grade thresholds for 2020 Oct/Nov, Paper 1 · Variant 2. A higher threshold means an easier paper — the bar moves with how the cohort did.