Cambridge IGCSE Economics (9-1) 0987 — 2020 May/June Paper 1 · Variant 2
0987/12/M/J/20 · 30 questions · 30 marks · ≈34 min
The question paper and its mark scheme, free to read here and free to download. This is Cambridge’s own paper, exactly as it was sat.
Question paper12 pages

Mark scheme3 pages
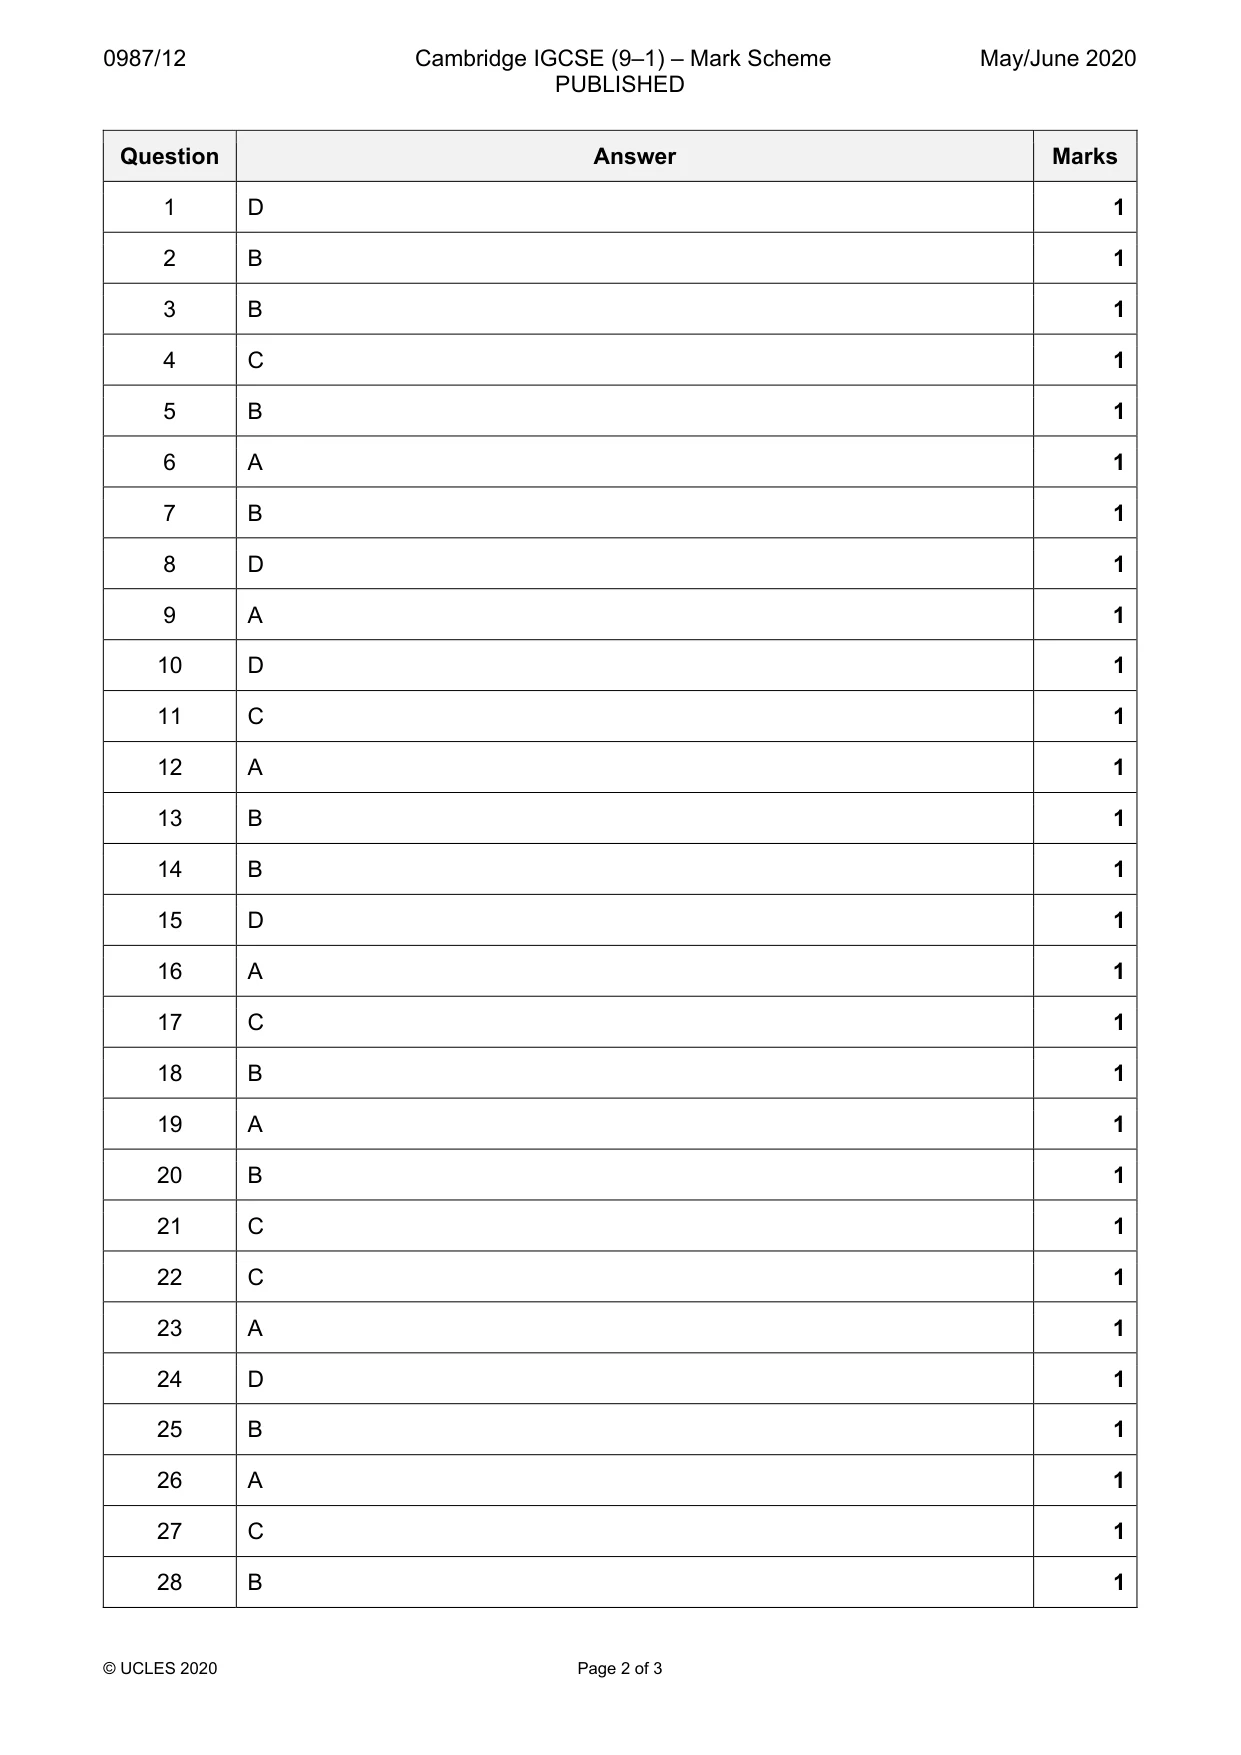
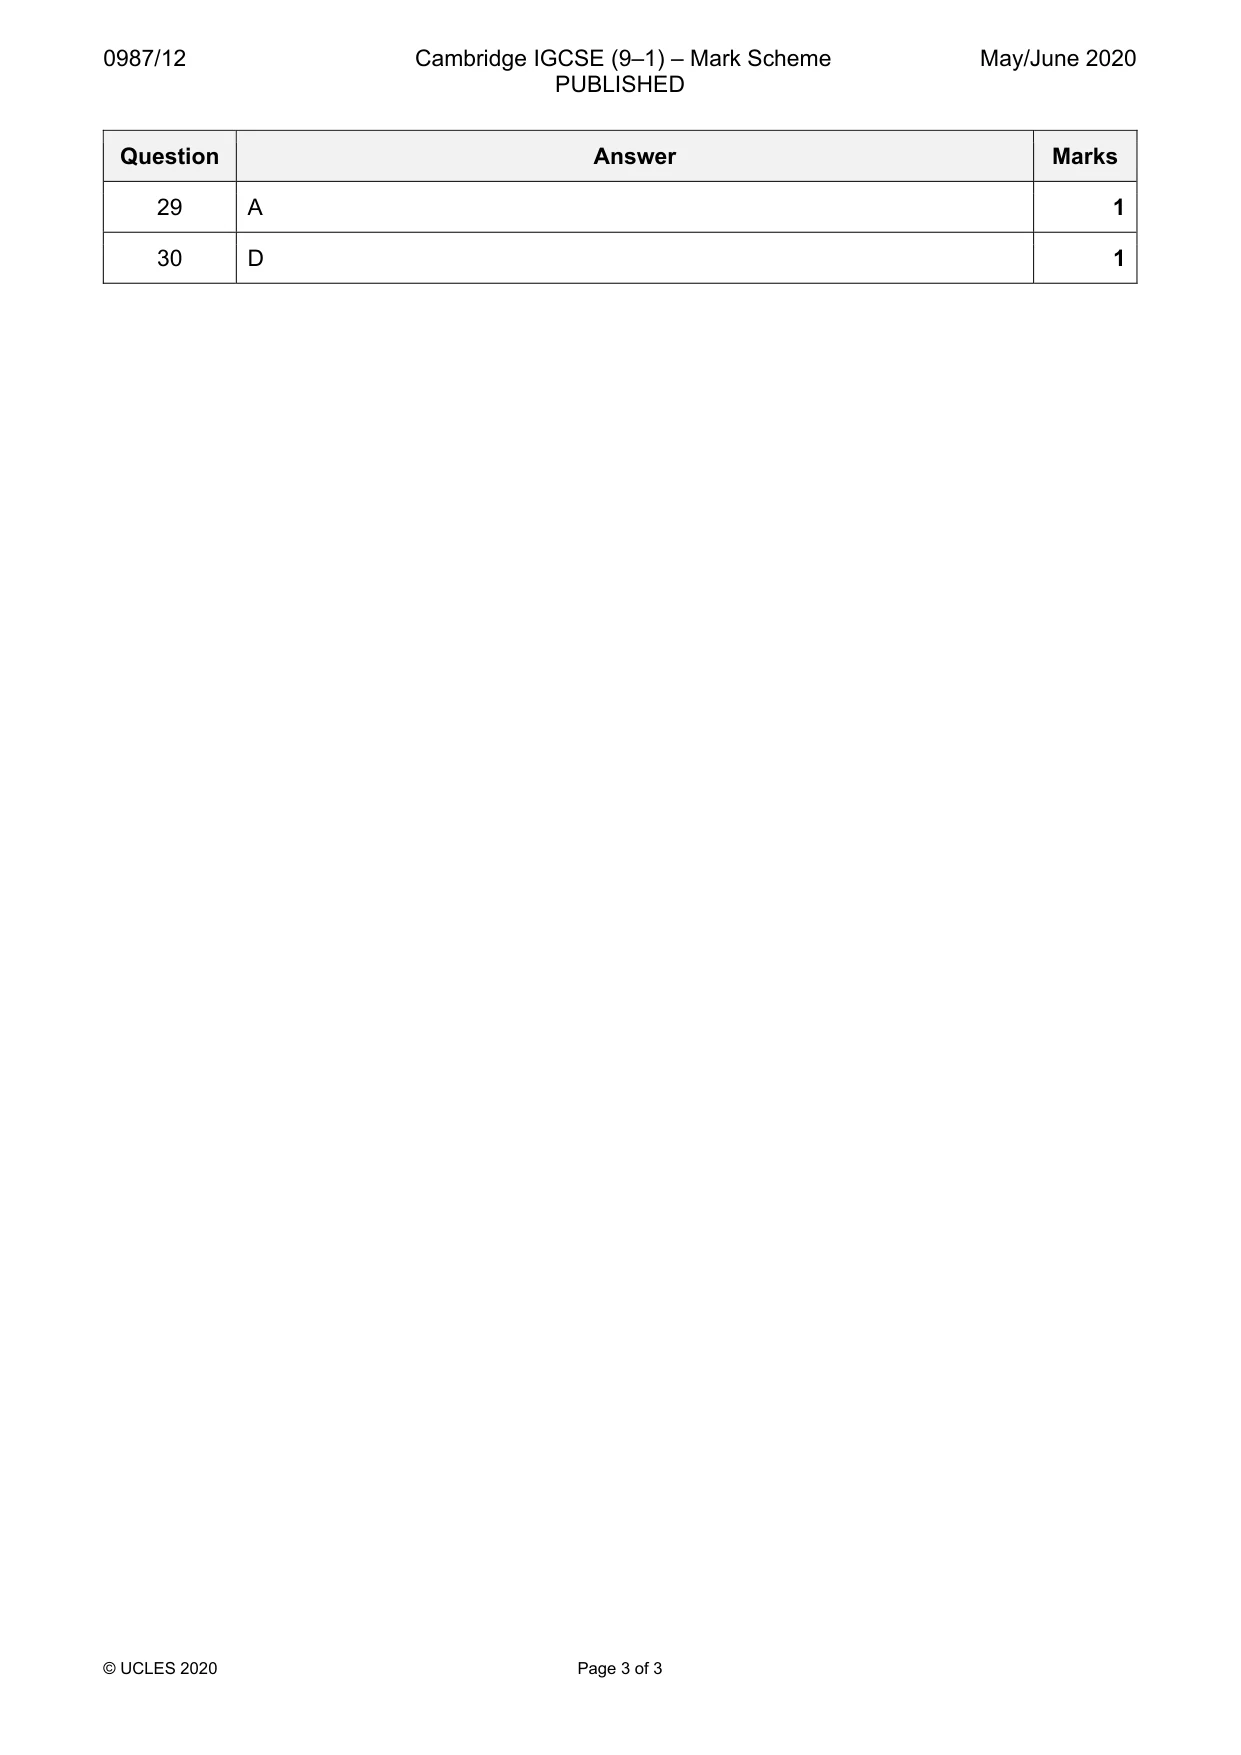
Answers below. Sit the paper first if you are practising.
Questions as text
Q1 · In 2016, 20 billion barrels of oil and 1.6 billion barrels of natural gas were discovered…
1 In 2016, 20 billion barrels of oil and 1.6 billion barrels of natural gas were discovered in Texas, US. Which factor of production has increased in the US due to this discovery? A capital B enterprise C labour D land
Mark scheme: D
Q2 · The diagram shows a production possibility curve (PPC)
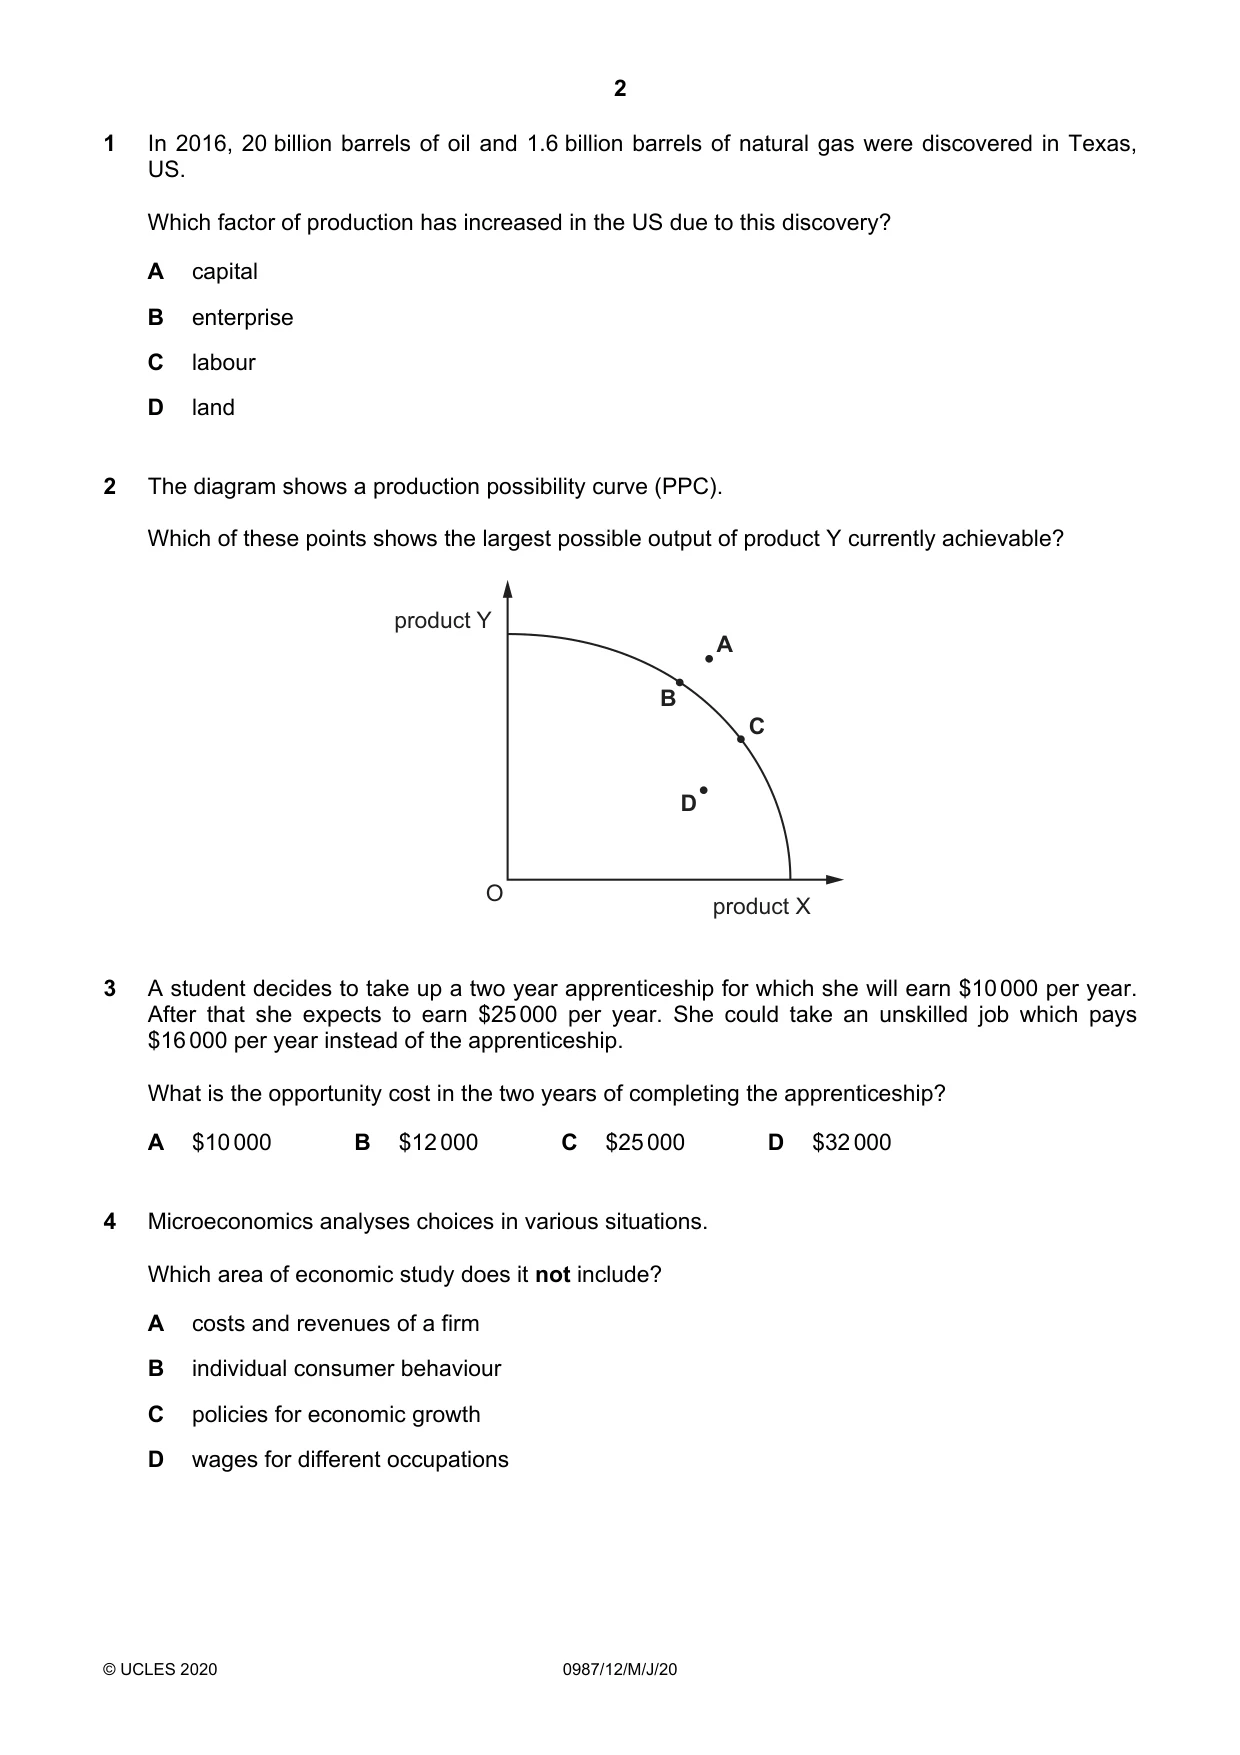
2 The diagram shows a production possibility curve (PPC). Which of these points shows the largest possible output of product Y currently achievable? product Y A B C D O product X
Mark scheme: B
More questions on Production possibility curve (PPC) diagrams
Q3 · A student decides to take up a two year apprenticeship for which she will earn $10 000…
3 A student decides to take up a two year apprenticeship for which she will earn $10 000 per year. After that she expects to earn $25 000 per year. She could take an unskilled job which pays $16 000 per year instead of the apprenticeship. What is the opportunity cost in the two years of completing the apprenticeship? A $10 000 B $12 000 C $25 000 D $32 000
Mark scheme: B
Q4 · Microeconomics analyses choices in various situations
4 Microeconomics analyses choices in various situations. Which area of economic study does it not include? A costs and revenues of a firm B individual consumer behaviour C policies for economic growth D wages for different occupations
Mark scheme: C
Q5 · What is a cause of market failure?
5 What is a cause of market failure? A many firms B monopoly C profit maximisation D specialisation
Mark scheme: B
Q6 · The diagrams show the supply curve for an individual grower of tomatoes and for the total…
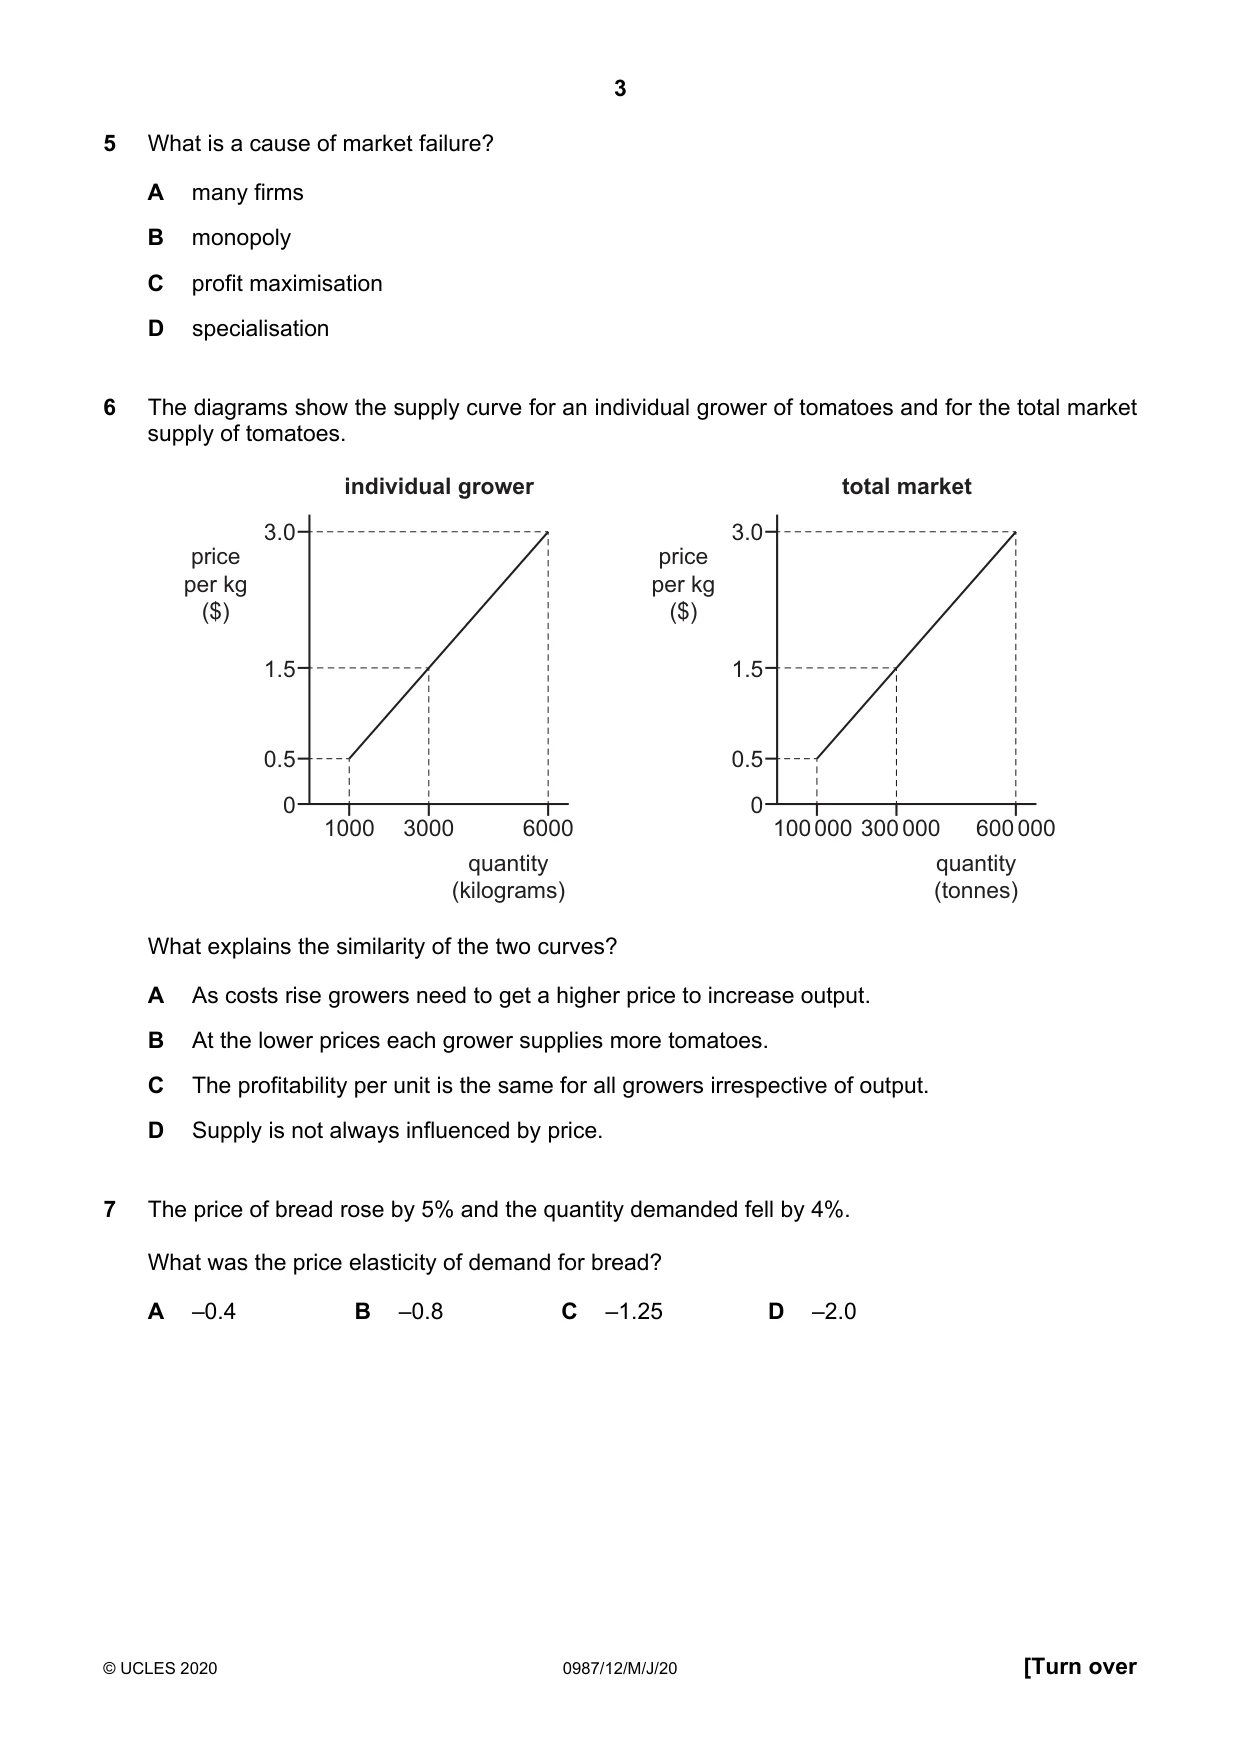
6 The diagrams show the supply curve for an individual grower of tomatoes and for the total market supply of tomatoes. individual grower total market 3.0 3.0 price price per kg per kg ($) ($) 1.5 1.5 0.5 0.5 0 0 1000 3000 6000 100 000 300 000 600 000 quantity quantity (kilograms) (tonnes) What explains the similarity of the two curves? A As costs rise growers need to get a higher price to increase output. B At the lower prices each grower supplies more tomatoes. C The profitability per unit is the same for all growers irrespective of output. D Supply is not always influenced by price.
Mark scheme: A
Q7 · The price of bread rose by 5% and the quantity demanded fell by 4%
7 The price of bread rose by 5% and the quantity demanded fell by 4%. What was the price elasticity of demand for bread? A –0.4 B –0.8 C –1.25 D –2.0
Mark scheme: B
Q8 · Saudi Arabia specialises in oil extraction and refining
8 Saudi Arabia specialises in oil extraction and refining. This is a capital-intensive industry with highly skilled labour. What might be a disadvantage of this specialisation? A Oil companies have increased training costs as each worker needs many different skills. B Oil companies may find it difficult to achieve economies of scale. C Resource allocation is not efficient because a narrow range of goods is being produced. D Workers may face a restricted range of job opportunities.
Mark scheme: D
Q9 · What would most likely cause a person to increase their savings?
9 What would most likely cause a person to increase their savings? A a decision to plan for retirement B a fall in income C a fall in interest rates D a reduction in tax-free saving schemes
Mark scheme: A
Q10 · The graph shows women’s wages as a percentage of men’s wages in year 1 and year 2
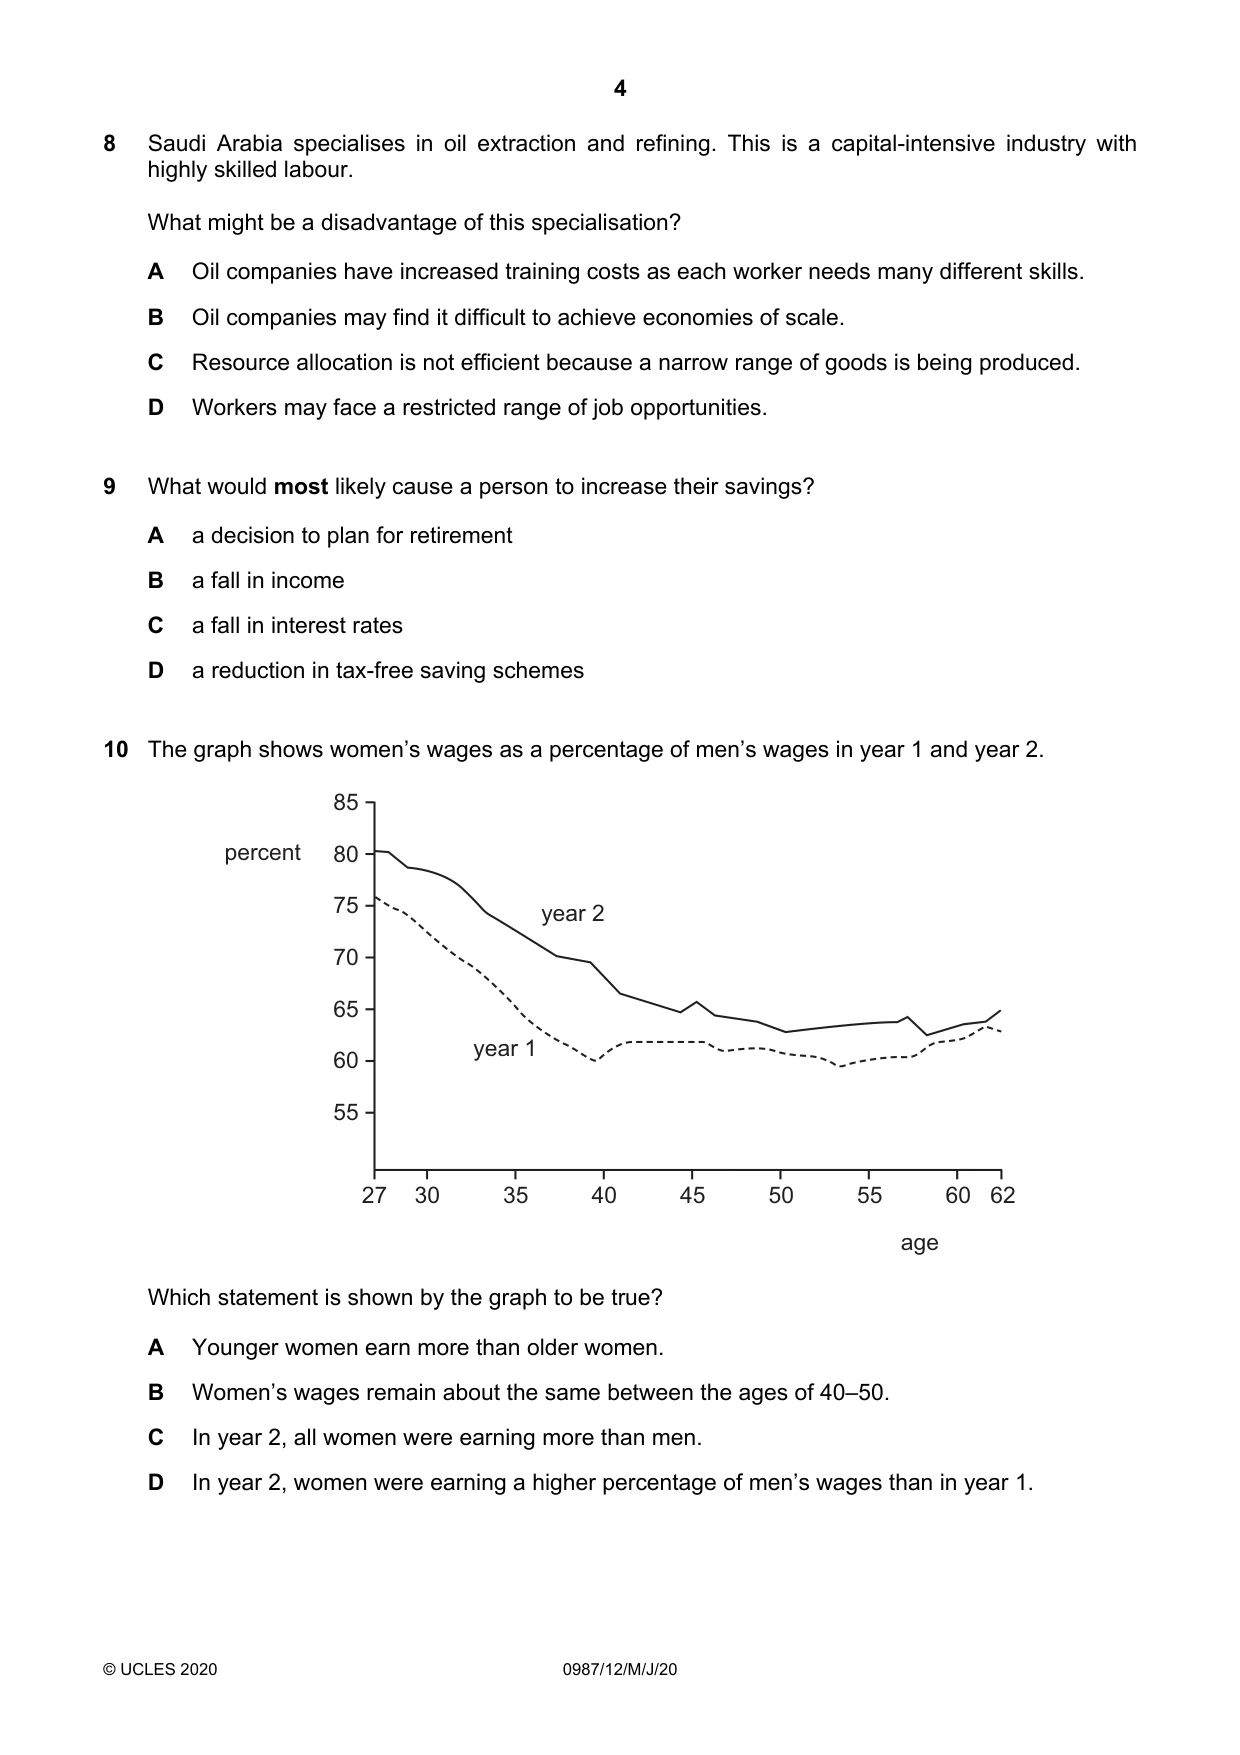
10 The graph shows women’s wages as a percentage of men’s wages in year 1 and year 2. 85 percent 80 75 year 2 70 65 year 1 60 55 27 30 35 40 45 50 55 60 62 age Which statement is shown by the graph to be true? A Younger women earn more than older women. B Women’s wages remain about the same between the ages of 40–50. C In year 2, all women were earning more than men. D In year 2, women were earning a higher percentage of men’s wages than in year 1.
Mark scheme: D
Question 11
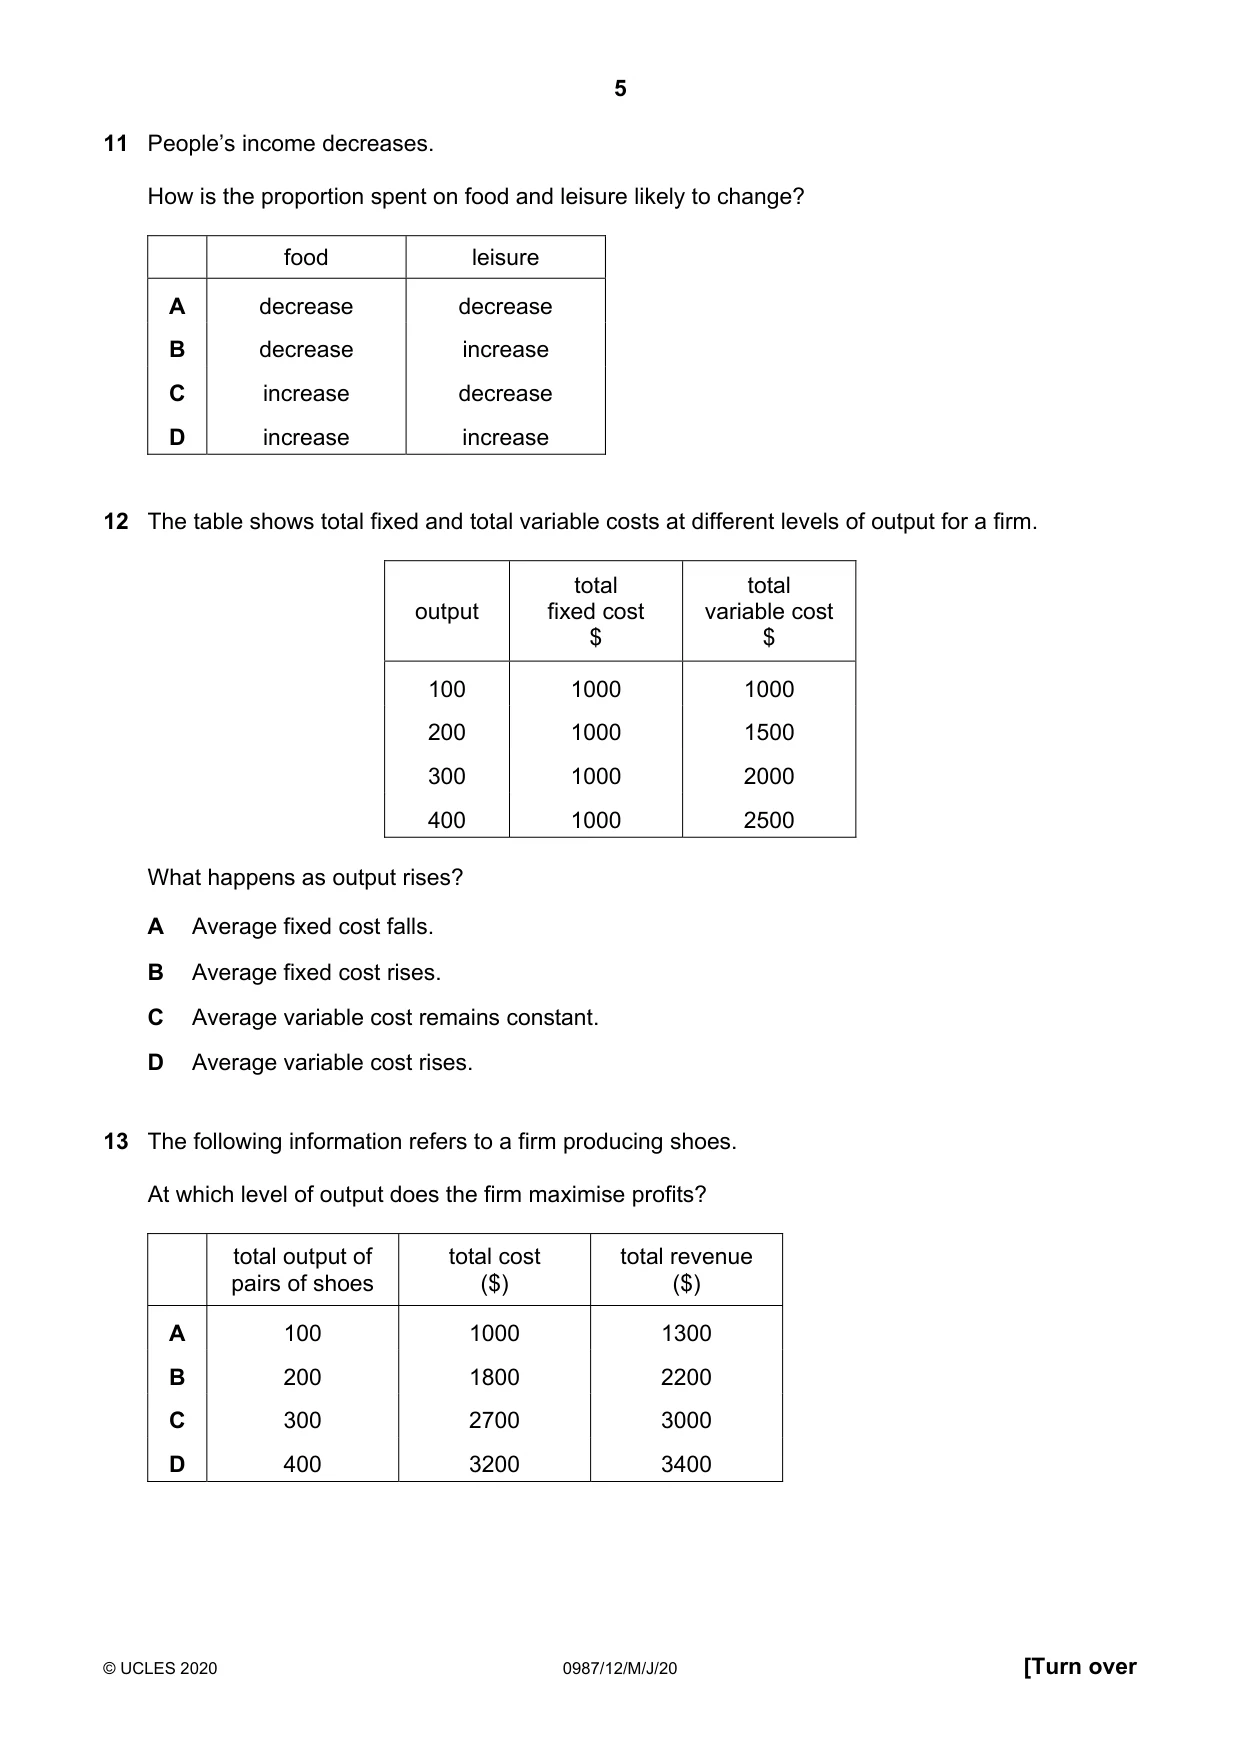
11 People’s income decreases. How is the proportion spent on food and leisure likely to change? food leisure A decrease decrease B decrease increase C increase decrease D increase increase
Mark scheme: C
Q12 · The table shows total fixed and total variable costs at different levels of output for a…
12 The table shows total fixed and total variable costs at different levels of output for a firm. total total output fixed cost variable cost $ $ 100 1000 1000 200 1000 1500 300 1000 2000 400 1000 2500 What happens as output rises? A Average fixed cost falls. B Average fixed cost rises. C Average variable cost remains constant. D Average variable cost rises.
Mark scheme: A
Q13 · The following information refers to a firm producing shoes
13 The following information refers to a firm producing shoes. At which level of output does the firm maximise profits? total output of total cost total revenue pairs of shoes ($) ($) A 100 1000 1300 B 200 1800 2200 C 300 2700 3000 D 400 3200 3400
Mark scheme: B
Q14 · Which statement proves there has been an increase in productivity for a factory making…
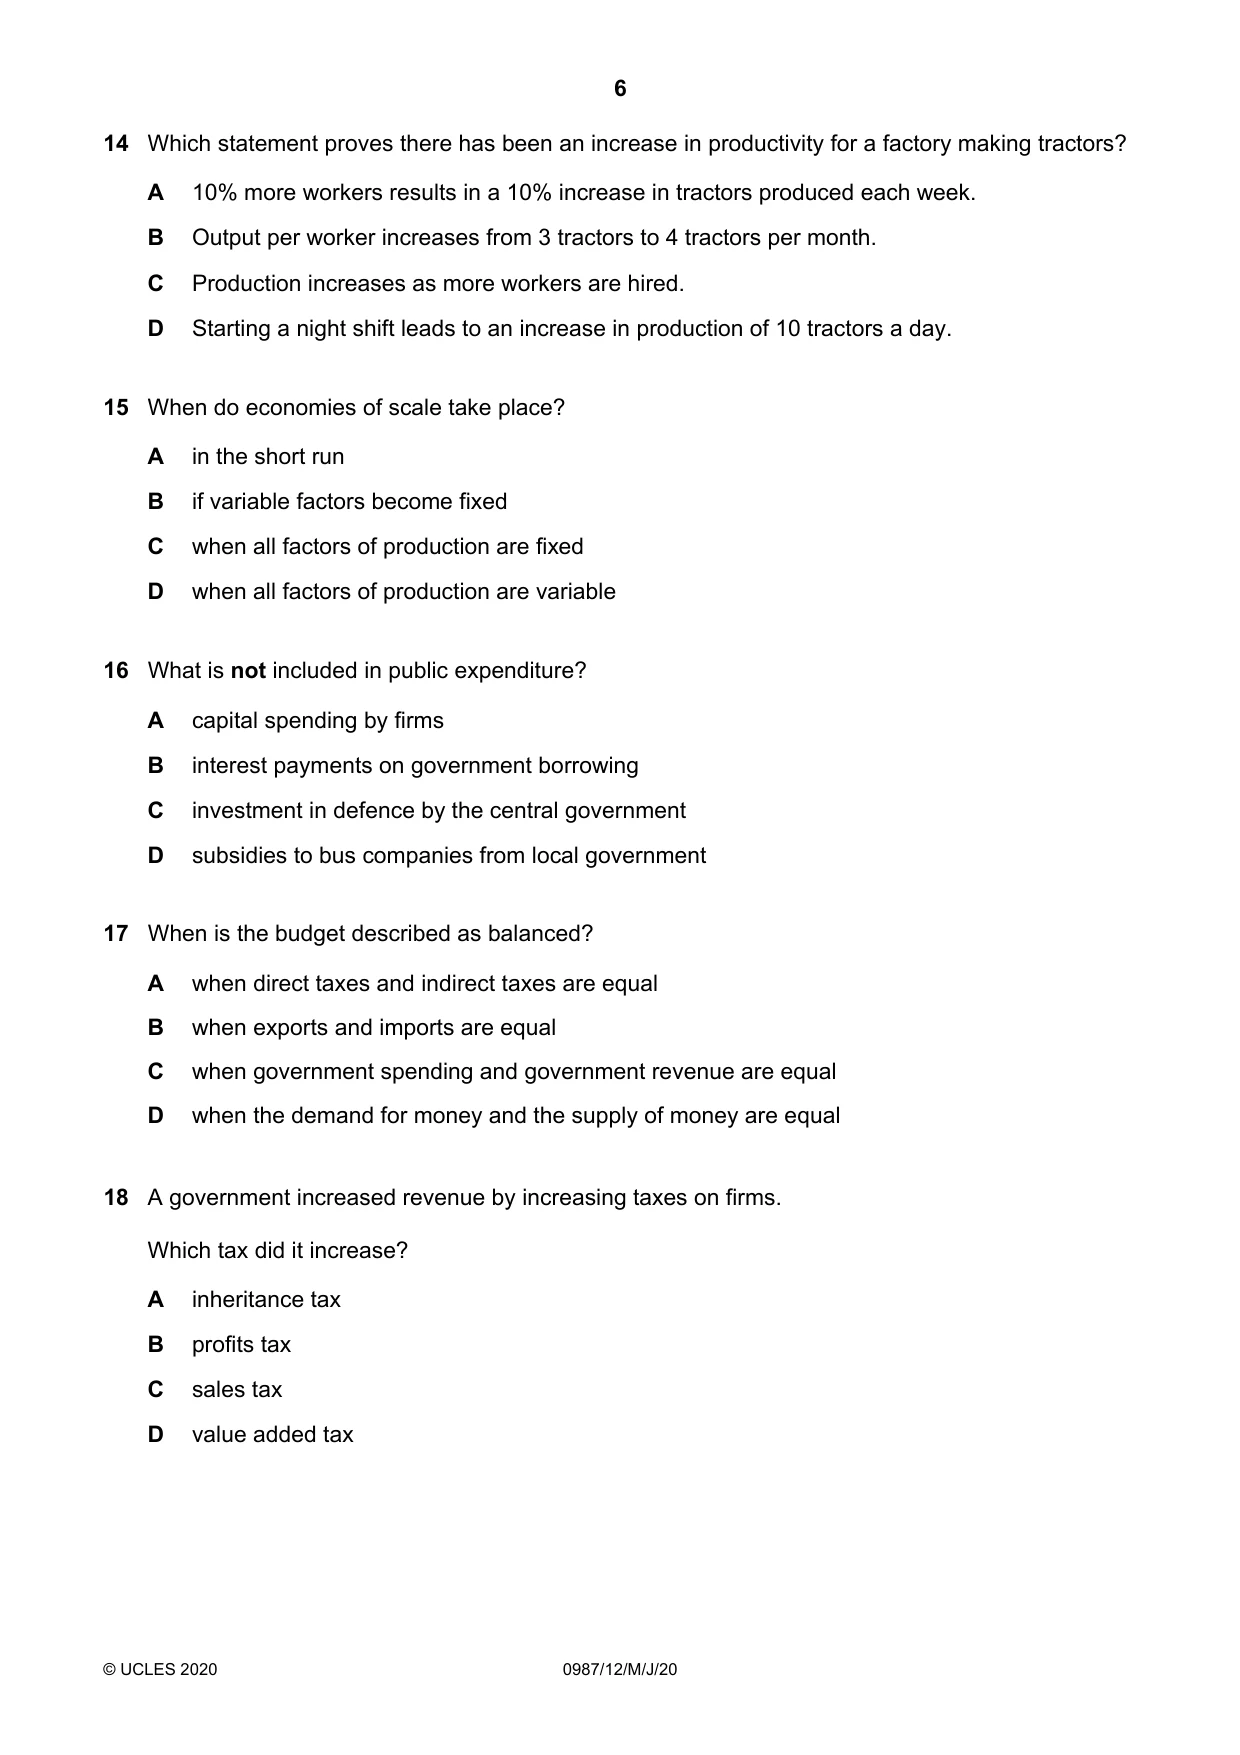
14 Which statement proves there has been an increase in productivity for a factory making tractors? A 10% more workers results in a 10% increase in tractors produced each week. B Output per worker increases from 3 tractors to 4 tractors per month. C Production increases as more workers are hired. D Starting a night shift leads to an increase in production of 10 tractors a day.
Mark scheme: B
Q15 · When do economies of scale take place?
15 When do economies of scale take place? A in the short run B if variable factors become fixed C when all factors of production are fixed D when all factors of production are variable
Mark scheme: D
Q16 · What is not included in public expenditure?
16 What is not included in public expenditure? A capital spending by firms B interest payments on government borrowing C investment in defence by the central government D subsidies to bus companies from local government
Mark scheme: A
Q17 · When is the budget described as balanced?
17 When is the budget described as balanced? A when direct taxes and indirect taxes are equal B when exports and imports are equal C when government spending and government revenue are equal D when the demand for money and the supply of money are equal
Mark scheme: C
Q18 · A government increased revenue by increasing taxes on firms
18 A government increased revenue by increasing taxes on firms. Which tax did it increase? A inheritance tax B profits tax C sales tax D value added tax
Mark scheme: B
Q19 · Why are governments responsible for the defence of the country?
19 Why are governments responsible for the defence of the country? A It is impossible to charge a price for defence. B It prevents individual citizens having access to weapons. C Only governments can manufacture weapons. D Providing defence is very expensive.
Mark scheme: A
Q20 · Information about job vacancies on a government website has led to a decrease in…
20 Information about job vacancies on a government website has led to a decrease in short-term unemployment. What is the term for this type of unemployment? A cyclical unemployment B frictional unemployment C structural unemployment D technological unemployment
Mark scheme: B
Q21 · The table shows figures for the real GDP of a country
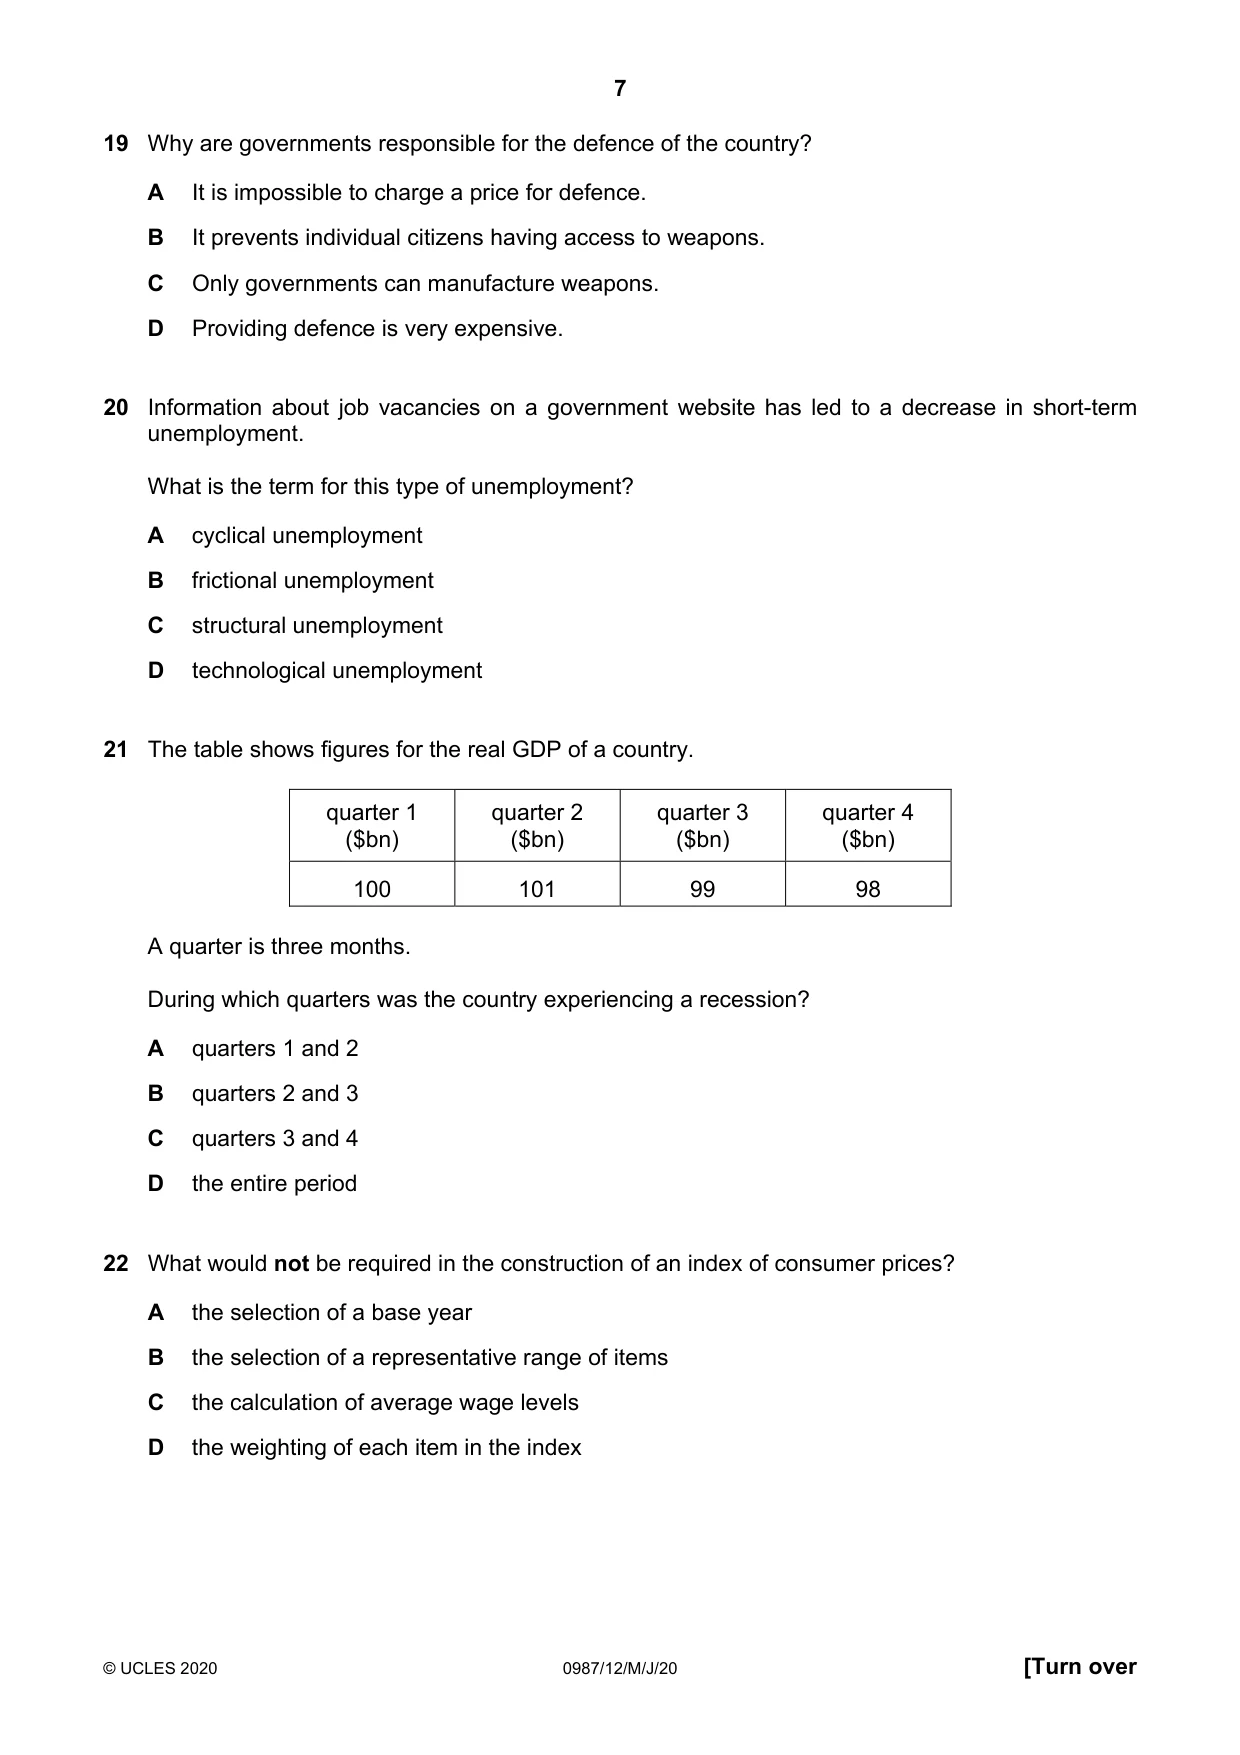
21 The table shows figures for the real GDP of a country. quarter 1 quarter 2 quarter 3 quarter 4 ($bn) ($bn) ($bn) ($bn) 100 101 99 98 A quarter is three months. During which quarters was the country experiencing a recession? A quarters 1 and 2 B quarters 2 and 3 C quarters 3 and 4 D the entire period
Mark scheme: C
Q22 · What would not be required in the construction of an index of consumer prices?
22 What would not be required in the construction of an index of consumer prices? A the selection of a base year B the selection of a representative range of items C the calculation of average wage levels D the weighting of each item in the index
Mark scheme: C
Q23 · The table gives information about three economic indicators in four countries
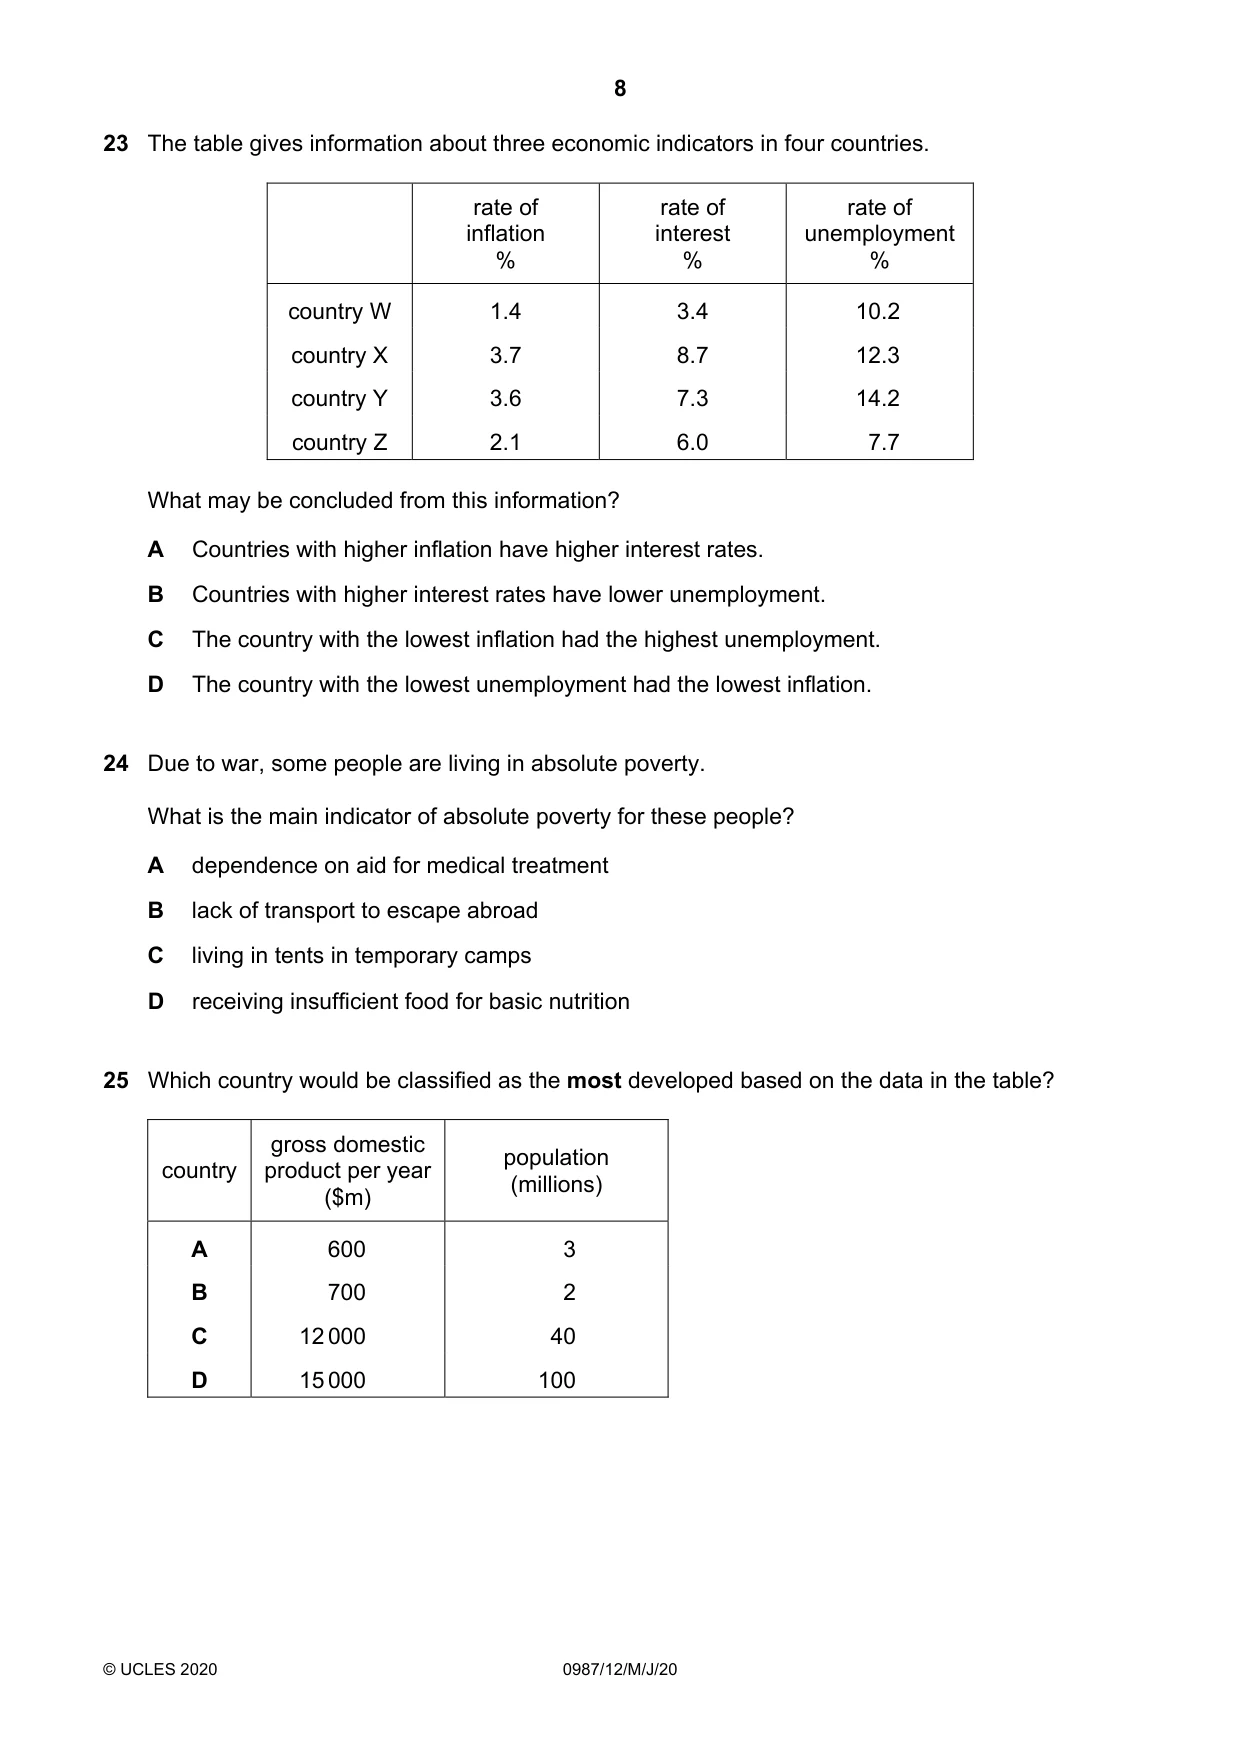
23 The table gives information about three economic indicators in four countries. rate of rate of rate of inflation interest unemployment % % % country W 1.4 3.4 10.2 country X 3.7 8.7 12.3 country Y 3.6 7.3 14.2 country Z 2.1 6.0 7.7 What may be concluded from this information? A Countries with higher inflation have higher interest rates. B Countries with higher interest rates have lower unemployment. C The country with the lowest inflation had the highest unemployment. D The country with the lowest unemployment had the lowest inflation.
Mark scheme: A
Q24 · Due to war, some people are living in absolute poverty
24 Due to war, some people are living in absolute poverty. What is the main indicator of absolute poverty for these people? A dependence on aid for medical treatment B lack of transport to escape abroad C living in tents in temporary camps D receiving insufficient food for basic nutrition
Mark scheme: D
Q25 · Which country would be classified as the most developed based on the data in the table?
25 Which country would be classified as the most developed based on the data in the table? gross domestic population country product per year (millions) ($m) A 600 3 B 700 2 C 12 000 40 D 15 000 100
Mark scheme: B
More questions on Differences in economic development between countries
Q26 · Which changes usually result when a country develops and is able to provide free…
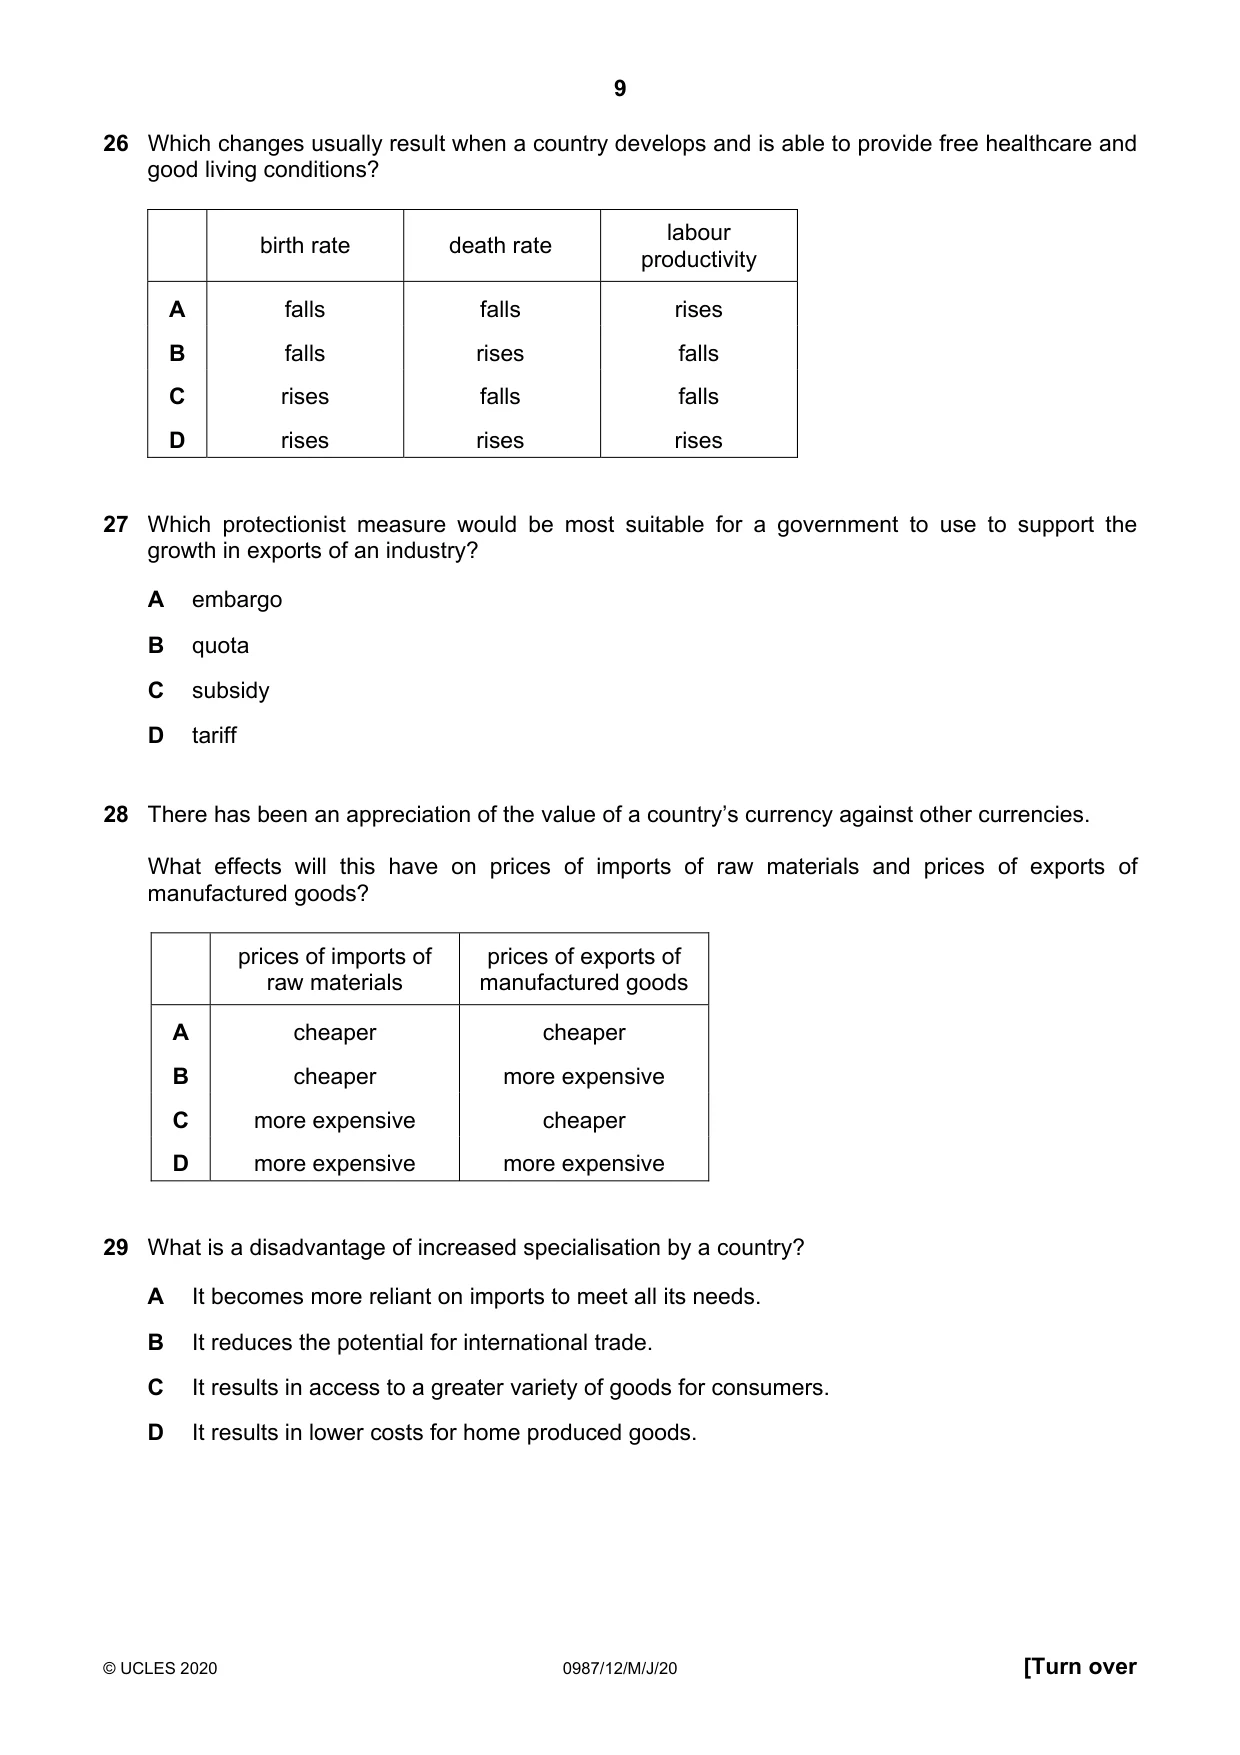
26 Which changes usually result when a country develops and is able to provide free healthcare and good living conditions? labour birth rate death rate productivity A falls falls rises B falls rises falls C rises falls falls D rises rises rises
Mark scheme: A
Q27 · Which protectionist measure would be most suitable for a government to use to support the…
27 Which protectionist measure would be most suitable for a government to use to support the growth in exports of an industry? A embargo B quota C subsidy D tariff
Mark scheme: C
Q28 · There has been an appreciation of the value of a country’s currency against other…
28 There has been an appreciation of the value of a country’s currency against other currencies. What effects will this have on prices of imports of raw materials and prices of exports of manufactured goods? prices of imports of prices of exports of raw materials manufactured goods A cheaper cheaper B cheaper more expensive C more expensive cheaper D more expensive more expensive
Mark scheme: B
Q29 · What is a disadvantage of increased specialisation by a country?
29 What is a disadvantage of increased specialisation by a country? A It becomes more reliant on imports to meet all its needs. B It reduces the potential for international trade. C It results in access to a greater variety of goods for consumers. D It results in lower costs for home produced goods.
Mark scheme: A
Q30 · The table shows components of Japan’s current account balance in trillion Yen (¥) for…
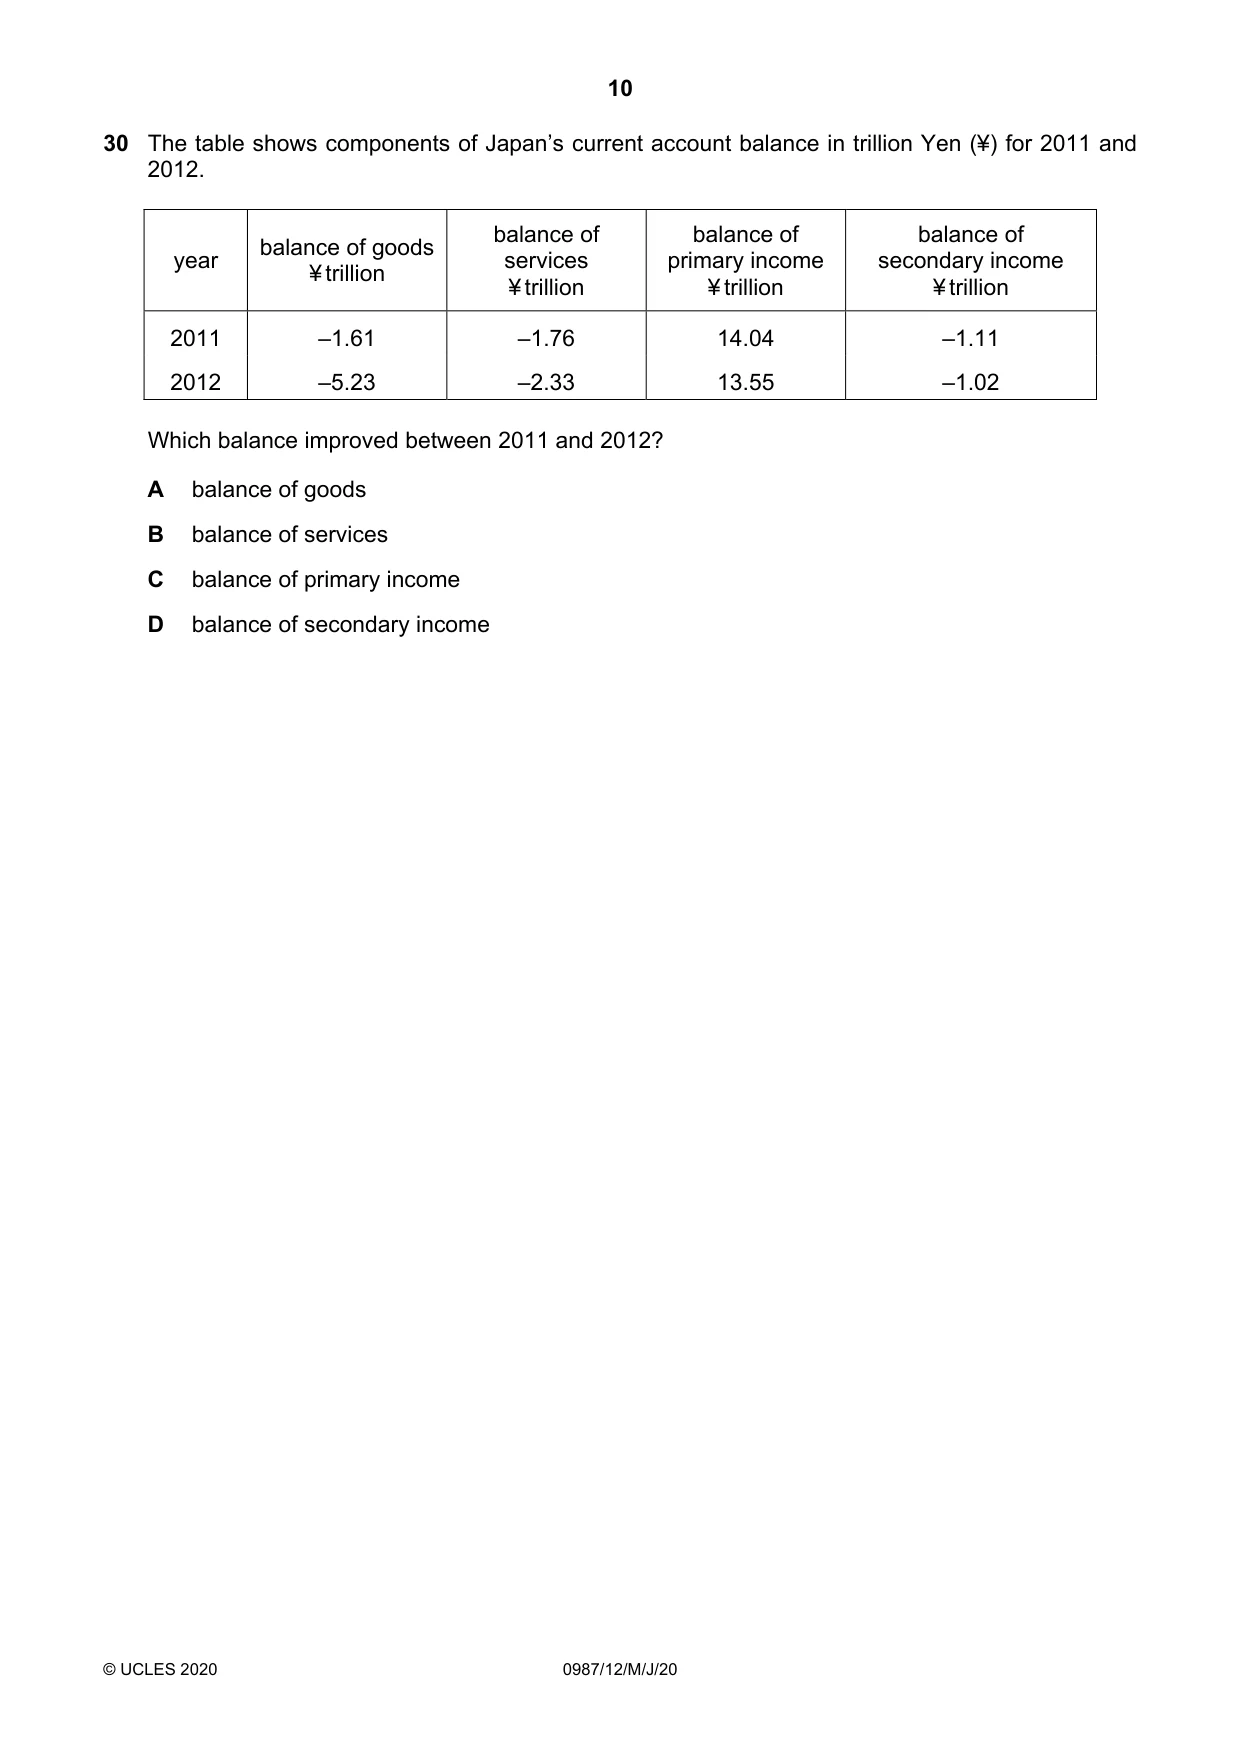
30 The table shows components of Japan’s current account balance in trillion Yen (¥) for 2011 and 2012. balance of balance of balance of balance of goods year services primary income secondary income ¥ trillion ¥ trillion ¥ trillion ¥ trillion 2011 –1.61 –1.76 14.04 –1.11 2012 –5.23 –2.33 13.55 –1.02 Which balance improved between 2011 and 2012? A balance of goods B balance of services C balance of primary income D balance of secondary income
Mark scheme: D
More questions on Current account of the balance of payments
What was in this paper
The subtopics covered by these 30 questions, and how many questions each got. Open one in a new tab to see every Cambridge question on it.
3Firms and production2Firms’ costs, revenue and objectives2Households2Market failure2Specialisation and free trade2Current account of the balance of payments1Differences in economic development between countries1Economic growth1Employment and unemployment1Factors of production1Foreign exchange rates1Globalisation and trade restrictions1Government macroeconomic intervention1Inflation1Opportunity cost1Population1Poverty1Price elasticity of demand (PED)1Production possibility curve (PPC) diagrams1Supply1The nature of the basic economic problem1Workers1