Cambridge IGCSE Economics 0455 — 2024 May/June Paper 1 · Variant 1
0455/11/M/J/24 · 30 marks · ≈34 min
The question paper and its mark scheme, free to read here and free to download. This is Cambridge’s own paper, exactly as it was sat.
Question paper12 pages


Mark scheme3 pages
Answers below. Sit the paper first if you are practising.

Paper as text
Question paper, page 1
This document has 12 pages. Any blank pages are indicated. 06_0455_11_2024_1.15c © UCLES 2024 [Turn over *3446629161* Cambridge IGCSE™ ECONOMICS 0455/11 Paper 1 Multiple Choice May/June 2024 45 minutes You must answer on the multiple choice answer sheet. You will need: Multiple choice answer sheet Soft clean eraser Soft pencil (type B or HB is recommended) INSTRUCTIONS There are thirty questions on this paper. Answer all questions. For each question there are four possible answers A, B, C and D. Choose the one you consider correct and record your choice in soft pencil on the multiple choice answer sheet. Follow the instructions on the multiple choice answer sheet. Write in soft pencil. Write your name, centre number and candidate number on the multiple choice answer sheet in the spaces provided unless this has been done for you. Do not use correction fluid. Do not write on any bar codes. You may use a calculator. INFORMATION The total mark for this paper is 30. Each correct answer will score one mark. Any rough working should be done on this question paper.
Question paper, page 2
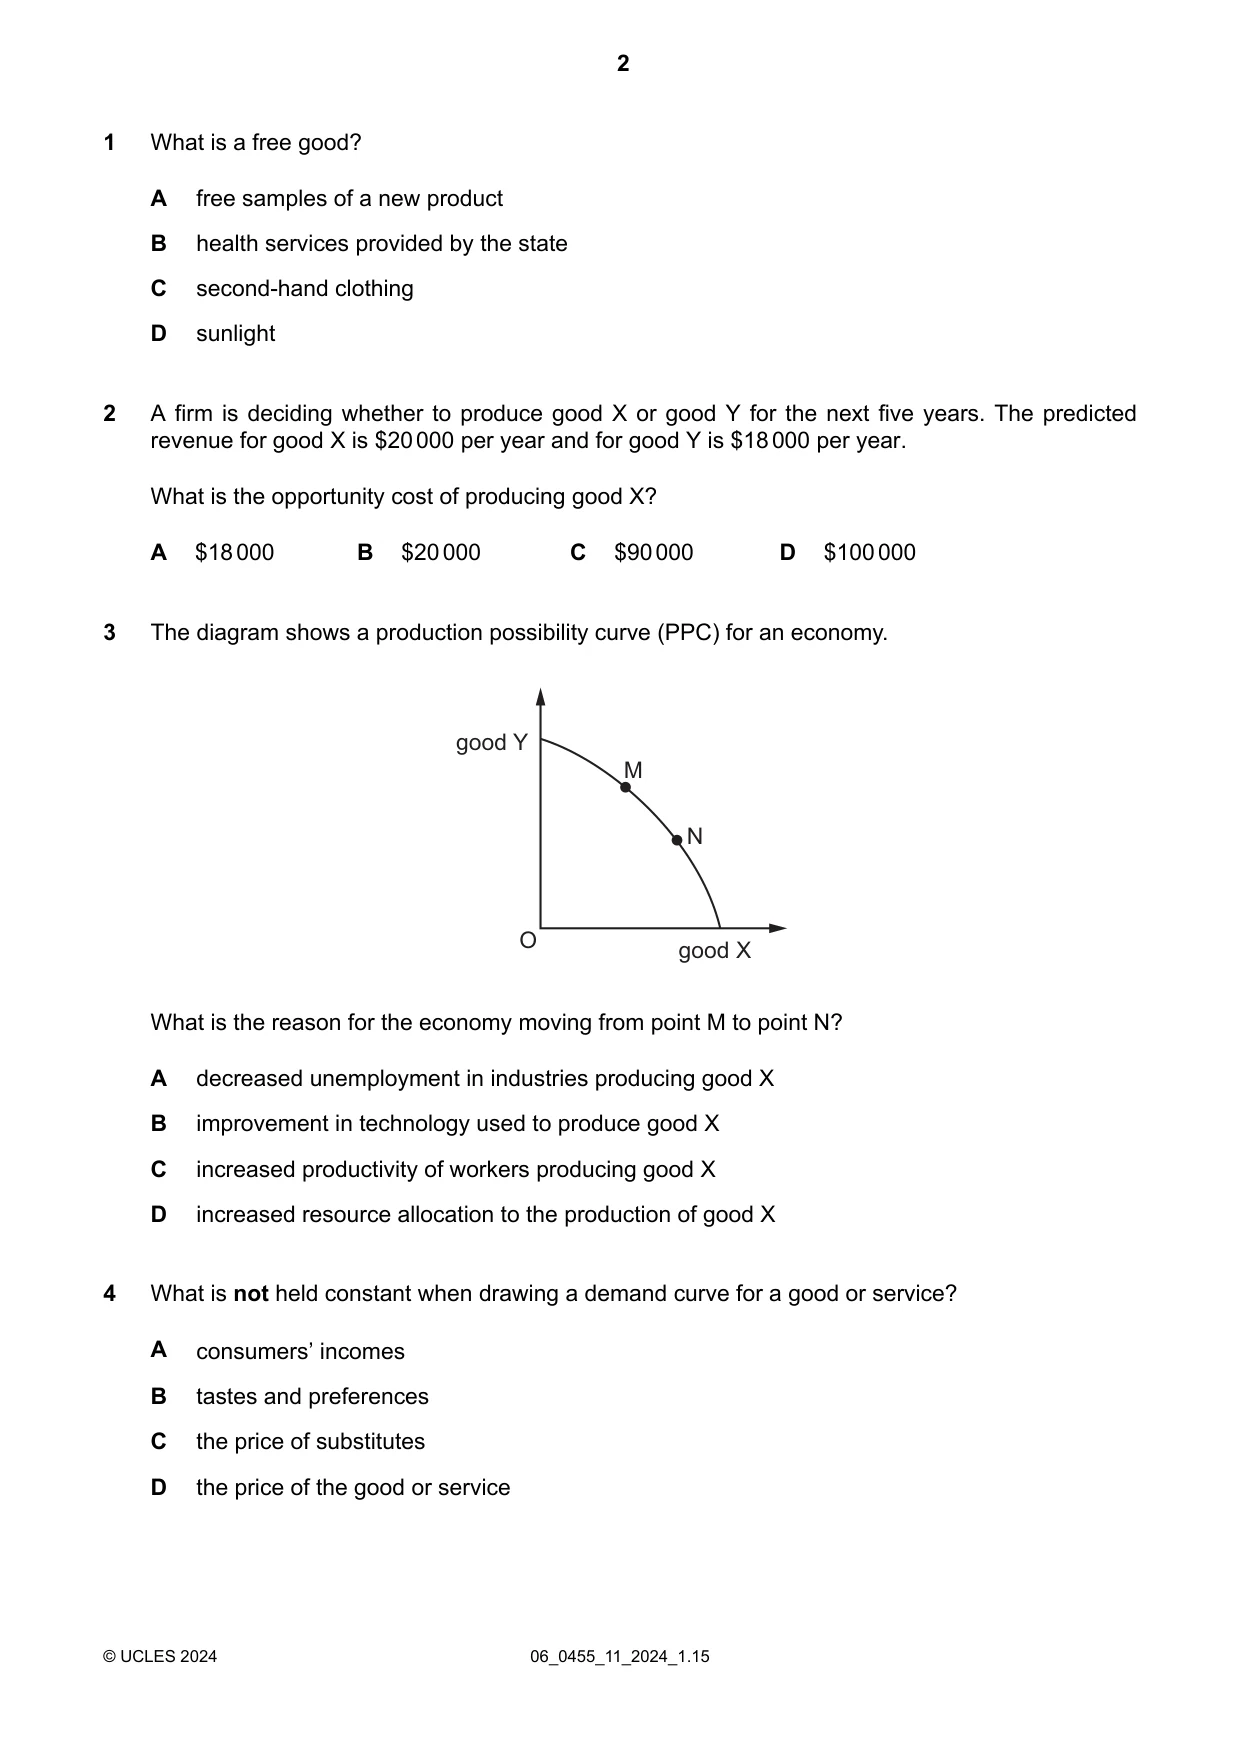
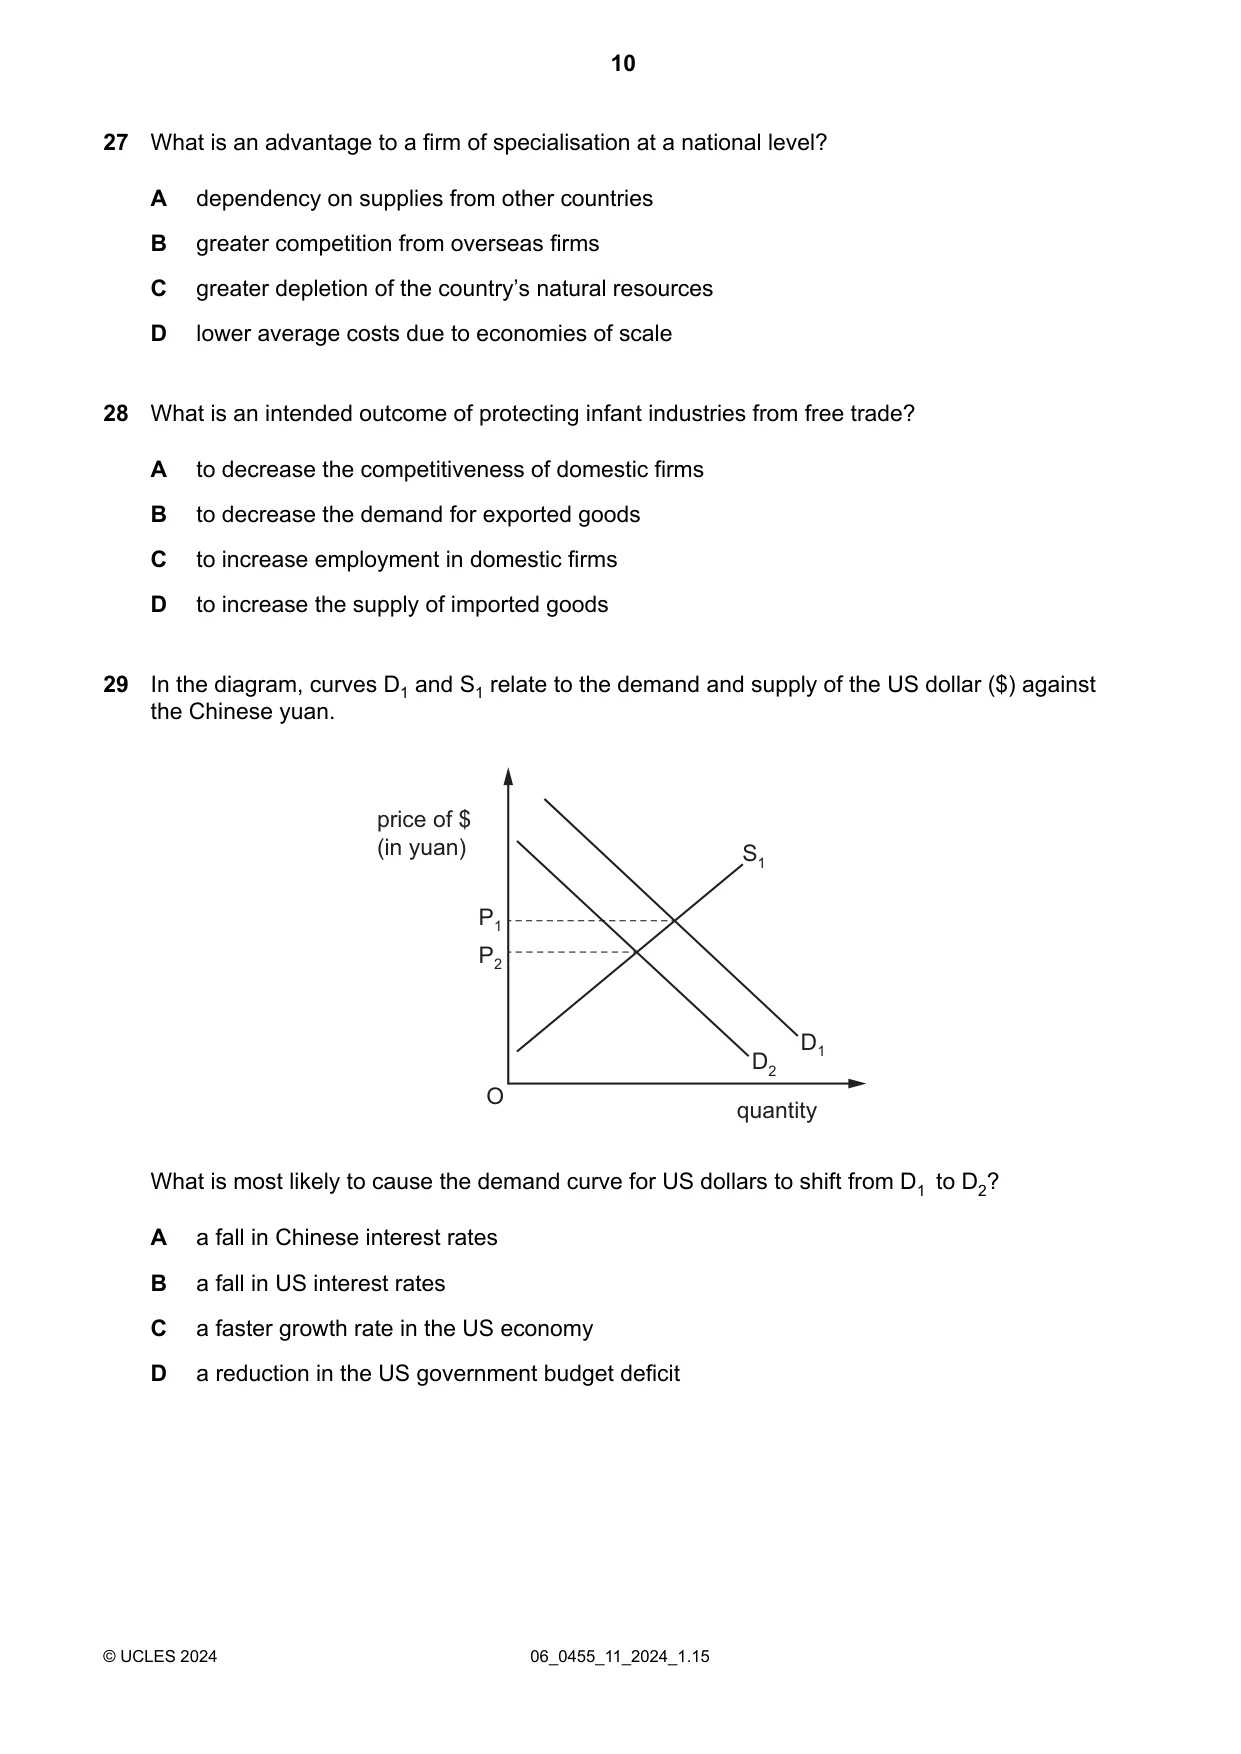
What is a free good? 1 free samples of a new product A health services provided by the state B second-hand clothing C sunlight D A firm is deciding whether to produce good X or good Y for the next five years. The predicted revenue for good X is $20 000 per year and for good Y is $18 000 per year. What is the opportunity cost of producing good X? 2 D $100 000 C $90 000 A $18 000 B $20 000 The diagram shows a production possibility curve (PPC) for an economy. 3 O good Y good X M N What is the reason for the economy moving from point M to point N? decreased unemployment in industries producing good X A improvement in technology used to produce good X B increased productivity of workers producing good X C increased resource allocation to the production of good X D What is not held constant when drawing a demand curve for a good or service? 4 consumers’ incomes A tastes and preferences B the price of substitutes C the price of the good or service D 06_0455_11_2024_1.15 © UCLES 2024 2
Question paper, page 3
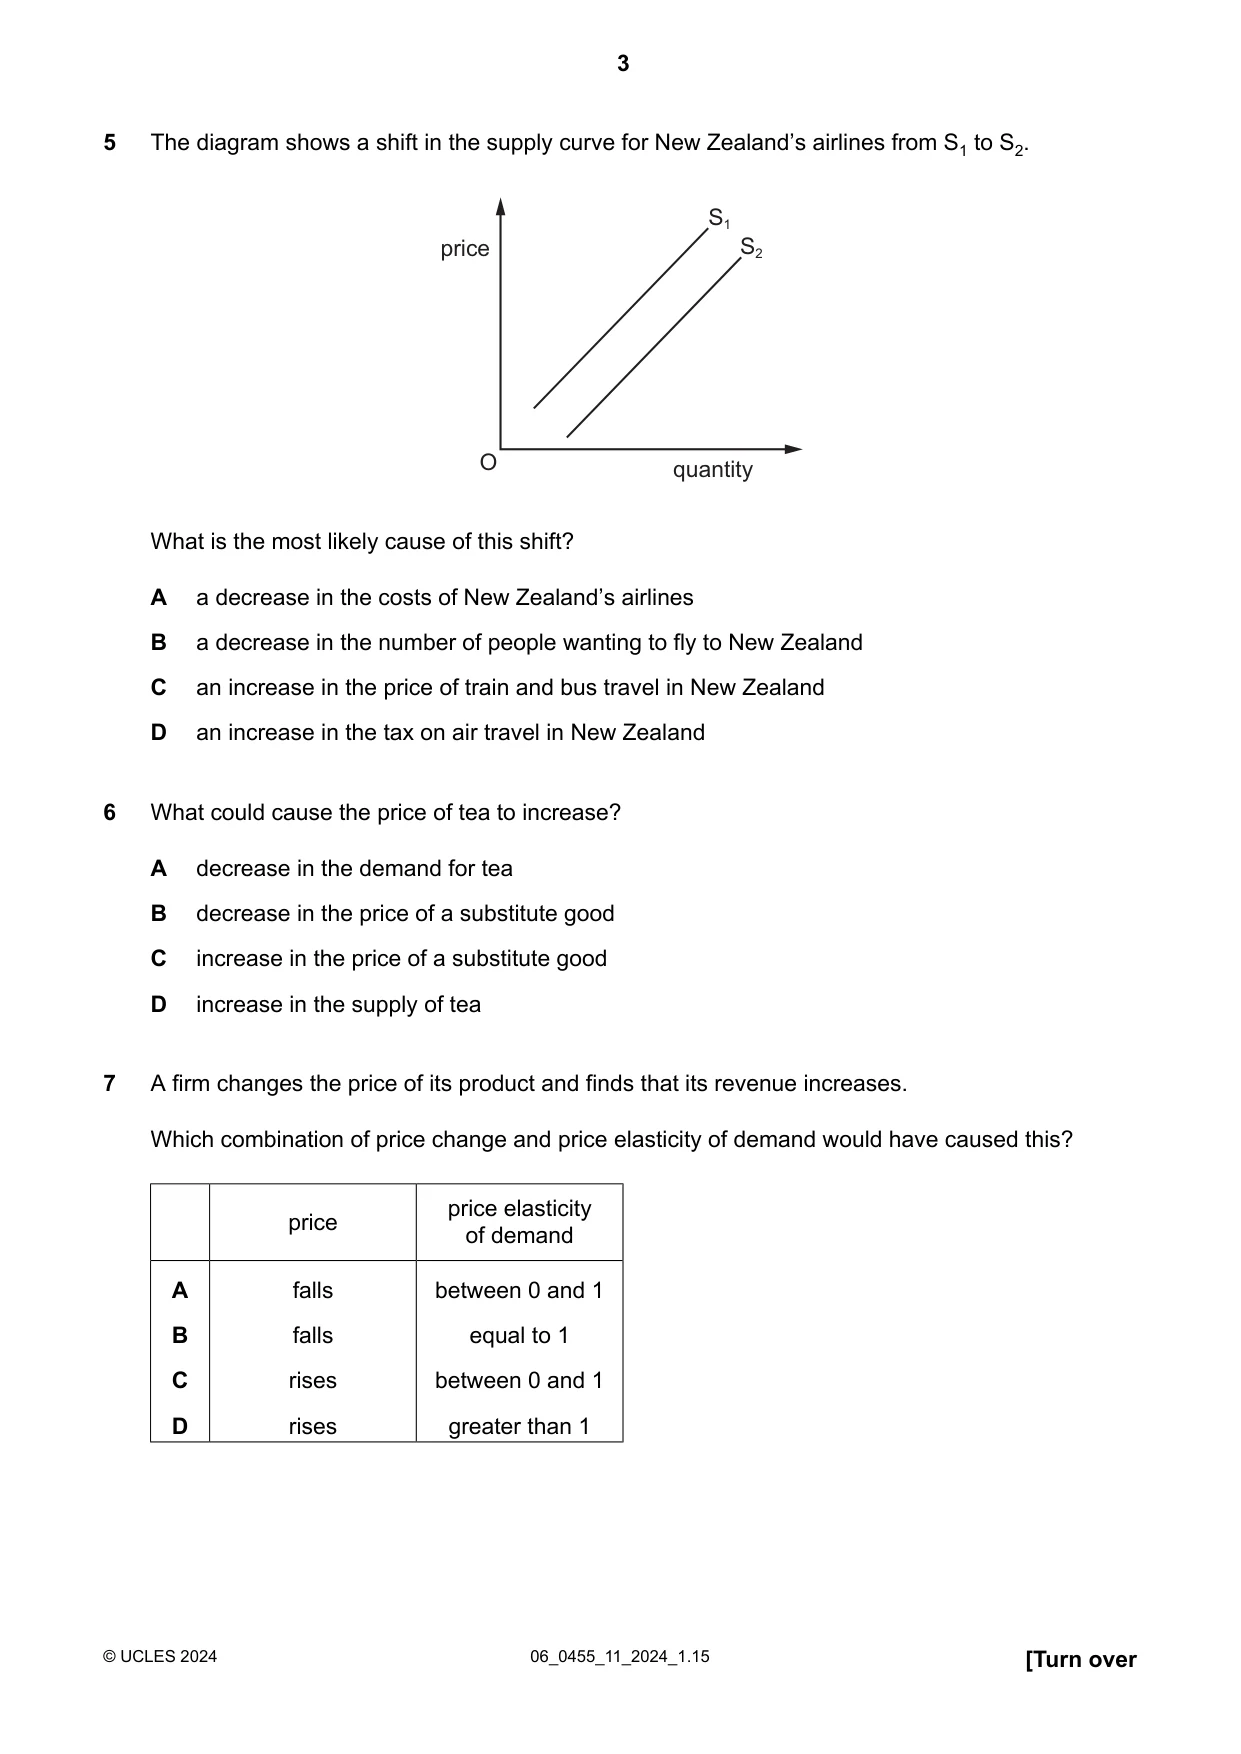
The diagram shows a shift in the supply curve for New Zealand’s airlines from S1 to S2. 5 S1 S2 O price quantity What is the most likely cause of this shift? a decrease in the costs of New Zealand’s airlines A a decrease in the number of people wanting to fly to New Zealand B an increase in the price of train and bus travel in New Zealand C an increase in the tax on air travel in New Zealand D What could cause the price of tea to increase? 6 decrease in the demand for tea A decrease in the price of a substitute good B increase in the price of a substitute good C increase in the supply of tea D A firm changes the price of its product and finds that its revenue increases. Which combination of price change and price elasticity of demand would have caused this? 7 price elasticity of demand price between 0 and 1 falls A equal to 1 falls B between 0 and 1 rises C greater than 1 rises D [Turn over 06_0455_11_2024_1.15 © UCLES 2024 3
Question paper, page 4
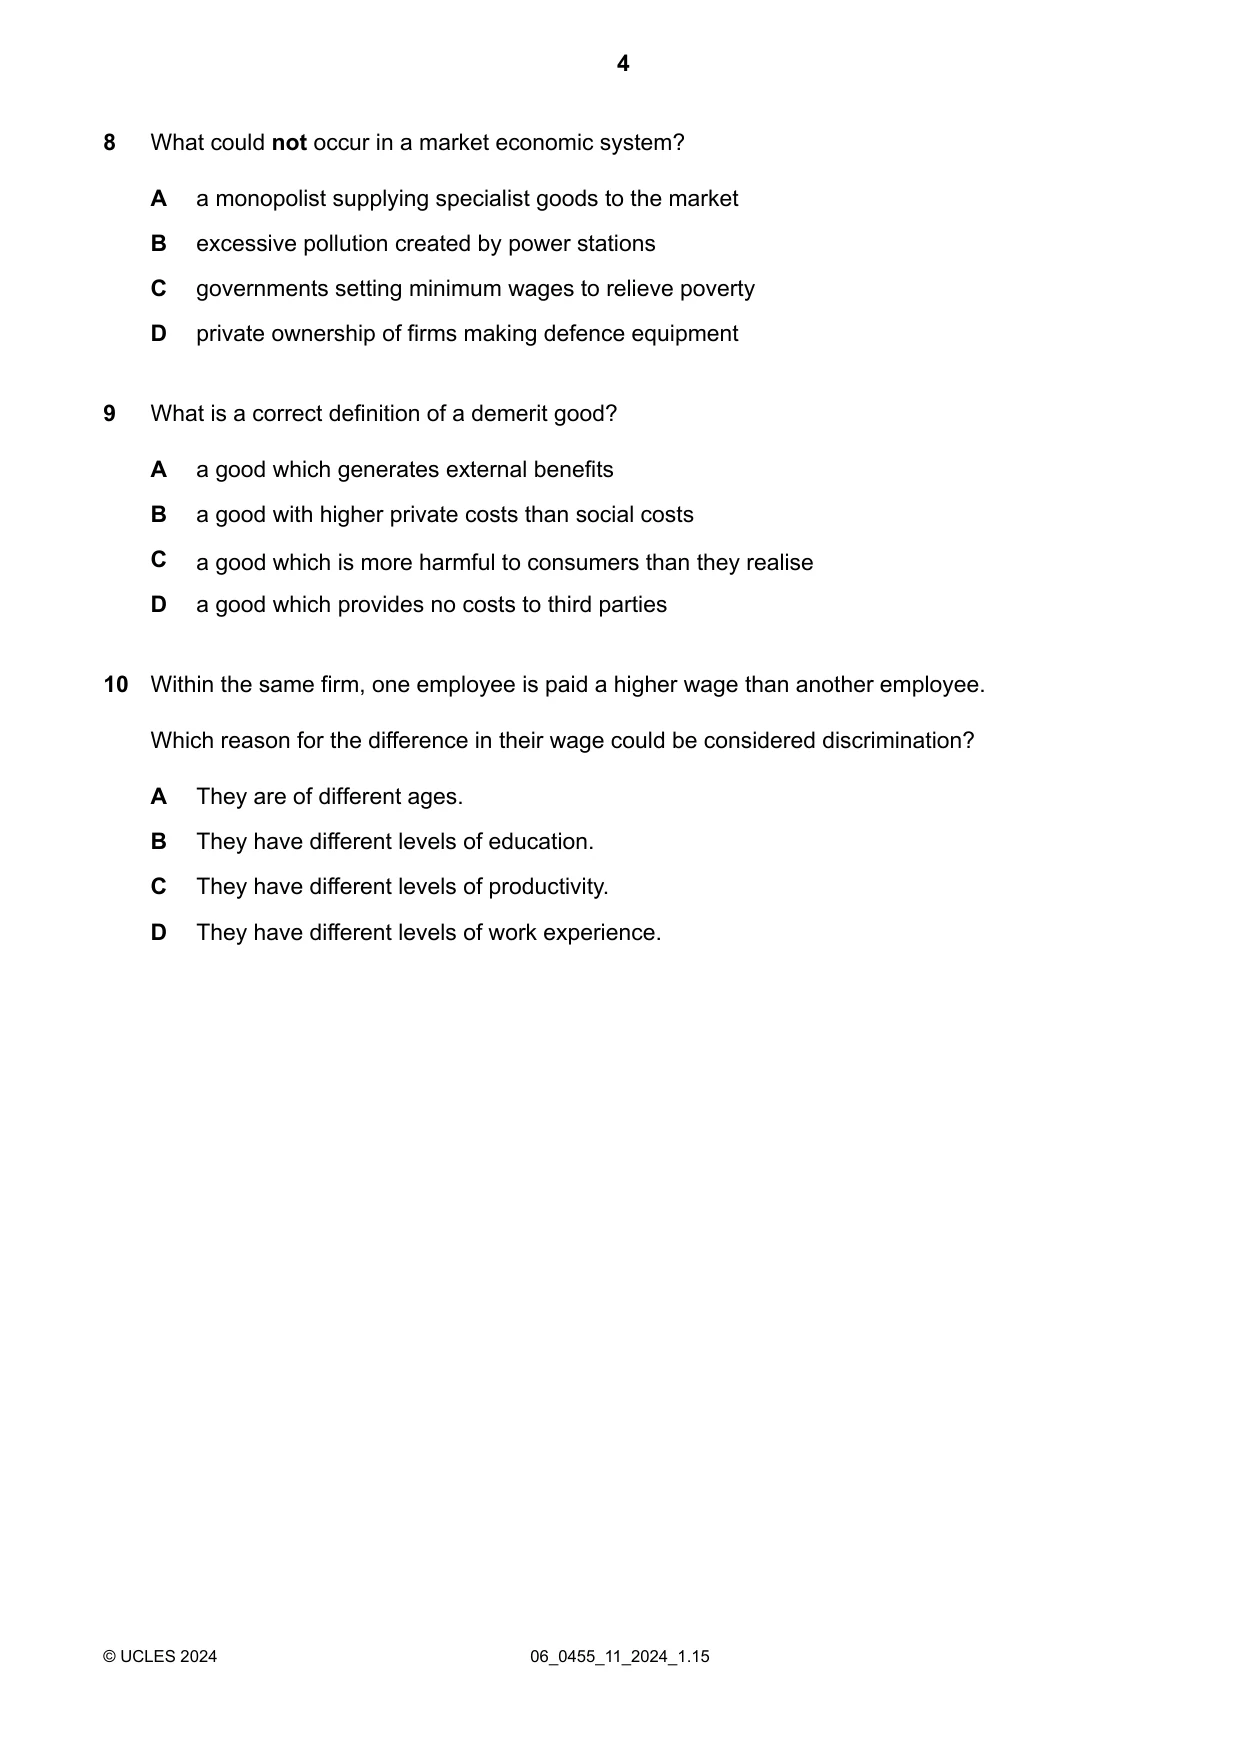
What could not occur in a market economic system? 8 a monopolist supplying specialist goods to the market A excessive pollution created by power stations B governments setting minimum wages to relieve poverty C private ownership of firms making defence equipment D What is a correct definition of a demerit good? 9 a good which generates external benefits A a good with higher private costs than social costs B a good which is more harmful to consumers than they realise C a good which provides no costs to third parties D Within the same firm, one employee is paid a higher wage than another employee. Which reason for the difference in their wage could be considered discrimination? 10 They are of different ages. A They have different levels of education. B They have different levels of productivity. C They have different levels of work experience. D 06_0455_11_2024_1.15 © UCLES 2024 4
Question paper, page 5
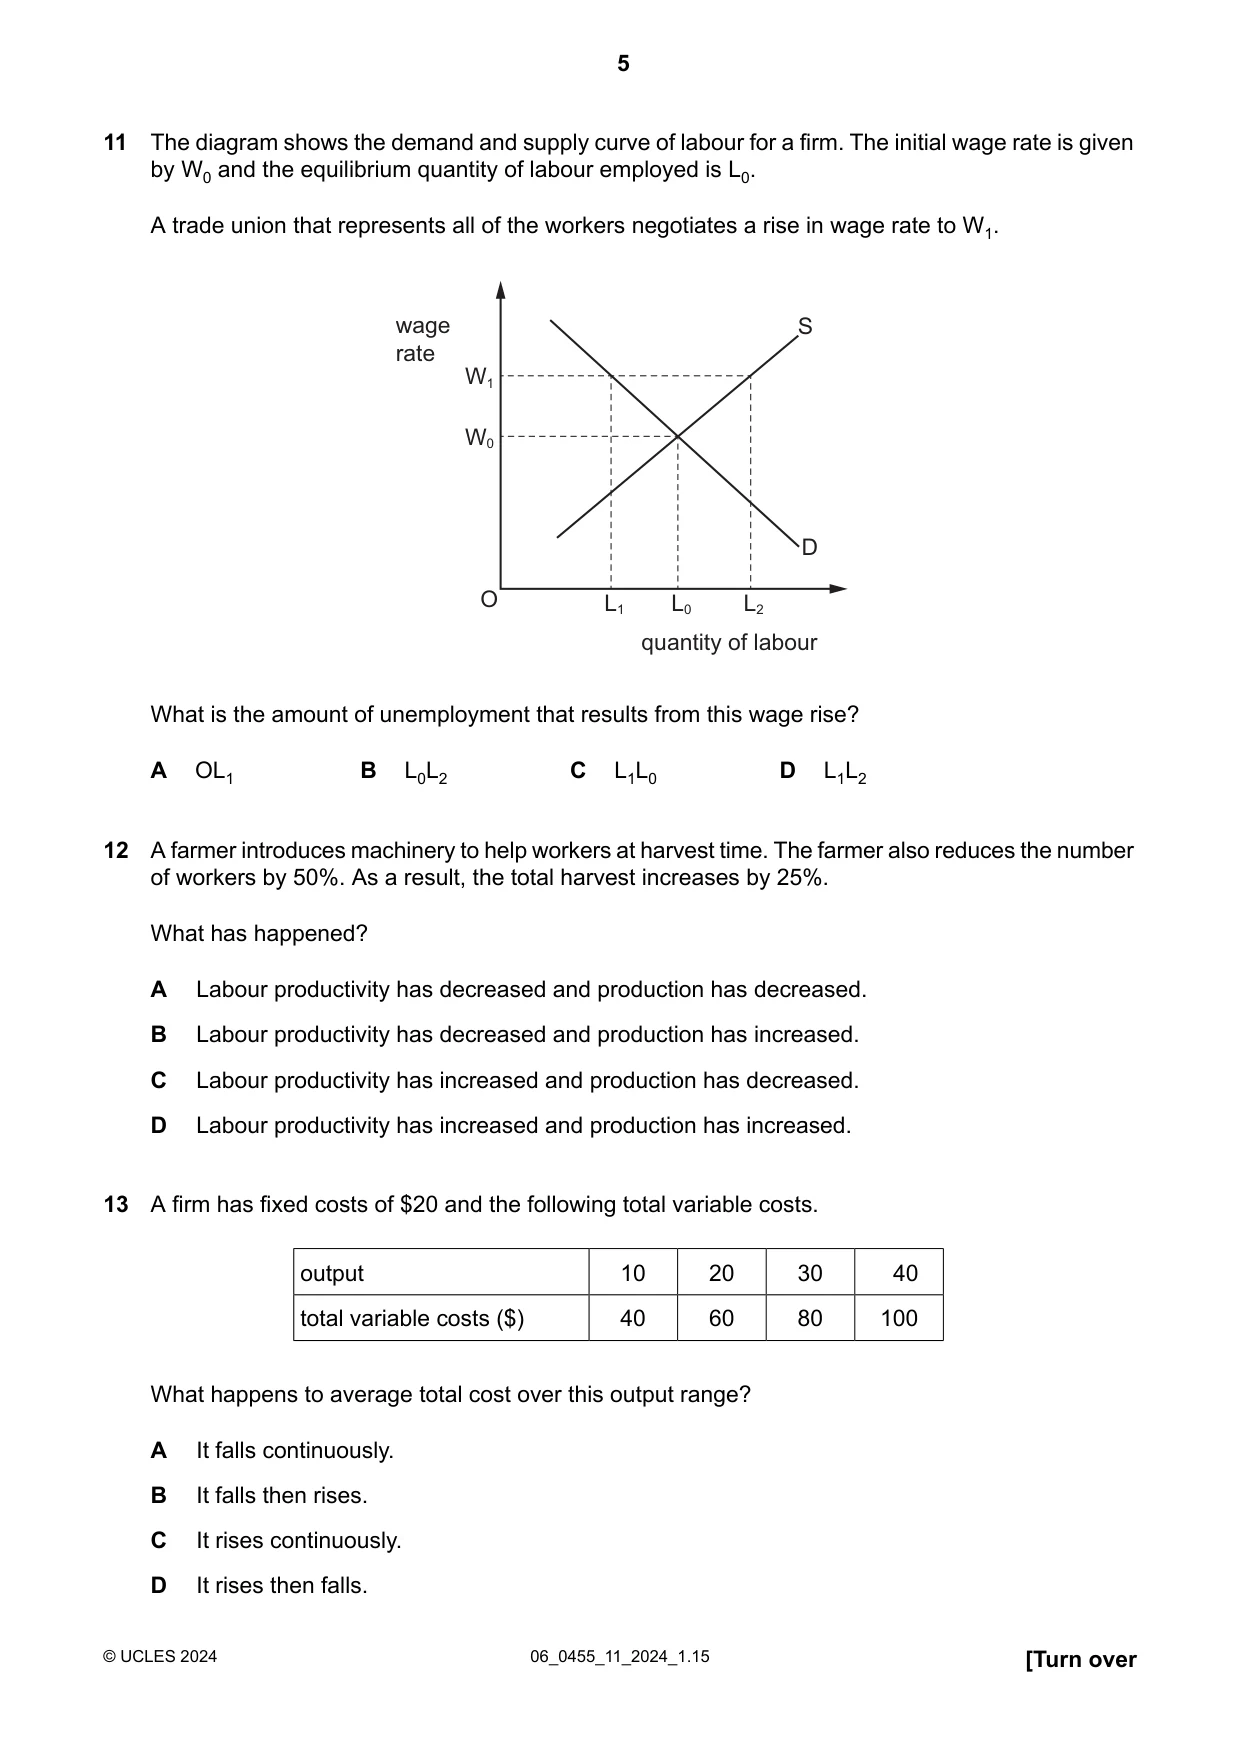
The diagram shows the demand and supply curve of labour for a firm. The initial wage rate is given by W0 and the equilibrium quantity of labour employed is L0. A trade union that represents all of the workers negotiates a rise in wage rate to W1. 11 O S D W1 L1 L0 L2 W0 wage rate quantity of labour What is the amount of unemployment that results from this wage rise? L1L2 D L1L0 C L0L2 B OL1 A A farmer introduces machinery to help workers at harvest time. The farmer also reduces the number of workers by 50%. As a result, the total harvest increases by 25%. What has happened? 12 Labour productivity has decreased and production has decreased. A Labour productivity has decreased and production has increased. B Labour productivity has increased and production has decreased. C Labour productivity has increased and production has increased. D A firm has fixed costs of $20 and the following total variable costs. 13 40 30 20 10 output 100 80 60 40 total variable costs ($) What happens to average total cost over this output range? It falls continuously. A It falls then rises. B It rises continuously. C It rises then falls. D [Turn over 06_0455_11_2024_1.15 © UCLES 2024 5
Question paper, page 6
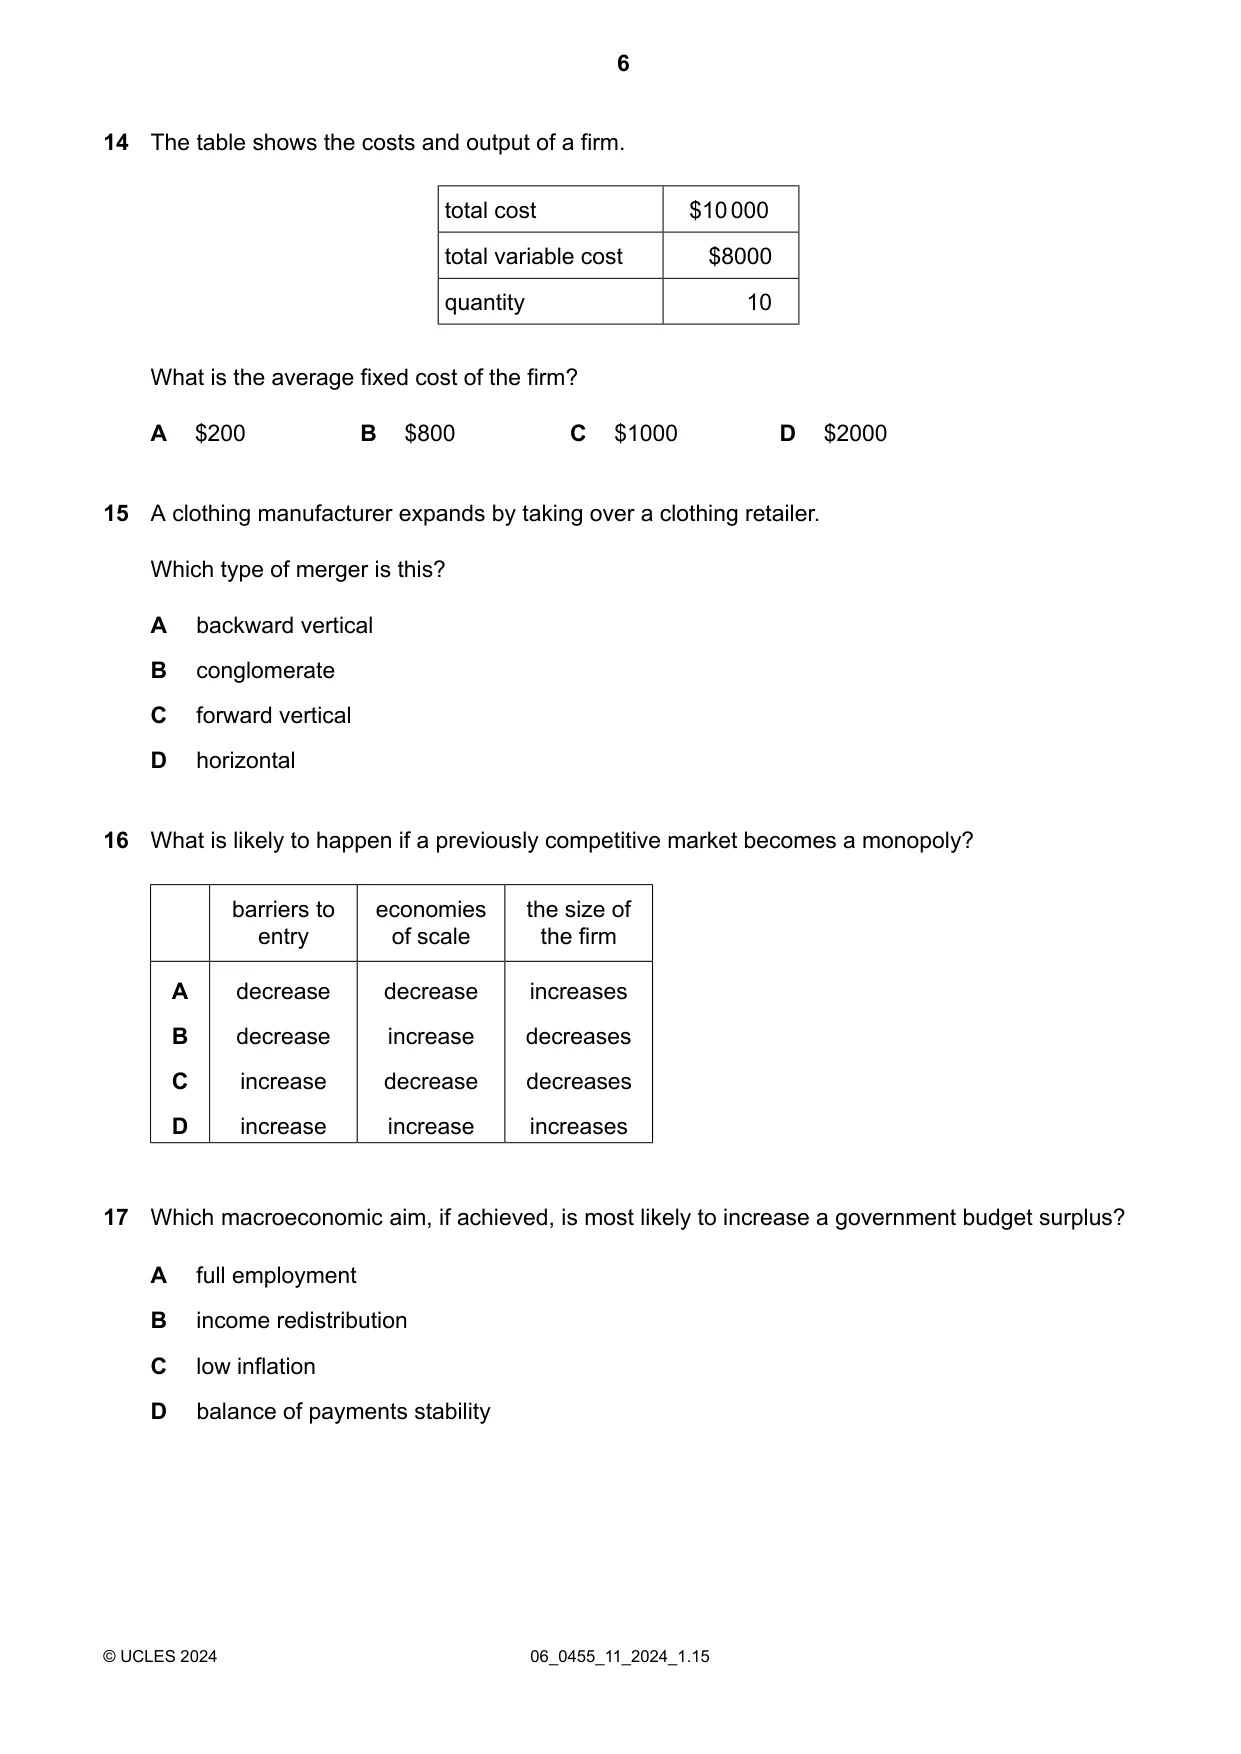
The table shows the costs and output of a firm. 14 $10 000 total cost $8000 total variable cost 10 quantity What is the average fixed cost of the firm? $2000 D $1000 C $800 B $200 A A clothing manufacturer expands by taking over a clothing retailer. Which type of merger is this? 15 backward vertical A conglomerate B forward vertical C horizontal D What is likely to happen if a previously competitive market becomes a monopoly? 16 the size of the firm economies of scale barriers to entry increases decrease decrease A decreases increase decrease B decreases decrease increase C increases increase increase D Which macroeconomic aim, if achieved, is most likely to increase a government budget surplus? 17 full employment A income redistribution B low inflation C balance of payments stability D 06_0455_11_2024_1.15 © UCLES 2024 6
Question paper, page 7
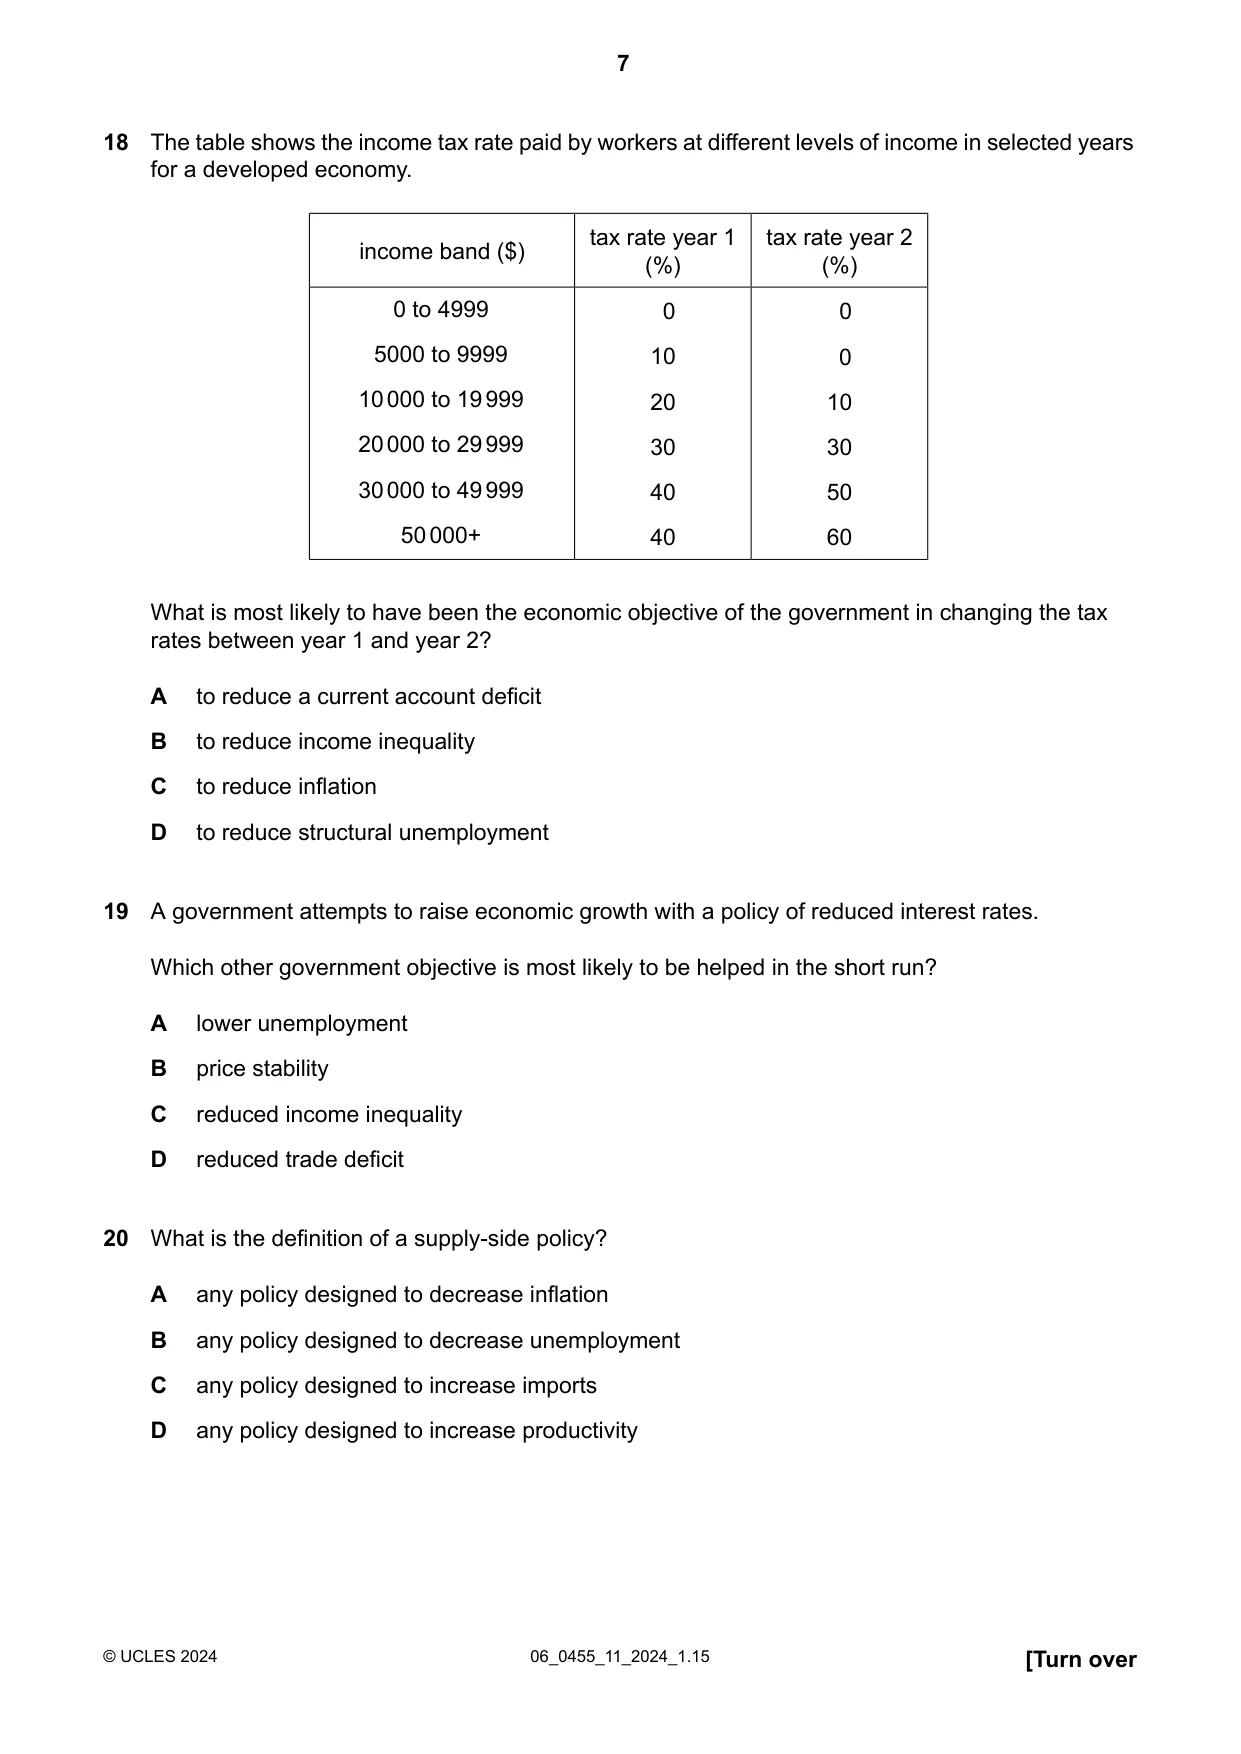
The table shows the income tax rate paid by workers at different levels of income in selected years for a developed economy. 18 tax rate year 2 (%) tax rate year 1 (%) income band ($) 0 0 0 10 10 20 30 30 50 40 60 40 0 to 4999 5000 to 9999 10 000 to 19 999 20 000 to 29 999 30 000 to 49 999 50 000+ What is most likely to have been the economic objective of the government in changing the tax rates between year 1 and year 2? to reduce a current account deficit A to reduce income inequality B to reduce inflation C to reduce structural unemployment D A government attempts to raise economic growth with a policy of reduced interest rates. Which other government objective is most likely to be helped in the short run? 19 lower unemployment A price stability B reduced income inequality C reduced trade deficit D What is the definition of a supply-side policy? 20 any policy designed to decrease inflation A any policy designed to decrease unemployment B any policy designed to increase imports C any policy designed to increase productivity D [Turn over 06_0455_11_2024_1.15 © UCLES 2024 7
Question paper, page 8
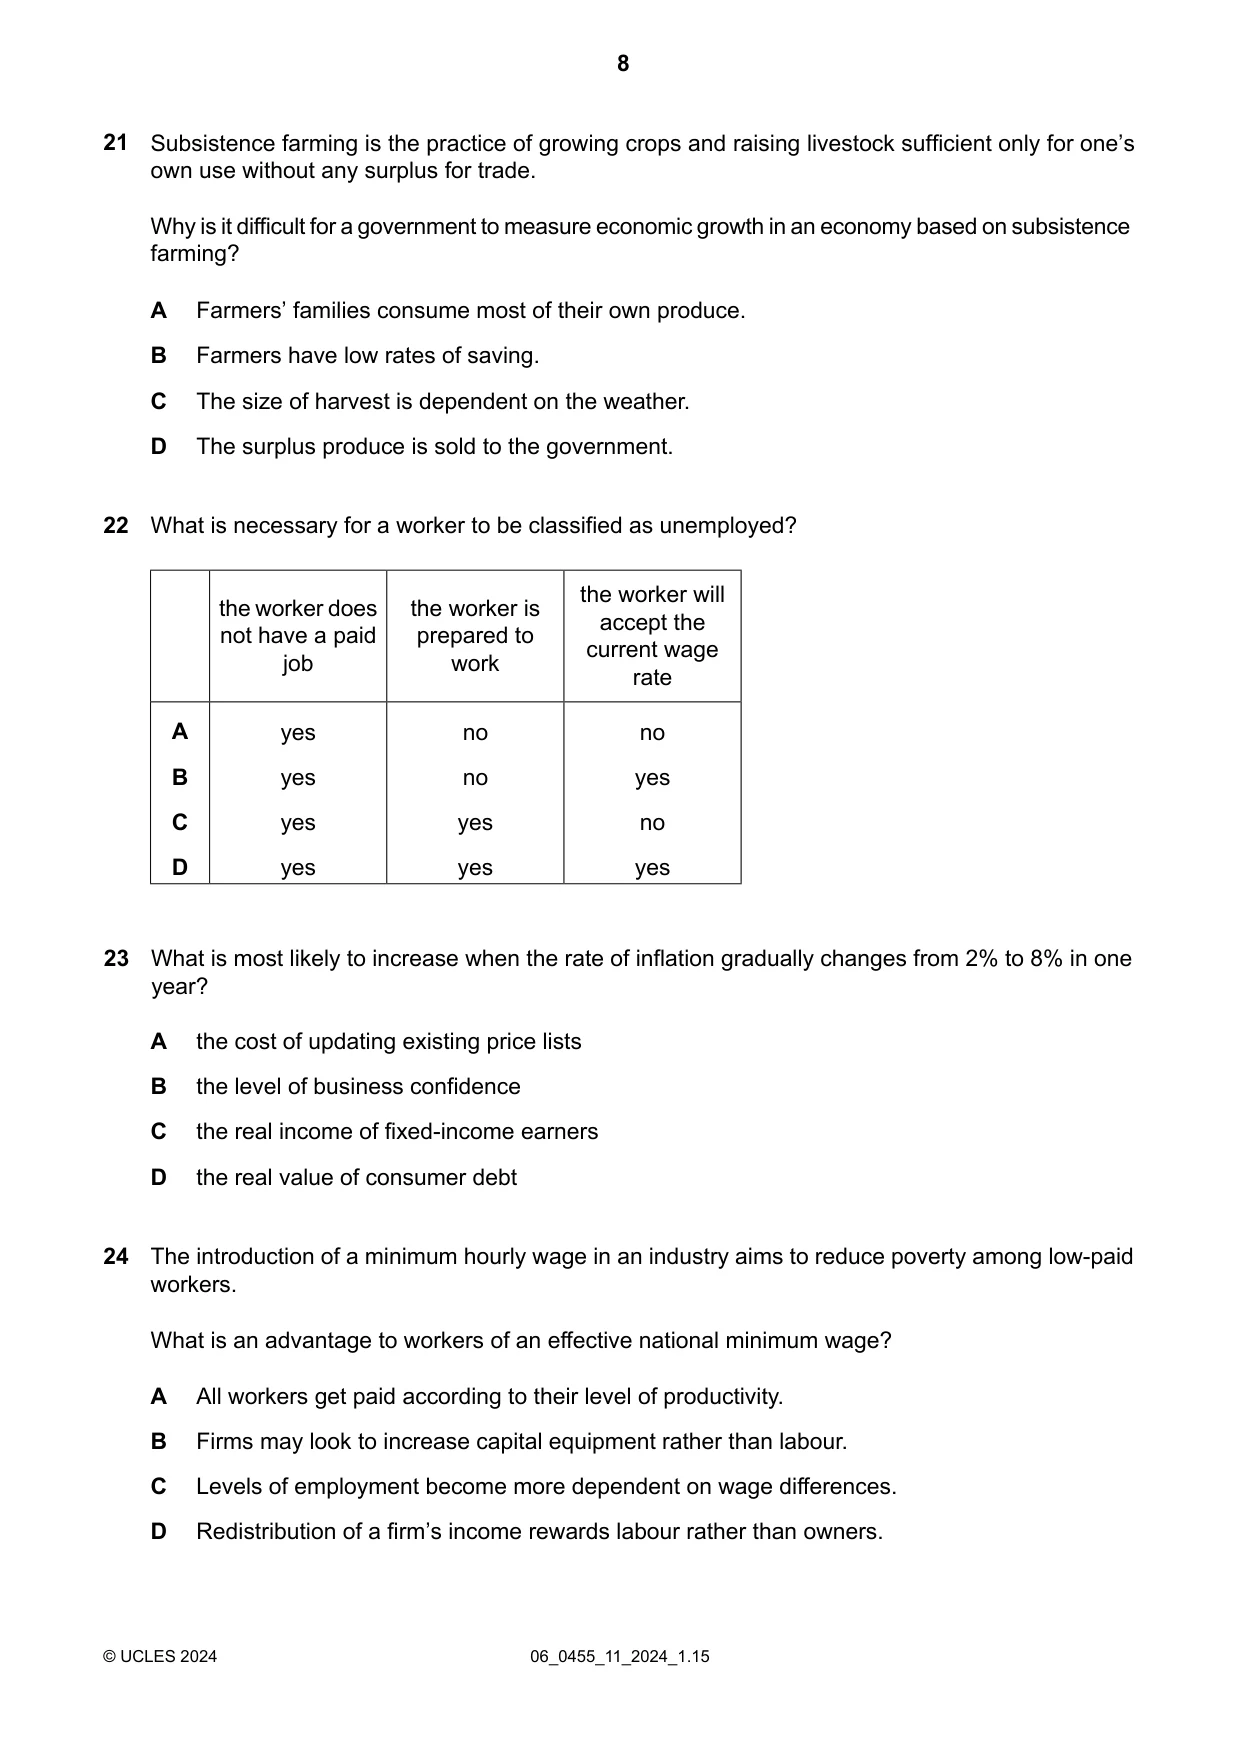
Subsistence farming is the practice of growing crops and raising livestock sufficient only for one’s own use without any surplus for trade. Why is it difficult for a government to measure economic growth in an economy based on subsistence farming? 21 Farmers’ families consume most of their own produce. A Farmers have low rates of saving. B The size of harvest is dependent on the weather. C The surplus produce is sold to the government. D What is necessary for a worker to be classified as unemployed? 22 the worker will accept the current wage rate the worker is prepared to work the worker does not have a paid job no no yes A yes no yes B no yes yes C yes yes yes D 23 What is most likely to increase when the rate of inflation gradually changes from 2% to 8% in one year? the cost of updating existing price lists A the level of business confidence B the real income of fixed-income earners C the real value of consumer debt D The introduction of a minimum hourly wage in an industry aims to reduce poverty among low-paid workers. What is an advantage to workers of an effective national minimum wage? 24 All workers get paid according to their level of productivity. A Firms may look to increase capital equipment rather than labour. B Levels of employment become more dependent on wage differences. C Redistribution of a firm’s income rewards labour rather than owners. D 06_0455_11_2024_1.15 © UCLES 2024 8
Question paper, page 9
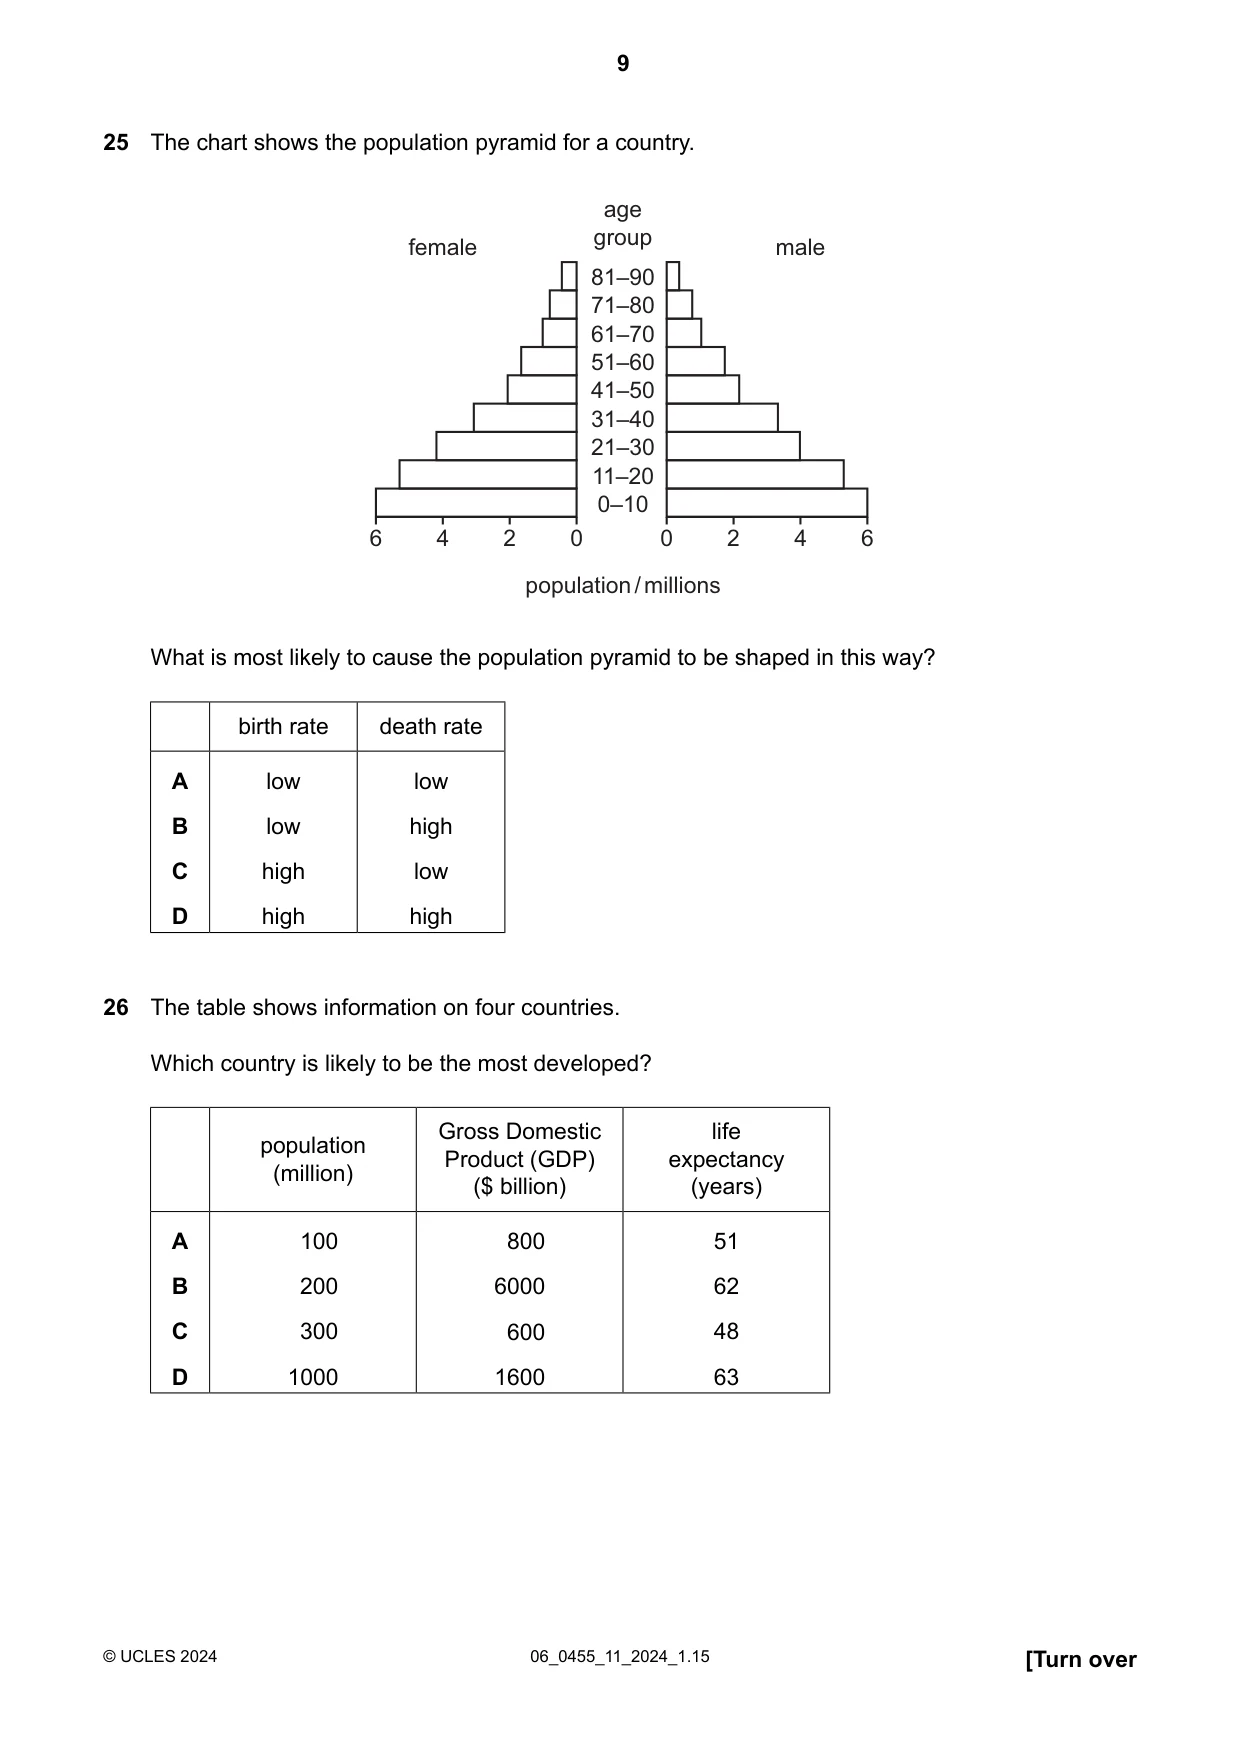
The chart shows the population pyramid for a country. 25 0 0 2 2 4 4 6 6 81–90 71–80 61–70 51–60 41–50 31–40 21–30 11–20 0–10 age group female male population / millions What is most likely to cause the population pyramid to be shaped in this way? death rate birth rate low low A high low B low high C high high D The table shows information on four countries. Which country is likely to be the most developed? 26 life expectancy (years) Gross Domestic Product (GDP) ($ billion) population (million) 51 800 100 A 62 6000 200 B 48 600 300 C 63 1600 1000 D [Turn over 06_0455_11_2024_1.15 © UCLES 2024 9
Question paper, page 10
27 What is an advantage to a firm of specialisation at a national level? dependency on supplies from other countries A greater competition from overseas firms B greater depletion of the country’s natural resources C lower average costs due to economies of scale D What is an intended outcome of protecting infant industries from free trade? 28 to decrease the competitiveness of domestic firms A to decrease the demand for exported goods B to increase employment in domestic firms C to increase the supply of imported goods D In the diagram, curves D1 and S1 relate to the demand and supply of the US dollar ($) against the Chinese yuan. 29 O price of $ (in yuan) quantity P1 S1 D1 D2 P2 What is most likely to cause the demand curve for US dollars to shift from D1 to D2? a fall in Chinese interest rates A a fall in US interest rates B a faster growth rate in the US economy C a reduction in the US government budget deficit D 06_0455_11_2024_1.15 © UCLES 2024 10
Question paper, page 11
Brazil had a balance of payments current account deficit of US$23.5 billion. Which policy is most likely to reduce the current account deficit in Brazil? 30 depreciate Brazil’s currency A reduce rates of income tax in Brazil B reduce subsidies to Brazil’s exporting firms C reduce tariffs on Brazil’s imports D 06_0455_11_2024_1.15 © UCLES 2024 11
Question paper, page 12
Permission to reproduce items where third-party owned material protected by copyright is included has been sought and cleared where possible. Every reasonable effort has been made by the publisher (UCLES) to trace copyright holders, but if any items requiring clearance have unwittingly been included, the publisher will be pleased to make amends at the earliest possible opportunity. To avoid the issue of disclosure of answer-related information to candidates, all copyright acknowledgements are reproduced online in the Cambridge Assessment International Education Copyright Acknowledgements Booklet. This is produced for each series of examinations and is freely available to download at www.cambridgeinternational.org after the live examination series. Cambridge Assessment International Education is part of Cambridge Assessment. Cambridge Assessment is the brand name of the University of Cambridge Local Examinations Syndicate (UCLES), which is a department of the University of Cambridge. © UCLES 2024 06_0455_11_2024_1.15 BLANK PAGE 12
Mark scheme, page 1
This document consists of 3 printed pages. © Cambridge University Press & Assessment 2024 [Turn over Cambridge IGCSE™ ECONOMICS 0455/11 Paper 1 Multiple Choice May/June 2024 MARK SCHEME Maximum Mark: 30 Published This mark scheme is published as an aid to teachers and candidates, to indicate the requirements of the examination. Mark schemes should be read in conjunction with the question paper and the Principal Examiner Report for Teachers. Cambridge International will not enter into discussions about these mark schemes. Cambridge International is publishing the mark schemes for the May/June 2024 series for most Cambridge IGCSE, Cambridge International A and AS Level and Cambridge Pre-U components, and some Cambridge O Level components.
Mark scheme, page 2
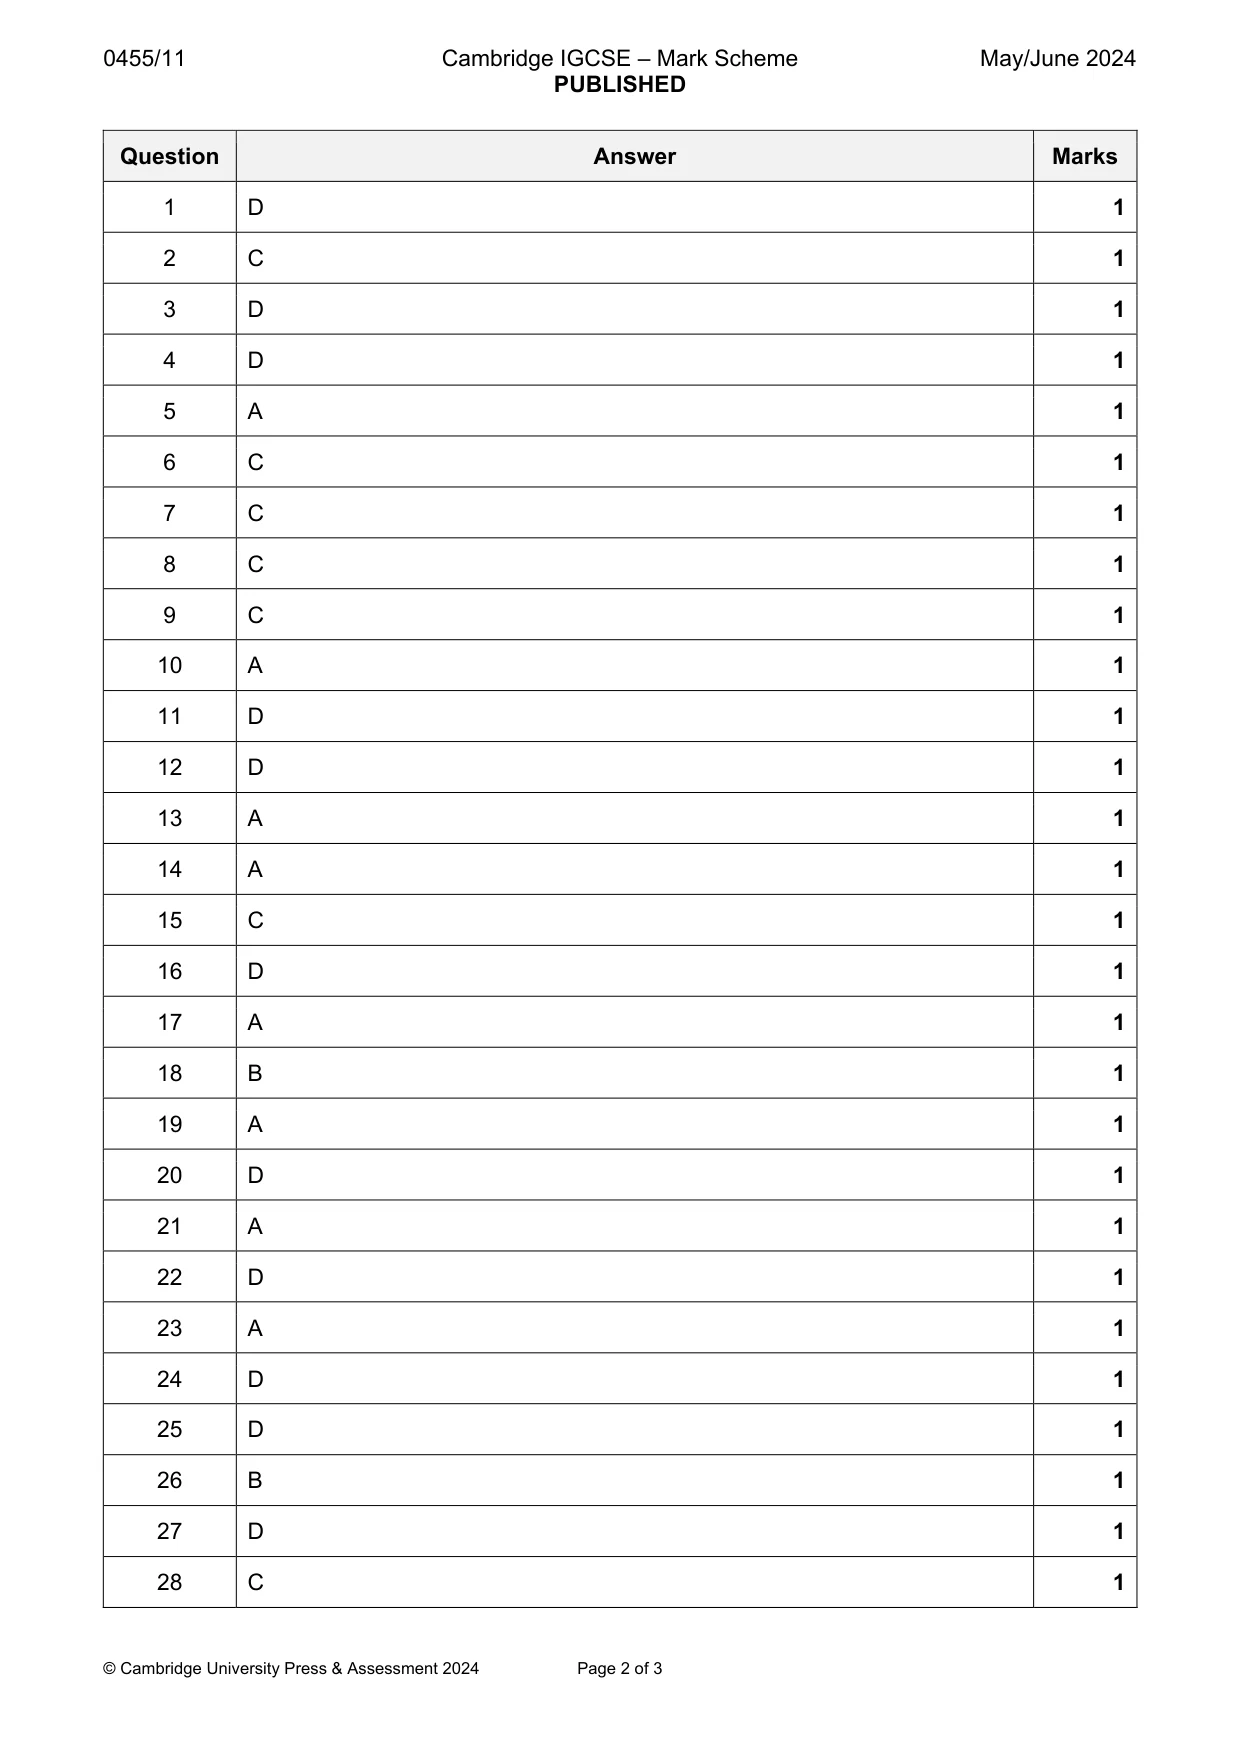
0455/11 Cambridge IGCSE – Mark Scheme PUBLISHED May/June 2024 © Cambridge University Press & Assessment 2024 Page 2 of 3 Question Answer Marks 1 D 1 2 C 1 3 D 1 4 D 1 5 A 1 6 C 1 7 C 1 8 C 1 9 C 1 10 A 1 11 D 1 12 D 1 13 A 1 14 A 1 15 C 1 16 D 1 17 A 1 18 B 1 19 A 1 20 D 1 21 A 1 22 D 1 23 A 1 24 D 1 25 D 1 26 B 1 27 D 1 28 C 1
Mark scheme, page 3
0455/11 Cambridge IGCSE – Mark Scheme PUBLISHED May/June 2024 © Cambridge University Press & Assessment 2024 Page 3 of 3 Question Answer Marks 29 B 1 30 A 1
What you needed in this session
Cambridge’s own grade thresholds for 2024 May/June, Paper 1 · Variant 1. A higher threshold means an easier paper — the bar moves with how the cohort did.