Cambridge IGCSE Biology (9-1) 0970 — 2023 May/June Paper 4 · Variant 2
0970/42/M/J/23 · 7 questions · 80 marks · ≈90 min
The question paper and its mark scheme, free to read here and free to download. This is Cambridge’s own paper, exactly as it was sat.
Question paper20 pages



Mark scheme12 pages
Answers below. Sit the paper first if you are practising.
Questions as text
Q1 · A diagram of part of a cross‑section of a leaf
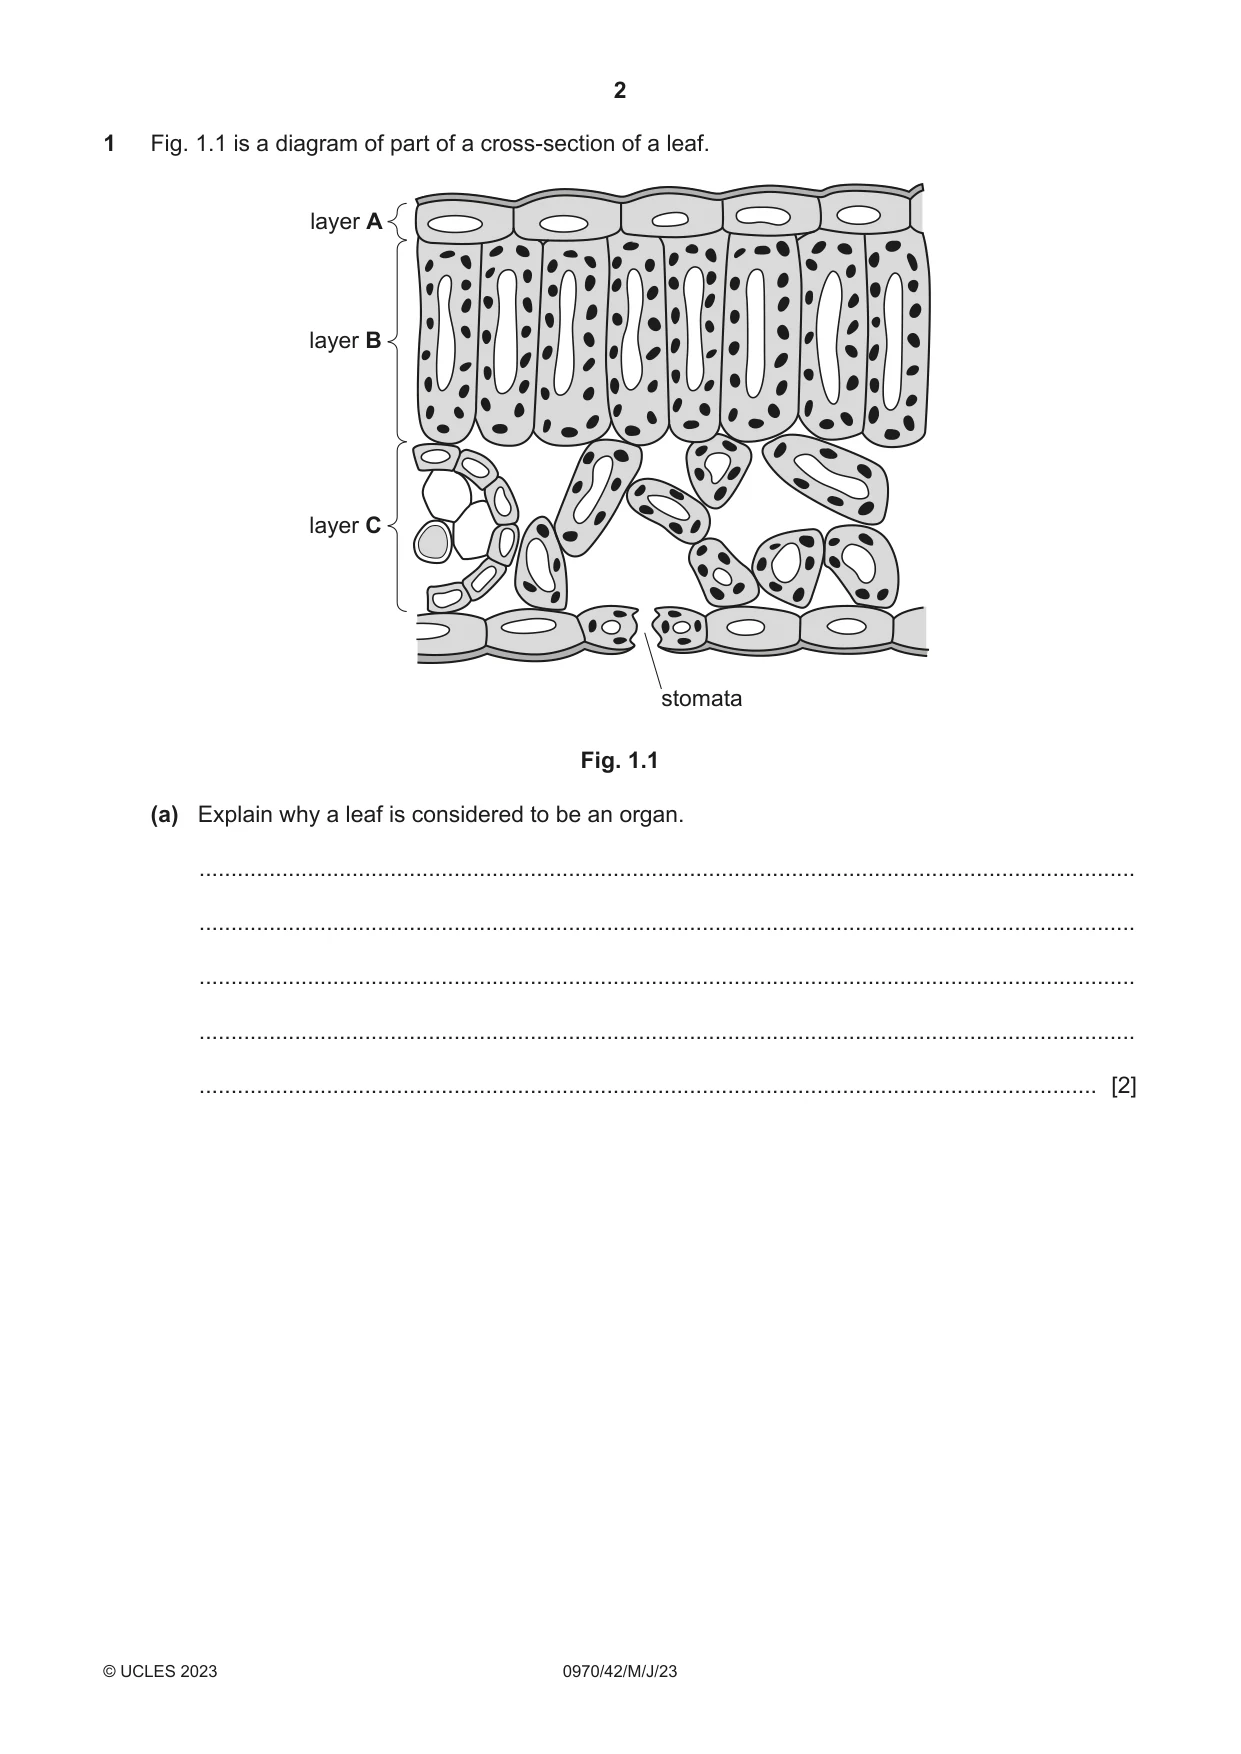
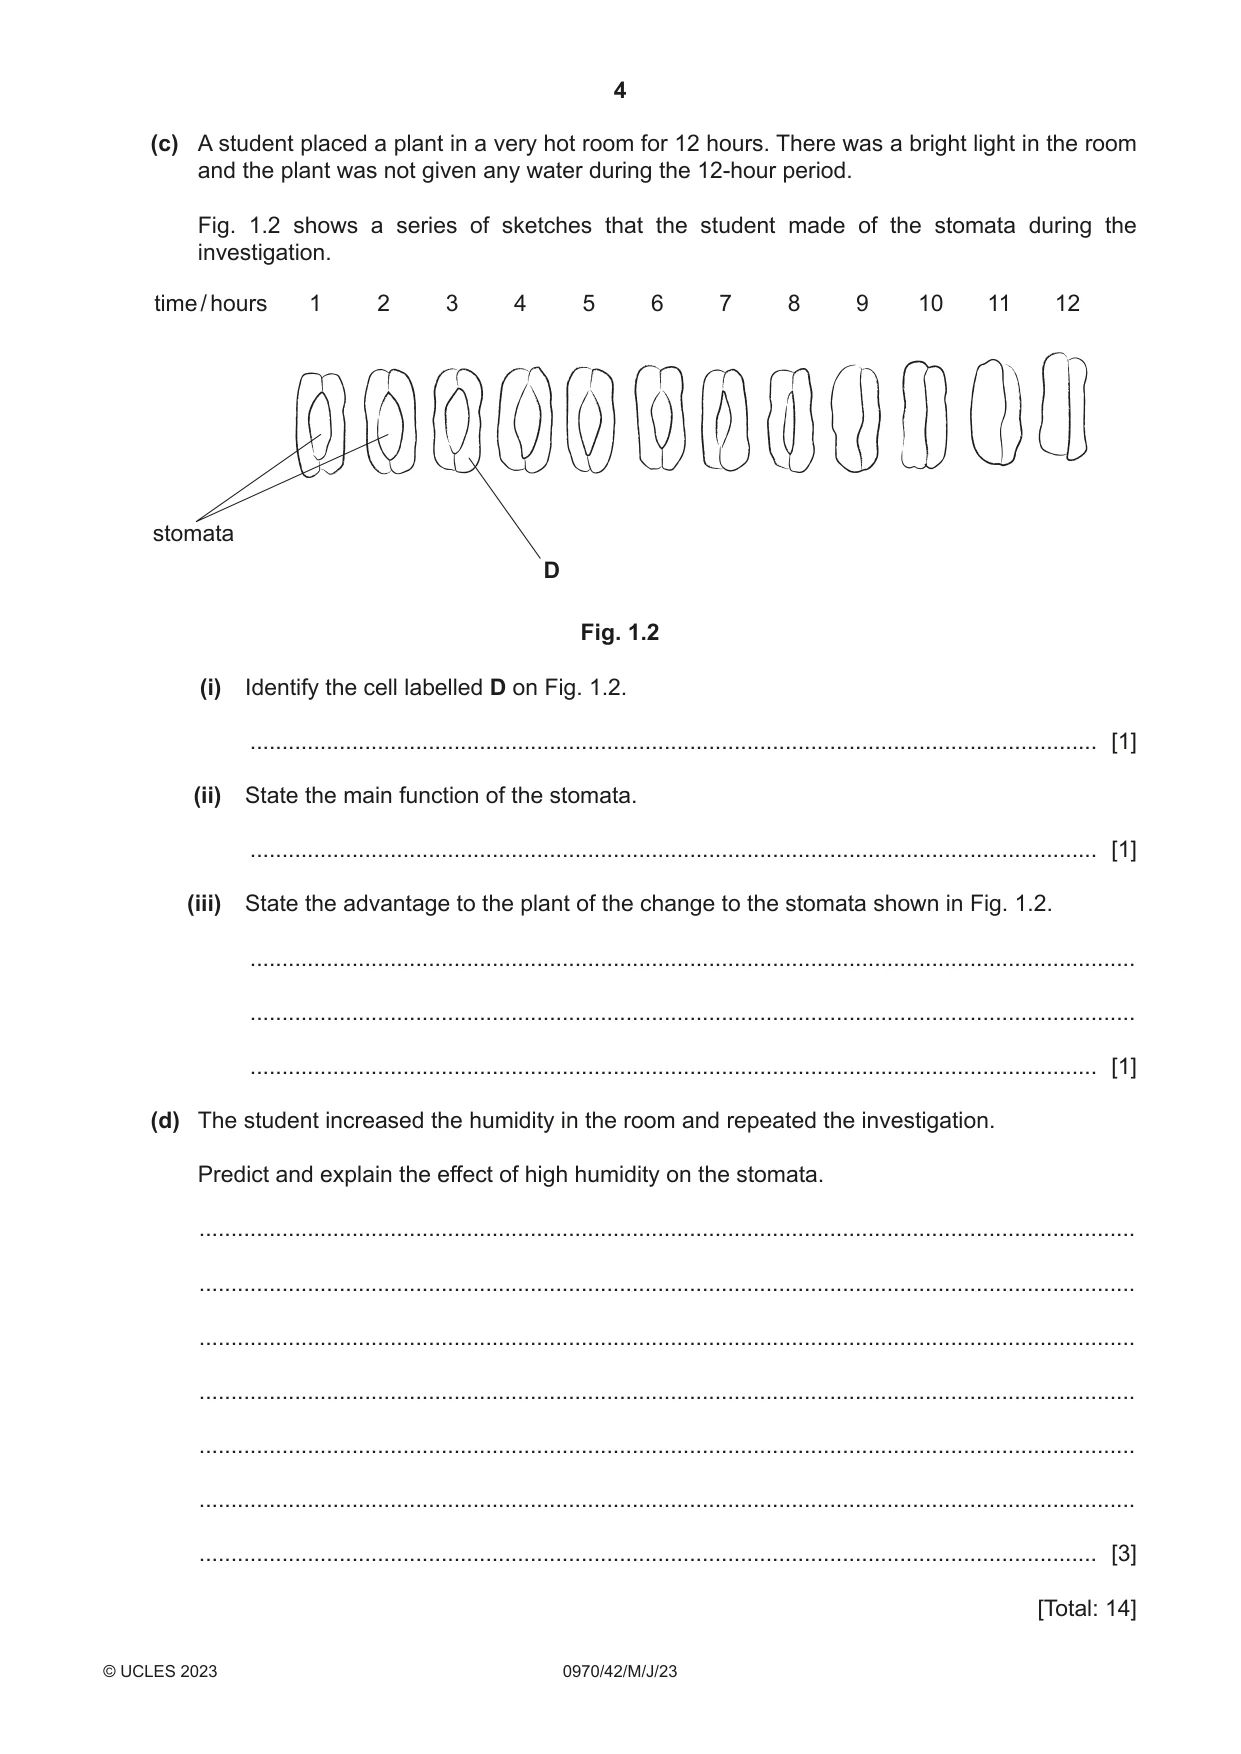
1 Fig. 1.1 is a diagram of part of a cross‑section of a leaf. layer A layer B layer C stomata Fig. 1.1 (a) Explain why a leaf is considered to be an organ. ................................................................................................................................................... ................................................................................................................................................... ................................................................................................................................................... ................................................................................................................................................... ............................................................................................................................................. [2] (b) Explain how layer B and layer C in Fig. 1.1 are adapted for their functions. ................................................................................................................................................... ................................................................................................................................................... ................................................................................................................................................... ................................................................................................................................................... ................................................................................................................................................... ................................................................................................................................................... ................................................................................................................................................... ................................................................................................................................................... ................................................................................................................................................... ................................................................................................................................................... ................................................................................................................................................... ................................................................................................................................................... ............................................................................................................................................. [6] (c) A student placed a plant in a very hot room for 12 hours. There was a bright light in the room and the plant was not given any water during the 12‑hour period. Fig. 1.2 shows a series of sketches that the student made of the stomata during the investigation. time / hours 1 2 3 4 5 6 7 8 9 10 11 12 stomata D Fig. 1.2 (i) Identify the cell labelled D on Fig. 1.2. ..................................................................................................................................... [1] (ii) State the main function of the stomata. ..................................................................................................................................... [1] (iii) State the advantage to the plant of the change to the stomata shown in Fig. 1.2. ........................................................................................................................................... ........................................................................................................................................... ..................................................................................................................................... [1] (d) The student increased the humidity in the room and repeated the investigation. Predict and explain the effect of high humidity on the stomata. ................................................................................................................................................... ................................................................................................................................................... ................................................................................................................................................... ................................................................................................................................................... ................................................................................................................................................... ................................................................................................................................................... ............................................................................................................................................. [3] [Total: 14]
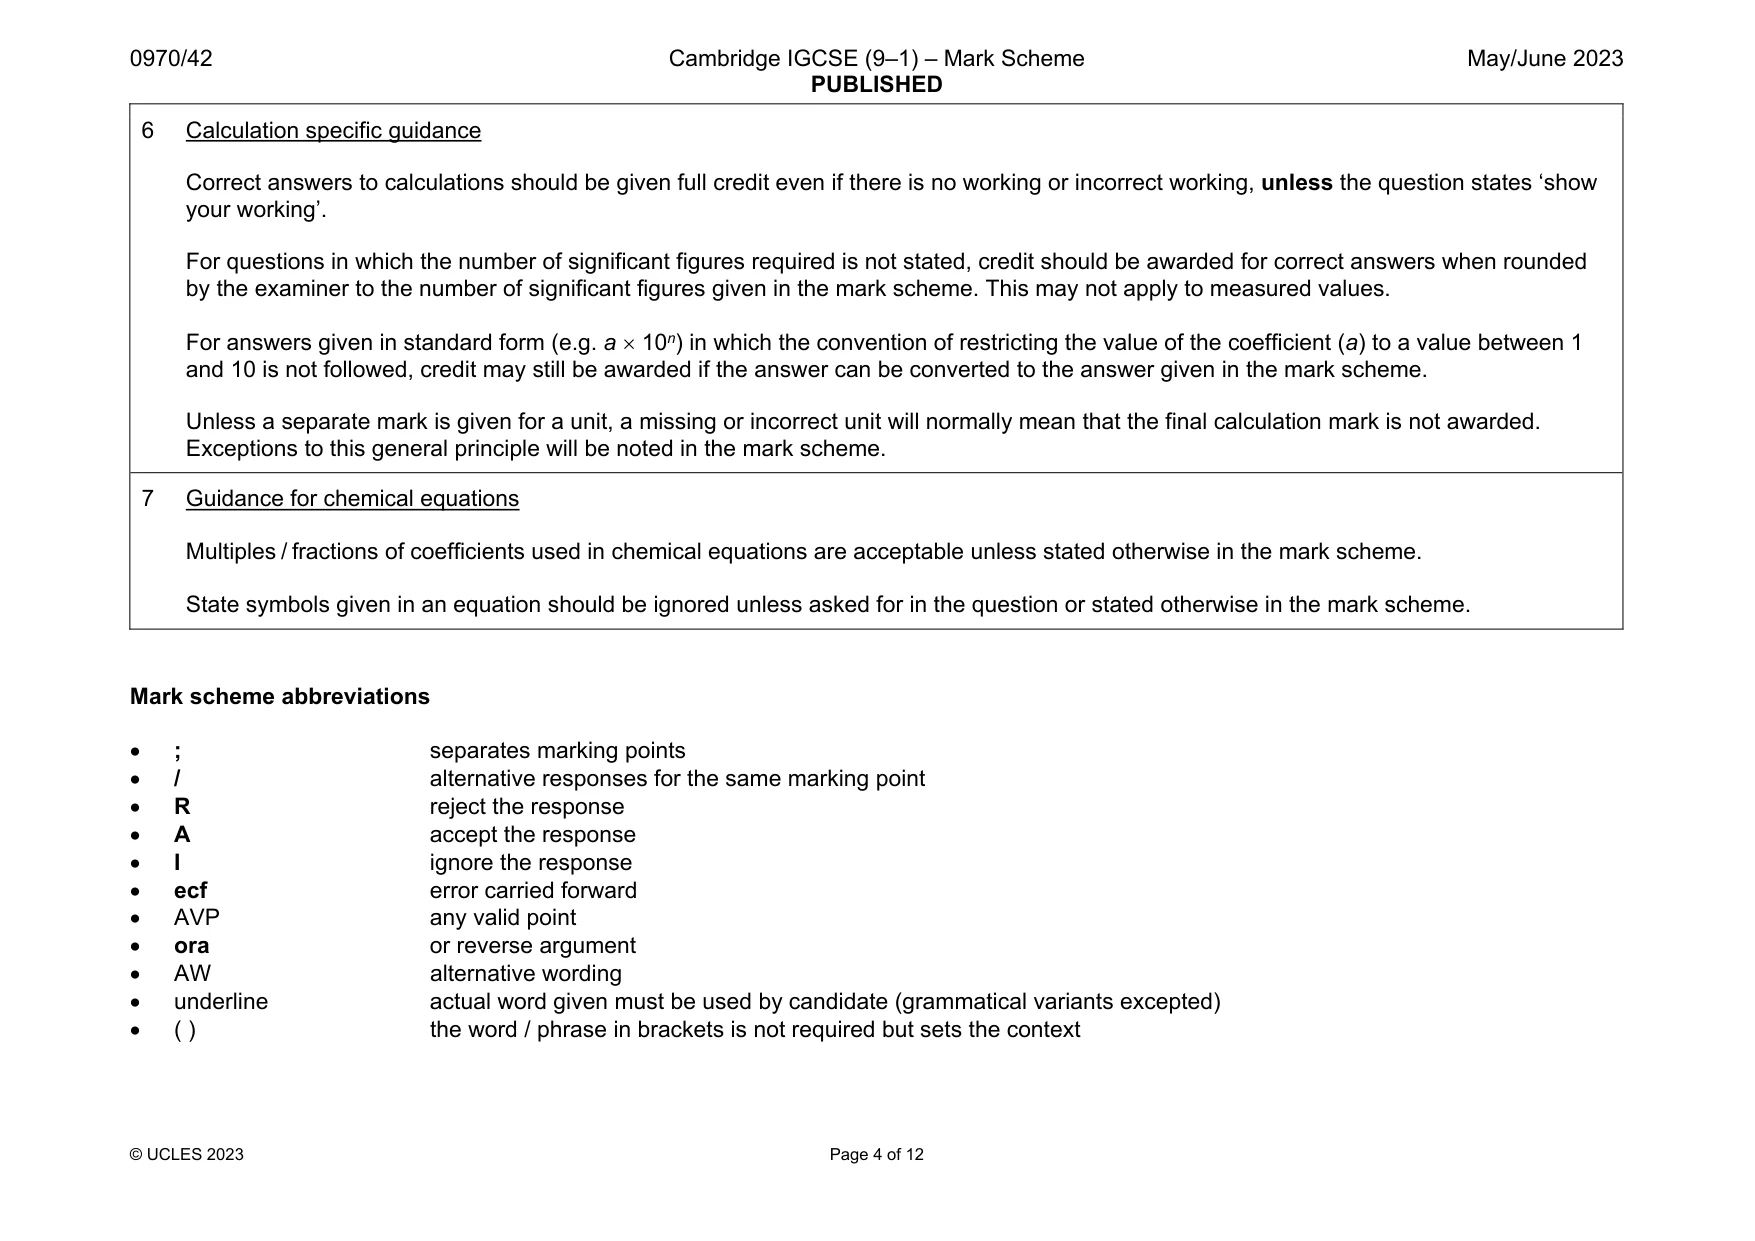
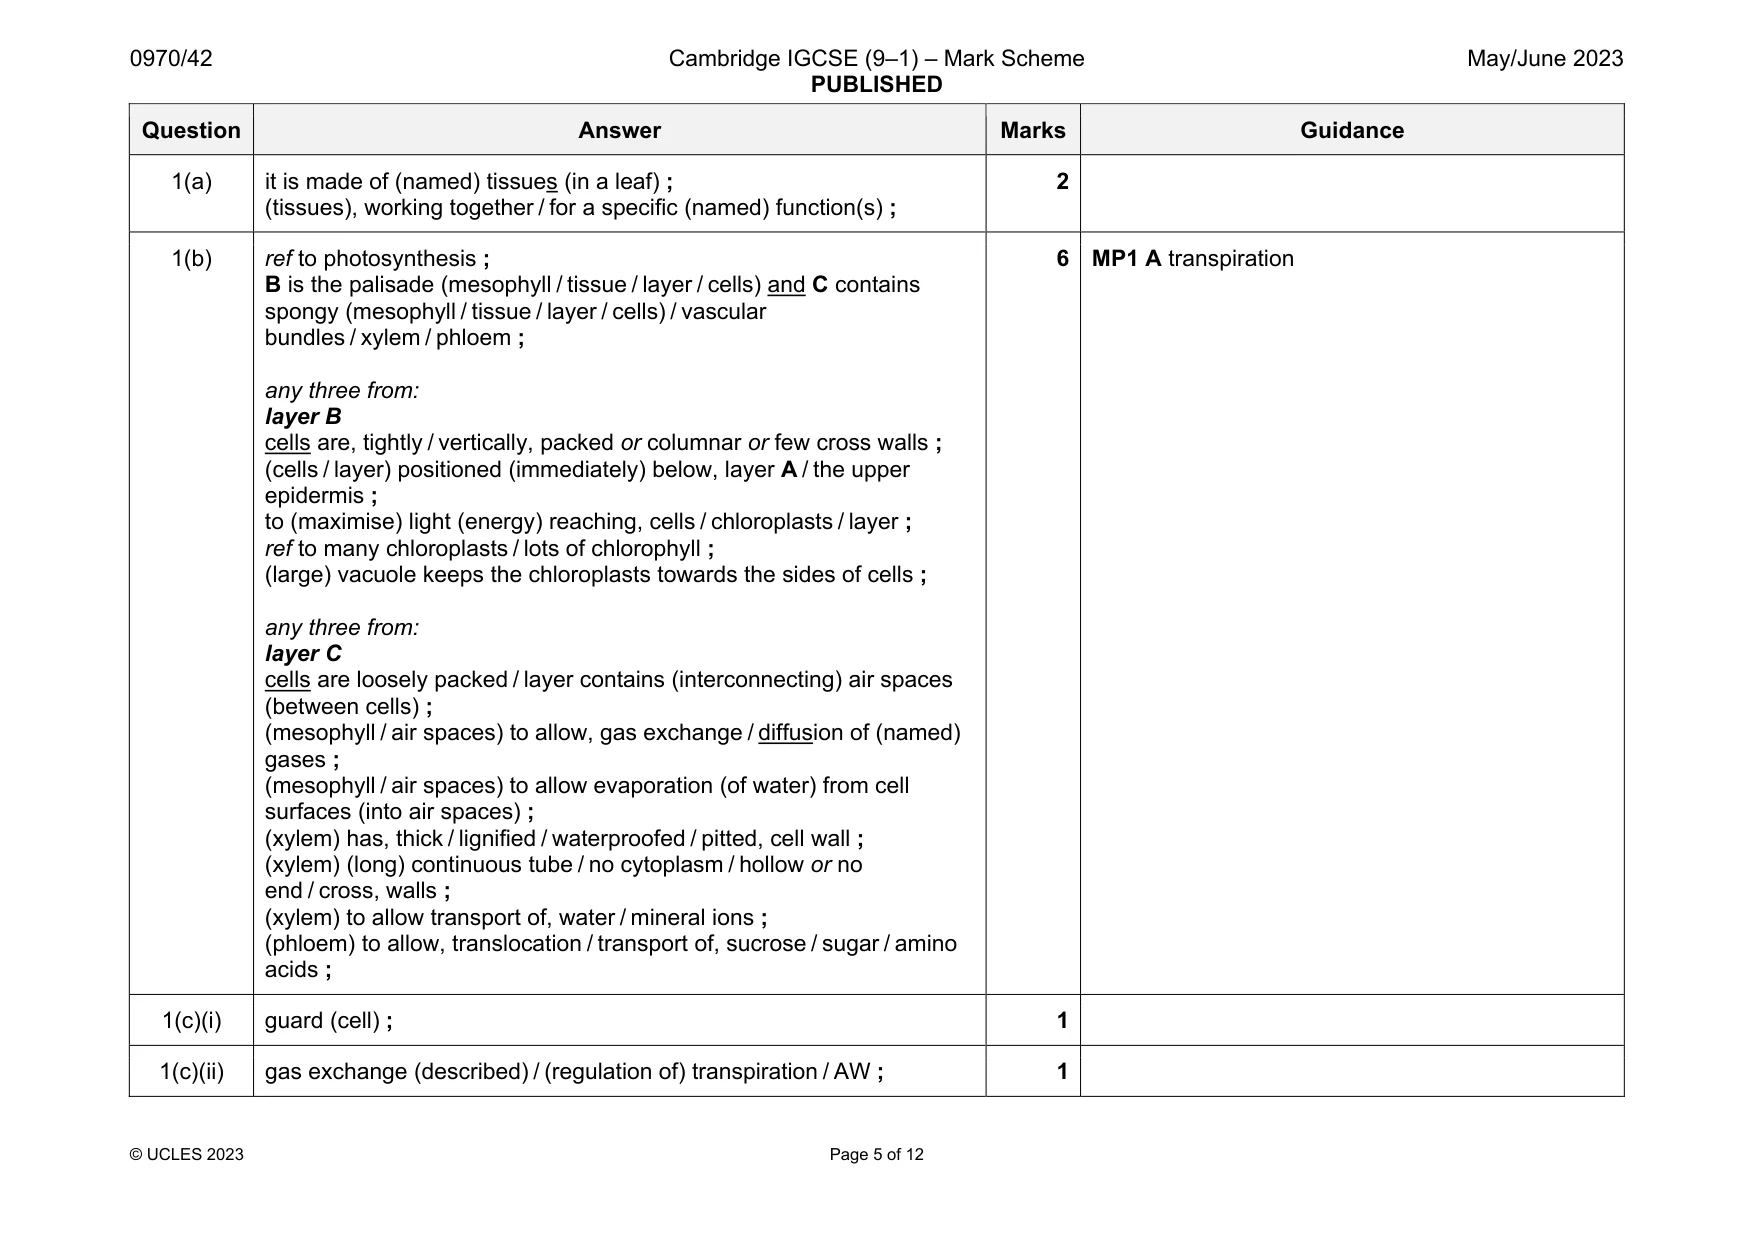
Mark scheme: 1(a) it is made of (named) tissues (in a leaf) ; (tissues), working together / for a specific (named) function(s) ; 2 1(b) ref to photosynthesis ; B is the palisade (mesophyll / tissue / layer / cells) and C contains spongy (mesophyll / tissue / layer / cells) / vascular bundles / xylem / phloem ; any three from: layer B cells are, tightly / vertically, packed or columnar or few cross walls ; (cells / layer) positioned (immediately) below, layer A / the upper epidermis ; to (maximise) light (energy) reaching, cells / chloroplasts / layer ; ref to many chloroplasts / lots of chlorophyll ; (large) vacuole keeps the chloroplasts towards the sides of cells ; any three from: layer C cells are loosely packed / layer contains (interconnecting) air spaces (between cells) ; (mesophyll / air spaces) to allow, gas exchange / diffusion of (named) gases ; (mesophyll / air spaces) to allow evaporation (of water) from cell surfaces (into air spaces) ; (xylem) has, thick / lignified / waterproofed / pitted, cell wall ; (xylem) (long) continuous tube / no cytoplasm / hollow or no end / cross, walls ; (xylem) to allow transport of, water / mineral ions ; (phloem) to allow, translocation / transport of, sucrose / sugar / amino acids ; 6 MP1 A transpiration 1(c)(i) guard (cell) ; 1 1(c)(ii) gas exchange (described) / (regulation of) transpiration / AW ; 1 Question Answer Marks Guidance 1(c)(iii) reduce water loss (through transpiration) ; ref to preventing wilting ; 1 1(d) any three from: stomata will take longer to close / reduces (stomatal) closure / reduces (stomatal) response ; reduced, water vapour / concentration / diffusion, gradient (between the air spaces and the outside) ; so the (guard) cells do not lose water (as, quickly / much as the first experiment) ; the (guard) cells, stay / become, turgid or (guard) cells take longer to become flaccid ; 3
Q2 · A diagram of part of a DNA molecule
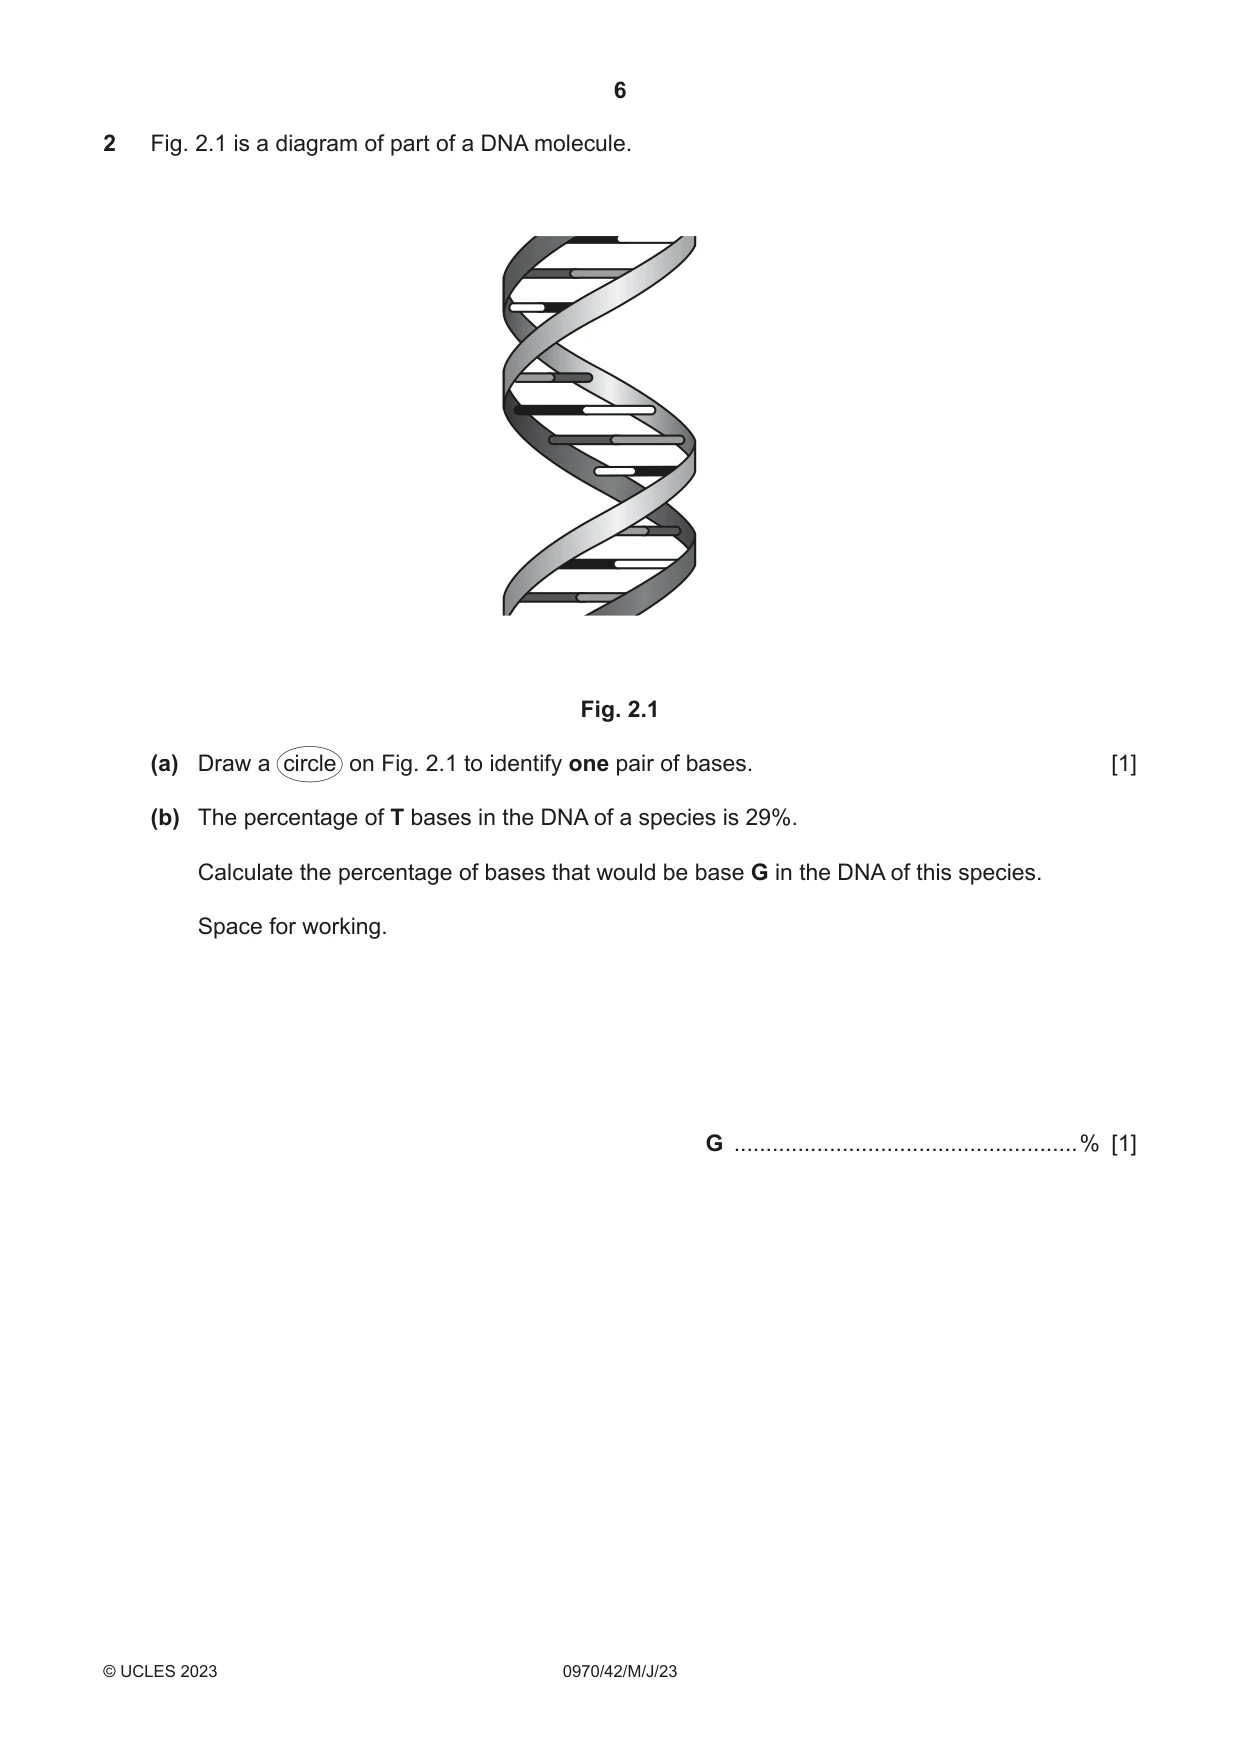
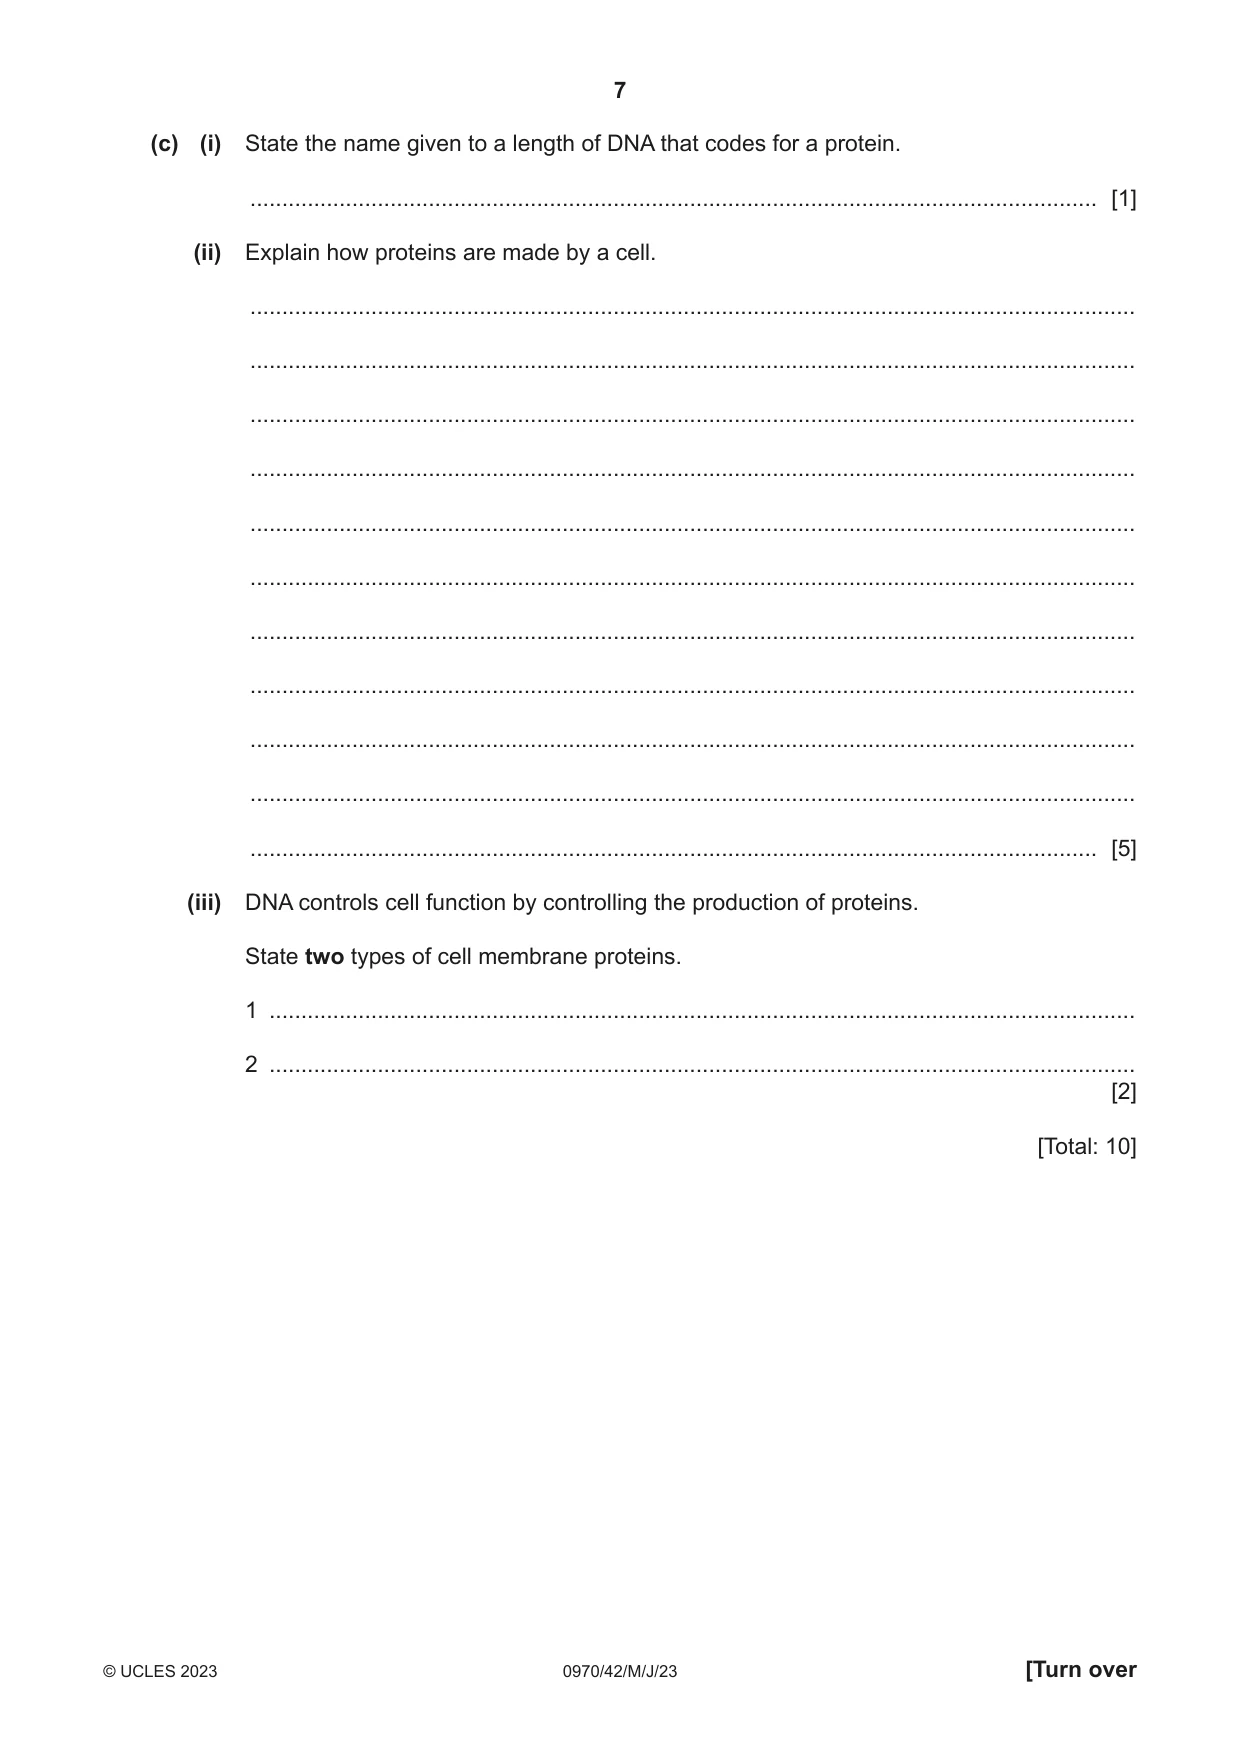
2 Fig. 2.1 is a diagram of part of a DNA molecule. Fig. 2.1 (a) Draw a circle on Fig. 2.1 to identify one pair of bases. [1] (b) The percentage of T bases in the DNA of a species is 29%. Calculate the percentage of bases that would be base G in the DNA of this species. Space for working. G ......................................................% [1] (c) (i) State the name given to a length of DNA that codes for a protein. ..................................................................................................................................... [1] (ii) Explain how proteins are made by a cell. ........................................................................................................................................... ........................................................................................................................................... ........................................................................................................................................... ........................................................................................................................................... ........................................................................................................................................... ........................................................................................................................................... ........................................................................................................................................... ........................................................................................................................................... ........................................................................................................................................... ........................................................................................................................................... ..................................................................................................................................... [5] (iii) DNA controls cell function by controlling the production of proteins. State two types of cell membrane proteins. 1 ........................................................................................................................................ 2 ........................................................................................................................................ [2] [Total: 10]
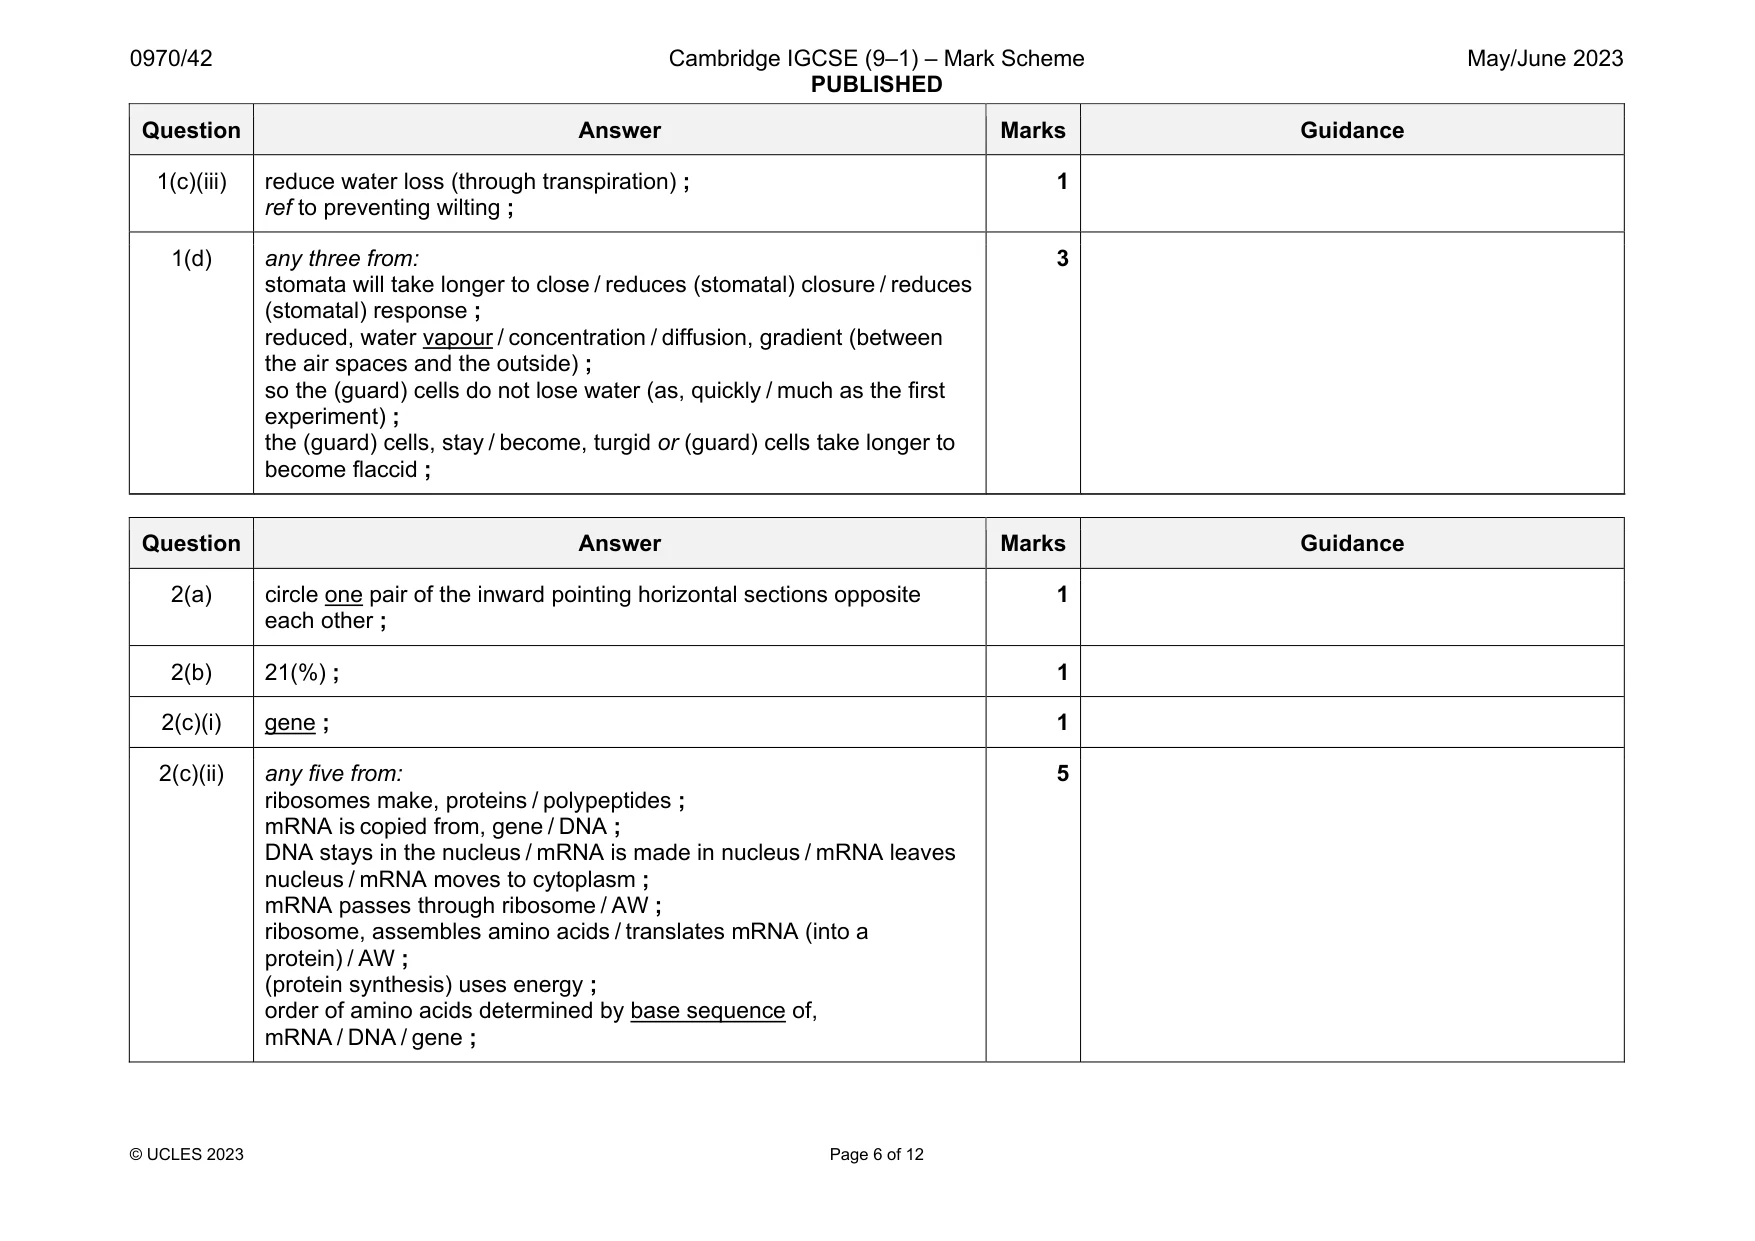
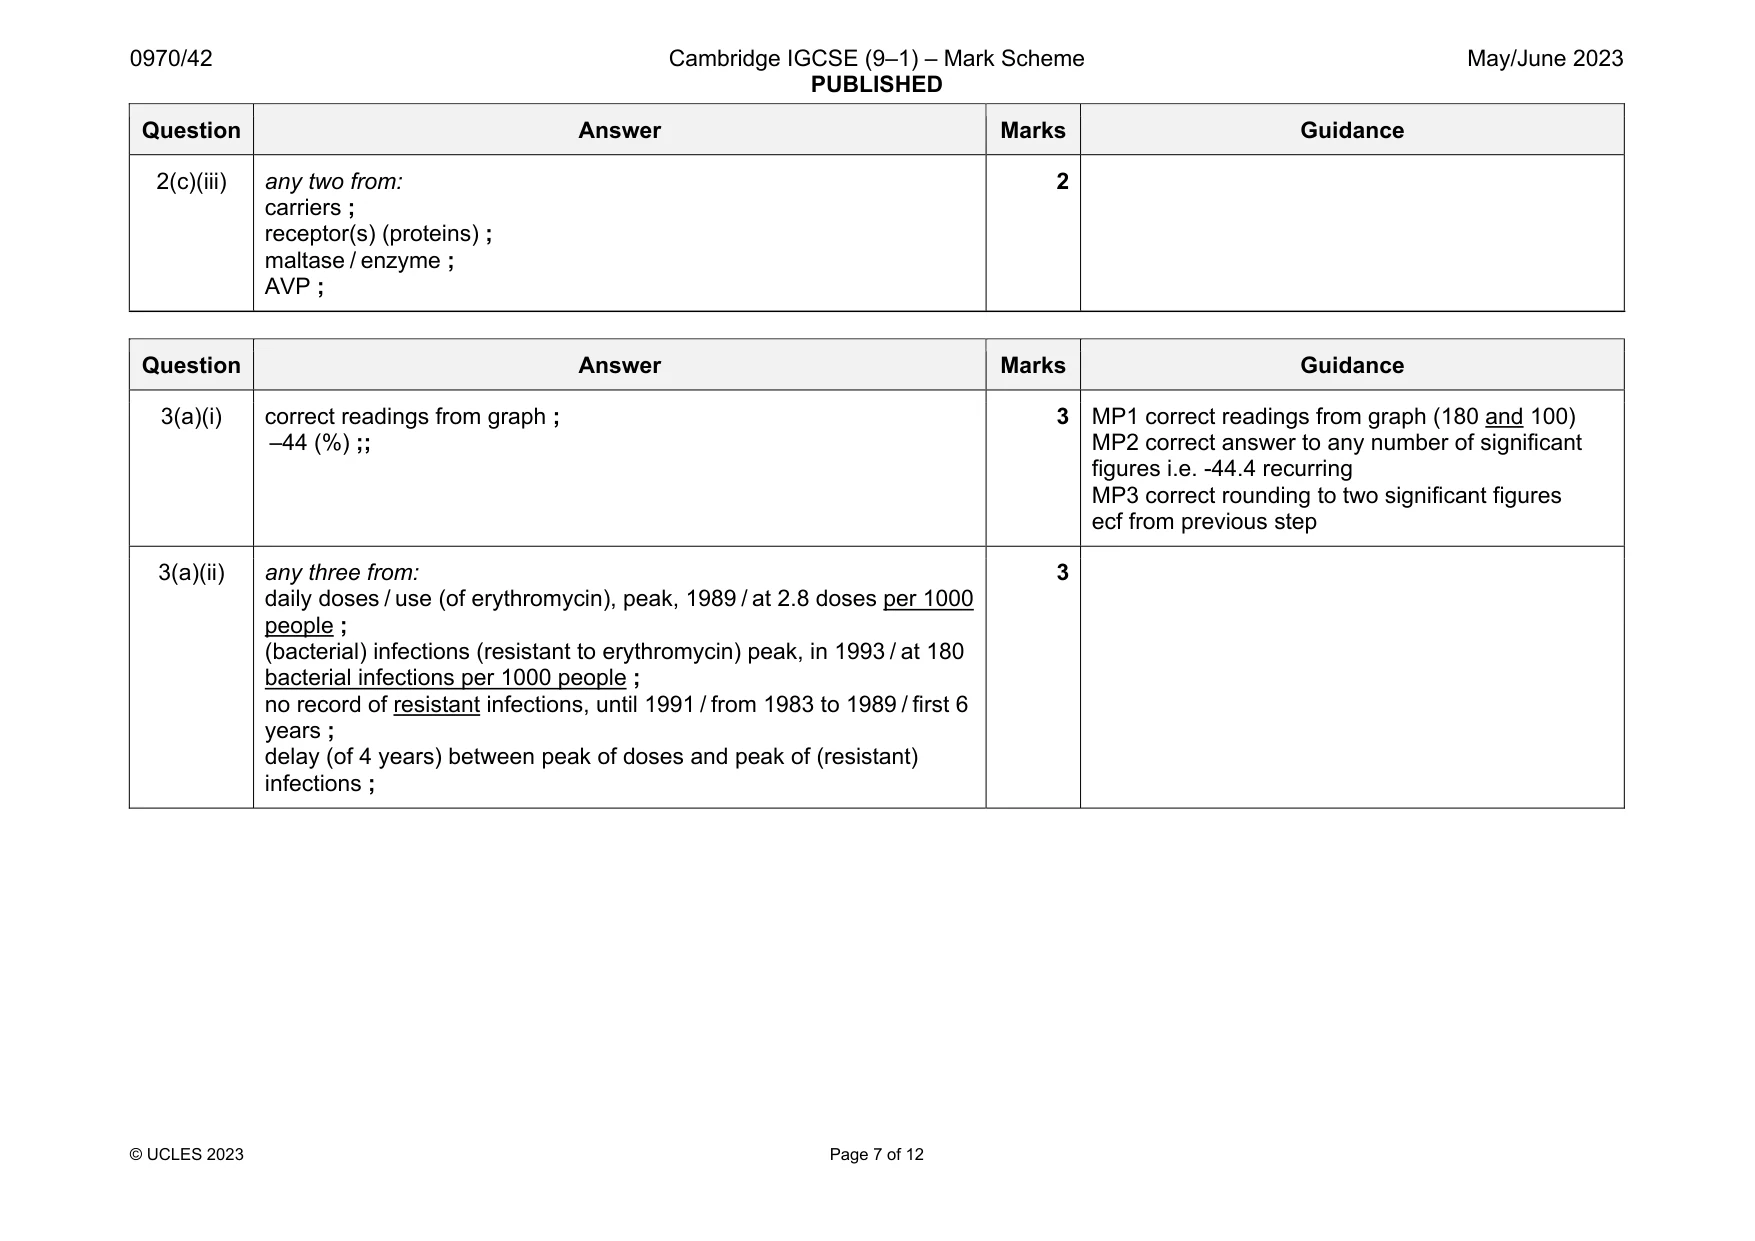
Mark scheme: 2(a) circle one pair of the inward pointing horizontal sections opposite each other ; 1 2(b) 21(%) ; 1 2(c)(i) gene ; 1 2(c)(ii) any five from: ribosomes make, proteins / polypeptides ; mRNA is copied from, gene / DNA ; DNA stays in the nucleus / mRNA is made in nucleus / mRNA leaves nucleus / mRNA moves to cytoplasm ; mRNA passes through ribosome / AW ; ribosome, assembles amino acids / translates mRNA (into a protein) / AW ; (protein synthesis) uses energy ; order of amino acids determined by base sequence of, mRNA / DNA / gene ; 5 Question Answer Marks Guidance 2(c)(iii) any two from: carriers ; receptor(s) (proteins) ; maltase / enzyme ; AVP ; 2
Q3 · Antibiotic resistance is an increasing problem worldwide
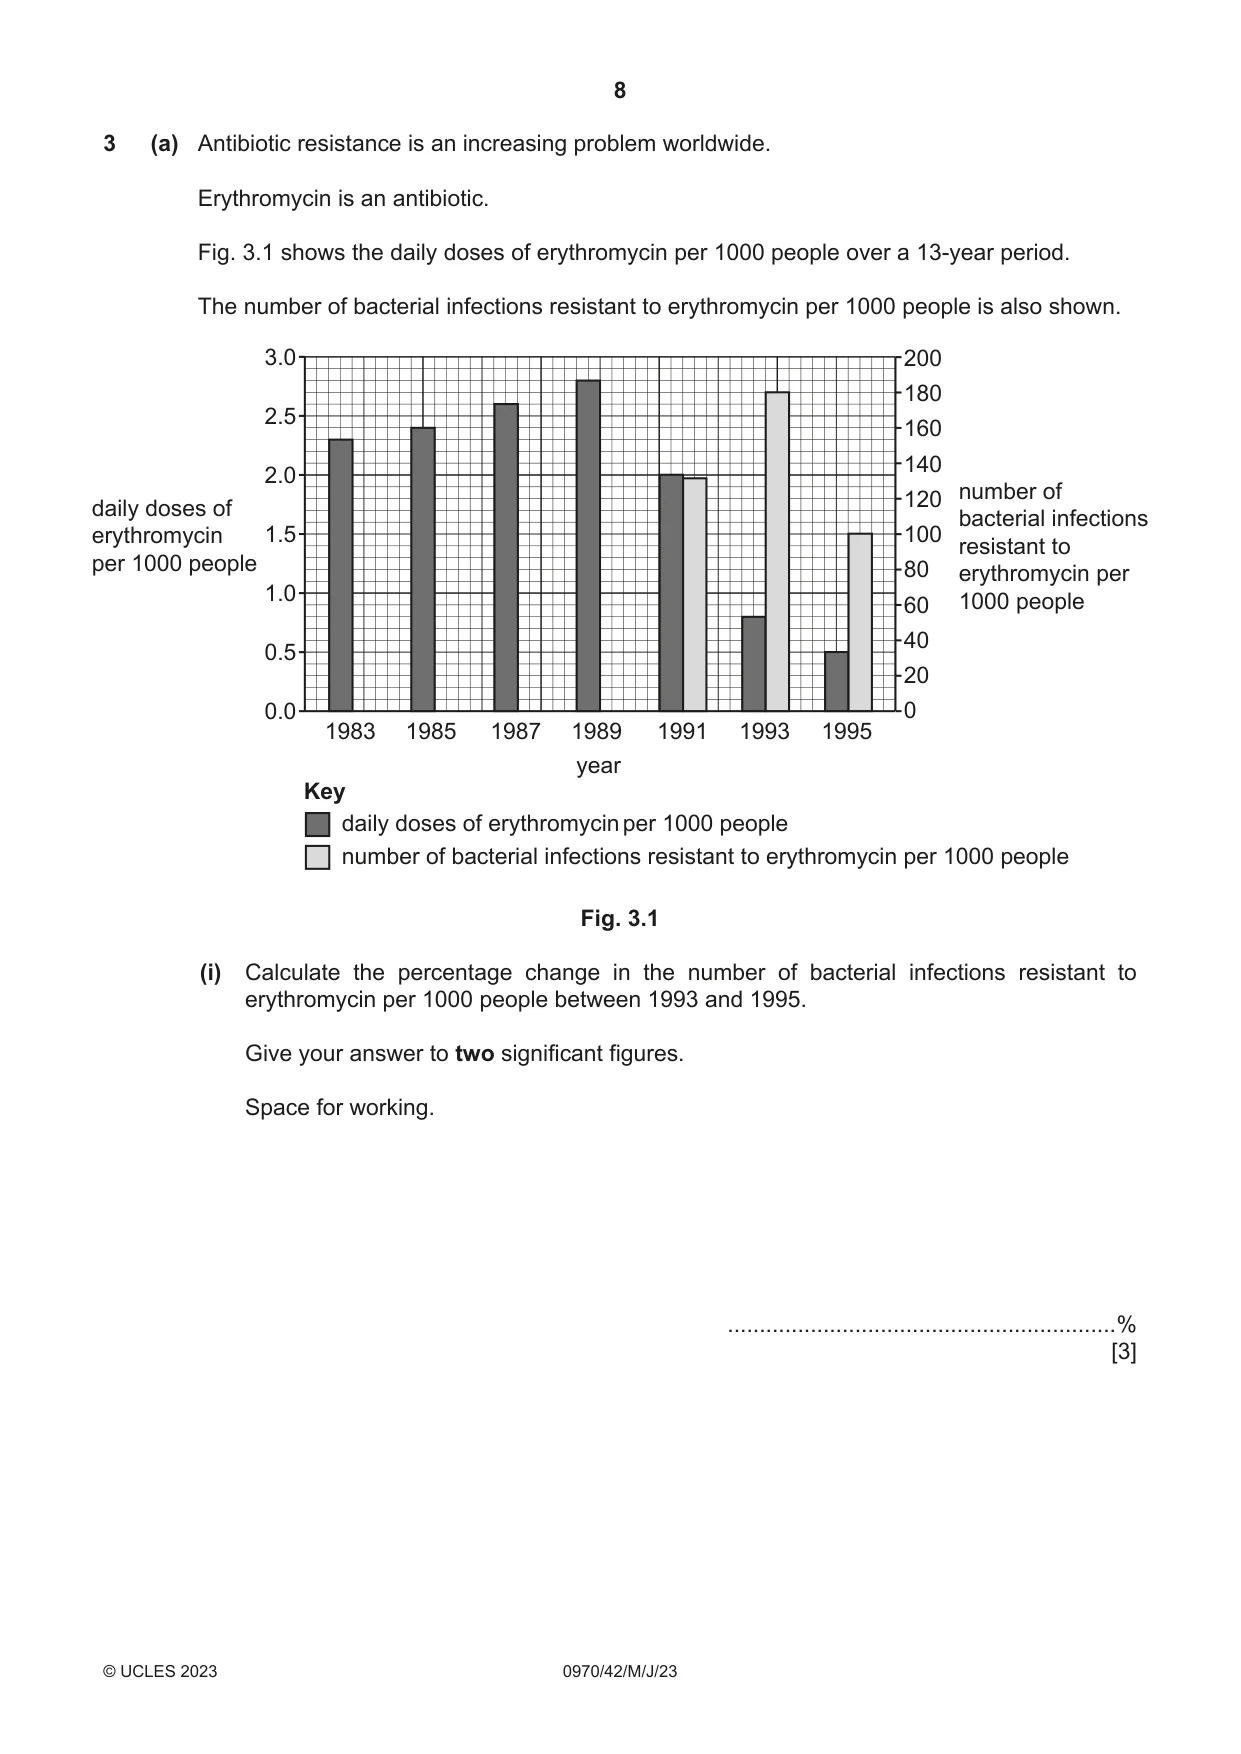
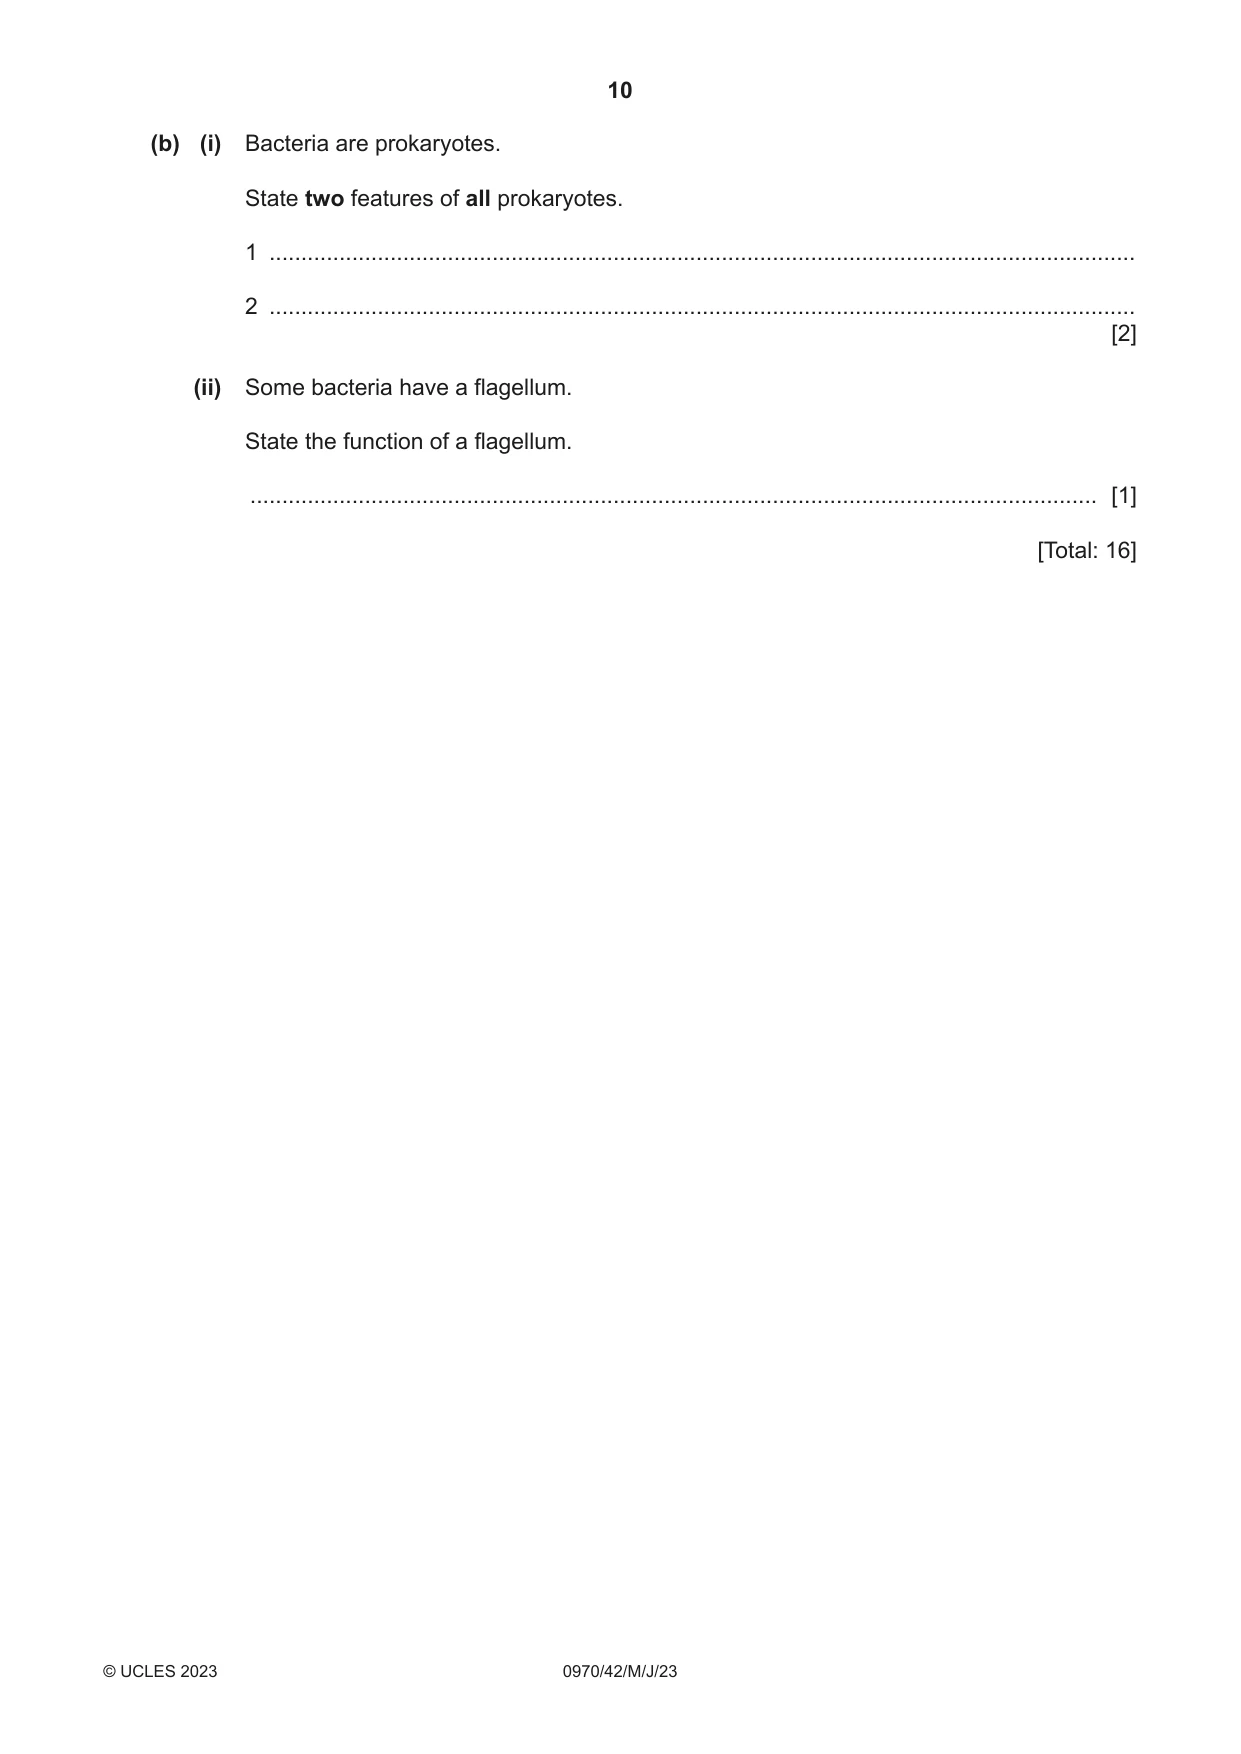
3 (a) Antibiotic resistance is an increasing problem worldwide. Erythromycin is an antibiotic. Fig. 3.1 shows the daily doses of erythromycin per 1000 people over a 13‑year period. The number of bacterial infections resistant to erythromycin per 1000 people is also shown. 3.0 200 180 2.5 160 140 2.0 number of 120daily doses of bacterial infections erythromycin 1.5 100 resistant to per 1000 people 80 erythromycin per 1.0 60 1000 people 40 0.5 20 0.0 0 1983 1985 1987 1989 1991 1993 1995 year Key daily doses of erythromycin per 1000 people number of bacterial infections resistant to erythromycin per 1000 people Fig. 3.1 (i) Calculate the percentage change in the number of bacterial infections resistant to erythromycin per 1000 people between 1993 and 1995. Give your answer to two significant figures. Space for working. .............................................................% [3] (ii) Describe the data shown in Fig. 3.1. ........................................................................................................................................... ........................................................................................................................................... ........................................................................................................................................... ........................................................................................................................................... ........................................................................................................................................... ........................................................................................................................................... ..................................................................................................................................... [3] (iii) Suggest reasons for the change in the number of bacterial infections resistant to erythromycin from 1993 to 1995 shown in Fig. 3.1. ........................................................................................................................................... ........................................................................................................................................... ........................................................................................................................................... ........................................................................................................................................... ..................................................................................................................................... [2] (iv) Explain how bacteria become resistant to antibiotics. ........................................................................................................................................... ........................................................................................................................................... ........................................................................................................................................... ........................................................................................................................................... ........................................................................................................................................... ........................................................................................................................................... ........................................................................................................................................... ........................................................................................................................................... ........................................................................................................................................... ........................................................................................................................................... ..................................................................................................................................... [5] (b) (i) Bacteria are prokaryotes. State two features of all prokaryotes. 1 ........................................................................................................................................ 2 ........................................................................................................................................ [2] (ii) Some bacteria have a flagellum. State the function of a flagellum. ..................................................................................................................................... [1] [Total: 16]
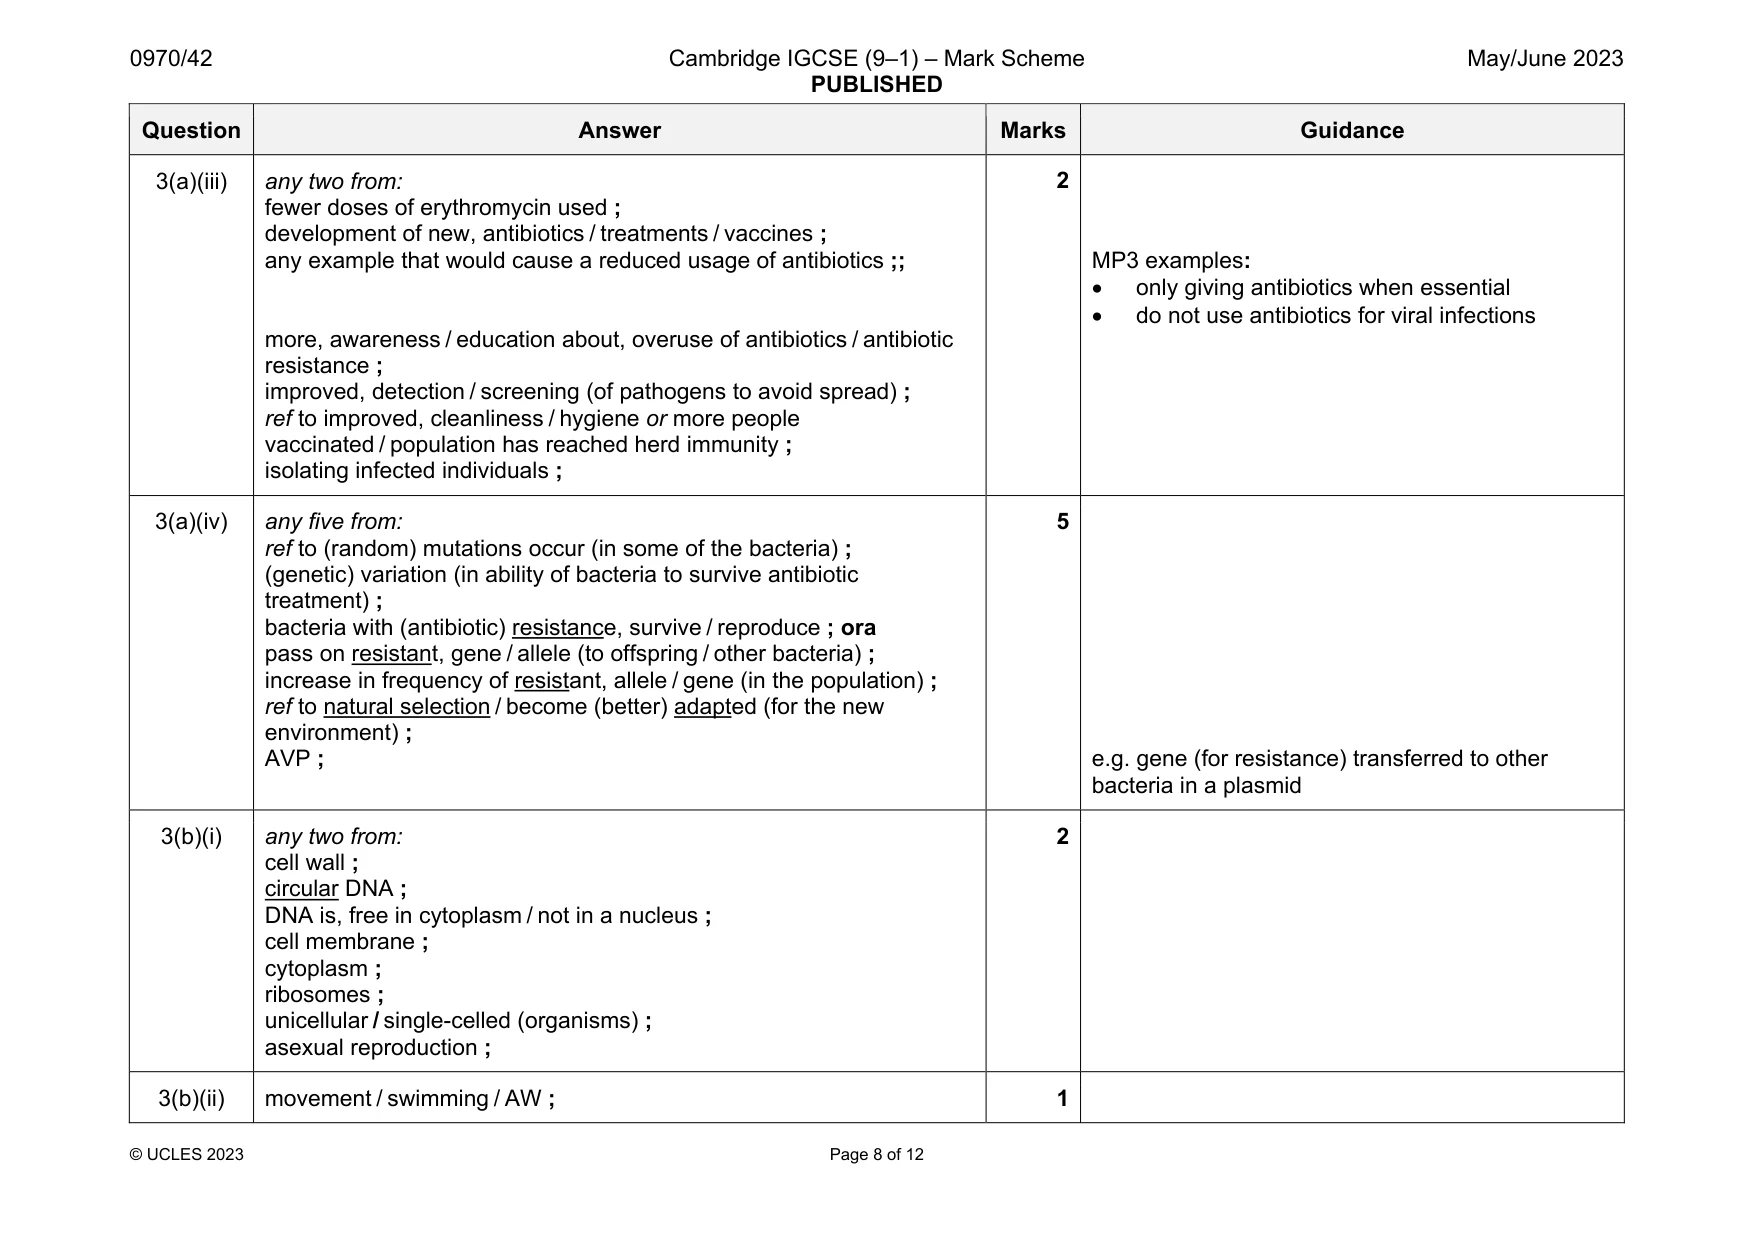
Mark scheme: 3(a)(i) correct readings from graph ; –44 (%) ;; 3 MP1 correct readings from graph (180 and 100) MP2 correct answer to any number of significant figures i.e. -44.4 recurring MP3 correct rounding to two significant figures ecf from previous step 3(a)(ii) any three from: daily doses / use (of erythromycin), peak, 1989 / at 2.8 doses per 1000 people ; (bacterial) infections (resistant to erythromycin) peak, in 1993 / at 180 bacterial infections per 1000 people ; no record of resistant infections, until 1991 / from 1983 to 1989 / first 6 years ; delay (of 4 years) between peak of doses and peak of (resistant) infections ; 3 Question Answer Marks Guidance 3(a)(iii) any two from: fewer doses of erythromycin used ; development of new, antibiotics / treatments / vaccines ; any example that would cause a reduced usage of antibiotics ;; more, awareness / education about, overuse of antibiotics / antibiotic resistance ; improved, detection / screening (of pathogens to avoid spread) ; ref to improved, cleanliness / hygiene or more people vaccinated / population has reached herd immunity ; isolating infected individuals ; 2 MP3 examples: only giving antibiotics when essential do not use antibiotics for viral infections 3(a)(iv) any five from: ref to (random) mutations occur (in some of the bacteria) ; (genetic) variation (in ability of bacteria to survive antibiotic treatment) ; bacteria with (antibiotic) resistance, survive / reproduce ; ora pass on resistant, gene / allele (to offspring / other bacteria) ; increase in frequency of resistant, allele / gene (in the population) ; ref to natural selection / become (better) adapted (for the new environment) ; AVP ; 5 e.g. gene (for resistance) transferred to other bacteria in a plasmid 3(b)(i) any two from: cell wall ; circular DNA ; DNA is, free in cytoplasm / not in a nucleus ; cell membrane ; cytoplasm ; ribosomes ; unicellular / single-celled (organisms) ; asexual reproduction ; 2 3(b)(ii) movement / swimming / AW ; 1
Q4 · A student recorded the information about an aquatic habitat
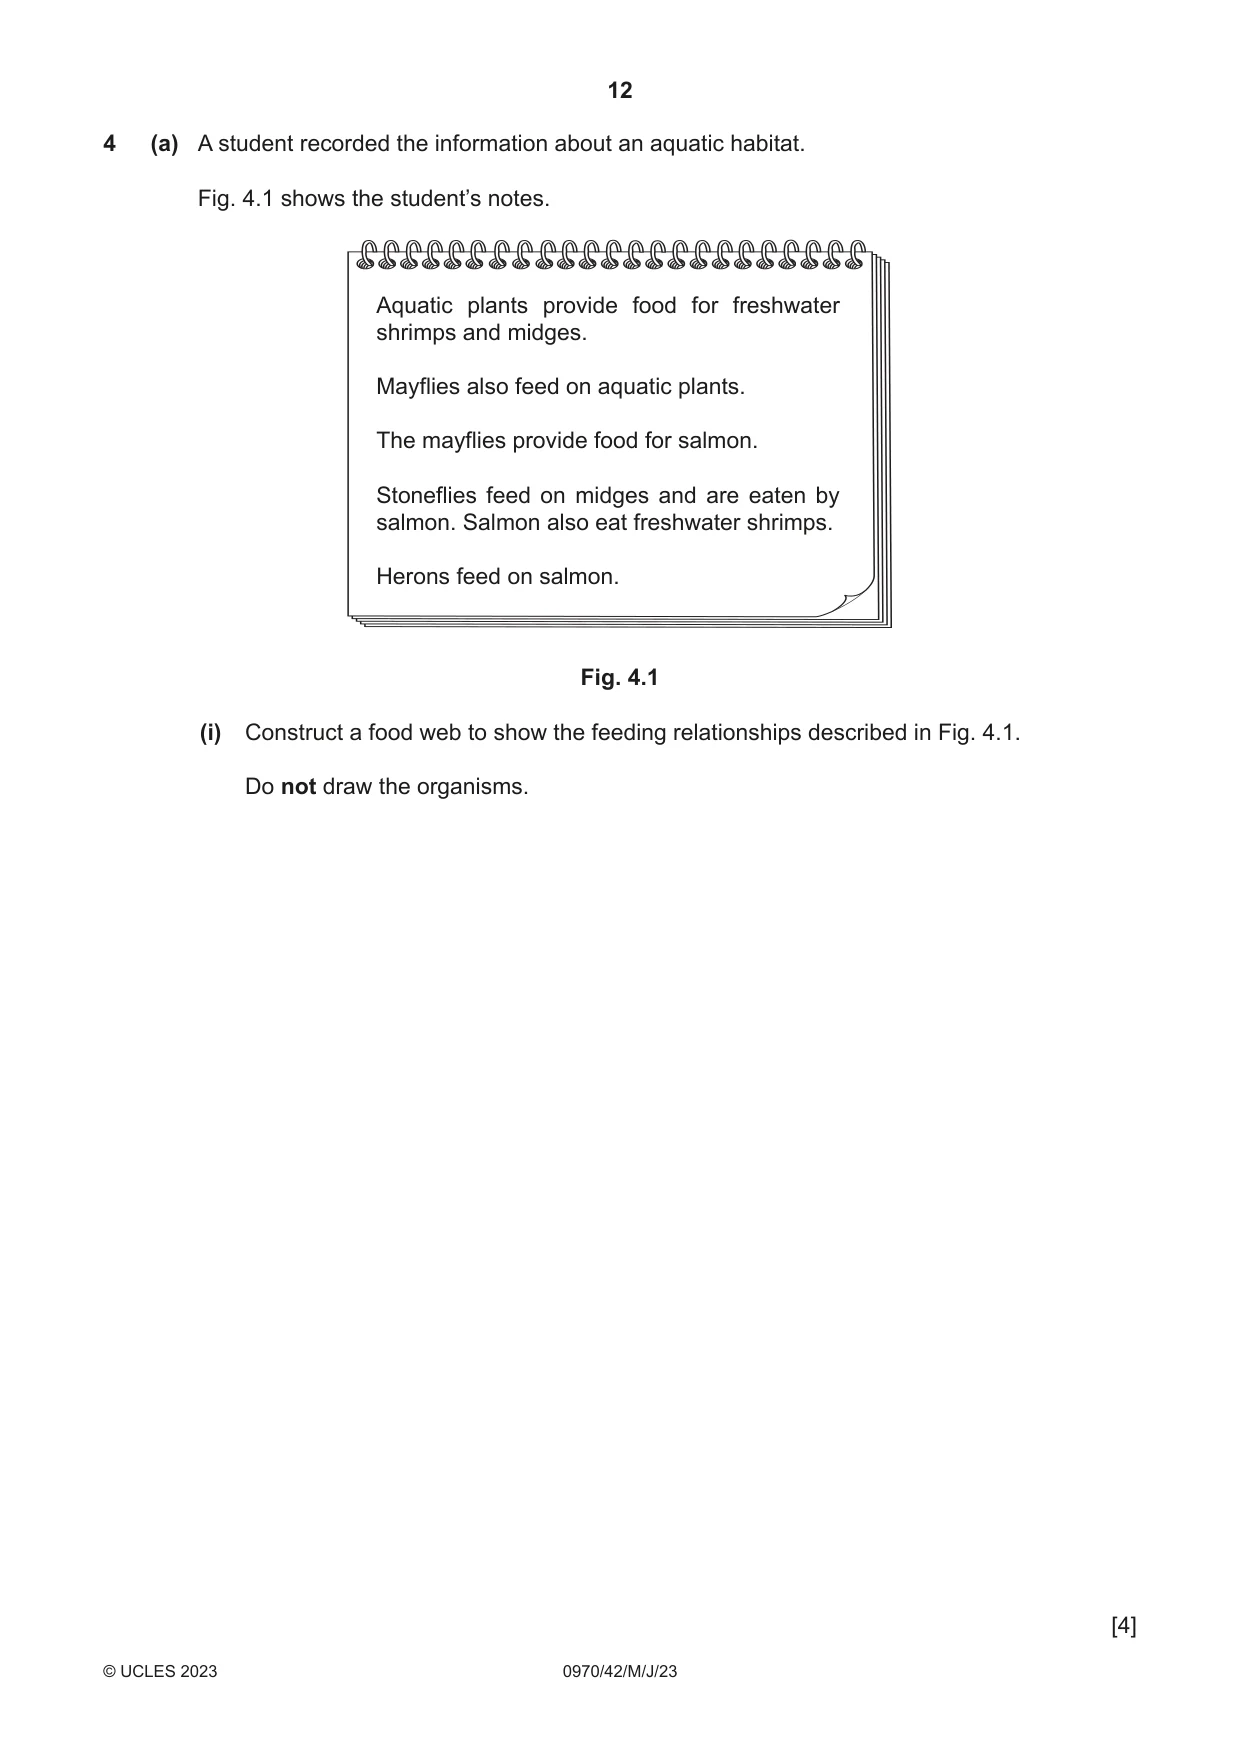
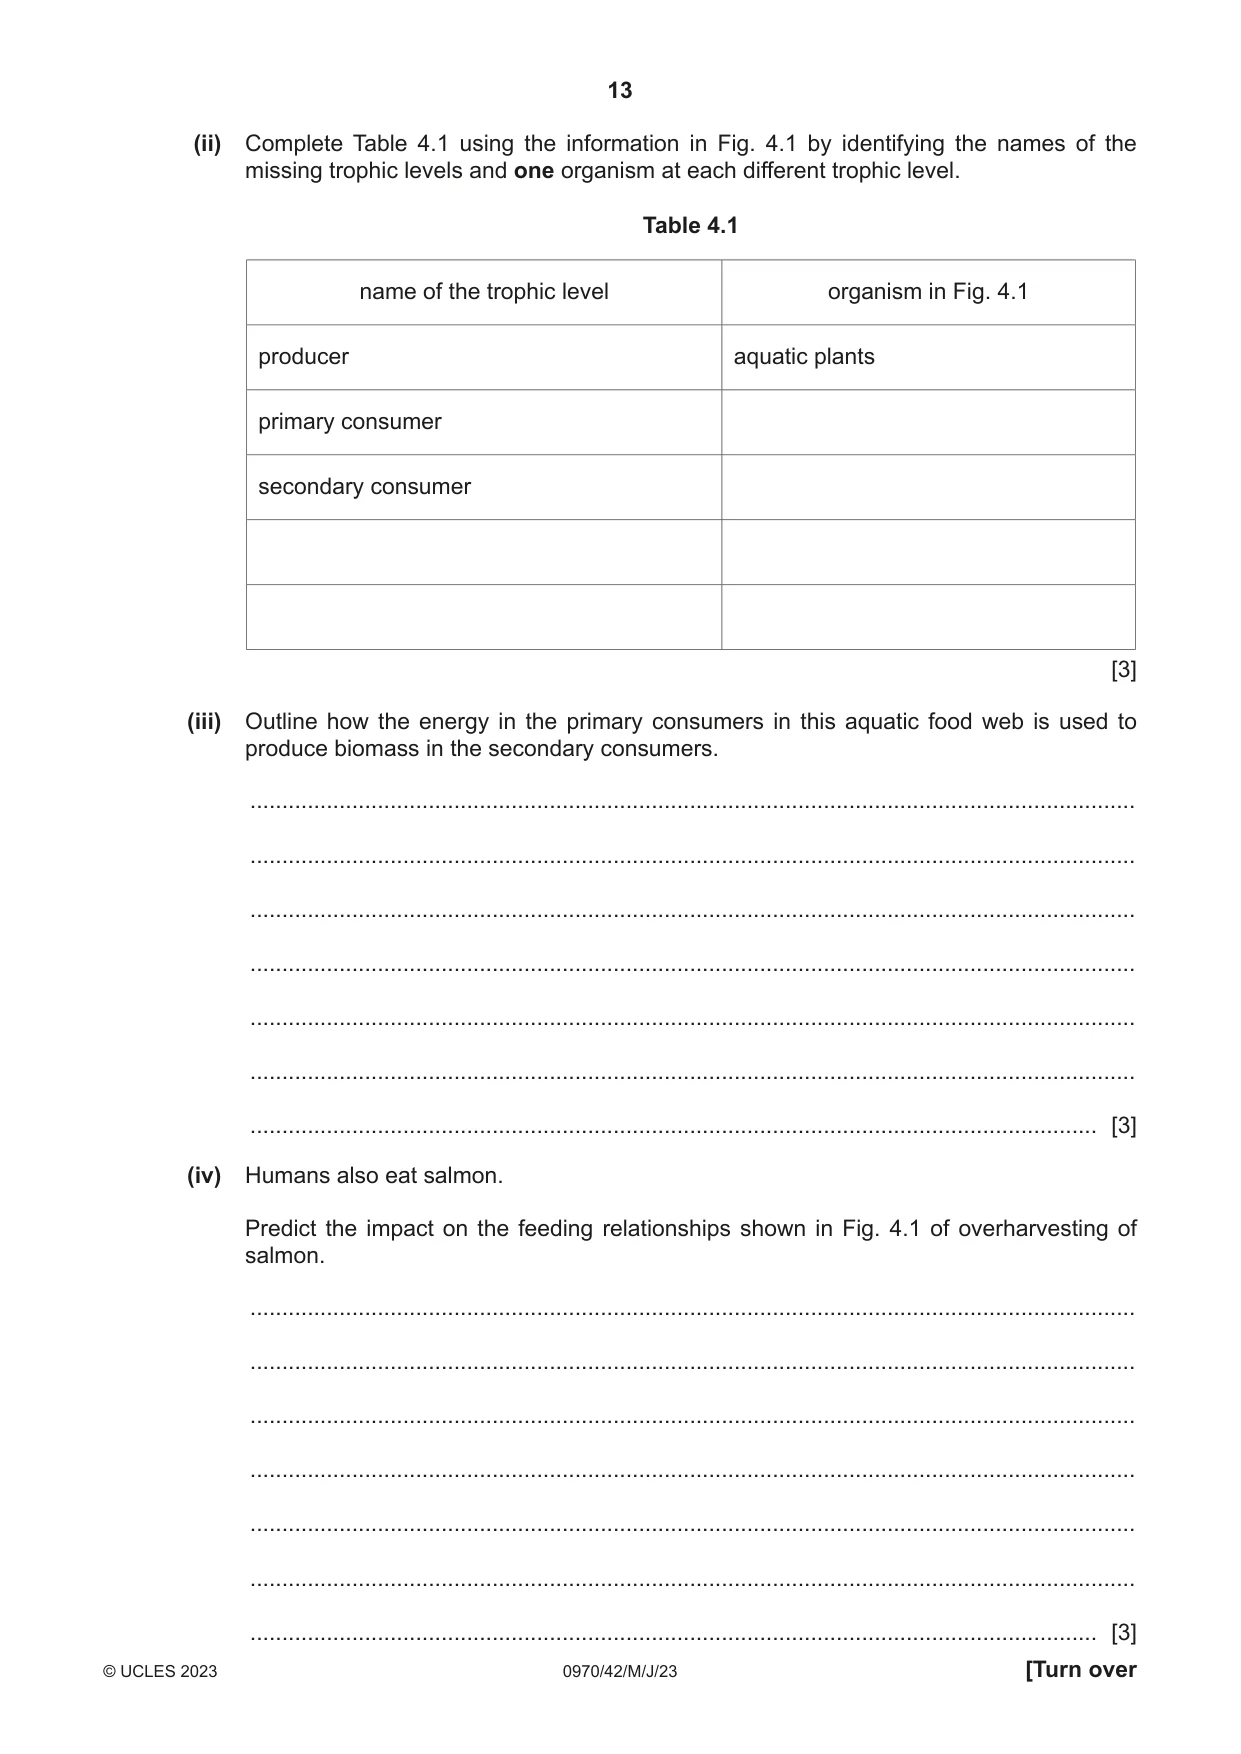
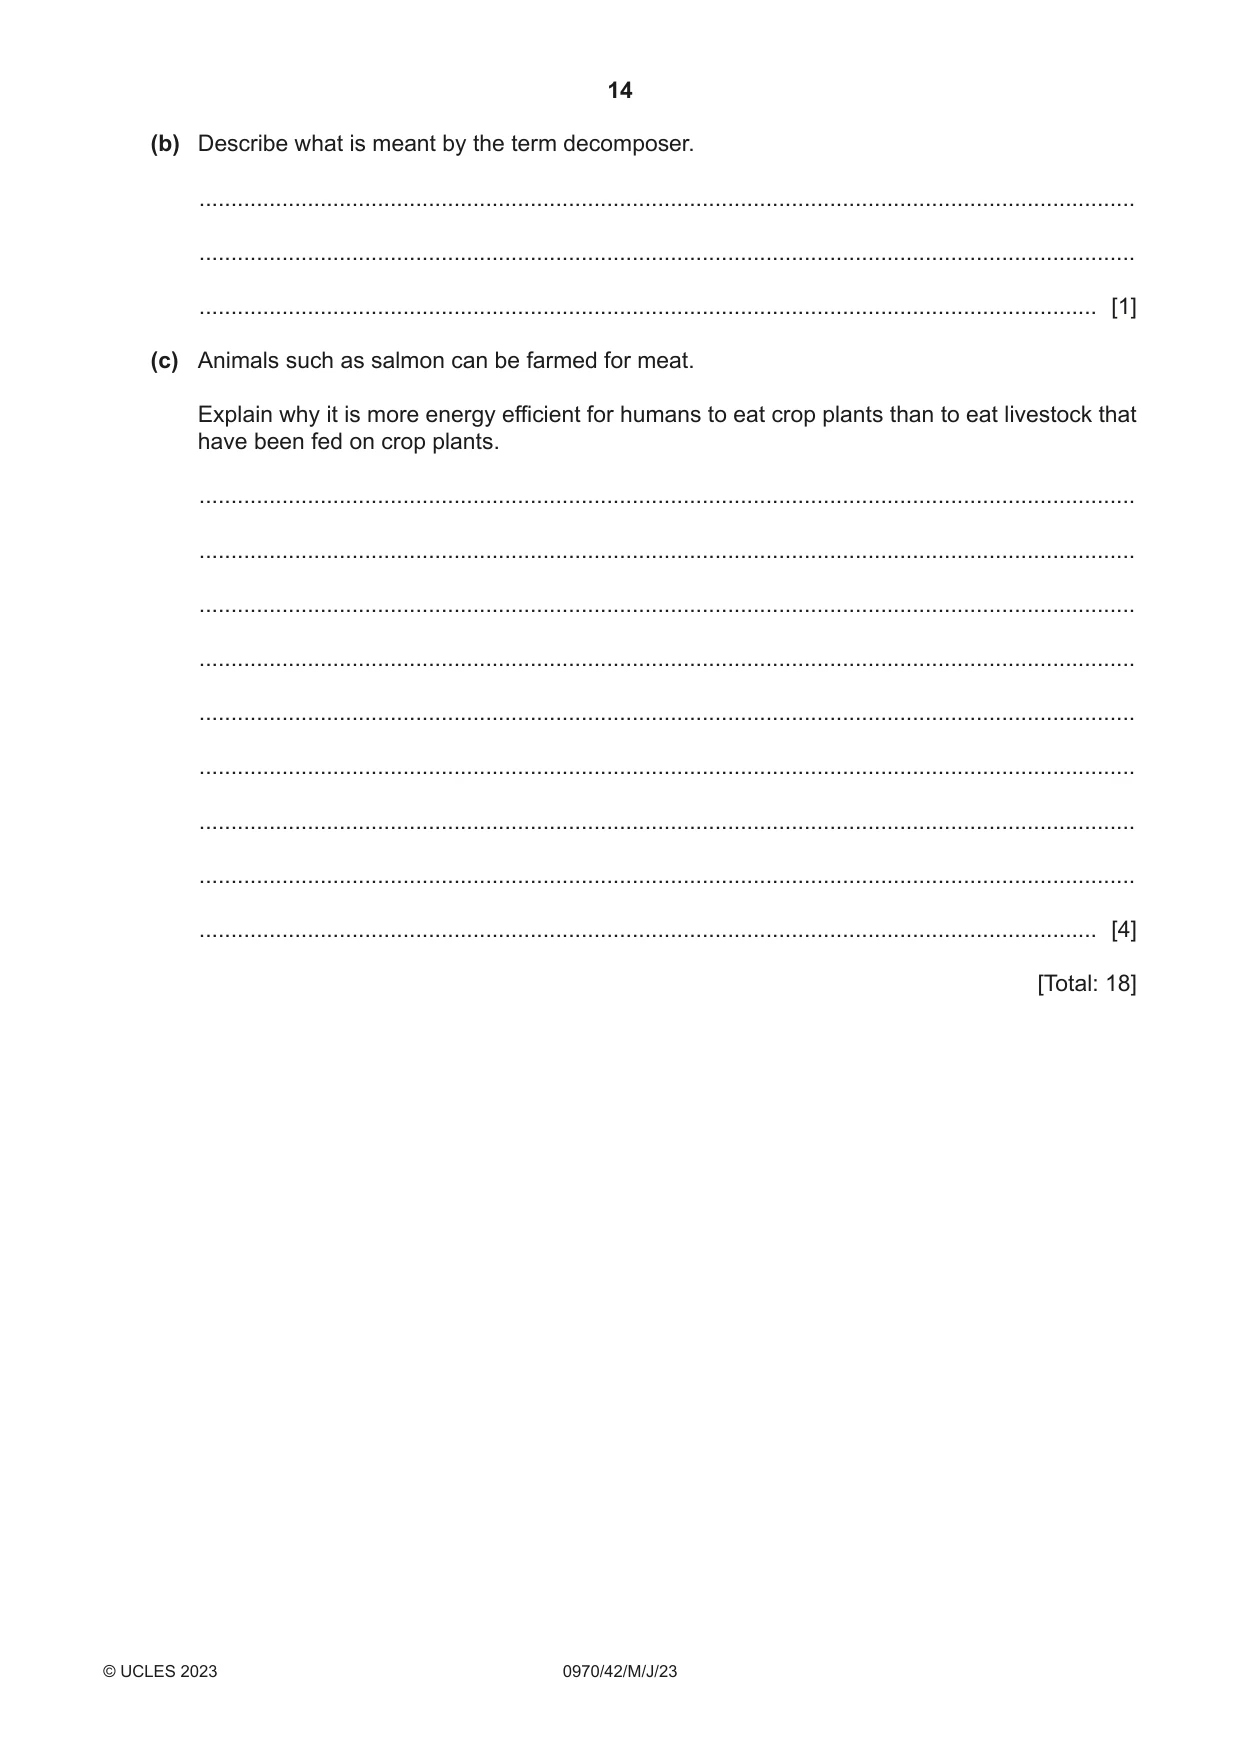
4 (a) A student recorded the information about an aquatic habitat. Fig. 4.1 shows the student’s notes. Aquatic plants provide food for freshwater shrimps and midges. Mayflies also feed on aquatic plants. The mayflies provide food for salmon. Stoneflies feed on midges and are eaten by salmon. Salmon also eat freshwater shrimps. Herons feed on salmon. Fig. 4.1 (i) Construct a food web to show the feeding relationships described in Fig. 4.1. Do not draw the organisms. [4] (ii) Complete Table 4.1 using the information in Fig. 4.1 by identifying the names of the missing trophic levels and one organism at each different trophic level. Table 4.1 name of the trophic level organism in Fig. 4.1 producer aquatic plants primary consumer secondary consumer [3] (iii) Outline how the energy in the primary consumers in this aquatic food web is used to produce biomass in the secondary consumers. ........................................................................................................................................... ........................................................................................................................................... ........................................................................................................................................... ........................................................................................................................................... ........................................................................................................................................... ........................................................................................................................................... ..................................................................................................................................... [3] (iv) Humans also eat salmon. Predict the impact on the feeding relationships shown in Fig. 4.1 of overharvesting of salmon. ........................................................................................................................................... ........................................................................................................................................... ........................................................................................................................................... ........................................................................................................................................... ........................................................................................................................................... ........................................................................................................................................... ..................................................................................................................................... [3] (b) Describe what is meant by the term decomposer. ................................................................................................................................................... ................................................................................................................................................... ............................................................................................................................................. [1] (c) Animals such as salmon can be farmed for meat. Explain why it is more energy efficient for humans to eat crop plants than to eat livestock that have been fed on crop plants. ................................................................................................................................................... ................................................................................................................................................... ................................................................................................................................................... ................................................................................................................................................... ................................................................................................................................................... ................................................................................................................................................... ................................................................................................................................................... ................................................................................................................................................... ............................................................................................................................................. [4] [Total: 18]
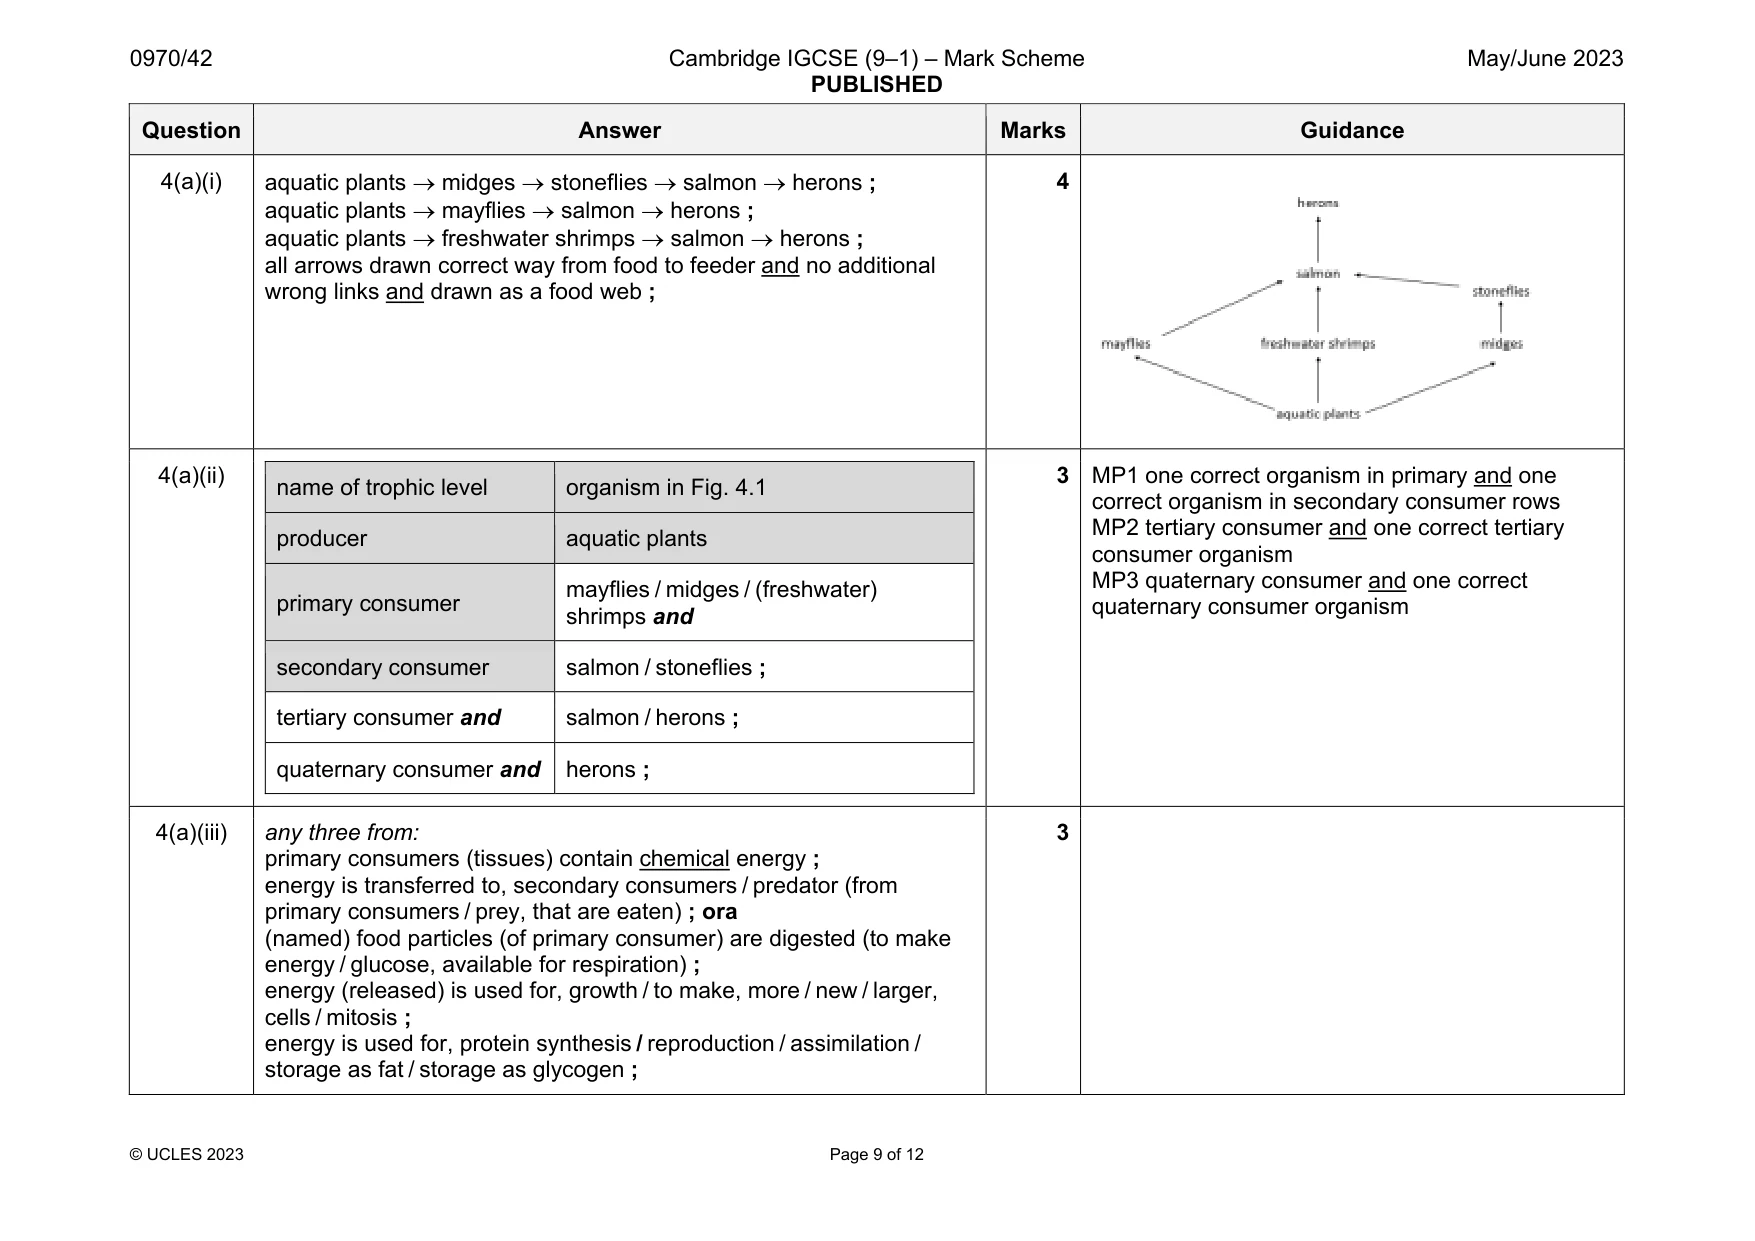
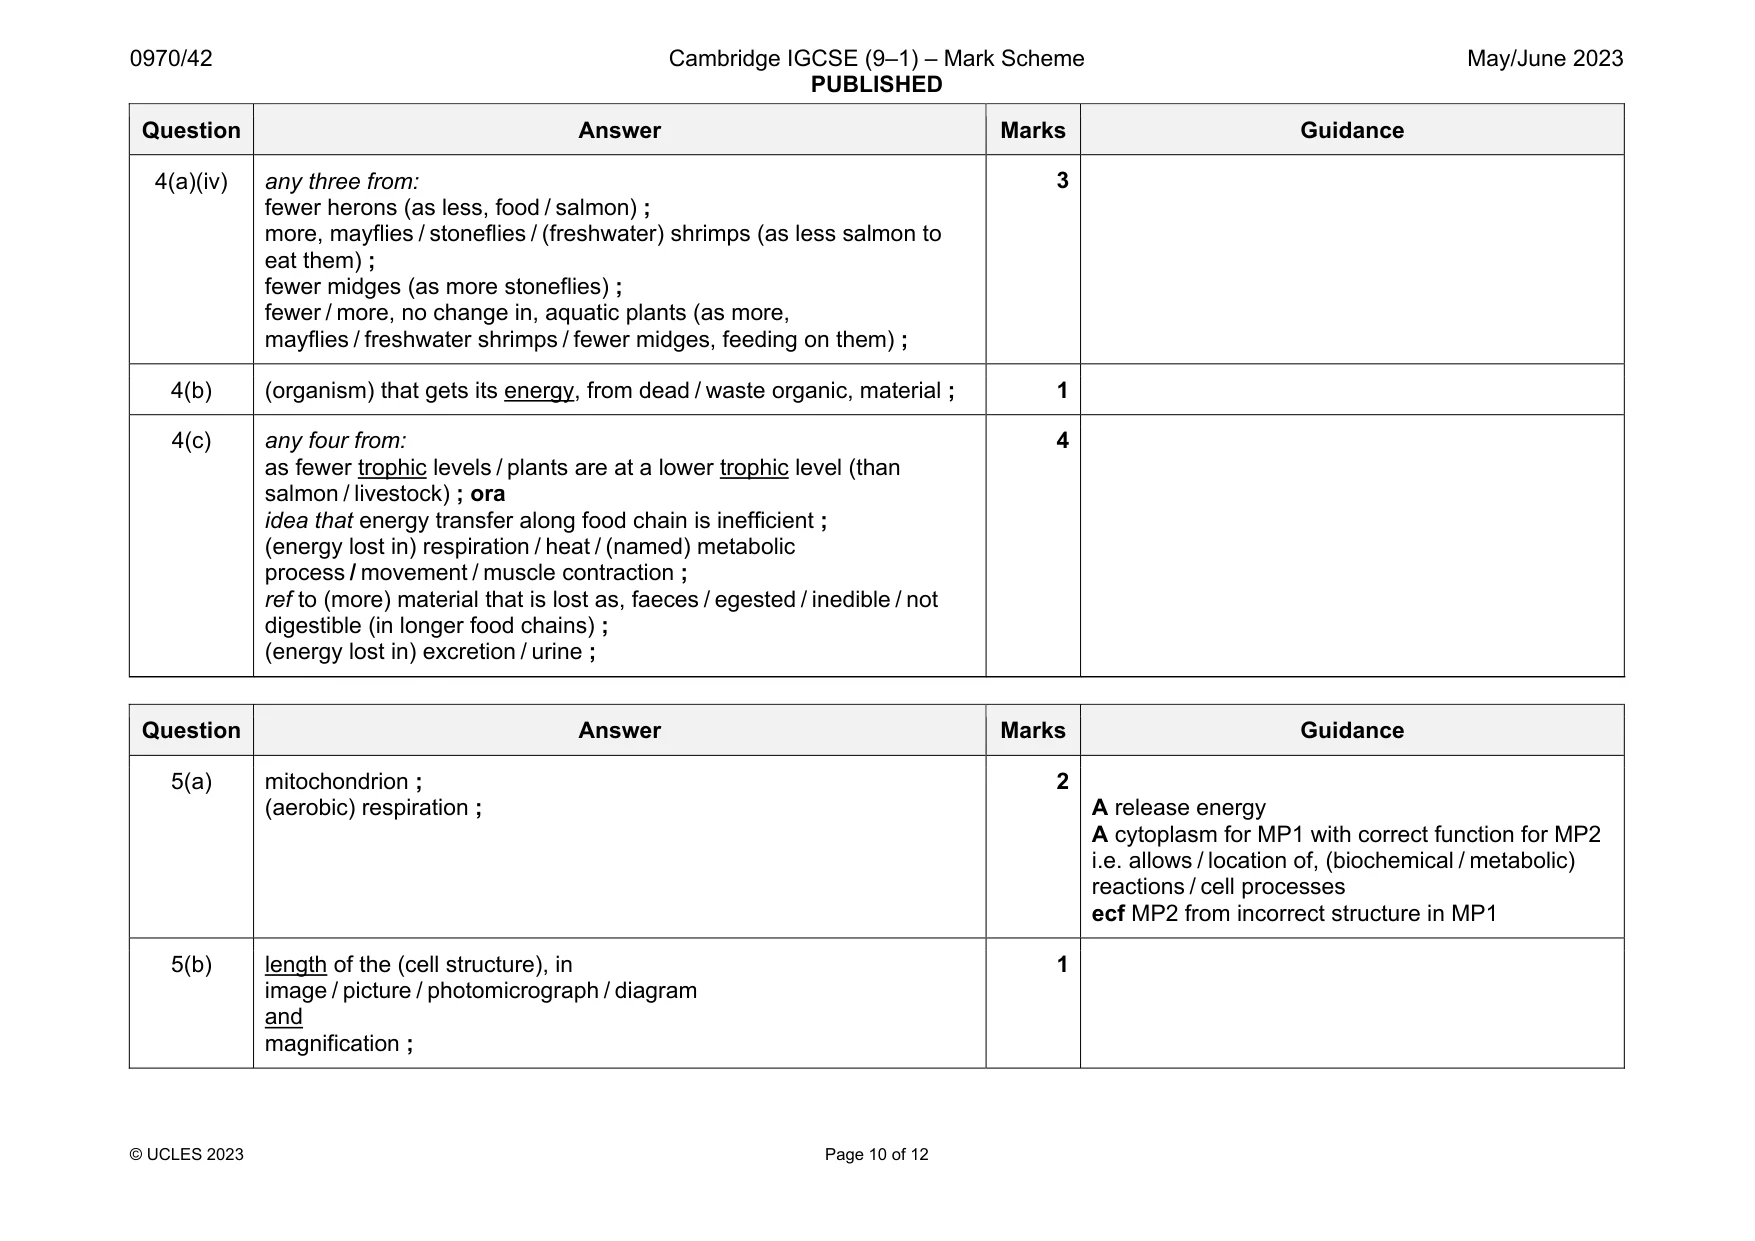
Mark scheme: 4(a)(i) aquatic plants mayflies salmon herons ; aquatic plants freshwater shrimps salmon herons ; all arrows drawn correct way from food to feeder and no additional wrong links and drawn as a food web ; 4 4(a)(ii) name of trophic level organism in Fig. 4.1 producer aquatic plants primary consumer mayflies / midges / (freshwater) shrimps and secondary consumer salmon / stoneflies ; tertiary consumer and salmon / herons ; quaternary consumer and herons ; 3 MP1 one correct organism in primary and one correct organism in secondary consumer rows MP2 tertiary consumer and one correct tertiary consumer organism MP3 quaternary consumer and one correct quaternary consumer organism 4(a)(iii) any three from: primary consumers (tissues) contain chemical energy ; energy is transferred to, secondary consumers / predator (from primary consumers / prey, that are eaten) ; ora (named) food particles (of primary consumer) are digested (to make energy / glucose, available for respiration) ; energy (released) is used for, growth / to make, more / new / larger, cells / mitosis ; energy is used for, protein synthesis / reproduction / assimilation / storage as fat / storage as glycogen ; 3 Question Answer Marks Guidance 4(a)(iv) any three from: fewer herons (as less, food / salmon) ; more, mayflies / stoneflies / (freshwater) shrimps (as less salmon to eat them) ; fewer midges (as more stoneflies) ; fewer / more, no change in, aquatic plants (as more, mayflies / freshwater shrimps / fewer midges, feeding on them) ; 3 4(b) (organism) that gets its energy, from dead / waste organic, material ; 1 4(c) any four from: as fewer trophic levels / plants are at a lower trophic level (than salmon / livestock) ; ora idea that energy transfer along food chain is inefficient ; (energy lost in) respiration / heat / (named) metabolic process / movement / muscle contraction ; ref to (more) material that is lost as, faeces / egested / inedible / not digestible (in longer food chains) ; (energy lost in) excretion / urine ; 4
Q5 · A photomicrograph of a structure found in animal and plant cells
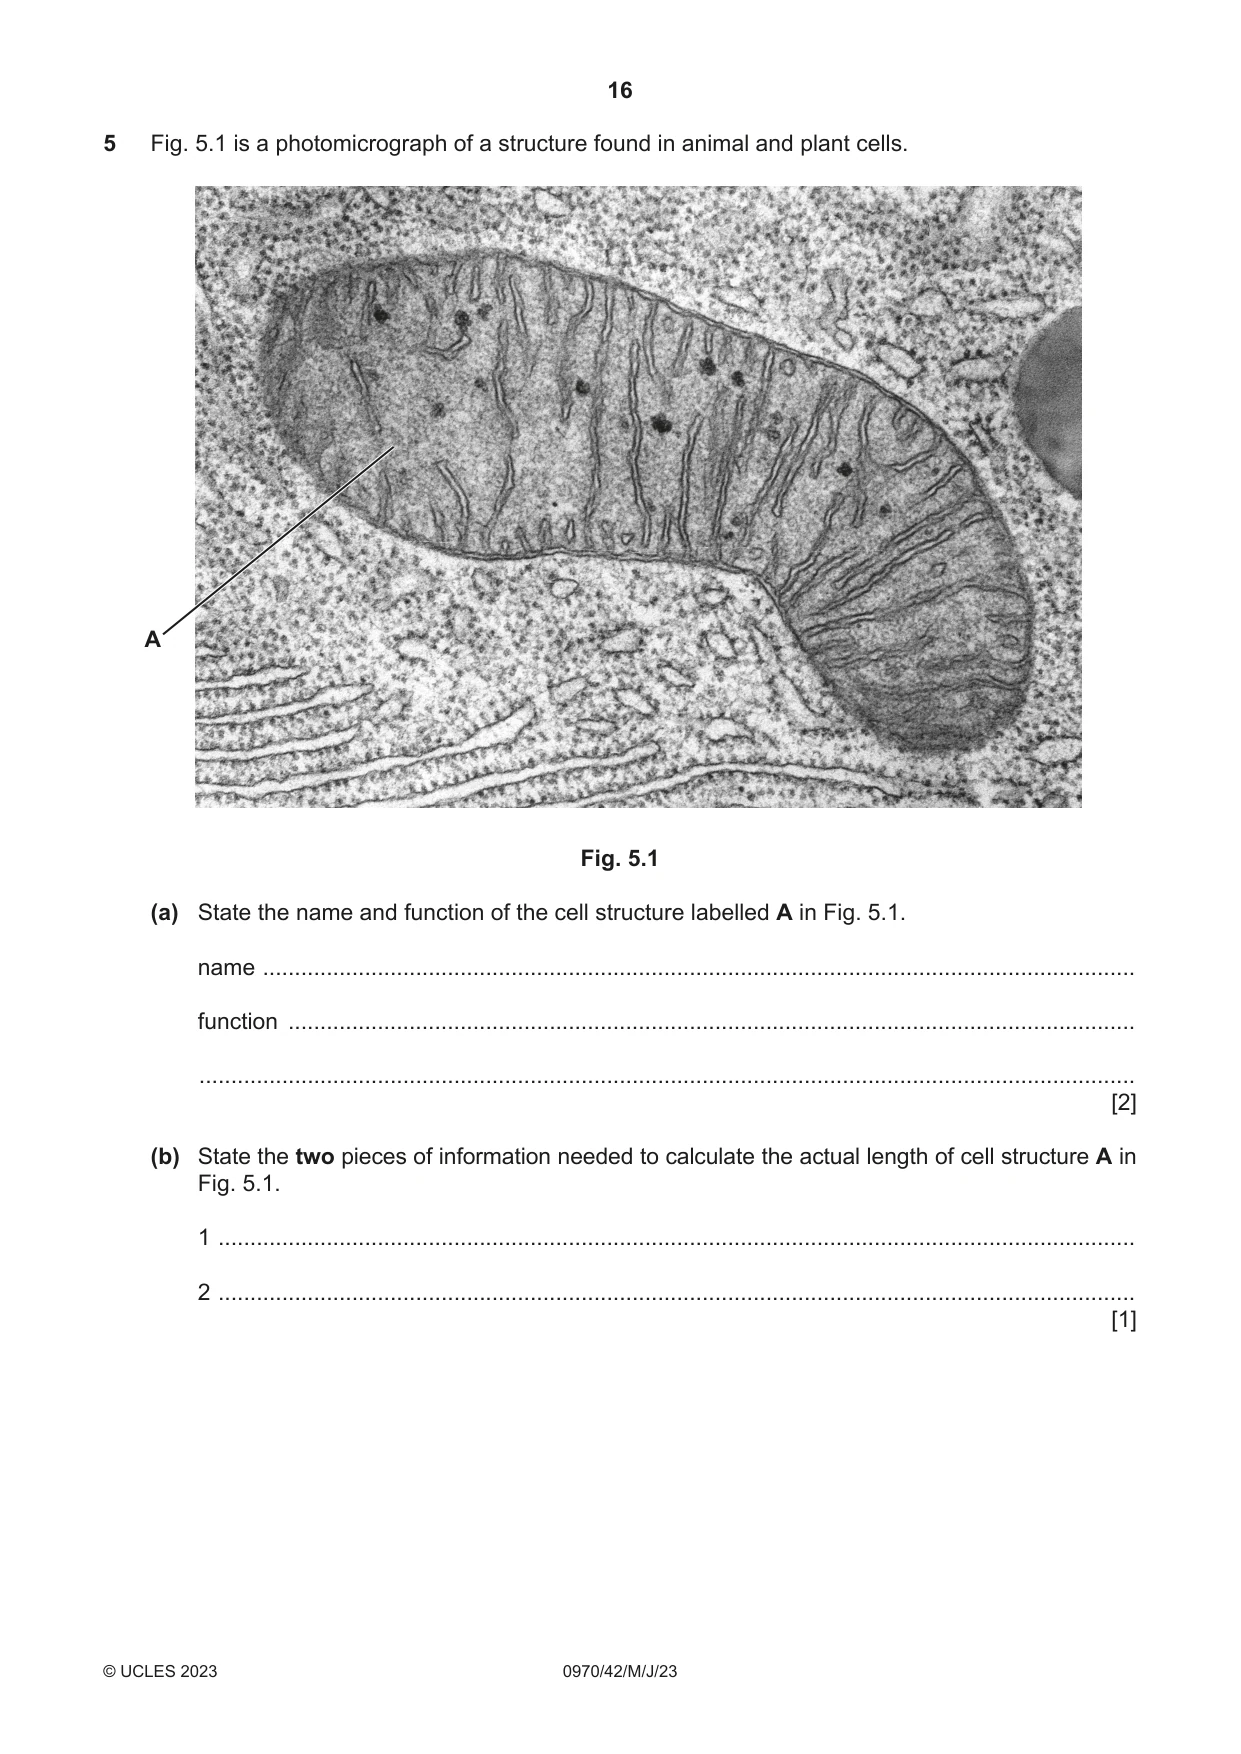
5 Fig. 5.1 is a photomicrograph of a structure found in animal and plant cells. A Fig. 5.1 (a) State the name and function of the cell structure labelled A in Fig. 5.1. name ......................................................................................................................................... function ..................................................................................................................................... ................................................................................................................................................... [2] (b) State the two pieces of information needed to calculate the actual length of cell structure A in Fig. 5.1. 1 ................................................................................................................................................ 2 ................................................................................................................................................ [1] (c) The actual length of cell structure A is 0.000 75 mm. Convert this value to micrometres (µm). ..................................................... µm [1] [Total: 4]
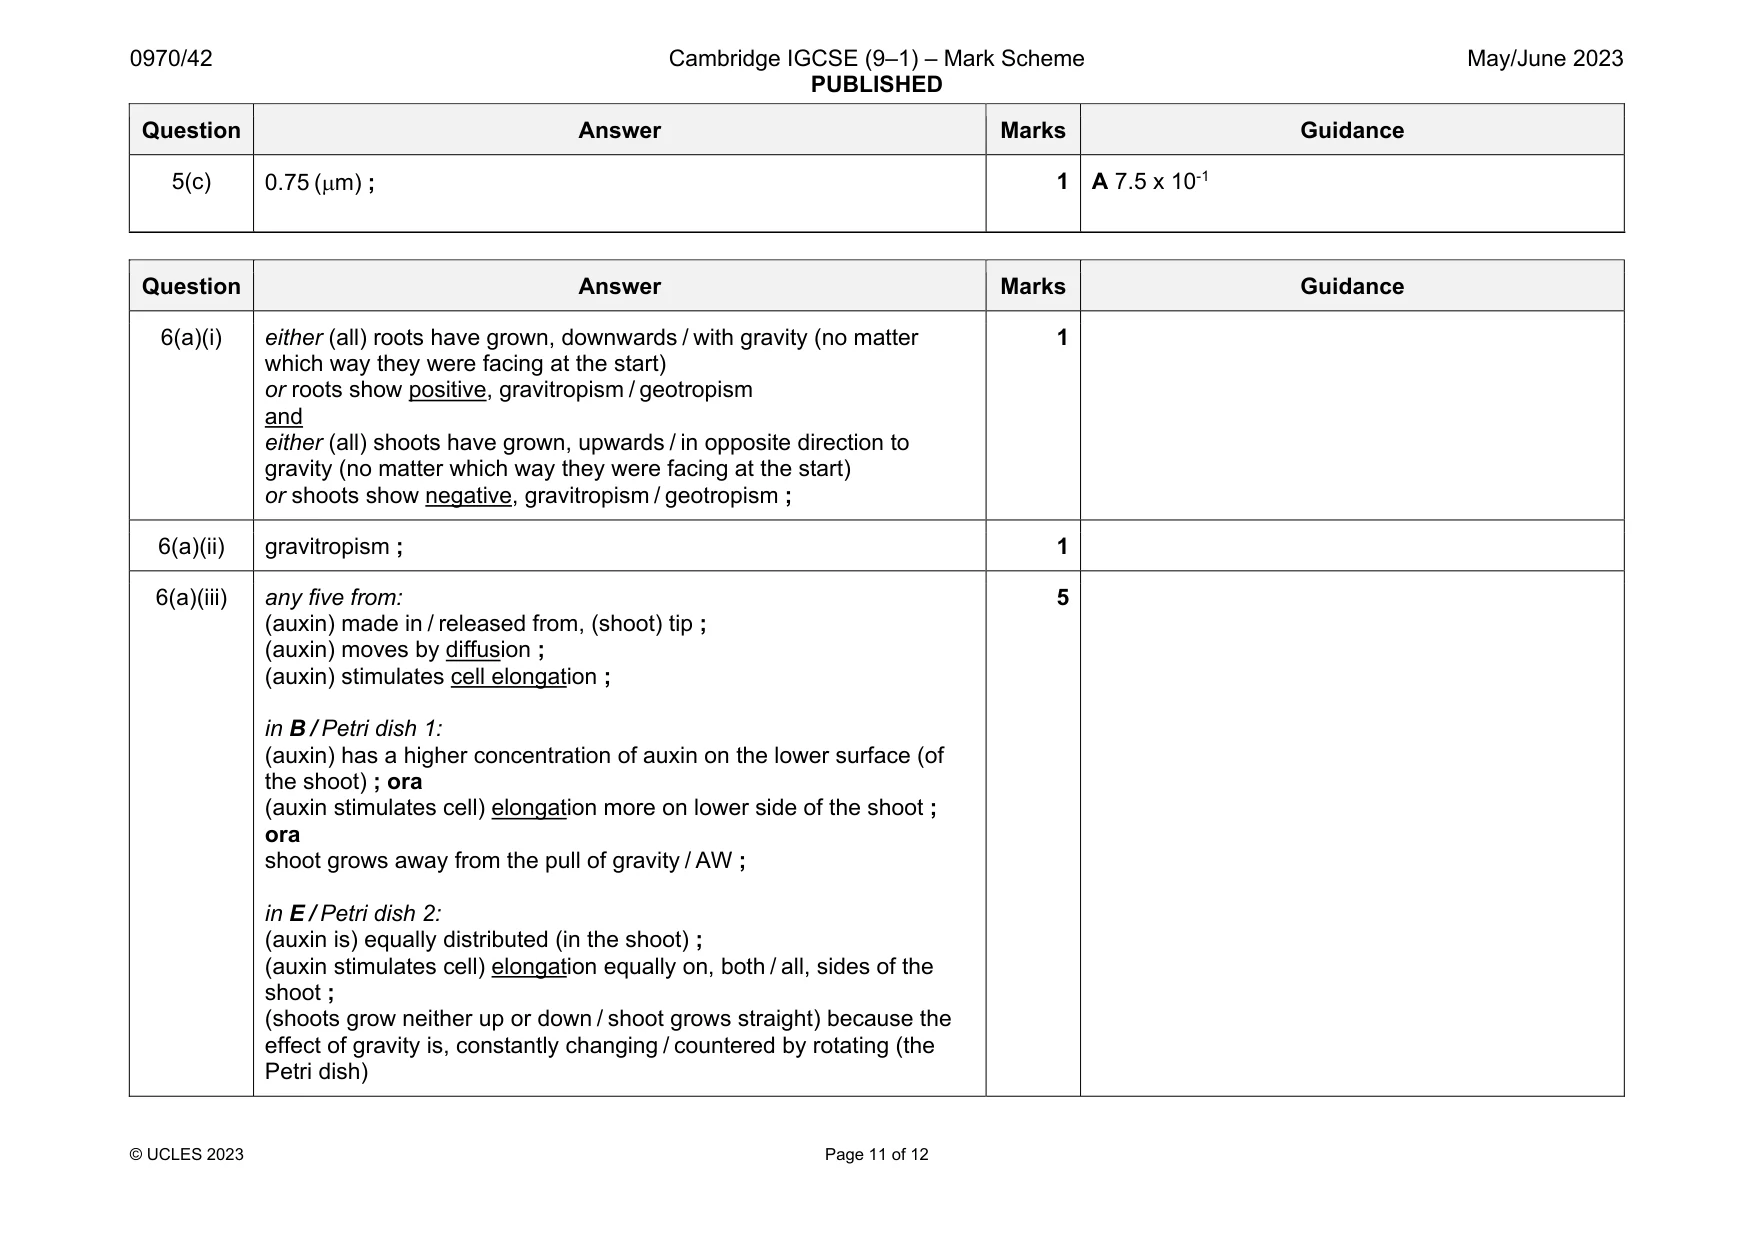
Mark scheme: 5(a) mitochondrion ; (aerobic) respiration ; 2 A release energy A cytoplasm for MP1 with correct function for MP2 i.e. allows / location of, (biochemical / metabolic) reactions / cell processes ecf MP2 from incorrect structure in MP1 5(b) length of the (cell structure), in image / picture / photomicrograph / diagram and magnification ; 1 Question Answer Marks Guidance 5(c) 0.75 (m) ; 1 A 7.5 x 10⁻¹
Q6 · A student investigated plant growth responses in roots and shoots
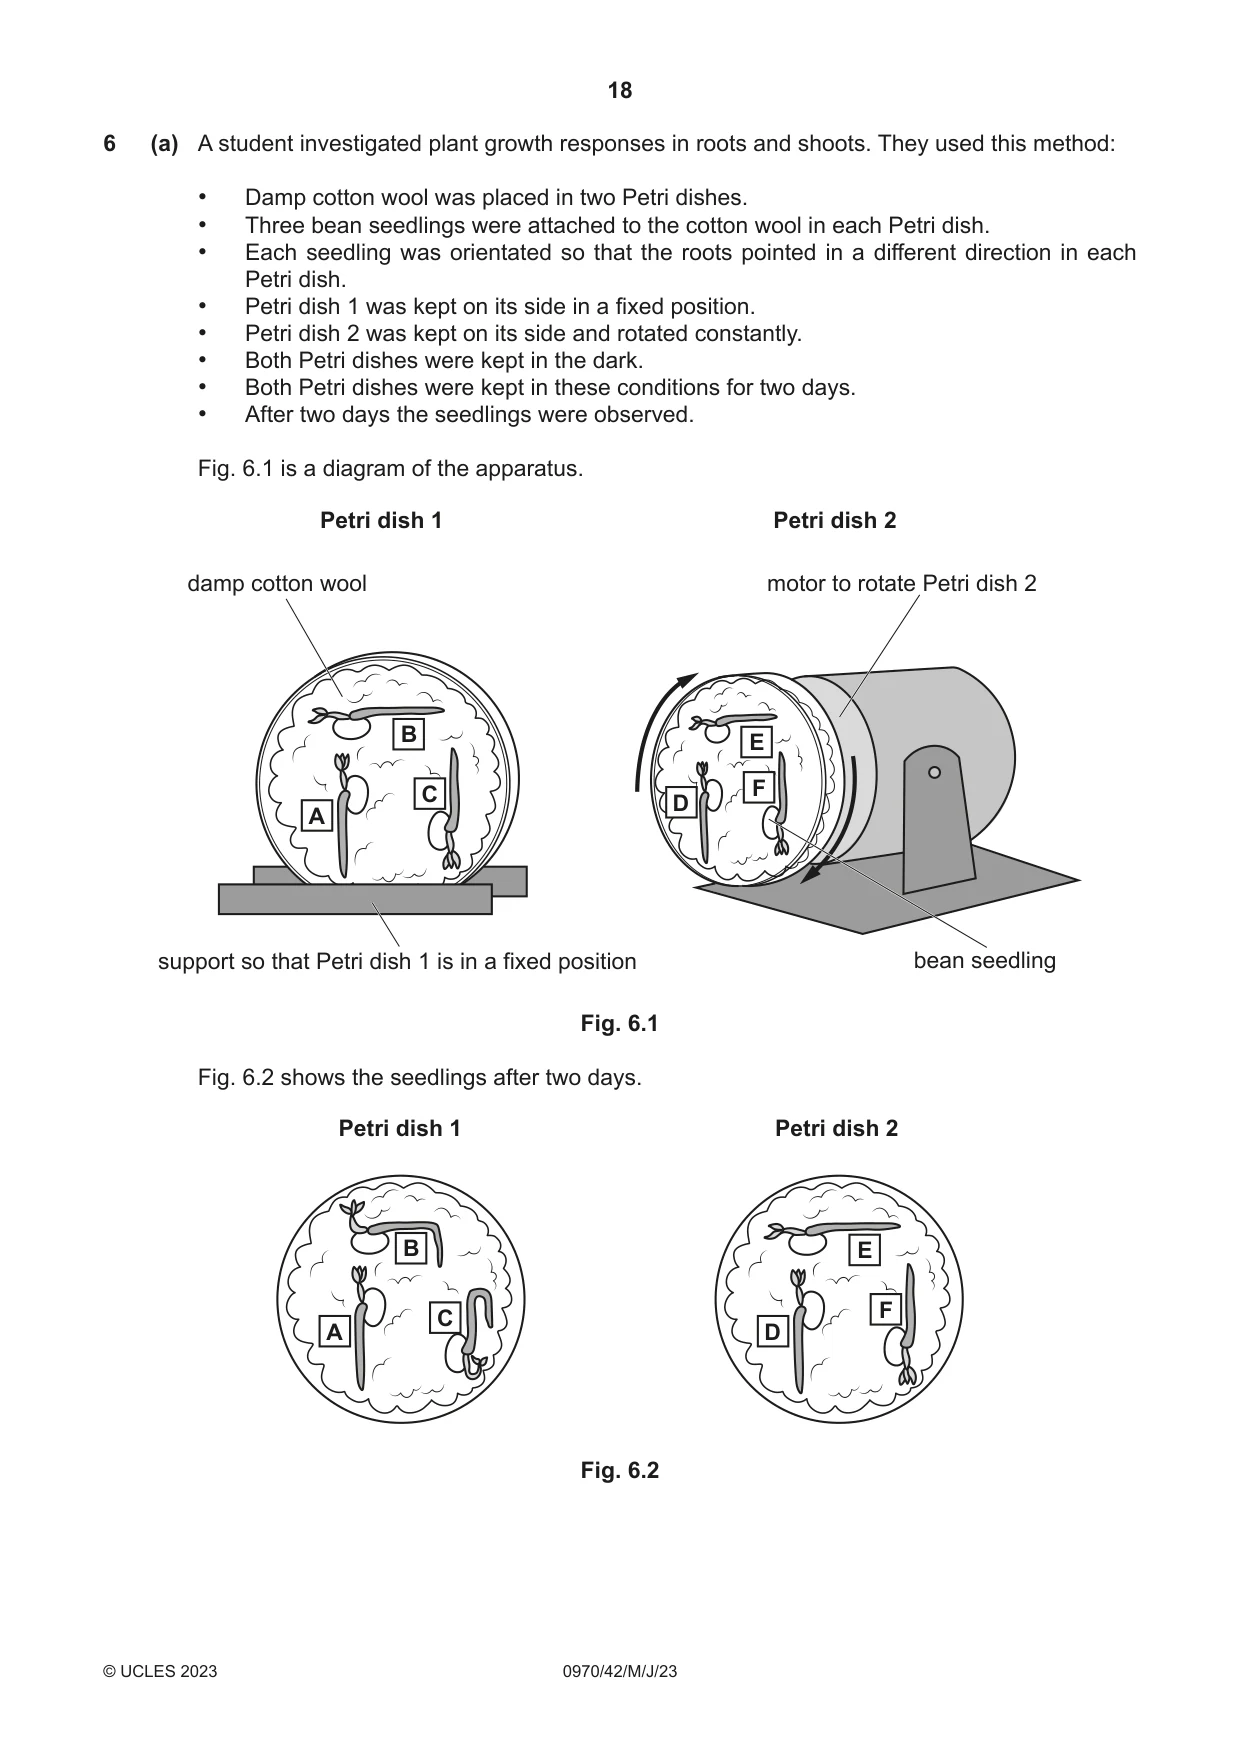
6 (a) A student investigated plant growth responses in roots and shoots. They used this method: • Damp cotton wool was placed in two Petri dishes. • Three bean seedlings were attached to the cotton wool in each Petri dish. • Each seedling was orientated so that the roots pointed in a different direction in each Petri dish. • Petri dish 1 was kept on its side in a fixed position. • Petri dish 2 was kept on its side and rotated constantly. • Both Petri dishes were kept in the dark. • Both Petri dishes were kept in these conditions for two days. • After two days the seedlings were observed. Fig. 6.1 is a diagram of the apparatus. Petri dish 1 Petri dish 2 damp cotton wool motor to rotate Petri dish 2 B E F C D A support so that Petri dish 1 is in a fixed position bean seedling Fig. 6.1 Fig. 6.2 shows the seedlings after two days. Petri dish 1 Petri dish 2 B E F C A D Fig. 6.2 (i) Describe the pattern of growth of the bean roots and shoots in Petri dish 1 shown in Fig. 6.2. ........................................................................................................................................... ........................................................................................................................................... ..................................................................................................................................... [1] (ii) State the name of the growth responses observed in the bean roots and shoots. ..................................................................................................................................... [1] (iii) Explain how auxin causes the difference in the pattern of growth shown by the shoots of seedlings B and E shown in Fig. 6.2. ........................................................................................................................................... ........................................................................................................................................... ........................................................................................................................................... ........................................................................................................................................... ........................................................................................................................................... ........................................................................................................................................... ........................................................................................................................................... ........................................................................................................................................... ........................................................................................................................................... ........................................................................................................................................... ..................................................................................................................................... [5] (b) Seeds require oxygen and water to germinate. (i) State one other environmental condition that affects germination. ..................................................................................................................................... [1] (ii) Suggest why oxygen and water are required for germination. ........................................................................................................................................... ........................................................................................................................................... ........................................................................................................................................... ........................................................................................................................................... ..................................................................................................................................... [2] [Total: 10]
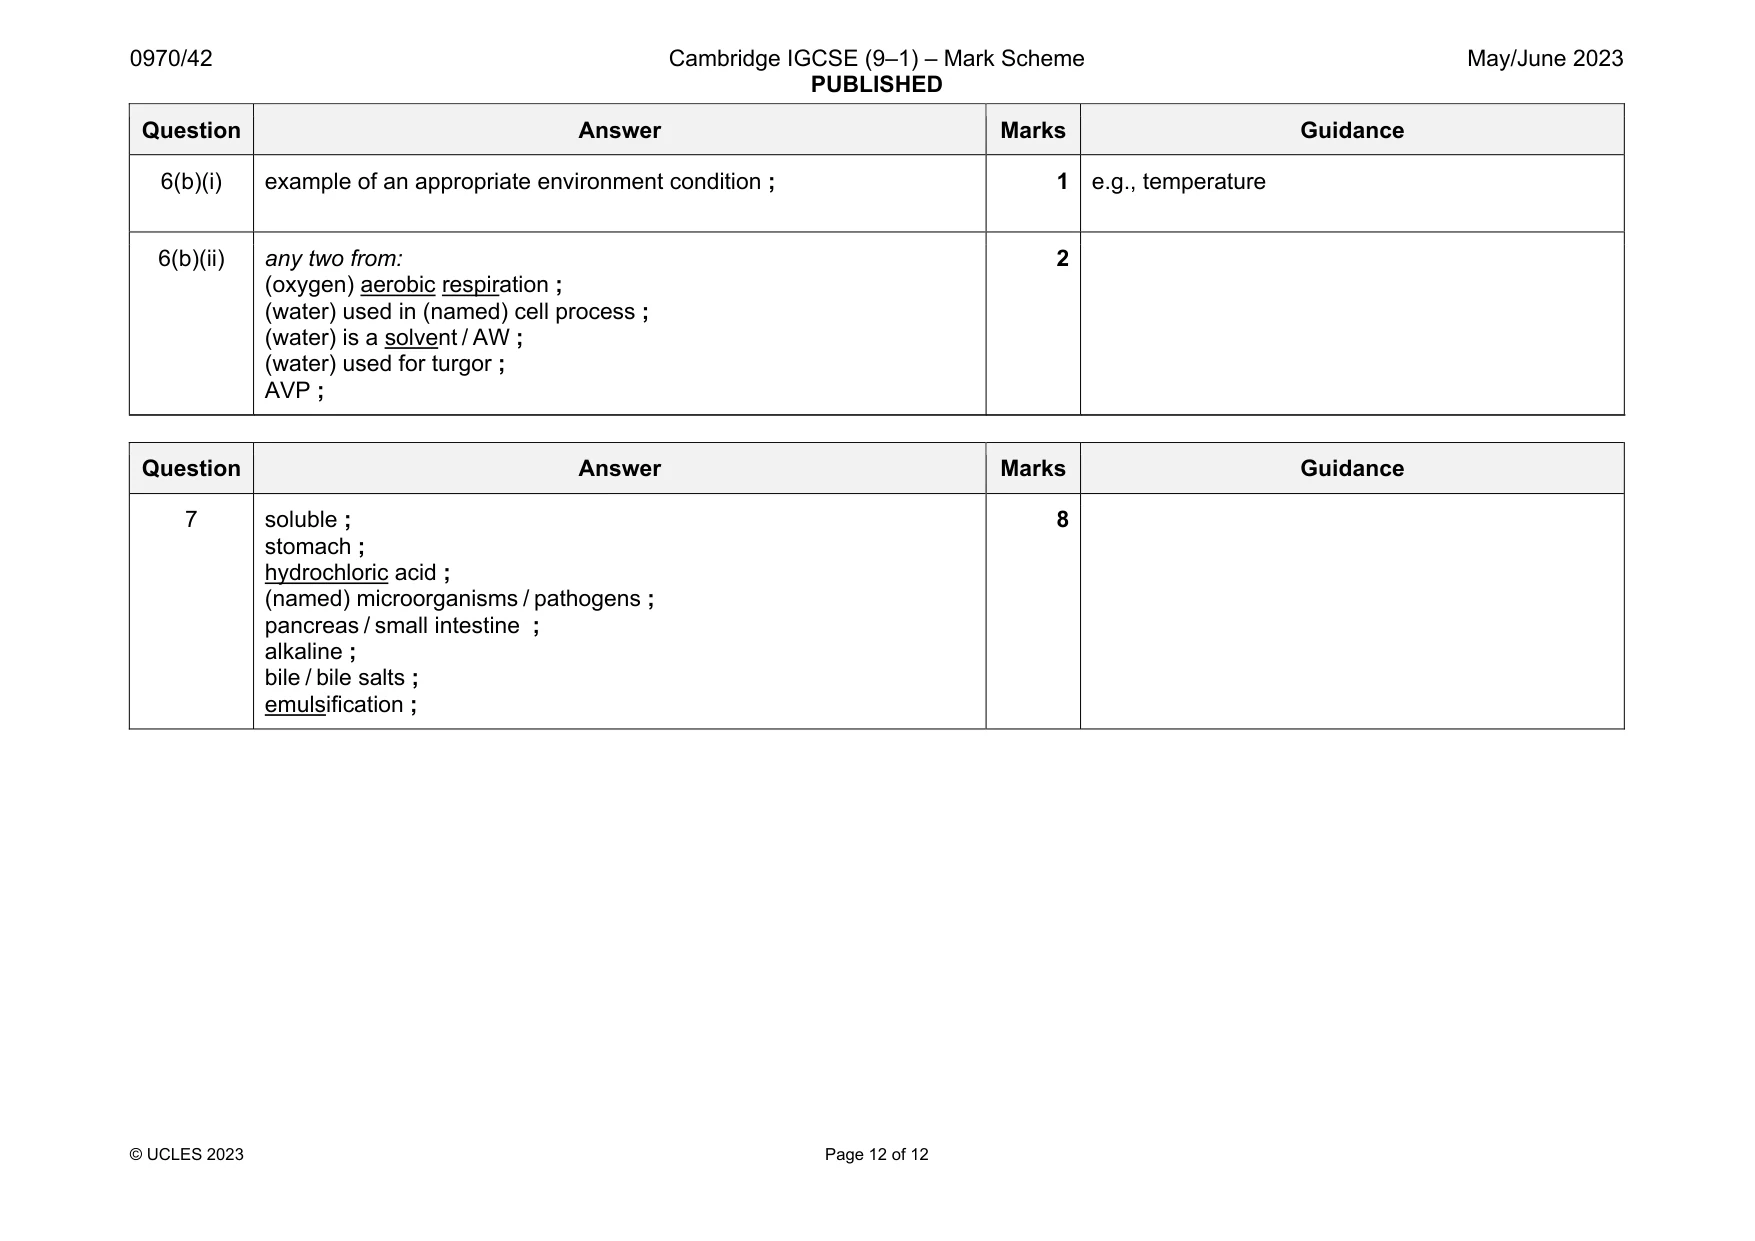
Mark scheme: 6(a)(i) either (all) roots have grown, downwards / with gravity (no matter which way they were facing at the start) or roots show positive, gravitropism / geotropism and either (all) shoots have grown, upwards / in opposite direction to gravity (no matter which way they were facing at the start) or shoots show negative, gravitropism / geotropism ; 1 6(a)(ii) gravitropism ; 1 6(a)(iii) any five from: (auxin) made in / released from, (shoot) tip ; (auxin) moves by diffusion ; (auxin) stimulates cell elongation ; in B / Petri dish 1: (auxin) has a higher concentration of auxin on the lower surface (of the shoot) ; ora (auxin stimulates cell) elongation more on lower side of the shoot ; ora shoot grows away from the pull of gravity / AW ; in E / Petri dish 2: (auxin is) equally distributed (in the shoot) ; (auxin stimulates cell) elongation equally on, both / all, sides of the shoot ; (shoots grow neither up or down / shoot grows straight) because the effect of gravity is, constantly changing / countered by rotating (the Petri dish) 5 Question Answer Marks Guidance 6(b)(i) example of an appropriate environment condition ; 1 e.g., temperature 6(b)(ii) any two from: (oxygen) aerobic respiration ; (water) used in (named) cell process ; (water) is a solvent / AW ; (water) used for turgor ; AVP ; 2
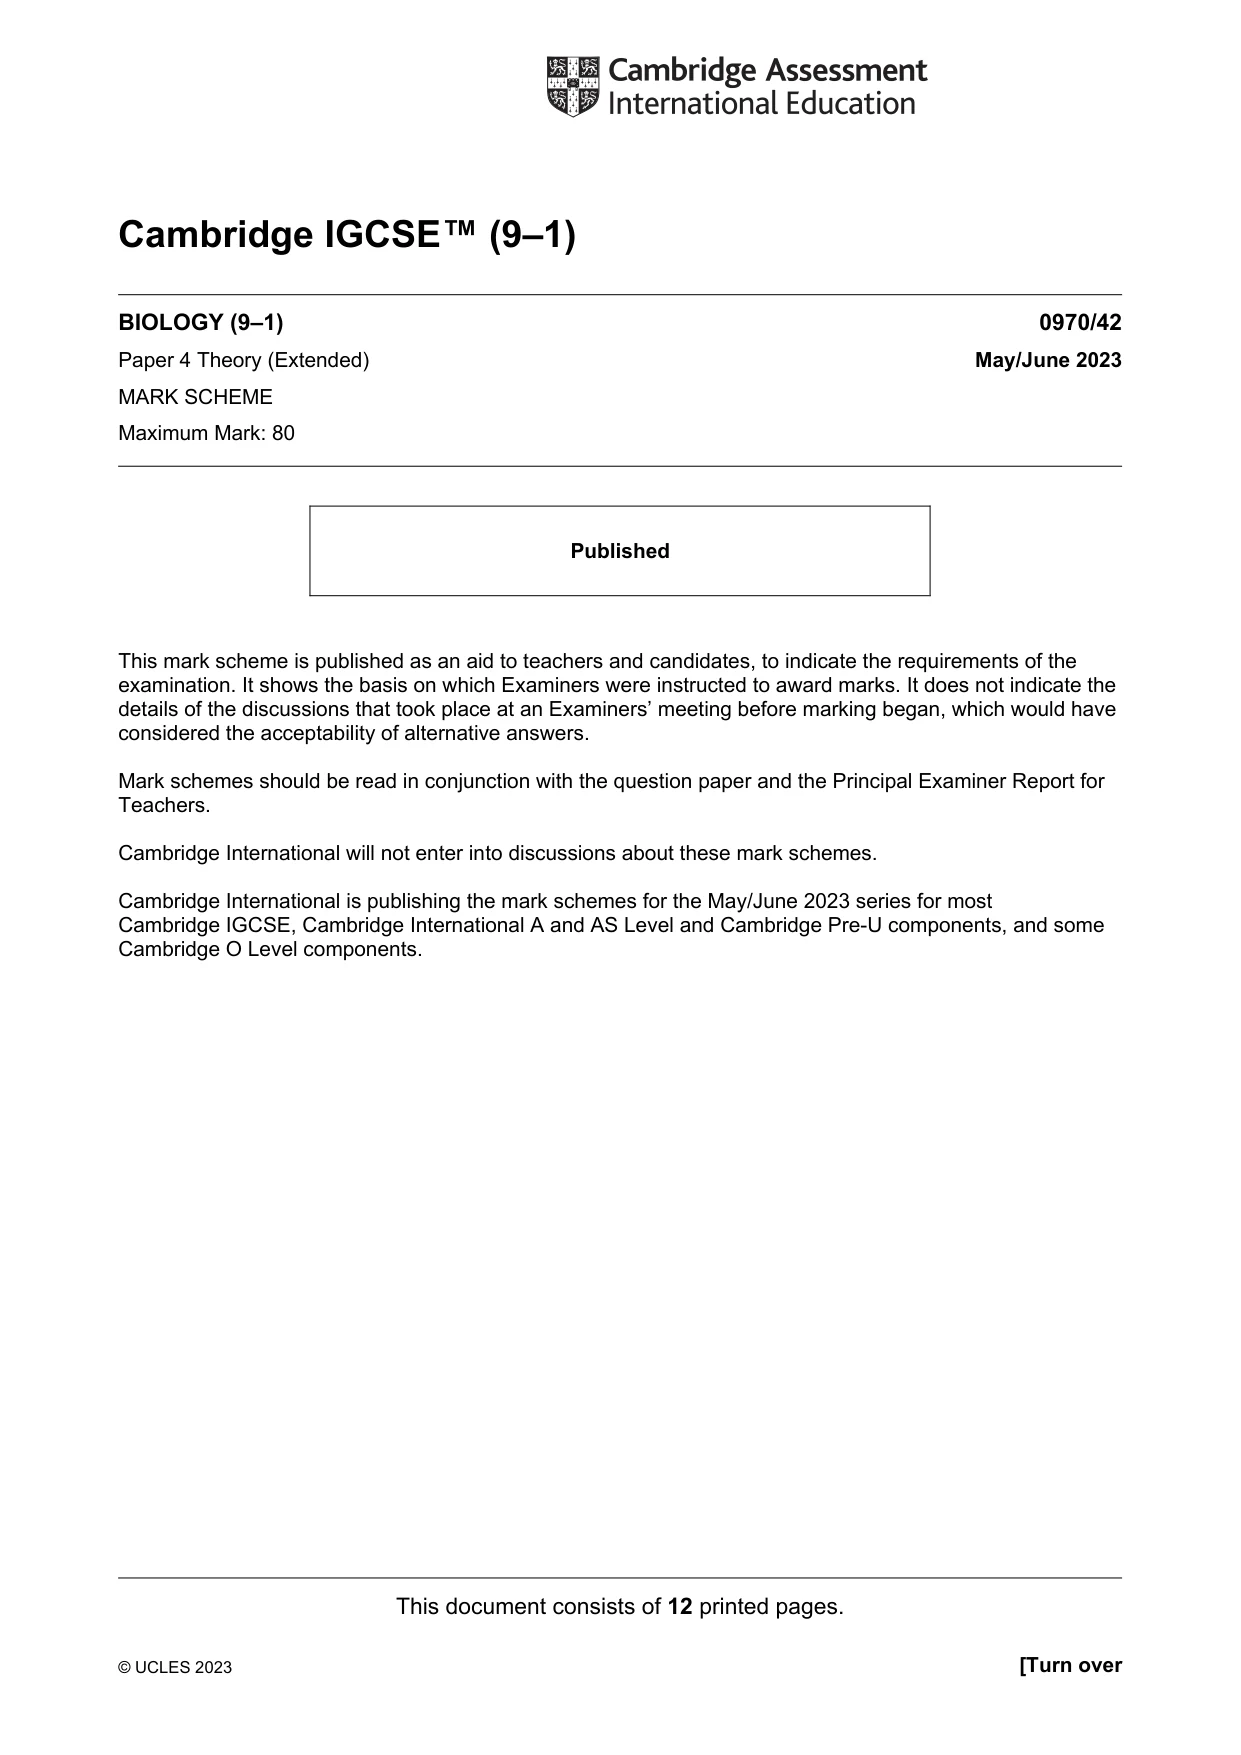
Q7 · Complete the sentences about enzymes by writing a suitable word or phrase in each of the…
7 Complete the sentences about enzymes by writing a suitable word or phrase in each of the spaces provided. Enzymes are involved in chemical digestion which produces small ................................................ molecules that can be absorbed into the blood. Two examples of protease enzymes are pepsin and trypsin. Pepsin is produced by the ................................................ and requires acidic conditions. These conditions are created by the release of ................................................ , which provides the optimum pH for pepsin activity and also kills harmful ................................................ . The ................................................ produces trypsin which breaks down protein in ................................................ pH conditions. These conditions are created by a substance called ................................................ , which neutralises the gastric juices and also has an important role in the ................................................ of fats and oils. [8]
Mark scheme: 7 soluble ; stomach ; hydrochloric acid ; (named) microorganisms / pathogens ; pancreas / small intestine ; alkaline ; bile / bile salts ; emulsification ; 8
What was in this paper
The subtopics covered by these 7 questions, and how many questions each got. Open one in a new tab to see every Cambridge question on it.
What you needed in this session
Cambridge’s own grade thresholds for 2023 May/June, Paper 4 · Variant 2. A higher threshold means an easier paper — the bar moves with how the cohort did.