Cambridge A Level Psychology (from 2018) 9990 — 2021 Oct/Nov Paper 3 · Variant 2
9990/32/O/N/21 · 8 questions · 60 marks · ≈68 min
The question paper and its mark scheme, free to read here and free to download. This is Cambridge’s own paper, exactly as it was sat.
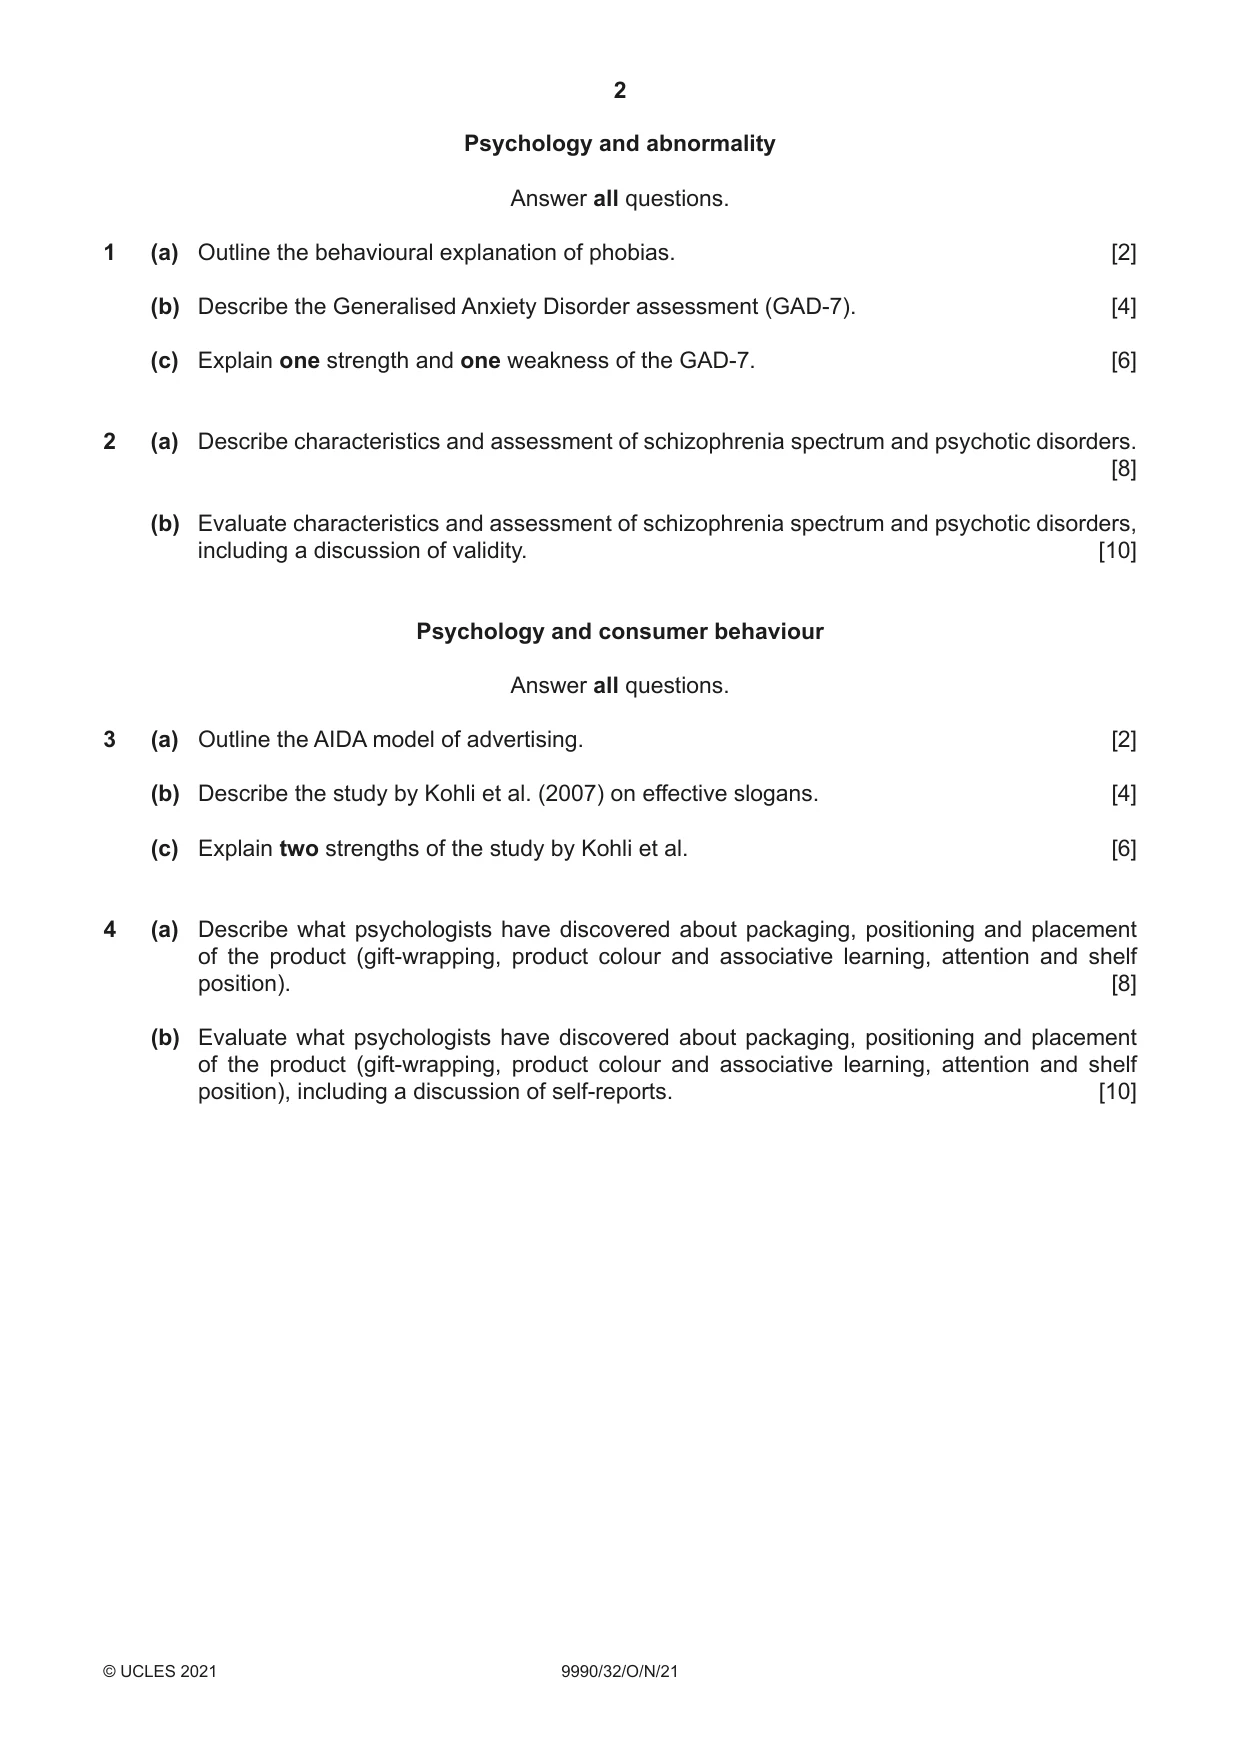
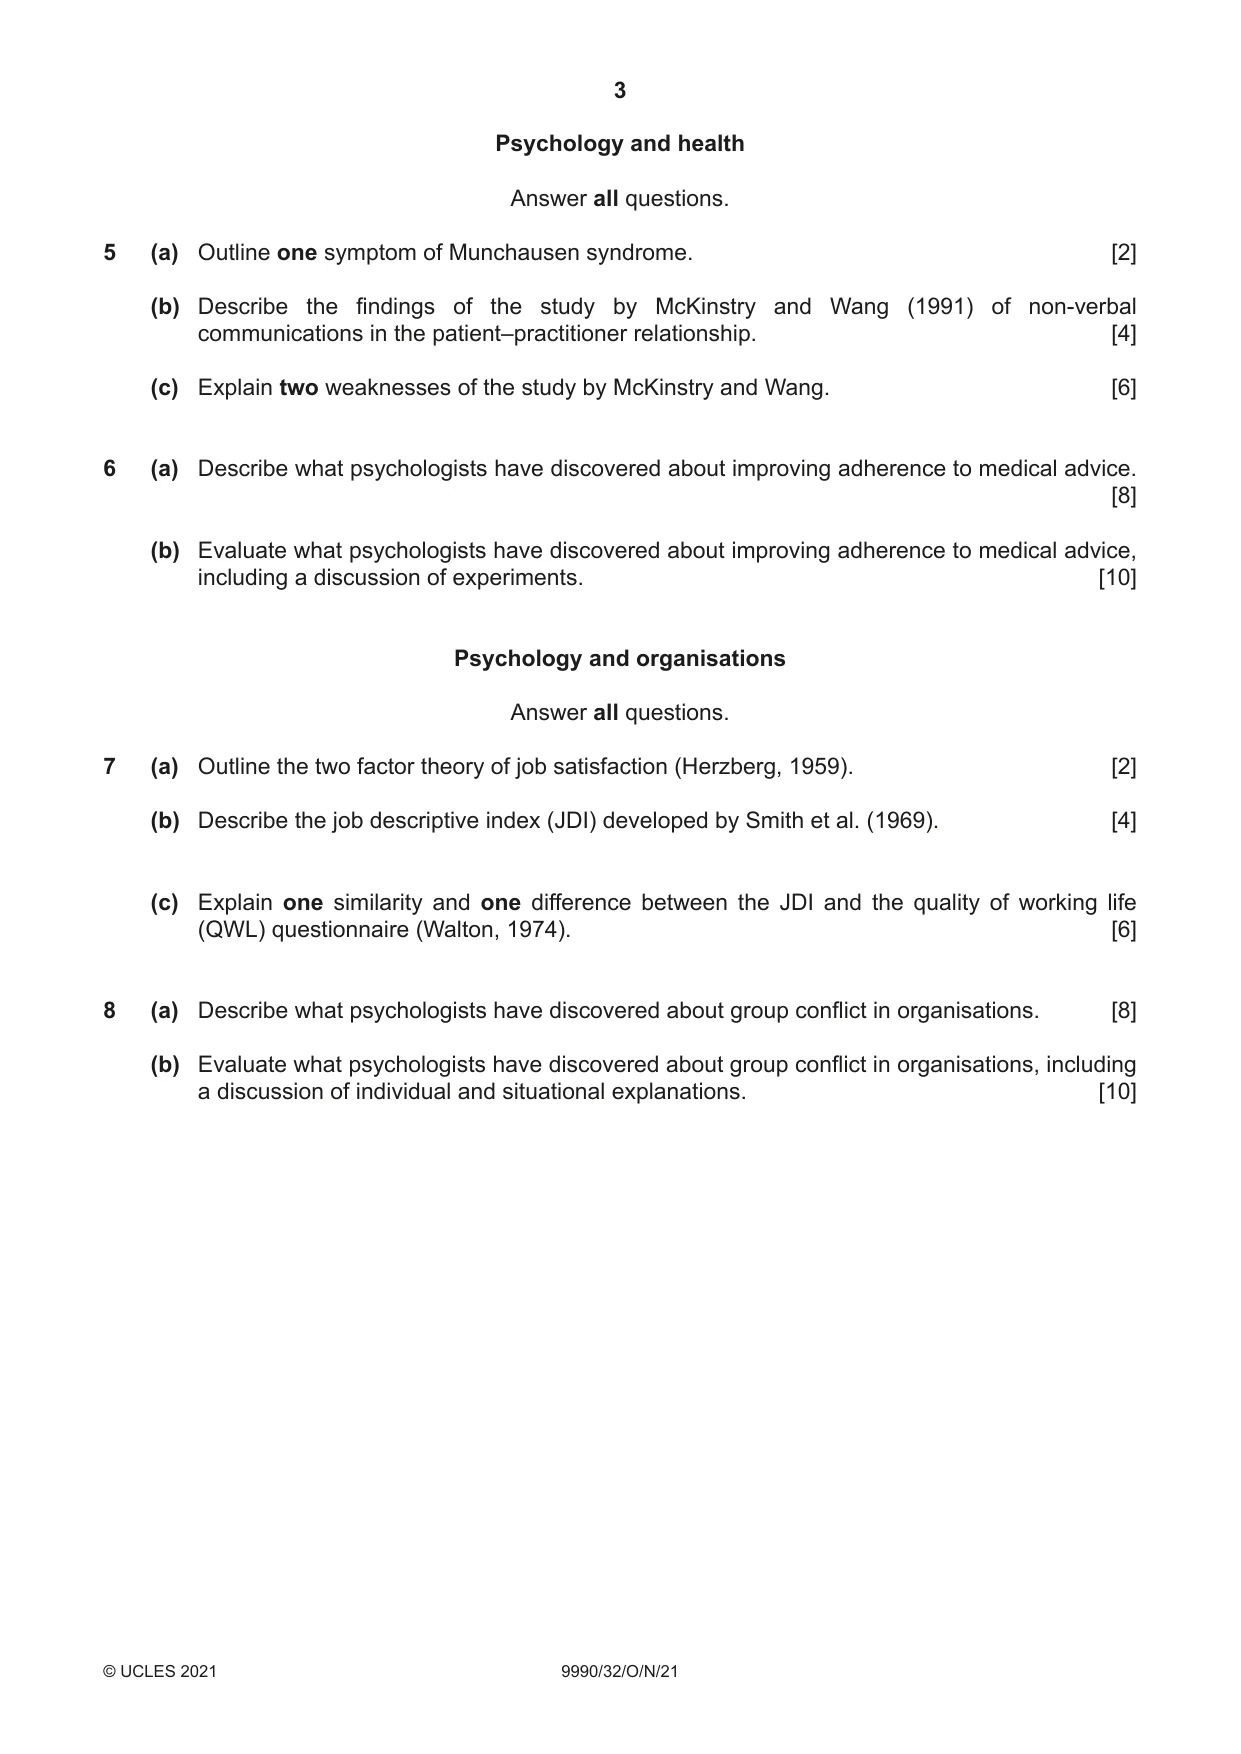
Question paper4 pages

Mark scheme25 pages
Answers below. Sit the paper first if you are practising.

Questions as text
Q1 · Outline the behavioural explanation of phobias
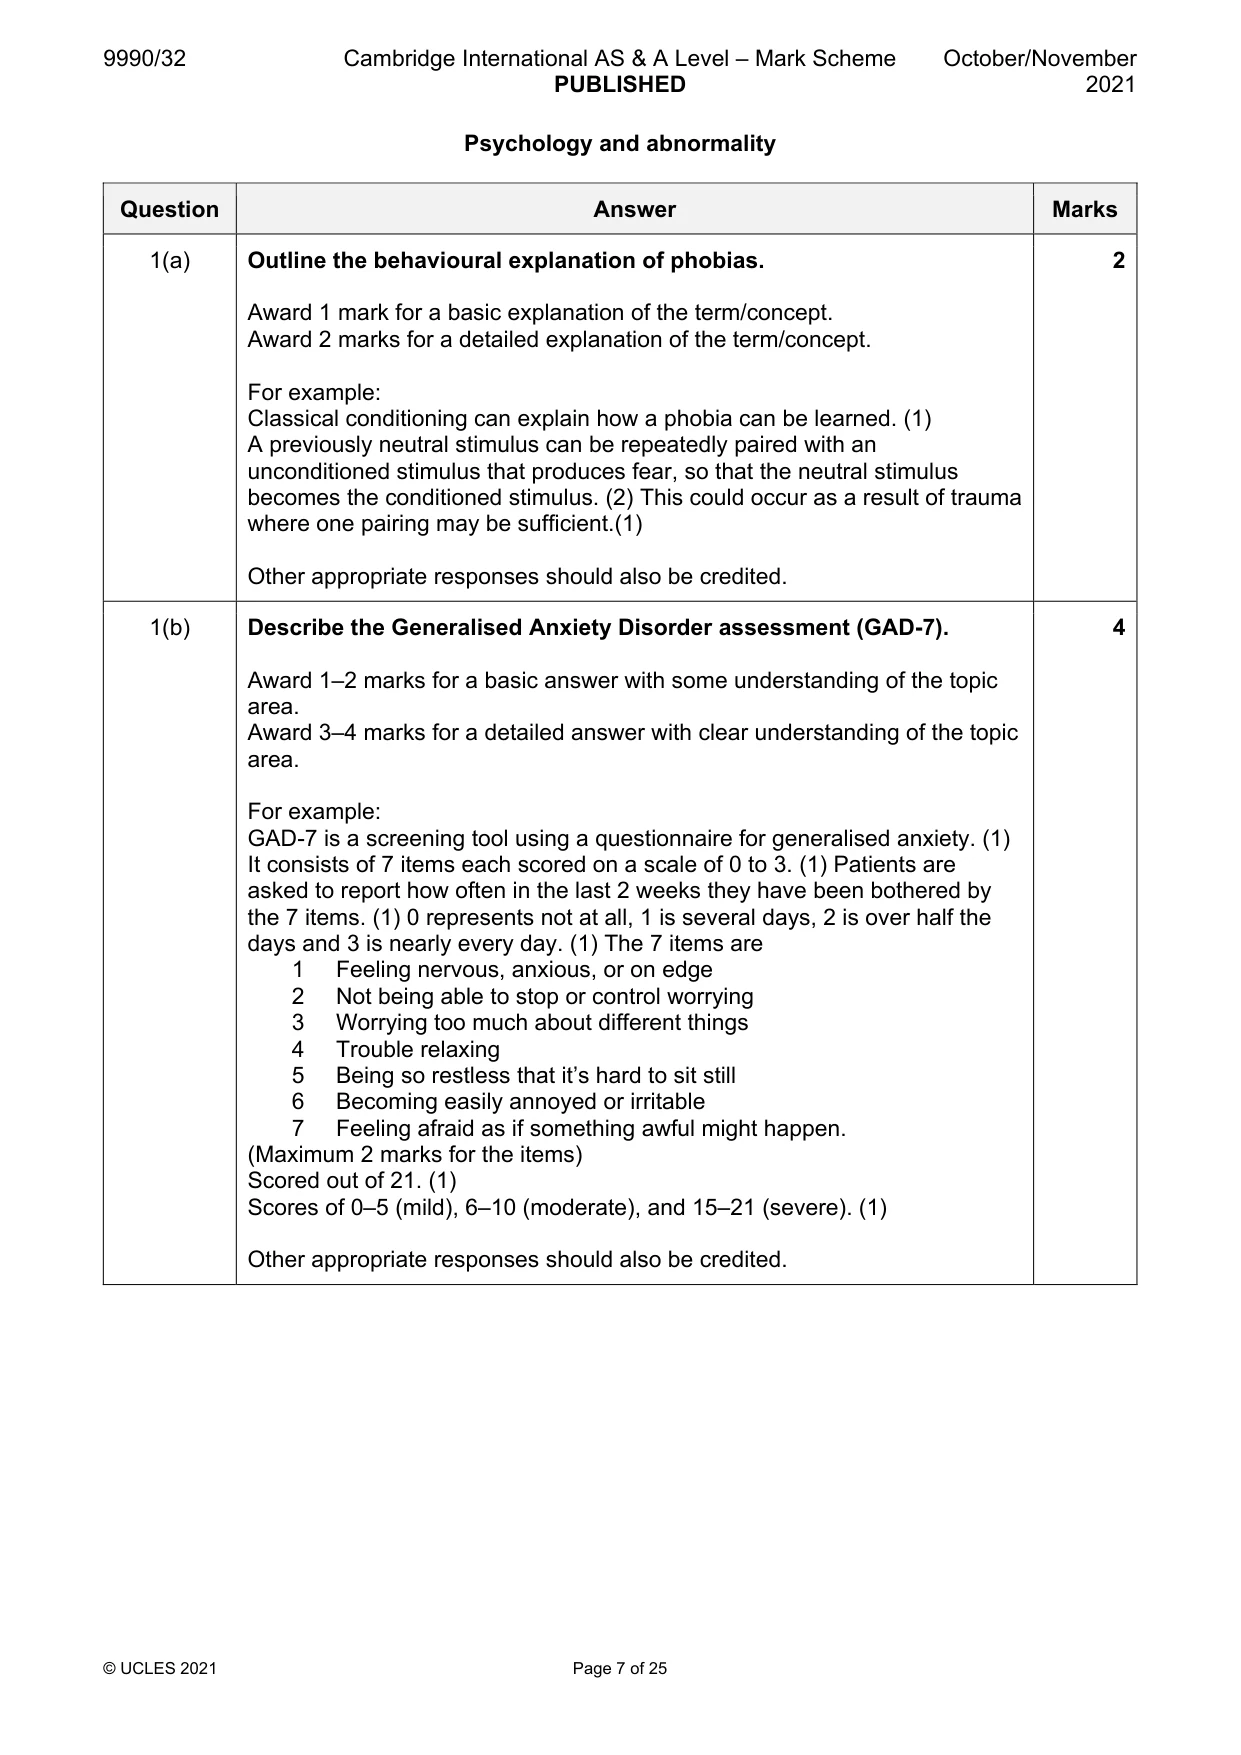
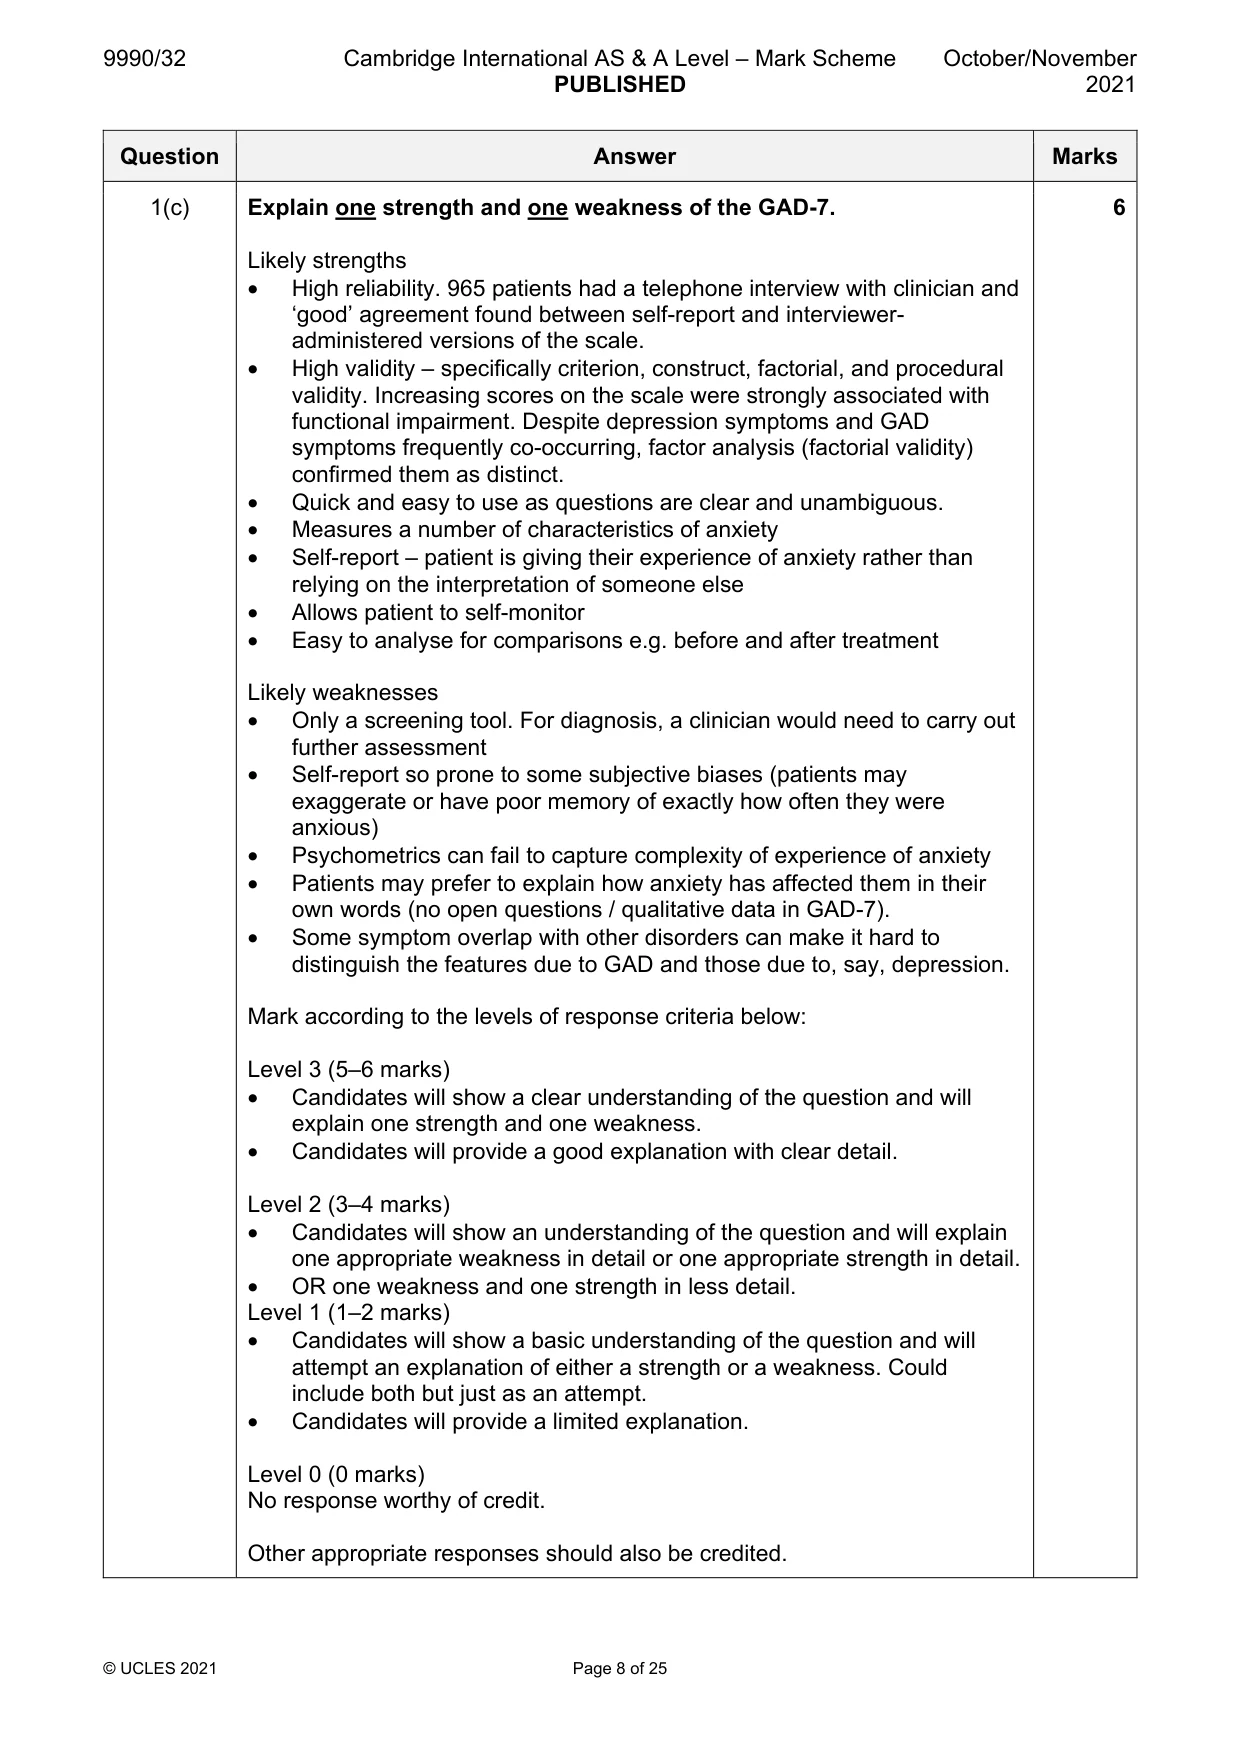
1 (a) Outline the behavioural explanation of phobias. [2] (b) Describe the Generalised Anxiety Disorder assessment (GAD-7). [4] (c) Explain one strength and one weakness of the GAD-7. [6]
Mark scheme: Question Answer Marks 1(a) Outline the behavioural explanation of phobias. 2 Award 1 mark for a basic explanation of the term/concept. Award 2 marks for a detailed explanation of the term/concept. For example: Classical conditioning can explain how a phobia can be learned. (1) A previously neutral stimulus can be repeatedly paired with an unconditioned stimulus that produces fear, so that the neutral stimulus becomes the conditioned stimulus. (2) This could occur as a result of trauma where one pairing may be sufficient.(1) Other appropriate responses should also be credited. 1(b) Describe the Generalised Anxiety Disorder assessment (GAD-7). 4 Award 1–2 marks for a basic answer with some understanding of the topic area. Award 3–4 marks for a detailed answer with clear understanding of the topic area. For example: GAD-7 is a screening tool using a questionnaire for generalised anxiety. (1) It consists of 7 items each scored on a scale of 0 to 3. (1) Patients are asked to report how often in the last 2 weeks they have been bothered by the 7 items. (1) 0 represents not at all, 1 is several days, 2 is over half the days and 3 is nearly every day. (1) The 7 items are 1 Feeling nervous, anxious, or on edge 2 Not being able to stop or control worrying 3 Worrying too much about different things 4 Trouble relaxing 5 Being so restless that it’s hard to sit still 6 Becoming easily annoyed or irritable 7 Feeling afraid as if something awful might happen. (Maximum 2 marks for the items) Scored out of 21. (1) Scores of 0–5 (mild), 6–10 (moderate), and 15–21 (severe). (1) Other appropriate responses should also be credited. 1(c) Explain one strength and one weakness of the GAD-7. 6 Likely strengths • High reliability. 965 patients had a telephone interview with clinician and ‘good’ agreement found between self-report and interviewer- administered versions of the scale. • High validity – specifically criterion, construct, factorial, and procedural validity. Increasing scores on the scale were strongly associated with functional impairment. Despite depression symptoms and GAD symptoms frequently co-occurring, factor analysis (factorial validity) confirmed them as distinct. • Quick and easy to use as questions are clear and unambiguous. • Measures a number of characteristics of anxiety • Self-report – patient is giving their experience of anxiety rather than relying on the interpretation of someone else • Allows patient to self-monitor • Easy to analyse for comparisons e.g. before and after treatment Likely weaknesses • Only a screening tool. For diagnosis, a clinician would need to carry out further assessment • Self-report so prone to some subjective biases (patients may exaggerate or have poor memory of exactly how often they were anxious) • Psychometrics can fail to capture complexity of experience of anxiety • Patients may prefer to explain how anxiety has affected them in their own words (no open questions / qualitative data in GAD-7). • Some symptom overlap with other disorders can make it hard to distinguish the features due to GAD and those due to, say, depression. Mark according to the levels of response criteria below: Level 3 (5–6 marks) • Candidates will show a clear understanding of the question and will explain one strength and one weakness. • Candidates will provide a good explanation with clear detail. Level 2 (3–4 marks) • Candidates will show an understanding of the question and will explain one appropriate weakness in detail or one appropriate strength in detail. • OR one weakness and one strength in less detail. Level 1 (1–2 marks) • Candidates will show a basic understanding of the question and will attempt an explanation of either a strength or a weakness. Could include both but just as an attempt. • Candidates will provide a limited explanation. Level 0 (0 marks) No response worthy of credit. Other appropriate responses should also be credited.
More questions on Anxiety disorders and fear-related disorders
Q2 · Describe characteristics and assessment of schizophrenia spectrum and psychotic disorders
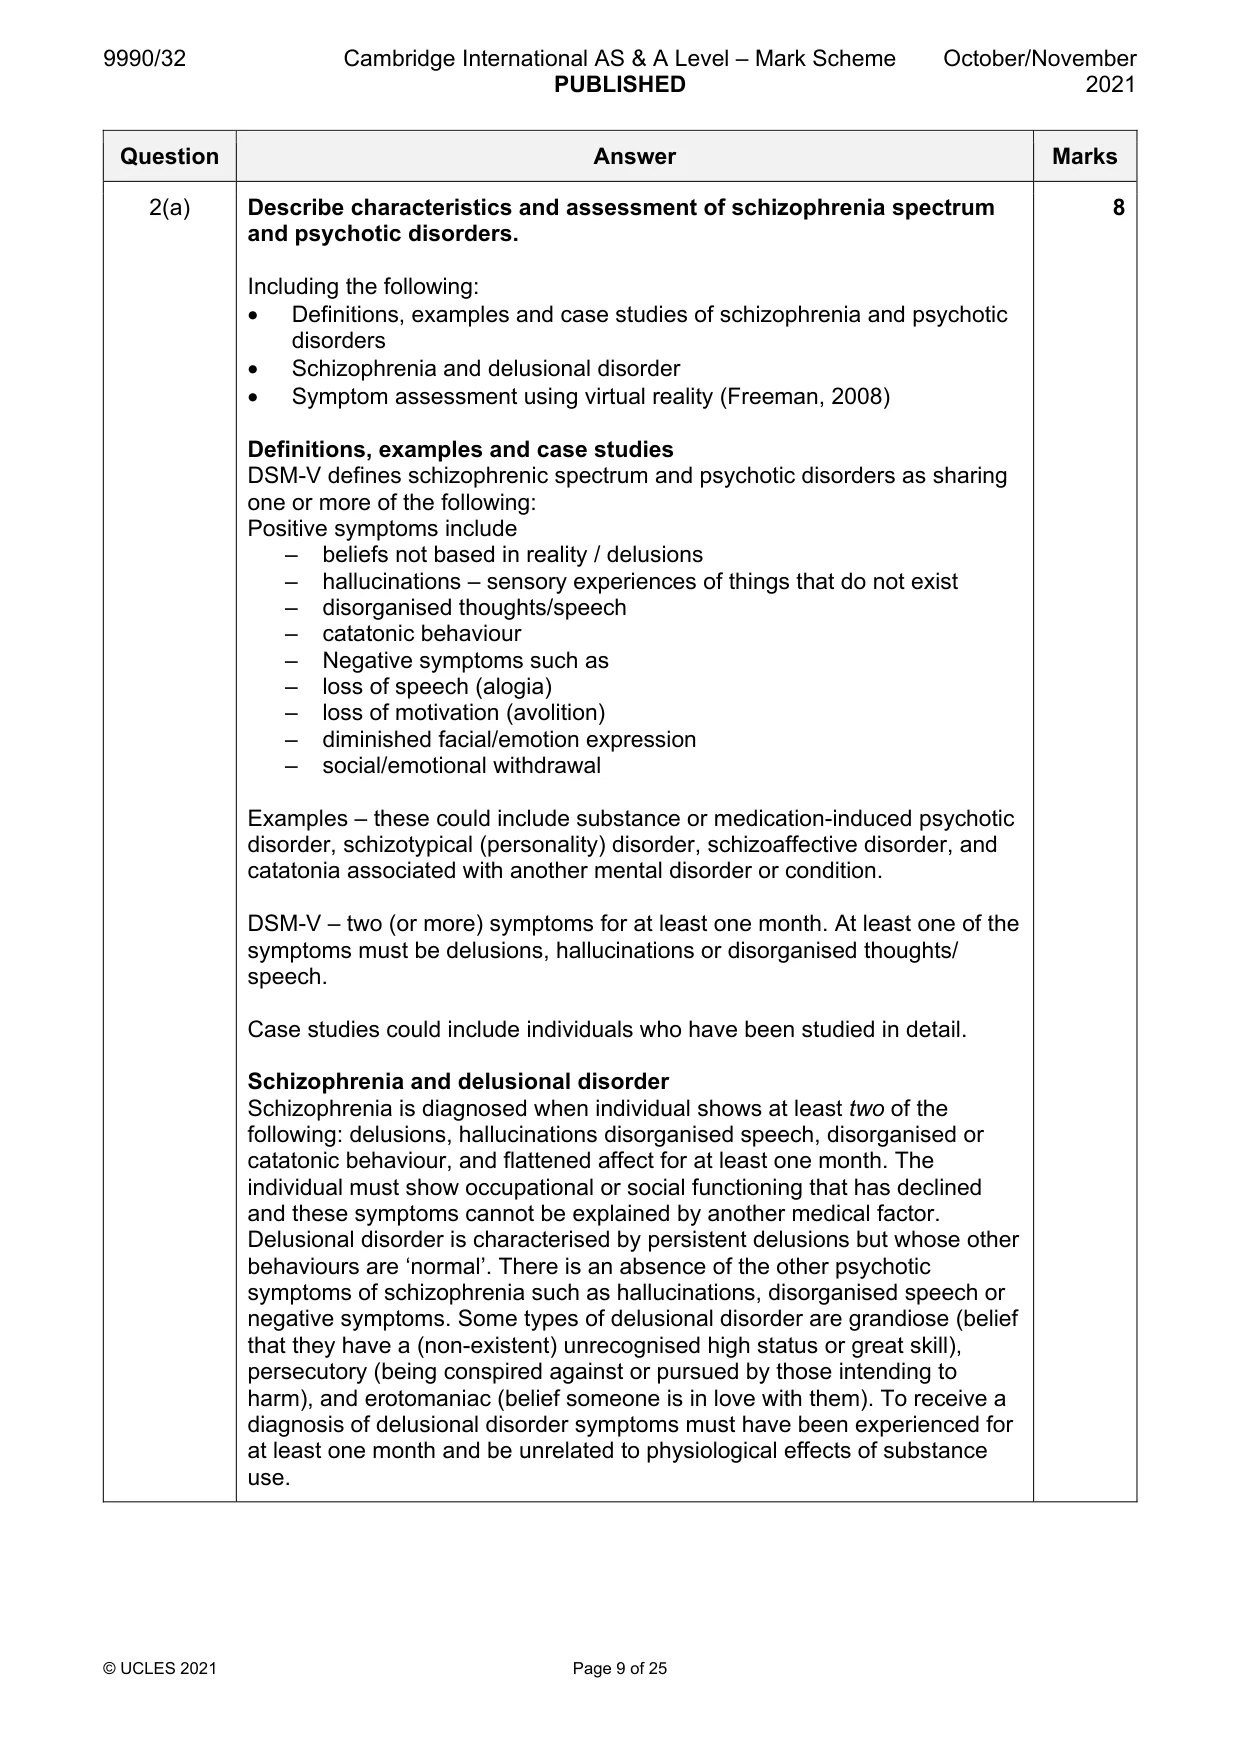
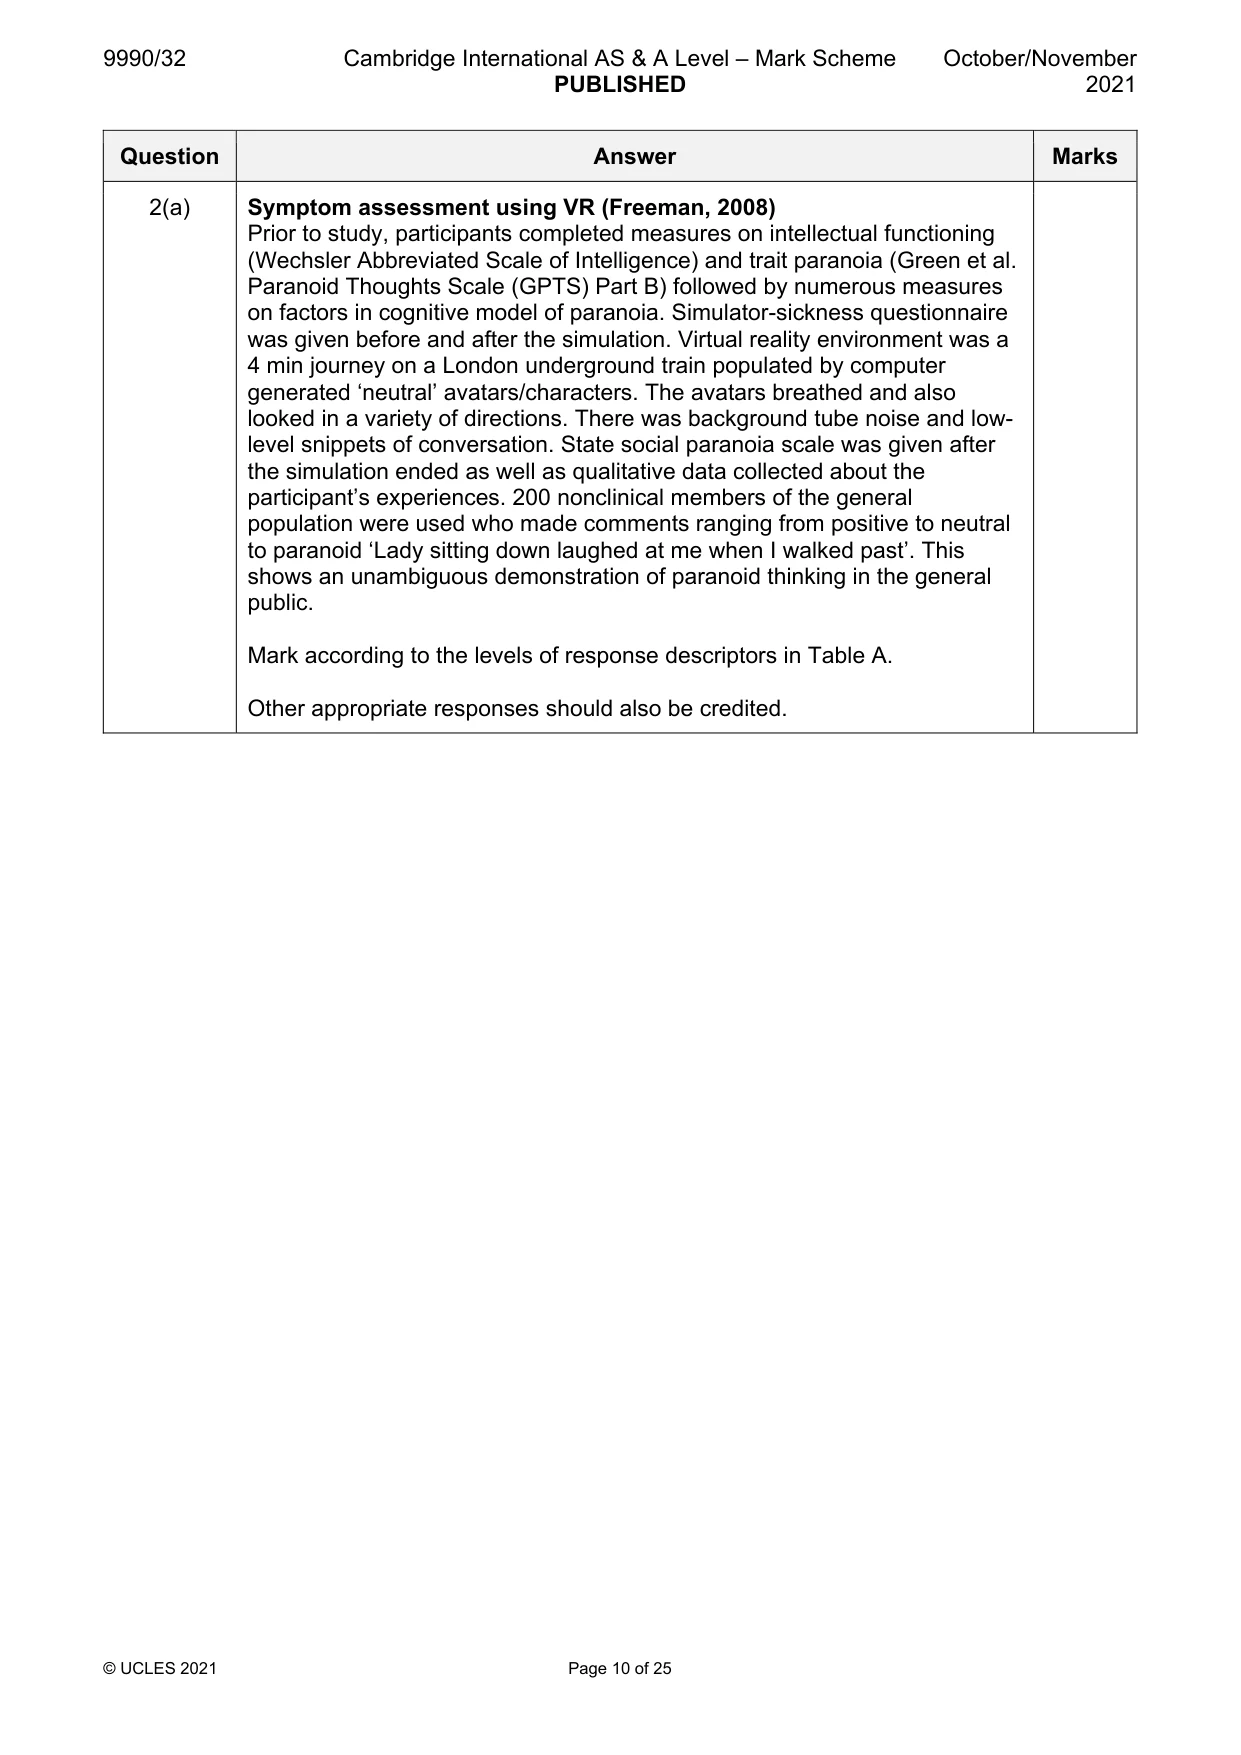
2 (a) Describe characteristics and assessment of schizophrenia spectrum and psychotic disorders. [8] (b) Evaluate characteristics and assessment of schizophrenia spectrum and psychotic disorders, including a discussion of validity. [10] Psychology and consumer behaviour Answer all questions.
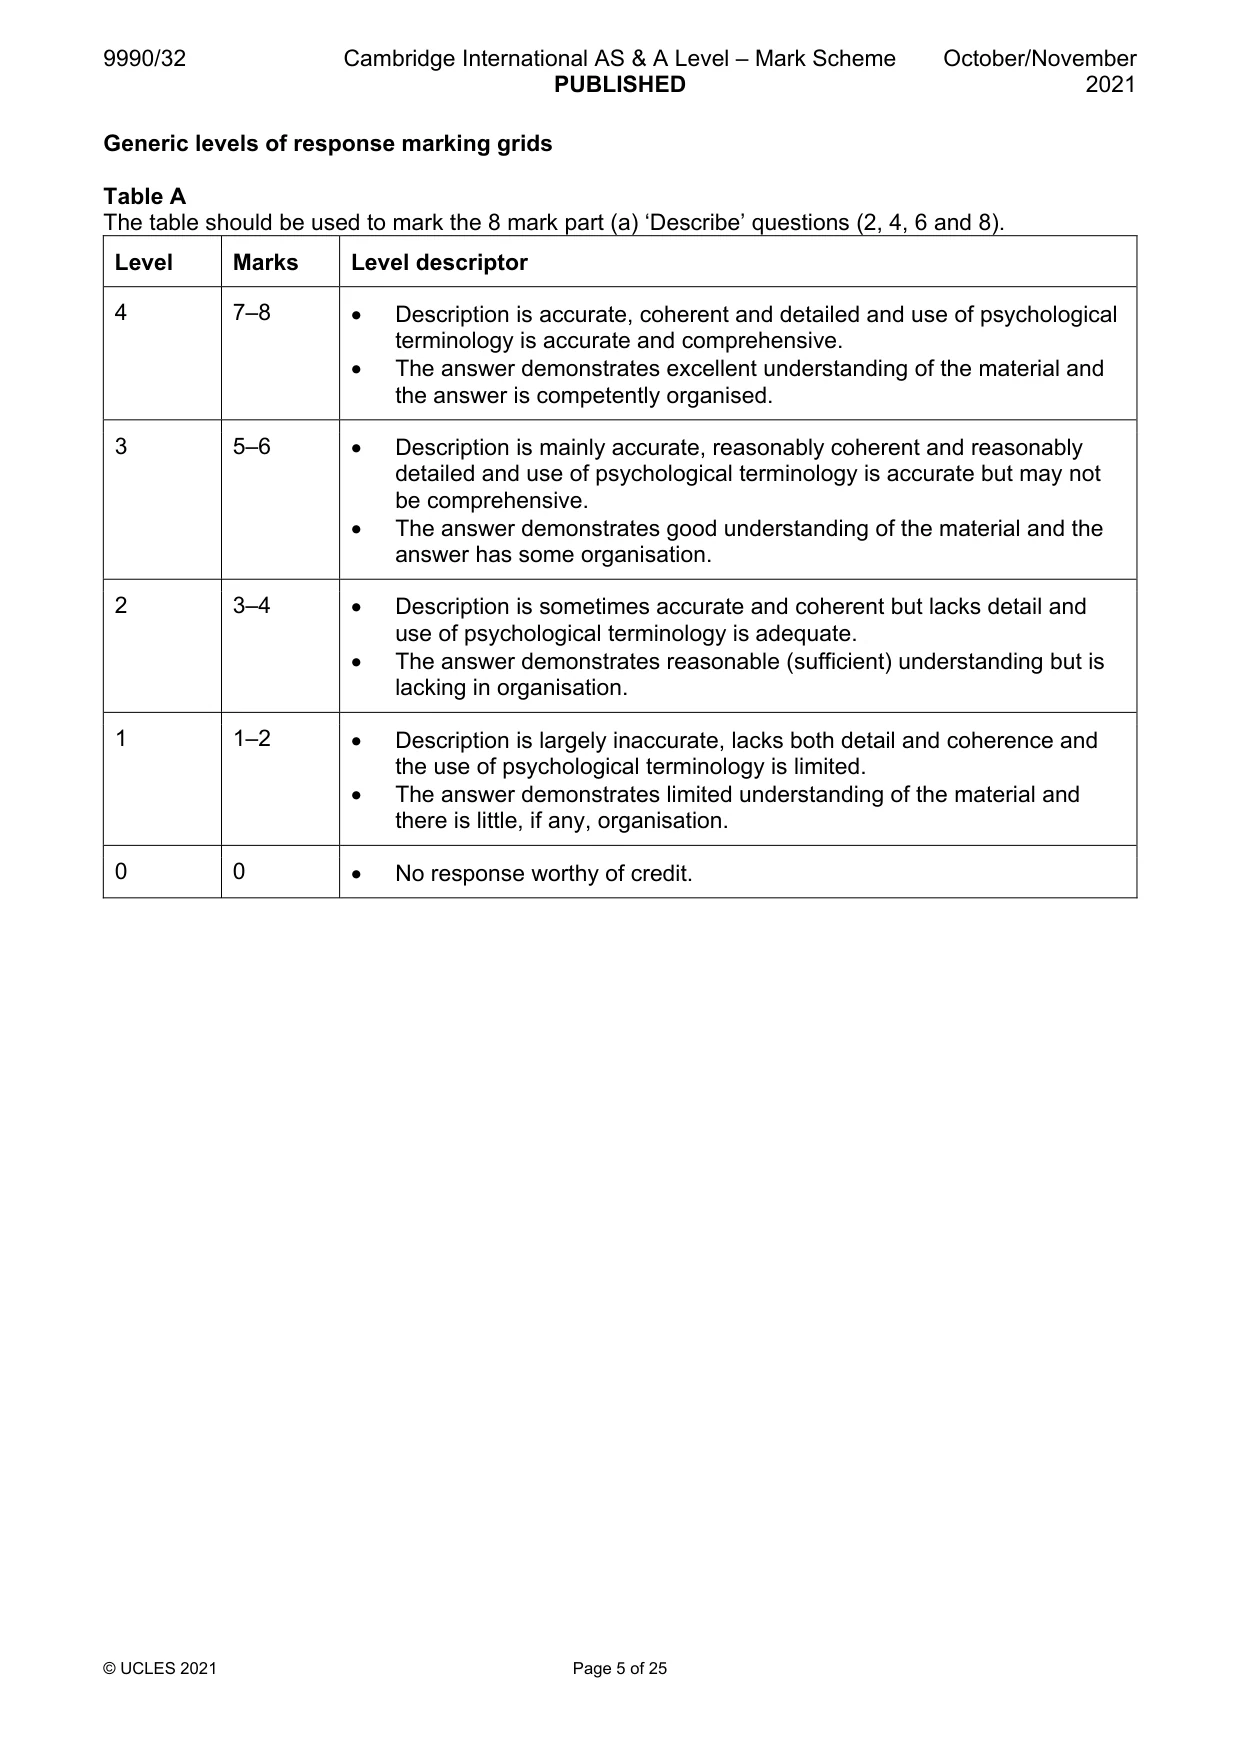
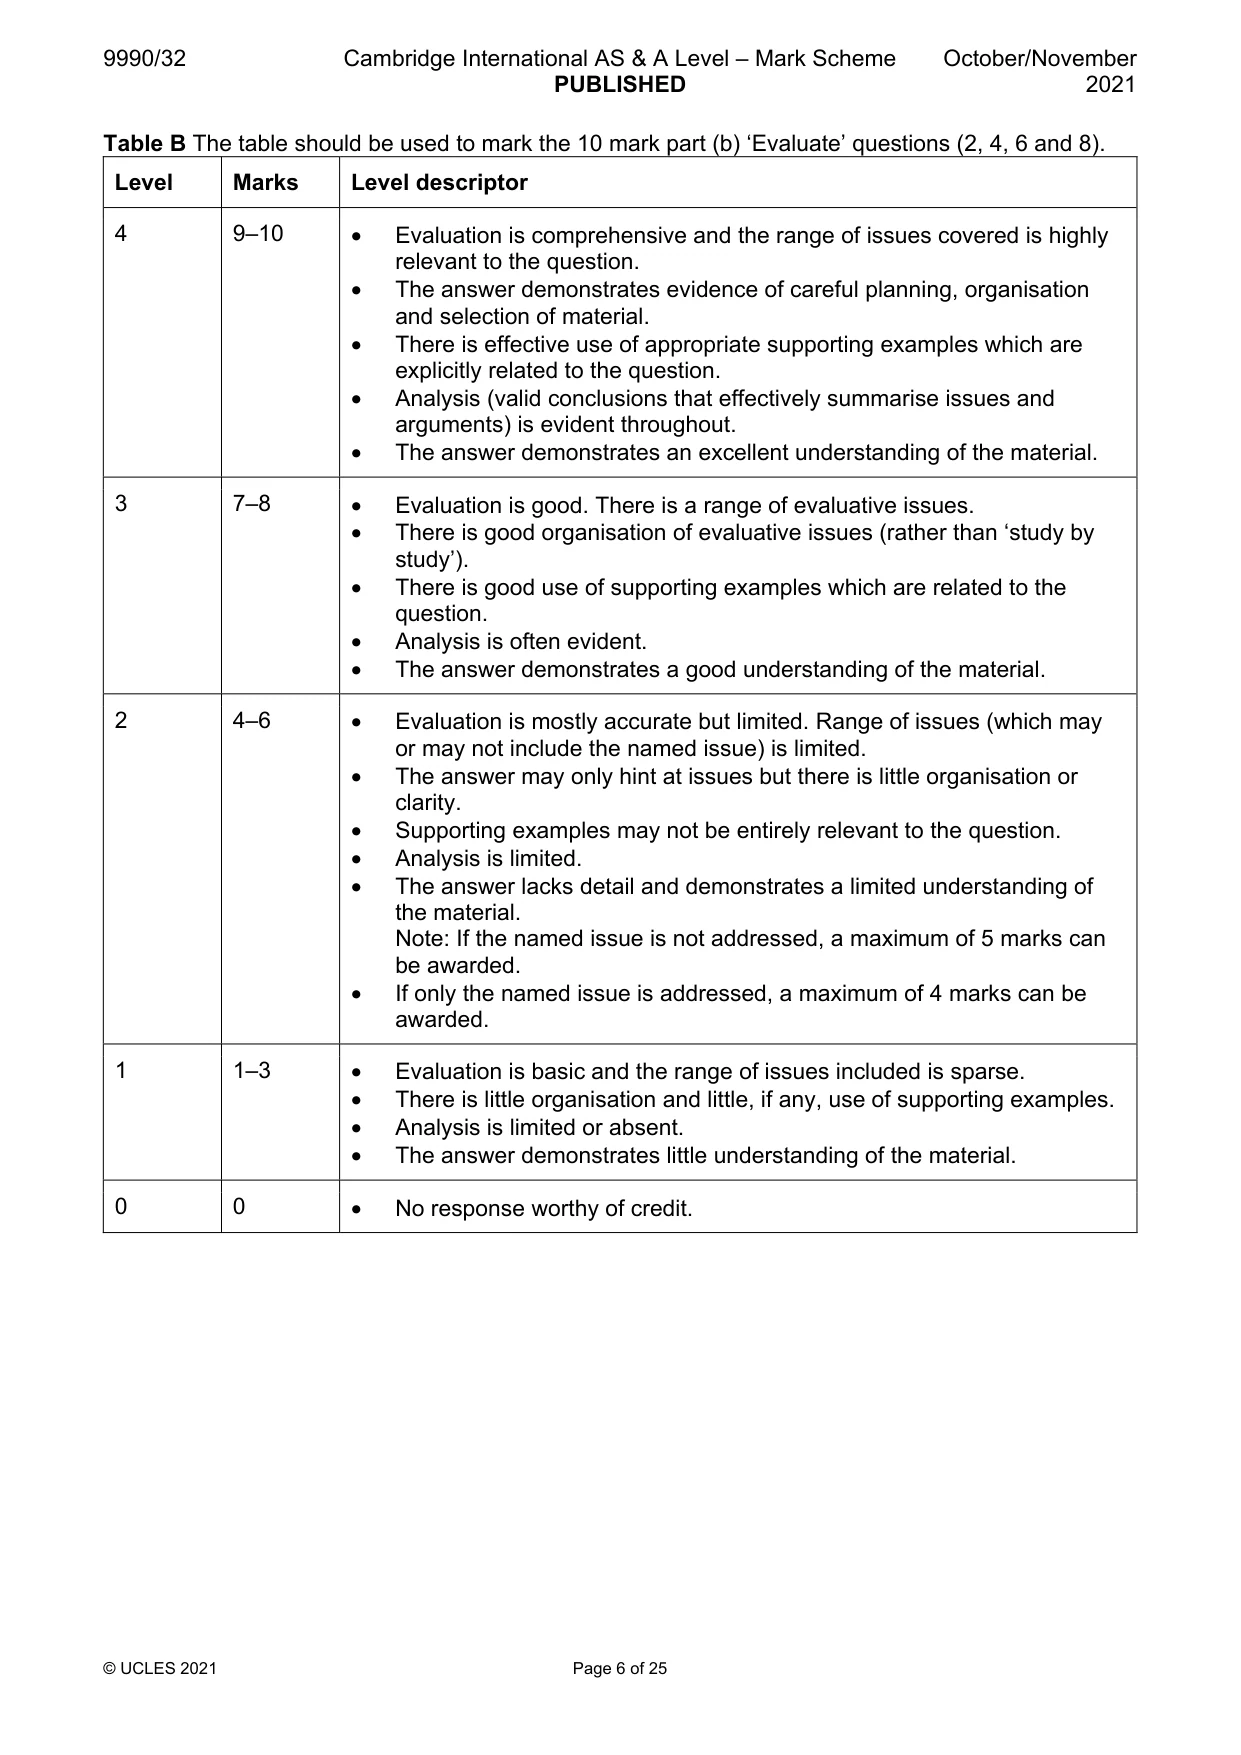
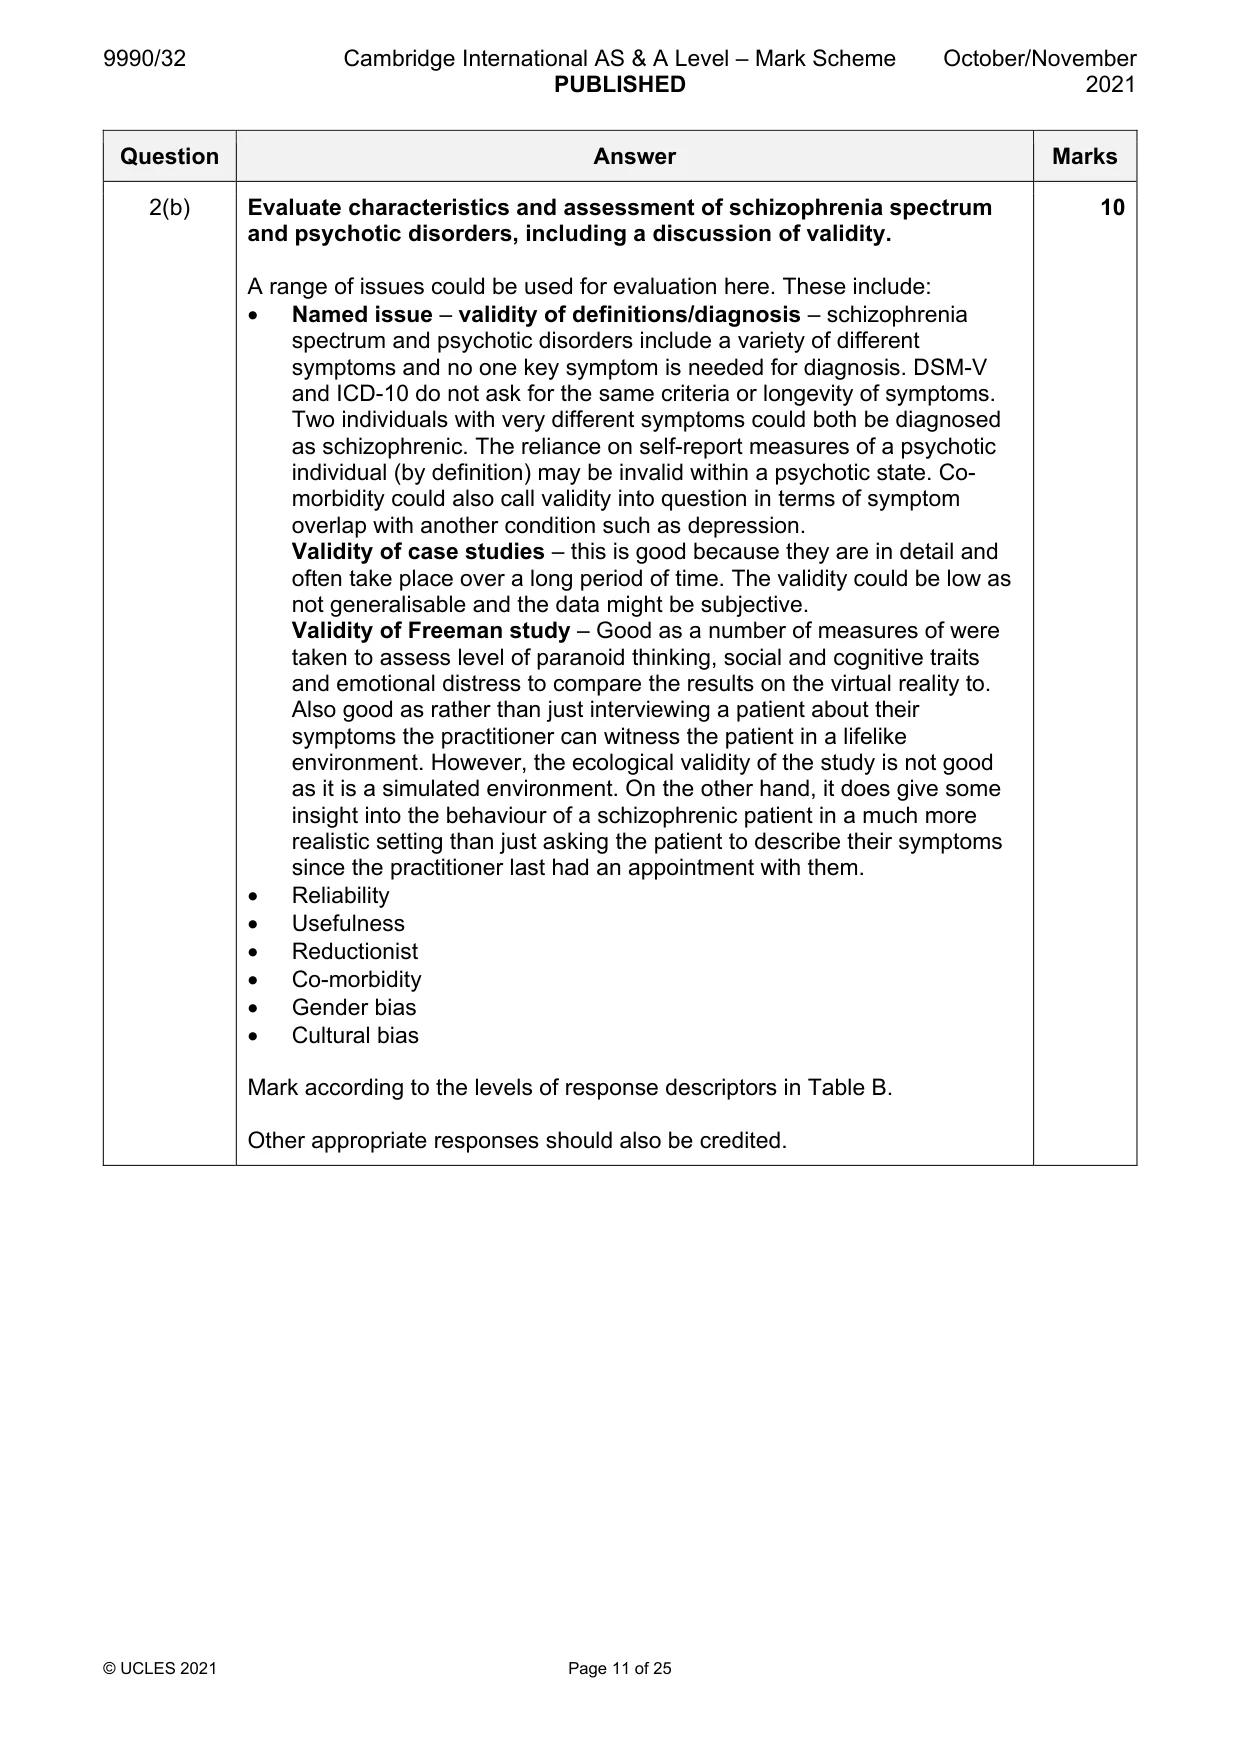
Mark scheme: 2(a) Describe characteristics and assessment of schizophrenia spectrum 8 and psychotic disorders. Including the following: • Definitions, examples and case studies of schizophrenia and psychotic disorders • Schizophrenia and delusional disorder • Symptom assessment using virtual reality (Freeman, 2008) Definitions, examples and case studies DSM-V defines schizophrenic spectrum and psychotic disorders as sharing one or more of the following: Positive symptoms include – beliefs not based in reality / delusions – hallucinations – sensory experiences of things that do not exist – disorganised thoughts/speech – catatonic behaviour – Negative symptoms such as – loss of speech (alogia) – loss of motivation (avolition) – diminished facial/emotion expression – social/emotional withdrawal Examples – these could include substance or medication-induced psychotic disorder, schizotypical (personality) disorder, schizoaffective disorder, and catatonia associated with another mental disorder or condition. DSM-V – two (or more) symptoms for at least one month. At least one of the symptoms must be delusions, hallucinations or disorganised thoughts/ speech. Case studies could include individuals who have been studied in detail. Schizophrenia and delusional disorder Schizophrenia is diagnosed when individual shows at least two of the following: delusions, hallucinations disorganised speech, disorganised or catatonic behaviour, and flattened affect for at least one month. The individual must show occupational or social functioning that has declined and these symptoms cannot be explained by another medical factor. Delusional disorder is characterised by persistent delusions but whose other behaviours are ‘normal’. There is an absence of the other psychotic symptoms of schizophrenia such as hallucinations, disorganised speech or negative symptoms. Some types of delusional disorder are grandiose (belief that they have a (non-existent) unrecognised high status or great skill), persecutory (being conspired against or pursued by those intending to harm), and erotomaniac (belief someone is in love with them). To receive a diagnosis of delusional disorder symptoms must have been experienced for at least one month and be unrelated to physiological effects of substance use. 2(a) Symptom assessment using VR (Freeman, 2008) Prior to study, participants completed measures on intellectual functioning (Wechsler Abbreviated Scale of Intelligence) and trait paranoia (Green et al. Paranoid Thoughts Scale (GPTS) Part B) followed by numerous measures on factors in cognitive model of paranoia. Simulator-sickness questionnaire was given before and after the simulation. Virtual reality environment was a 4 min journey on a London underground train populated by computer generated ‘neutral’ avatars/characters. The avatars breathed and also looked in a variety of directions. There was background tube noise and low- level snippets of conversation. State social paranoia scale was given after the simulation ended as well as qualitative data collected about the participant’s experiences. 200 nonclinical members of the general population were used who made comments ranging from positive to neutral to paranoid ‘Lady sitting down laughed at me when I walked past’. This shows an unambiguous demonstration of paranoid thinking in the general public. Mark according to the levels of response descriptors in Table A. Other appropriate responses should also be credited. 2(b) Evaluate characteristics and assessment of schizophrenia spectrum 10 and psychotic disorders, including a discussion of validity. A range of issues could be used for evaluation here. These include: • Named issue – validity of definitions/diagnosis – schizophrenia spectrum and psychotic disorders include a variety of different symptoms and no one key symptom is needed for diagnosis. DSM-V and ICD-10 do not ask for the same criteria or longevity of symptoms. Two individuals with very different symptoms could both be diagnosed as schizophrenic. The reliance on self-report measures of a psychotic individual (by definition) may be invalid within a psychotic state. Co- morbidity could also call validity into question in terms of symptom overlap with another condition such as depression. Validity of case studies – this is good because they are in detail and often take place over a long period of time. The validity could be low as not generalisable and the data might be subjective. Validity of Freeman study – Good as a number of measures of were taken to assess level of paranoid thinking, social and cognitive traits and emotional distress to compare the results on the virtual reality to. Also good as rather than just interviewing a patient about their symptoms the practitioner can witness the patient in a lifelike environment. However, the ecological validity of the study is not good as it is a simulated environment. On the other hand, it does give some insight into the behaviour of a schizophrenic patient in a much more realistic setting than just asking the patient to describe their symptoms since the practitioner last had an appointment with them. • Reliability • Usefulness • Reductionist • Co-morbidity • Gender bias • Cultural bias Mark according to the levels of response descriptors in Table B. Other appropriate responses should also be credited. Psychology and consumer behaviour
Q3 · Outline the AIDA model of advertising
3 (a) Outline the AIDA model of advertising. [2] (b) Describe the study by Kohli et al. (2007) on effective slogans. [4] (c) Explain two strengths of the study by Kohli et al. [6]
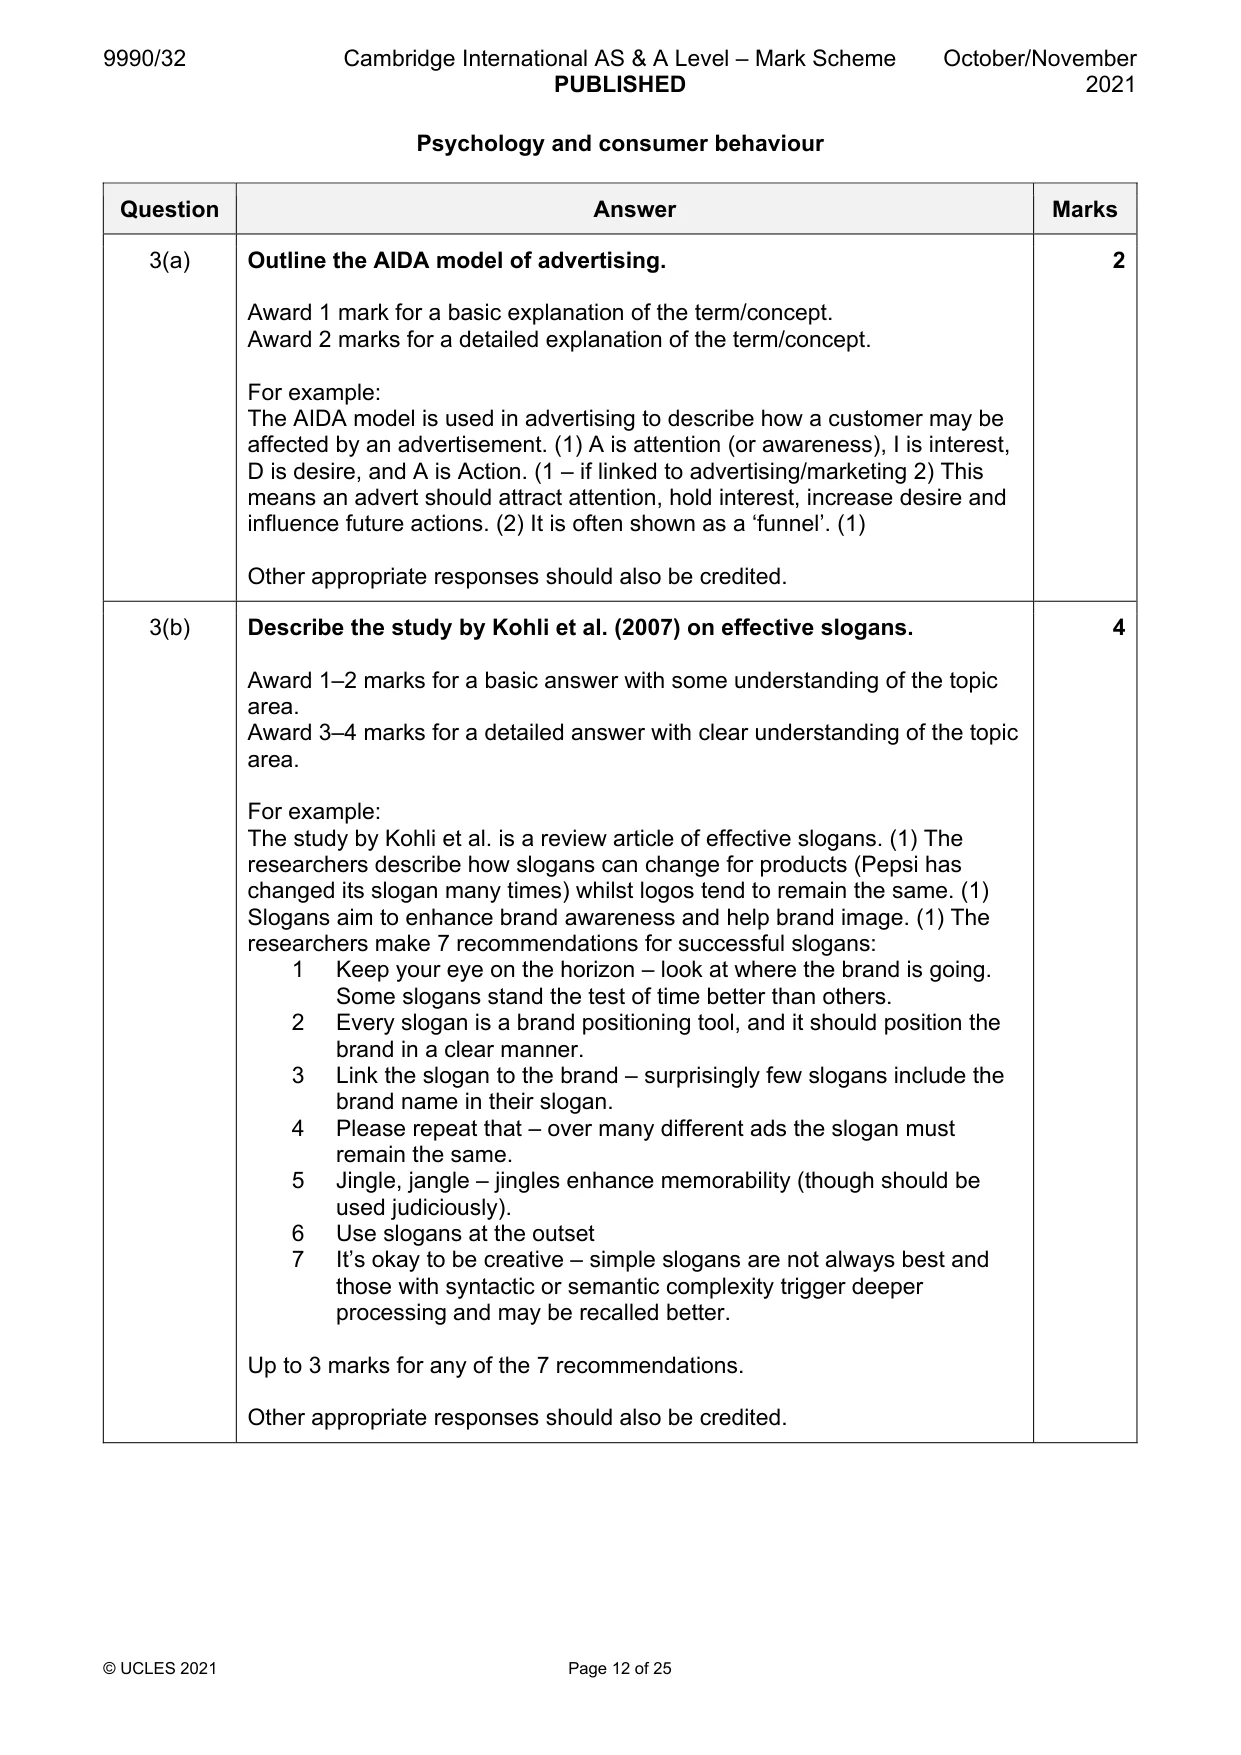
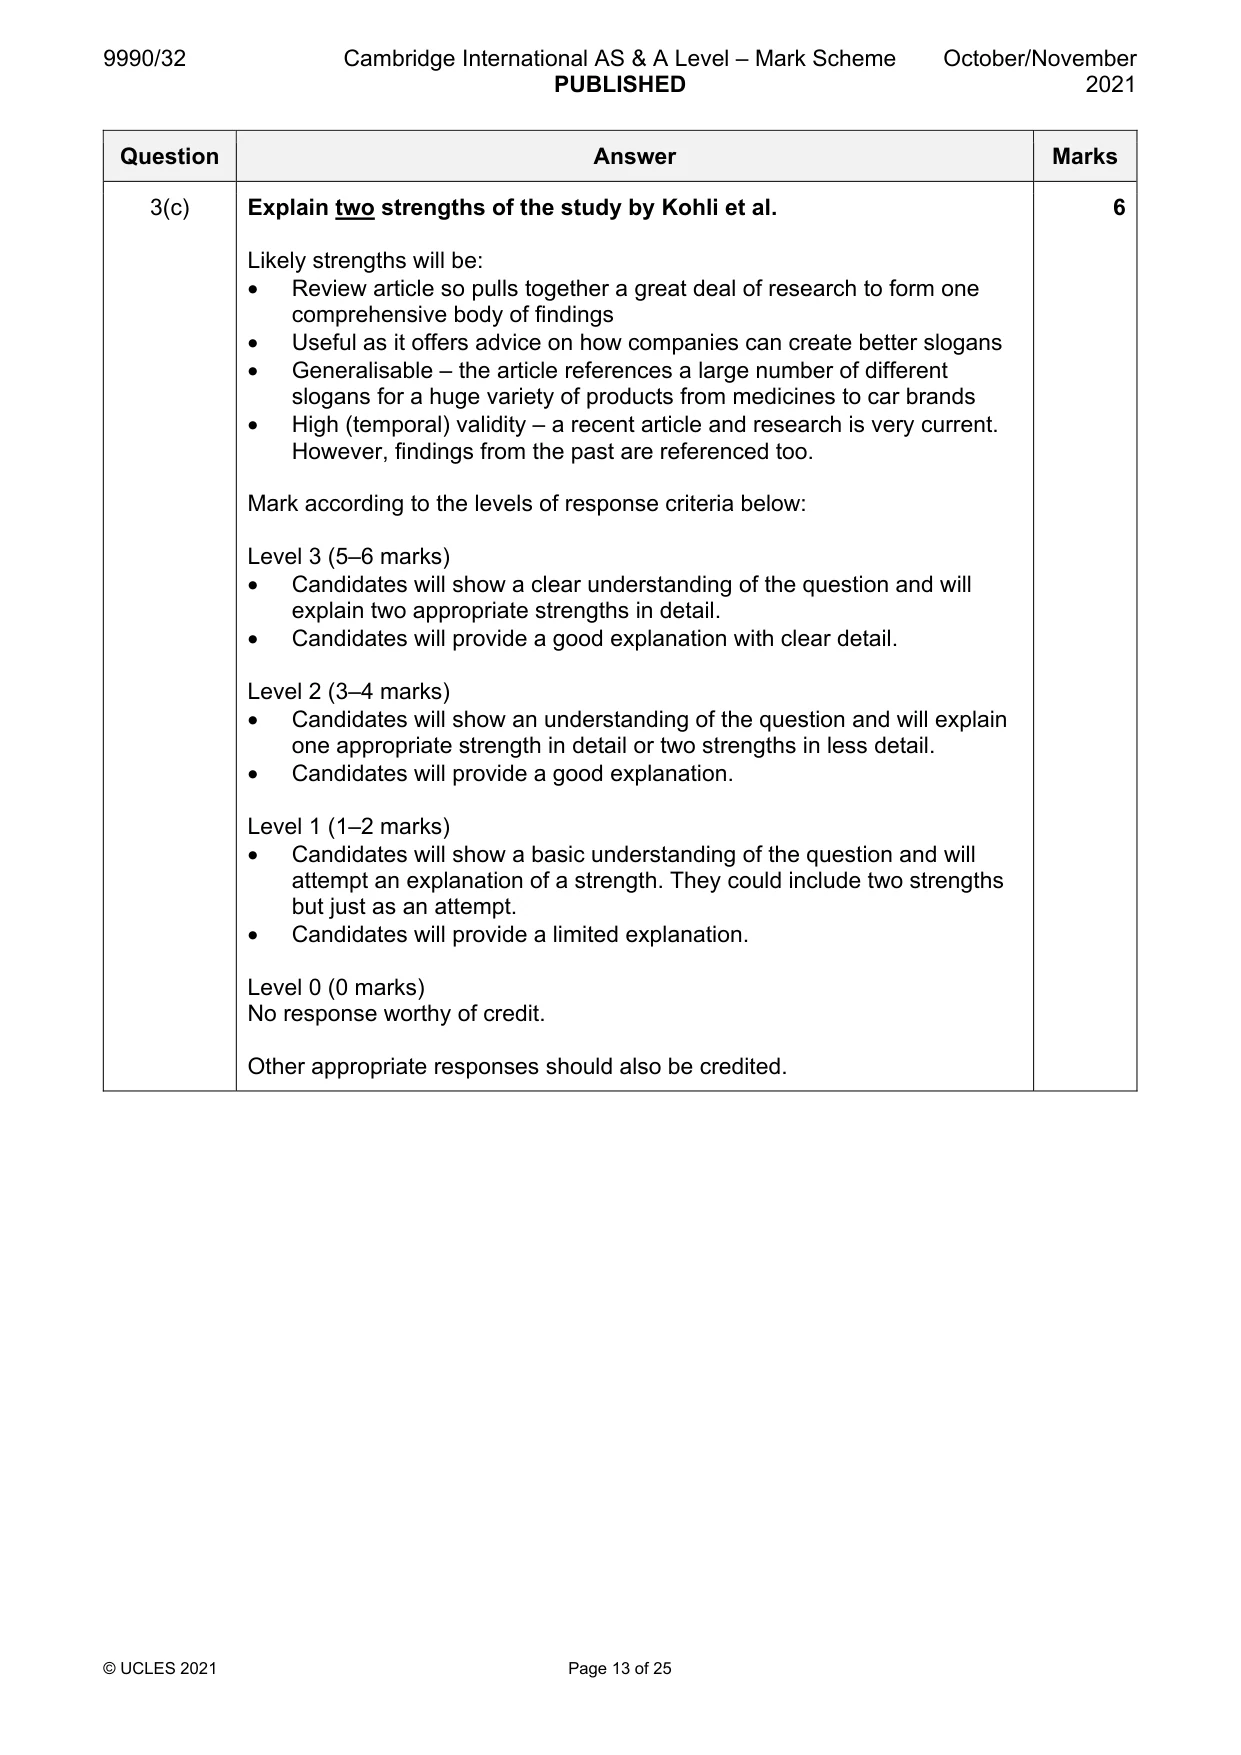
Mark scheme: 3(a) Outline the AIDA model of advertising. 2 Award 1 mark for a basic explanation of the term/concept. Award 2 marks for a detailed explanation of the term/concept. For example: The AIDA model is used in advertising to describe how a customer may be affected by an advertisement. (1) A is attention (or awareness), I is interest, D is desire, and A is Action. (1 – if linked to advertising/marketing 2) This means an advert should attract attention, hold interest, increase desire and influence future actions. (2) It is often shown as a ‘funnel’. (1) Other appropriate responses should also be credited. 3(b) Describe the study by Kohli et al. (2007) on effective slogans. 4 Award 1–2 marks for a basic answer with some understanding of the topic area. Award 3–4 marks for a detailed answer with clear understanding of the topic area. For example: The study by Kohli et al. is a review article of effective slogans. (1) The researchers describe how slogans can change for products (Pepsi has changed its slogan many times) whilst logos tend to remain the same. (1) Slogans aim to enhance brand awareness and help brand image. (1) The researchers make 7 recommendations for successful slogans: 1 Keep your eye on the horizon – look at where the brand is going. Some slogans stand the test of time better than others. 2 Every slogan is a brand positioning tool, and it should position the brand in a clear manner. 3 Link the slogan to the brand – surprisingly few slogans include the brand name in their slogan. 4 Please repeat that – over many different ads the slogan must remain the same. 5 Jingle, jangle – jingles enhance memorability (though should be used judiciously). 6 Use slogans at the outset 7 It’s okay to be creative – simple slogans are not always best and those with syntactic or semantic complexity trigger deeper processing and may be recalled better. Up to 3 marks for any of the 7 recommendations. Other appropriate responses should also be credited. 3(c) Explain two strengths of the study by Kohli et al. 6 Likely strengths will be: • Review article so pulls together a great deal of research to form one comprehensive body of findings • Useful as it offers advice on how companies can create better slogans • Generalisable – the article references a large number of different slogans for a huge variety of products from medicines to car brands • High (temporal) validity – a recent article and research is very current. However, findings from the past are referenced too. Mark according to the levels of response criteria below: Level 3 (5–6 marks) • Candidates will show a clear understanding of the question and will explain two appropriate strengths in detail. • Candidates will provide a good explanation with clear detail. Level 2 (3–4 marks) • Candidates will show an understanding of the question and will explain one appropriate strength in detail or two strengths in less detail. • Candidates will provide a good explanation. Level 1 (1–2 marks) • Candidates will show a basic understanding of the question and will attempt an explanation of a strength. They could include two strengths but just as an attempt. • Candidates will provide a limited explanation. Level 0 (0 marks) No response worthy of credit. Other appropriate responses should also be credited.
Q4 · Describe what psychologists have discovered about packaging, positioning and placement of…
4 (a) Describe what psychologists have discovered about packaging, positioning and placement of the product (gift-wrapping, product colour and associative learning, attention and shelf position). [8] (b) Evaluate what psychologists have discovered about packaging, positioning and placement of the product (gift-wrapping, product colour and associative learning, attention and shelf position), including a discussion of self-reports. [10] Psychology and health Answer all questions.
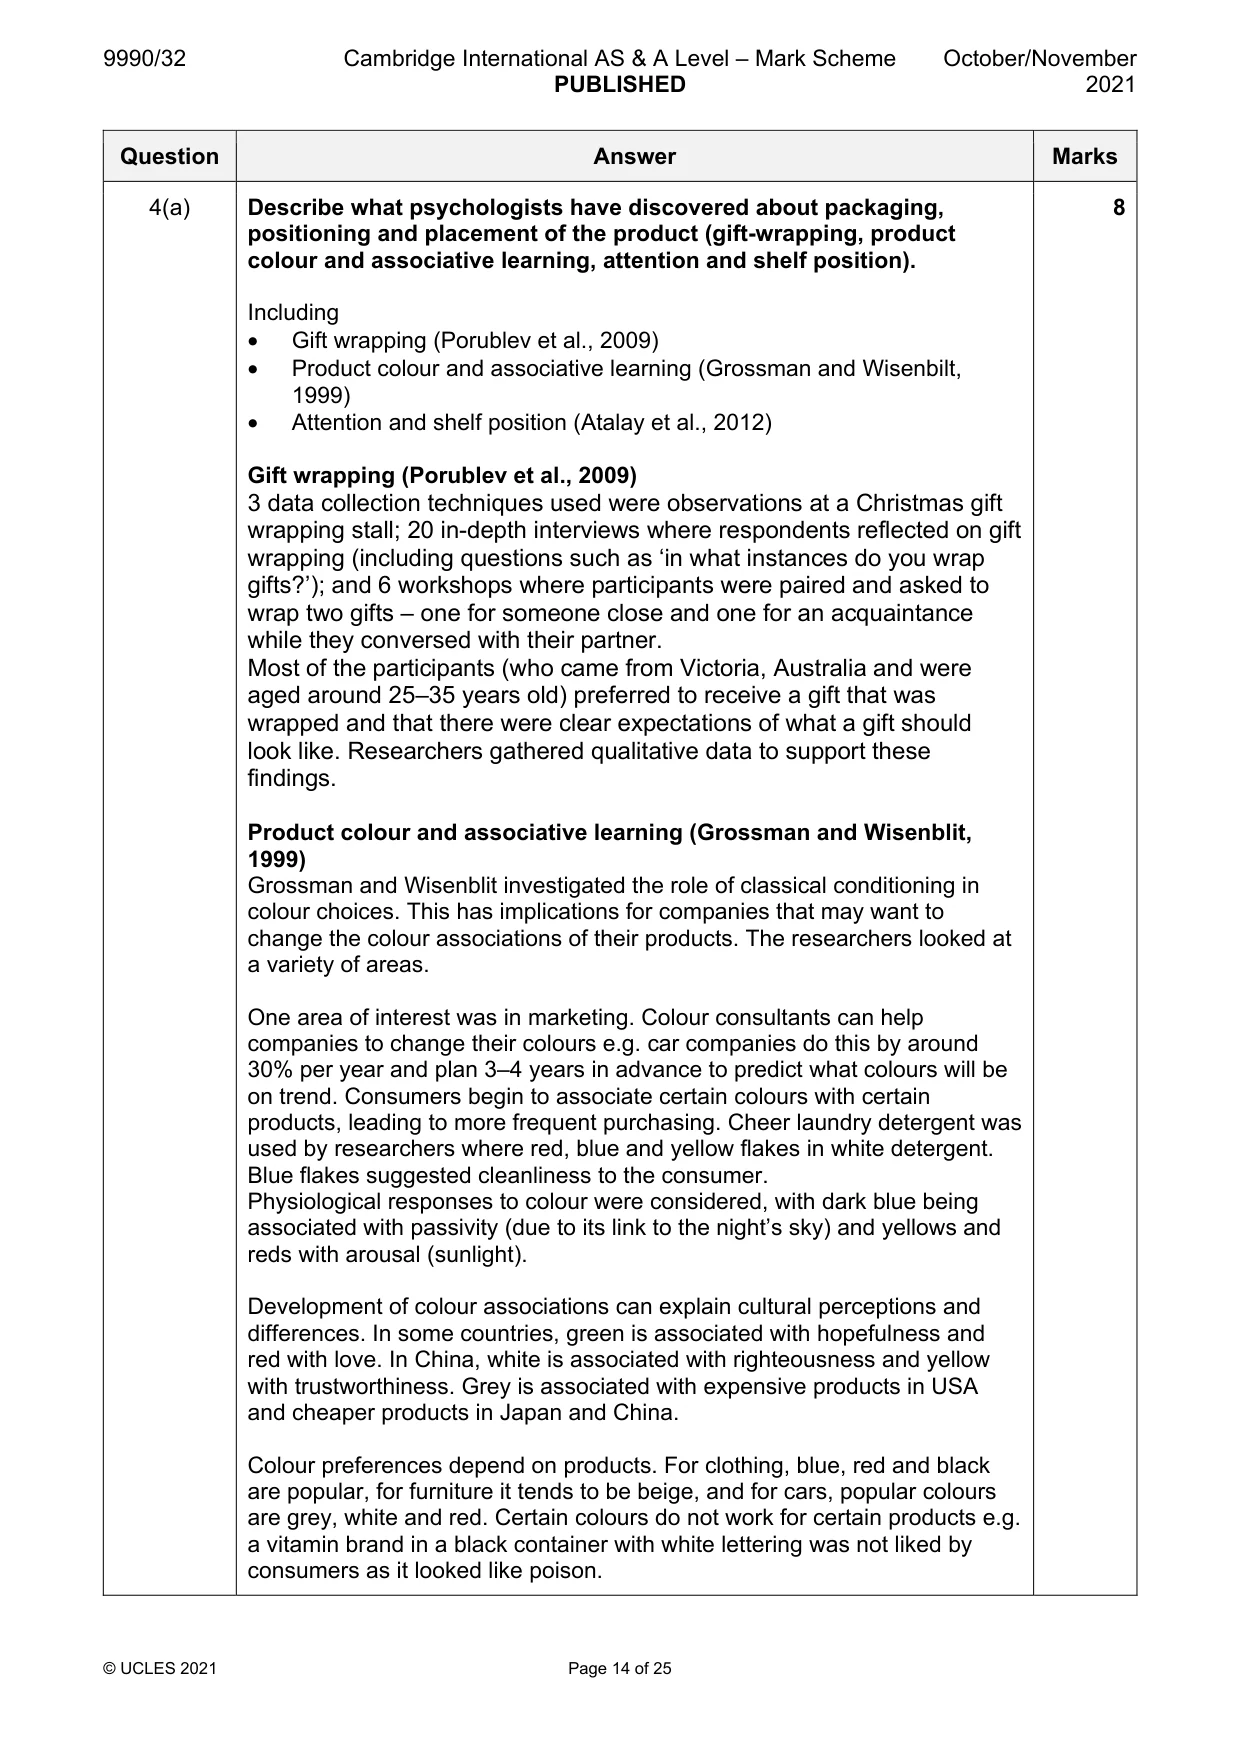
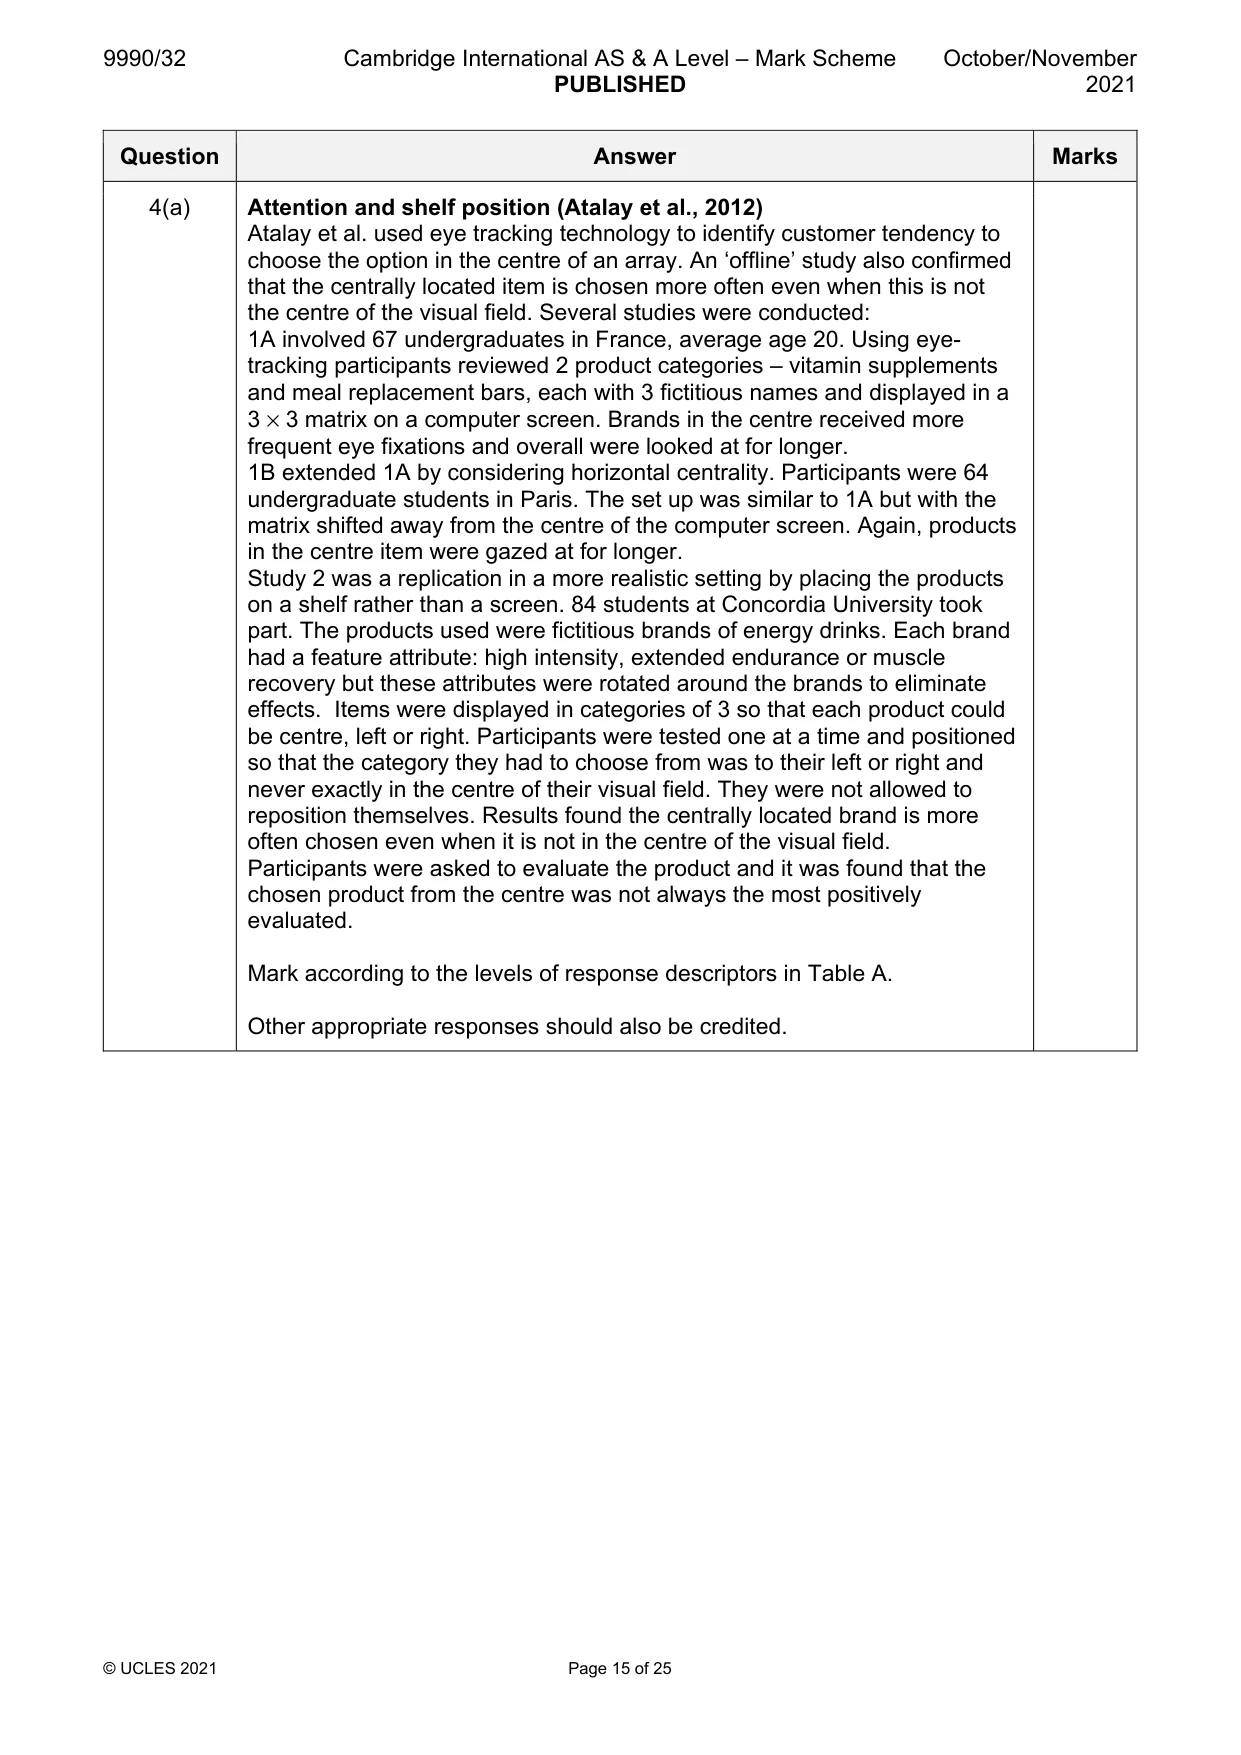
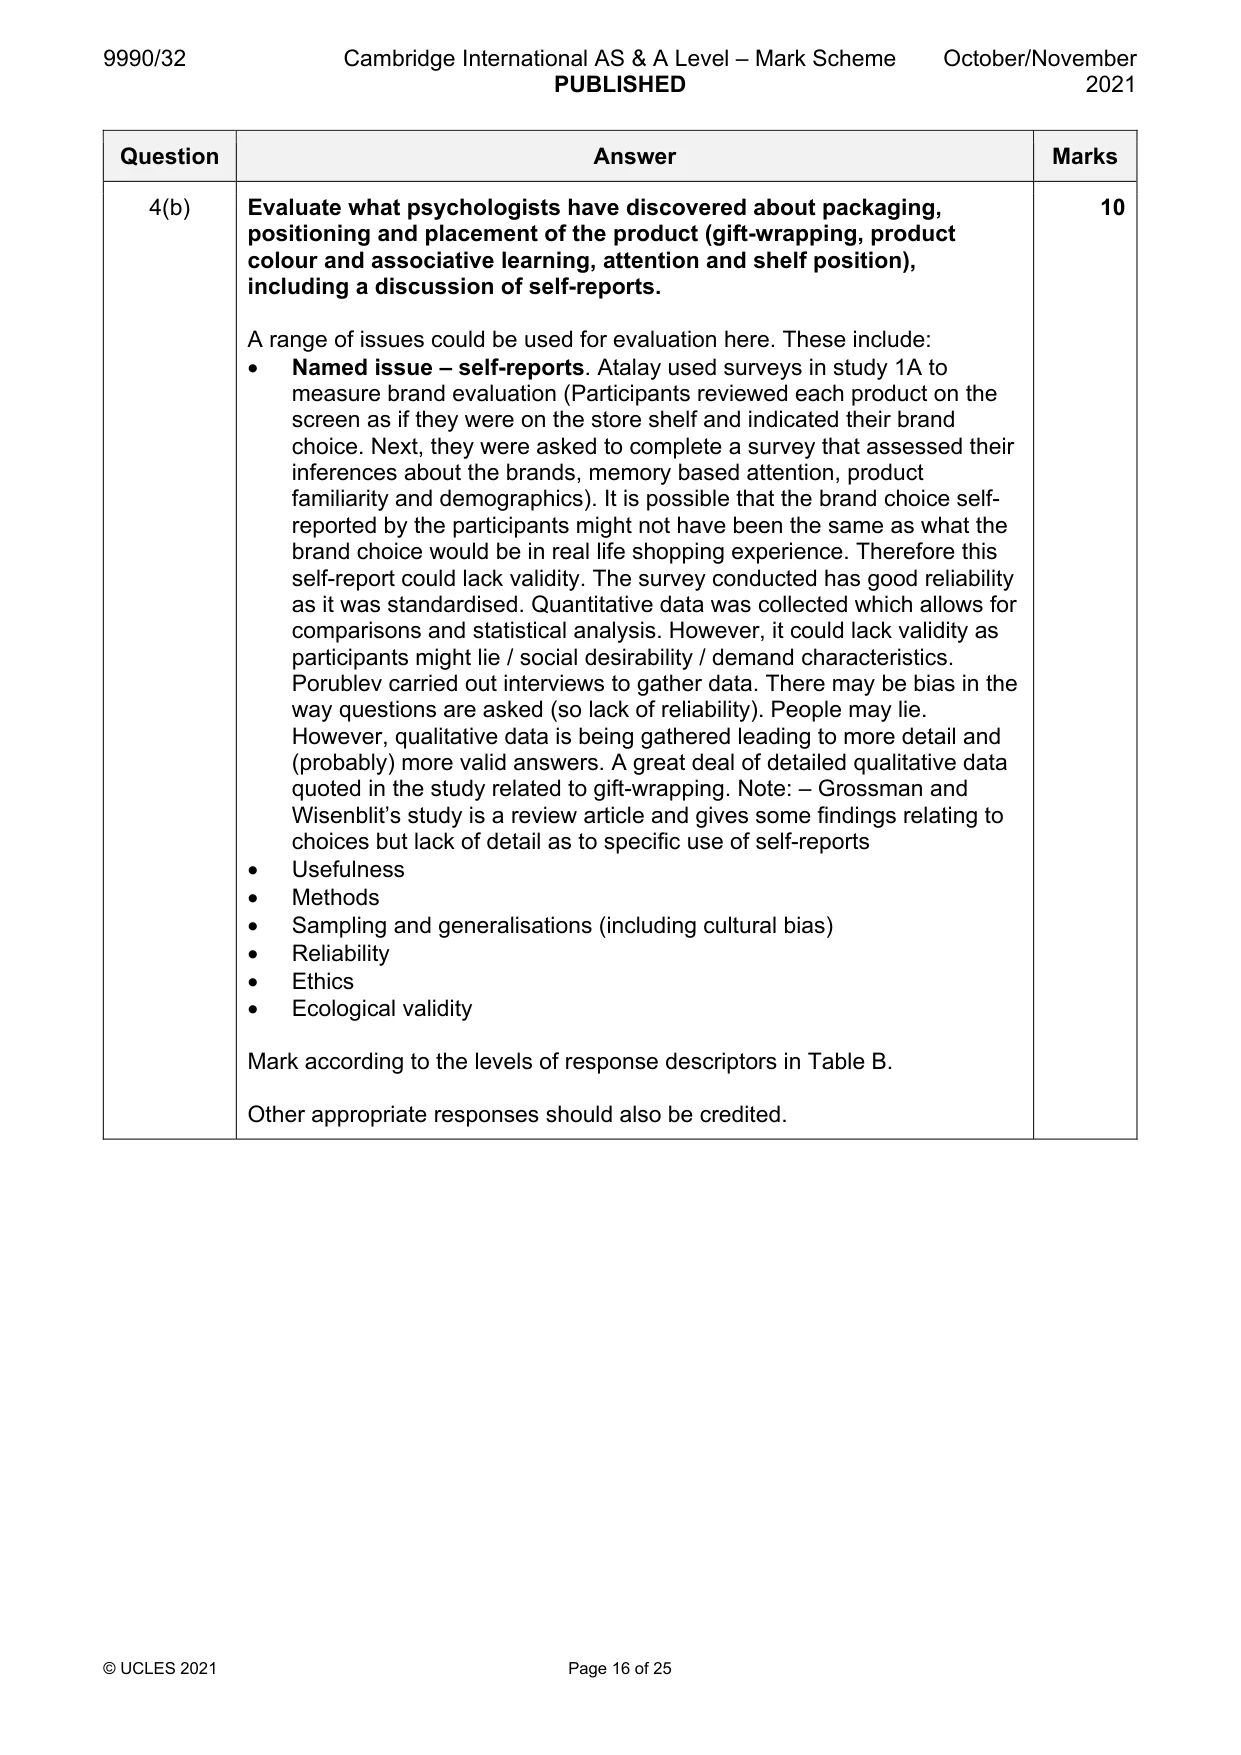
Mark scheme: 4(a) Describe what psychologists have discovered about packaging, 8 positioning and placement of the product (gift-wrapping, product colour and associative learning, attention and shelf position). Including • Gift wrapping (Porublev et al., 2009) • Product colour and associative learning (Grossman and Wisenbilt, 1999) • Attention and shelf position (Atalay et al., 2012) Gift wrapping (Porublev et al., 2009) 3 data collection techniques used were observations at a Christmas gift wrapping stall; 20 in-depth interviews where respondents reflected on gift wrapping (including questions such as ‘in what instances do you wrap gifts?’); and 6 workshops where participants were paired and asked to wrap two gifts – one for someone close and one for an acquaintance while they conversed with their partner. Most of the participants (who came from Victoria, Australia and were aged around 25–35 years old) preferred to receive a gift that was wrapped and that there were clear expectations of what a gift should look like. Researchers gathered qualitative data to support these findings. Product colour and associative learning (Grossman and Wisenblit, 1999) Grossman and Wisenblit investigated the role of classical conditioning in colour choices. This has implications for companies that may want to change the colour associations of their products. The researchers looked at a variety of areas. One area of interest was in marketing. Colour consultants can help companies to change their colours e.g. car companies do this by around 30% per year and plan 3–4 years in advance to predict what colours will be on trend. Consumers begin to associate certain colours with certain products, leading to more frequent purchasing. Cheer laundry detergent was used by researchers where red, blue and yellow flakes in white detergent. Blue flakes suggested cleanliness to the consumer. Physiological responses to colour were considered, with dark blue being associated with passivity (due to its link to the night’s sky) and yellows and reds with arousal (sunlight). Development of colour associations can explain cultural perceptions and differences. In some countries, green is associated with hopefulness and red with love. In China, white is associated with righteousness and yellow with trustworthiness. Grey is associated with expensive products in USA and cheaper products in Japan and China. Colour preferences depend on products. For clothing, blue, red and black are popular, for furniture it tends to be beige, and for cars, popular colours are grey, white and red. Certain colours do not work for certain products e.g. a vitamin brand in a black container with white lettering was not liked by consumers as it looked like poison. 4(a) Attention and shelf position (Atalay et al., 2012) Atalay et al. used eye tracking technology to identify customer tendency to choose the option in the centre of an array. An ‘offline’ study also confirmed that the centrally located item is chosen more often even when this is not the centre of the visual field. Several studies were conducted: 1A involved 67 undergraduates in France, average age 20. Using eye- tracking participants reviewed 2 product categories – vitamin supplements and meal replacement bars, each with 3 fictitious names and displayed in a 3 × 3 matrix on a computer screen. Brands in the centre received more frequent eye fixations and overall were looked at for longer. 1B extended 1A by considering horizontal centrality. Participants were 64 undergraduate students in Paris. The set up was similar to 1A but with the matrix shifted away from the centre of the computer screen. Again, products in the centre item were gazed at for longer. Study 2 was a replication in a more realistic setting by placing the products on a shelf rather than a screen. 84 students at Concordia University took part. The products used were fictitious brands of energy drinks. Each brand had a feature attribute: high intensity, extended endurance or muscle recovery but these attributes were rotated around the brands to eliminate effects. Items were displayed in categories of 3 so that each product could be centre, left or right. Participants were tested one at a time and positioned so that the category they had to choose from was to their left or right and never exactly in the centre of their visual field. They were not allowed to reposition themselves. Results found the centrally located brand is more often chosen even when it is not in the centre of the visual field. Participants were asked to evaluate the product and it was found that the chosen product from the centre was not always the most positively evaluated. Mark according to the levels of response descriptors in Table A. Other appropriate responses should also be credited. 4(b) Evaluate what psychologists have discovered about packaging, 10 positioning and placement of the product (gift-wrapping, product colour and associative learning, attention and shelf position), including a discussion of self-reports. A range of issues could be used for evaluation here. These include: • Named issue – self-reports. Atalay used surveys in study 1A to measure brand evaluation (Participants reviewed each product on the screen as if they were on the store shelf and indicated their brand choice. Next, they were asked to complete a survey that assessed their inferences about the brands, memory based attention, product familiarity and demographics). It is possible that the brand choice self- reported by the participants might not have been the same as what the brand choice would be in real life shopping experience. Therefore this self-report could lack validity. The survey conducted has good reliability as it was standardised. Quantitative data was collected which allows for comparisons and statistical analysis. However, it could lack validity as participants might lie / social desirability / demand characteristics. Porublev carried out interviews to gather data. There may be bias in the way questions are asked (so lack of reliability). People may lie. However, qualitative data is being gathered leading to more detail and (probably) more valid answers. A great deal of detailed qualitative data quoted in the study related to gift-wrapping. Note: – Grossman and Wisenblit’s study is a review article and gives some findings relating to choices but lack of detail as to specific use of self-reports • Usefulness • Methods • Sampling and generalisations (including cultural bias) • Reliability • Ethics • Ecological validity Mark according to the levels of response descriptors in Table B. Other appropriate responses should also be credited. Psychology and health
Q5 · Outline one symptom of Munchausen syndrome
5 (a) Outline one symptom of Munchausen syndrome. [2] (b) Describe the findings of the study by McKinstry and Wang (1991) of non-verbal communications in the patient–practitioner relationship. [4] (c) Explain two weaknesses of the study by McKinstry and Wang. [6]
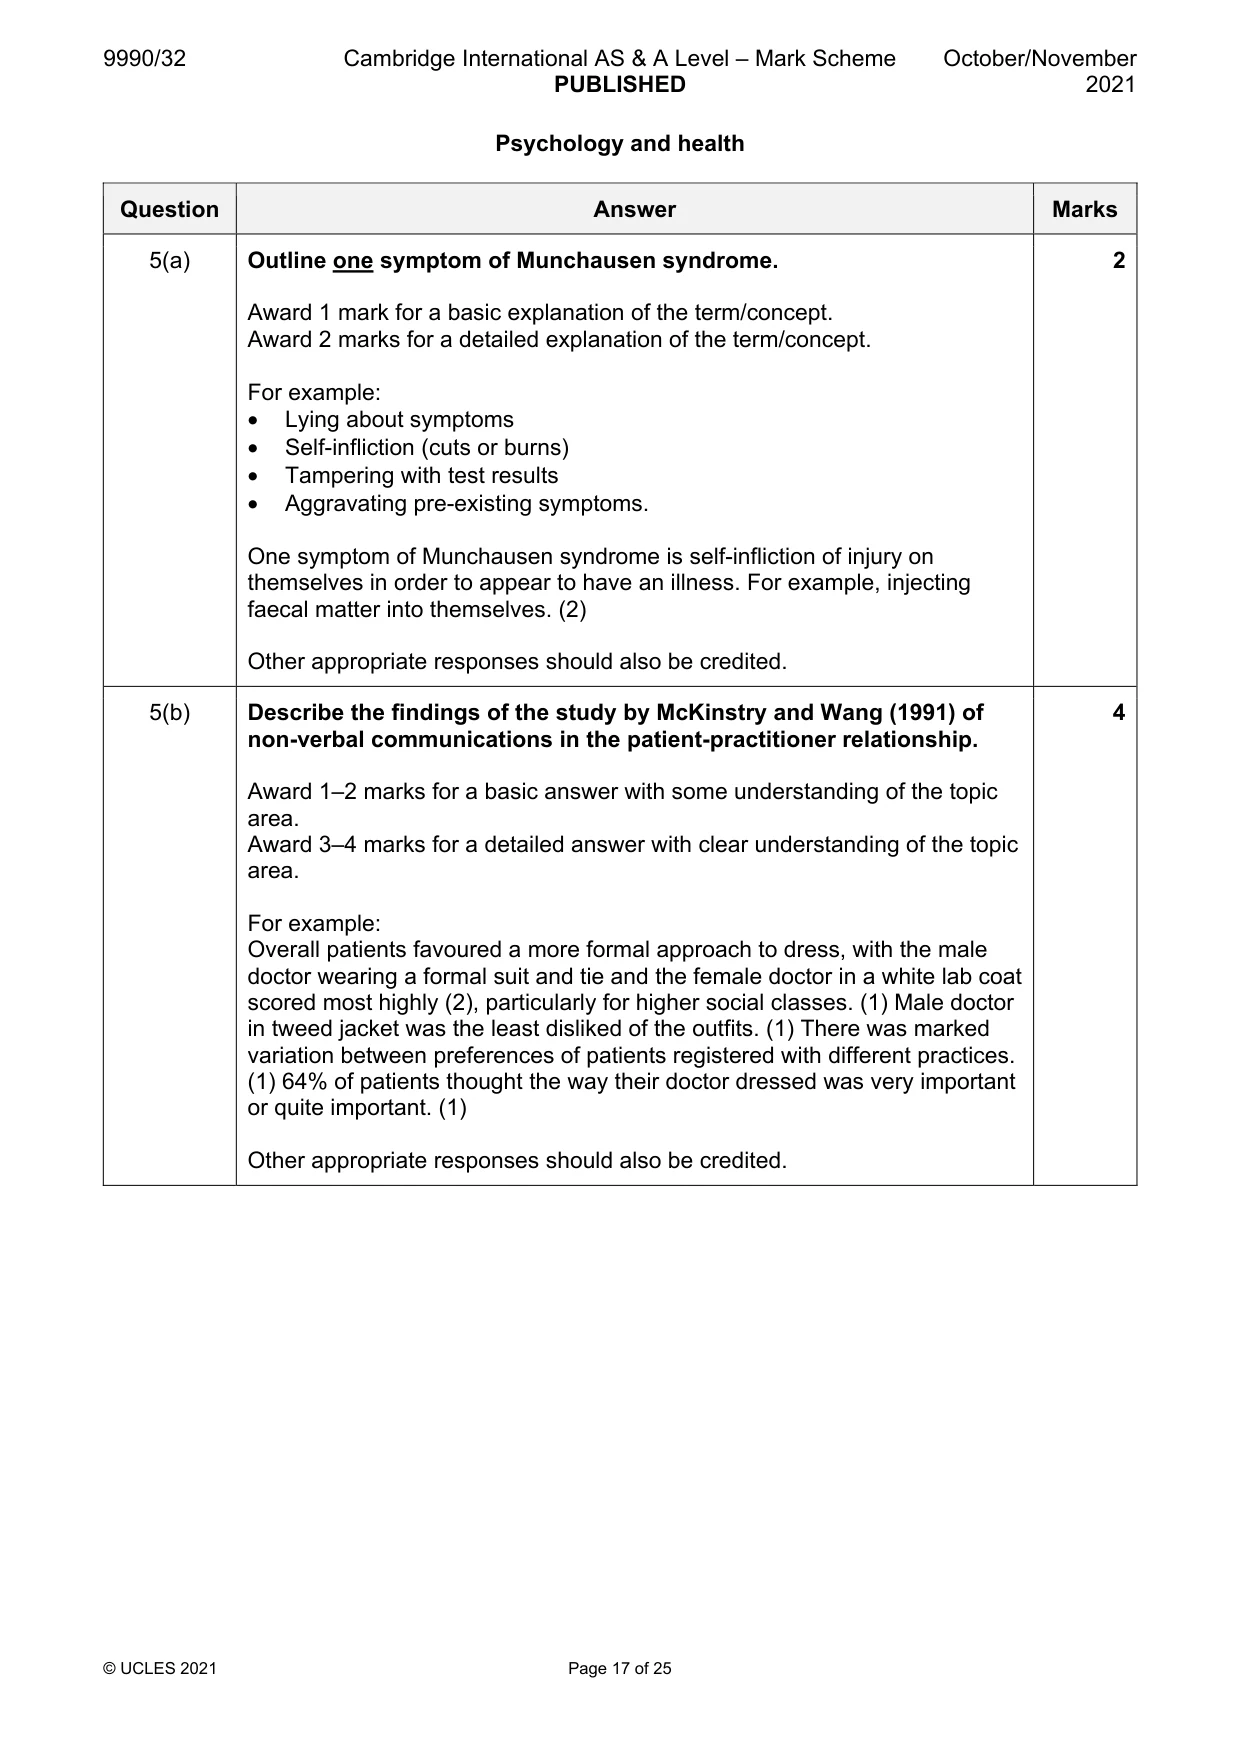
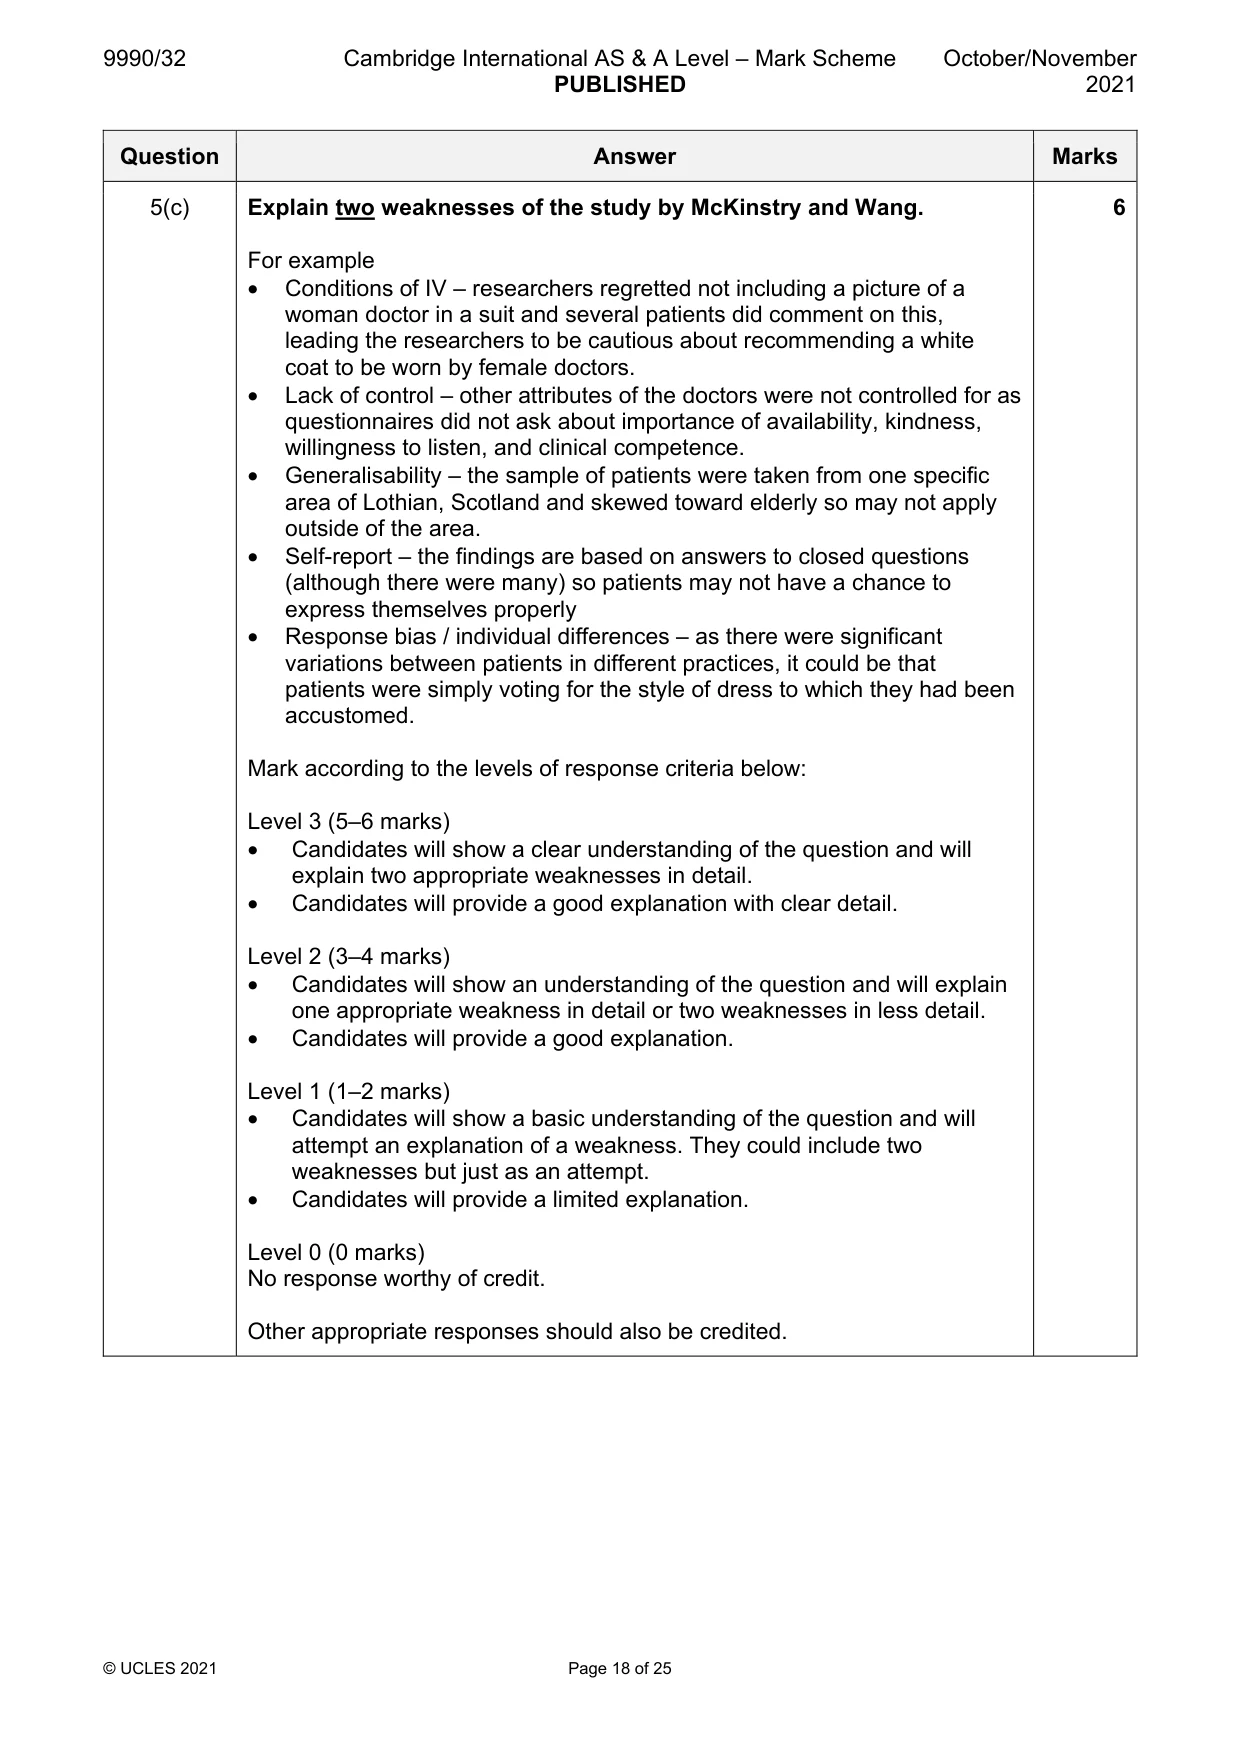
Mark scheme: 5(a) Outline one symptom of Munchausen syndrome. 2 Award 1 mark for a basic explanation of the term/concept. Award 2 marks for a detailed explanation of the term/concept. For example: • Lying about symptoms • Self-infliction (cuts or burns) • Tampering with test results • Aggravating pre-existing symptoms. One symptom of Munchausen syndrome is self-infliction of injury on themselves in order to appear to have an illness. For example, injecting faecal matter into themselves. (2) Other appropriate responses should also be credited. 5(b) Describe the findings of the study by McKinstry and Wang (1991) of 4 non-verbal communications in the patient-practitioner relationship. Award 1–2 marks for a basic answer with some understanding of the topic area. Award 3–4 marks for a detailed answer with clear understanding of the topic area. For example: Overall patients favoured a more formal approach to dress, with the male doctor wearing a formal suit and tie and the female doctor in a white lab coat scored most highly (2), particularly for higher social classes. (1) Male doctor in tweed jacket was the least disliked of the outfits. (1) There was marked variation between preferences of patients registered with different practices. (1) 64% of patients thought the way their doctor dressed was very important or quite important. (1) Other appropriate responses should also be credited. 5(c) Explain two weaknesses of the study by McKinstry and Wang. 6 For example • Conditions of IV – researchers regretted not including a picture of a woman doctor in a suit and several patients did comment on this, leading the researchers to be cautious about recommending a white coat to be worn by female doctors. • Lack of control – other attributes of the doctors were not controlled for as questionnaires did not ask about importance of availability, kindness, willingness to listen, and clinical competence. • Generalisability – the sample of patients were taken from one specific area of Lothian, Scotland and skewed toward elderly so may not apply outside of the area. • Self-report – the findings are based on answers to closed questions (although there were many) so patients may not have a chance to express themselves properly • Response bias / individual differences – as there were significant variations between patients in different practices, it could be that patients were simply voting for the style of dress to which they had been accustomed. Mark according to the levels of response criteria below: Level 3 (5–6 marks) • Candidates will show a clear understanding of the question and will explain two appropriate weaknesses in detail. • Candidates will provide a good explanation with clear detail. Level 2 (3–4 marks) • Candidates will show an understanding of the question and will explain one appropriate weakness in detail or two weaknesses in less detail. • Candidates will provide a good explanation. Level 1 (1–2 marks) • Candidates will show a basic understanding of the question and will attempt an explanation of a weakness. They could include two weaknesses but just as an attempt. • Candidates will provide a limited explanation. Level 0 (0 marks) No response worthy of credit. Other appropriate responses should also be credited.
Q6 · Describe what psychologists have discovered about improving adherence to medical advice
6 (a) Describe what psychologists have discovered about improving adherence to medical advice. [8] (b) Evaluate what psychologists have discovered about improving adherence to medical advice, including a discussion of experiments. [10] Psychology and organisations Answer all questions.
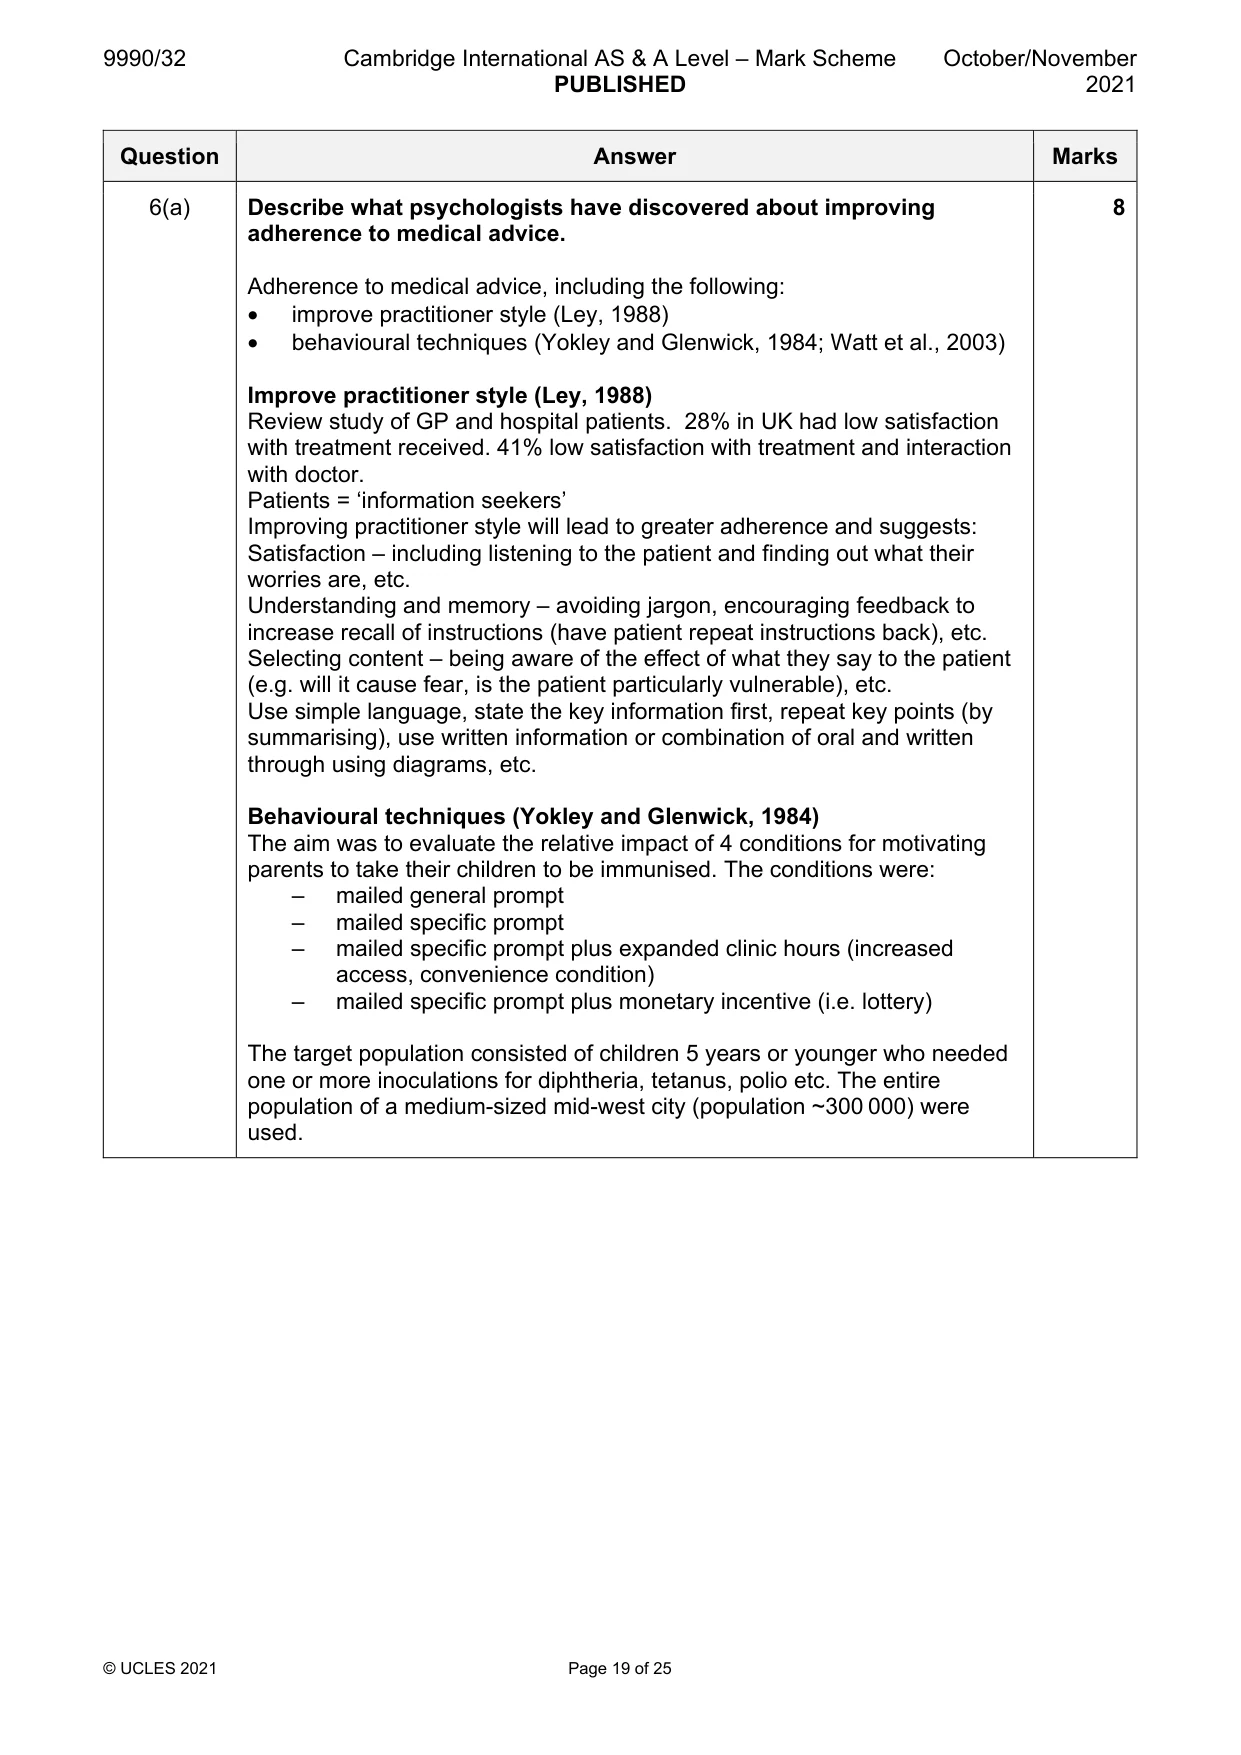
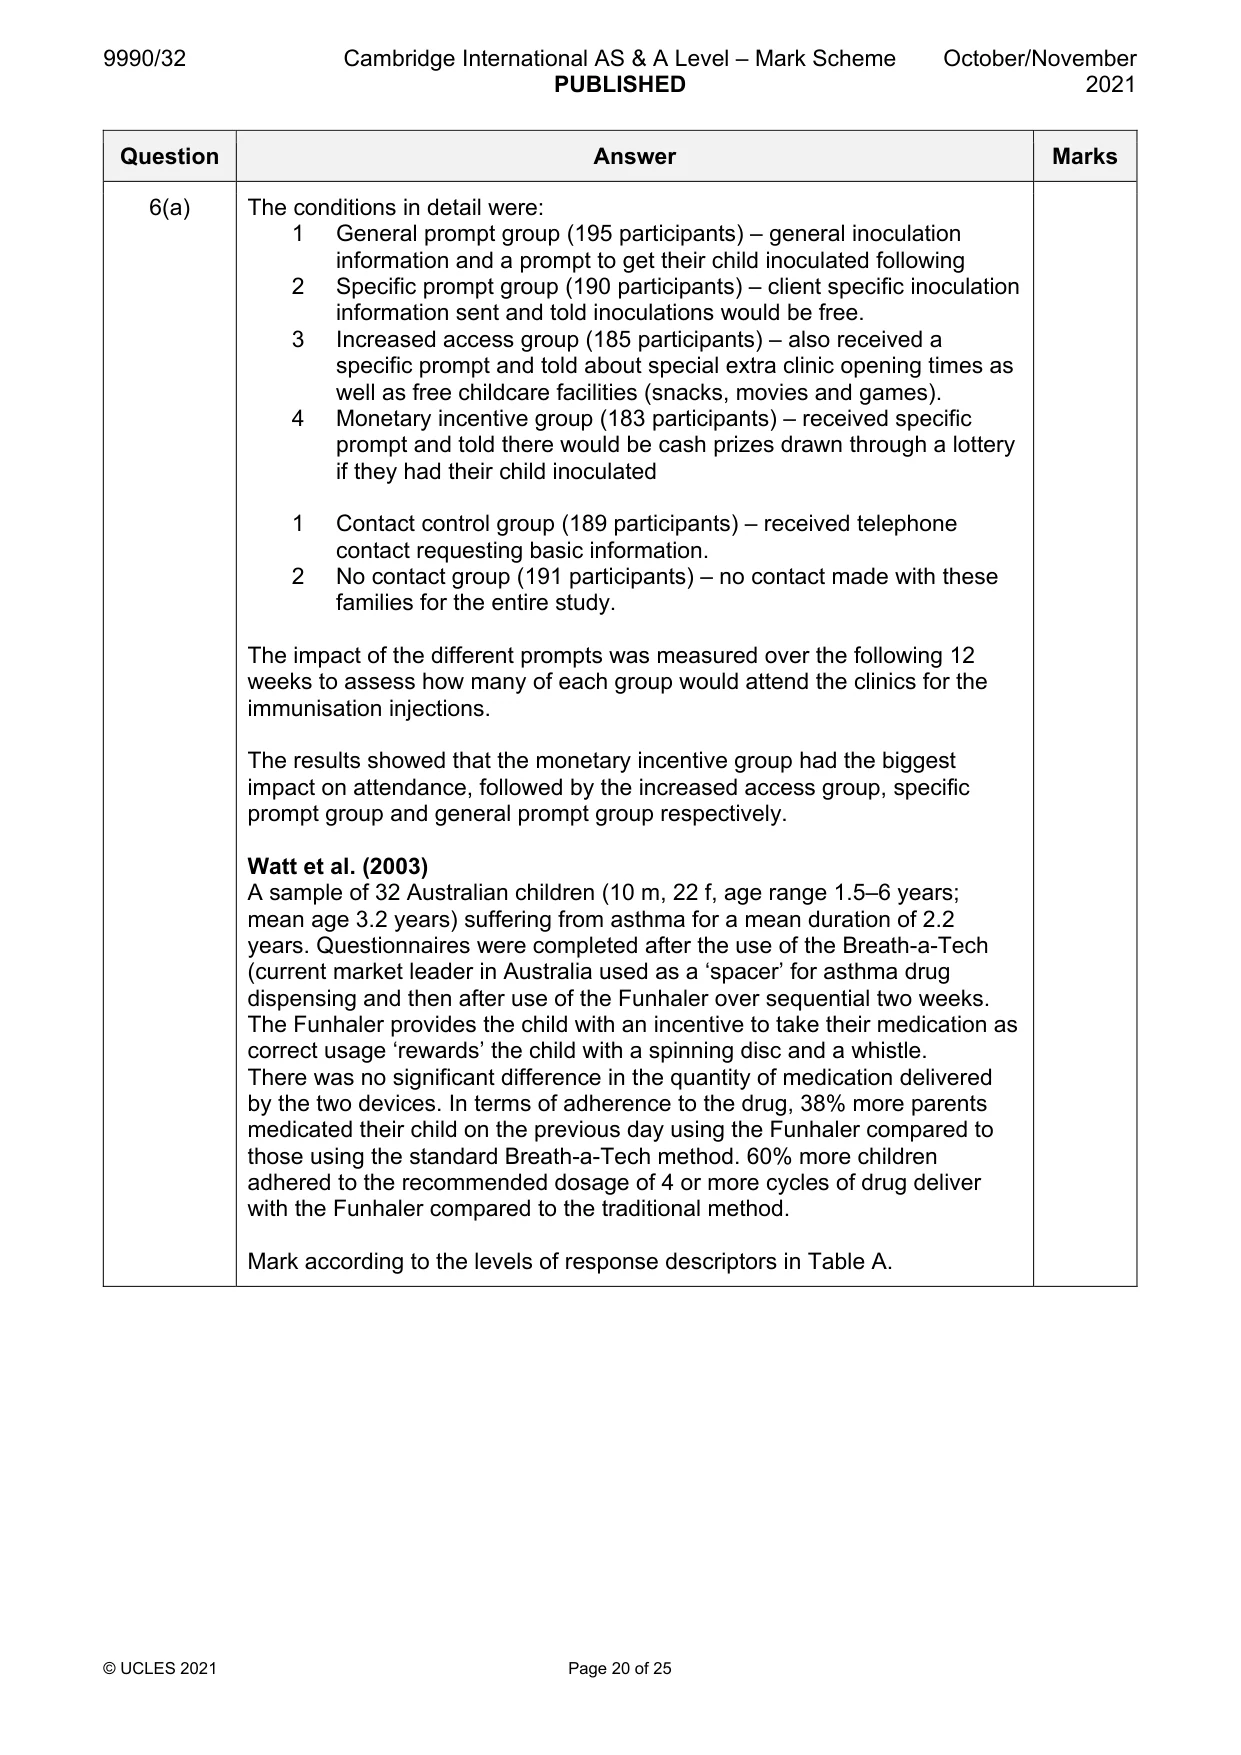
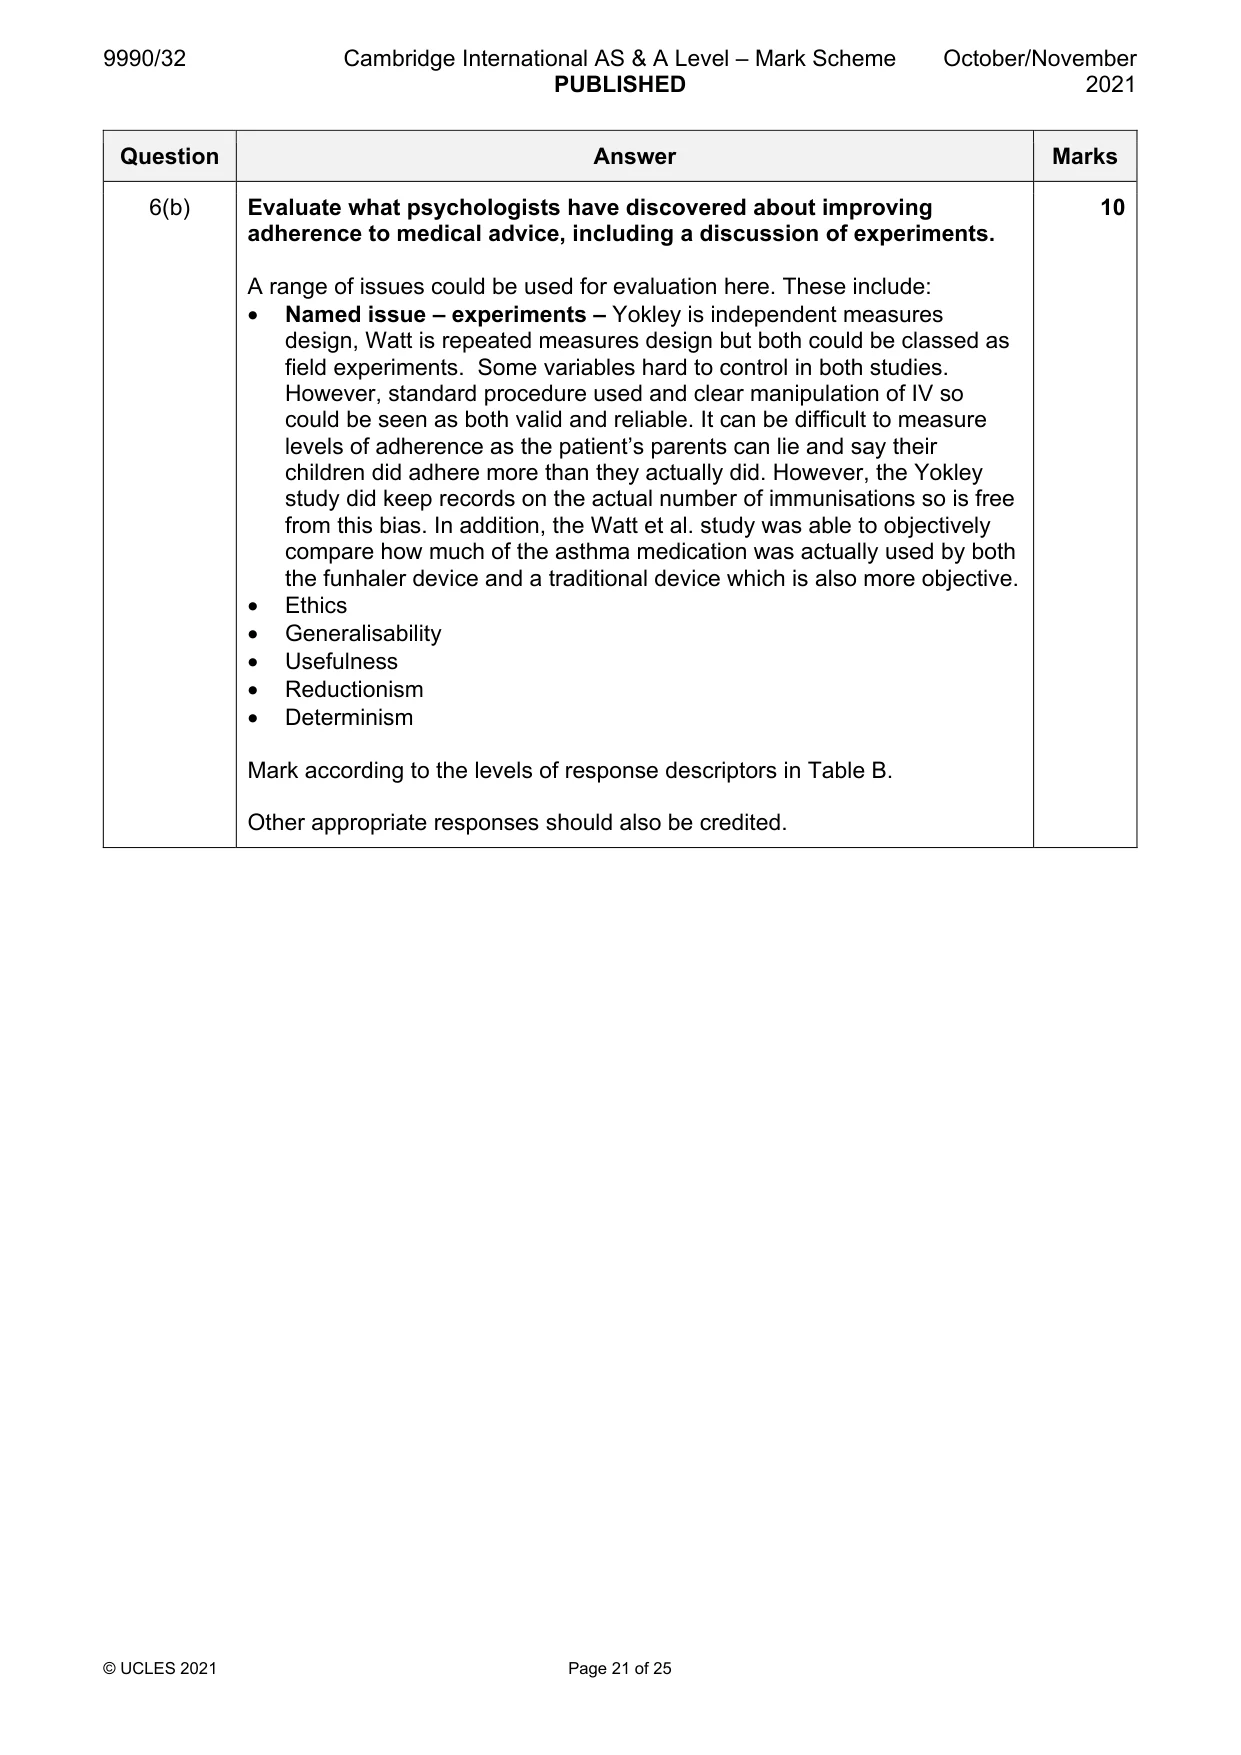
Mark scheme: 6(a) Describe what psychologists have discovered about improving 8 adherence to medical advice. Adherence to medical advice, including the following: • improve practitioner style (Ley, 1988) • behavioural techniques (Yokley and Glenwick, 1984; Watt et al., 2003) Improve practitioner style (Ley, 1988) Review study of GP and hospital patients. 28% in UK had low satisfaction with treatment received. 41% low satisfaction with treatment and interaction with doctor. Patients = ‘information seekers’ Improving practitioner style will lead to greater adherence and suggests: Satisfaction – including listening to the patient and finding out what their worries are, etc. Understanding and memory – avoiding jargon, encouraging feedback to increase recall of instructions (have patient repeat instructions back), etc. Selecting content – being aware of the effect of what they say to the patient (e.g. will it cause fear, is the patient particularly vulnerable), etc. Use simple language, state the key information first, repeat key points (by summarising), use written information or combination of oral and written through using diagrams, etc. Behavioural techniques (Yokley and Glenwick, 1984) The aim was to evaluate the relative impact of 4 conditions for motivating parents to take their children to be immunised. The conditions were: – mailed general prompt – mailed specific prompt – mailed specific prompt plus expanded clinic hours (increased access, convenience condition) – mailed specific prompt plus monetary incentive (i.e. lottery) The target population consisted of children 5 years or younger who needed one or more inoculations for diphtheria, tetanus, polio etc. The entire population of a medium-sized mid-west city (population ~300 000) were used. 6(a) The conditions in detail were: 1 General prompt group (195 participants) – general inoculation information and a prompt to get their child inoculated following 2 Specific prompt group (190 participants) – client specific inoculation information sent and told inoculations would be free. 3 Increased access group (185 participants) – also received a specific prompt and told about special extra clinic opening times as well as free childcare facilities (snacks, movies and games). 4 Monetary incentive group (183 participants) – received specific prompt and told there would be cash prizes drawn through a lottery if they had their child inoculated 1 Contact control group (189 participants) – received telephone contact requesting basic information. 2 No contact group (191 participants) – no contact made with these families for the entire study. The impact of the different prompts was measured over the following 12 weeks to assess how many of each group would attend the clinics for the immunisation injections. The results showed that the monetary incentive group had the biggest impact on attendance, followed by the increased access group, specific prompt group and general prompt group respectively. Watt et al. (2003) A sample of 32 Australian children (10 m, 22 f, age range 1.5–6 years; mean age 3.2 years) suffering from asthma for a mean duration of 2.2 years. Questionnaires were completed after the use of the Breath-a-Tech (current market leader in Australia used as a ‘spacer’ for asthma drug dispensing and then after use of the Funhaler over sequential two weeks. The Funhaler provides the child with an incentive to take their medication as correct usage ‘rewards’ the child with a spinning disc and a whistle. There was no significant difference in the quantity of medication delivered by the two devices. In terms of adherence to the drug, 38% more parents medicated their child on the previous day using the Funhaler compared to those using the standard Breath-a-Tech method. 60% more children adhered to the recommended dosage of 4 or more cycles of drug deliver with the Funhaler compared to the traditional method. Mark according to the levels of response descriptors in Table A. 6(b) Evaluate what psychologists have discovered about improving 10 adherence to medical advice, including a discussion of experiments. A range of issues could be used for evaluation here. These include: • Named issue – experiments – Yokley is independent measures design, Watt is repeated measures design but both could be classed as field experiments. Some variables hard to control in both studies. However, standard procedure used and clear manipulation of IV so could be seen as both valid and reliable. It can be difficult to measure levels of adherence as the patient’s parents can lie and say their children did adhere more than they actually did. However, the Yokley study did keep records on the actual number of immunisations so is free from this bias. In addition, the Watt et al. study was able to objectively compare how much of the asthma medication was actually used by both the funhaler device and a traditional device which is also more objective. • Ethics • Generalisability • Usefulness • Reductionism • Determinism Mark according to the levels of response descriptors in Table B. Other appropriate responses should also be credited. Psychology and organisations
Q7 · Outline the two factor theory of job satisfaction (Herzberg, 1959)
7 (a) Outline the two factor theory of job satisfaction (Herzberg, 1959). [2] (b) Describe the job descriptive index (JDI) developed by Smith et al. (1969). [4] (c) Explain one similarity and one difference between the JDI and the quality of working life (QWL) questionnaire (Walton, 1974). [6]
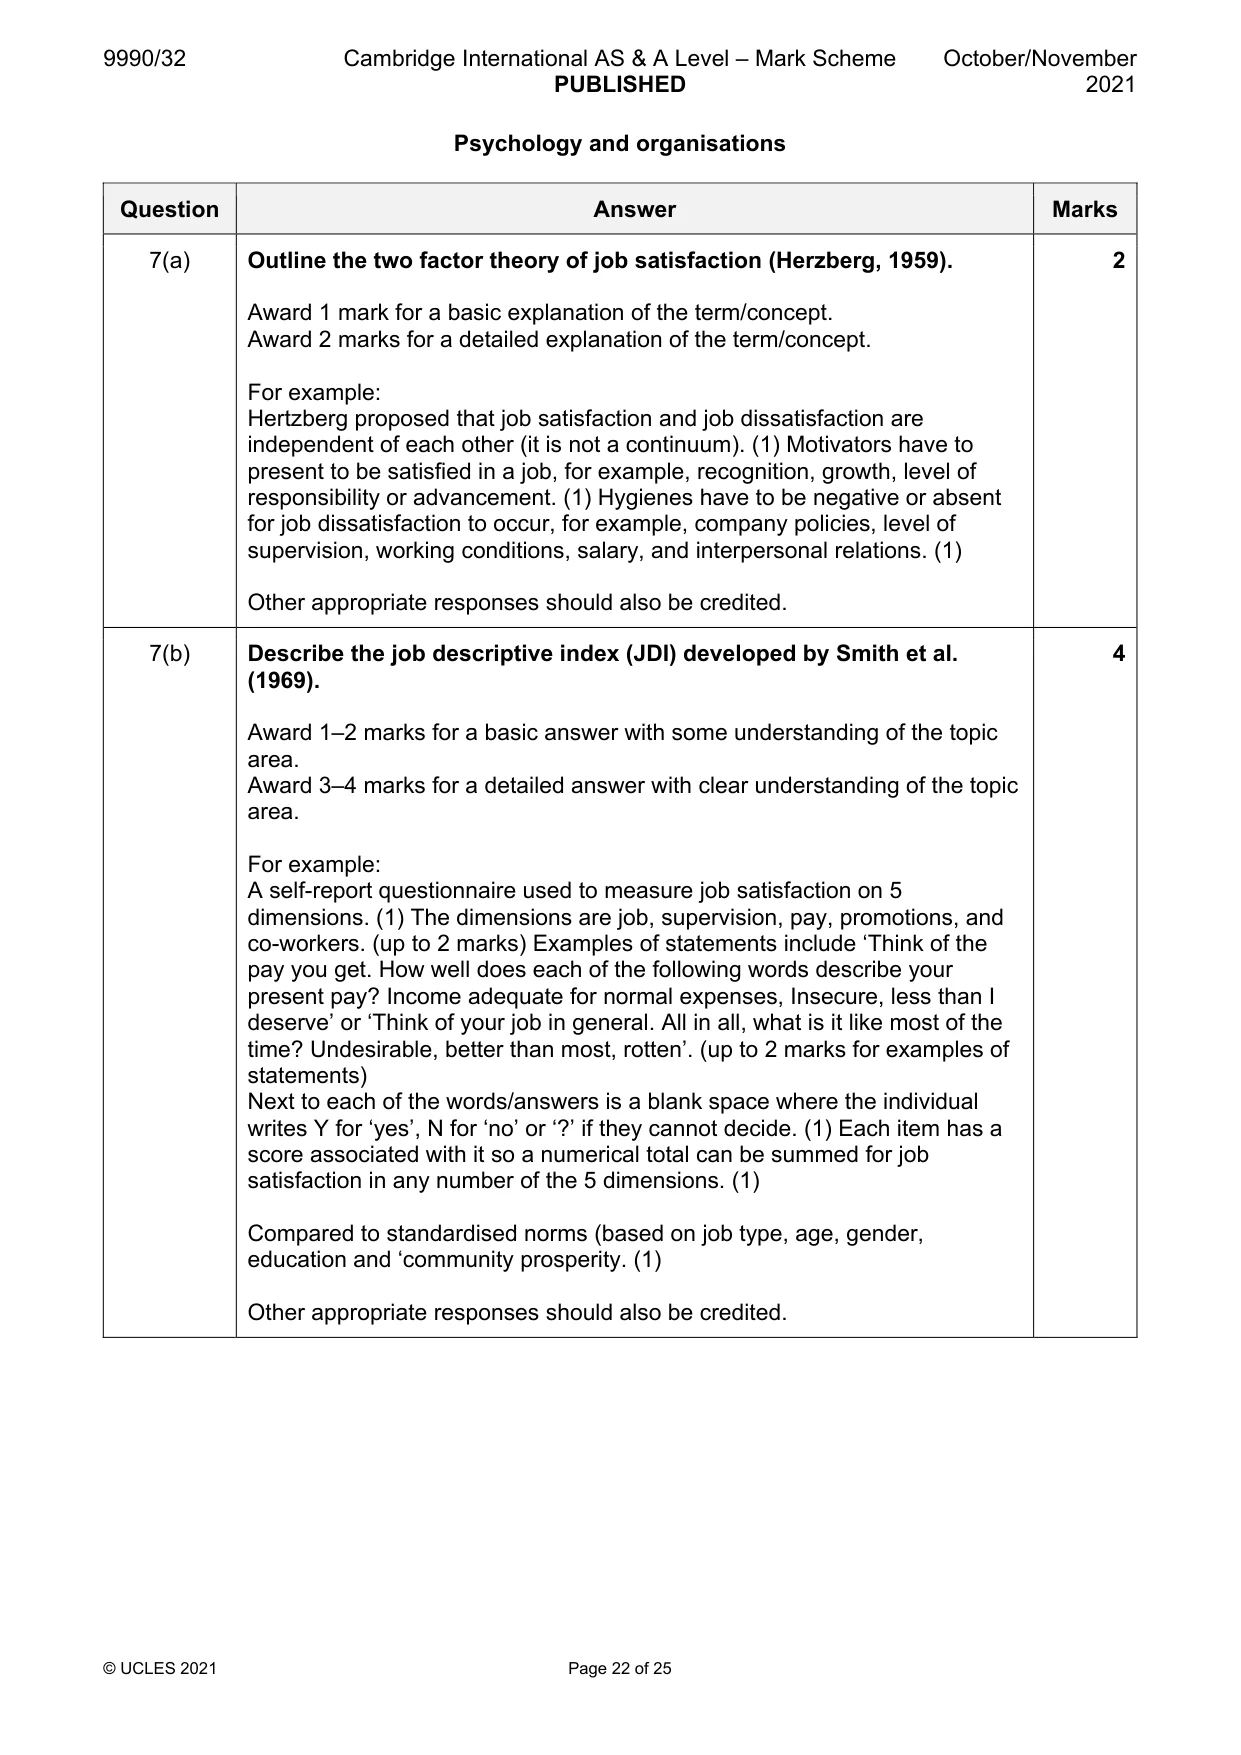
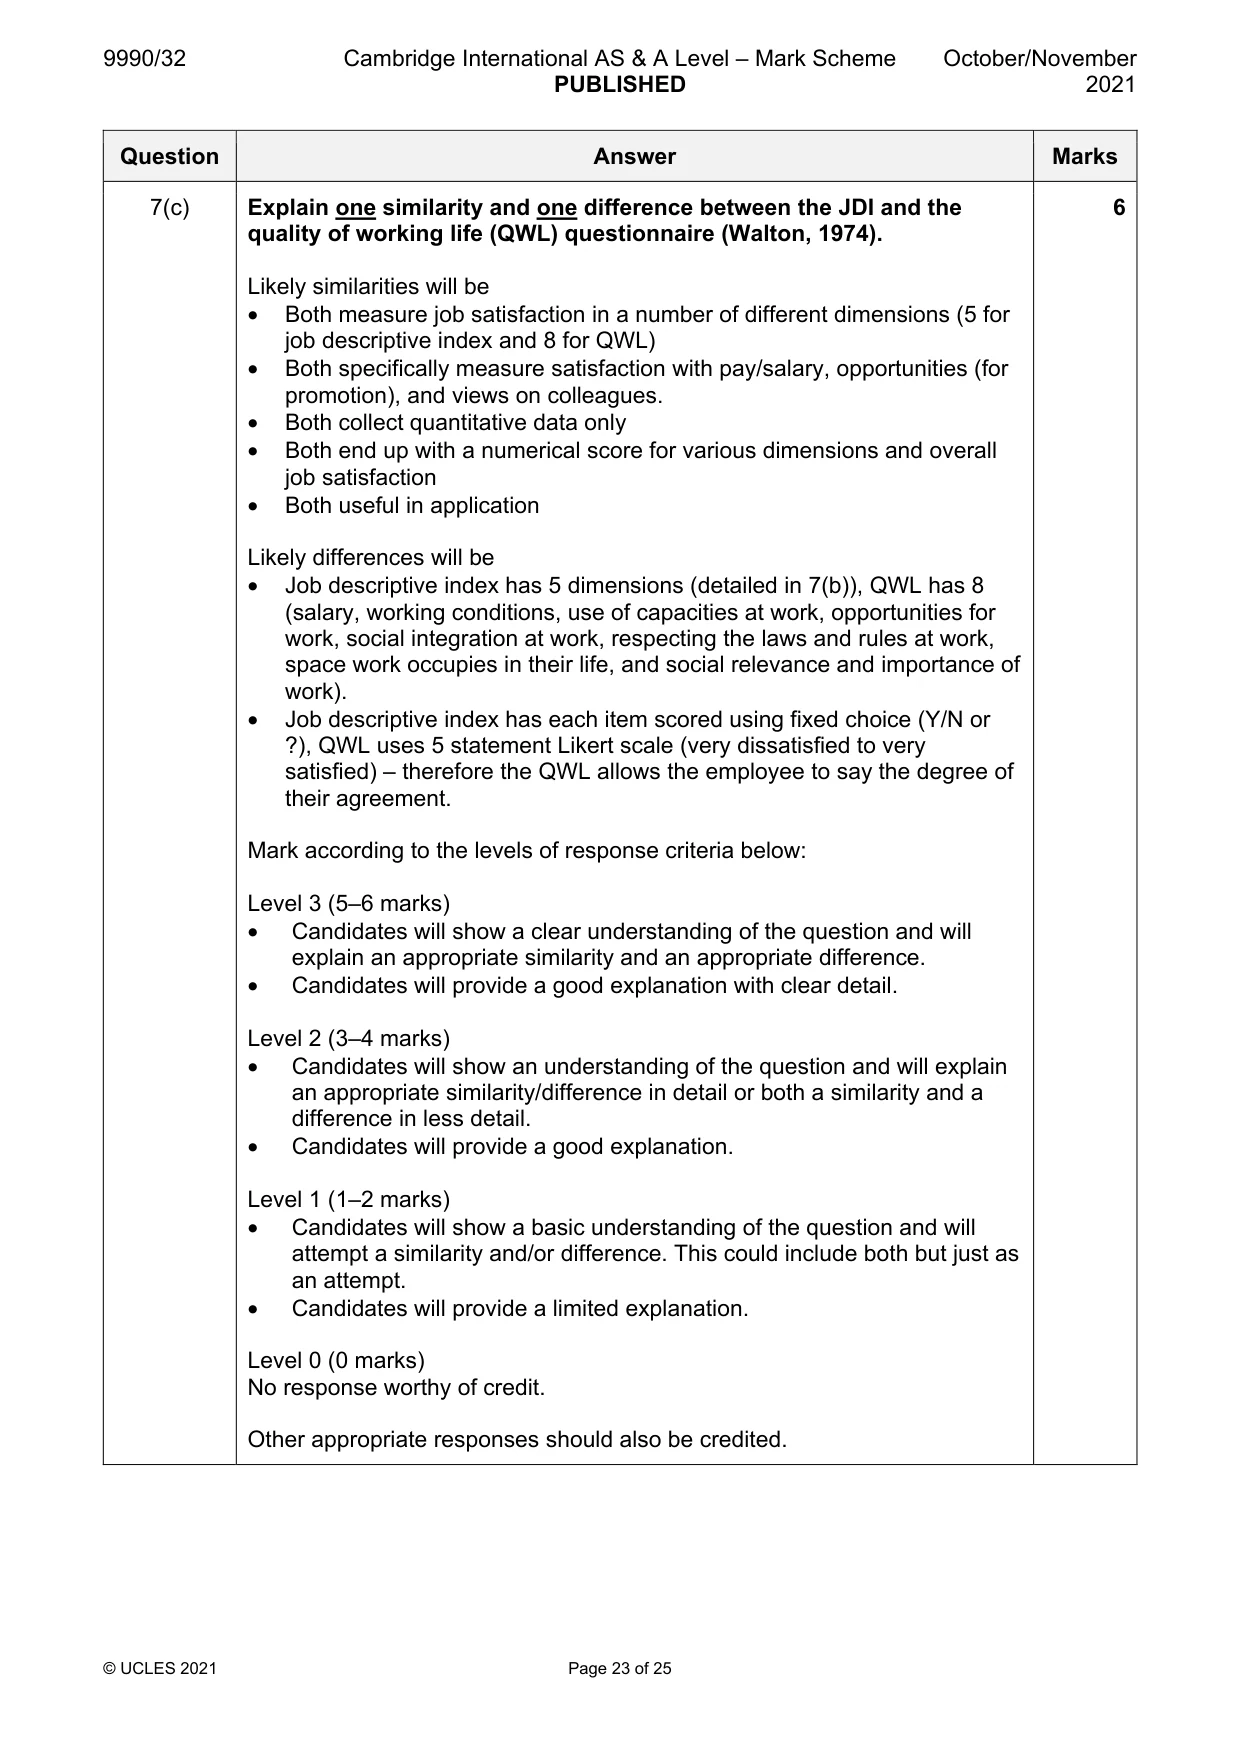
Mark scheme: 7(a) Outline the two factor theory of job satisfaction (Herzberg, 1959). 2 Award 1 mark for a basic explanation of the term/concept. Award 2 marks for a detailed explanation of the term/concept. For example: Hertzberg proposed that job satisfaction and job dissatisfaction are independent of each other (it is not a continuum). (1) Motivators have to present to be satisfied in a job, for example, recognition, growth, level of responsibility or advancement. (1) Hygienes have to be negative or absent for job dissatisfaction to occur, for example, company policies, level of supervision, working conditions, salary, and interpersonal relations. (1) Other appropriate responses should also be credited. 7(b) Describe the job descriptive index (JDI) developed by Smith et al. 4 (1969). Award 1–2 marks for a basic answer with some understanding of the topic area. Award 3–4 marks for a detailed answer with clear understanding of the topic area. For example: A self-report questionnaire used to measure job satisfaction on 5 dimensions. (1) The dimensions are job, supervision, pay, promotions, and co-workers. (up to 2 marks) Examples of statements include ‘Think of the pay you get. How well does each of the following words describe your present pay? Income adequate for normal expenses, Insecure, less than I deserve’ or ‘Think of your job in general. All in all, what is it like most of the time? Undesirable, better than most, rotten’. (up to 2 marks for examples of statements) Next to each of the words/answers is a blank space where the individual writes Y for ‘yes’, N for ‘no’ or ‘?’ if they cannot decide. (1) Each item has a score associated with it so a numerical total can be summed for job satisfaction in any number of the 5 dimensions. (1) Compared to standardised norms (based on job type, age, gender, education and ‘community prosperity. (1) Other appropriate responses should also be credited. 7(c) Explain one similarity and one difference between the JDI and the 6 quality of working life (QWL) questionnaire (Walton, 1974). Likely similarities will be • Both measure job satisfaction in a number of different dimensions (5 for job descriptive index and 8 for QWL) • Both specifically measure satisfaction with pay/salary, opportunities (for promotion), and views on colleagues. • Both collect quantitative data only • Both end up with a numerical score for various dimensions and overall job satisfaction • Both useful in application Likely differences will be • Job descriptive index has 5 dimensions (detailed in 7(b)), QWL has 8 (salary, working conditions, use of capacities at work, opportunities for work, social integration at work, respecting the laws and rules at work, space work occupies in their life, and social relevance and importance of work). • Job descriptive index has each item scored using fixed choice (Y/N or ?), QWL uses 5 statement Likert scale (very dissatisfied to very satisfied) – therefore the QWL allows the employee to say the degree of their agreement. Mark according to the levels of response criteria below: Level 3 (5–6 marks) • Candidates will show a clear understanding of the question and will explain an appropriate similarity and an appropriate difference. • Candidates will provide a good explanation with clear detail. Level 2 (3–4 marks) • Candidates will show an understanding of the question and will explain an appropriate similarity/difference in detail or both a similarity and a difference in less detail. • Candidates will provide a good explanation. Level 1 (1–2 marks) • Candidates will show a basic understanding of the question and will attempt a similarity and/or difference. This could include both but just as an attempt. • Candidates will provide a limited explanation. Level 0 (0 marks) No response worthy of credit. Other appropriate responses should also be credited.
Q8 · Describe what psychologists have discovered about group conflict in organisations
8 (a) Describe what psychologists have discovered about group conflict in organisations. [8] (b) Evaluate what psychologists have discovered about group conflict in organisations, including a discussion of individual and situational explanations. [10]
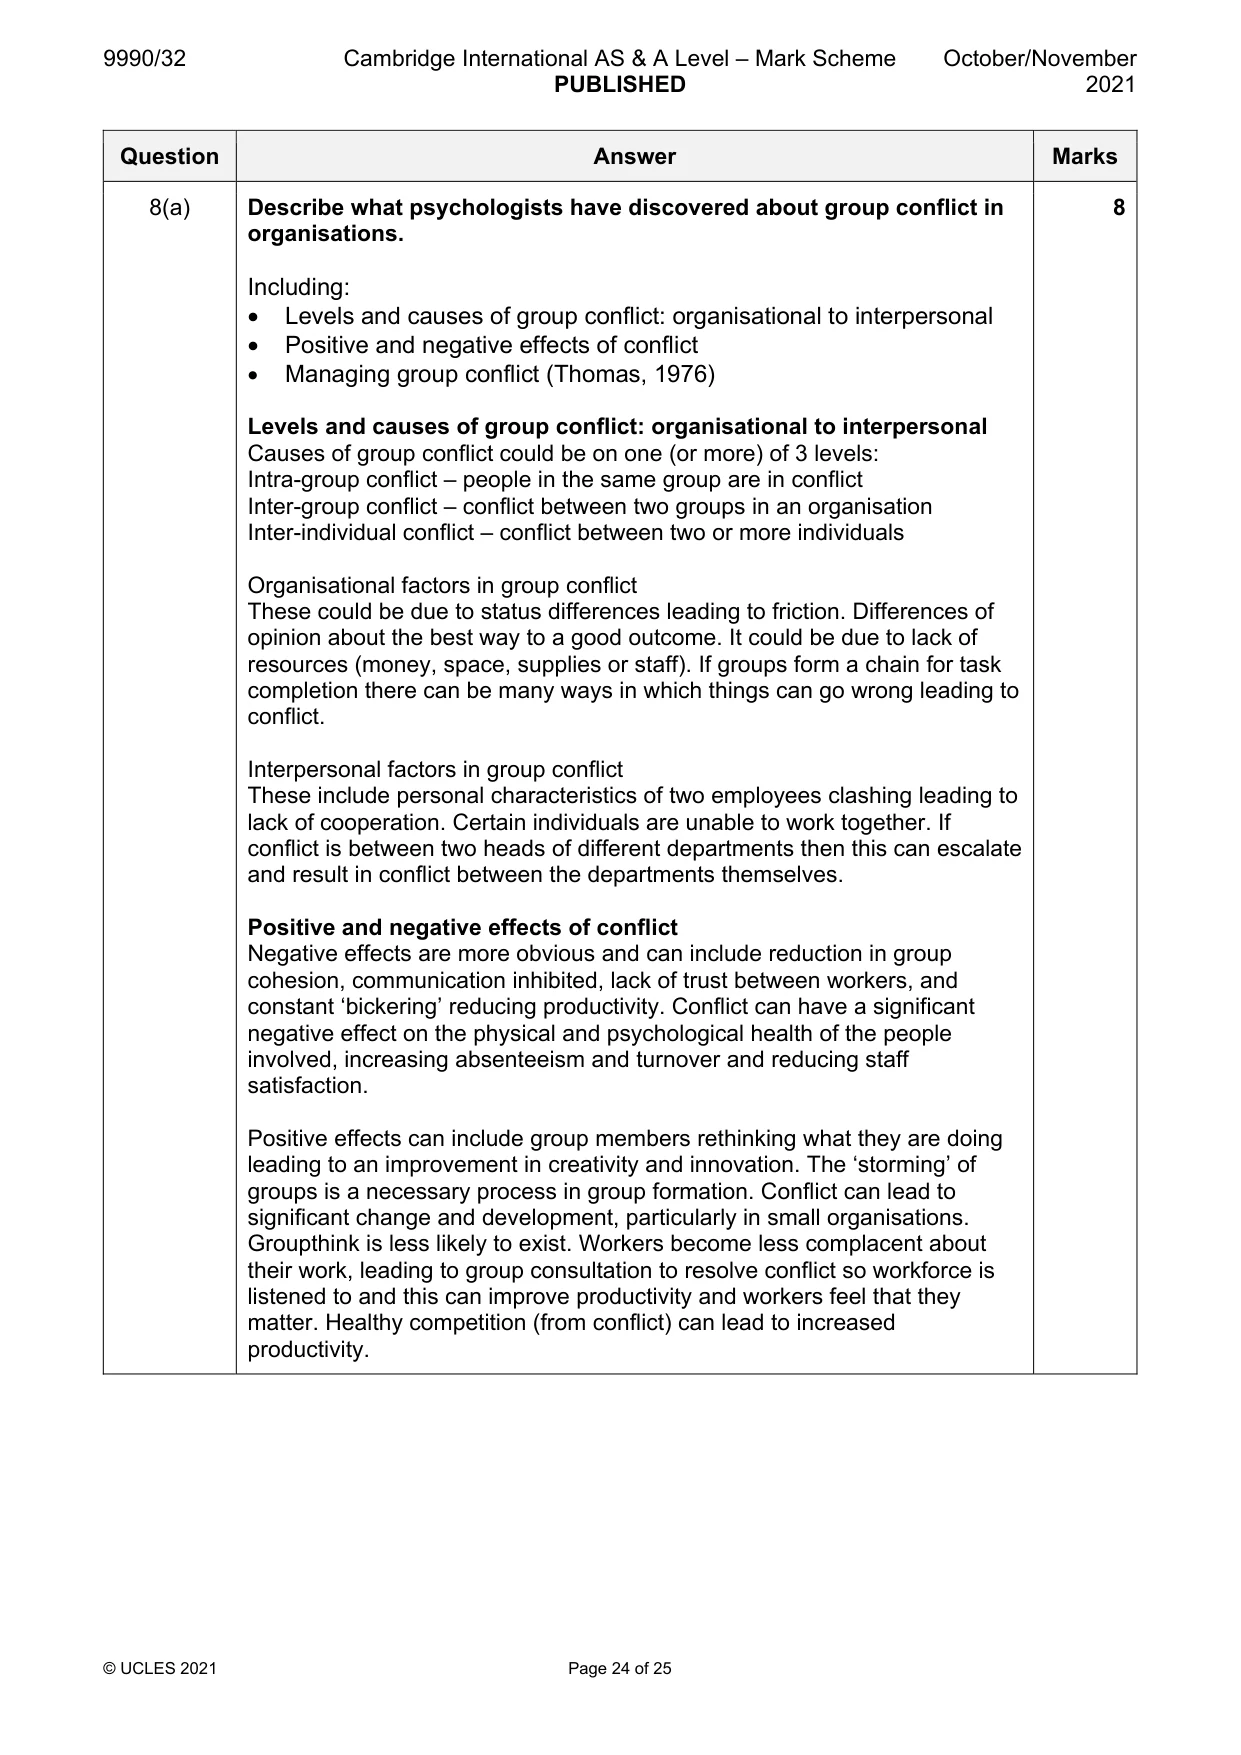
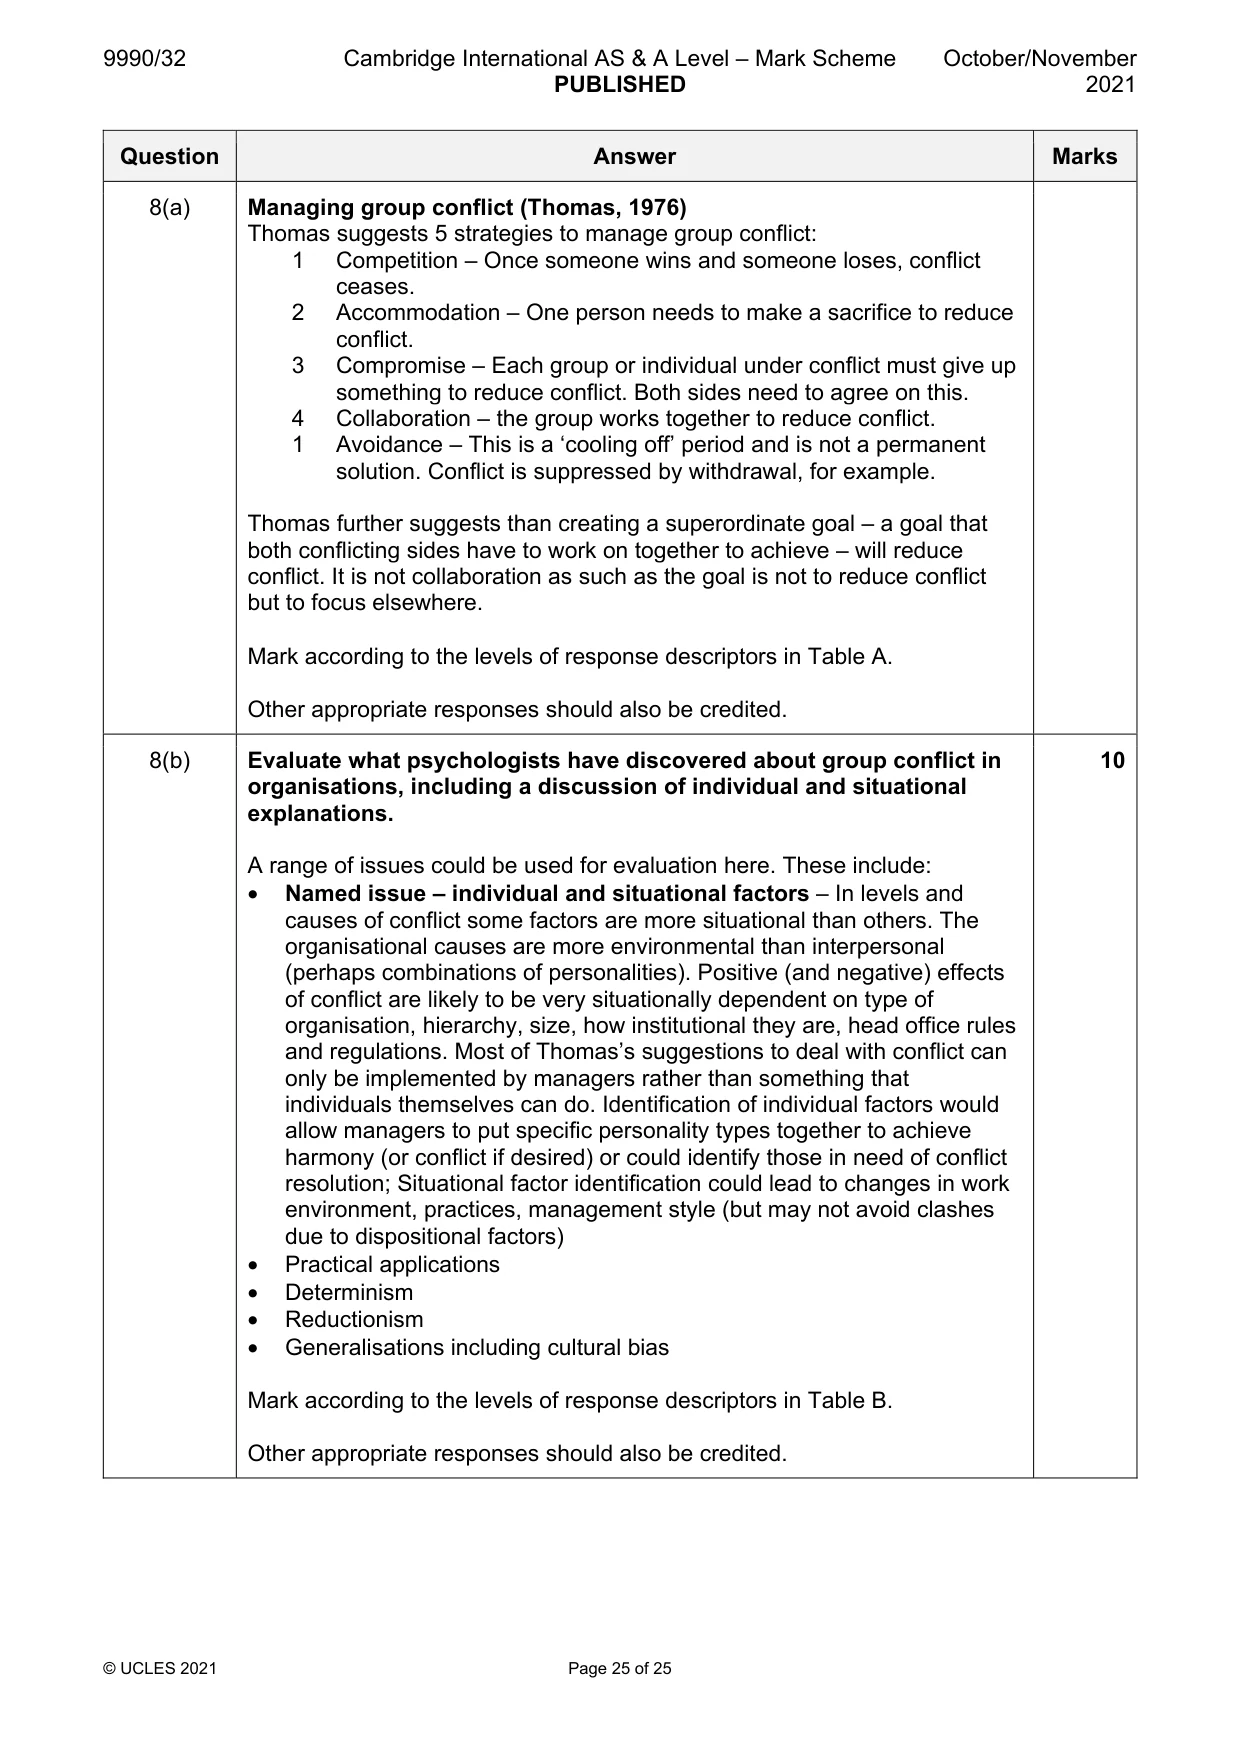
Mark scheme: 8(a) Describe what psychologists have discovered about group conflict in 8 organisations. Including: • Levels and causes of group conflict: organisational to interpersonal • Positive and negative effects of conflict • Managing group conflict (Thomas, 1976) Levels and causes of group conflict: organisational to interpersonal Causes of group conflict could be on one (or more) of 3 levels: Intra-group conflict – people in the same group are in conflict Inter-group conflict – conflict between two groups in an organisation Inter-individual conflict – conflict between two or more individuals Organisational factors in group conflict These could be due to status differences leading to friction. Differences of opinion about the best way to a good outcome. It could be due to lack of resources (money, space, supplies or staff). If groups form a chain for task completion there can be many ways in which things can go wrong leading to conflict. Interpersonal factors in group conflict These include personal characteristics of two employees clashing leading to lack of cooperation. Certain individuals are unable to work together. If conflict is between two heads of different departments then this can escalate and result in conflict between the departments themselves. Positive and negative effects of conflict Negative effects are more obvious and can include reduction in group cohesion, communication inhibited, lack of trust between workers, and constant ‘bickering’ reducing productivity. Conflict can have a significant negative effect on the physical and psychological health of the people involved, increasing absenteeism and turnover and reducing staff satisfaction. Positive effects can include group members rethinking what they are doing leading to an improvement in creativity and innovation. The ‘storming’ of groups is a necessary process in group formation. Conflict can lead to significant change and development, particularly in small organisations. Groupthink is less likely to exist. Workers become less complacent about their work, leading to group consultation to resolve conflict so workforce is listened to and this can improve productivity and workers feel that they matter. Healthy competition (from conflict) can lead to increased productivity. 8(a) Managing group conflict (Thomas, 1976) Thomas suggests 5 strategies to manage group conflict: 1 Competition – Once someone wins and someone loses, conflict ceases. 2 Accommodation – One person needs to make a sacrifice to reduce conflict. 3 Compromise – Each group or individual under conflict must give up something to reduce conflict. Both sides need to agree on this. 4 Collaboration – the group works together to reduce conflict. 1 Avoidance – This is a ‘cooling off’ period and is not a permanent solution. Conflict is suppressed by withdrawal, for example. Thomas further suggests than creating a superordinate goal – a goal that both conflicting sides have to work on together to achieve – will reduce conflict. It is not collaboration as such as the goal is not to reduce conflict but to focus elsewhere. Mark according to the levels of response descriptors in Table A. Other appropriate responses should also be credited. 8(b) Evaluate what psychologists have discovered about group conflict in 10 organisations, including a discussion of individual and situational explanations. A range of issues could be used for evaluation here. These include: • Named issue – individual and situational factors – In levels and causes of conflict some factors are more situational than others. The organisational causes are more environmental than interpersonal (perhaps combinations of personalities). Positive (and negative) effects of conflict are likely to be very situationally dependent on type of organisation, hierarchy, size, how institutional they are, head office rules and regulations. Most of Thomas’s suggestions to deal with conflict can only be implemented by managers rather than something that individuals themselves can do. Identification of individual factors would allow managers to put specific personality types together to achieve harmony (or conflict if desired) or could identify those in need of conflict resolution; Situational factor identification could lead to changes in work environment, practices, management style (but may not avoid clashes due to dispositional factors) • Practical applications • Determinism • Reductionism • Generalisations including cultural bias Mark according to the levels of response descriptors in Table B. Other appropriate responses should also be credited.
What was in this paper
The subtopics covered by these 8 questions, and how many questions each got. Open one in a new tab to see every Cambridge question on it.
What you needed in this session
Cambridge’s own grade thresholds for 2021 Oct/Nov, Paper 3 · Variant 2. A higher threshold means an easier paper — the bar moves with how the cohort did.