Cambridge A Level Psychology (from 2018) 9990 — 2020 May/June Paper 2 · Variant 2
9990/22/M/J/20 · 10 questions · 60 marks · ≈68 min
The question paper and its mark scheme, free to read here and free to download. This is Cambridge’s own paper, exactly as it was sat.
Question paper12 pages



Mark scheme10 pages
Answers below. Sit the paper first if you are practising.
Questions as text
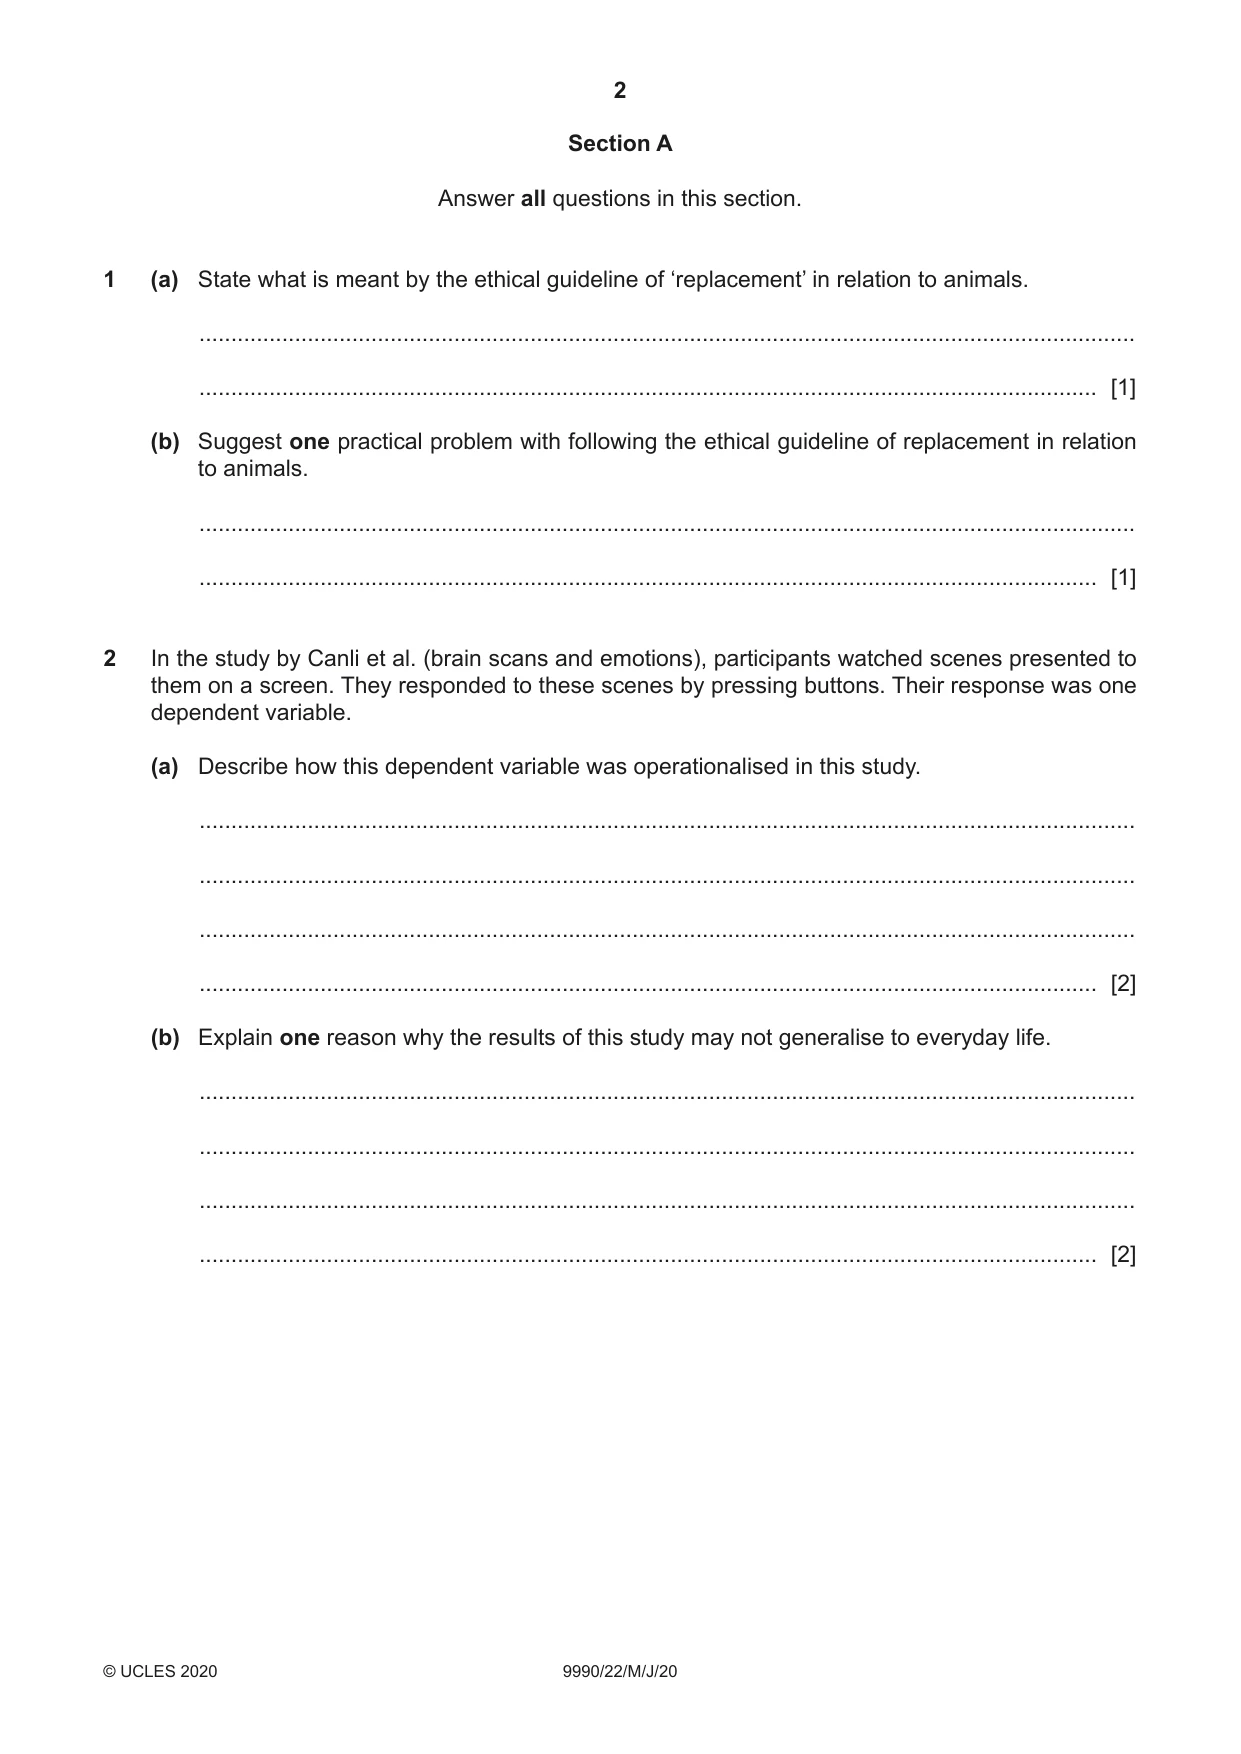
Q1 · State what is meant by the ethical guideline of ‘replacement’ in relation to animals
1 (a) State what is meant by the ethical guideline of ‘replacement’ in relation to animals. ................................................................................................................................................... ............................................................................................................................................. [1] (b) Suggest one practical problem with following the ethical guideline of replacement in relation to animals. ................................................................................................................................................... ............................................................................................................................................. [1]
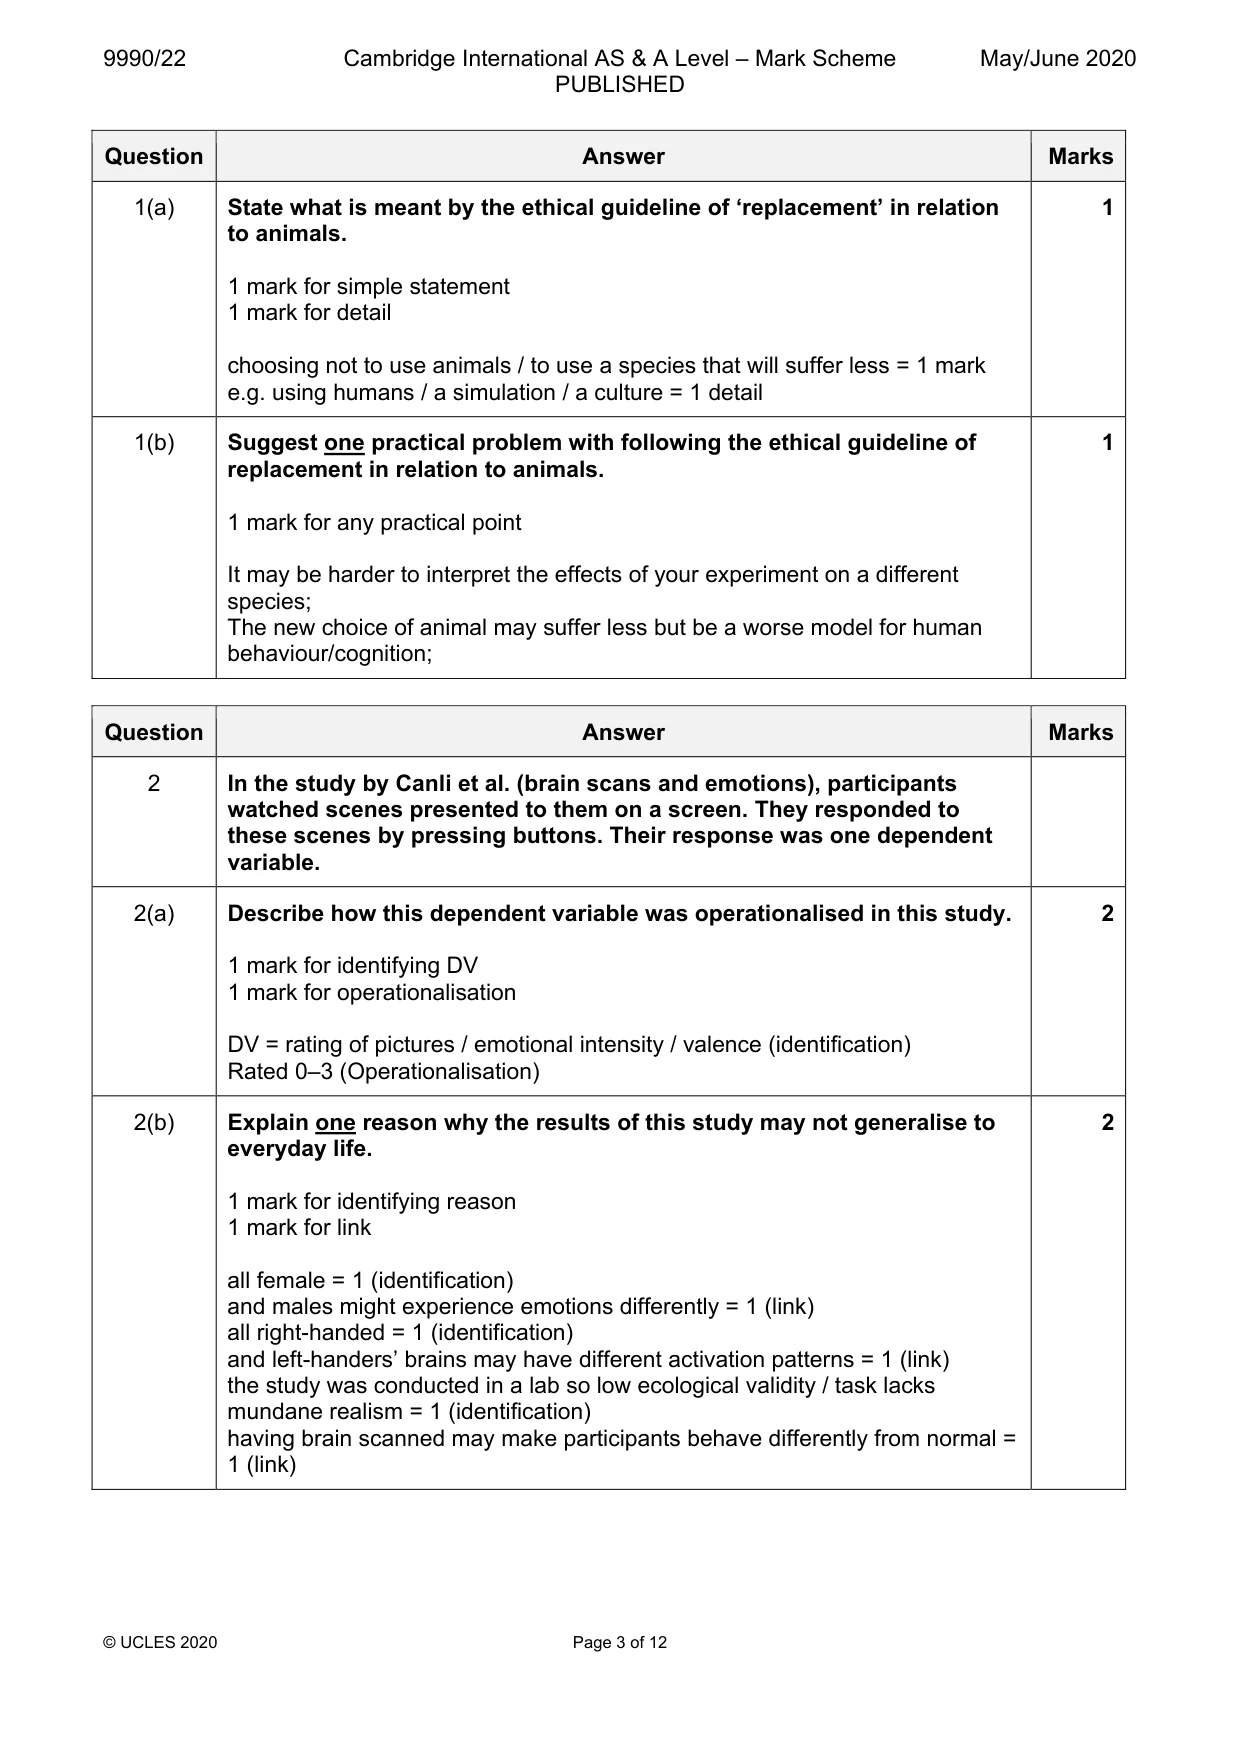
Mark scheme: Question Answer Marks 1(a) State what is meant by the ethical guideline of ‘replacement’ in relation 1 to animals. 1 mark for simple statement 1 mark for detail choosing not to use animals / to use a species that will suffer less = 1 mark e.g. using humans / a simulation / a culture = 1 detail 1(b) Suggest one practical problem with following the ethical guideline of 1 replacement in relation to animals. 1 mark for any practical point It may be harder to interpret the effects of your experiment on a different species; The new choice of animal may suffer less but be a worse model for human behaviour/cognition;
Q2 · In the study by Canli et al
2 In the study by Canli et al. (brain scans and emotions), participants watched scenes presented to them on a screen. They responded to these scenes by pressing buttons. Their response was one dependent variable. (a) Describe how this dependent variable was operationalised in this study. ................................................................................................................................................... ................................................................................................................................................... ................................................................................................................................................... ............................................................................................................................................. [2] (b) Explain one reason why the results of this study may not generalise to everyday life. ................................................................................................................................................... ................................................................................................................................................... ................................................................................................................................................... ............................................................................................................................................. [2]
Mark scheme: 2 In the study by Canli et al. (brain scans and emotions), participants watched scenes presented to them on a screen. They responded to these scenes by pressing buttons. Their response was one dependent variable. 2(a) Describe how this dependent variable was operationalised in this study. 2 1 mark for identifying DV 1 mark for operationalisation DV = rating of pictures / emotional intensity / valence (identification) Rated 0–3 (Operationalisation) 2(b) Explain one reason why the results of this study may not generalise to 2 everyday life. 1 mark for identifying reason 1 mark for link all female = 1 (identification) and males might experience emotions differently = 1 (link) all right-handed = 1 (identification) and left-handers’ brains may have different activation patterns = 1 (link) the study was conducted in a lab so low ecological validity / task lacks mundane realism = 1 (identification) having brain scanned may make participants behave differently from normal = 1 (link)
Q3 · Andrade conducted an experiment on doodling
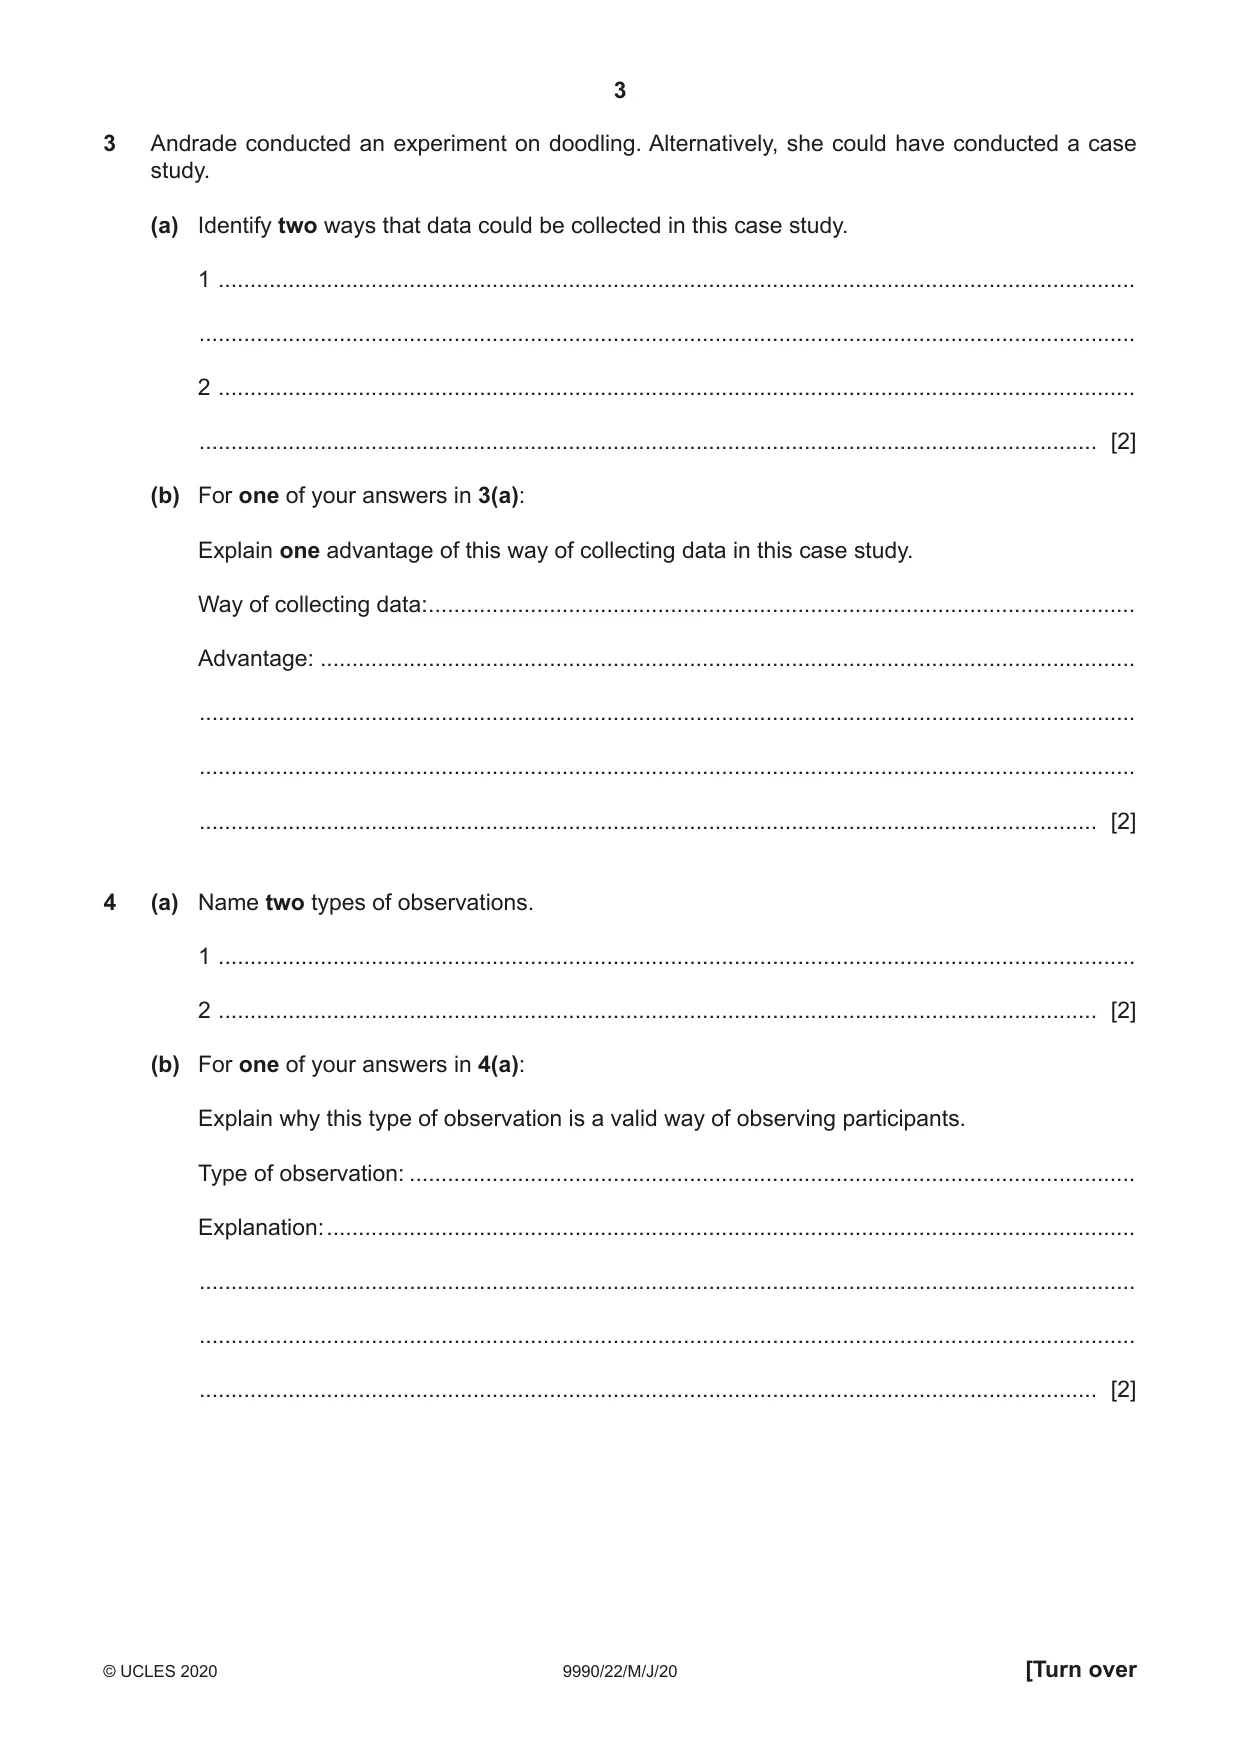
3 Andrade conducted an experiment on doodling. Alternatively, she could have conducted a case study. (a) Identify two ways that data could be collected in this case study. 1 ................................................................................................................................................ ................................................................................................................................................... 2 ................................................................................................................................................ ............................................................................................................................................. [2] (b) For one of your answers in 3(a): Explain one advantage of this way of collecting data in this case study. Way of collecting data: ............................................................................................................... Advantage: ................................................................................................................................ ................................................................................................................................................... ................................................................................................................................................... ............................................................................................................................................. [2]
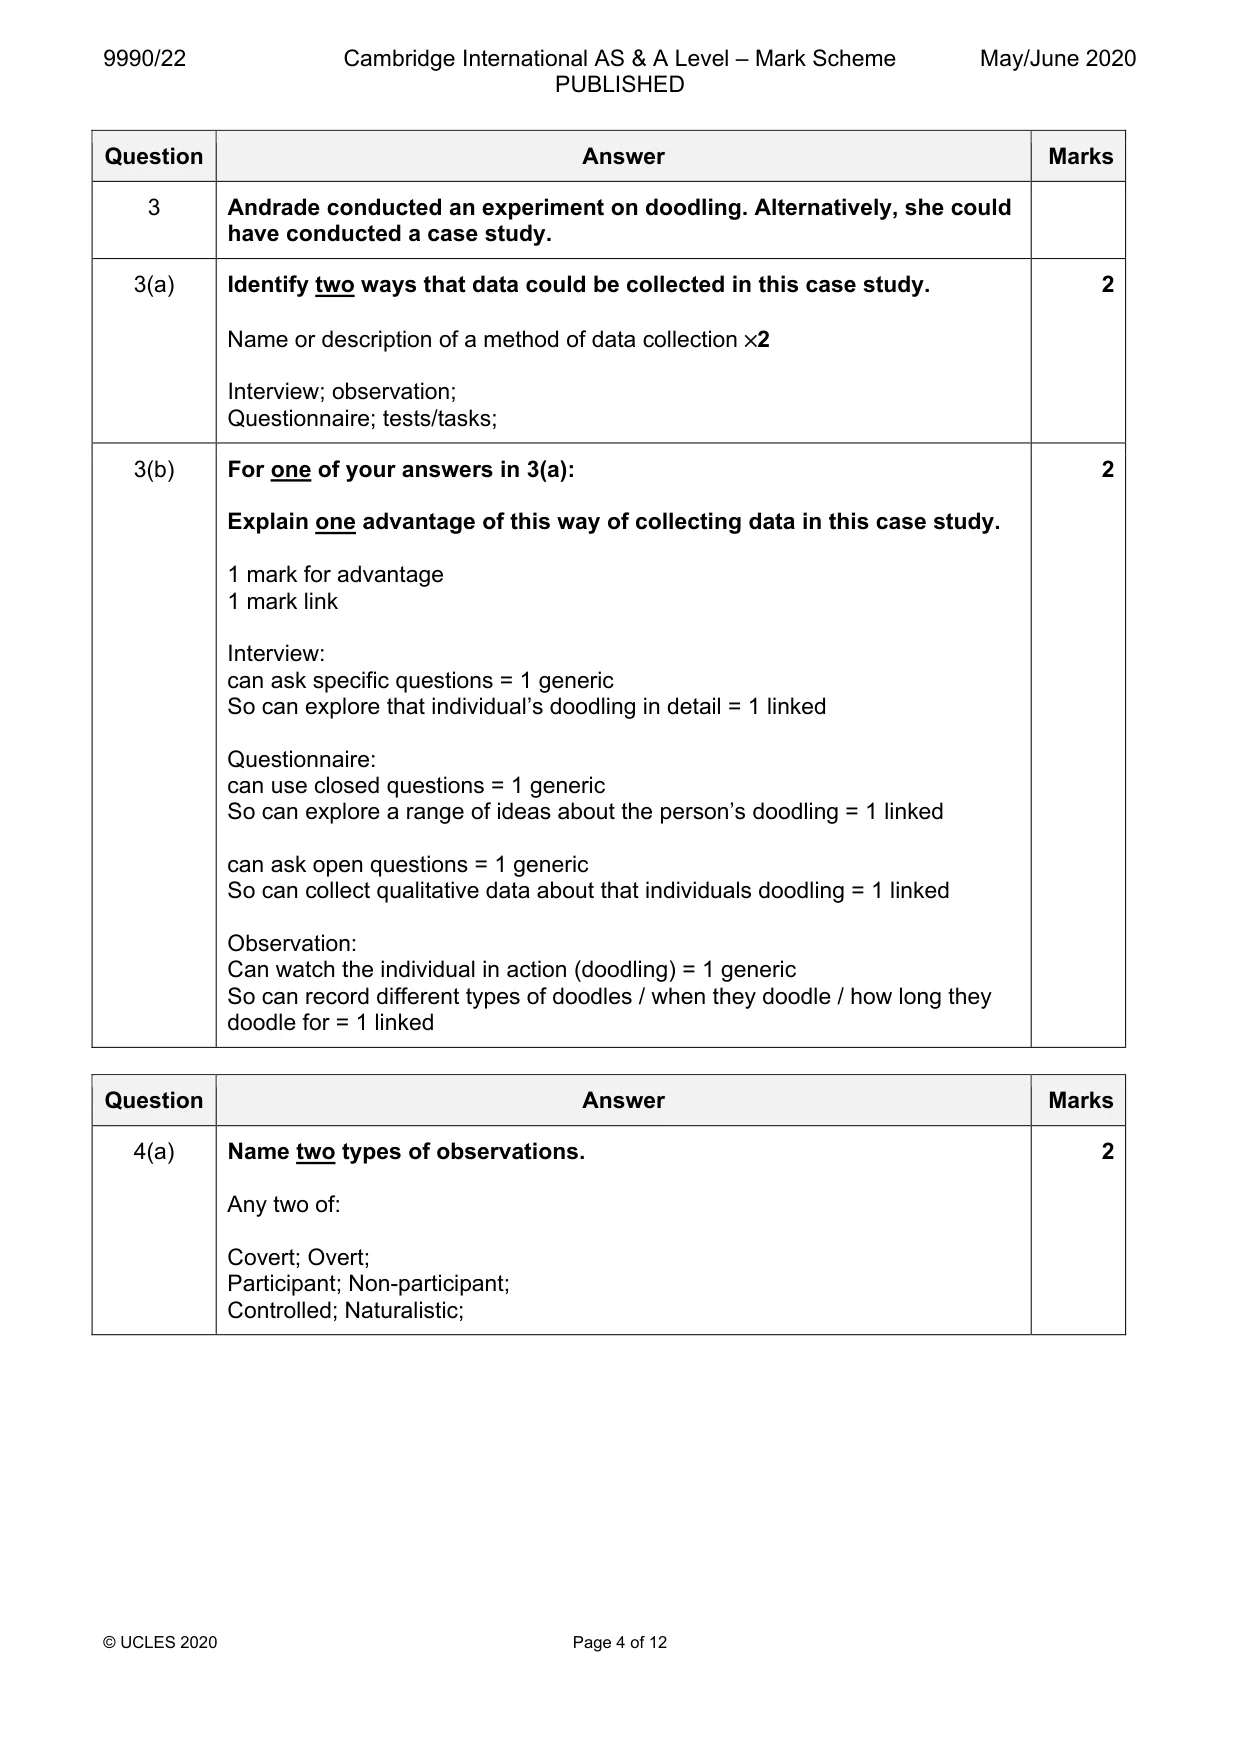
Mark scheme: 3 Andrade conducted an experiment on doodling. Alternatively, she could have conducted a case study. 3(a) Identify two ways that data could be collected in this case study. 2 Name or description of a method of data collection ×2 Interview; observation; Questionnaire; tests/tasks; 3(b) For one of your answers in 3(a): 2 Explain one advantage of this way of collecting data in this case study. 1 mark for advantage 1 mark link Interview: can ask specific questions = 1 generic So can explore that individual’s doodling in detail = 1 linked Questionnaire: can use closed questions = 1 generic So can explore a range of ideas about the person’s doodling = 1 linked can ask open questions = 1 generic So can collect qualitative data about that individuals doodling = 1 linked Observation: Can watch the individual in action (doodling) = 1 generic So can record different types of doodles / when they doodle / how long they doodle for = 1 linked
Q4 · Name two types of observations
4 (a) Name two types of observations. 1 ................................................................................................................................................ 2 .......................................................................................................................................... [2] (b) For one of your answers in 4(a): Explain why this type of observation is a valid way of observing participants. Type of observation: .................................................................................................................. Explanation: ............................................................................................................................... ................................................................................................................................................... ................................................................................................................................................... ............................................................................................................................................. [2]
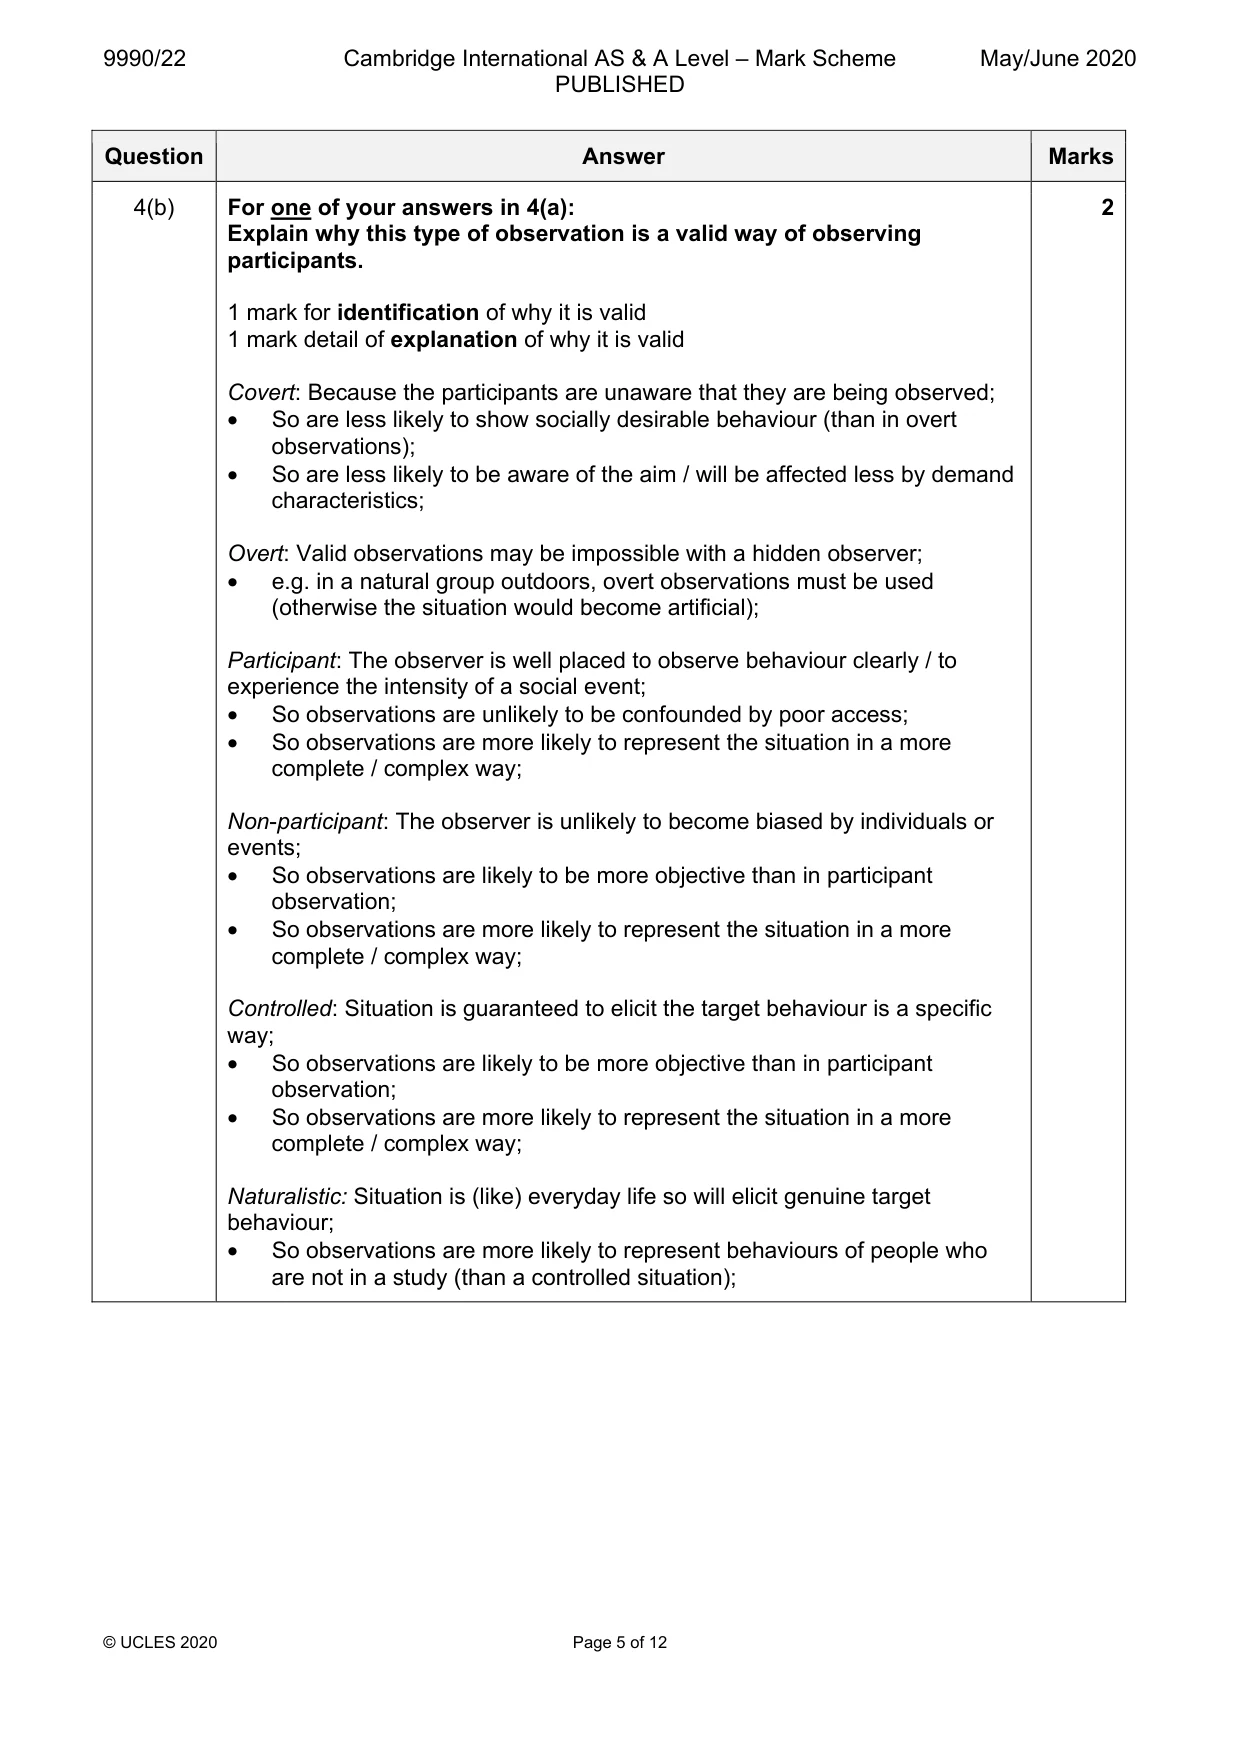
Mark scheme: 4(a) Name two types of observations. 2 Any two of: Covert; Overt; Participant; Non-participant; Controlled; Naturalistic; 4(b) For one of your answers in 4(a): 2 Explain why this type of observation is a valid way of observing participants. 1 mark for identification of why it is valid 1 mark detail of explanation of why it is valid Covert: Because the participants are unaware that they are being observed; • So are less likely to show socially desirable behaviour (than in overt observations); • So are less likely to be aware of the aim / will be affected less by demand characteristics; Overt: Valid observations may be impossible with a hidden observer; • e.g. in a natural group outdoors, overt observations must be used (otherwise the situation would become artificial); Participant: The observer is well placed to observe behaviour clearly / to experience the intensity of a social event; • So observations are unlikely to be confounded by poor access; • So observations are more likely to represent the situation in a more complete / complex way; Non-participant: The observer is unlikely to become biased by individuals or events; • So observations are likely to be more objective than in participant observation; • So observations are more likely to represent the situation in a more complete / complex way; Controlled: Situation is guaranteed to elicit the target behaviour is a specific way; • So observations are likely to be more objective than in participant observation; • So observations are more likely to represent the situation in a more complete / complex way; Naturalistic: Situation is (like) everyday life so will elicit genuine target behaviour; • So observations are more likely to represent behaviours of people who are not in a study (than a controlled situation);
Q5 · At the start of the study by Bandura et al
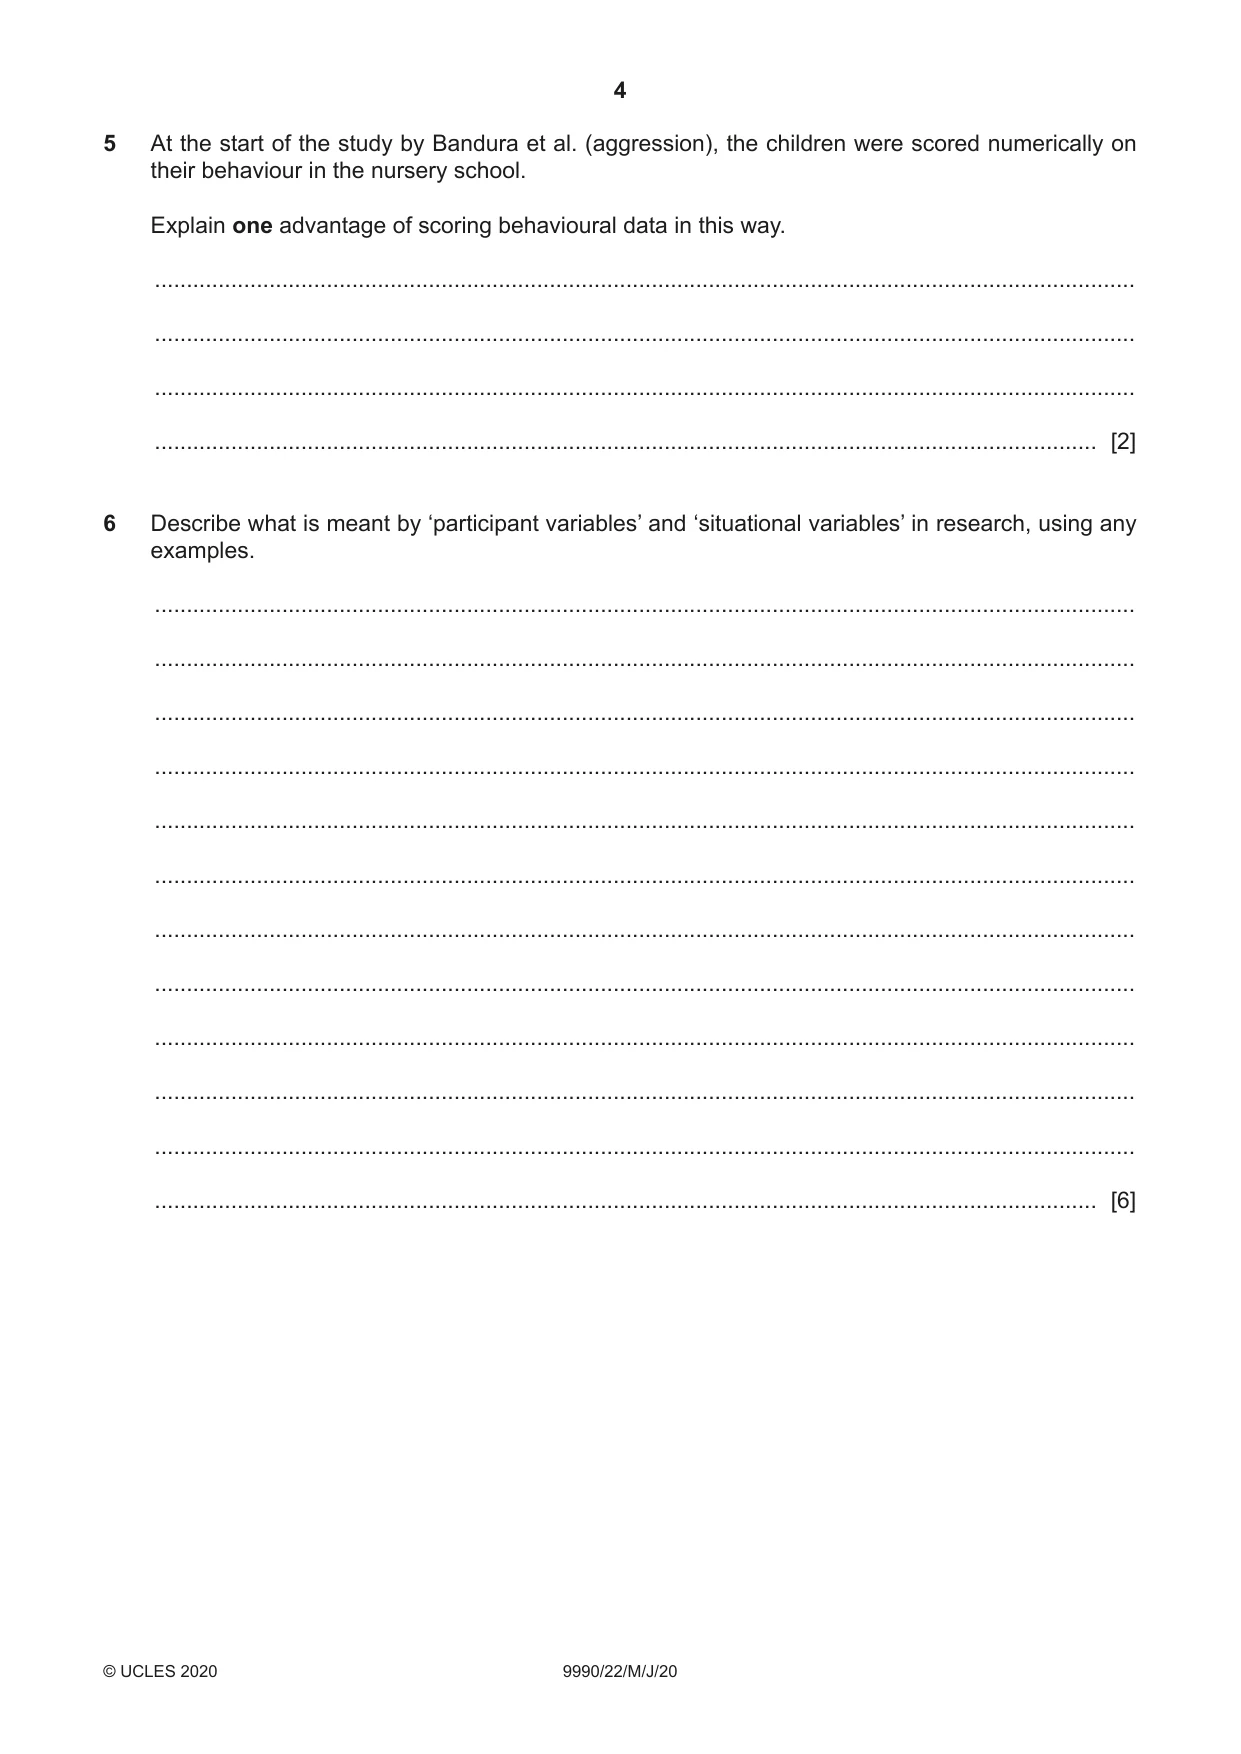
5 At the start of the study by Bandura et al. (aggression), the children were scored numerically on their behaviour in the nursery school. Explain one advantage of scoring behavioural data in this way. .......................................................................................................................................................... .......................................................................................................................................................... .......................................................................................................................................................... .................................................................................................................................................... [2]
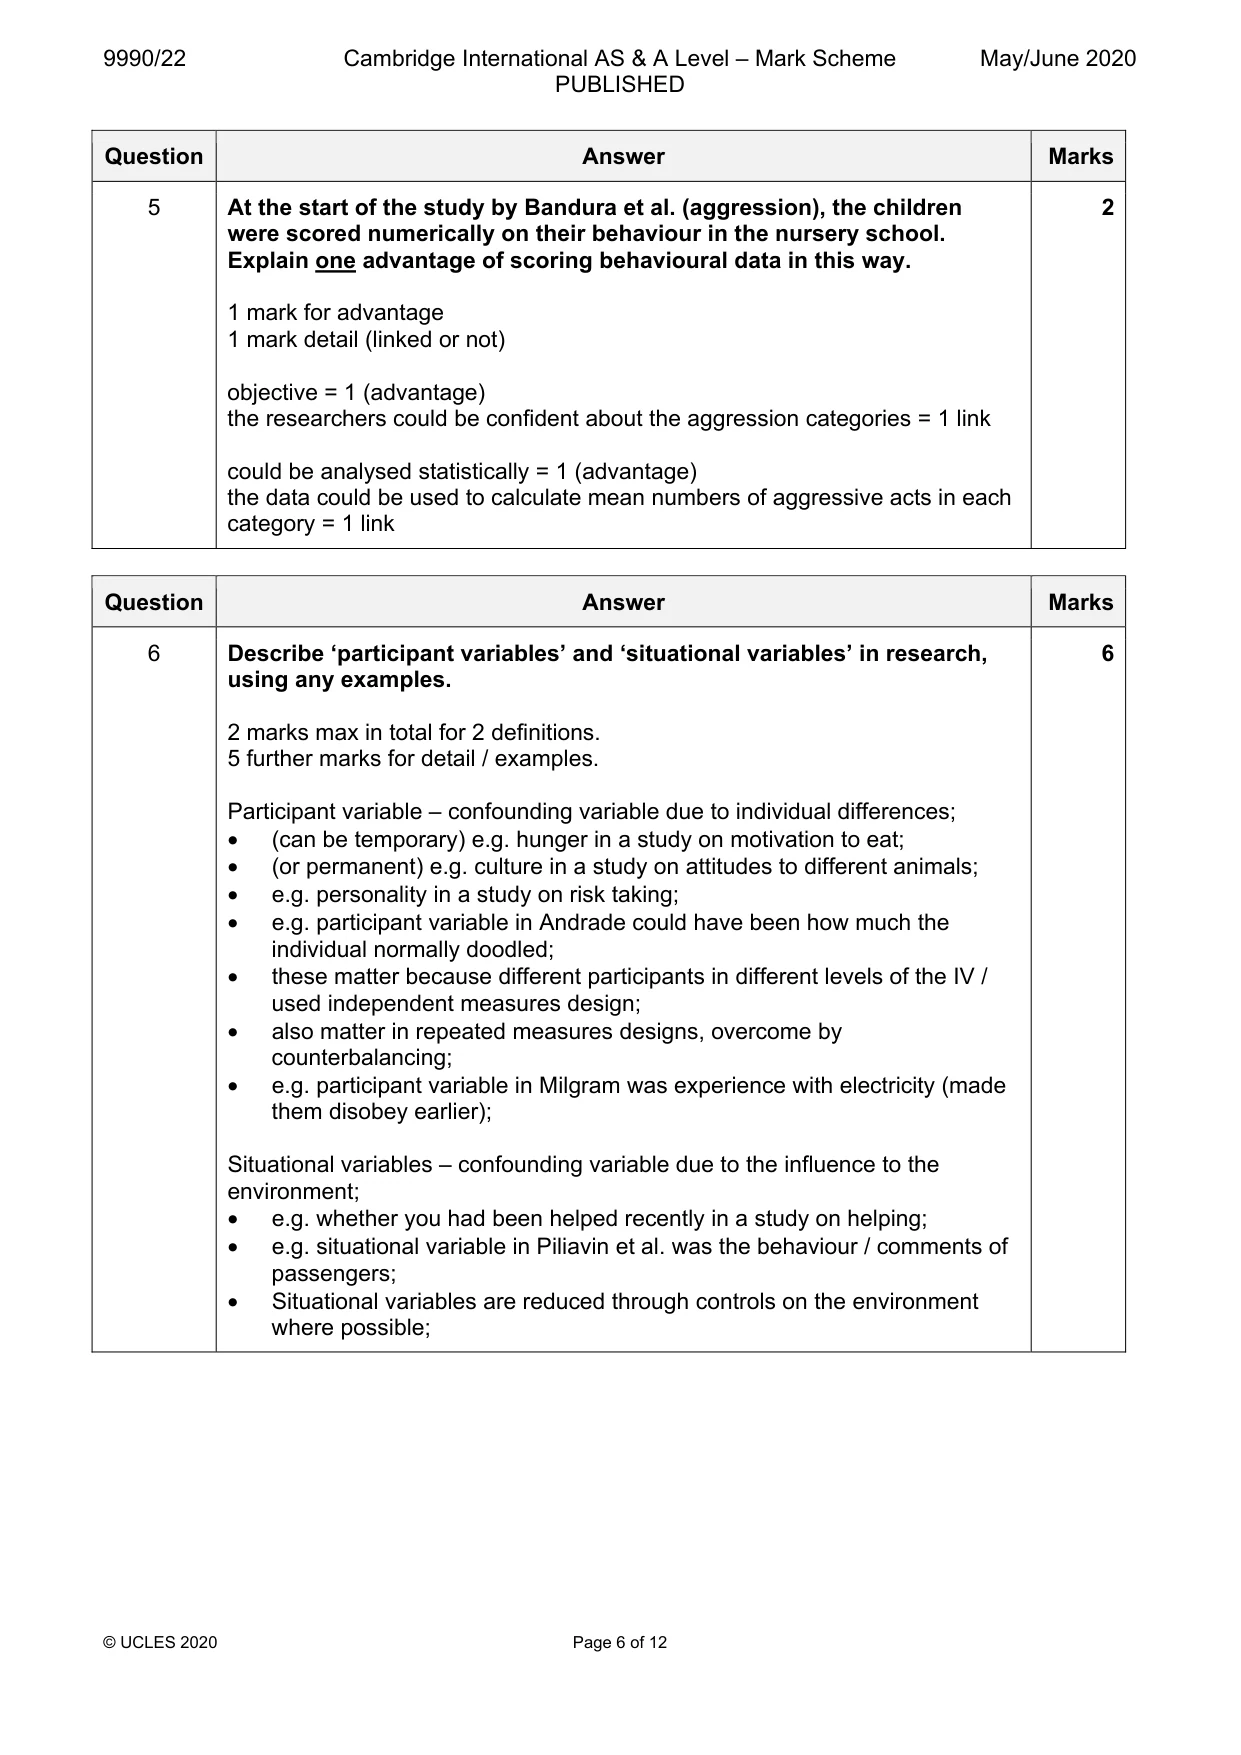
Mark scheme: 5 At the start of the study by Bandura et al. (aggression), the children 2 were scored numerically on their behaviour in the nursery school. Explain one advantage of scoring behavioural data in this way. 1 mark for advantage 1 mark detail (linked or not) objective = 1 (advantage) the researchers could be confident about the aggression categories = 1 link could be analysed statistically = 1 (advantage) the data could be used to calculate mean numbers of aggressive acts in each category = 1 link
Q6 · Describe what is meant by ‘participant variables’ and ‘situational variables’ in…
6 Describe what is meant by ‘participant variables’ and ‘situational variables’ in research, using any examples. .......................................................................................................................................................... .......................................................................................................................................................... .......................................................................................................................................................... .......................................................................................................................................................... .......................................................................................................................................................... .......................................................................................................................................................... .......................................................................................................................................................... .......................................................................................................................................................... .......................................................................................................................................................... .......................................................................................................................................................... .......................................................................................................................................................... .................................................................................................................................................... [6]
Mark scheme: 6 Describe ‘participant variables’ and ‘situational variables’ in research, 6 using any examples. 2 marks max in total for 2 definitions. 5 further marks for detail / examples. Participant variable – confounding variable due to individual differences; • (can be temporary) e.g. hunger in a study on motivation to eat; • (or permanent) e.g. culture in a study on attitudes to different animals; • e.g. personality in a study on risk taking; • e.g. participant variable in Andrade could have been how much the individual normally doodled; • these matter because different participants in different levels of the IV / used independent measures design; • also matter in repeated measures designs, overcome by counterbalancing; • e.g. participant variable in Milgram was experience with electricity (made them disobey earlier); Situational variables – confounding variable due to the influence to the environment; • e.g. whether you had been helped recently in a study on helping; • e.g. situational variable in Piliavin et al. was the behaviour / comments of passengers; • Situational variables are reduced through controls on the environment where possible;
Q7 · Mark is planning a natural experiment to investigate the short-term effect of noise on…
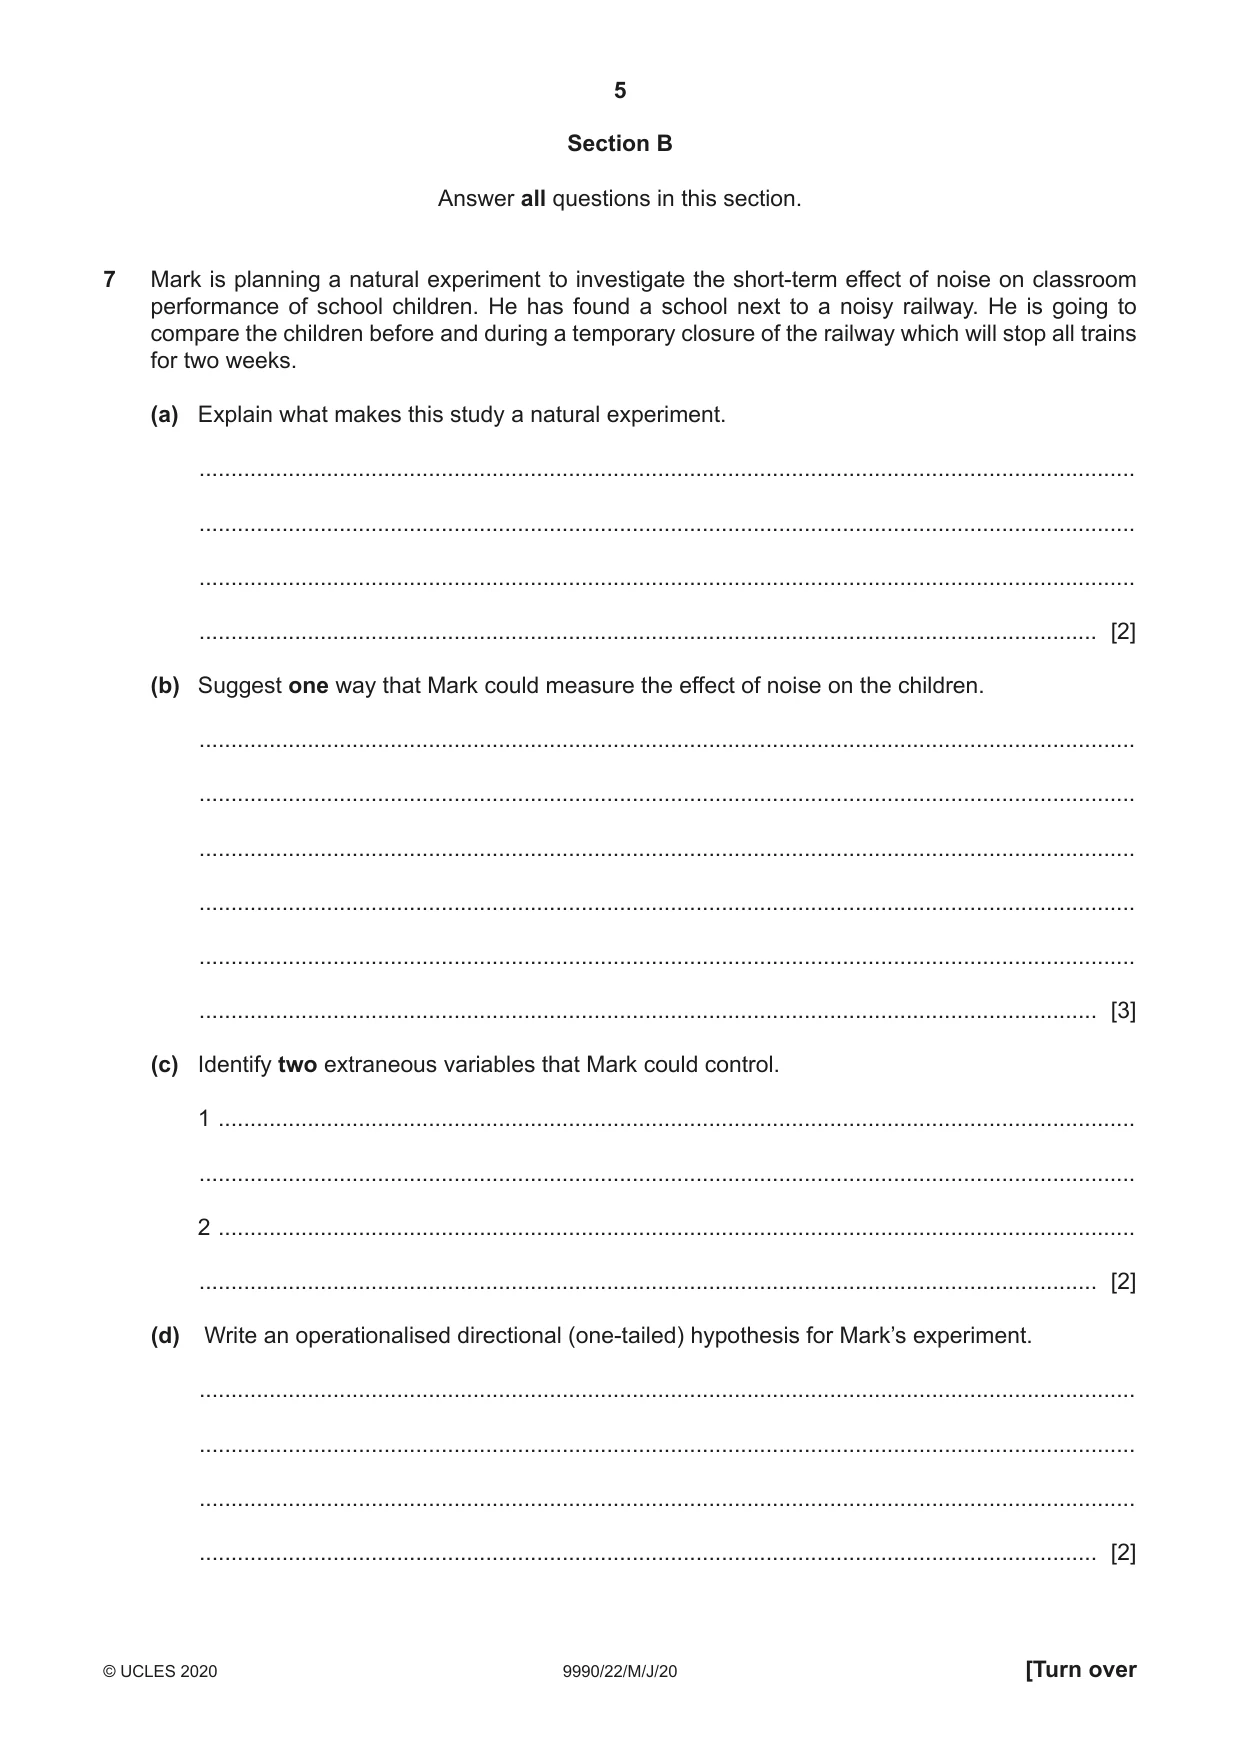
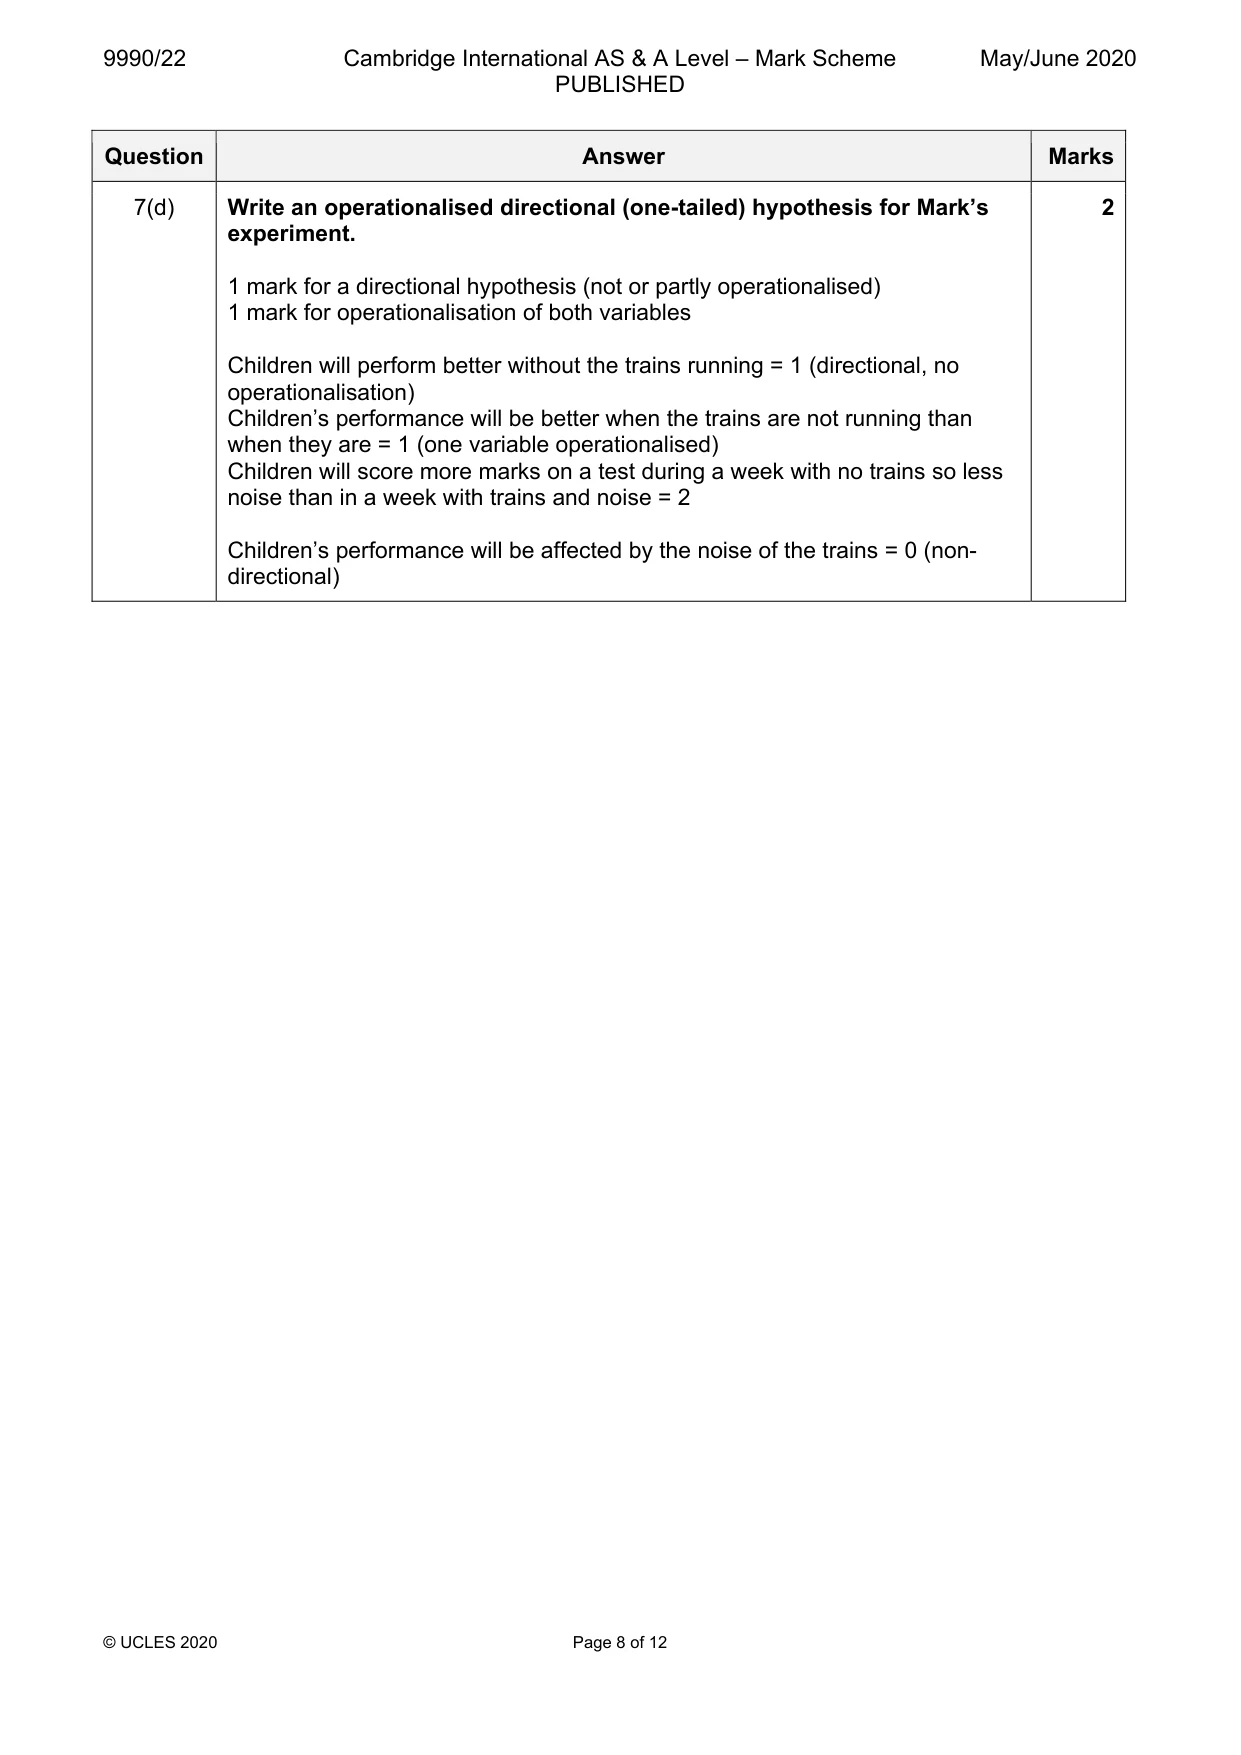
7 Mark is planning a natural experiment to investigate the short-term effect of noise on classroom performance of school children. He has found a school next to a noisy railway. He is going to compare the children before and during a temporary closure of the railway which will stop all trains for two weeks. (a) Explain what makes this study a natural experiment. ................................................................................................................................................... ................................................................................................................................................... ................................................................................................................................................... ............................................................................................................................................. [2] (b) Suggest one way that Mark could measure the effect of noise on the children. ................................................................................................................................................... ................................................................................................................................................... ................................................................................................................................................... ................................................................................................................................................... ................................................................................................................................................... ............................................................................................................................................. [3] (c) Identify two extraneous variables that Mark could control. 1 ................................................................................................................................................ ................................................................................................................................................... 2 ................................................................................................................................................ ............................................................................................................................................. [2] (d) Write an operationalised directional (one-tailed) hypothesis for Mark’s experiment. ................................................................................................................................................... ................................................................................................................................................... ................................................................................................................................................... ............................................................................................................................................. [2]
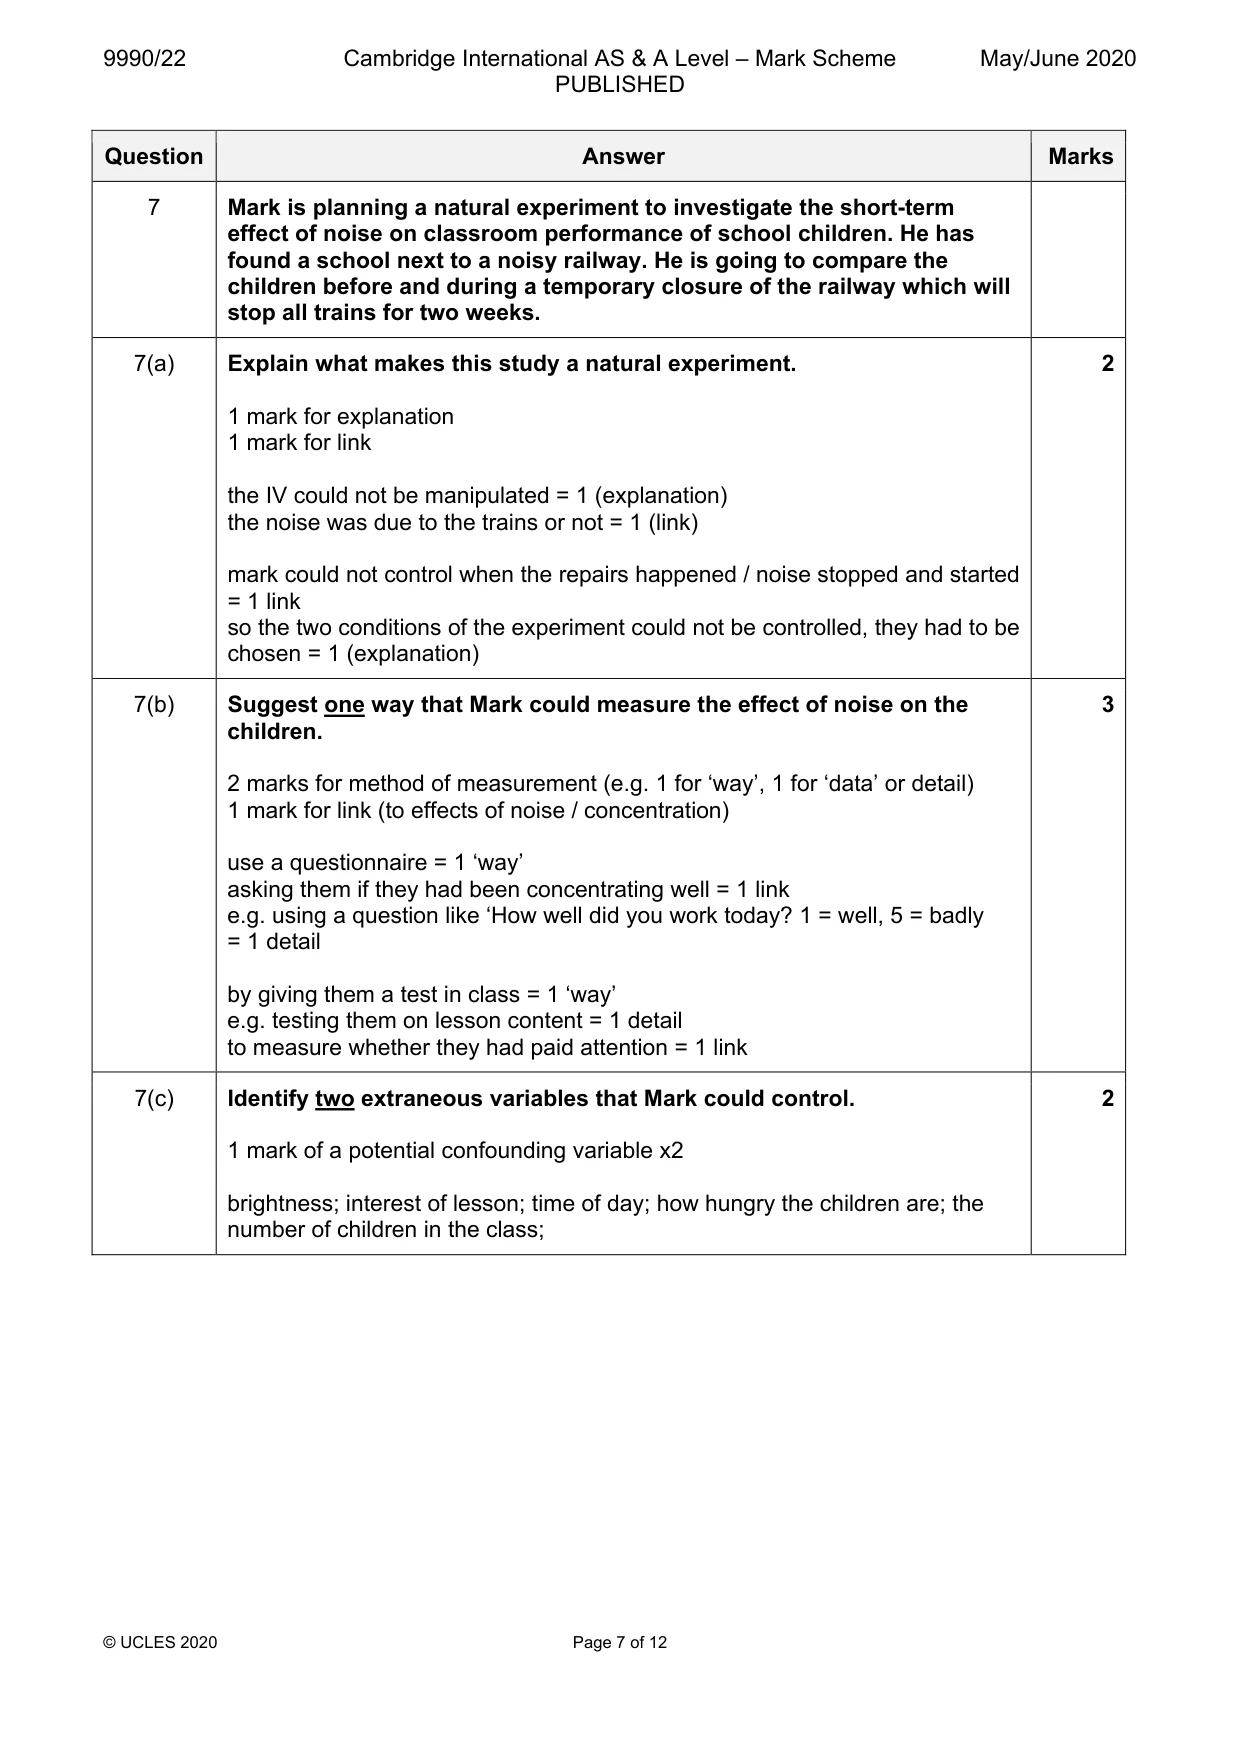
Mark scheme: 7 Mark is planning a natural experiment to investigate the short-term effect of noise on classroom performance of school children. He has found a school next to a noisy railway. He is going to compare the children before and during a temporary closure of the railway which will stop all trains for two weeks. 7(a) Explain what makes this study a natural experiment. 2 1 mark for explanation 1 mark for link the IV could not be manipulated = 1 (explanation) the noise was due to the trains or not = 1 (link) mark could not control when the repairs happened / noise stopped and started = 1 link so the two conditions of the experiment could not be controlled, they had to be chosen = 1 (explanation) 7(b) Suggest one way that Mark could measure the effect of noise on the 3 children. 2 marks for method of measurement (e.g. 1 for ‘way’, 1 for ‘data’ or detail) 1 mark for link (to effects of noise / concentration) use a questionnaire = 1 ‘way’ asking them if they had been concentrating well = 1 link e.g. using a question like ‘How well did you work today? 1 = well, 5 = badly = 1 detail by giving them a test in class = 1 ‘way’ e.g. testing them on lesson content = 1 detail to measure whether they had paid attention = 1 link 7(c) Identify two extraneous variables that Mark could control. 2 1 mark of a potential confounding variable x2 brightness; interest of lesson; time of day; how hungry the children are; the number of children in the class; 7(d) Write an operationalised directional (one-tailed) hypothesis for Mark’s 2 experiment. 1 mark for a directional hypothesis (not or partly operationalised) 1 mark for operationalisation of both variables Children will perform better without the trains running = 1 (directional, no operationalisation) Children’s performance will be better when the trains are not running than when they are = 1 (one variable operationalised) Children will score more marks on a test during a week with no trains so less noise than in a week with trains and noise = 2 Children’s performance will be affected by the noise of the trains = 0 (non- directional)
Q8 · Rachel is correlating two variables: helping behaviour and communication skills
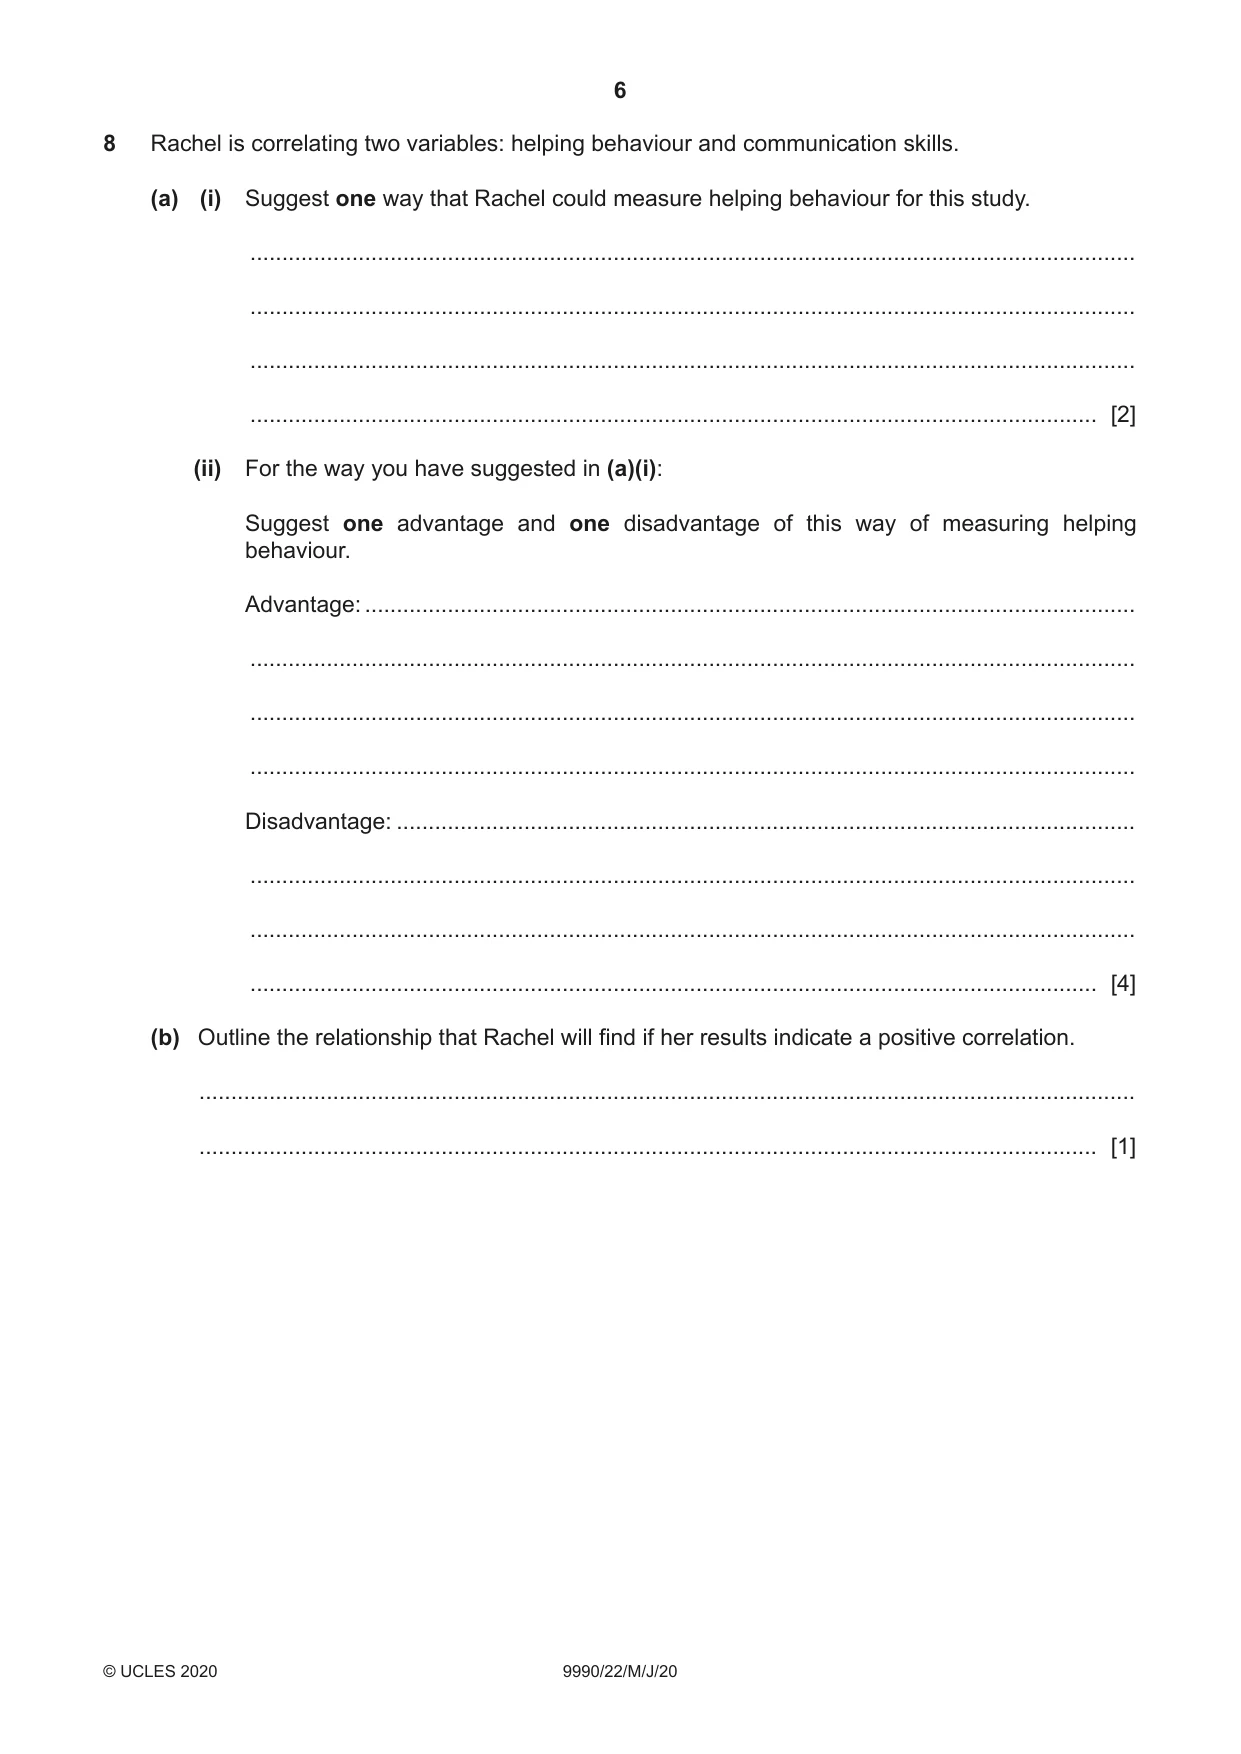
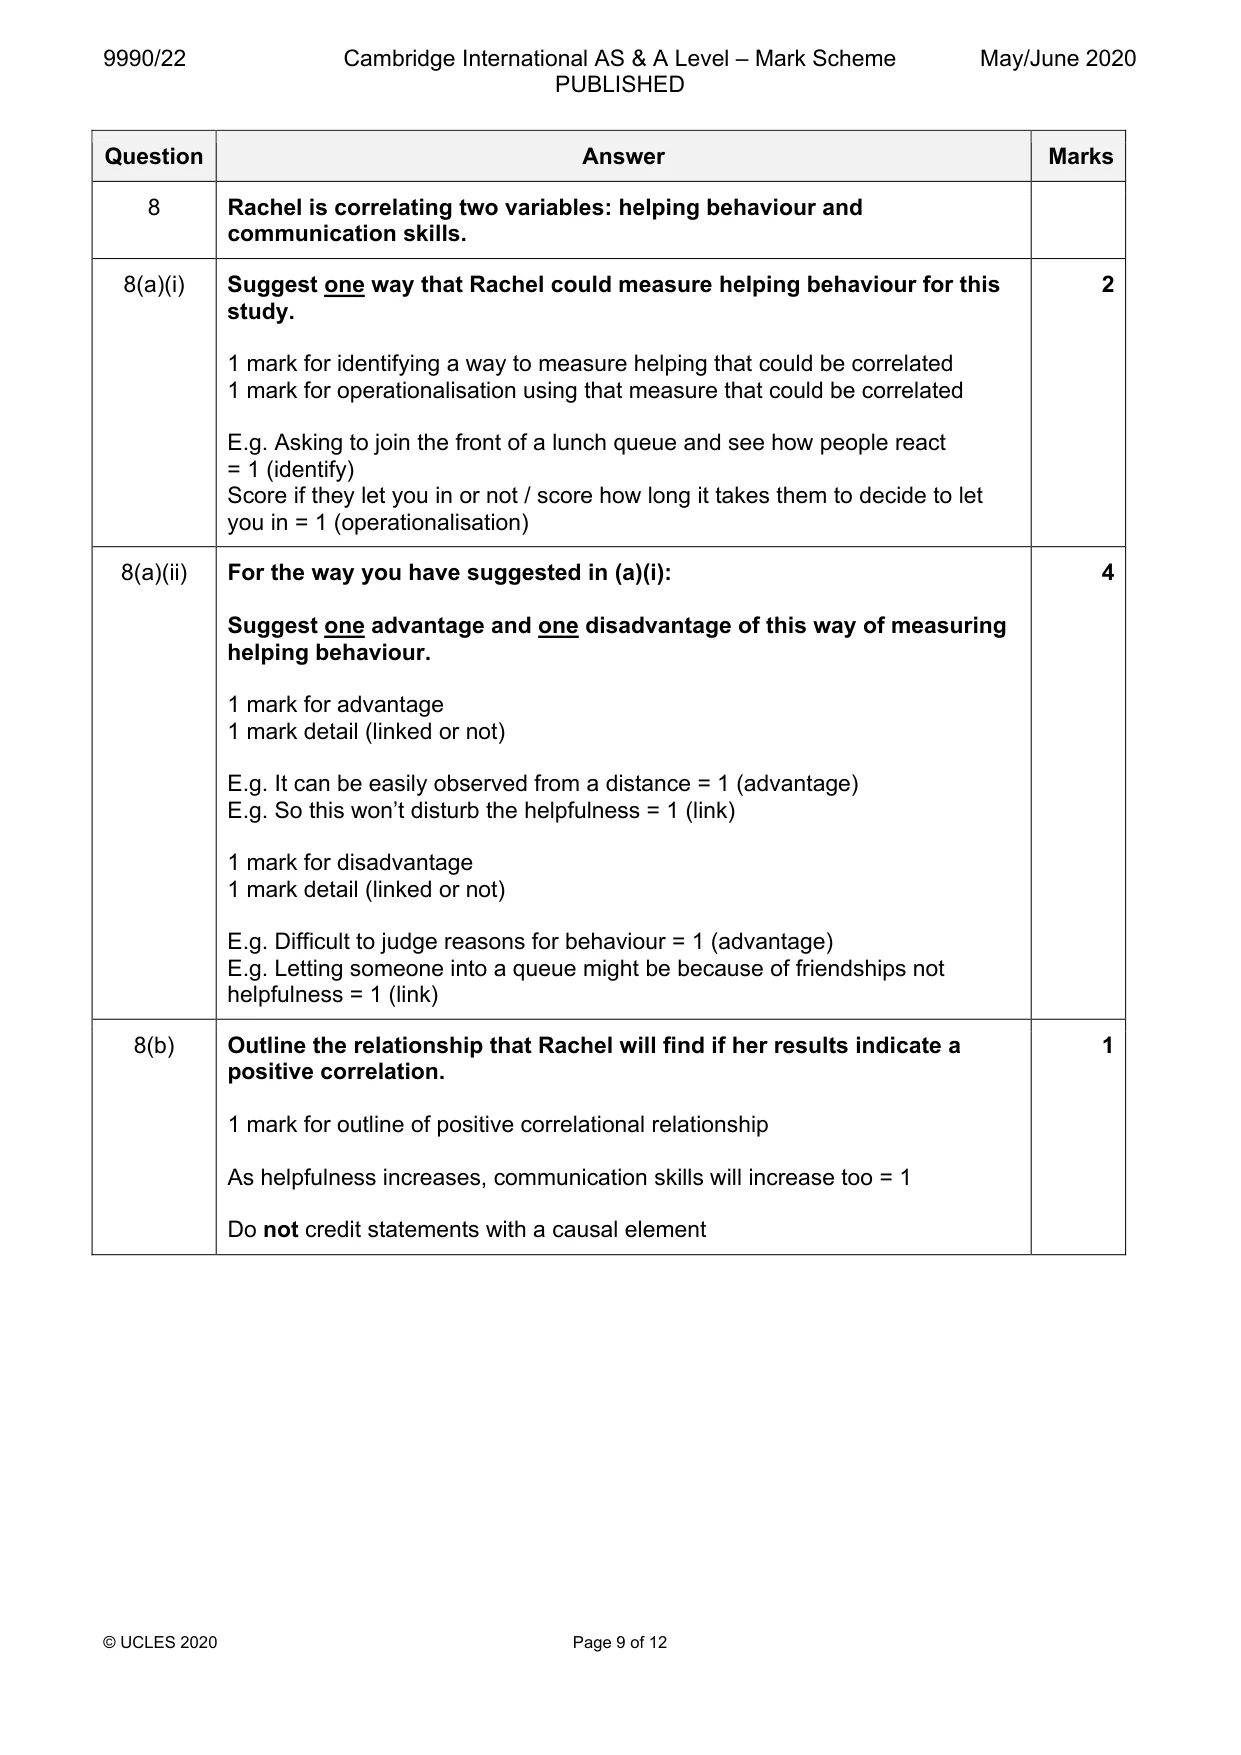
8 Rachel is correlating two variables: helping behaviour and communication skills. (a) (i) Suggest one way that Rachel could measure helping behaviour for this study. ........................................................................................................................................... ........................................................................................................................................... ........................................................................................................................................... ..................................................................................................................................... [2] (ii) For the way you have suggested in (a)(i): Suggest one advantage and one disadvantage of this way of measuring helping behaviour. Advantage: ......................................................................................................................... ........................................................................................................................................... ........................................................................................................................................... ........................................................................................................................................... Disadvantage: .................................................................................................................... ........................................................................................................................................... ........................................................................................................................................... ..................................................................................................................................... [4] (b) Outline the relationship that Rachel will find if her results indicate a positive correlation. ................................................................................................................................................... ............................................................................................................................................. [1]
Mark scheme: 8 Rachel is correlating two variables: helping behaviour and communication skills. 8(a)(i) Suggest one way that Rachel could measure helping behaviour for this 2 study. 1 mark for identifying a way to measure helping that could be correlated 1 mark for operationalisation using that measure that could be correlated E.g. Asking to join the front of a lunch queue and see how people react = 1 (identify) Score if they let you in or not / score how long it takes them to decide to let you in = 1 (operationalisation) 8(a)(ii) For the way you have suggested in (a)(i): 4 Suggest one advantage and one disadvantage of this way of measuring helping behaviour. 1 mark for advantage 1 mark detail (linked or not) E.g. It can be easily observed from a distance = 1 (advantage) E.g. So this won’t disturb the helpfulness = 1 (link) 1 mark for disadvantage 1 mark detail (linked or not) E.g. Difficult to judge reasons for behaviour = 1 (advantage) E.g. Letting someone into a queue might be because of friendships not helpfulness = 1 (link) 8(b) Outline the relationship that Rachel will find if her results indicate a 1 positive correlation. 1 mark for outline of positive correlational relationship As helpfulness increases, communication skills will increase too = 1 Do not credit statements with a causal element
Q9 · Perry has collected data about intelligence
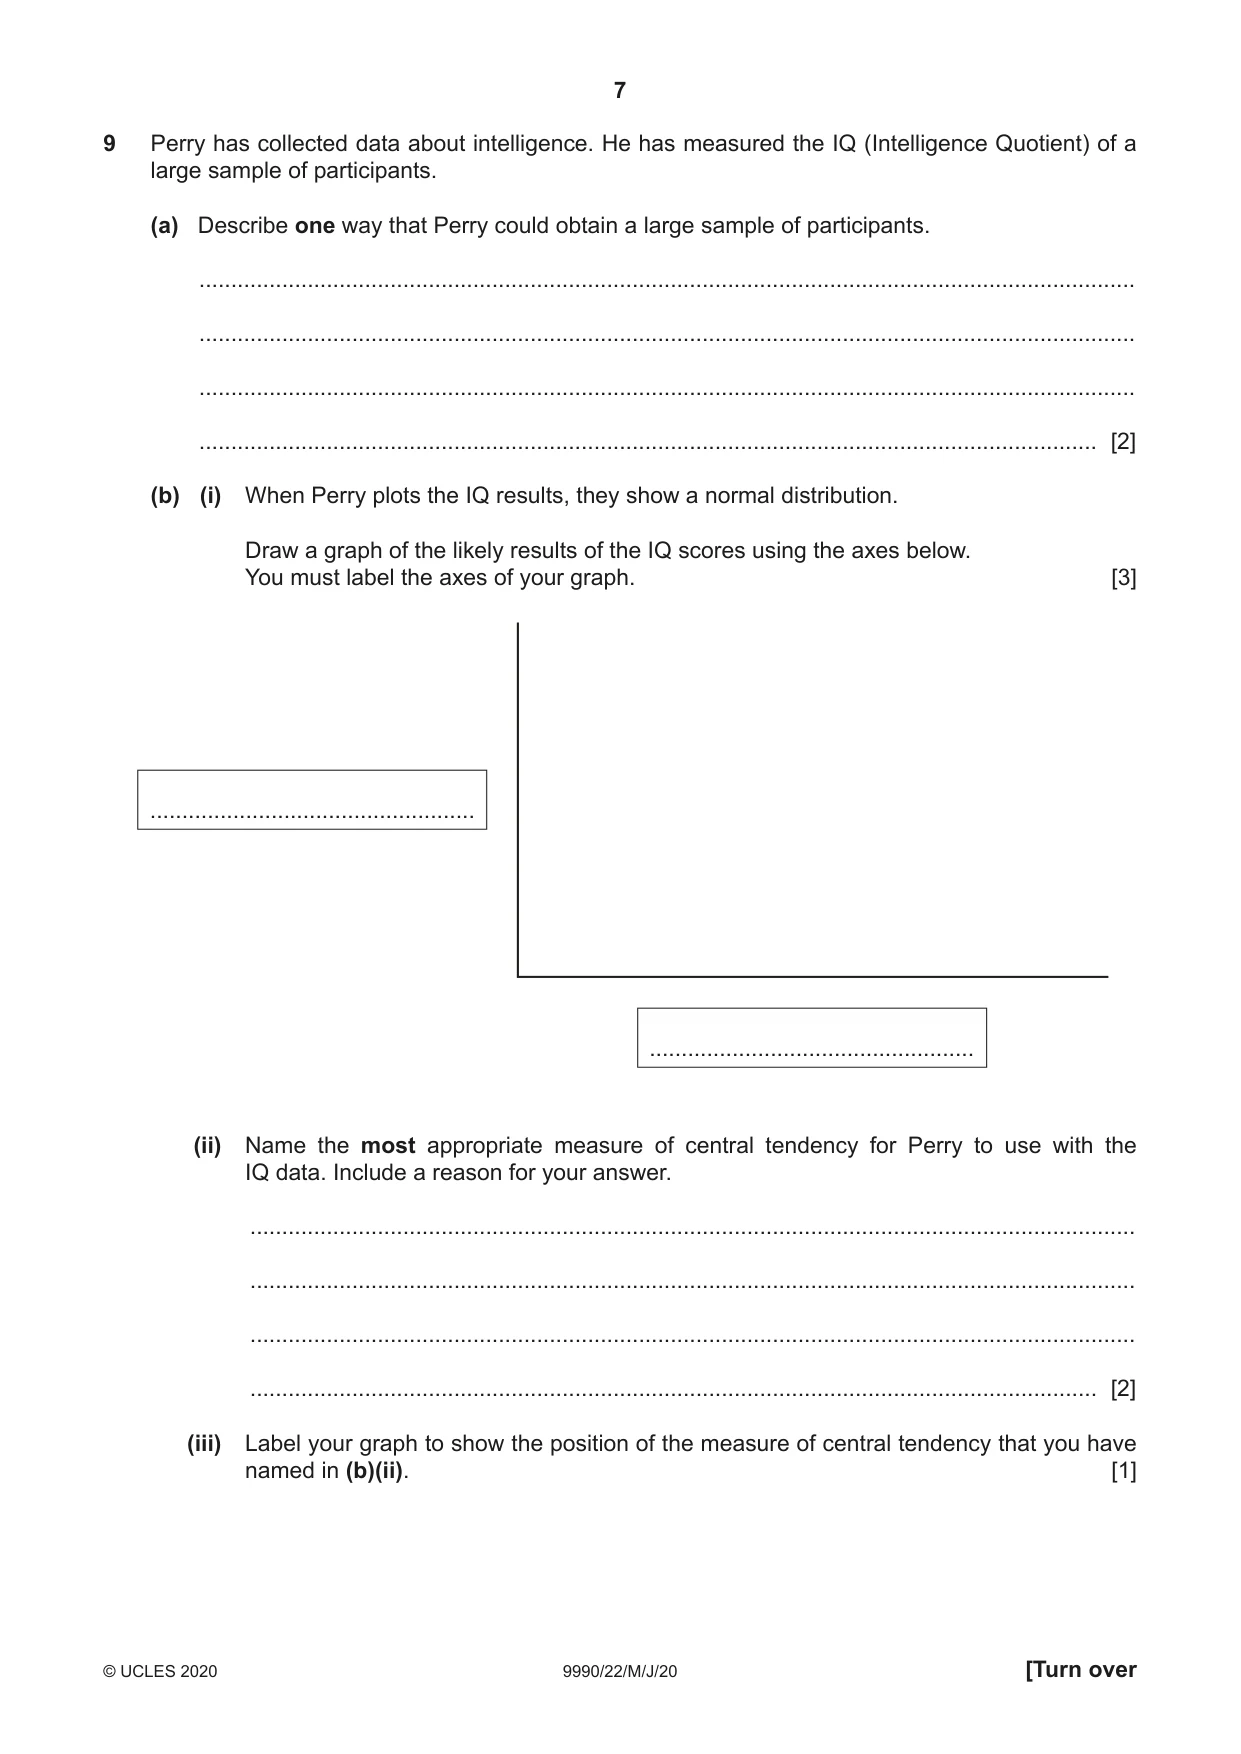
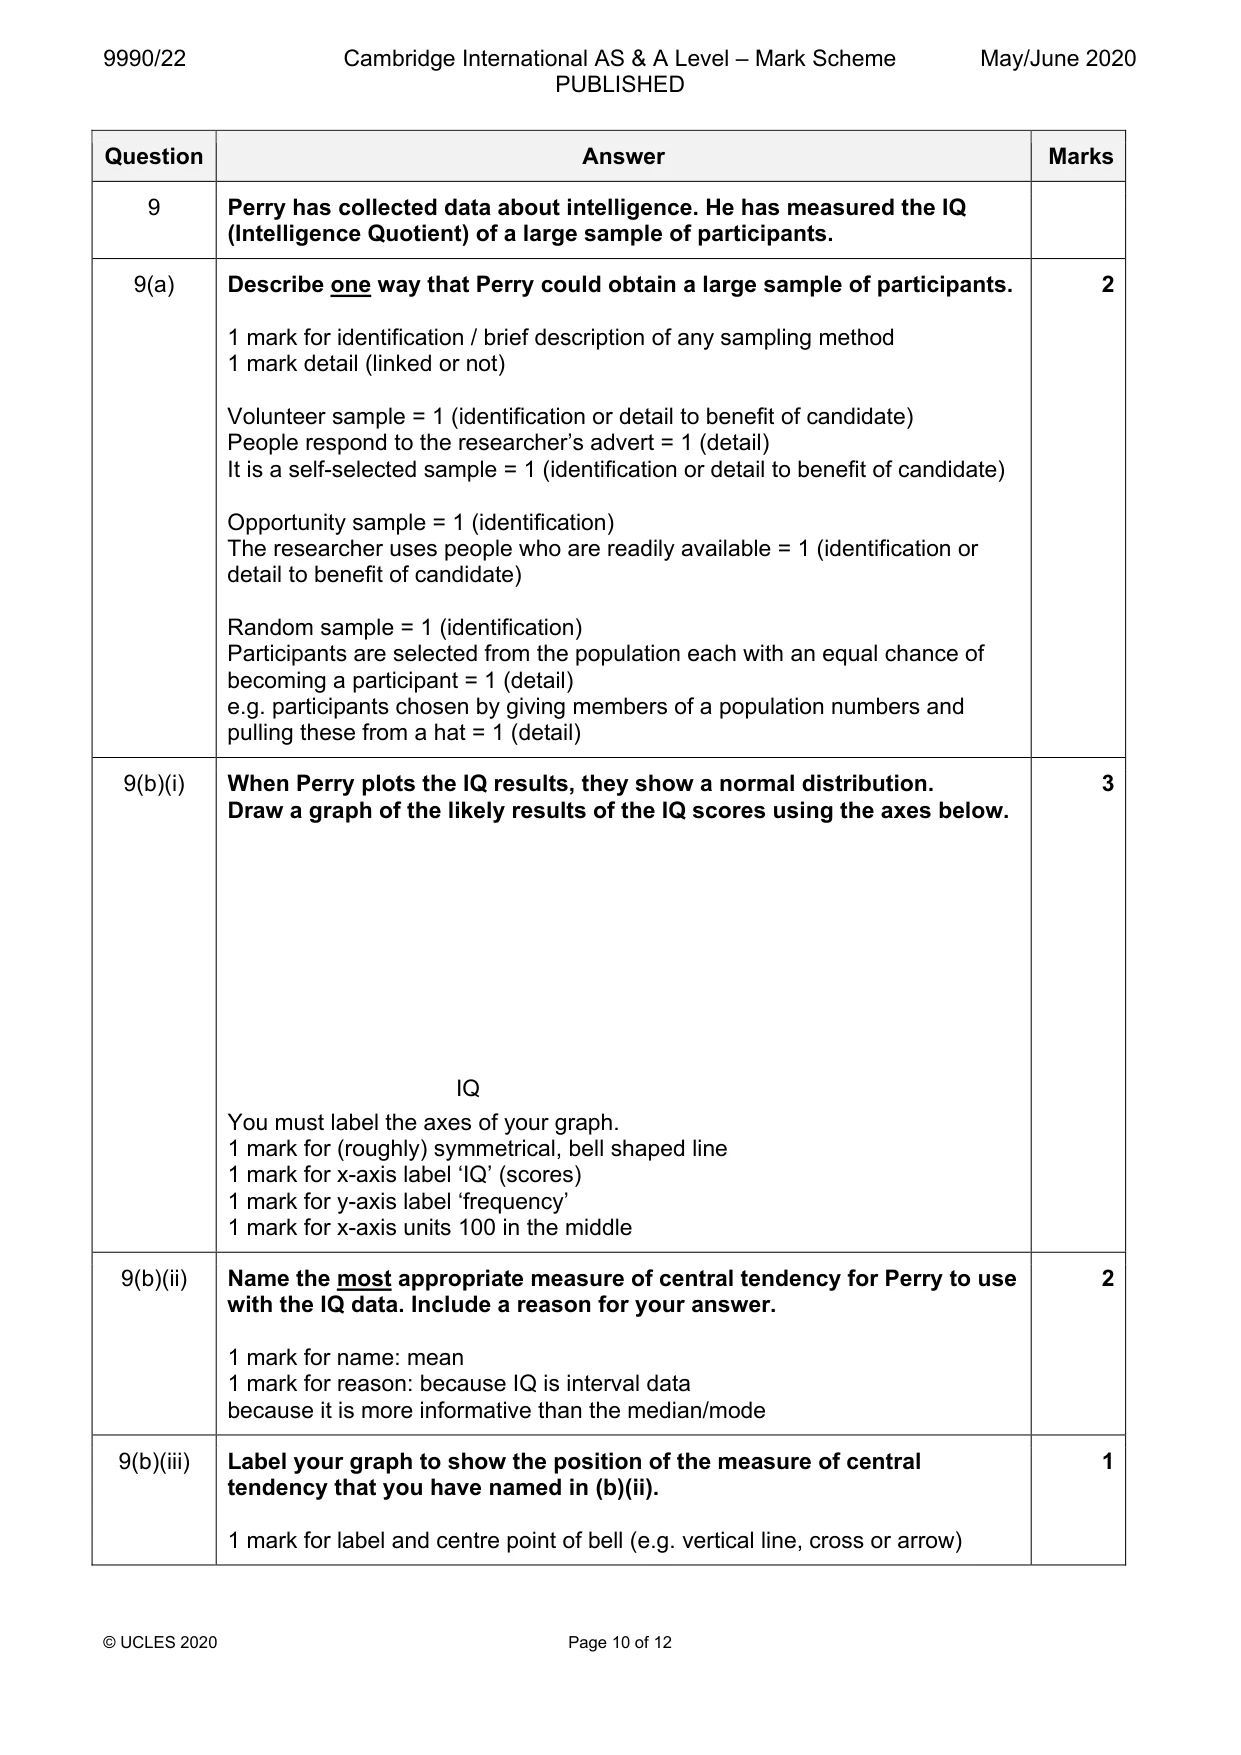
9 Perry has collected data about intelligence. He has measured the IQ (Intelligence Quotient) of a large sample of participants. (a) Describe one way that Perry could obtain a large sample of participants. ................................................................................................................................................... ................................................................................................................................................... ................................................................................................................................................... ............................................................................................................................................. [2] (b) (i) When Perry plots the IQ results, they show a normal distribution. Draw a graph of the likely results of the IQ scores using the axes below. You must label the axes of your graph. [3] ................................................... ................................................... (ii) Name the most appropriate measure of central tendency for Perry to use with the IQ data. Include a reason for your answer. ........................................................................................................................................... ........................................................................................................................................... ........................................................................................................................................... ..................................................................................................................................... [2] (iii) Label your graph to show the position of the measure of central tendency that you have named in (b)(ii). [1] Section C Answer all questions in this section.
Mark scheme: 9 Perry has collected data about intelligence. He has measured the IQ (Intelligence Quotient) of a large sample of participants. 9(a) Describe one way that Perry could obtain a large sample of participants. 2 1 mark for identification / brief description of any sampling method 1 mark detail (linked or not) Volunteer sample = 1 (identification or detail to benefit of candidate) People respond to the researcher’s advert = 1 (detail) It is a self-selected sample = 1 (identification or detail to benefit of candidate) Opportunity sample = 1 (identification) The researcher uses people who are readily available = 1 (identification or detail to benefit of candidate) Random sample = 1 (identification) Participants are selected from the population each with an equal chance of becoming a participant = 1 (detail) e.g. participants chosen by giving members of a population numbers and pulling these from a hat = 1 (detail) 9(b)(i) When Perry plots the IQ results, they show a normal distribution. 3 Draw a graph of the likely results of the IQ scores using the axes below. IQ You must label the axes of your graph. 1 mark for (roughly) symmetrical, bell shaped line 1 mark for x-axis label ‘IQ’ (scores) 1 mark for y-axis label ‘frequency’ 1 mark for x-axis units 100 in the middle 9(b)(ii) Name the most appropriate measure of central tendency for Perry to use 2 with the IQ data. Include a reason for your answer. 1 mark for name: mean 1 mark for reason: because IQ is interval data because it is more informative than the median/mode 9(b)(iii) Label your graph to show the position of the measure of central 1 tendency that you have named in (b)(ii). 1 mark for label and centre point of bell (e.g. vertical line, cross or arrow)
Q10 · Cecil is studying a family
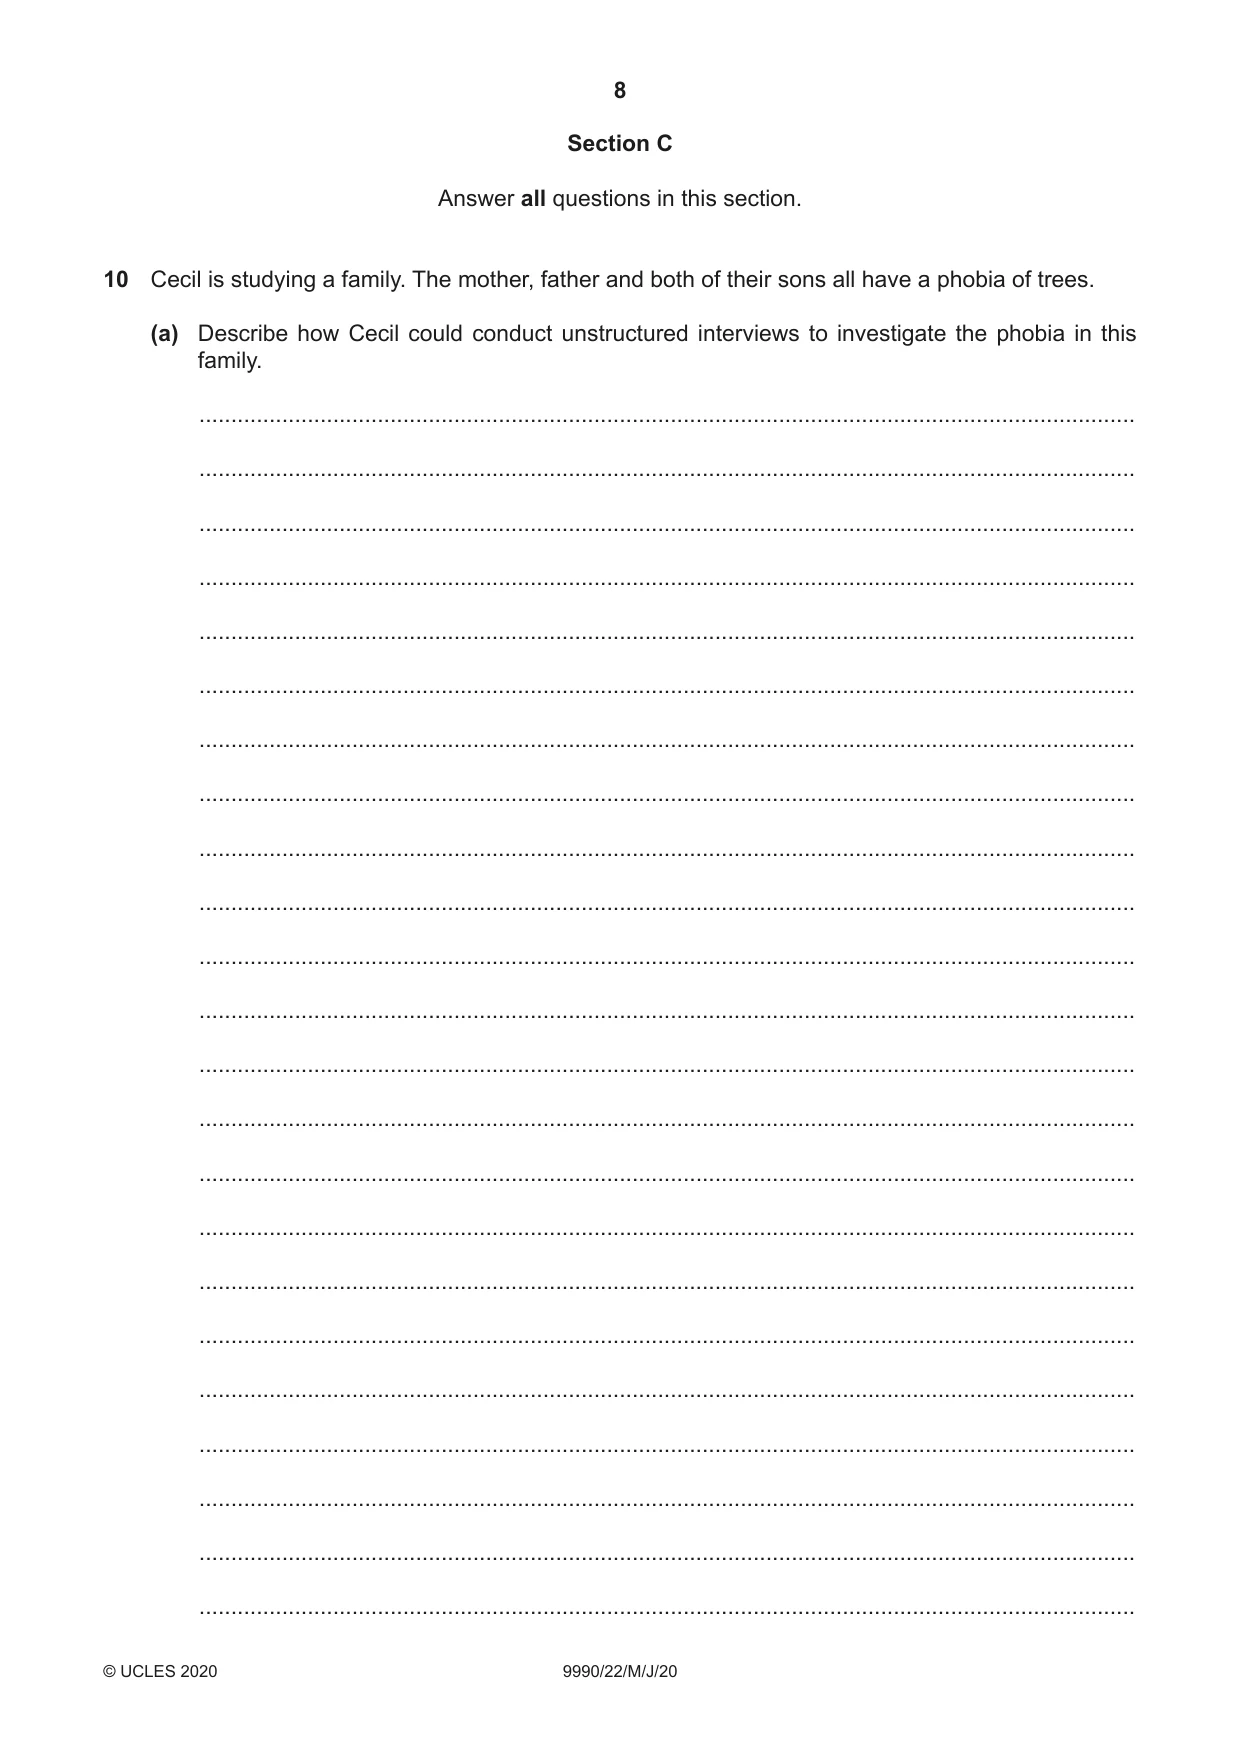
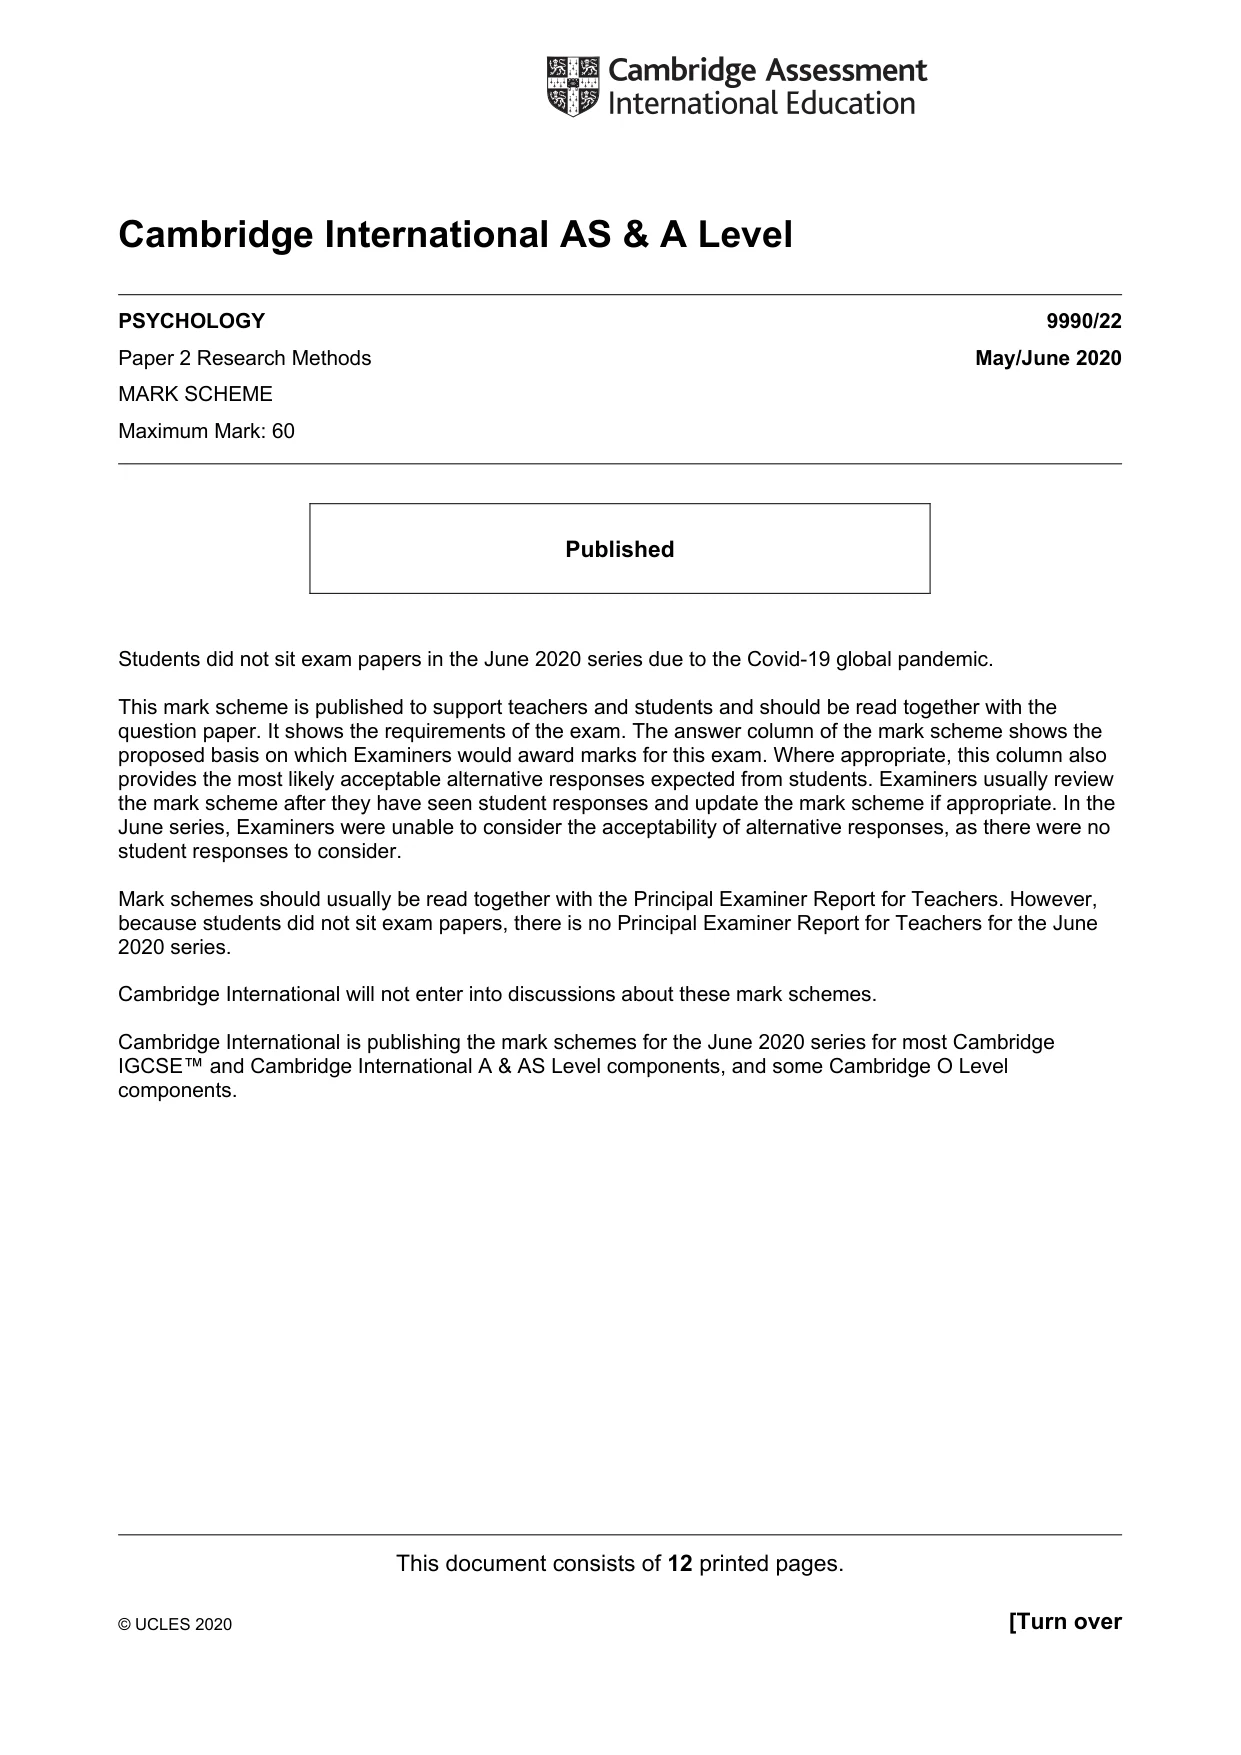
10 Cecil is studying a family. The mother, father and both of their sons all have a phobia of trees. (a) Describe how Cecil could conduct unstructured interviews to investigate the phobia in this family. ................................................................................................................................................... ................................................................................................................................................... ................................................................................................................................................... ................................................................................................................................................... ................................................................................................................................................... ................................................................................................................................................... ................................................................................................................................................... ................................................................................................................................................... ................................................................................................................................................... ................................................................................................................................................... ................................................................................................................................................... ................................................................................................................................................... ................................................................................................................................................... ................................................................................................................................................... ................................................................................................................................................... ................................................................................................................................................... ................................................................................................................................................... ................................................................................................................................................... ................................................................................................................................................... ................................................................................................................................................... ................................................................................................................................................... ................................................................................................................................................... ................................................................................................................................................... ................................................................................................................................................... ................................................................................................................................................... ................................................................................................................................................... ................................................................................................................................................... ................................................................................................................................................... ................................................................................................................................................... ................................................................................................................................................... ................................................................................................................................................... ................................................................................................................................................... ................................................................................................................................................... ................................................................................................................................................... ................................................................................................................................................... ................................................................................................................................................... ........................................................................................................................................... [10] (b) Identify one practical weakness/limitation with the procedure you have described in your answer to part (a) and suggest how your study might be done differently to overcome the problem. Do not refer to ethics or sampling in your answer. ................................................................................................................................................... ................................................................................................................................................... ................................................................................................................................................... ................................................................................................................................................... ................................................................................................................................................... ................................................................................................................................................... ................................................................................................................................................... ............................................................................................................................................. [4]
More questions on Anxiety disorders and fear-related disorders
What was in this paper
The subtopics covered by these 10 questions, and how many questions each got. Open one in a new tab to see every Cambridge question on it.