Cambridge A Level Geography 9696 — 2025 Oct/Nov Paper 2 · Variant 3
9696/23/O/N/25 · 6 questions · 60 marks · ≈68 min
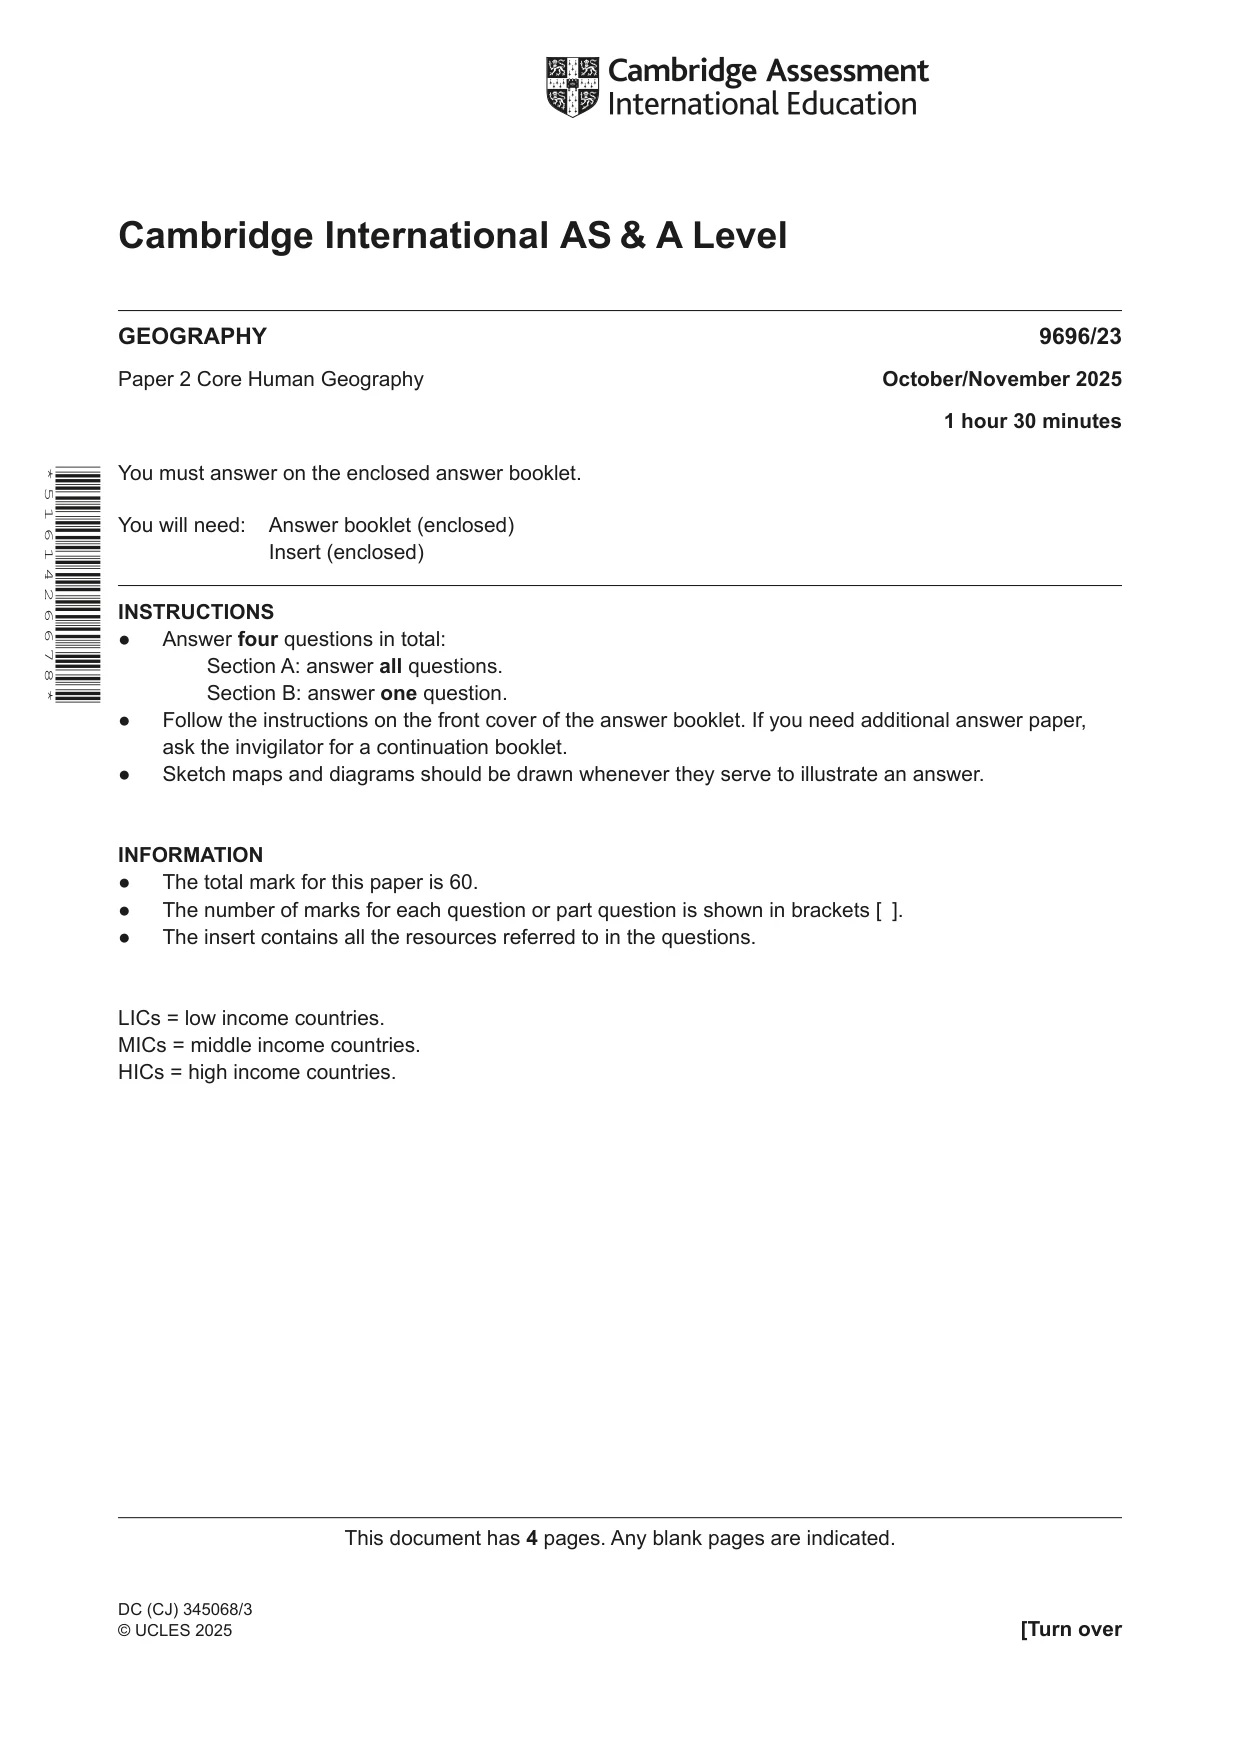
The question paper and its mark scheme, free to read here and free to download. This is Cambridge’s own paper, exactly as it was sat.
Question paper4 pages
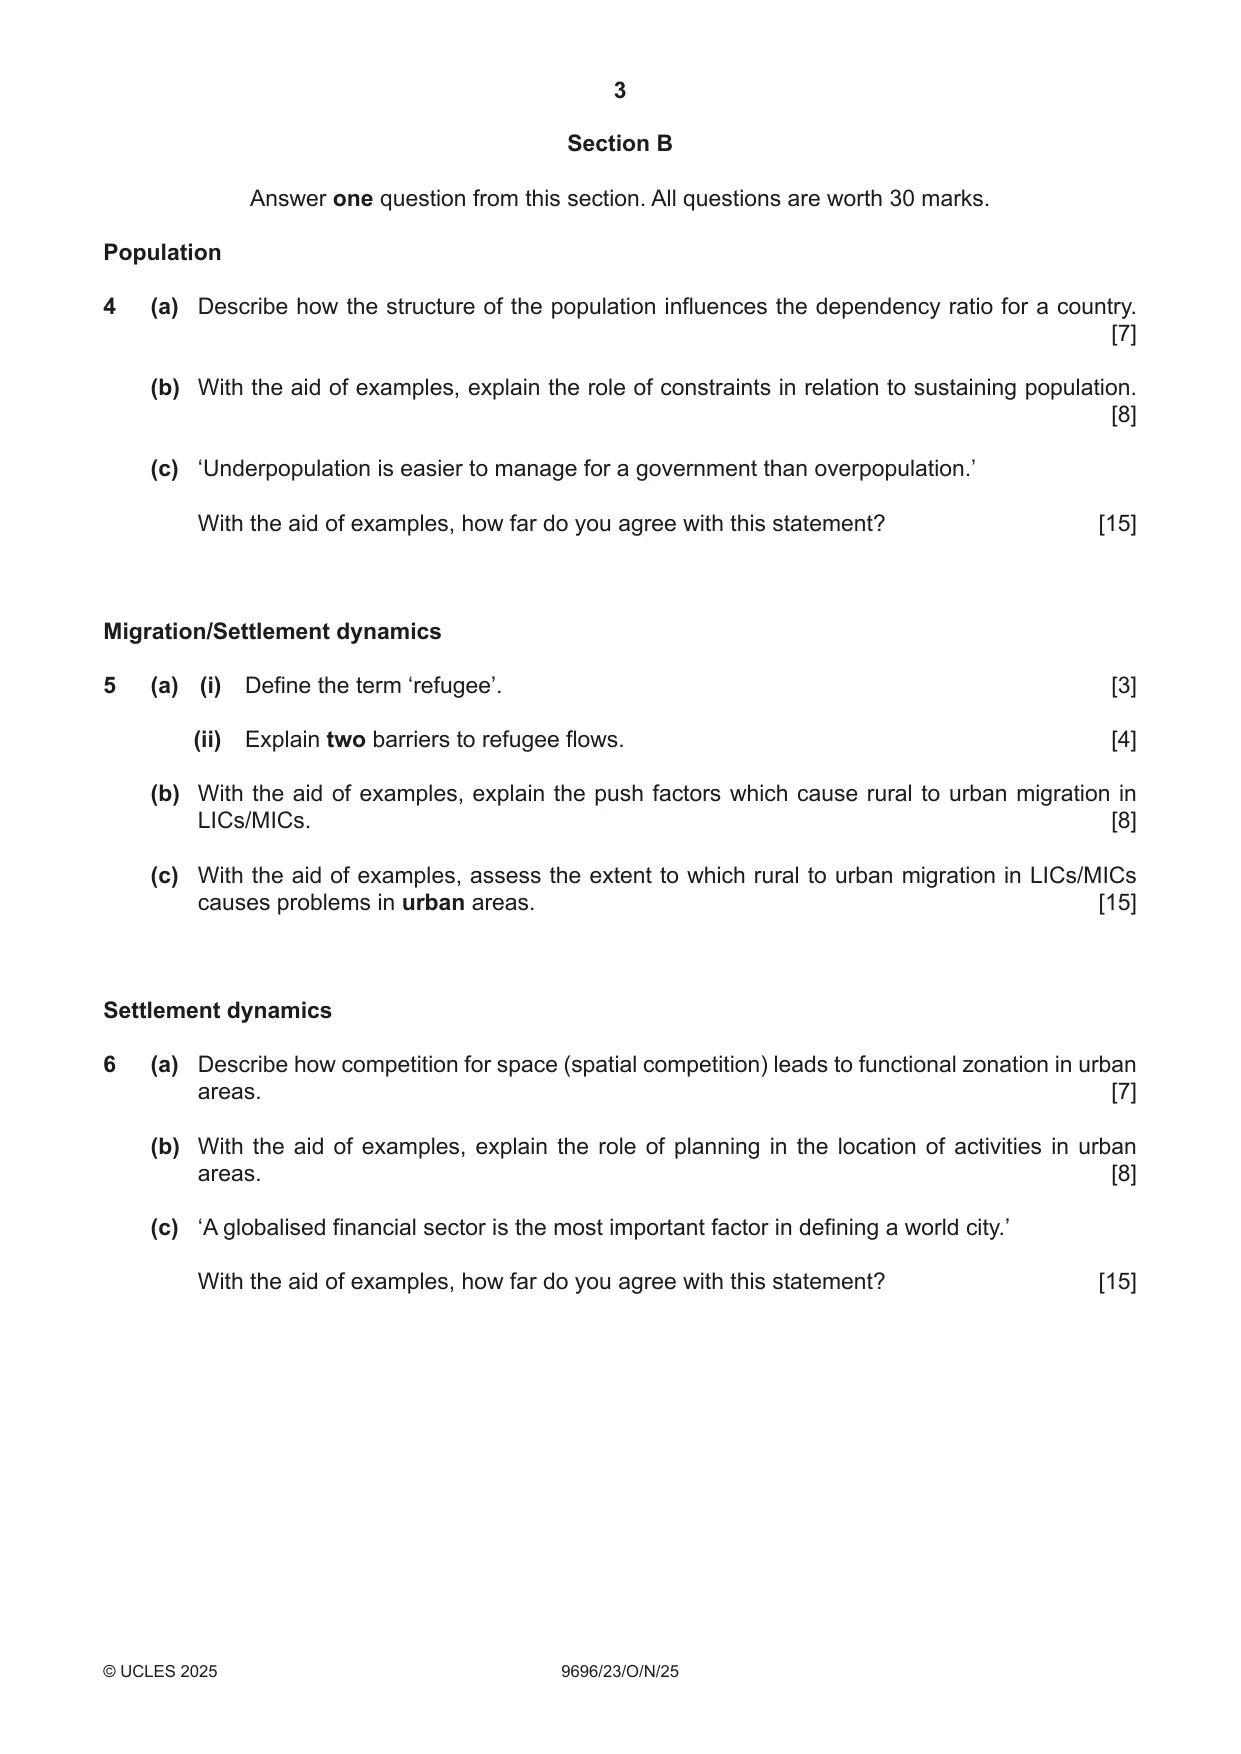

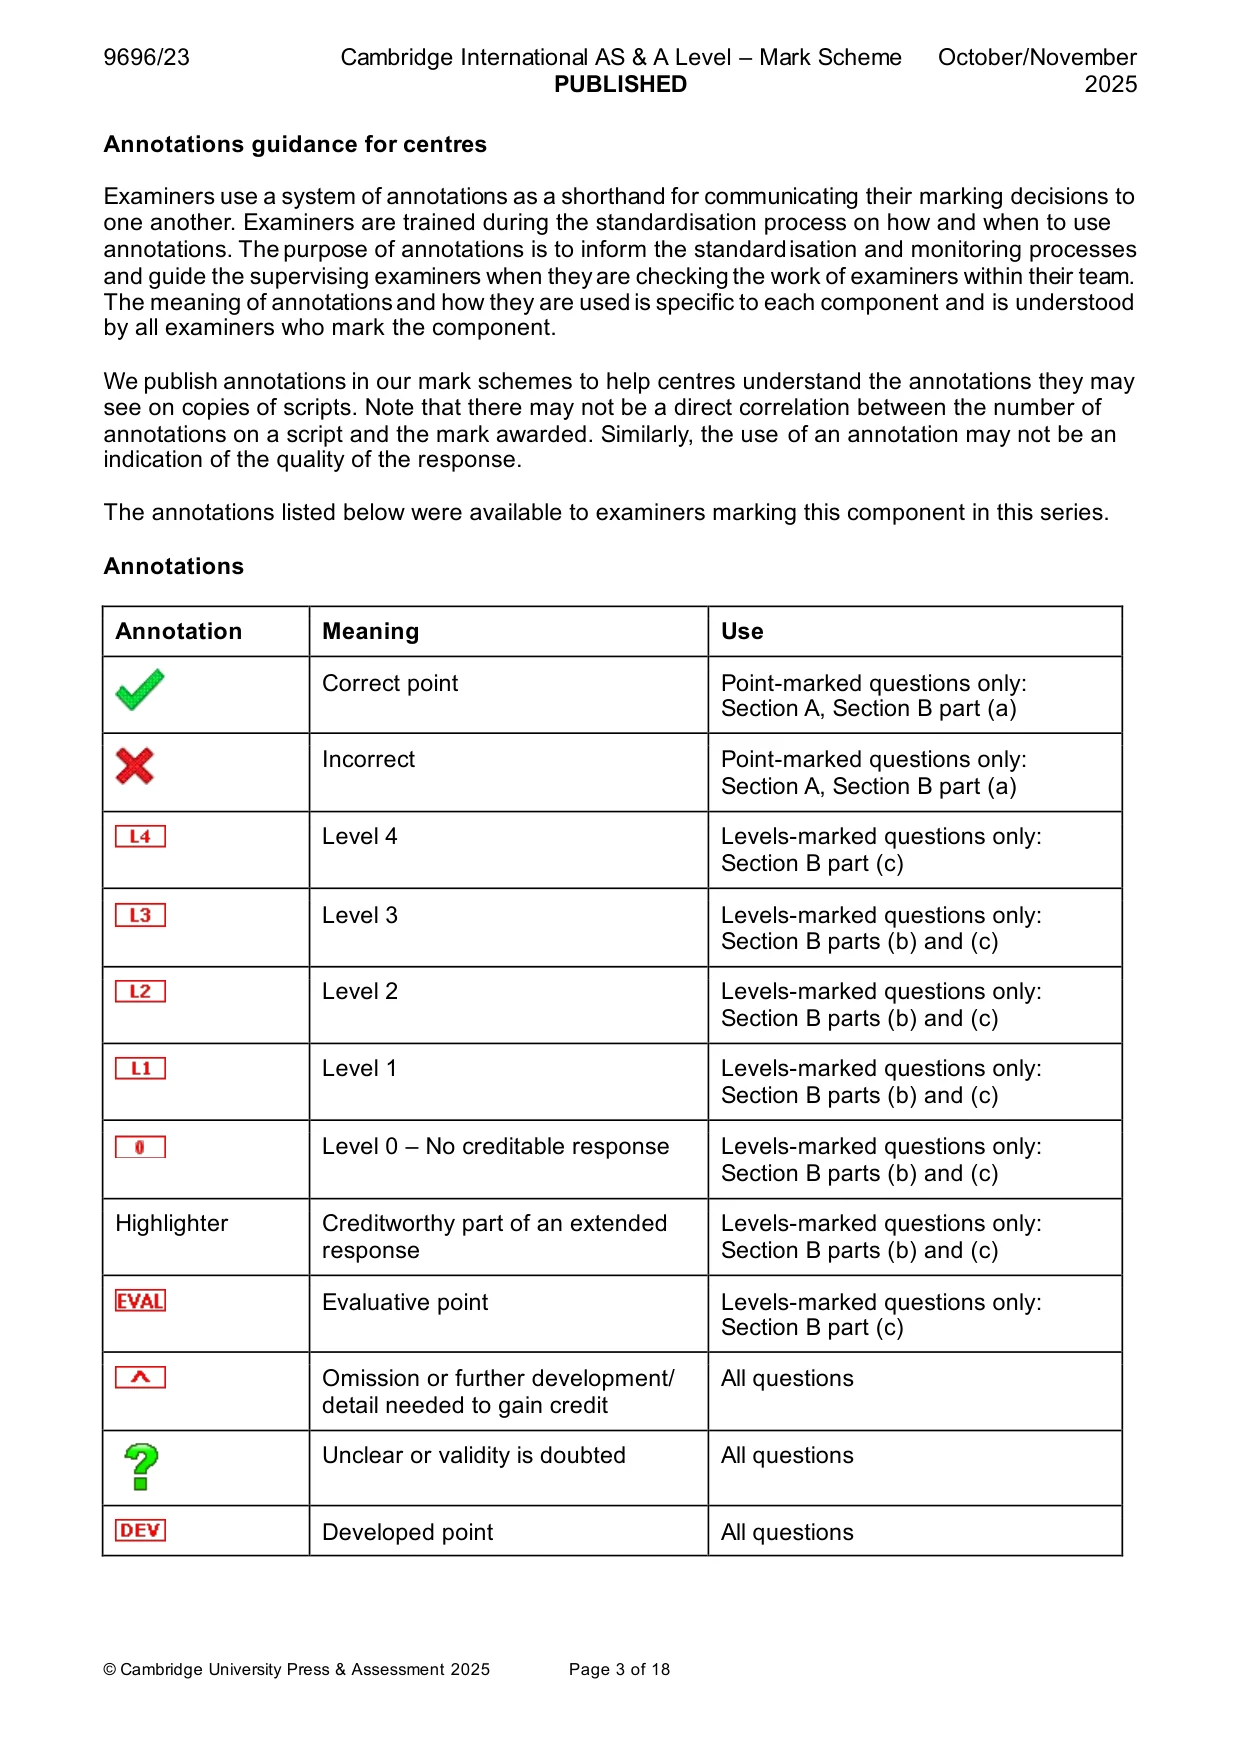
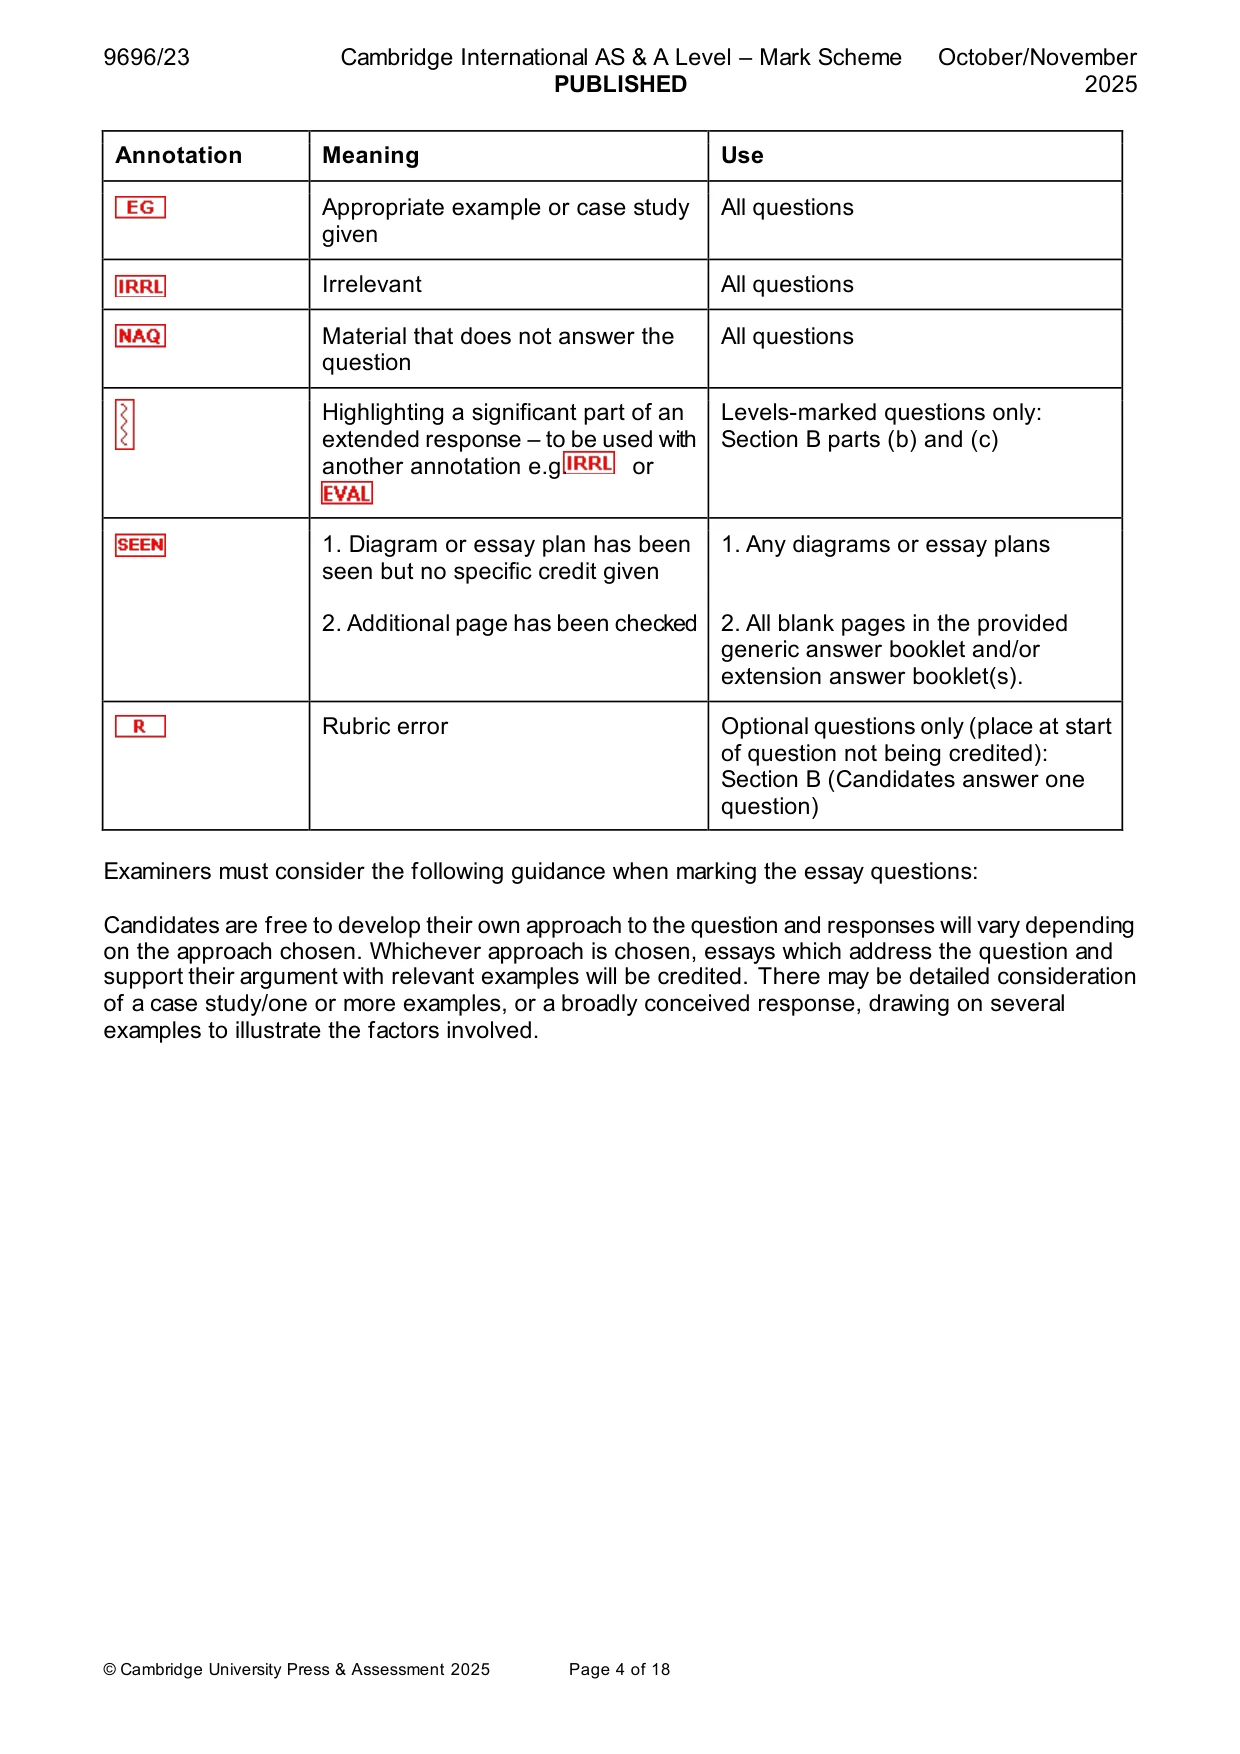
Mark scheme18 pages
Answers below. Sit the paper first if you are practising.

Questions as text
Q1 · The relationship between life expectancy and healthcare expenditure per capita, by…
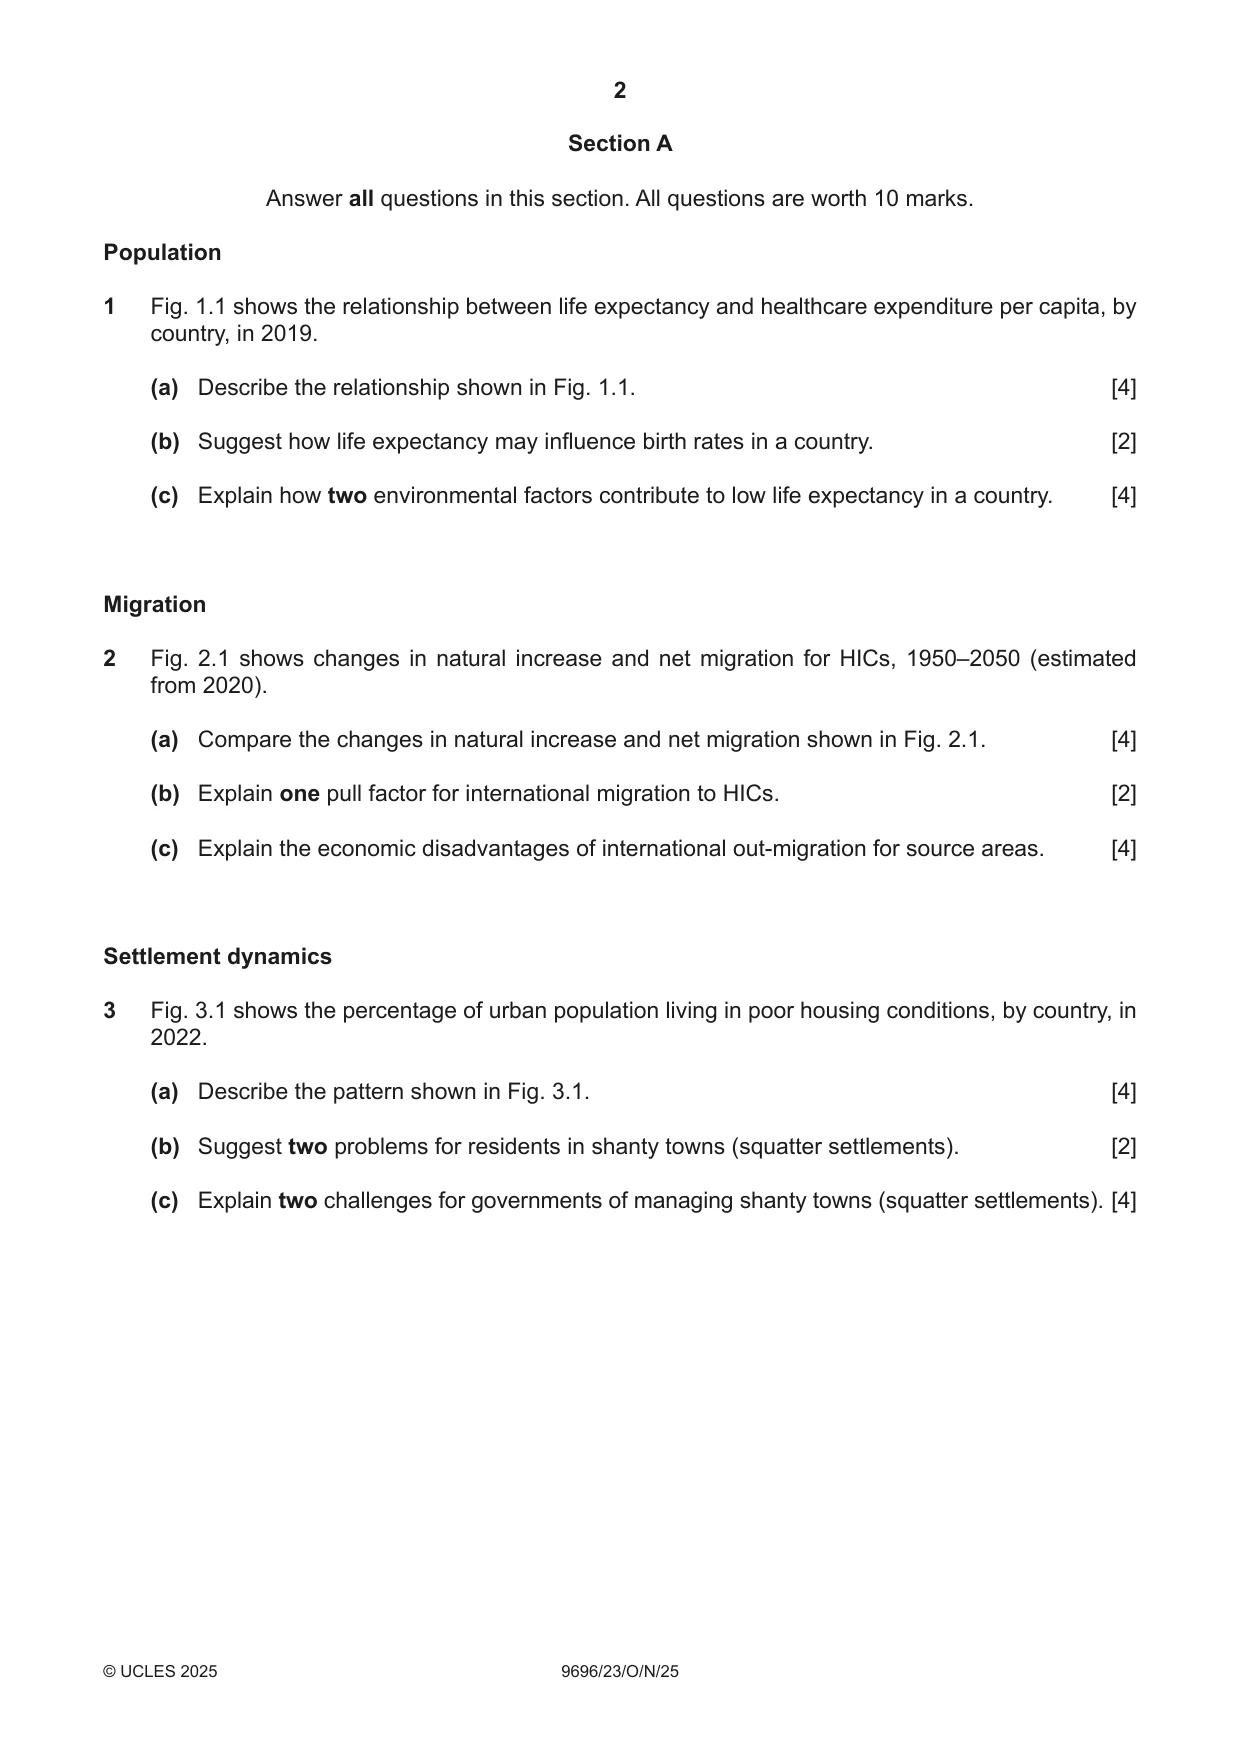
1 Fig. 1.1 shows the relationship between life expectancy and healthcare expenditure per capita, by country, in 2019. (a) Describe the relationship shown in Fig. 1.1. [4] (b) Suggest how life expectancy may influence birth rates in a country. [2] (c) Explain how two environmental factors contribute to low life expectancy in a country. [4] Migration
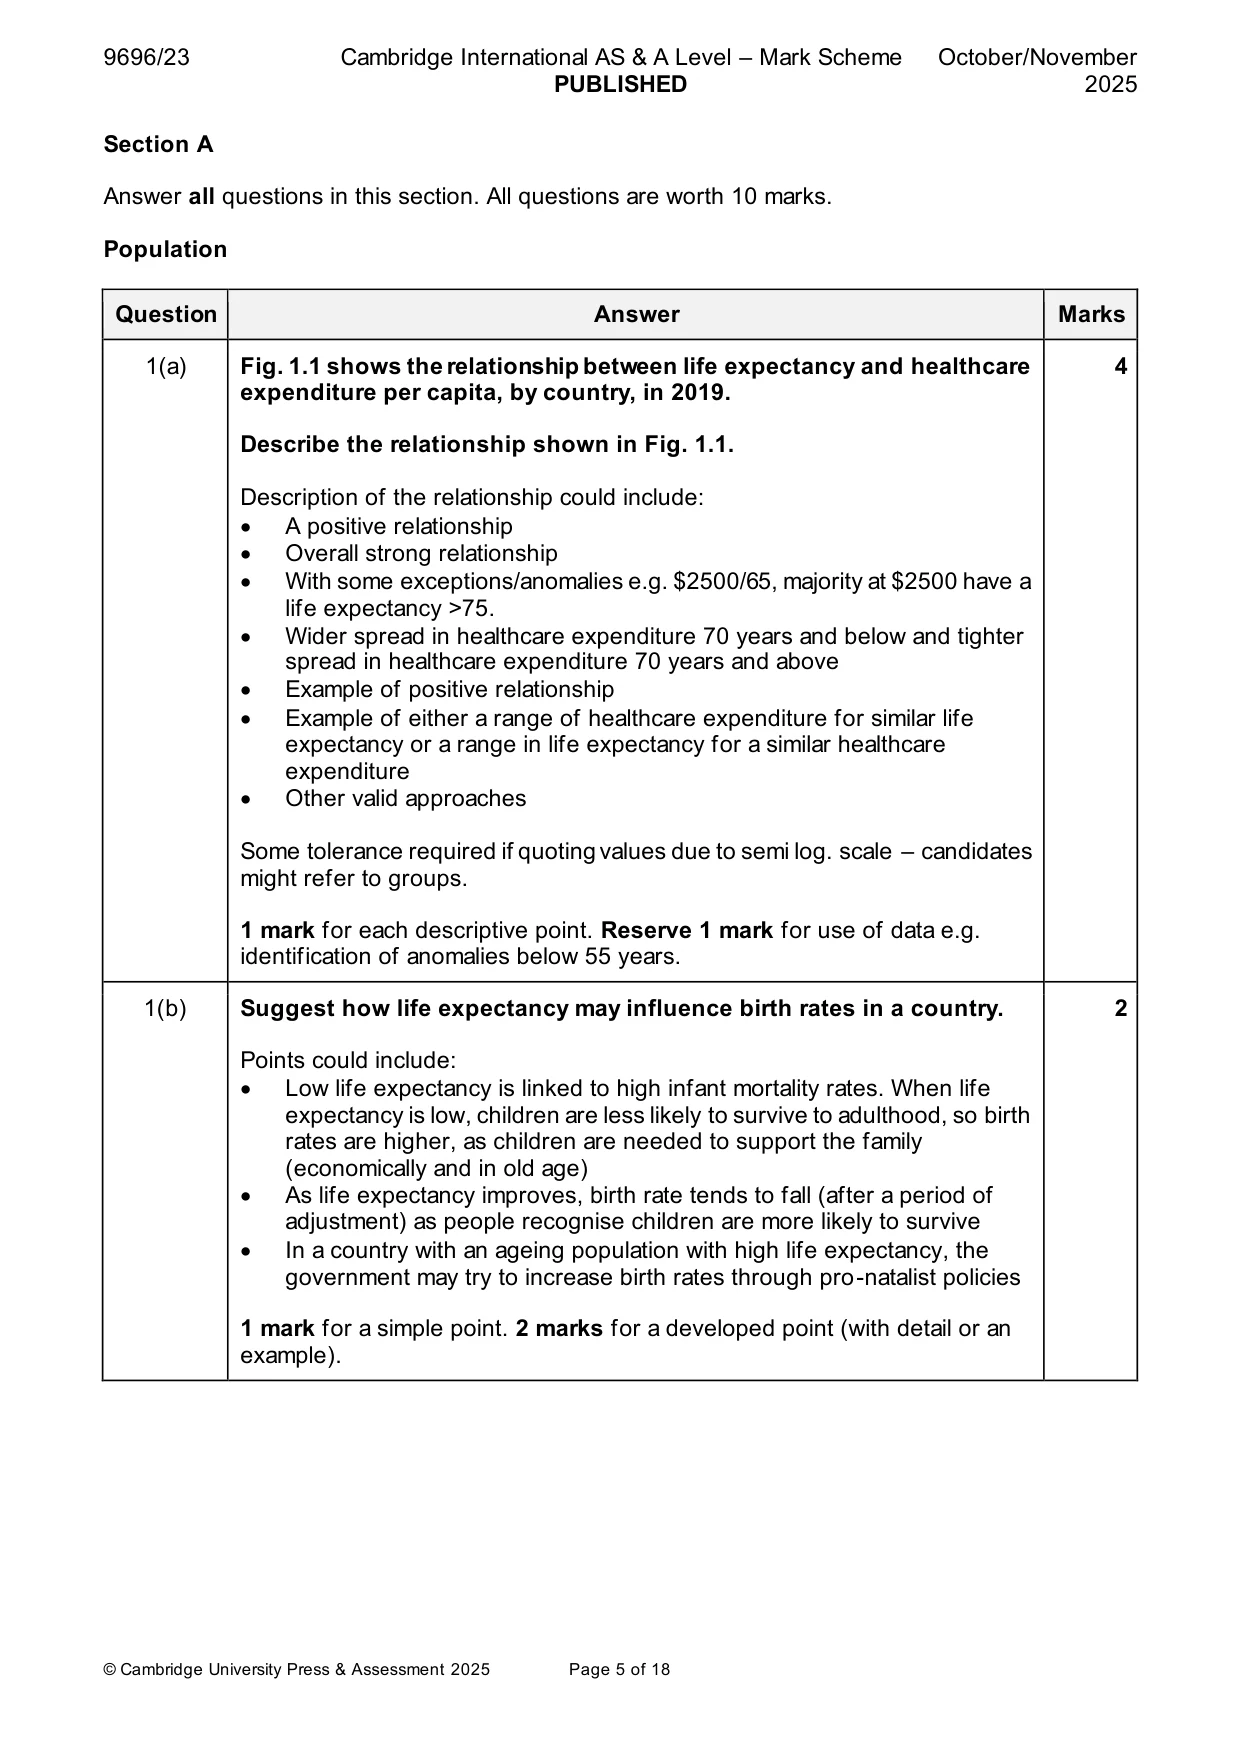
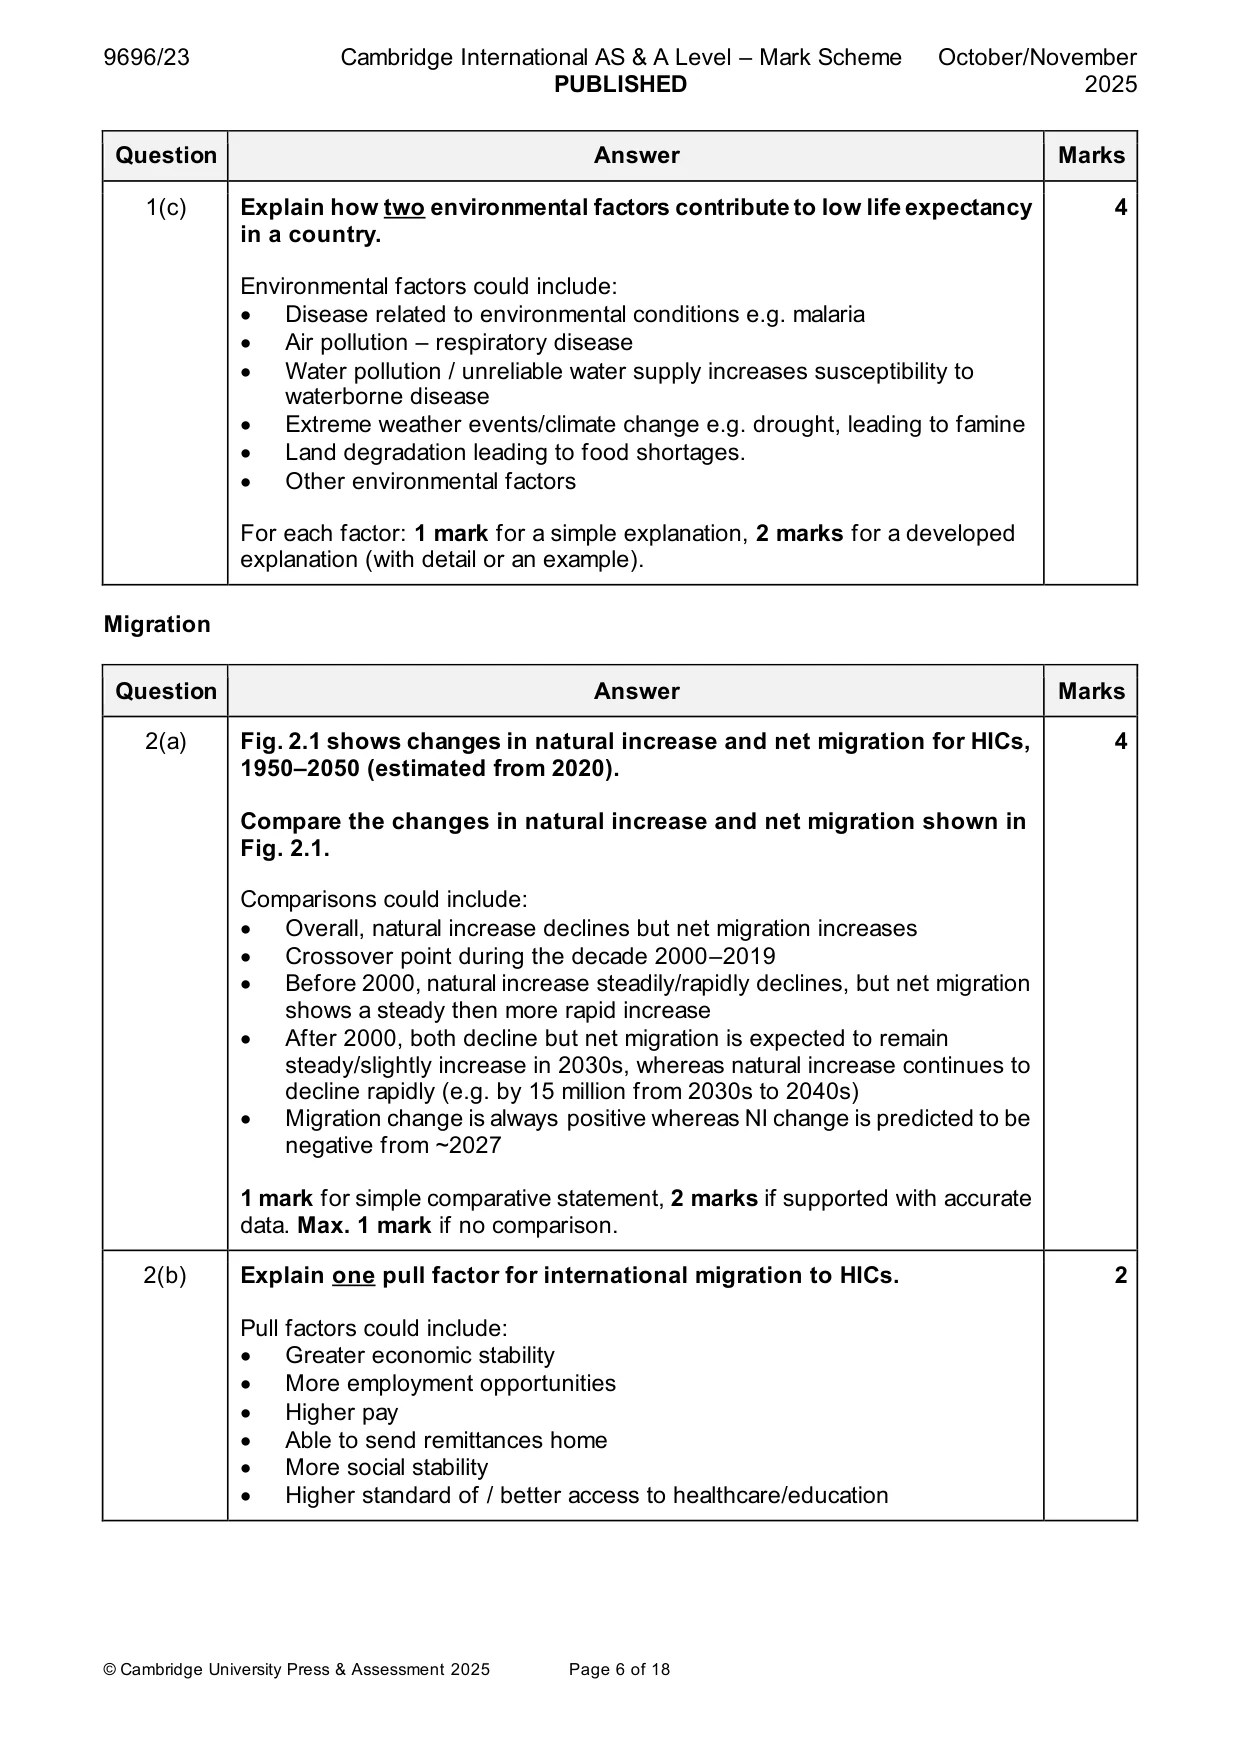
Mark scheme: Question Answer Marks 1(a) Fig. 1.1 shows the relationship between life expectancy and healthcare 4 expenditure per capita, by country, in 2019. Describe the relationship shown in Fig. 1.1. Description of the relationship could include: • A positive relationship • Overall strong relationship • With some exceptions/anomalies e.g. $2500/65, majority at $2500 have a life expectancy >75. • Wider spread in healthcare expenditure 70 years and below and tighter spread in healthcare expenditure 70 years and above • Example of positive relationship • Example of either a range of healthcare expenditure for similar life expectancy or a range in life expectancy for a similar healthcare expenditure • Other valid approaches Some tolerance required if quoting values due to semi log. scale – candidates might refer to groups. 1 mark for each descriptive point. Reserve 1 mark for use of data e.g. identification of anomalies below 55 years. 1(b) Suggest how life expectancy may influence birth rates in a country. 2 Points could include: • Low life expectancy is linked to high infant mortality rates. When life expectancy is low, children are less likely to survive to adulthood, so birth rates are higher, as children are needed to support the family (economically and in old age) • As life expectancy improves, birth rate tends to fall (after a period of adjustment) as people recognise children are more likely to survive • In a country with an ageing population with high life expectancy, the government may try to increase birth rates through pro-natalist policies 1 mark for a simple point. 2 marks for a developed point (with detail or an example). 1(c) Explain how two environmental factors contribute to low life expectancy 4 in a country. Environmental factors could include: • Disease related to environmental conditions e.g. malaria • Air pollution – respiratory disease • Water pollution / unreliable water supply increases susceptibility to waterborne disease • Extreme weather events/climate change e.g. drought, leading to famine • Land degradation leading to food shortages. • Other environmental factors For each factor: 1 mark for a simple explanation, 2 marks for a developed explanation (with detail or an example). Migration
Q2 · Changes in natural increase and net migration for HICs, 1950–2050 (estimated from 2020)
2 Fig. 2.1 shows changes in natural increase and net migration for HICs, 1950–2050 (estimated from 2020). (a) Compare the changes in natural increase and net migration shown in Fig. 2.1. [4] (b) Explain one pull factor for international migration to HICs. [2] (c) Explain the economic disadvantages of international out-migration for source areas. [4] Settlement dynamics
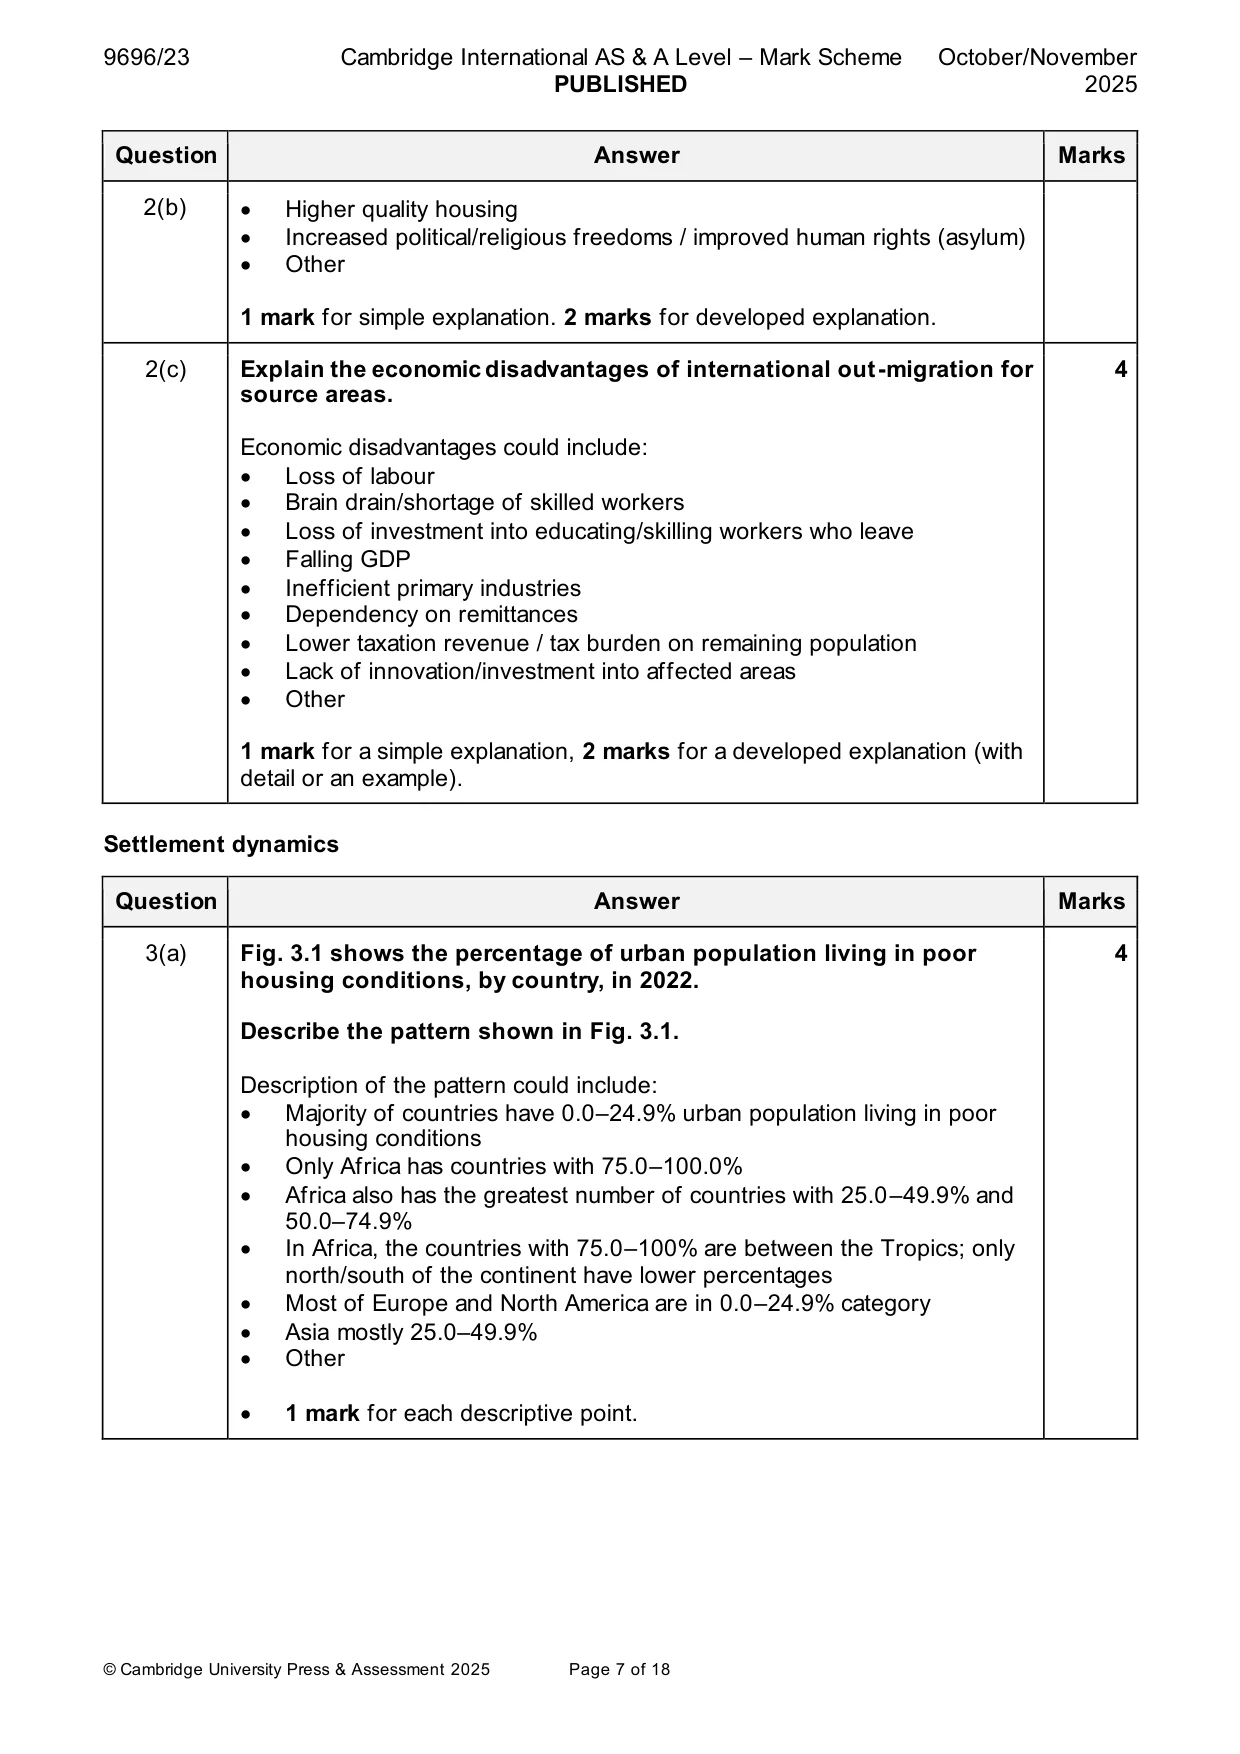
Mark scheme: 2(a) Fig. 2.1 shows changes in natural increase and net migration for HICs, 4 1950–2050 (estimated from 2020). Compare the changes in natural increase and net migration shown in Fig. 2.1. Comparisons could include: • Overall, natural increase declines but net migration increases • Crossover point during the decade 2000–2019 • Before 2000, natural increase steadily/rapidly declines, but net migration shows a steady then more rapid increase • After 2000, both decline but net migration is expected to remain steady/slightly increase in 2030s, whereas natural increase continues to decline rapidly (e.g. by 15 million from 2030s to 2040s) • Migration change is always positive whereas NI change is predicted to be negative from ~2027 1 mark for simple comparative statement, 2 marks if supported with accurate data. Max. 1 mark if no comparison. 2(b) Explain one pull factor for international migration to HICs. 2 Pull factors could include: • Greater economic stability • More employment opportunities • Higher pay • Able to send remittances home • More social stability • Higher standard of / better access to healthcare/education 2(b) • Higher quality housing • Increased political/religious freedoms / improved human rights (asylum) • Other 1 mark for simple explanation. 2 marks for developed explanation. 2(c) Explain the economic disadvantages of international out-migration for 4 source areas. Economic disadvantages could include: • Loss of labour • Brain drain/shortage of skilled workers • Loss of investment into educating/skilling workers who leave • Falling GDP • Inefficient primary industries • Dependency on remittances • Lower taxation revenue / tax burden on remaining population • Lack of innovation/investment into affected areas • Other 1 mark for a simple explanation, 2 marks for a developed explanation (with detail or an example). Settlement dynamics
Q3 · The percentage of urban population living in poor housing conditions, by country, in 2022
3 Fig. 3.1 shows the percentage of urban population living in poor housing conditions, by country, in 2022. (a) Describe the pattern shown in Fig. 3.1. [4] (b) Suggest two problems for residents in shanty towns (squatter settlements). [2] (c) Explain two challenges for governments of managing shanty towns (squatter settlements). [4]
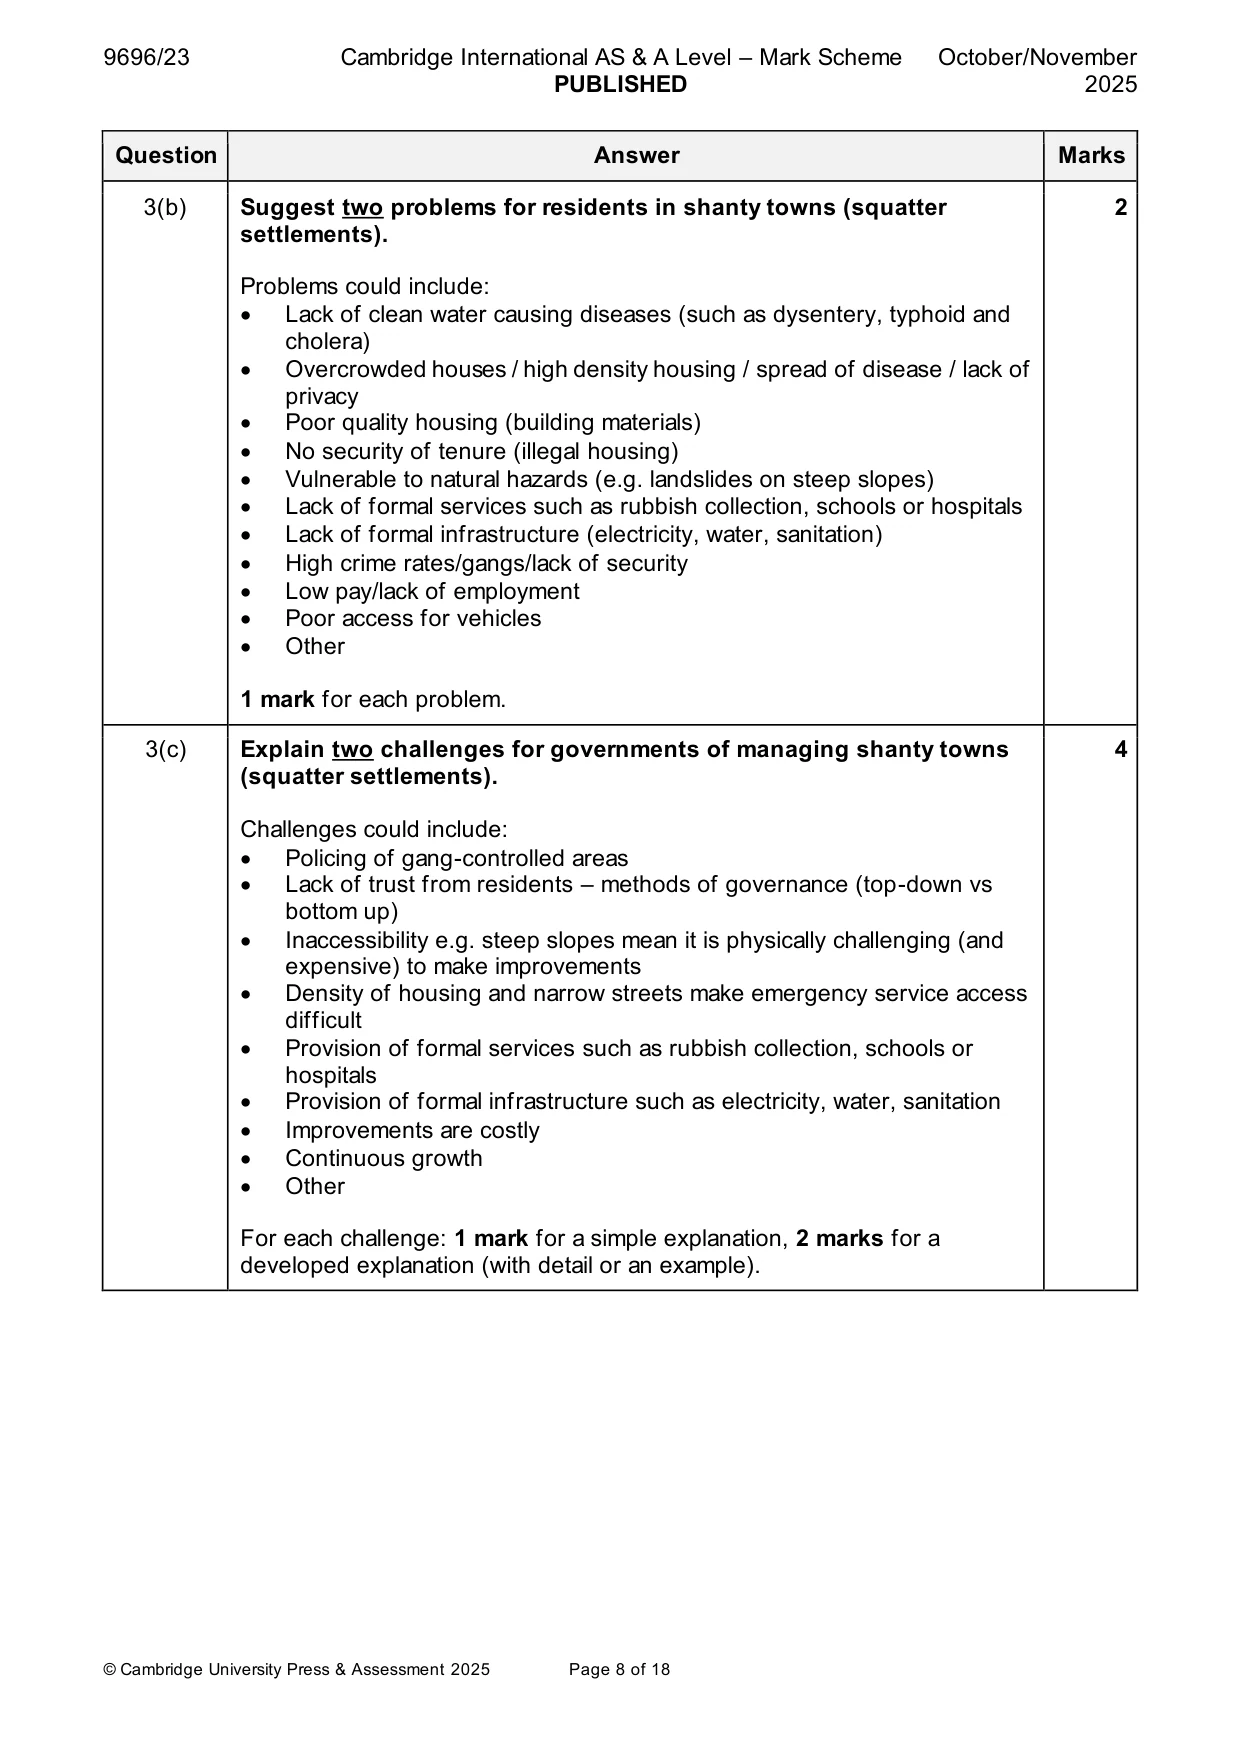
Mark scheme: 3(a) Fig. 3.1 shows the percentage of urban population living in poor 4 housing conditions, by country, in 2022. Describe the pattern shown in Fig. 3.1. Description of the pattern could include: • Majority of countries have 0.0–24.9% urban population living in poor housing conditions • Only Africa has countries with 75.0–100.0% • Africa also has the greatest number of countries with 25.0–49.9% and 50.0–74.9% • In Africa, the countries with 75.0–100% are between the Tropics; only north/south of the continent have lower percentages • Most of Europe and North America are in 0.0–24.9% category • Asia mostly 25.0–49.9% • Other • 1 mark for each descriptive point. 3(b) Suggest two problems for residents in shanty towns (squatter 2 settlements). Problems could include: • Lack of clean water causing diseases (such as dysentery, typhoid and cholera) • Overcrowded houses / high density housing / spread of disease / lack of privacy • Poor quality housing (building materials) • No security of tenure (illegal housing) • Vulnerable to natural hazards (e.g. landslides on steep slopes) • Lack of formal services such as rubbish collection, schools or hospitals • Lack of formal infrastructure (electricity, water, sanitation) • High crime rates/gangs/lack of security • Low pay/lack of employment • Poor access for vehicles • Other 1 mark for each problem. 3(c) Explain two challenges for governments of managing shanty towns 4 (squatter settlements). Challenges could include: • Policing of gang-controlled areas • Lack of trust from residents – methods of governance (top-down vs bottom up) • Inaccessibility e.g. steep slopes mean it is physically challenging (and expensive) to make improvements • Density of housing and narrow streets make emergency service access difficult • Provision of formal services such as rubbish collection, schools or hospitals • Provision of formal infrastructure such as electricity, water, sanitation • Improvements are costly • Continuous growth • Other For each challenge: 1 mark for a simple explanation, 2 marks for a developed explanation (with detail or an example). Section B Answer one question from this section. All questions are worth 30 marks. Population
Q4 · Describe how the structure of the population influences the dependency ratio for a country
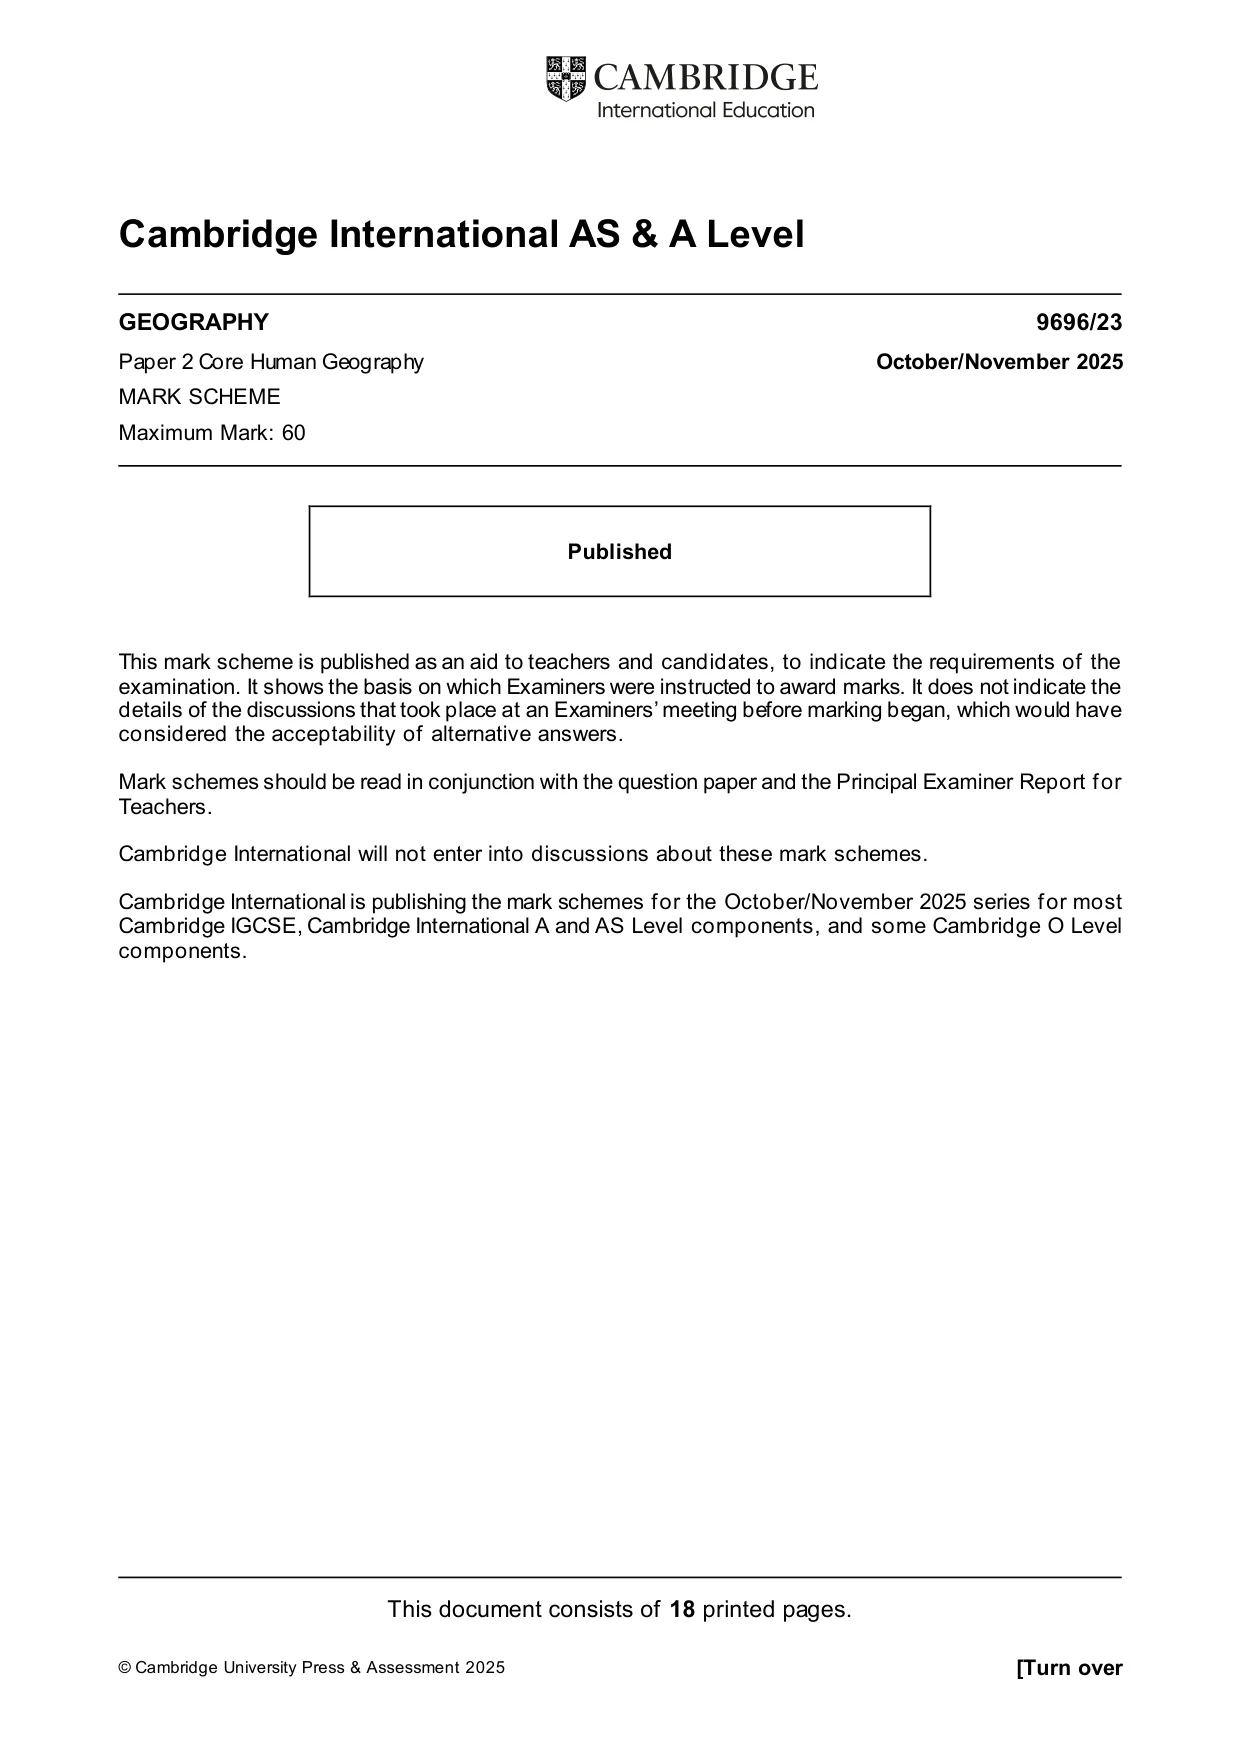
4 (a) Describe how the structure of the population influences the dependency ratio for a country. [7] (b) With the aid of examples, explain the role of constraints in relation to sustaining population. [8] (c) ‘Underpopulation is easier to manage for a government than overpopulation.’ With the aid of examples, how far do you agree with this statement? [15] Migration/Settlement dynamics
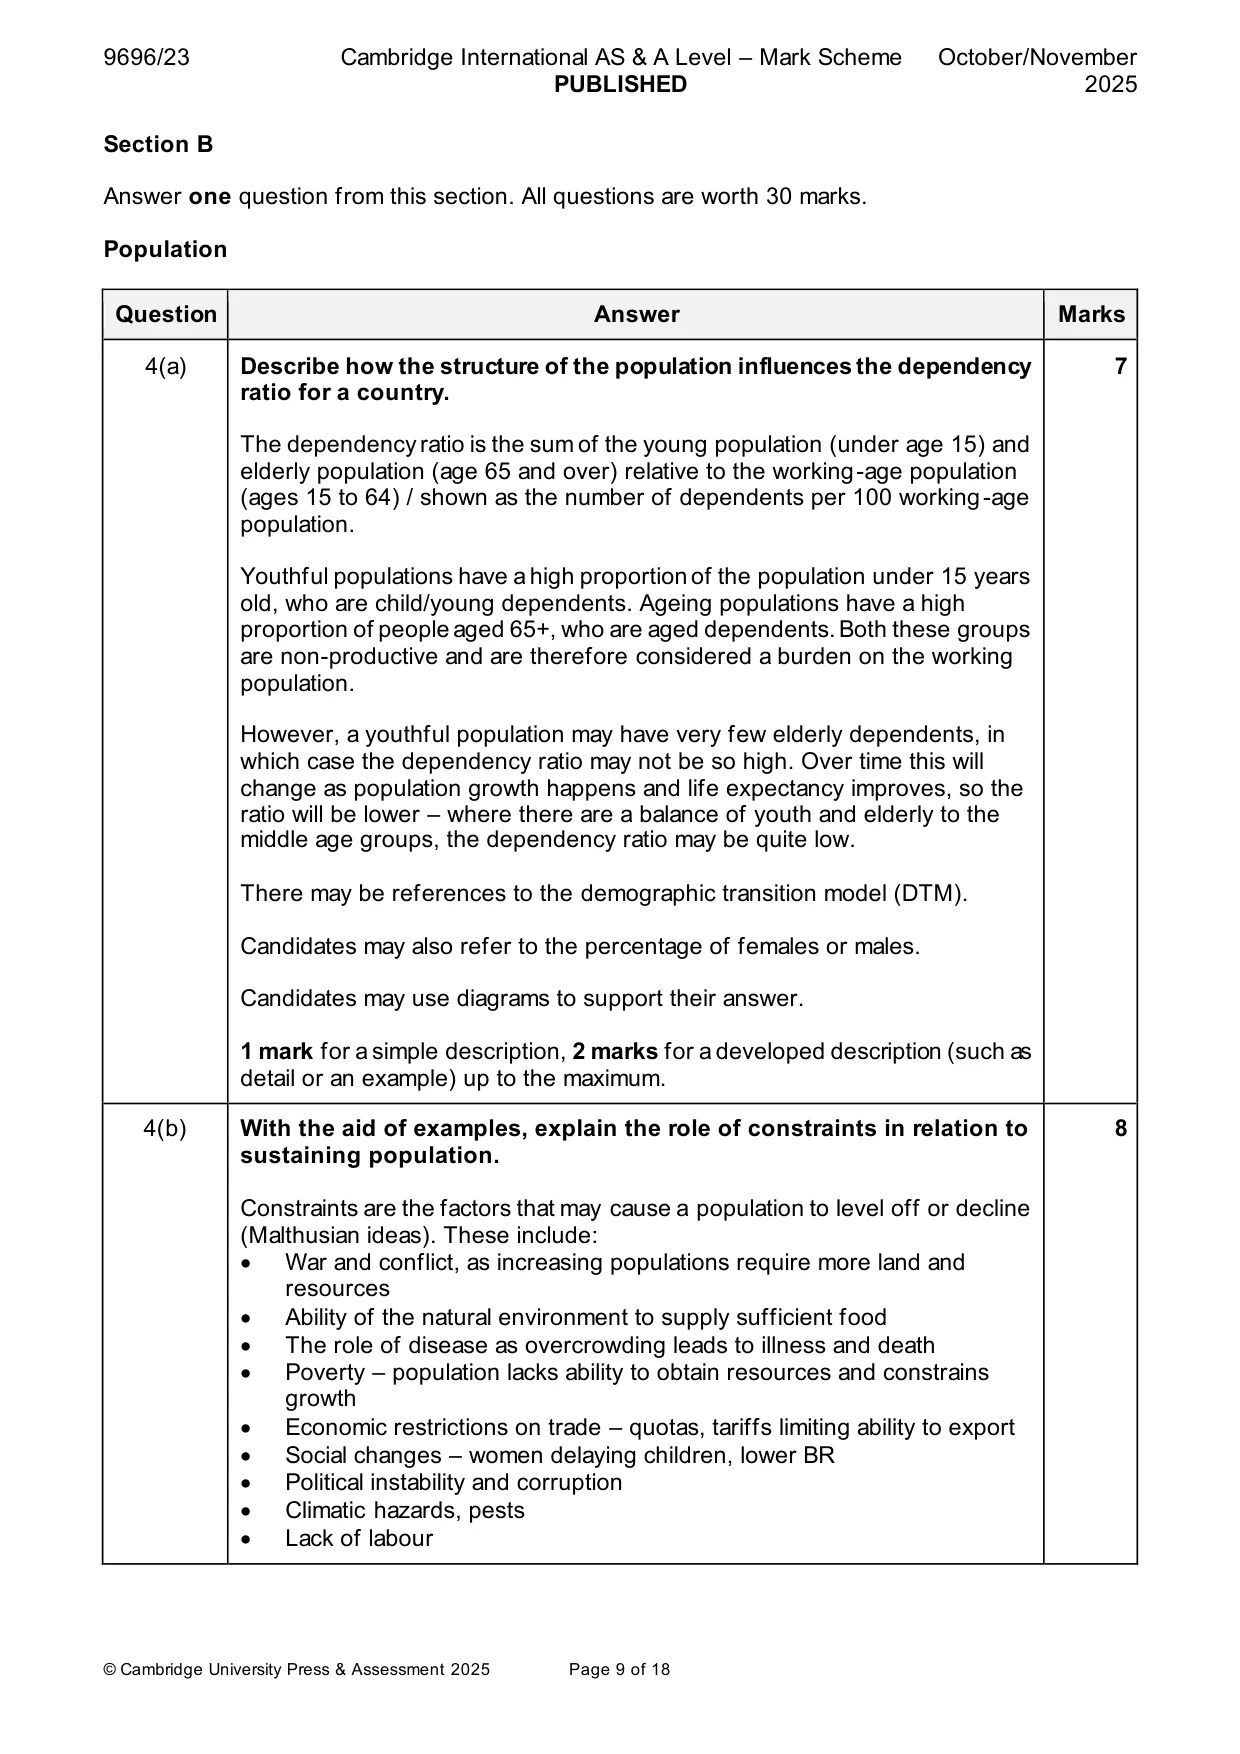
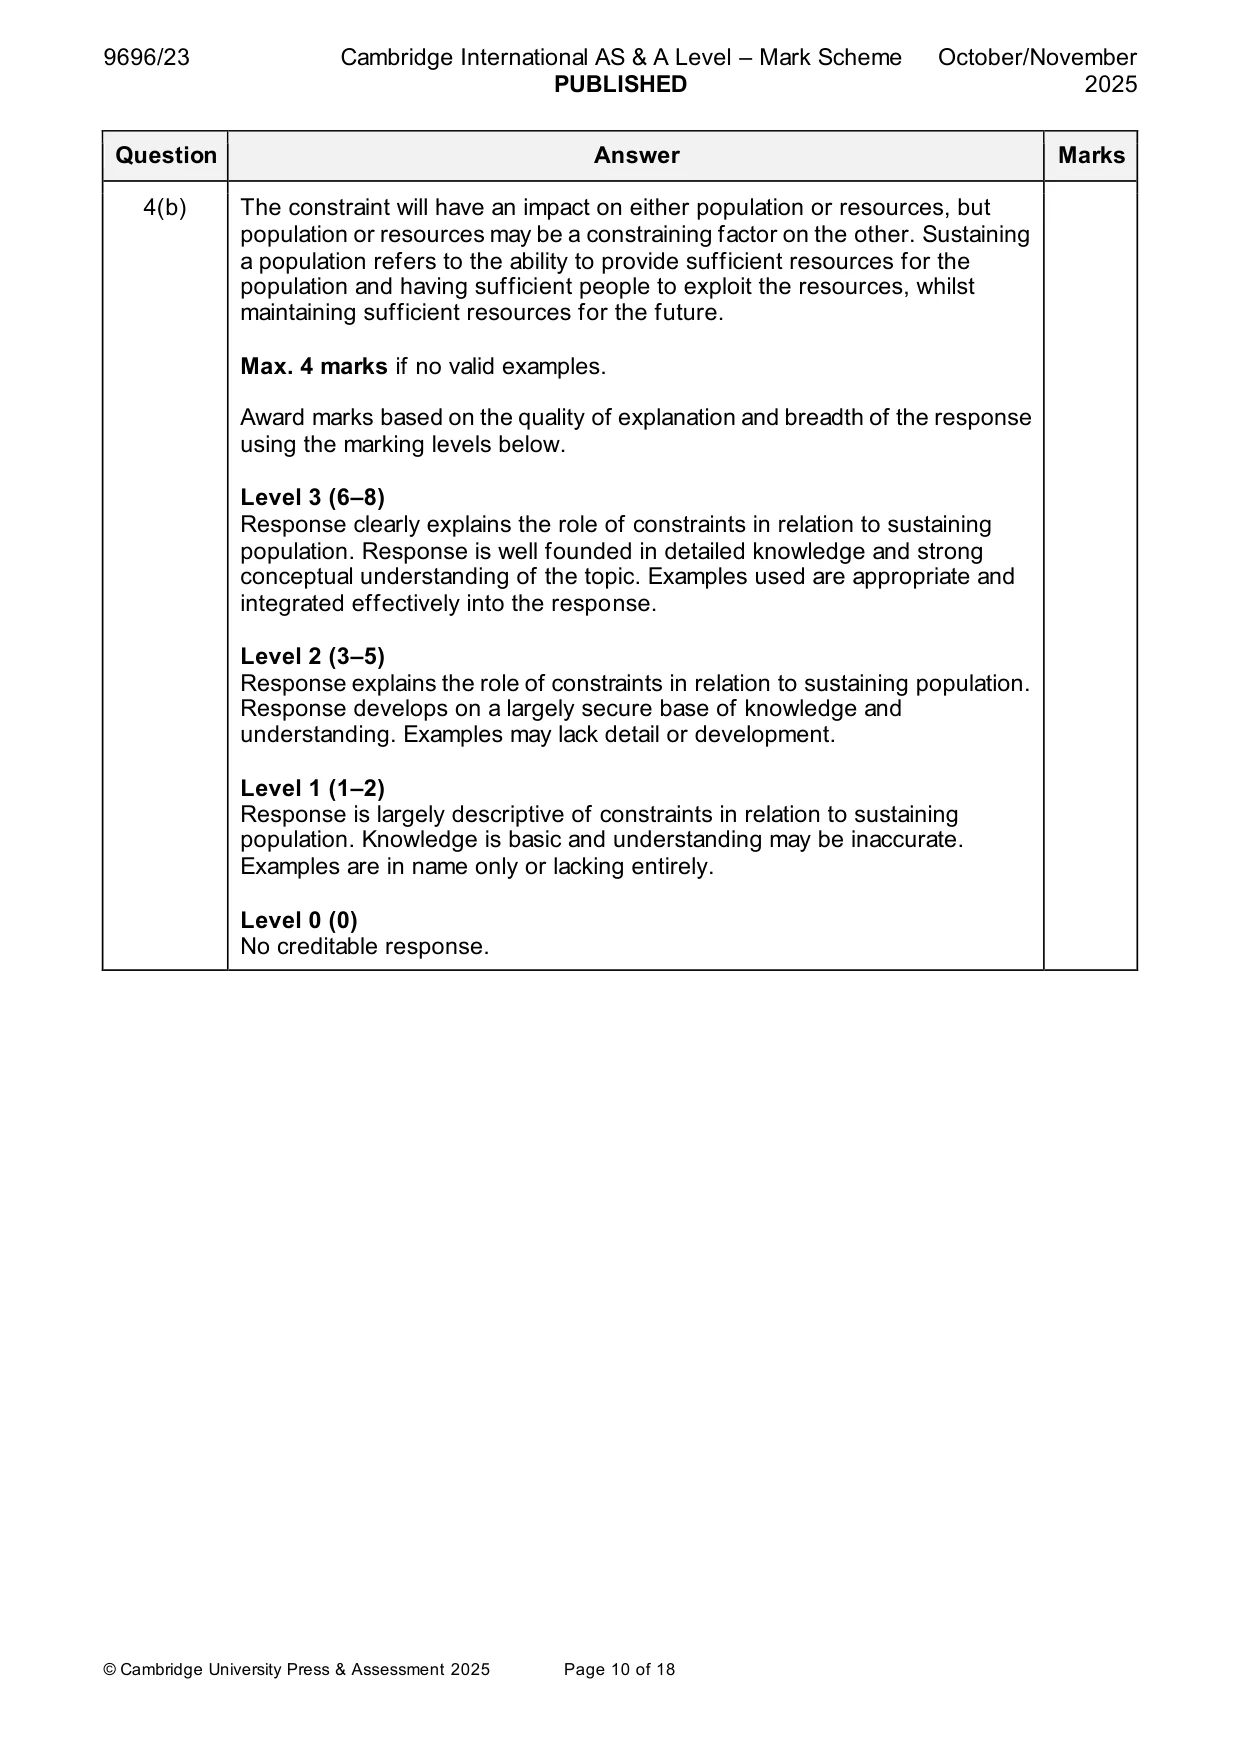
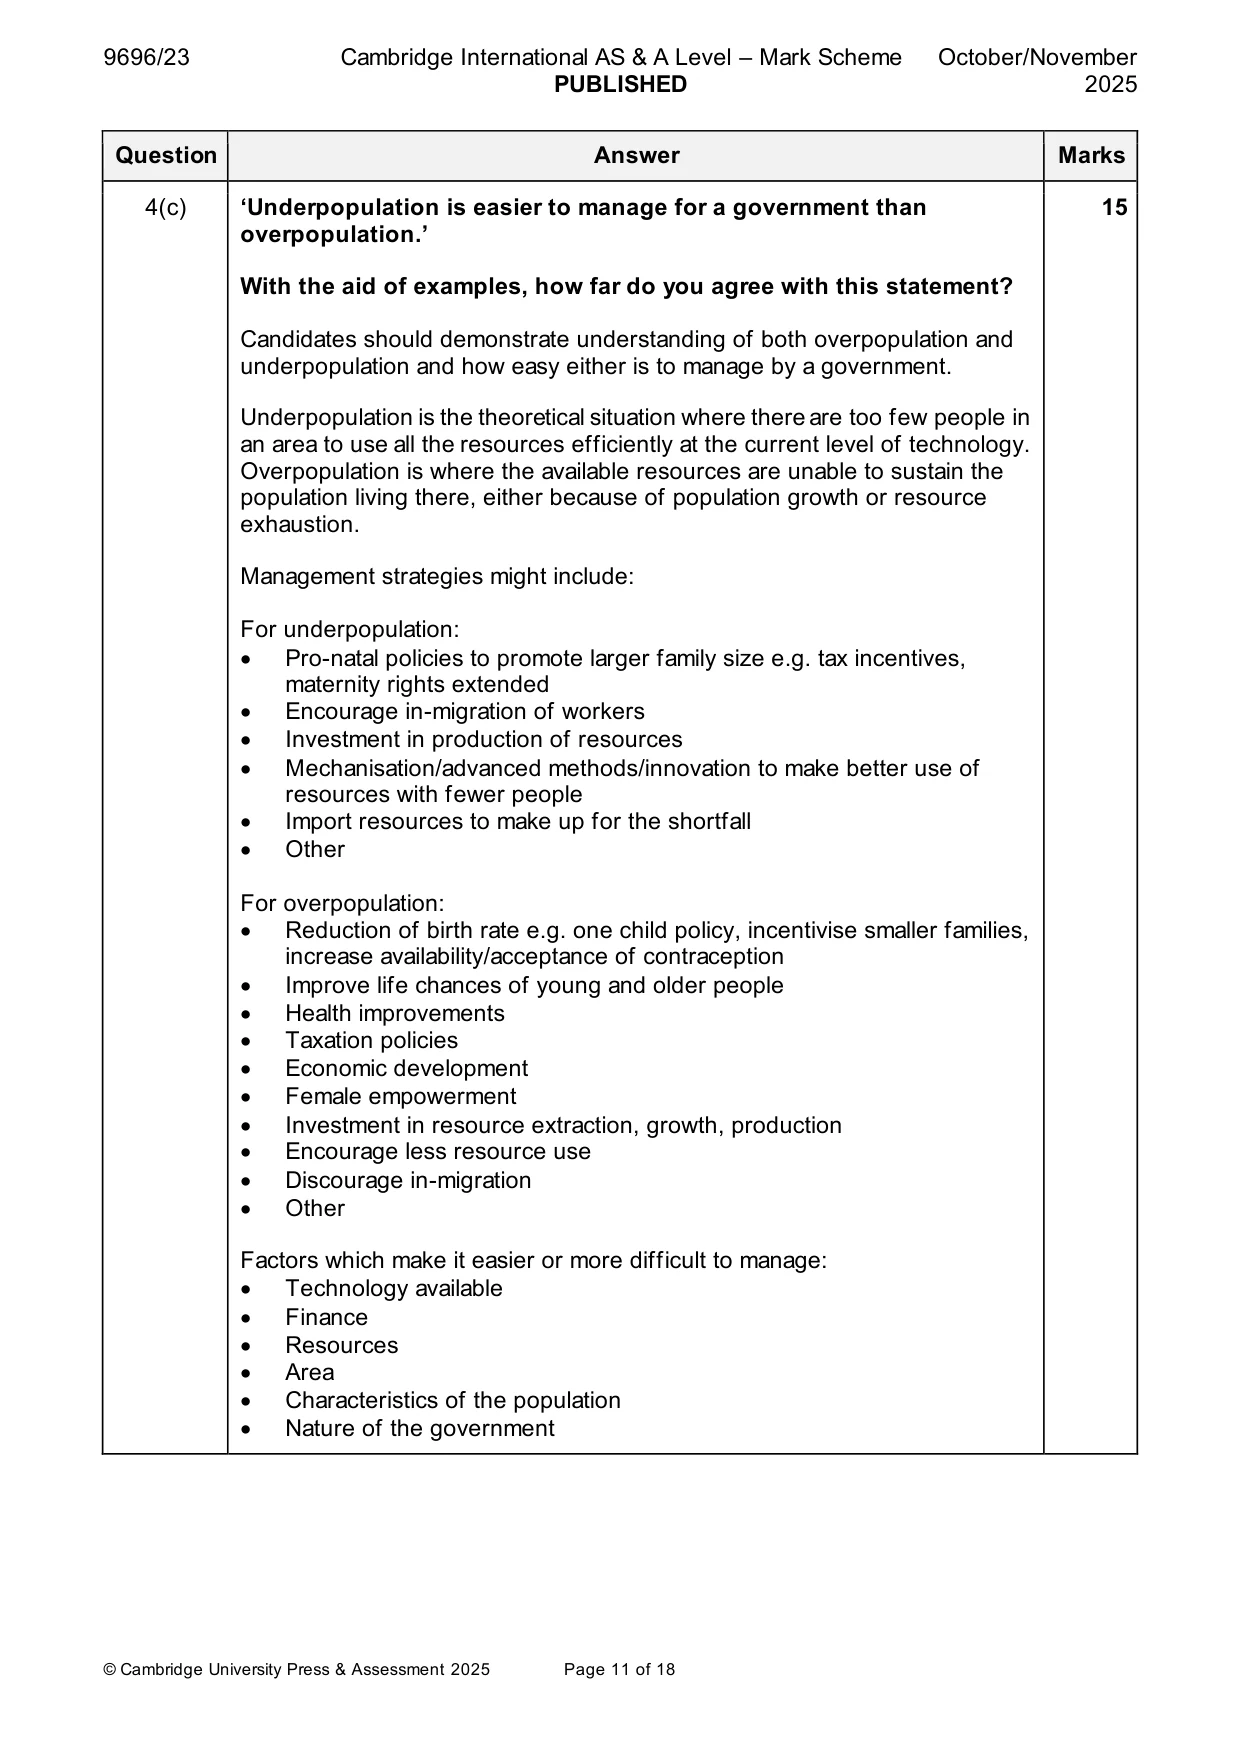
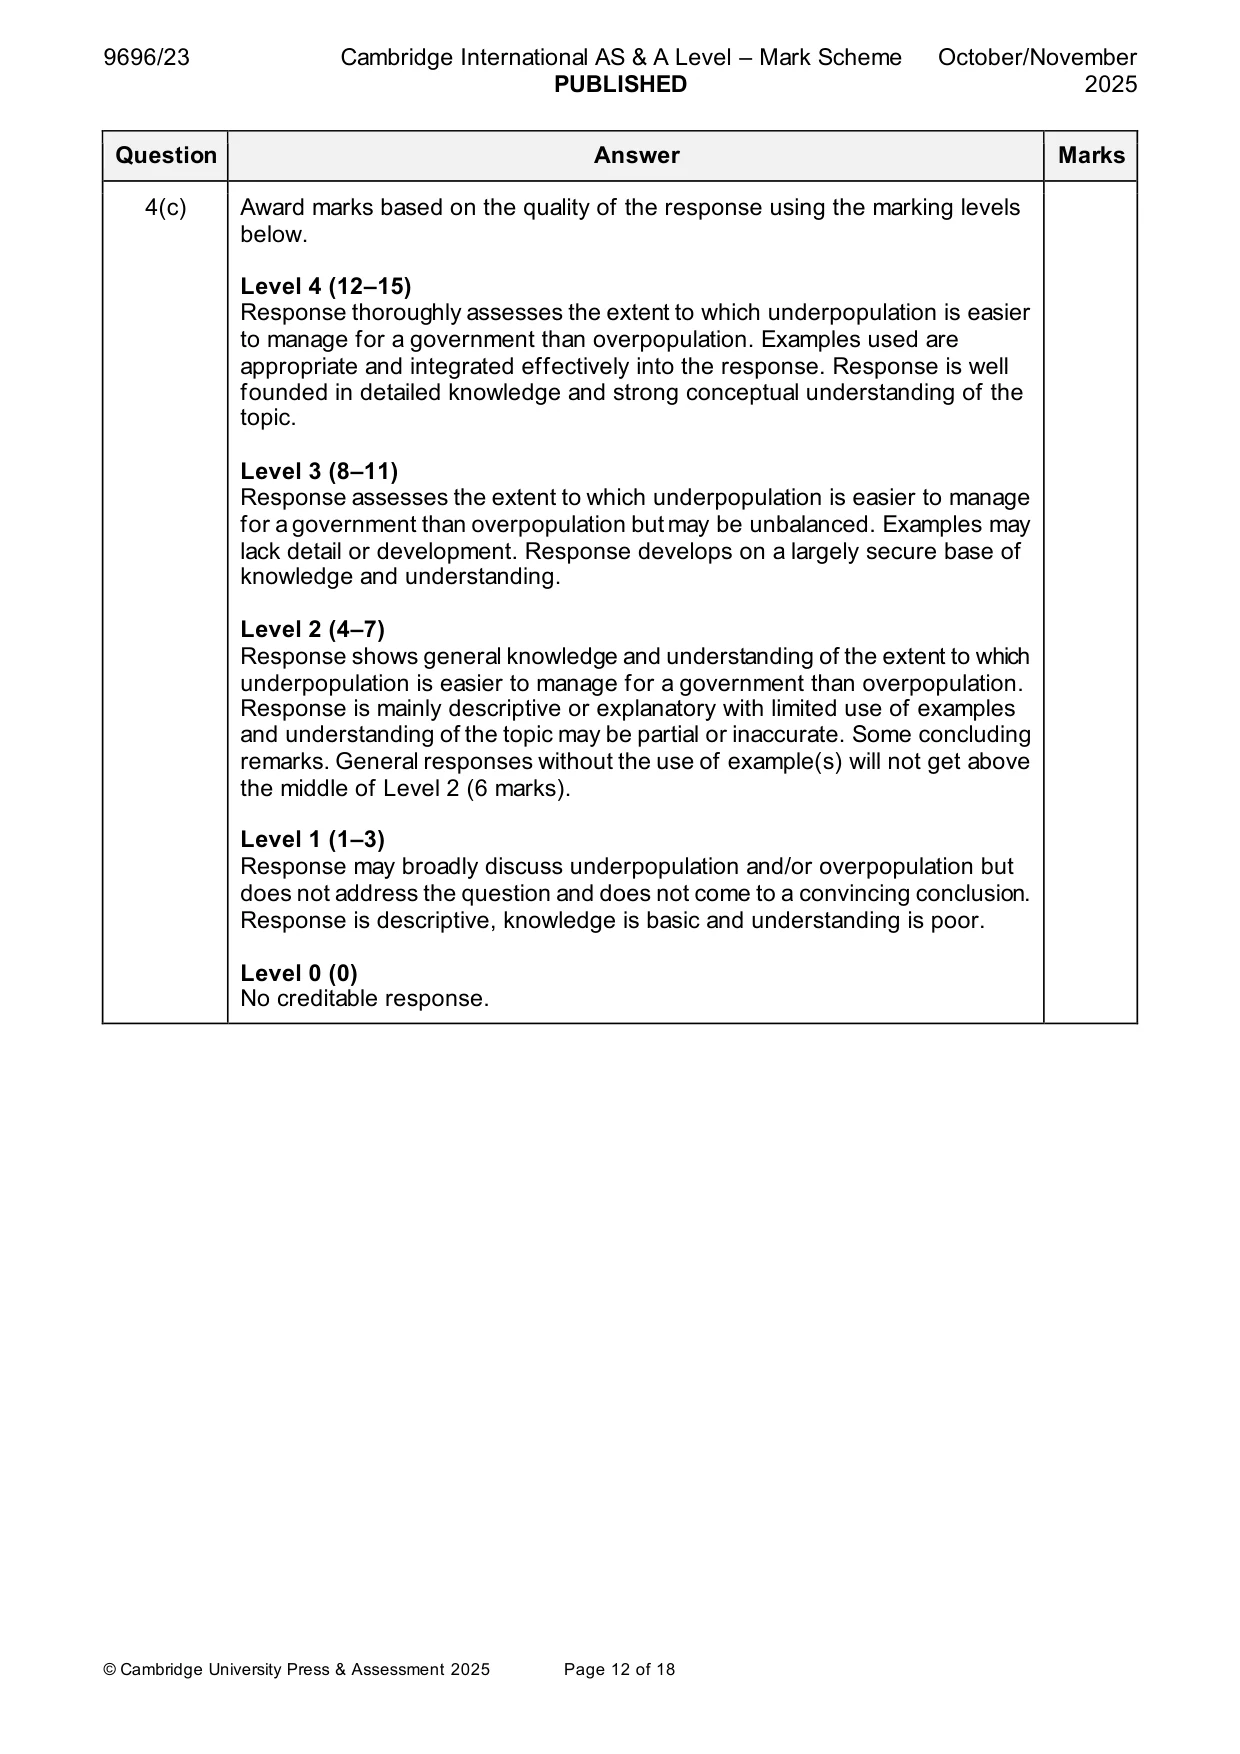
Mark scheme: 4(a) Describe how the structure of the population influences the dependency 7 ratio for a country. The dependency ratio is the sum of the young population (under age 15) and elderly population (age 65 and over) relative to the working-age population (ages 15 to 64) / shown as the number of dependents per 100 working-age population. Youthful populations have a high proportion of the population under 15 years old, who are child/young dependents. Ageing populations have a high proportion of people aged 65+, who are aged dependents. Both these groups are non-productive and are therefore considered a burden on the working population. However, a youthful population may have very few elderly dependents, in which case the dependency ratio may not be so high. Over time this will change as population growth happens and life expectancy improves, so the ratio will be lower – where there are a balance of youth and elderly to the middle age groups, the dependency ratio may be quite low. There may be references to the demographic transition model (DTM). Candidates may also refer to the percentage of females or males. Candidates may use diagrams to support their answer. 1 mark for a simple description, 2 marks for a developed description (such as detail or an example) up to the maximum. 4(b) With the aid of examples, explain the role of constraints in relation to 8 sustaining population. Constraints are the factors that may cause a population to level off or decline (Malthusian ideas). These include: • War and conflict, as increasing populations require more land and resources • Ability of the natural environment to supply sufficient food • The role of disease as overcrowding leads to illness and death • Poverty – population lacks ability to obtain resources and constrains growth • Economic restrictions on trade – quotas, tariffs limiting ability to export • Social changes – women delaying children, lower BR • Political instability and corruption • Climatic hazards, pests • Lack of labour 4(b) The constraint will have an impact on either population or resources, but population or resources may be a constraining factor on the other. Sustaining a population refers to the ability to provide sufficient resources for the population and having sufficient people to exploit the resources, whilst maintaining sufficient resources for the future. Max. 4 marks if no valid examples. Award marks based on the quality of explanation and breadth of the response using the marking levels below. Level 3 (6–8) Response clearly explains the role of constraints in relation to sustaining population. Response is well founded in detailed knowledge and strong conceptual understanding of the topic. Examples used are appropriate and integrated effectively into the response. Level 2 (3–5) Response explains the role of constraints in relation to sustaining population. Response develops on a largely secure base of knowledge and understanding. Examples may lack detail or development. Level 1 (1–2) Response is largely descriptive of constraints in relation to sustaining population. Knowledge is basic and understanding may be inaccurate. Examples are in name only or lacking entirely. Level 0 (0) No creditable response. 4(c) ‘Underpopulation is easier to manage for a government than 15 overpopulation.’ With the aid of examples, how far do you agree with this statement? Candidates should demonstrate understanding of both overpopulation and underpopulation and how easy either is to manage by a government. Underpopulation is the theoretical situation where there are too few people in an area to use all the resources efficiently at the current level of technology. Overpopulation is where the available resources are unable to sustain the population living there, either because of population growth or resource exhaustion. Management strategies might include: For underpopulation: • Pro-natal policies to promote larger family size e.g. tax incentives, maternity rights extended • Encourage in-migration of workers • Investment in production of resources • Mechanisation/advanced methods/innovation to make better use of resources with fewer people • Import resources to make up for the shortfall • Other For overpopulation: • Reduction of birth rate e.g. one child policy, incentivise smaller families, increase availability/acceptance of contraception • Improve life chances of young and older people • Health improvements • Taxation policies • Economic development • Female empowerment • Investment in resource extraction, growth, production • Encourage less resource use • Discourage in-migration • Other Factors which make it easier or more difficult to manage: • Technology available • Finance • Resources • Area • Characteristics of the population • Nature of the government 4(c) Award marks based on the quality of the response using the marking levels below. Level 4 (12–15) Response thoroughly assesses the extent to which underpopulation is easier to manage for a government than overpopulation. Examples used are appropriate and integrated effectively into the response. Response is well founded in detailed knowledge and strong conceptual understanding of the topic. Level 3 (8–11) Response assesses the extent to which underpopulation is easier to manage for a government than overpopulation but may be unbalanced. Examples may lack detail or development. Response develops on a largely secure base of knowledge and understanding. Level 2 (4–7) Response shows general knowledge and understanding of the extent to which underpopulation is easier to manage for a government than overpopulation. Response is mainly descriptive or explanatory with limited use of examples and understanding of the topic may be partial or inaccurate. Some concluding remarks. General responses without the use of example(s) will not get above the middle of Level 2 (6 marks). Level 1 (1–3) Response may broadly discuss underpopulation and/or overpopulation but does not address the question and does not come to a convincing conclusion. Response is descriptive, knowledge is basic and understanding is poor. Level 0 (0) No creditable response. Migration/Settlement dynamics
Q5 · Define the term ‘refugee’
5 (a) (i) Define the term ‘refugee’. [3] (ii) Explain two barriers to refugee flows. [4] (b) With the aid of examples, explain the push factors which cause rural to urban migration in LICs/MICs. [8] (c) With the aid of examples, assess the extent to which rural to urban migration in LICs/MICs causes problems in urban areas. [15] Settlement dynamics
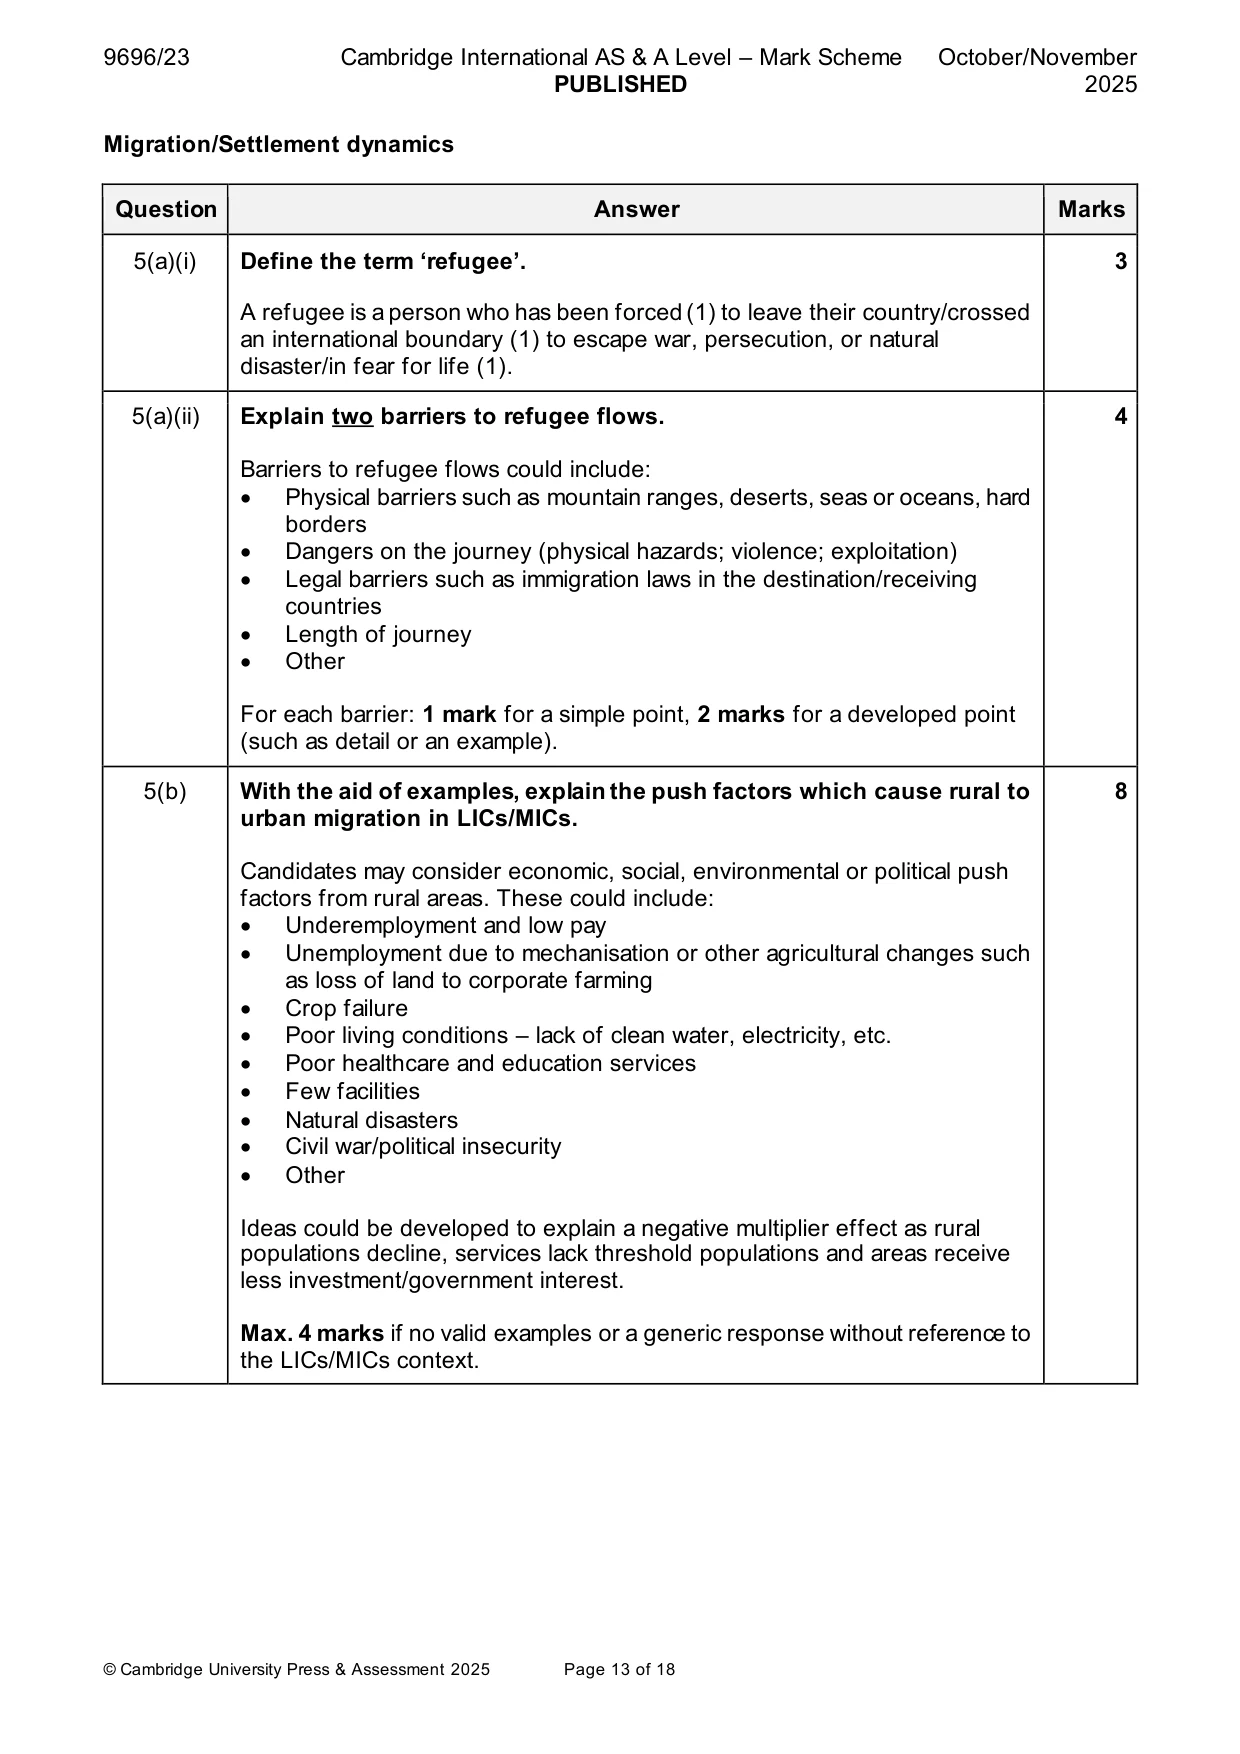
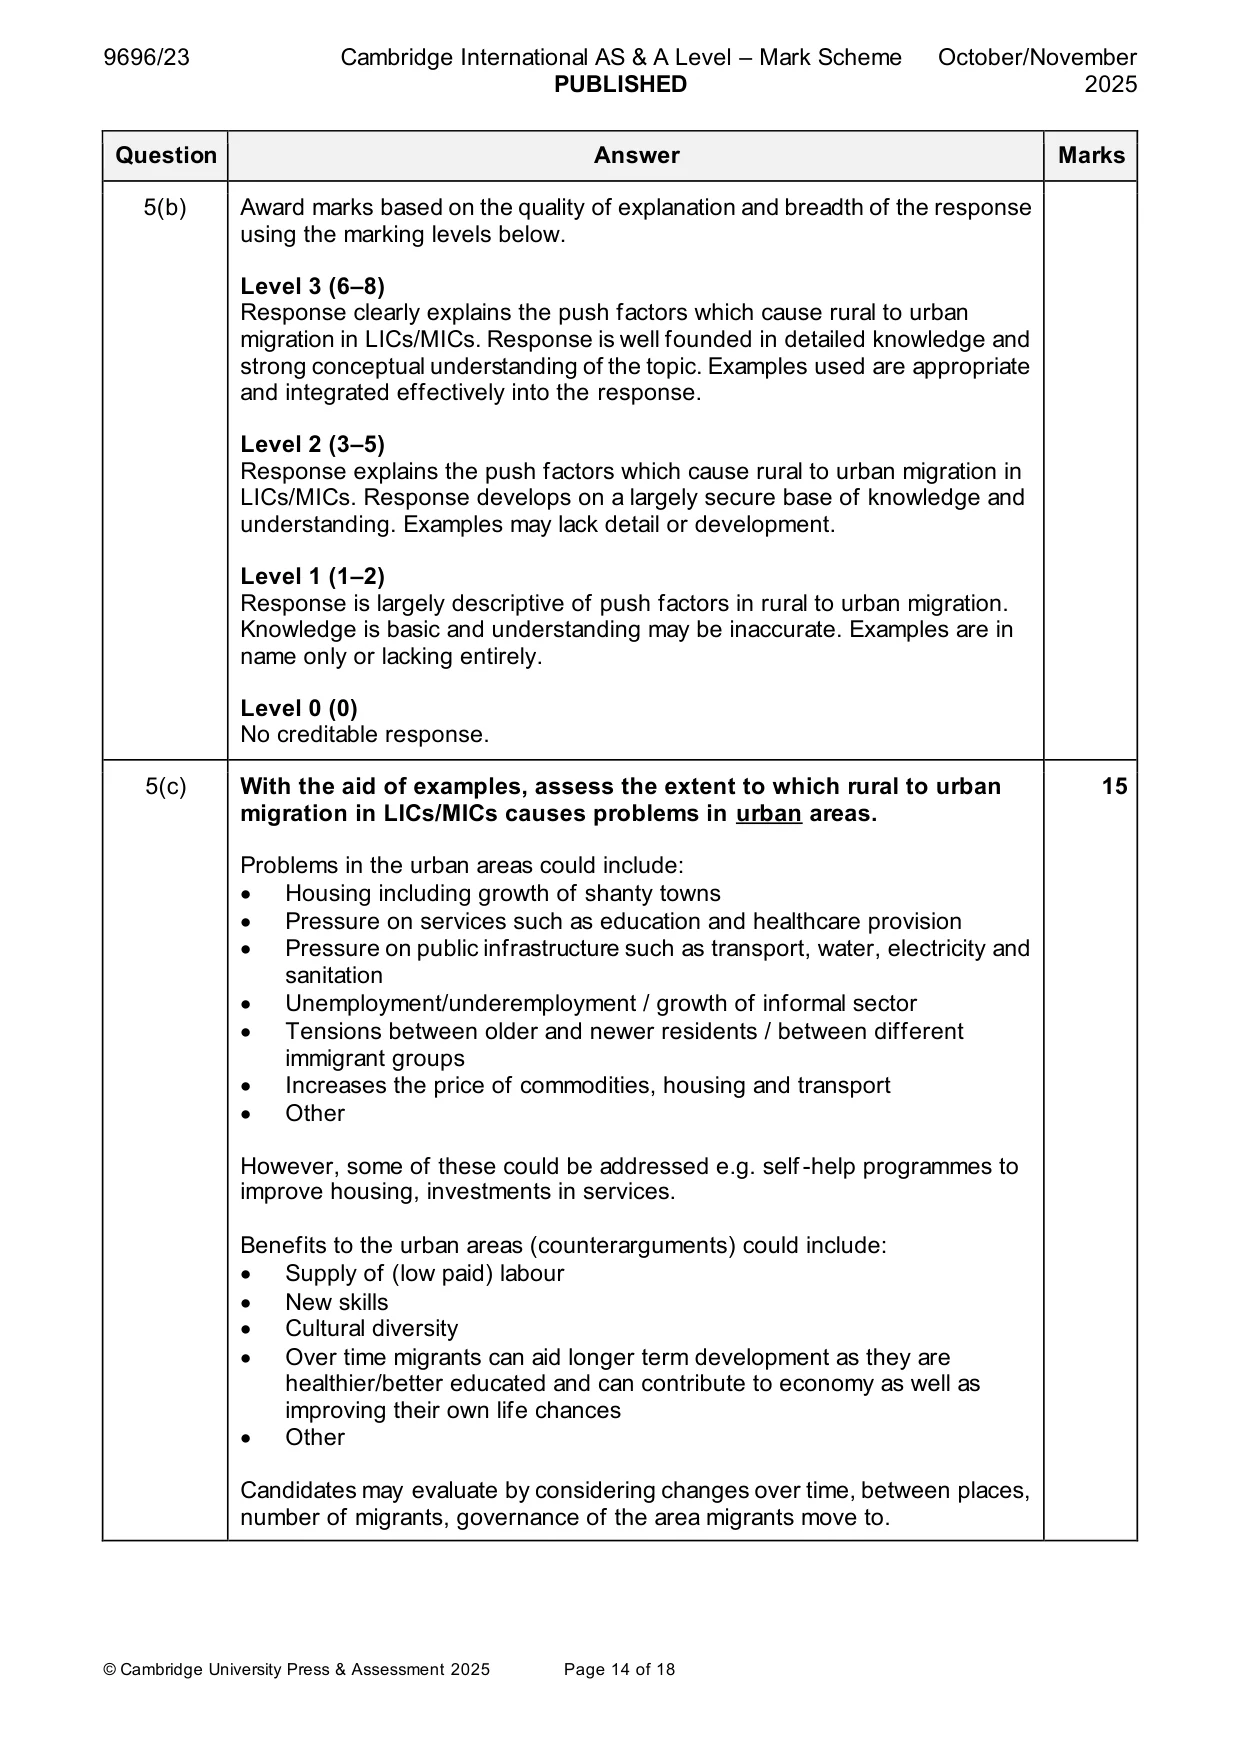
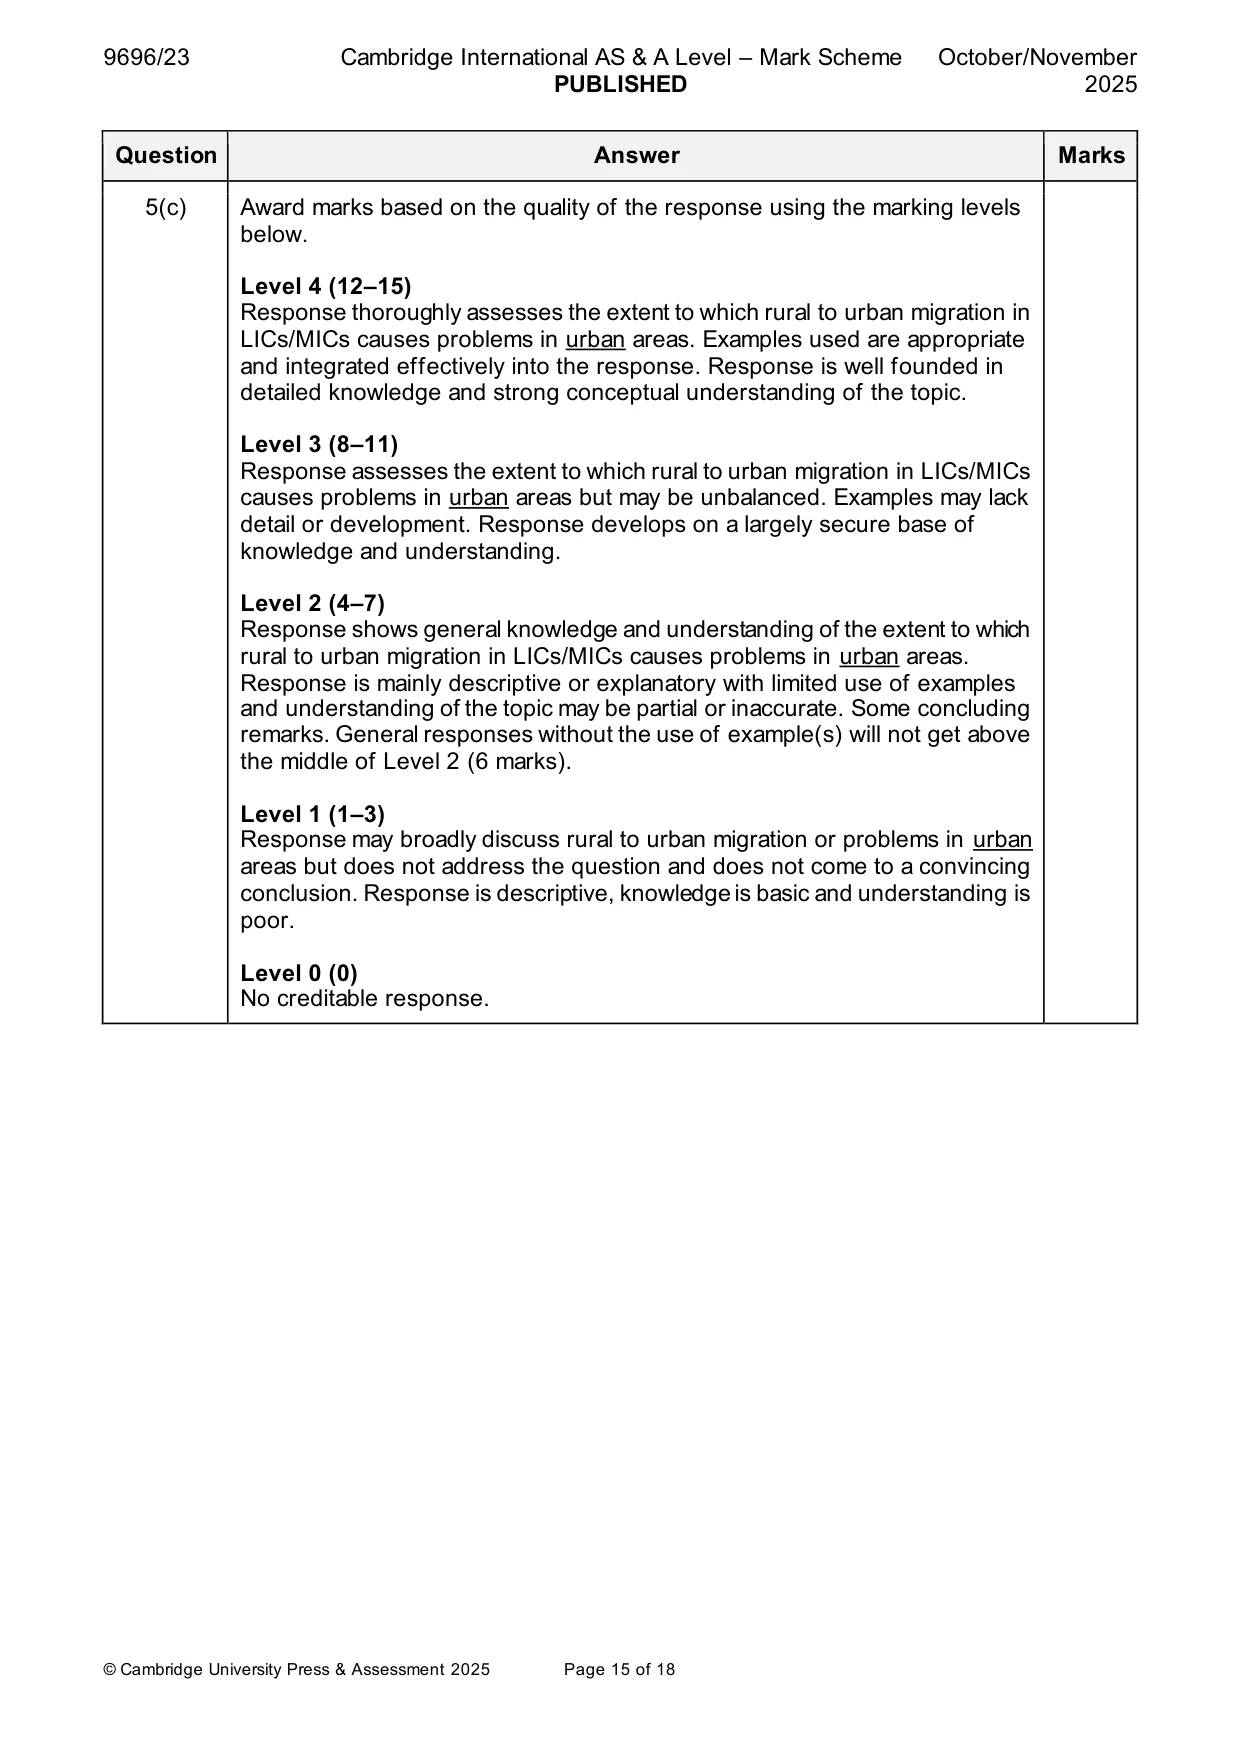
Mark scheme: 5(a)(i) Define the term ‘refugee’. 3 A refugee is a person who has been forced (1) to leave their country/crossed an international boundary (1) to escape war, persecution, or natural disaster/in fear for life (1). 5(a)(ii) Explain two barriers to refugee flows. 4 Barriers to refugee flows could include: • Physical barriers such as mountain ranges, deserts, seas or oceans, hard borders • Dangers on the journey (physical hazards; violence; exploitation) • Legal barriers such as immigration laws in the destination/receiving countries • Length of journey • Other For each barrier: 1 mark for a simple point, 2 marks for a developed point (such as detail or an example). 5(b) With the aid of examples, explain the push factors which cause rural to 8 urban migration in LICs/MICs. Candidates may consider economic, social, environmental or political push factors from rural areas. These could include: • Underemployment and low pay • Unemployment due to mechanisation or other agricultural changes such as loss of land to corporate farming • Crop failure • Poor living conditions – lack of clean water, electricity, etc. • Poor healthcare and education services • Few facilities • Natural disasters • Civil war/political insecurity • Other Ideas could be developed to explain a negative multiplier effect as rural populations decline, services lack threshold populations and areas receive less investment/government interest. Max. 4 marks if no valid examples or a generic response without reference to the LICs/MICs context. 5(b) Award marks based on the quality of explanation and breadth of the response using the marking levels below. Level 3 (6–8) Response clearly explains the push factors which cause rural to urban migration in LICs/MICs. Response is well founded in detailed knowledge and strong conceptual understanding of the topic. Examples used are appropriate and integrated effectively into the response. Level 2 (3–5) Response explains the push factors which cause rural to urban migration in LICs/MICs. Response develops on a largely secure base of knowledge and understanding. Examples may lack detail or development. Level 1 (1–2) Response is largely descriptive of push factors in rural to urban migration. Knowledge is basic and understanding may be inaccurate. Examples are in name only or lacking entirely. Level 0 (0) No creditable response. 5(c) With the aid of examples, assess the extent to which rural to urban 15 migration in LICs/MICs causes problems in urban areas. Problems in the urban areas could include: • Housing including growth of shanty towns • Pressure on services such as education and healthcare provision • Pressure on public infrastructure such as transport, water, electricity and sanitation • Unemployment/underemployment / growth of informal sector • Tensions between older and newer residents / between different immigrant groups • Increases the price of commodities, housing and transport • Other However, some of these could be addressed e.g. self -help programmes to improve housing, investments in services. Benefits to the urban areas (counterarguments) could include: • Supply of (low paid) labour • New skills • Cultural diversity • Over time migrants can aid longer term development as they are healthier/better educated and can contribute to economy as well as improving their own life chances • Other Candidates may evaluate by considering changes over time, between places, number of migrants, governance of the area migrants move to. 5(c) Award marks based on the quality of the response using the marking levels below. Level 4 (12–15) Response thoroughly assesses the extent to which rural to urban migration in LICs/MICs causes problems in urban areas. Examples used are appropriate and integrated effectively into the response. Response is well founded in detailed knowledge and strong conceptual understanding of the topic. Level 3 (8–11) Response assesses the extent to which rural to urban migration in LICs/MICs causes problems in urban areas but may be unbalanced. Examples may lack detail or development. Response develops on a largely secure base of knowledge and understanding. Level 2 (4–7) Response shows general knowledge and understanding of the extent to which rural to urban migration in LICs/MICs causes problems in urban areas. Response is mainly descriptive or explanatory with limited use of examples and understanding of the topic may be partial or inaccurate. Some concluding remarks. General responses without the use of example(s) will not get above the middle of Level 2 (6 marks). Level 1 (1–3) Response may broadly discuss rural to urban migration or problems in urban areas but does not address the question and does not come to a convincing conclusion. Response is descriptive, knowledge is basic and understanding is poor. Level 0 (0) No creditable response. Settlement dynamics
Q6 · Describe how competition for space (spatial competition) leads to functional zonation in…
6 (a) Describe how competition for space (spatial competition) leads to functional zonation in urban areas. [7] (b) With the aid of examples, explain the role of planning in the location of activities in urban areas. [8] (c) ‘A globalised financial sector is the most important factor in defining a world city.’ With the aid of examples, how far do you agree with this statement? [15]
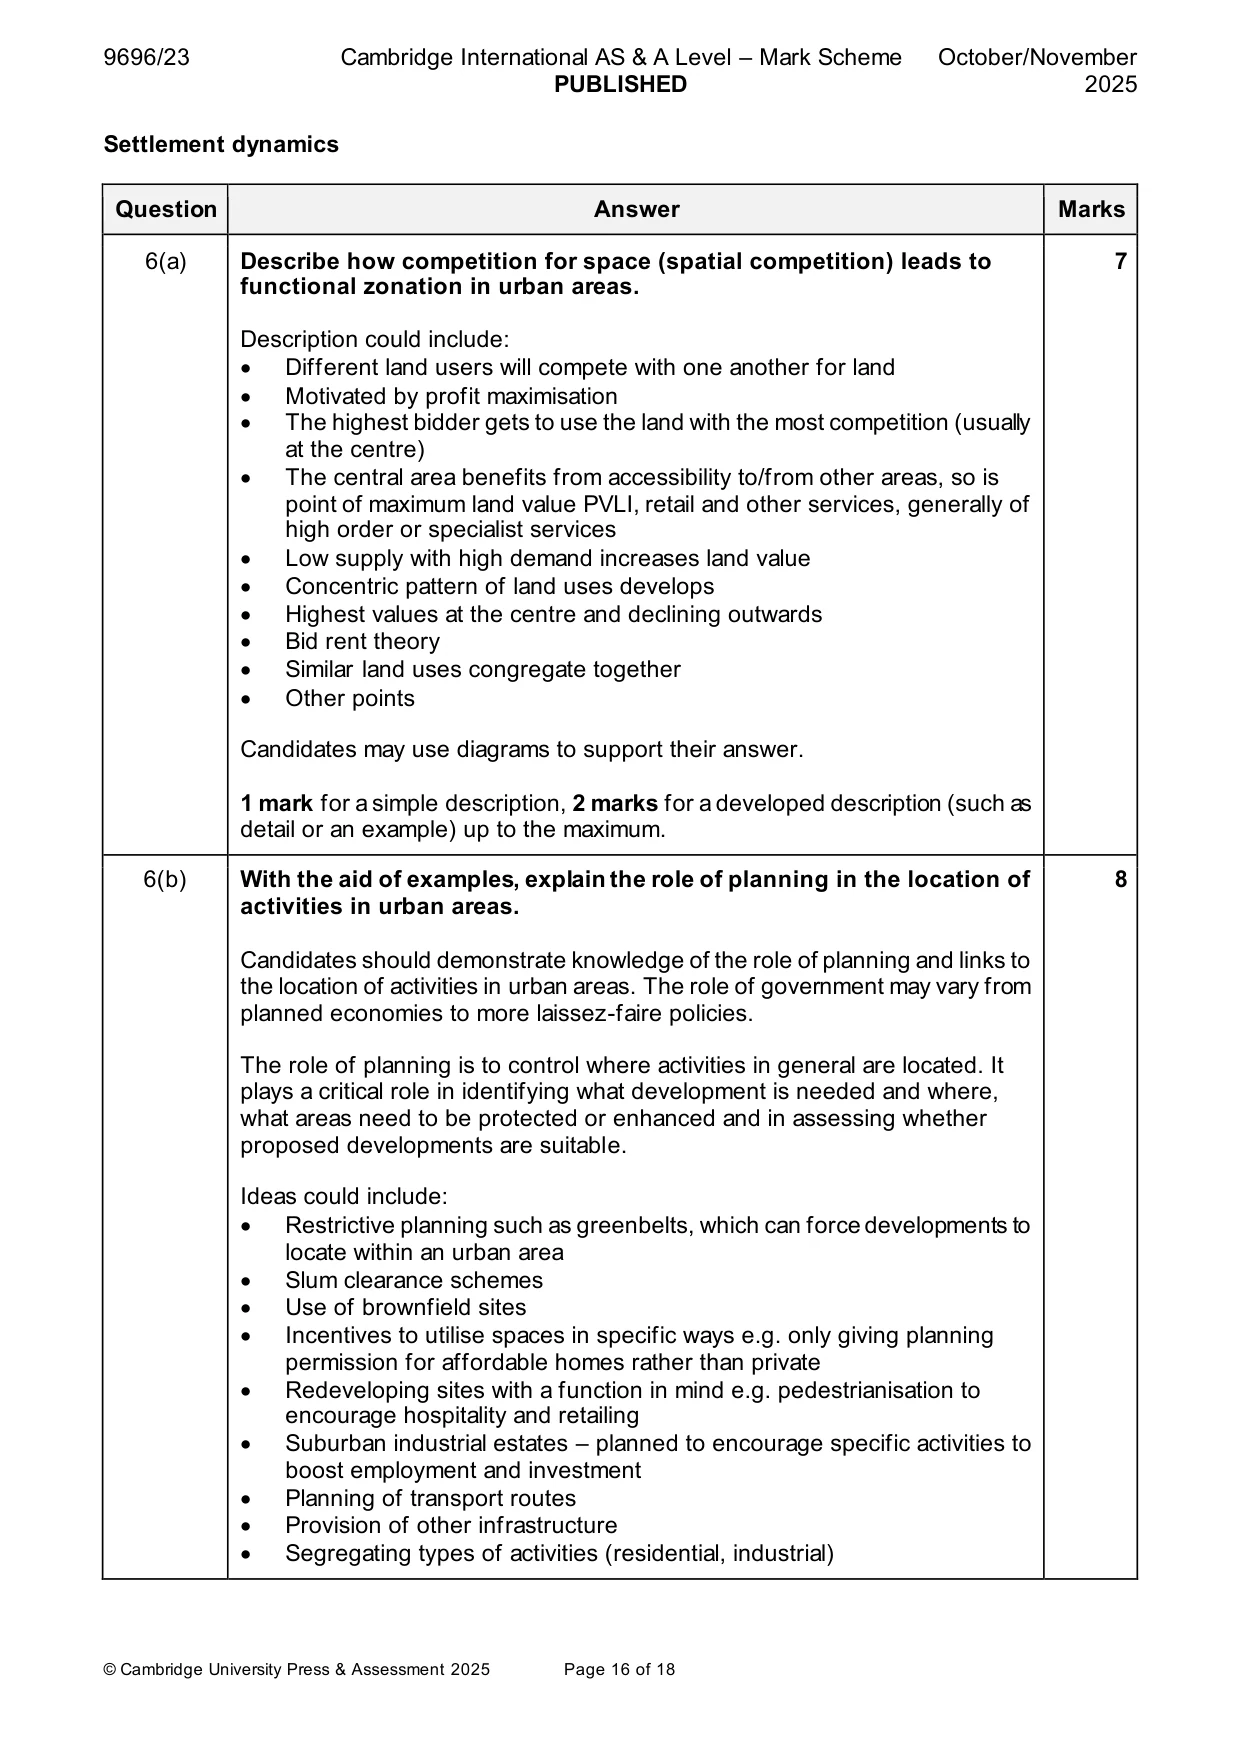
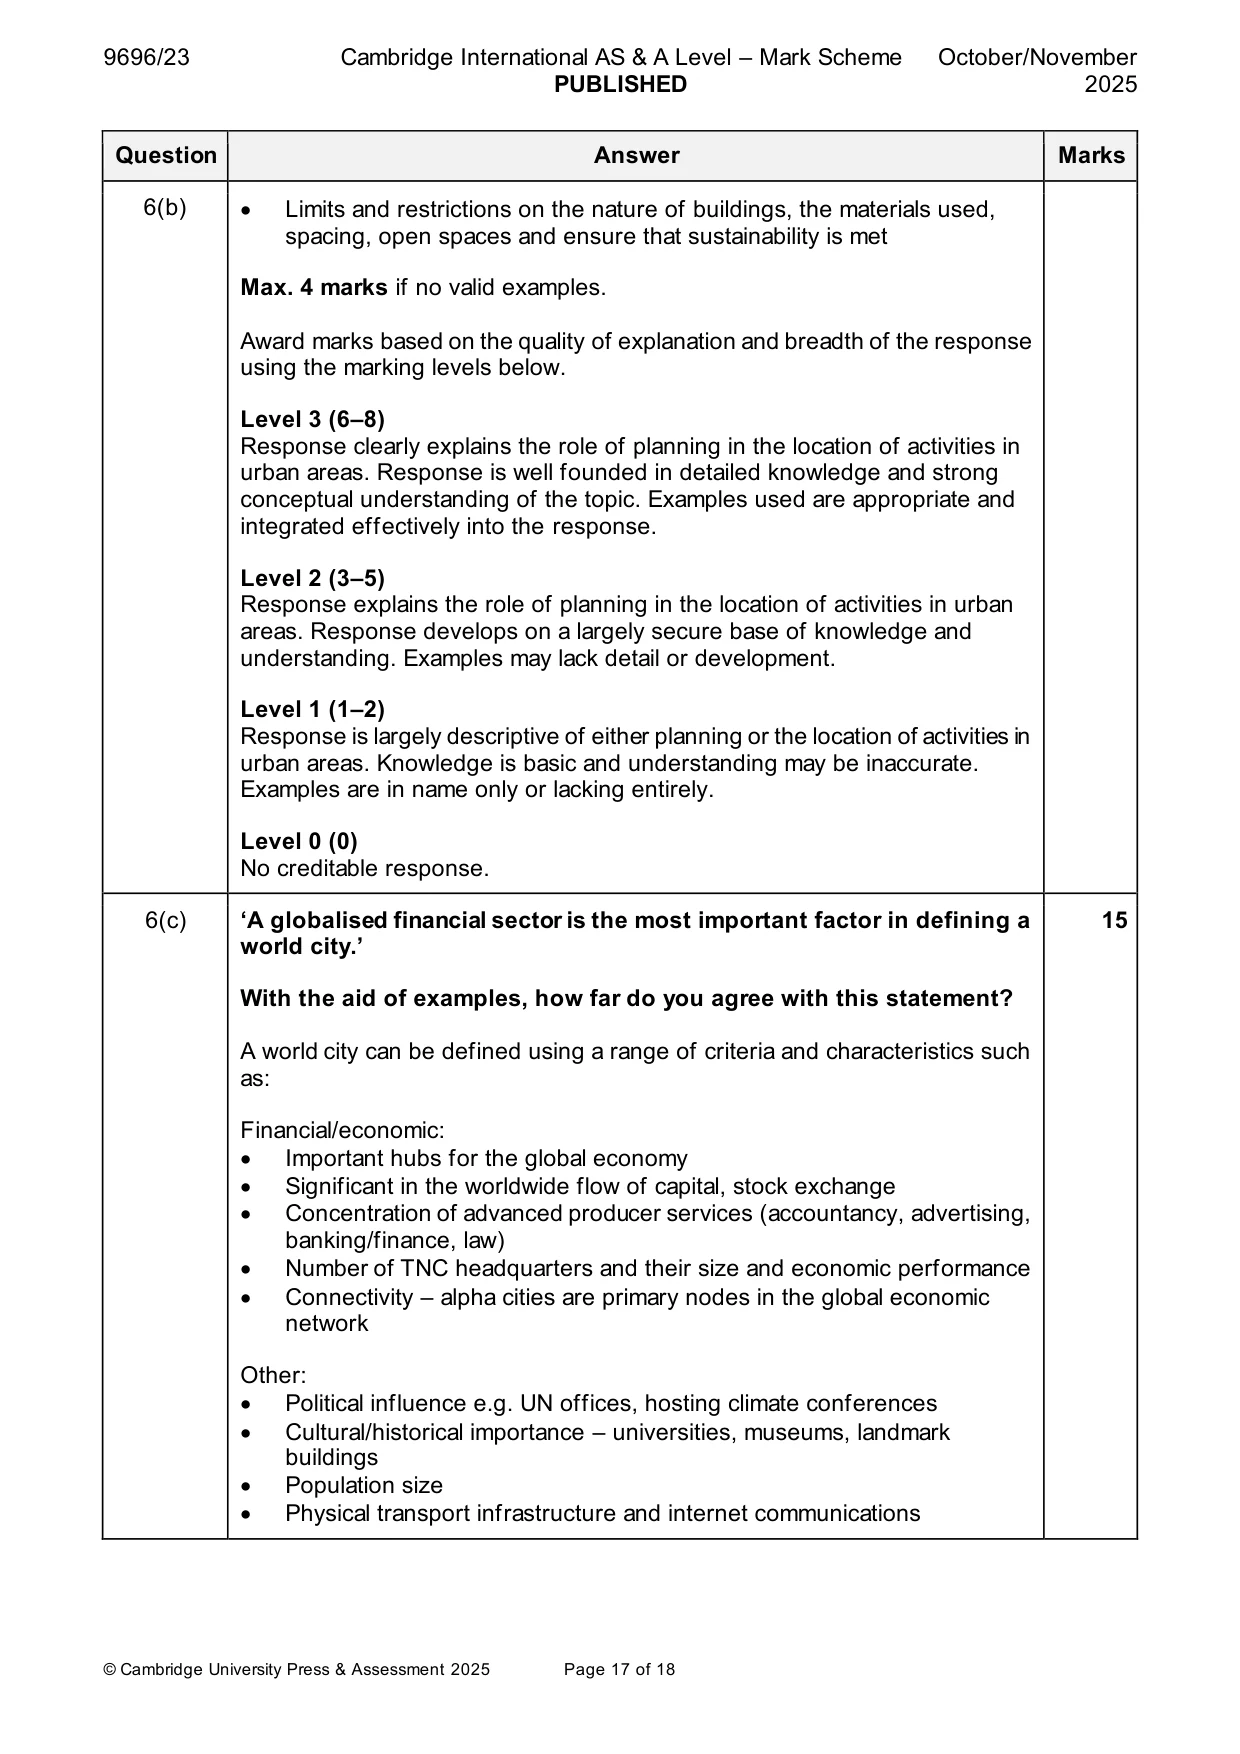
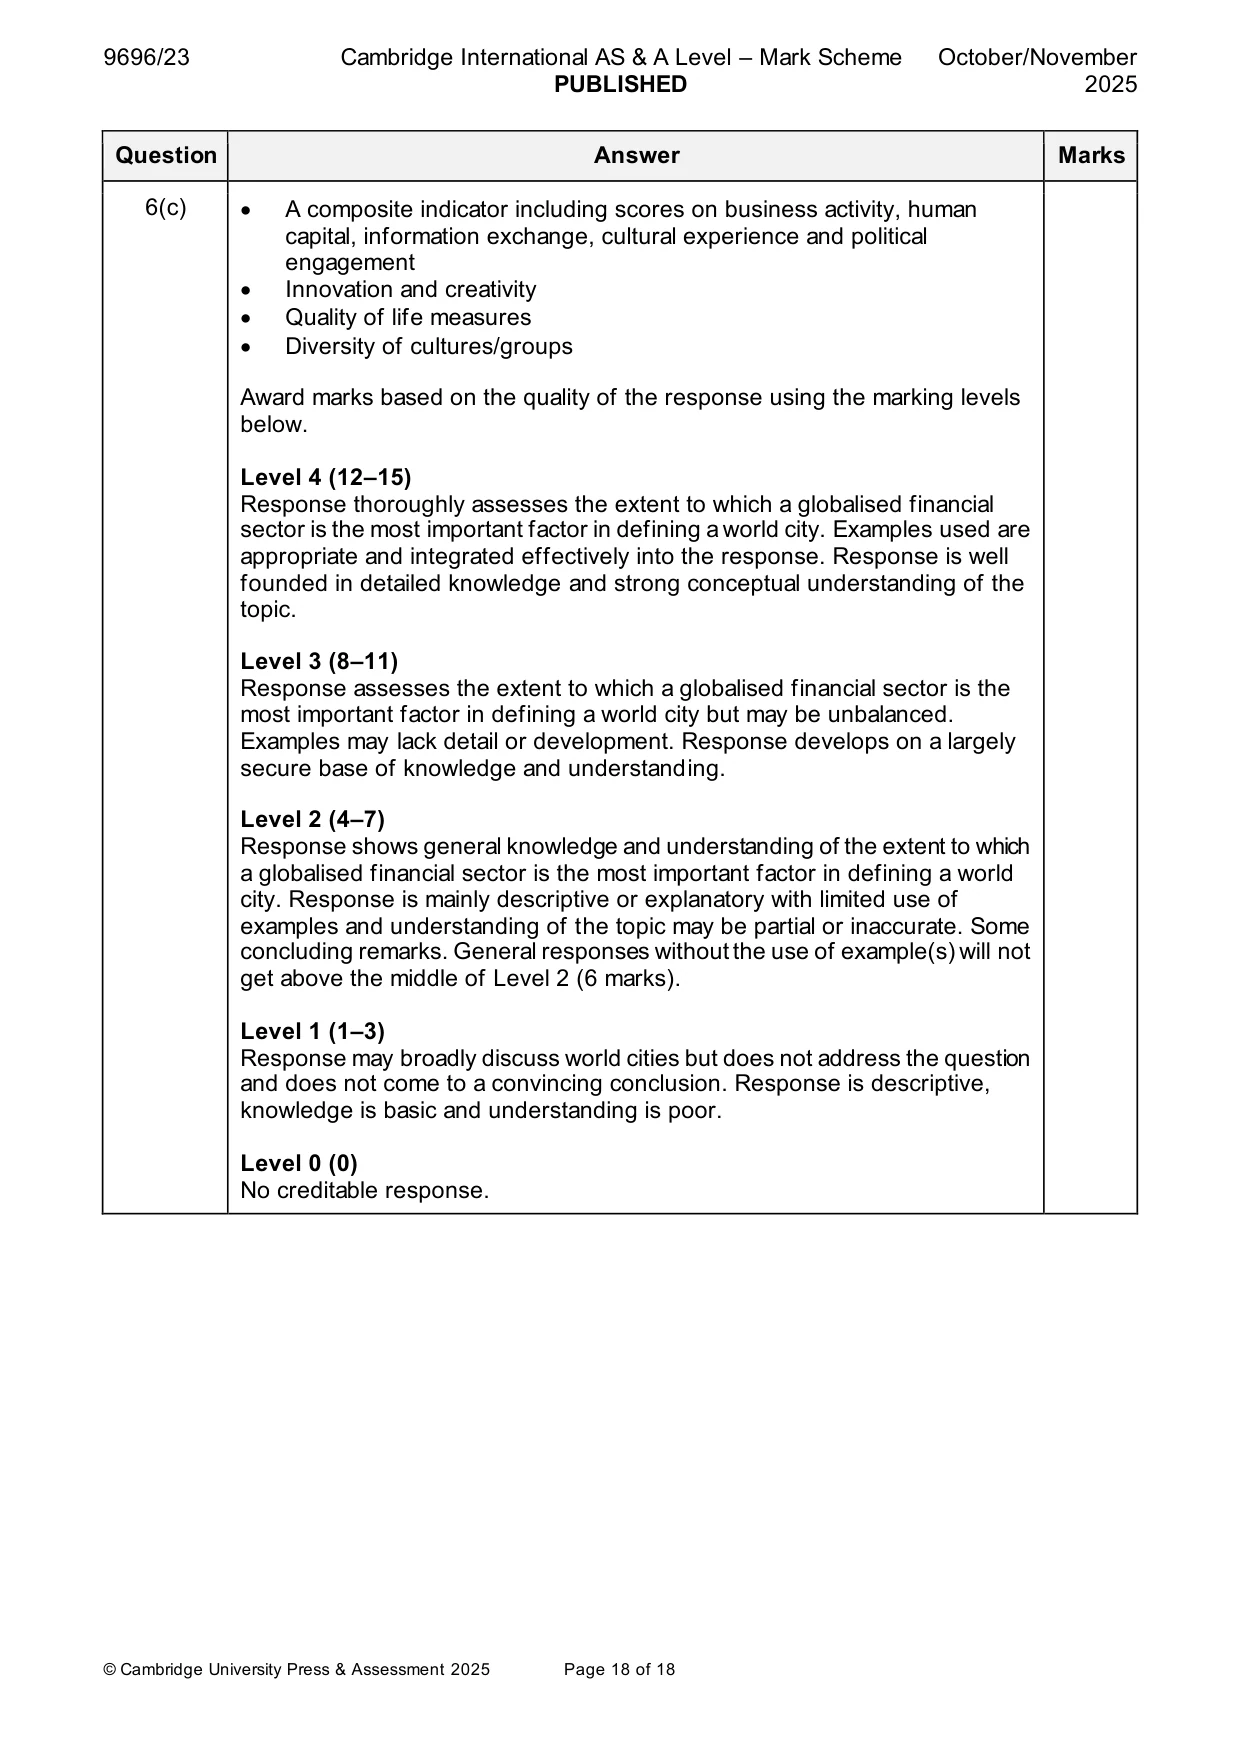
Mark scheme: 6(a) Describe how competition for space (spatial competition) leads to 7 functional zonation in urban areas. Description could include: • Different land users will compete with one another for land • Motivated by profit maximisation • The highest bidder gets to use the land with the most competition (usually at the centre) • The central area benefits from accessibility to/from other areas, so is point of maximum land value PVLI, retail and other services, generally of high order or specialist services • Low supply with high demand increases land value • Concentric pattern of land uses develops • Highest values at the centre and declining outwards • Bid rent theory • Similar land uses congregate together • Other points Candidates may use diagrams to support their answer. 1 mark for a simple description, 2 marks for a developed description (such as detail or an example) up to the maximum. 6(b) With the aid of examples, explain the role of planning in the location of 8 activities in urban areas. Candidates should demonstrate knowledge of the role of planning and links to the location of activities in urban areas. The role of government may vary from planned economies to more laissez-faire policies. The role of planning is to control where activities in general are located. It plays a critical role in identifying what development is needed and where, what areas need to be protected or enhanced and in assessing whether proposed developments are suitable. Ideas could include: • Restrictive planning such as greenbelts, which can force developments to locate within an urban area • Slum clearance schemes • Use of brownfield sites • Incentives to utilise spaces in specific ways e.g. only giving planning permission for affordable homes rather than private • Redeveloping sites with a function in mind e.g. pedestrianisation to encourage hospitality and retailing • Suburban industrial estates – planned to encourage specific activities to boost employment and investment • Planning of transport routes • Provision of other infrastructure • Segregating types of activities (residential, industrial) 6(b) • Limits and restrictions on the nature of buildings, the materials used, spacing, open spaces and ensure that sustainability is met Max. 4 marks if no valid examples. Award marks based on the quality of explanation and breadth of the response using the marking levels below. Level 3 (6–8) Response clearly explains the role of planning in the location of activities in urban areas. Response is well founded in detailed knowledge and strong conceptual understanding of the topic. Examples used are appropriate and integrated effectively into the response. Level 2 (3–5) Response explains the role of planning in the location of activities in urban areas. Response develops on a largely secure base of knowledge and understanding. Examples may lack detail or development. Level 1 (1–2) Response is largely descriptive of either planning or the location of activities in urban areas. Knowledge is basic and understanding may be inaccurate. Examples are in name only or lacking entirely. Level 0 (0) No creditable response. 6(c) ‘A globalised financial sector is the most important factor in defining a 15 world city.’ With the aid of examples, how far do you agree with this statement? A world city can be defined using a range of criteria and characteristics such as: Financial/economic: • Important hubs for the global economy • Significant in the worldwide flow of capital, stock exchange • Concentration of advanced producer services (accountancy, advertising, banking/finance, law) • Number of TNC headquarters and their size and economic performance • Connectivity – alpha cities are primary nodes in the global economic network Other: • Political influence e.g. UN offices, hosting climate conferences • Cultural/historical importance – universities, museums, landmark buildings • Population size • Physical transport infrastructure and internet communications 6(c) • A composite indicator including scores on business activity, human capital, information exchange, cultural experience and political engagement • Innovation and creativity • Quality of life measures • Diversity of cultures/groups Award marks based on the quality of the response using the marking levels below. Level 4 (12–15) Response thoroughly assesses the extent to which a globalised financial sector is the most important factor in defining a world city. Examples used are appropriate and integrated effectively into the response. Response is well founded in detailed knowledge and strong conceptual understanding of the topic. Level 3 (8–11) Response assesses the extent to which a globalised financial sector is the most important factor in defining a world city but may be unbalanced. Examples may lack detail or development. Response develops on a largely secure base of knowledge and understanding. Level 2 (4–7) Response shows general knowledge and understanding of the extent to which a globalised financial sector is the most important factor in defining a world city. Response is mainly descriptive or explanatory with limited use of examples and understanding of the topic may be partial or inaccurate. Some concluding remarks. General responses without the use of example(s) will not get above the middle of Level 2 (6 marks). Level 1 (1–3) Response may broadly discuss world cities but does not address the question and does not come to a convincing conclusion. Response is descriptive, knowledge is basic and understanding is poor. Level 0 (0) No creditable response.
What was in this paper
The subtopics covered by these 6 questions, and how many questions each got. Open one in a new tab to see every Cambridge question on it.
What you needed in this session
Cambridge’s own grade thresholds for 2025 Oct/Nov, Paper 2 · Variant 3. A higher threshold means an easier paper — the bar moves with how the cohort did.