Cambridge A Level Geography 9696 — 2024 Oct/Nov Paper 2 · Variant 3
9696/23/O/N/24 · 6 questions · 60 marks · ≈68 min
The question paper and its mark scheme, free to read here and free to download. This is Cambridge’s own paper, exactly as it was sat.
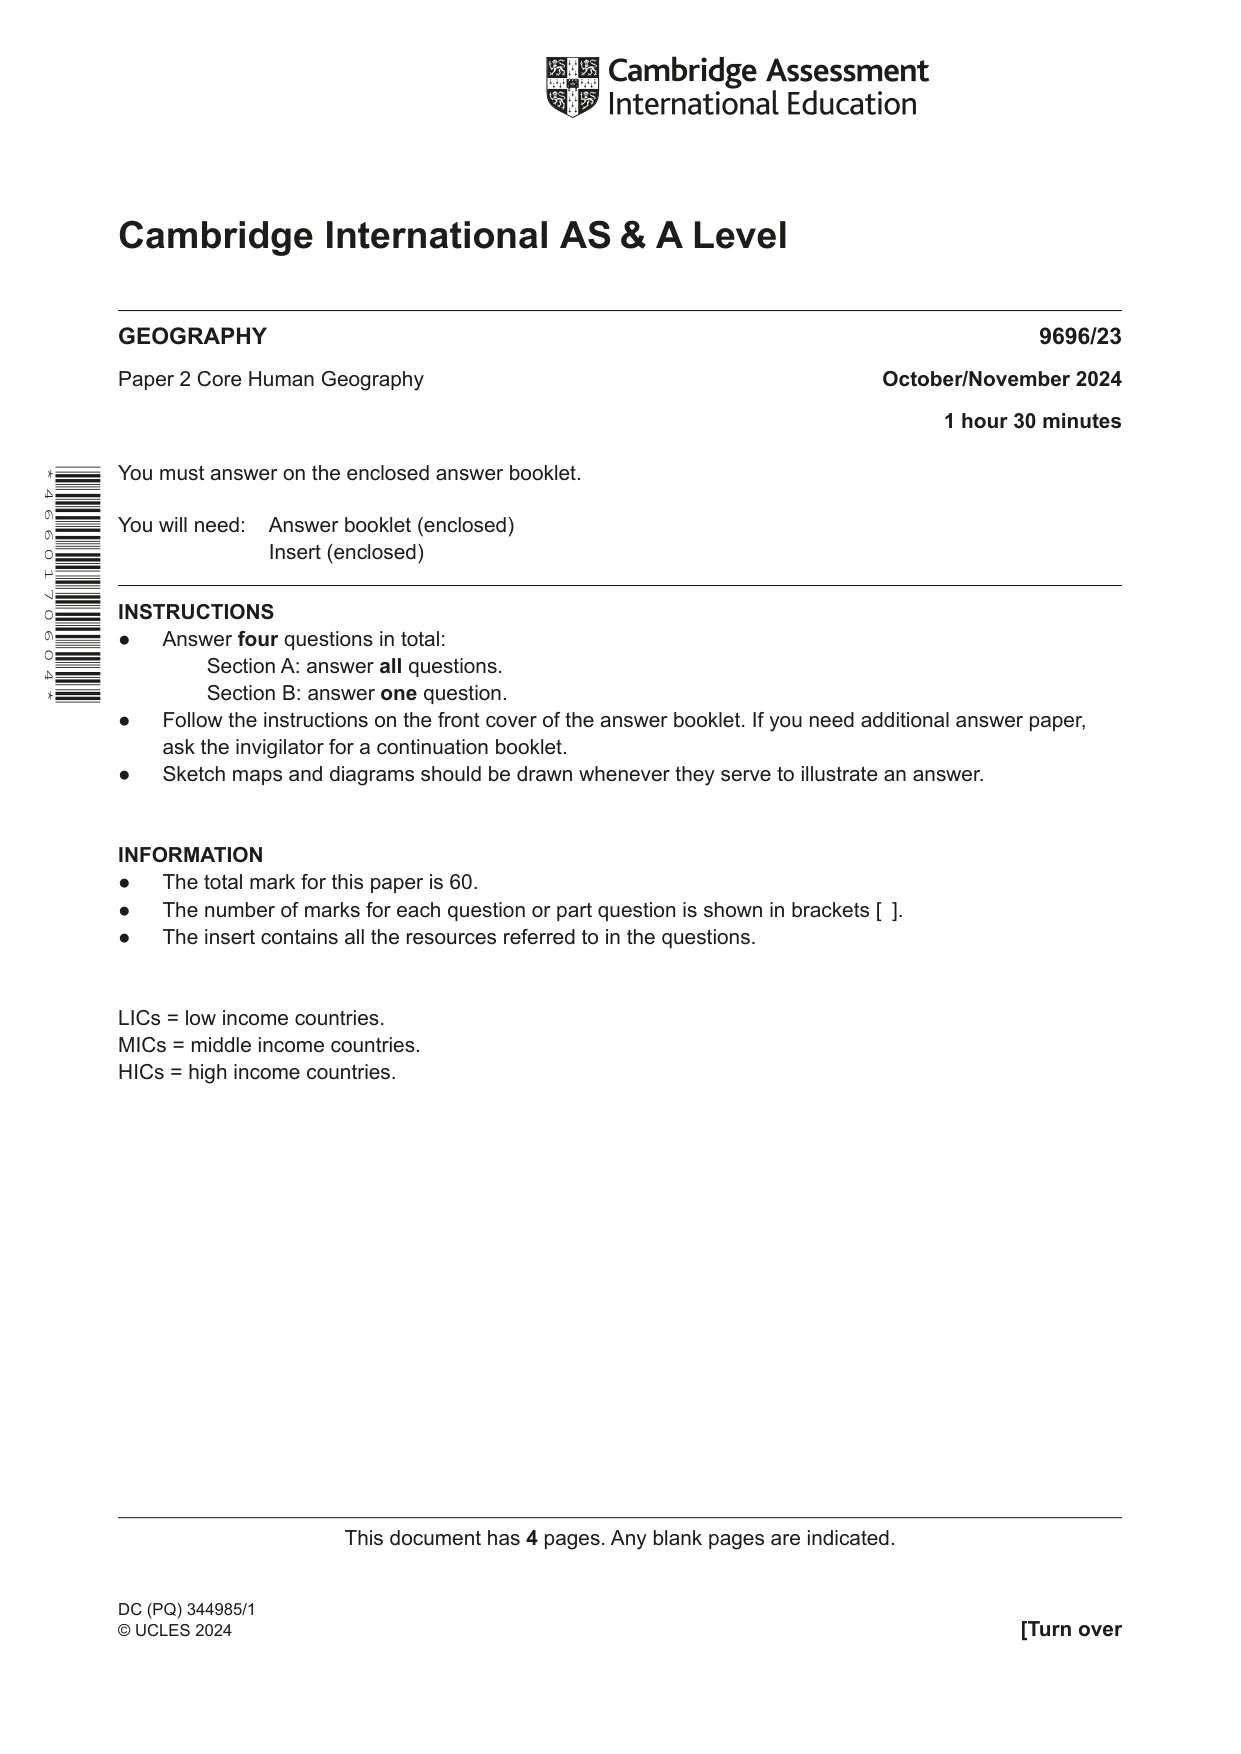
Question paper4 pages

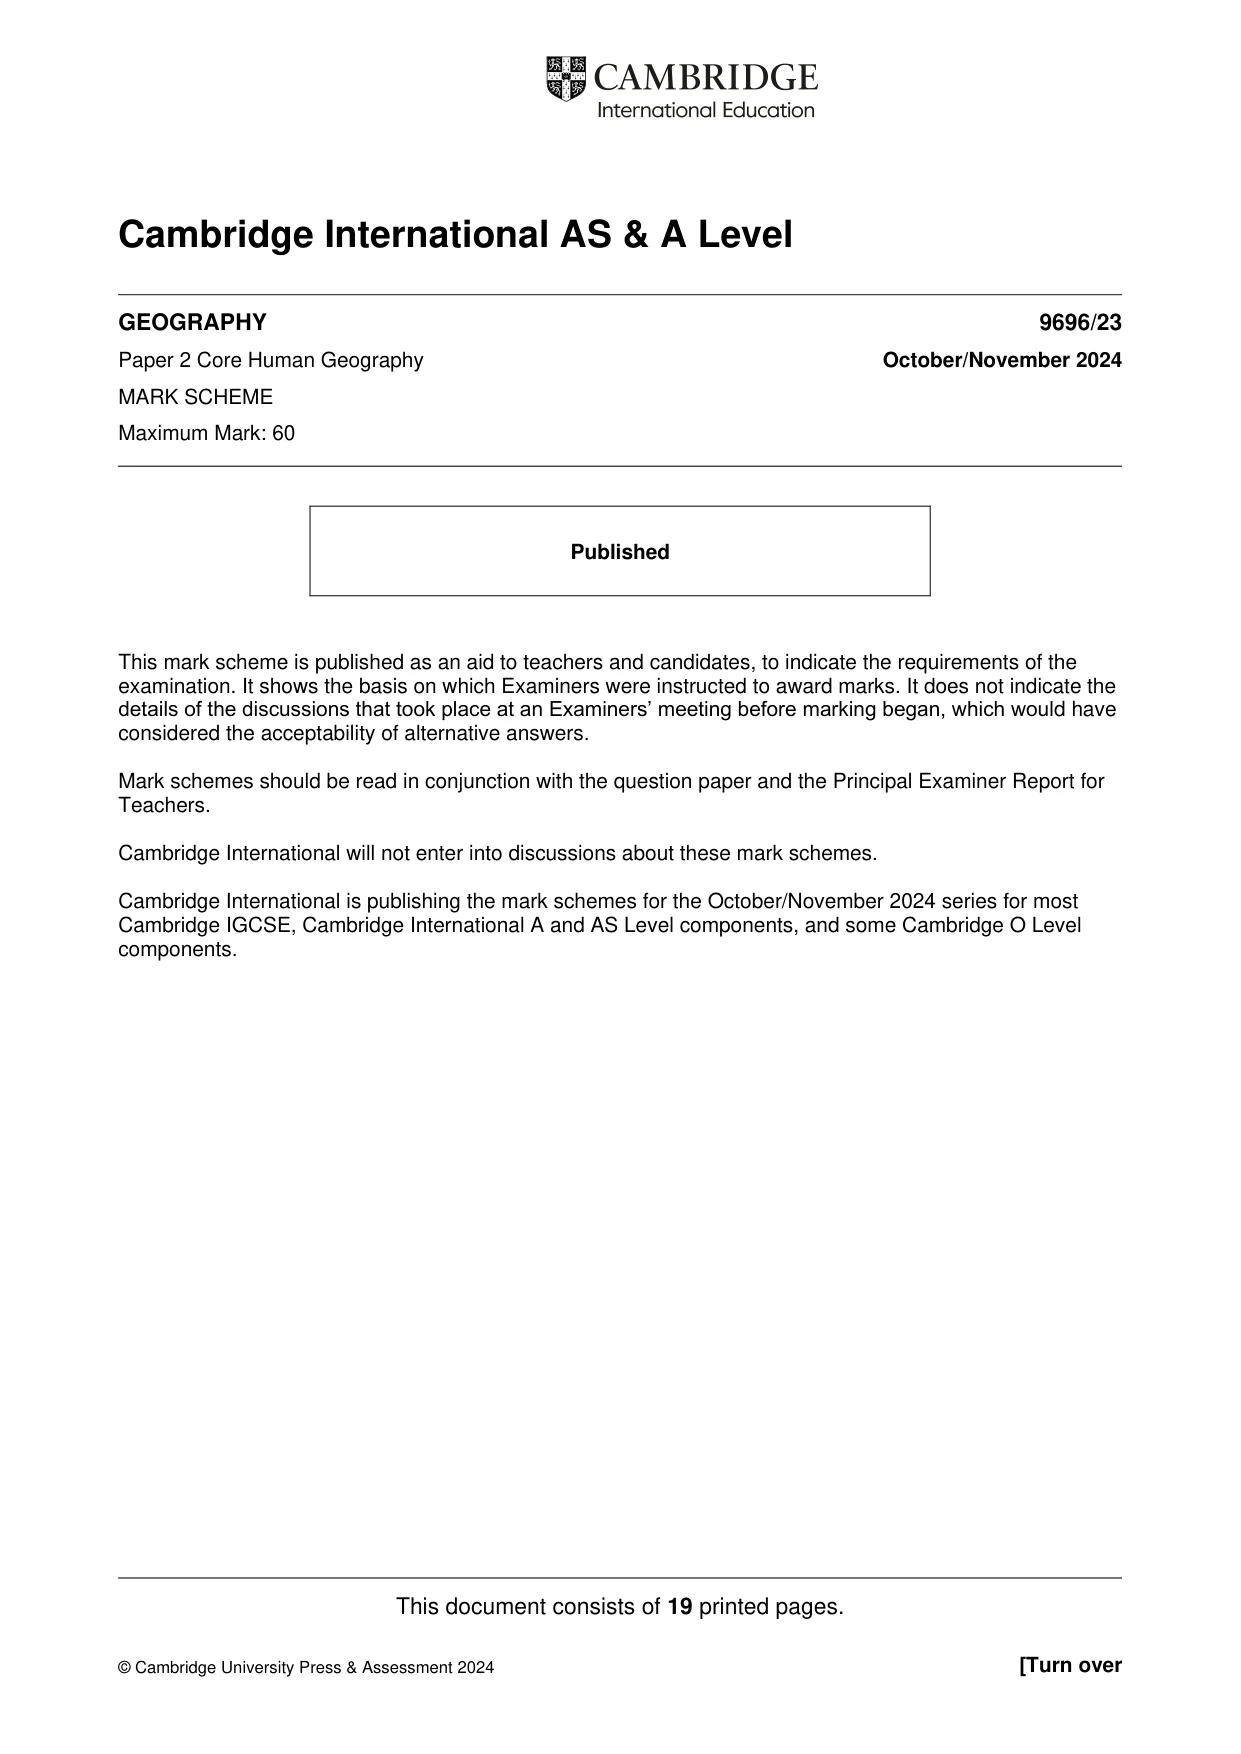
Mark scheme19 pages
Answers below. Sit the paper first if you are practising.


Questions as text
Q1 · Natural increase for selected countries from 1980 to 2020
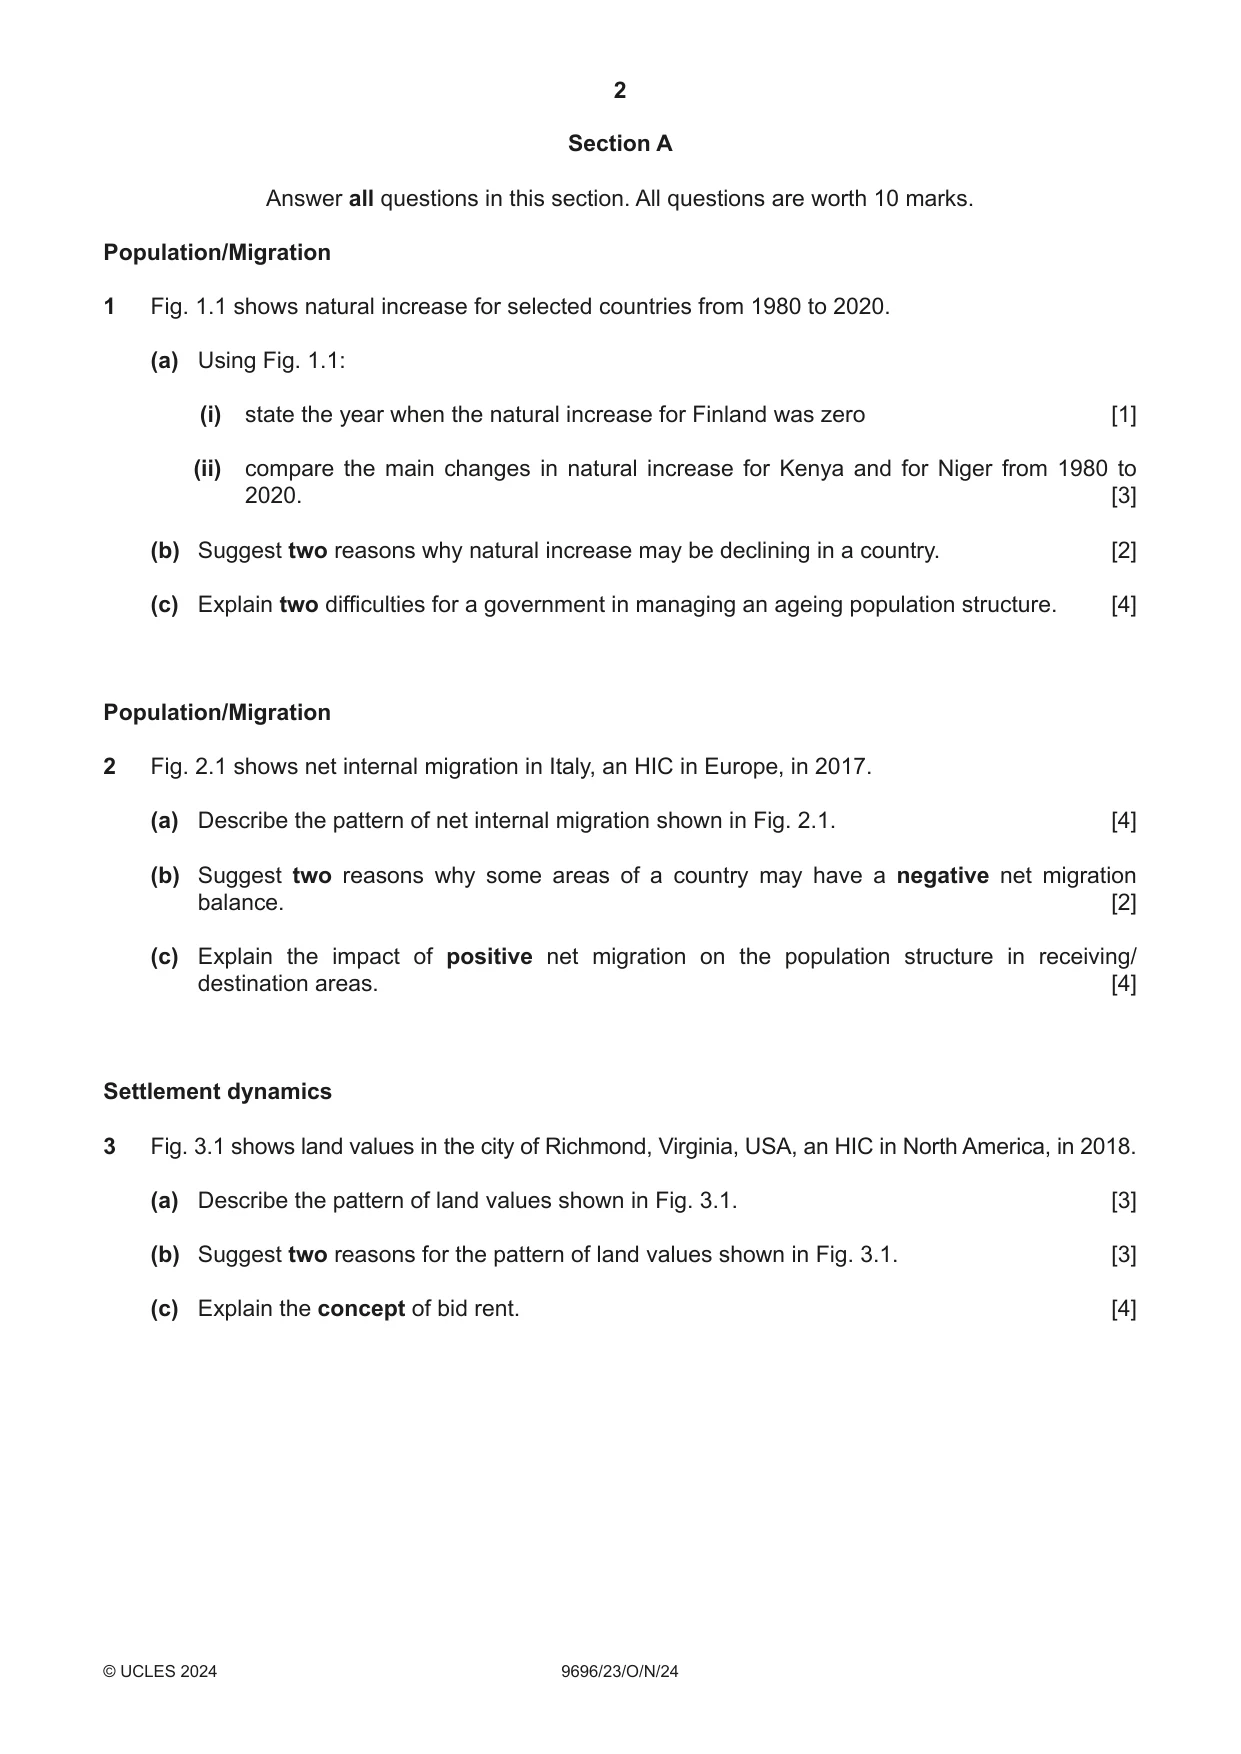
1 Fig. 1.1 shows natural increase for selected countries from 1980 to 2020. (a) Using Fig. 1.1: (i) state the year when the natural increase for Finland was zero [1] (ii) compare the main changes in natural increase for Kenya and for Niger from 1980 to 2020. [3] (b) Suggest two reasons why natural increase may be declining in a country. [2] (c) Explain two difficulties for a government in managing an ageing population structure. [4] Population/Migration
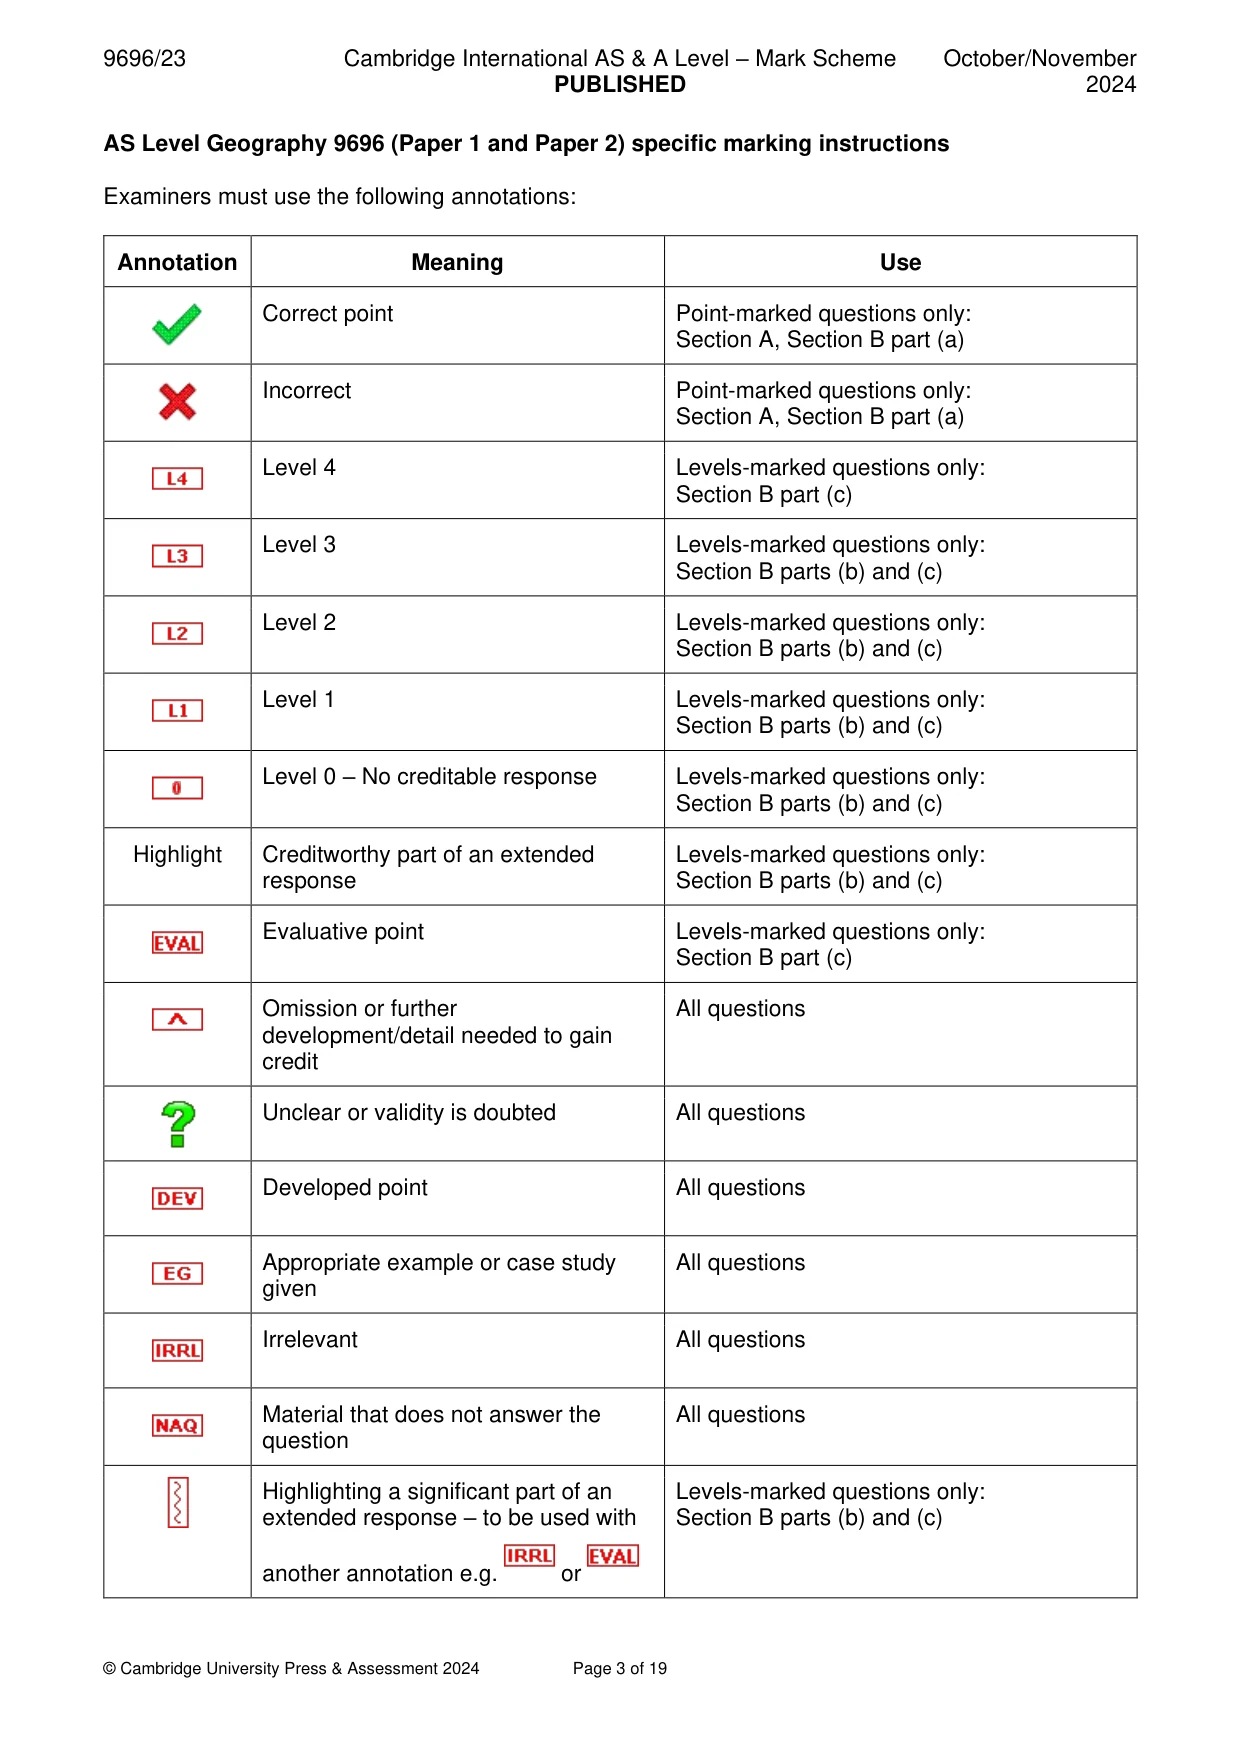
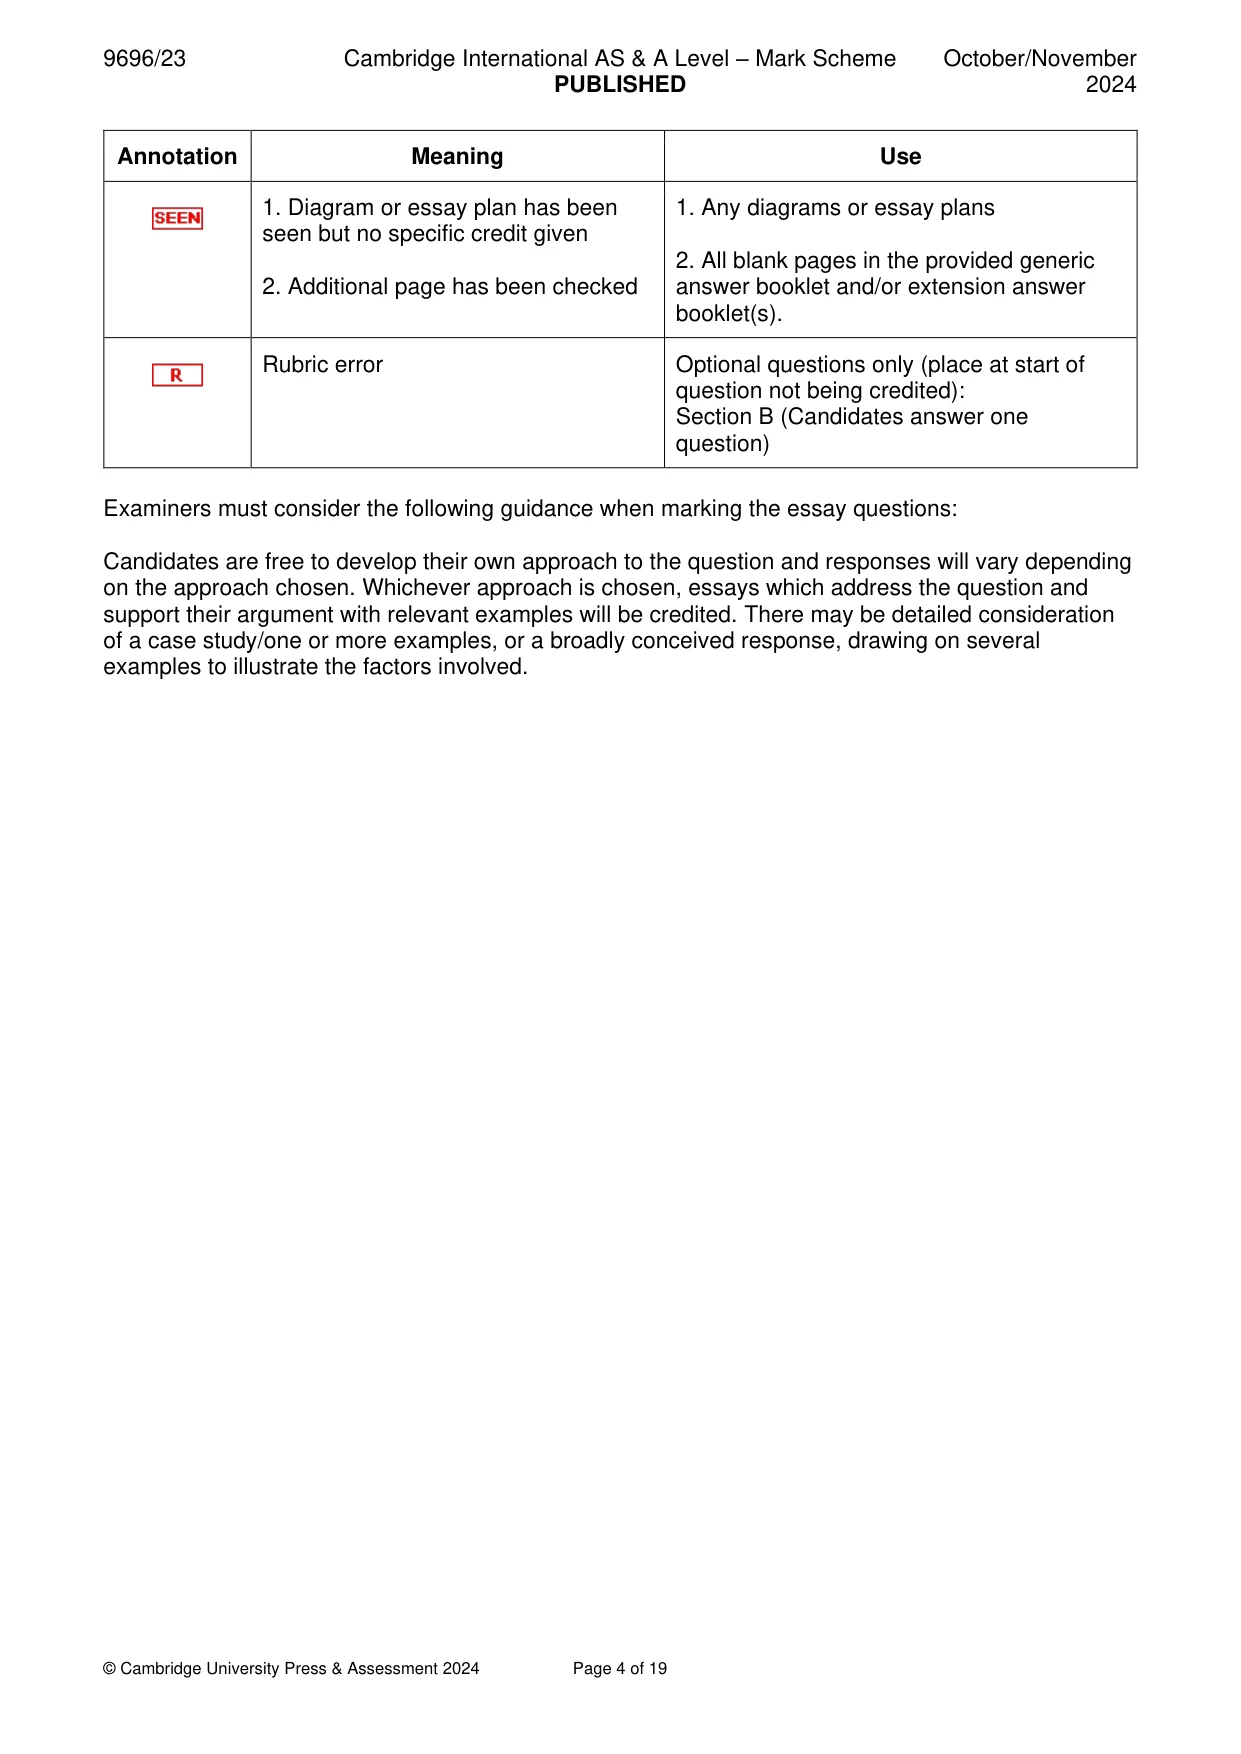
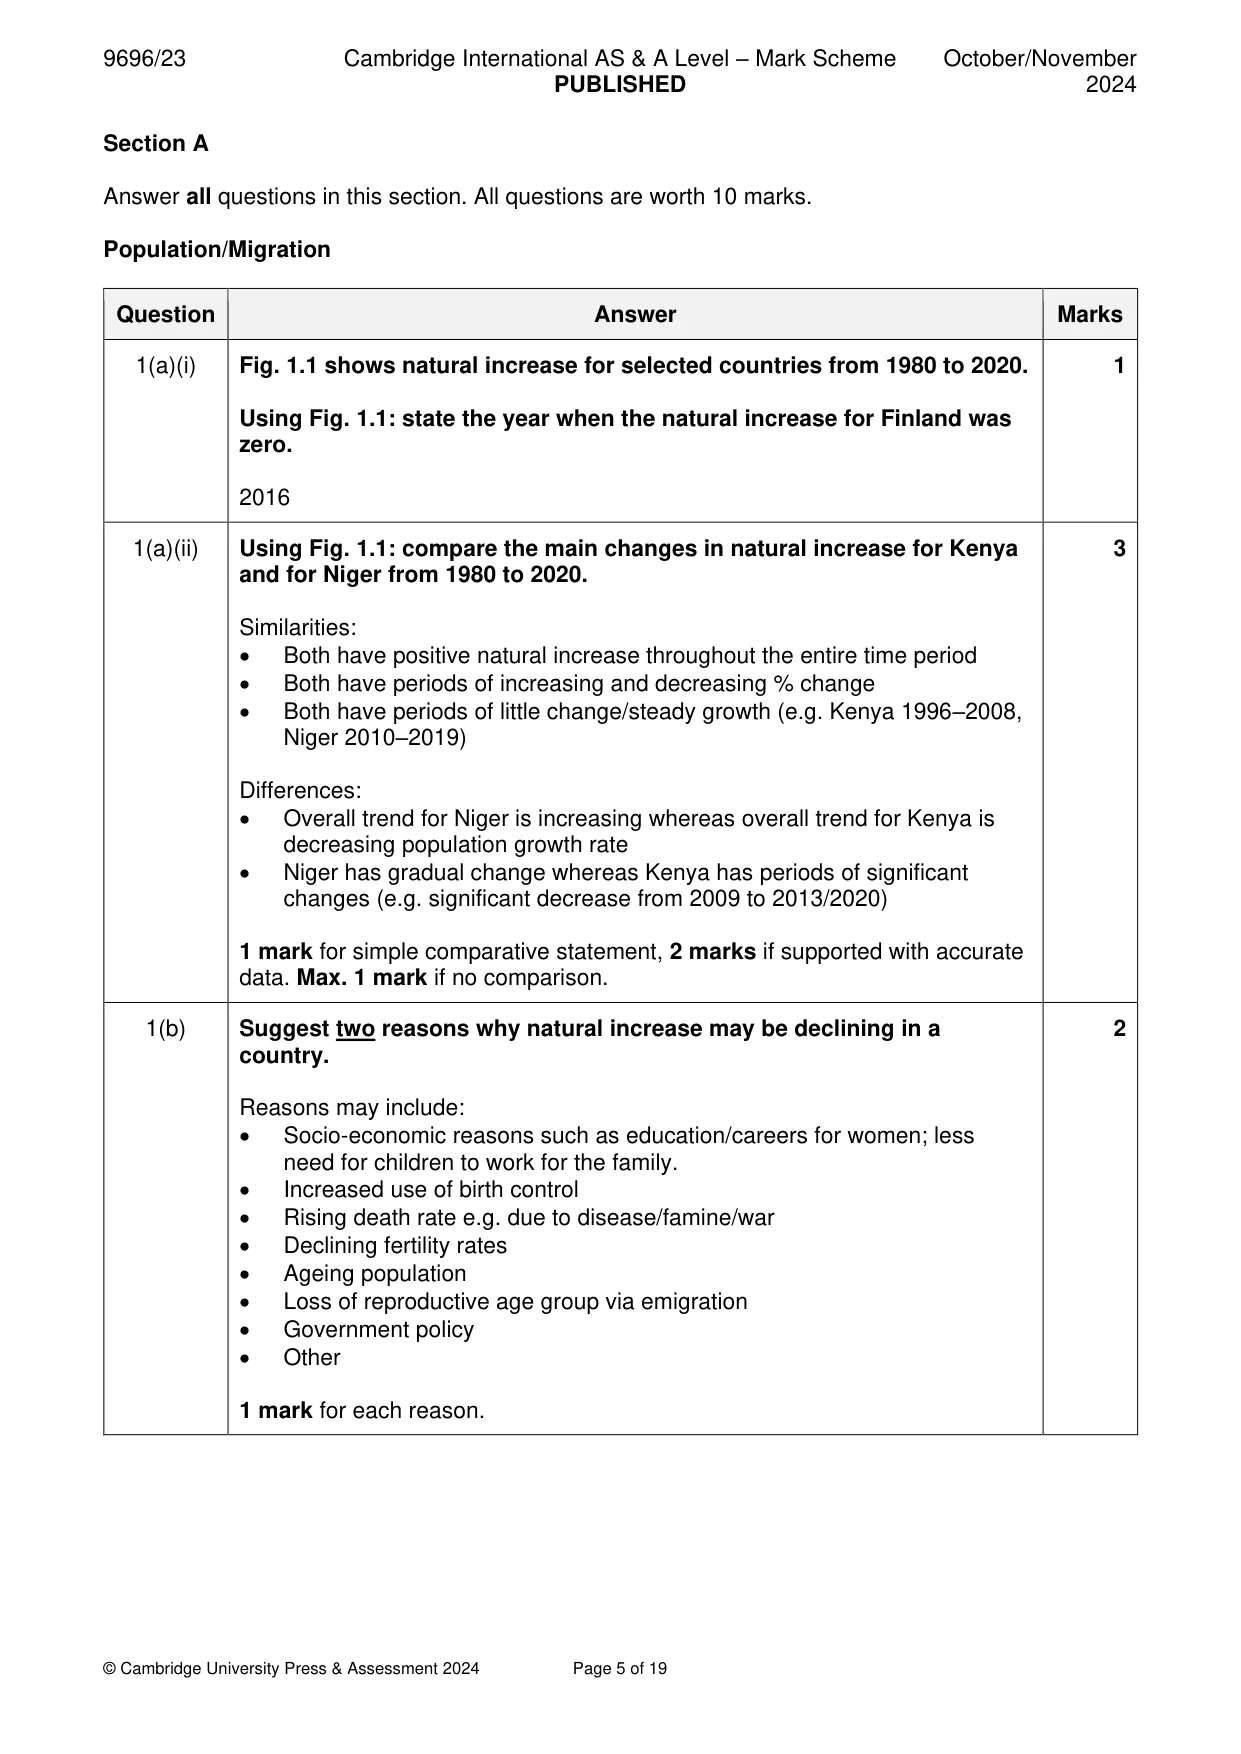
Mark scheme: Question Answer Marks 1(a)(i) Fig. 1.1 shows natural increase for selected countries from 1980 to 2020. 1 Using Fig. 1.1: state the year when the natural increase for Finland was zero. 2016 1(a)(ii) Using Fig. 1.1: compare the main changes in natural increase for Kenya 3 and for Niger from 1980 to 2020. Similarities: • Both have positive natural increase throughout the entire time period • Both have periods of increasing and decreasing % change • Both have periods of little change/steady growth (e.g. Kenya 1996–2008, Niger 2010–2019) Differences: • Overall trend for Niger is increasing whereas overall trend for Kenya is decreasing population growth rate • Niger has gradual change whereas Kenya has periods of significant changes (e.g. significant decrease from 2009 to 2013/2020) 1 mark for simple comparative statement, 2 marks if supported with accurate data. Max. 1 mark if no comparison. 1(b) Suggest two reasons why natural increase may be declining in a 2 country. Reasons may include: • Socio-economic reasons such as education/careers for women; less need for children to work for the family. • Increased use of birth control • Rising death rate e.g. due to disease/famine/war • Declining fertility rates • Ageing population • Loss of reproductive age group via emigration • Government policy • Other 1 mark for each reason. 1(c) Explain two difficulties for a government in managing an ageing 4 population structure. Difficulties for a government in managing an ageing population structure might arise from economic, social, political and environmental issues such as: • High cost of providing services such as healthcare and long-term care, which may lead to higher taxation/burden on the working population • Declining numbers in workforce, loss of experience and expertise • Immigration policy may have to encourage overseas workers to fill vacancies and/or provide a workforce for the care and health services • Spending priority issues with lower tax revenues and rising public sector debt • Pro-natal policies • Other For each difficulty: 1 mark for a simple explanation, 2 marks for a developed explanation (with detail or an example) with further development (such as detail related to why it is an issue for government) for 3 marks. Population/Migration
Q2 · Net internal migration in Italy, an HIC in Europe, in 2017
2 Fig. 2.1 shows net internal migration in Italy, an HIC in Europe, in 2017. (a) Describe the pattern of net internal migration shown in Fig. 2.1. [4] (b) Suggest two reasons why some areas of a country may have a negative net migration balance. [2] (c) Explain the impact of positive net migration on the population structure in receiving/ destination areas. [4] Settlement dynamics
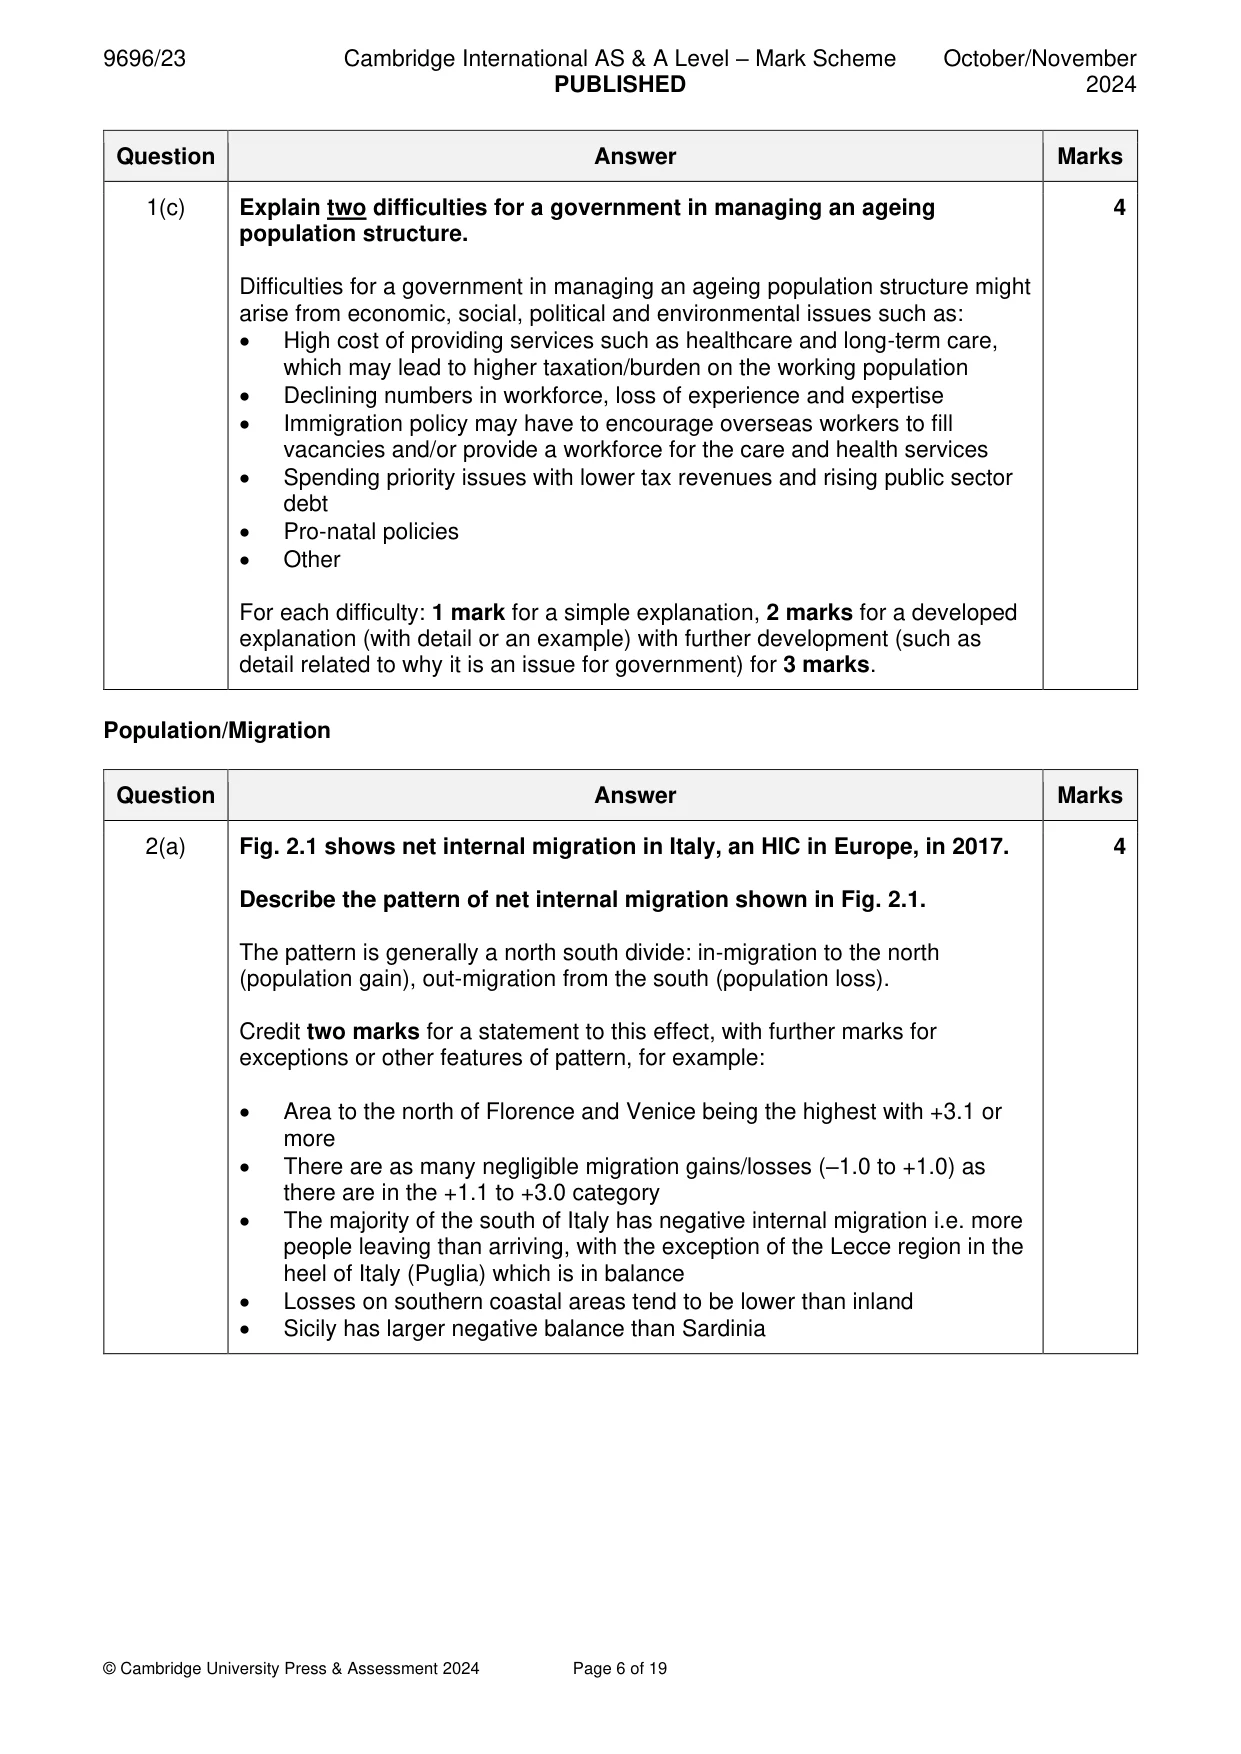
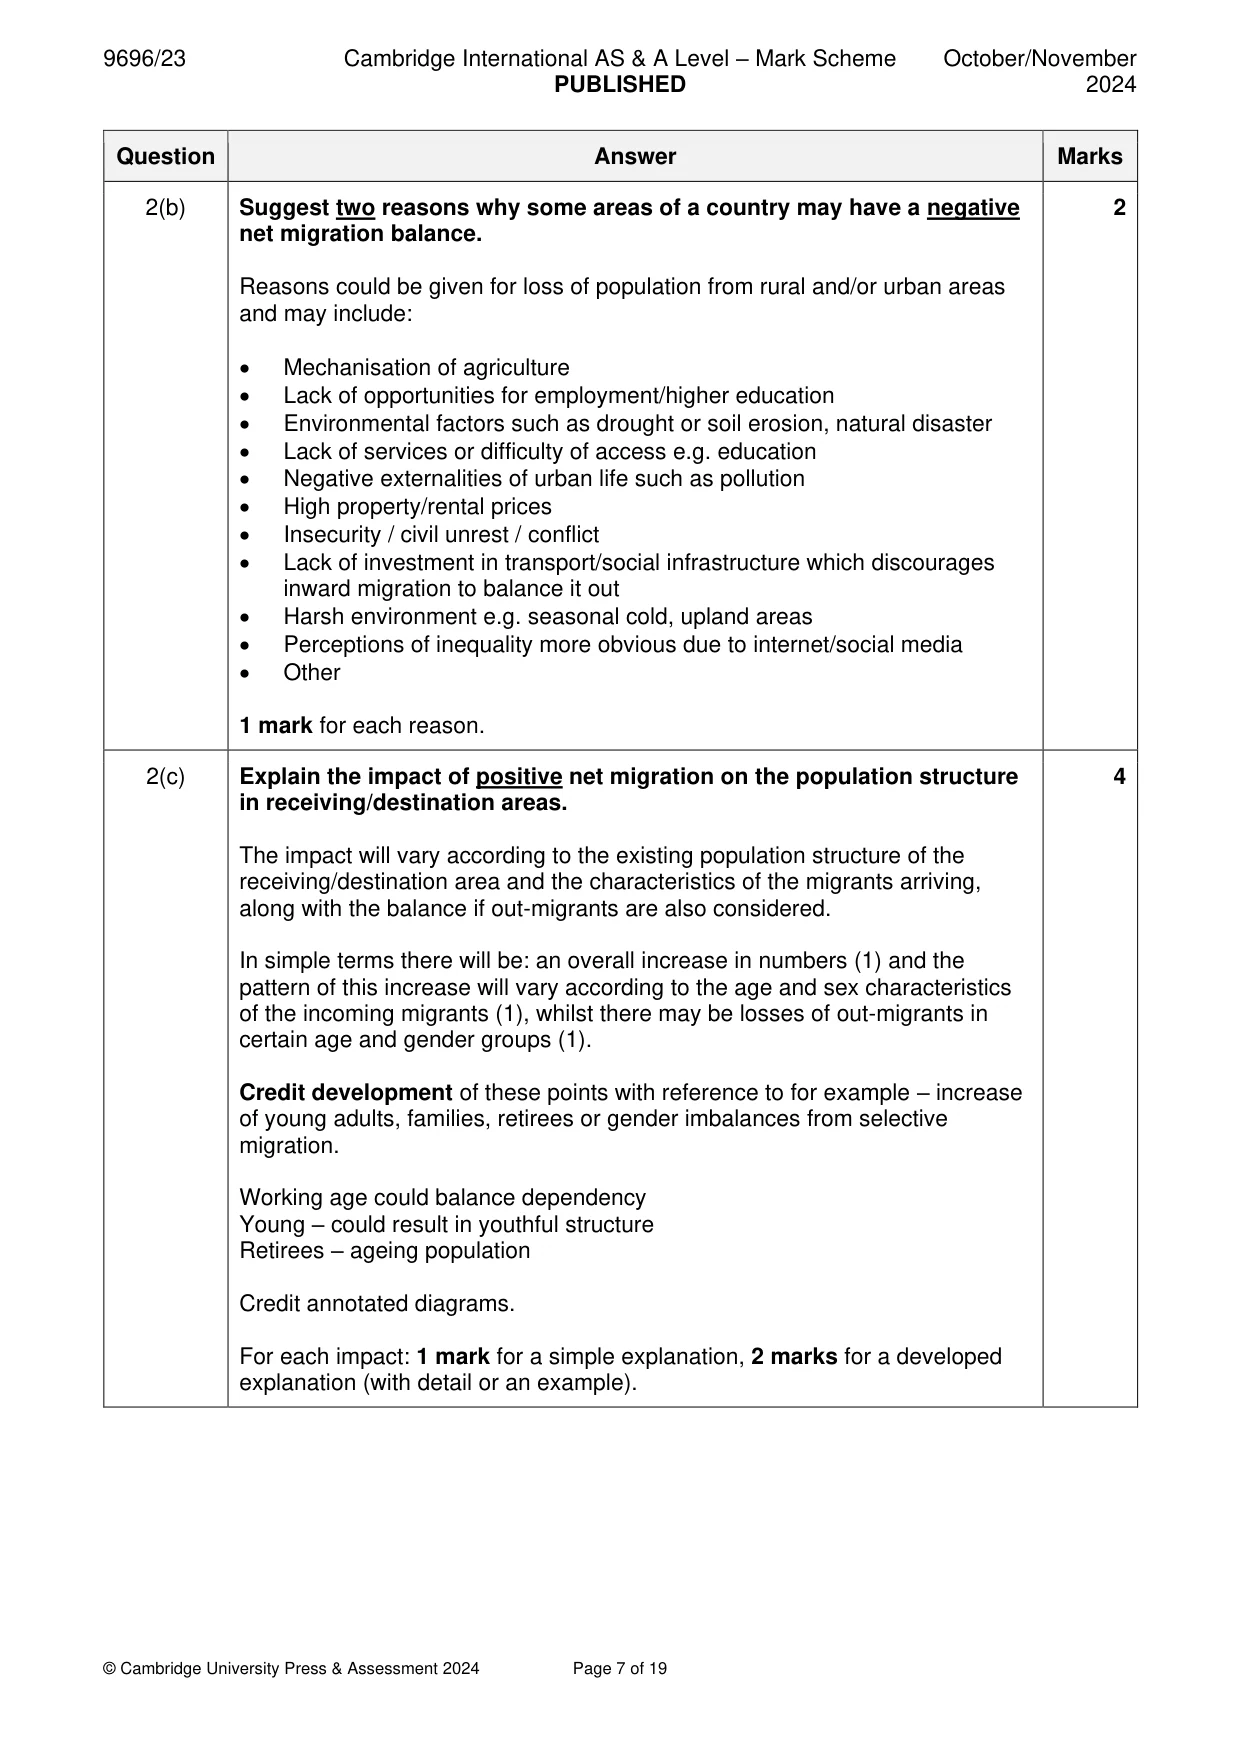
Mark scheme: 2(a) Fig. 2.1 shows net internal migration in Italy, an HIC in Europe, in 2017. 4 Describe the pattern of net internal migration shown in Fig. 2.1. The pattern is generally a north south divide: in-migration to the north (population gain), out-migration from the south (population loss). Credit two marks for a statement to this effect, with further marks for exceptions or other features of pattern, for example: • Area to the north of Florence and Venice being the highest with +3.1 or more • There are as many negligible migration gains/losses (–1.0 to +1.0) as there are in the +1.1 to +3.0 category • The majority of the south of Italy has negative internal migration i.e. more people leaving than arriving, with the exception of the Lecce region in the heel of Italy (Puglia) which is in balance • Losses on southern coastal areas tend to be lower than inland • Sicily has larger negative balance than Sardinia 2(b) Suggest two reasons why some areas of a country may have a negative 2 net migration balance. Reasons could be given for loss of population from rural and/or urban areas and may include: • Mechanisation of agriculture • Lack of opportunities for employment/higher education • Environmental factors such as drought or soil erosion, natural disaster • Lack of services or difficulty of access e.g. education • Negative externalities of urban life such as pollution • High property/rental prices • Insecurity / civil unrest / conflict • Lack of investment in transport/social infrastructure which discourages inward migration to balance it out • Harsh environment e.g. seasonal cold, upland areas • Perceptions of inequality more obvious due to internet/social media • Other 1 mark for each reason. 2(c) Explain the impact of positive net migration on the population structure 4 in receiving/destination areas. The impact will vary according to the existing population structure of the receiving/destination area and the characteristics of the migrants arriving, along with the balance if out-migrants are also considered. In simple terms there will be: an overall increase in numbers (1) and the pattern of this increase will vary according to the age and sex characteristics of the incoming migrants (1), whilst there may be losses of out-migrants in certain age and gender groups (1). Credit development of these points with reference to for example – increase of young adults, families, retirees or gender imbalances from selective migration. Working age could balance dependency Young – could result in youthful structure Retirees – ageing population Credit annotated diagrams. For each impact: 1 mark for a simple explanation, 2 marks for a developed explanation (with detail or an example). Settlement dynamics
Q3 · Land values in the city of Richmond, Virginia, USA, an HIC in North America, in 2018
3 Fig. 3.1 shows land values in the city of Richmond, Virginia, USA, an HIC in North America, in 2018. (a) Describe the pattern of land values shown in Fig. 3.1. [3] (b) Suggest two reasons for the pattern of land values shown in Fig. 3.1. [3] (c) Explain the concept of bid rent. [4]
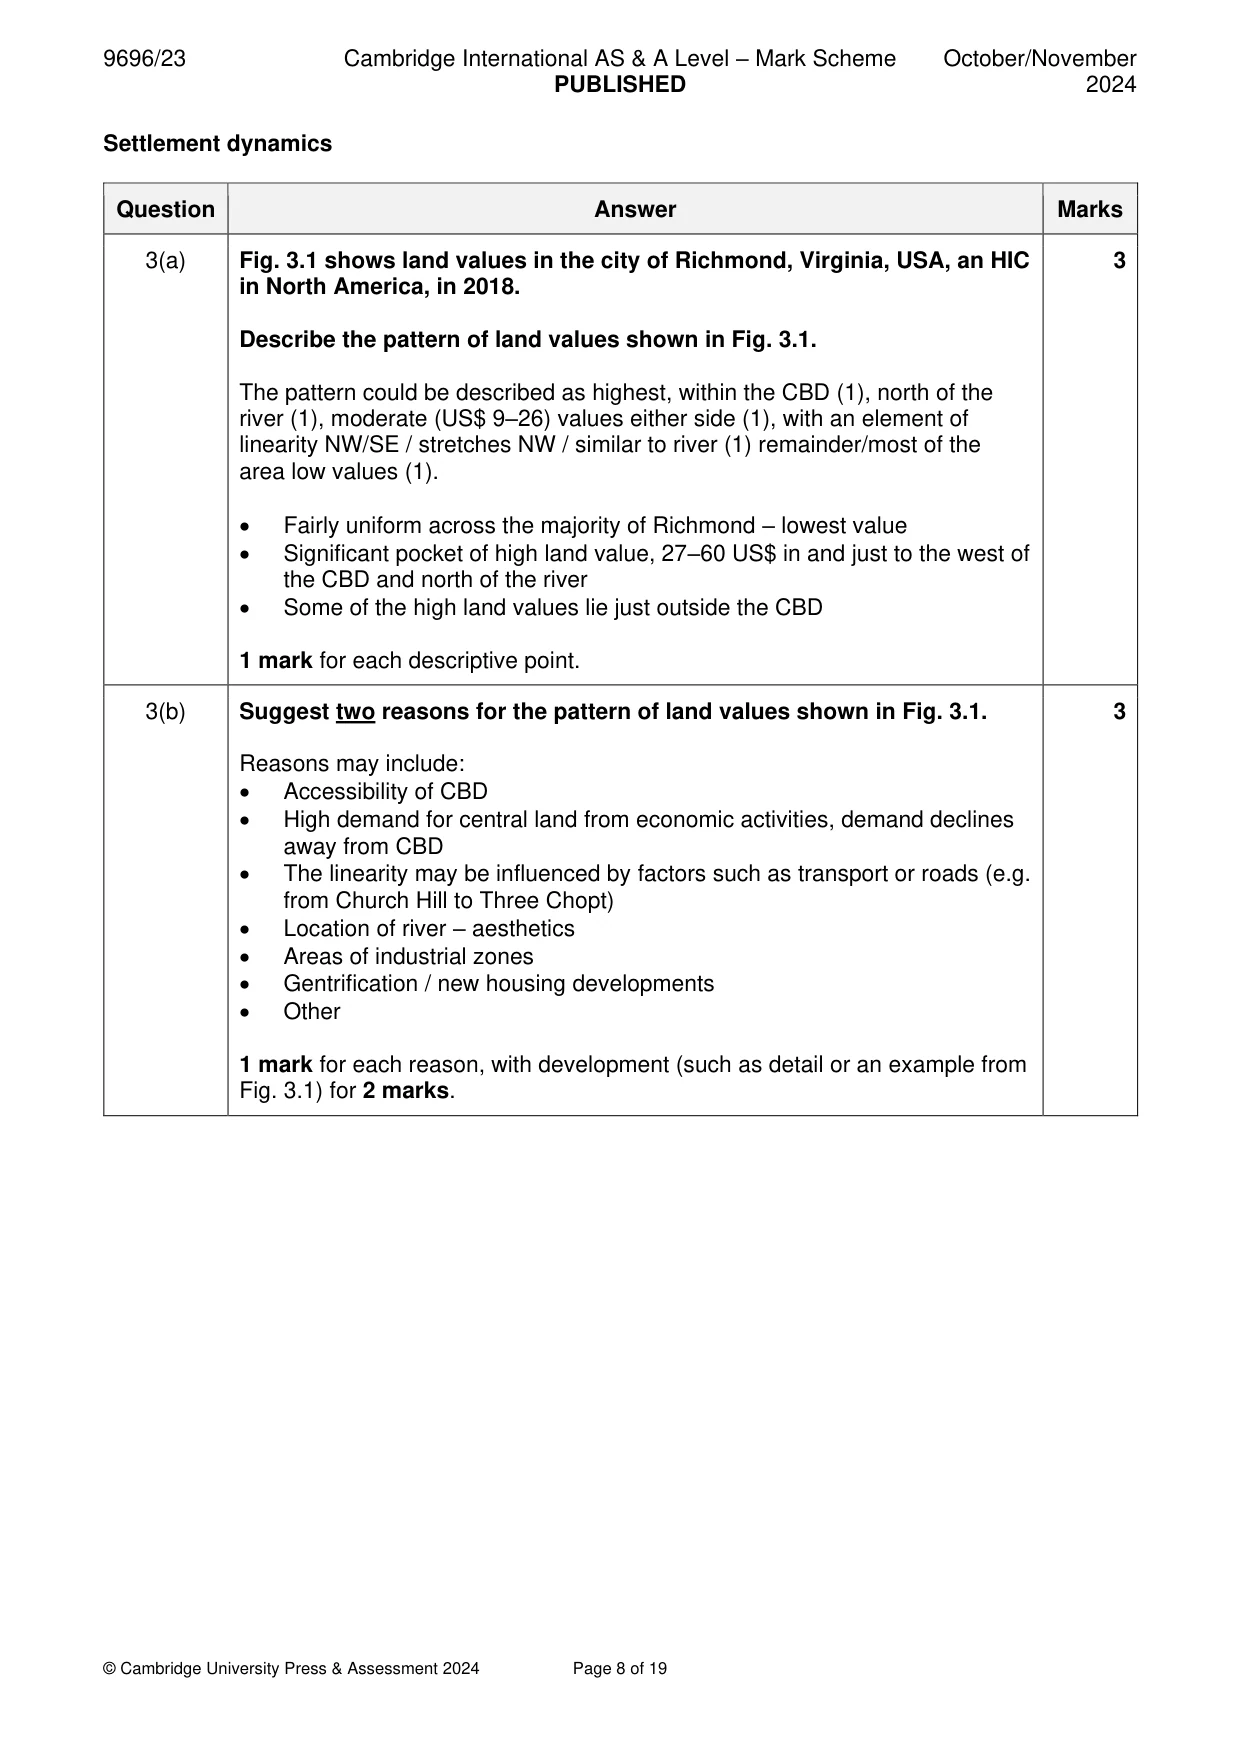
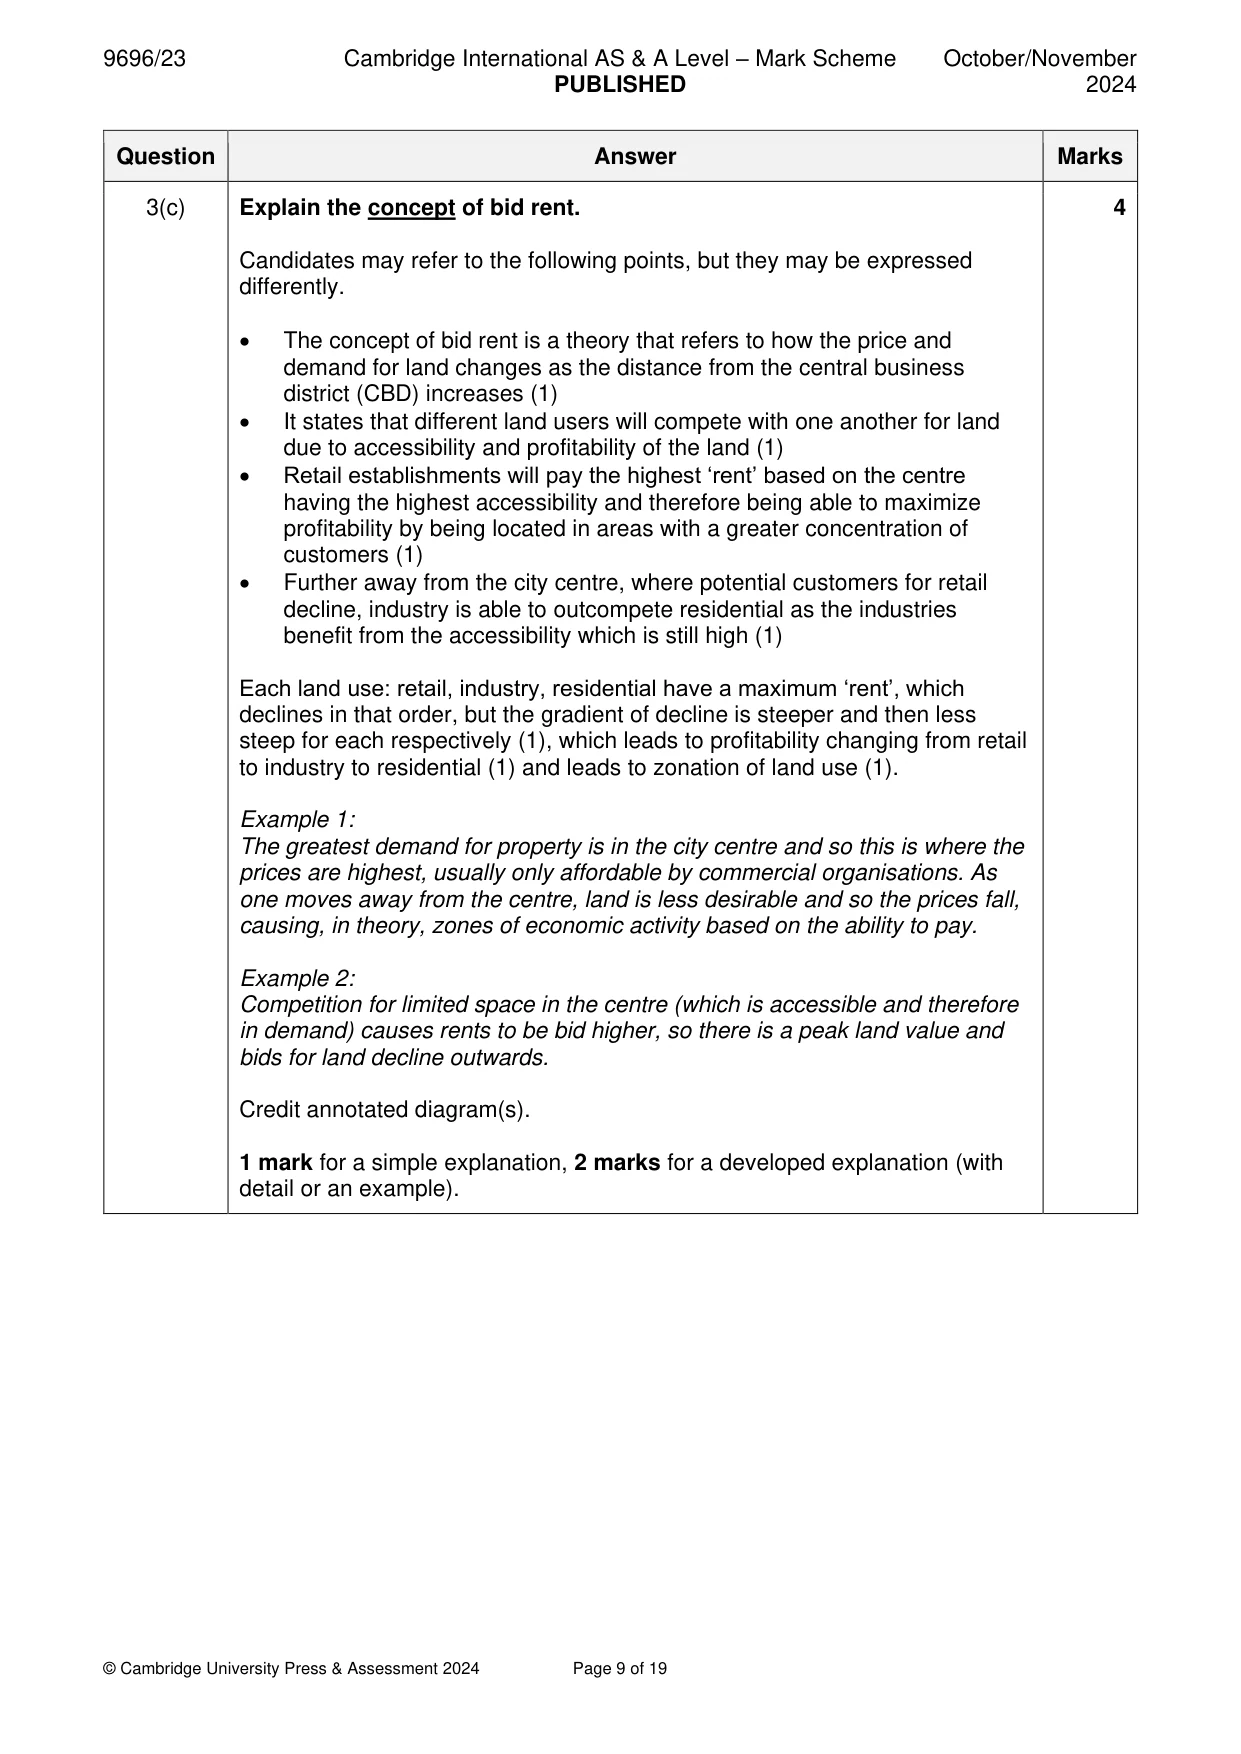
Mark scheme: 3(a) Fig. 3.1 shows land values in the city of Richmond, Virginia, USA, an HIC 3 in North America, in 2018. Describe the pattern of land values shown in Fig. 3.1. The pattern could be described as highest, within the CBD (1), north of the river (1), moderate (US$ 9–26) values either side (1), with an element of linearity NW/SE / stretches NW / similar to river (1) remainder/most of the area low values (1). • Fairly uniform across the majority of Richmond – lowest value • Significant pocket of high land value, 27–60 US$ in and just to the west of the CBD and north of the river • Some of the high land values lie just outside the CBD 1 mark for each descriptive point. 3(b) Suggest two reasons for the pattern of land values shown in Fig. 3.1. 3 Reasons may include: • Accessibility of CBD • High demand for central land from economic activities, demand declines away from CBD • The linearity may be influenced by factors such as transport or roads (e.g. from Church Hill to Three Chopt) • Location of river – aesthetics • Areas of industrial zones • Gentrification / new housing developments • Other 1 mark for each reason, with development (such as detail or an example from Fig. 3.1) for 2 marks. 3(c) Explain the concept of bid rent. 4 Candidates may refer to the following points, but they may be expressed differently. • The concept of bid rent is a theory that refers to how the price and demand for land changes as the distance from the central business district (CBD) increases (1) • It states that different land users will compete with one another for land due to accessibility and profitability of the land (1) • Retail establishments will pay the highest ‘rent’ based on the centre having the highest accessibility and therefore being able to maximize profitability by being located in areas with a greater concentration of customers (1) • Further away from the city centre, where potential customers for retail decline, industry is able to outcompete residential as the industries benefit from the accessibility which is still high (1) Each land use: retail, industry, residential have a maximum ‘rent’, which declines in that order, but the gradient of decline is steeper and then less steep for each respectively (1), which leads to profitability changing from retail to industry to residential (1) and leads to zonation of land use (1). Example 1: The greatest demand for property is in the city centre and so this is where the prices are highest, usually only affordable by commercial organisations. As one moves away from the centre, land is less desirable and so the prices fall, causing, in theory, zones of economic activity based on the ability to pay. Example 2: Competition for limited space in the centre (which is accessible and therefore in demand) causes rents to be bid higher, so there is a peak land value and bids for land decline outwards. Credit annotated diagram(s). 1 mark for a simple explanation, 2 marks for a developed explanation (with detail or an example). Section B Answer one question from this section. All questions are worth 30 marks. Population
Q4 · Define the term infant mortality rate
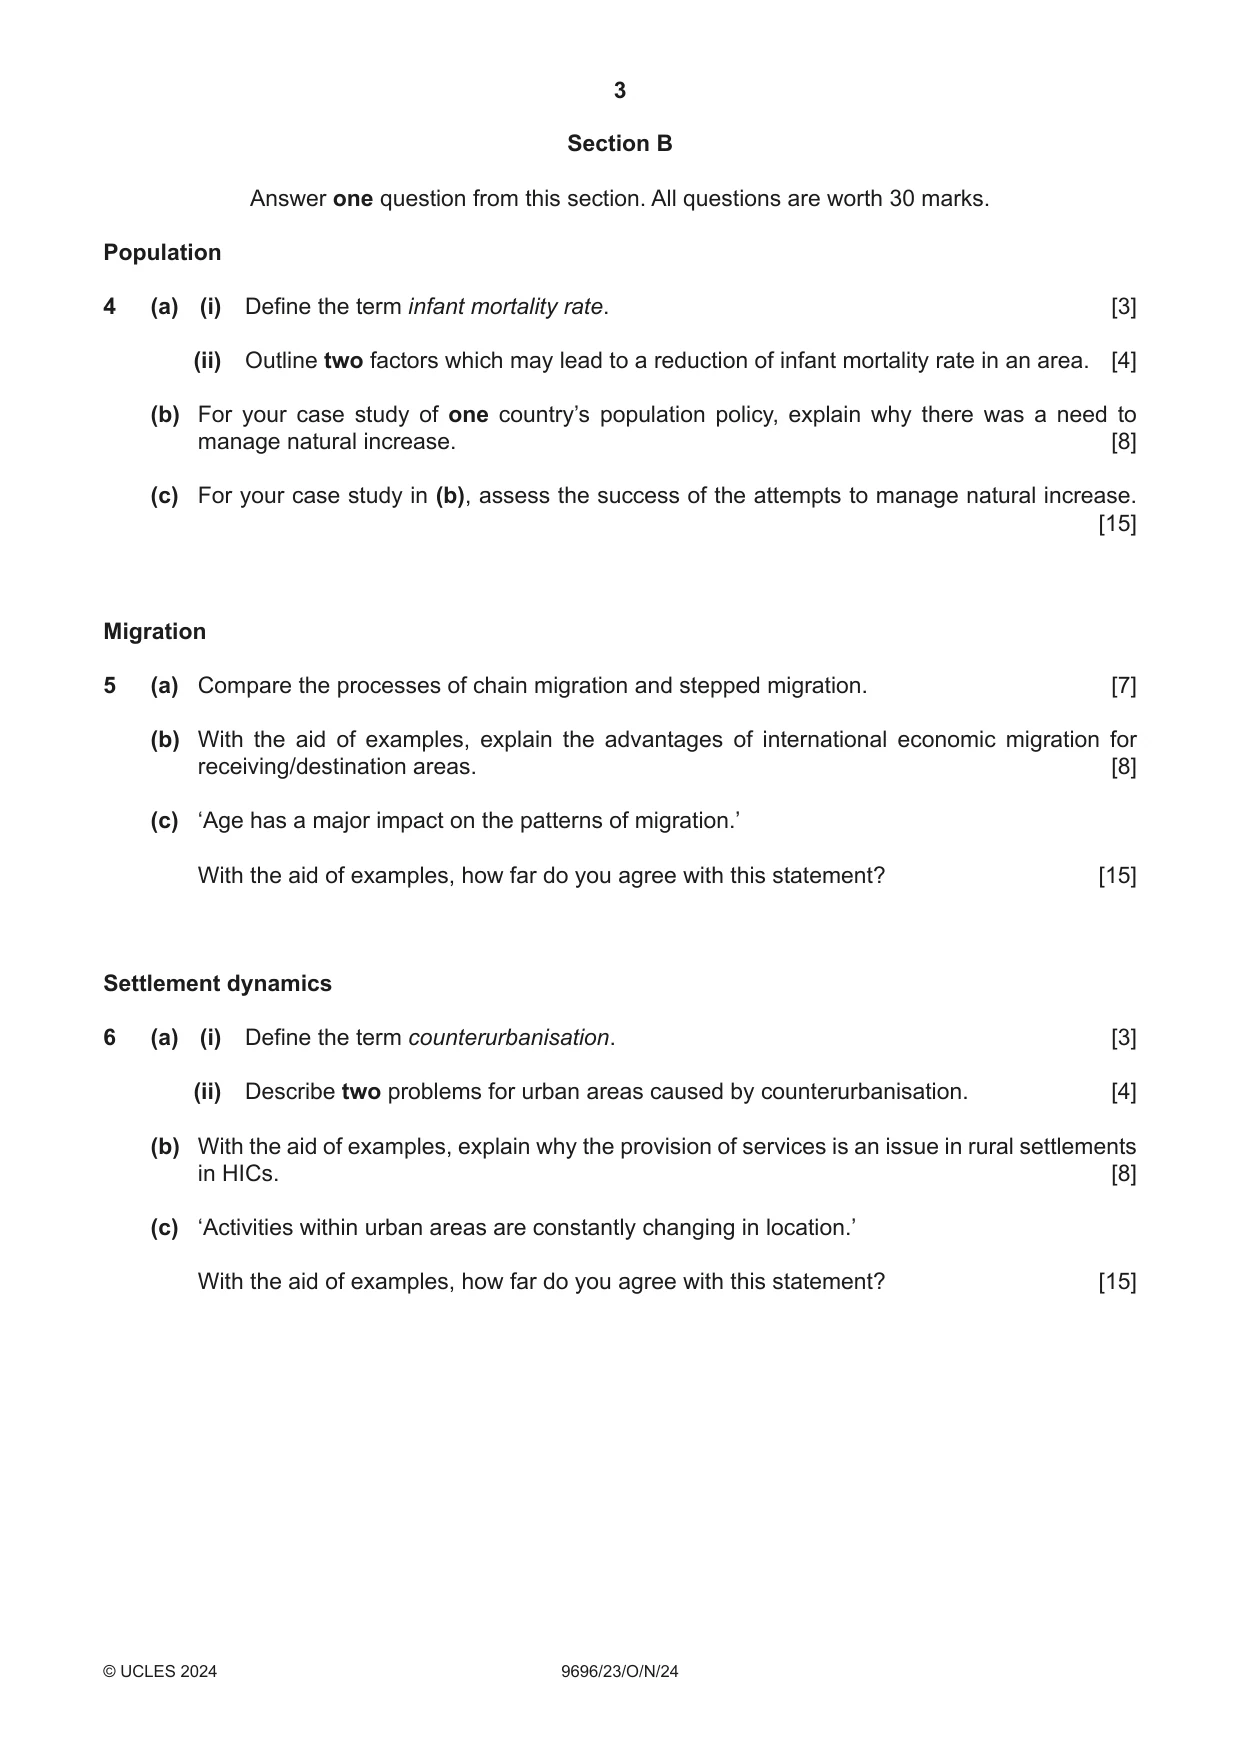
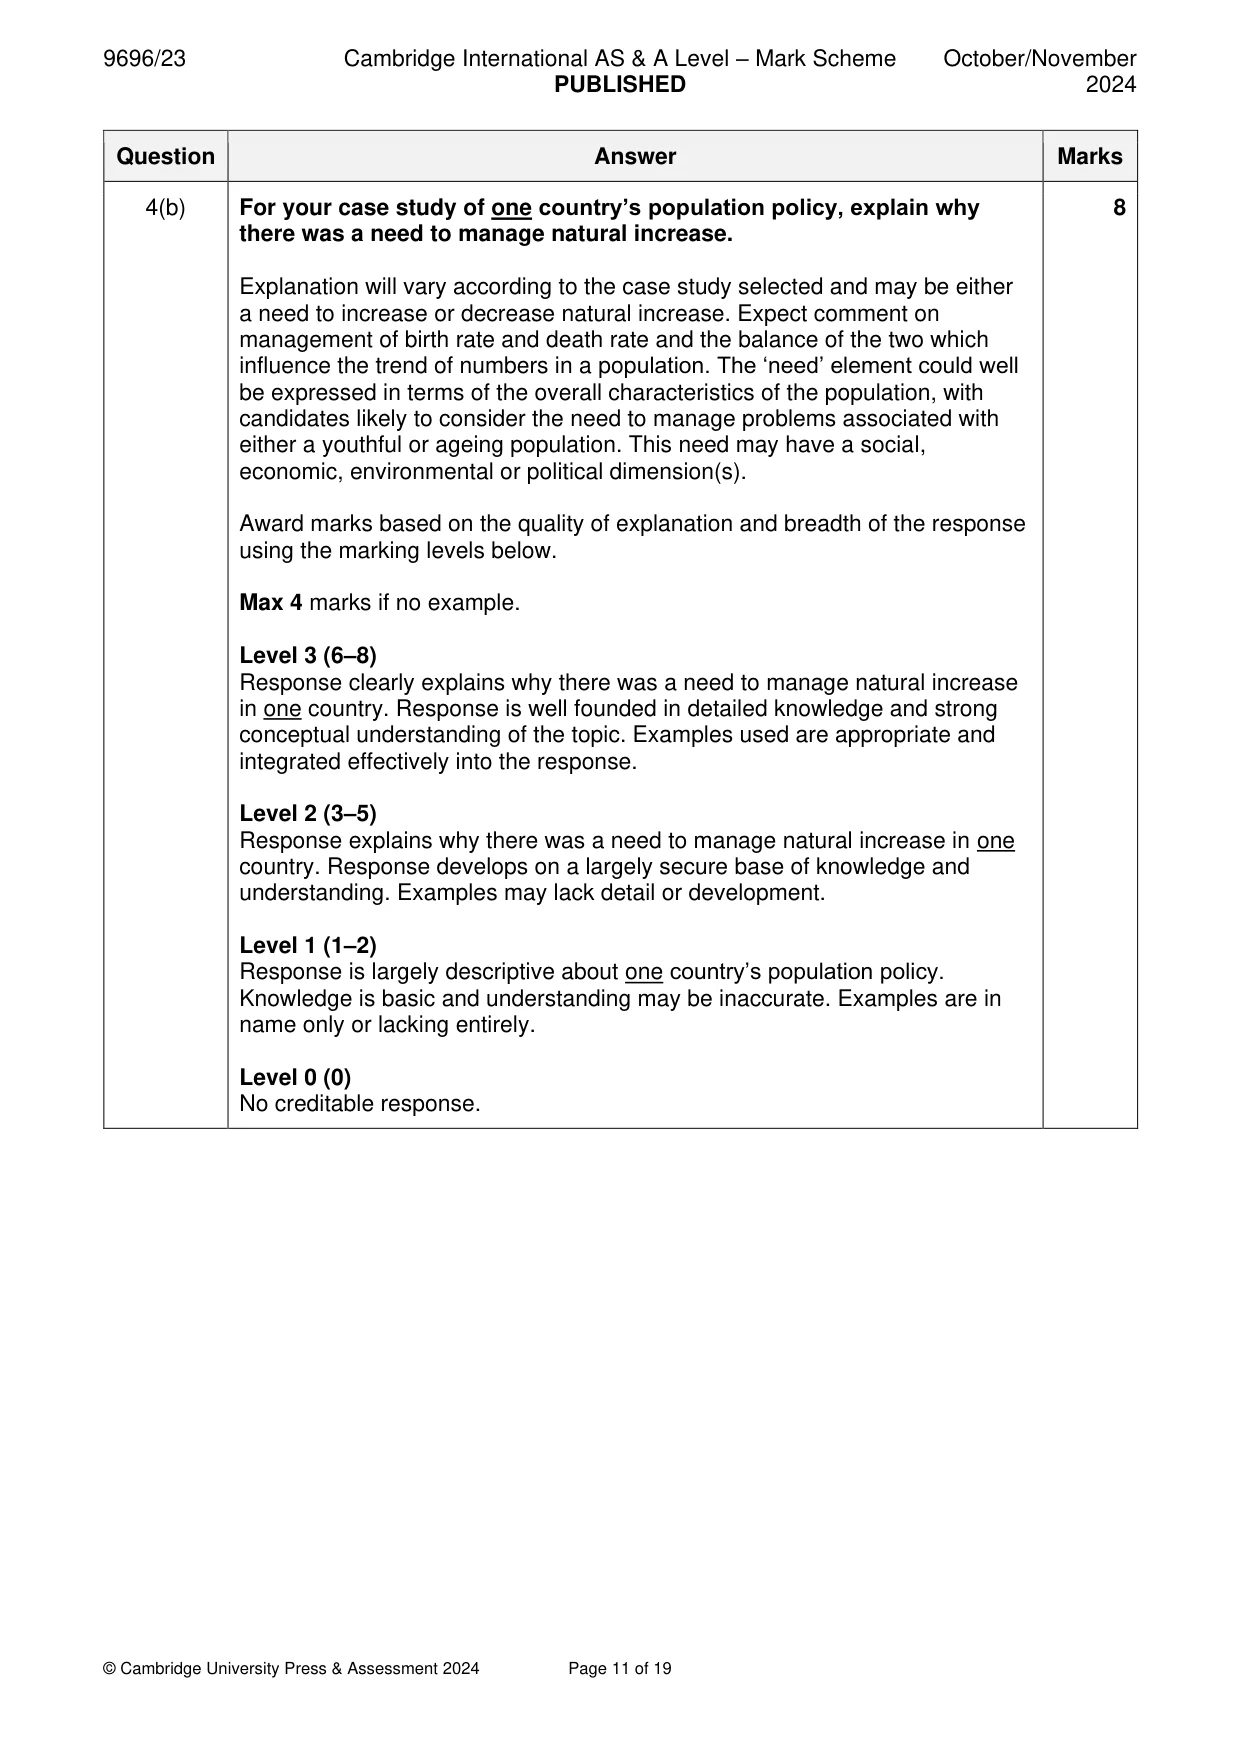
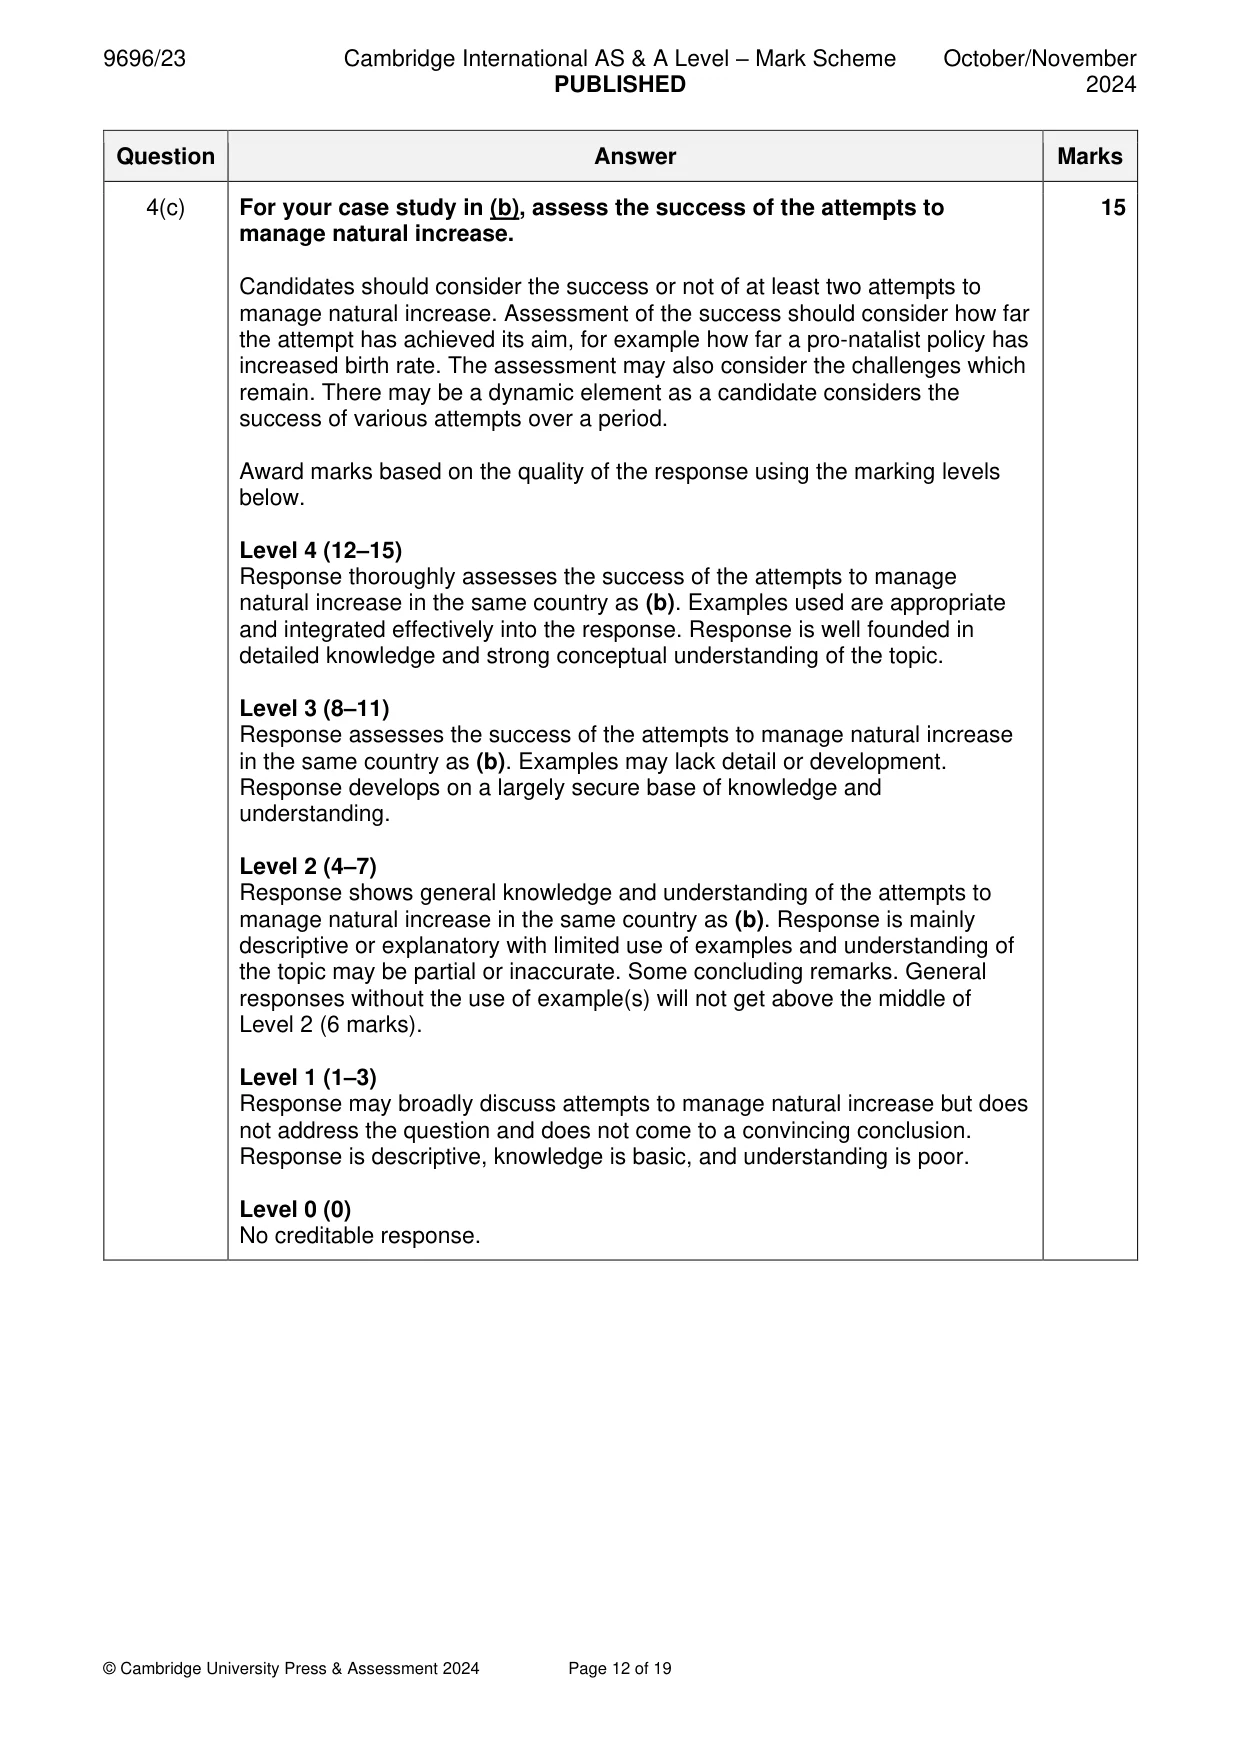
4 (a) (i) Define the term infant mortality rate. [3] (ii) Outline two factors which may lead to a reduction of infant mortality rate in an area. [4] (b) For your case study of one country’s population policy, explain why there was a need to manage natural increase. [8] (c) For your case study in (b), assess the success of the attempts to manage natural increase. [15] Migration
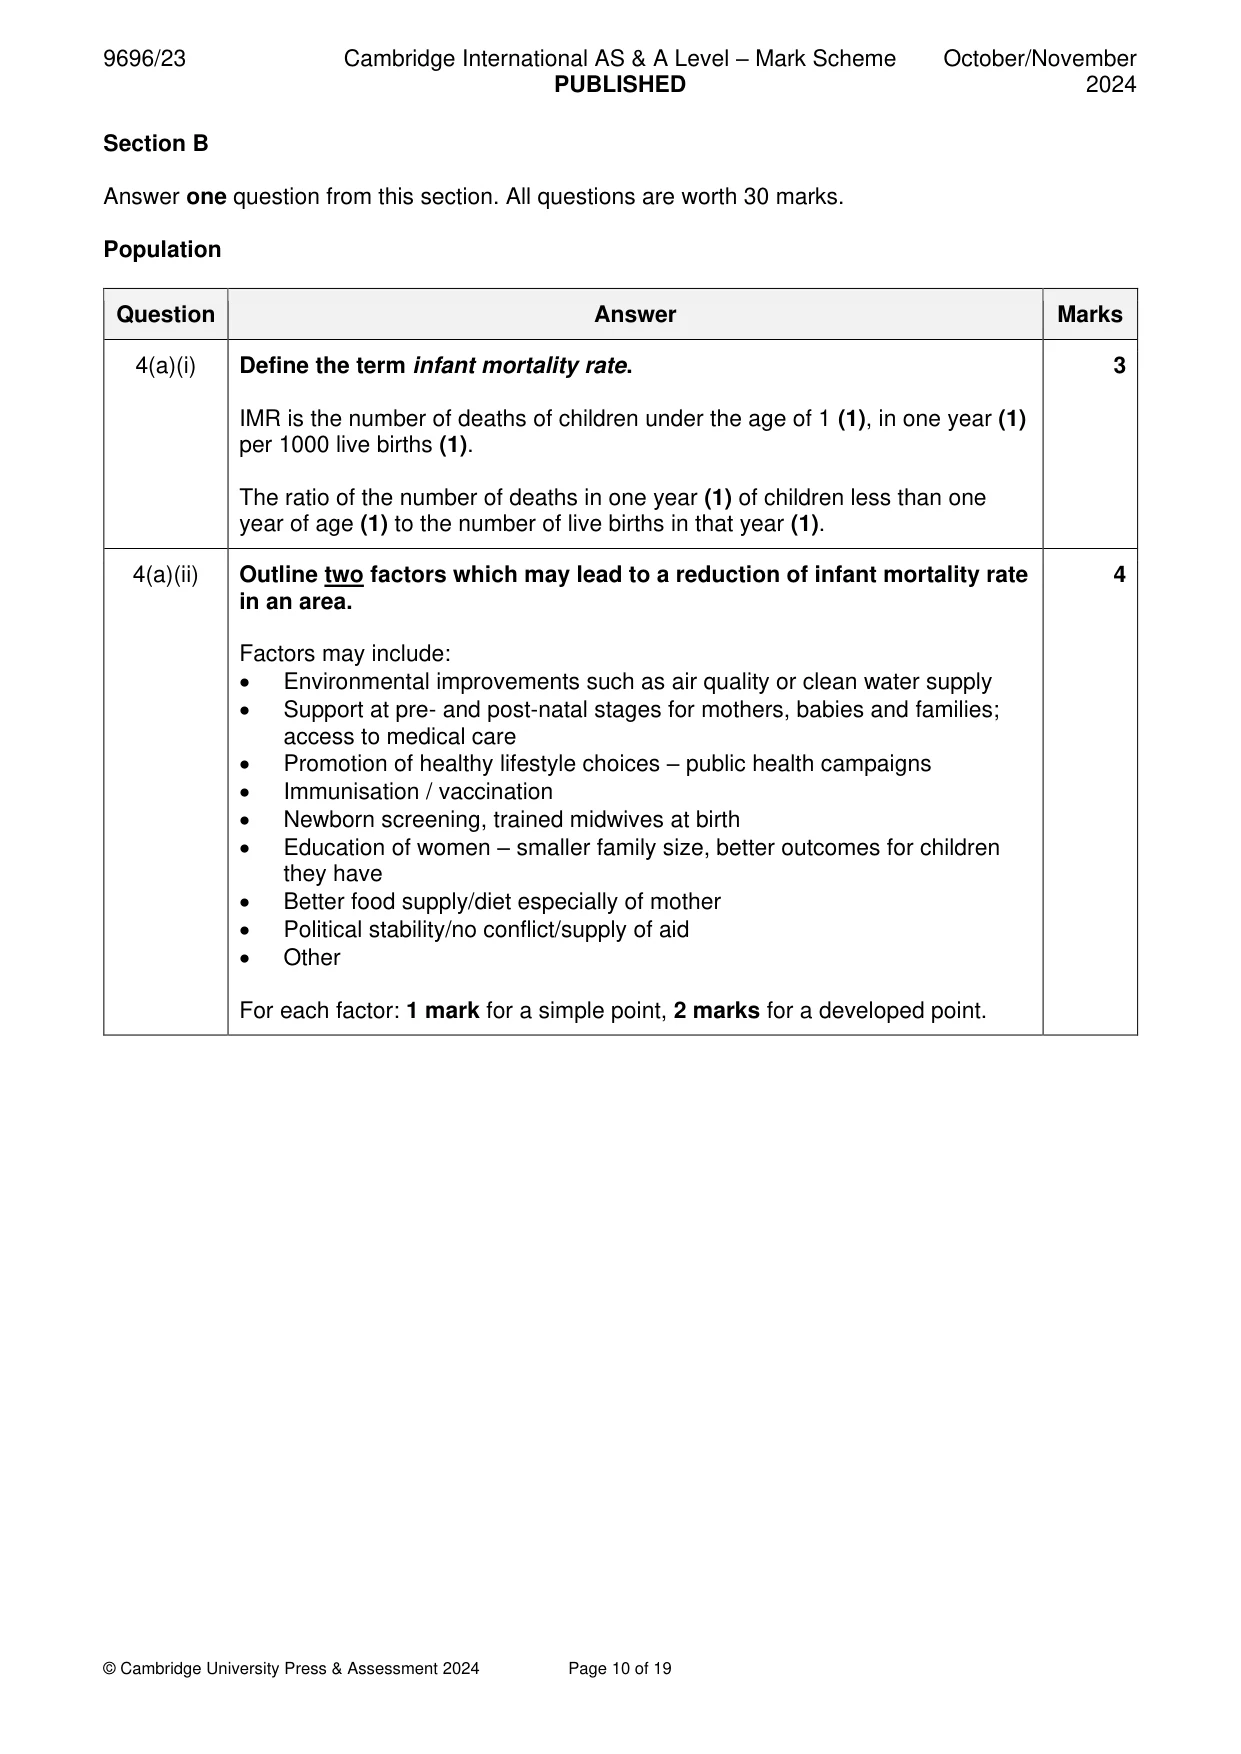
Mark scheme: 4(a)(i) Define the term infant mortality rate. 3 IMR is the number of deaths of children under the age of 1 (1), in one year (1) per 1000 live births (1). The ratio of the number of deaths in one year (1) of children less than one year of age (1) to the number of live births in that year (1). 4(a)(ii) Outline two factors which may lead to a reduction of infant mortality rate 4 in an area. Factors may include: • Environmental improvements such as air quality or clean water supply • Support at pre- and post-natal stages for mothers, babies and families; access to medical care • Promotion of healthy lifestyle choices – public health campaigns • Immunisation / vaccination • Newborn screening, trained midwives at birth • Education of women – smaller family size, better outcomes for children they have • Better food supply/diet especially of mother • Political stability/no conflict/supply of aid • Other For each factor: 1 mark for a simple point, 2 marks for a developed point. 4(b) For your case study of one country’s population policy, explain why 8 there was a need to manage natural increase. Explanation will vary according to the case study selected and may be either a need to increase or decrease natural increase. Expect comment on management of birth rate and death rate and the balance of the two which influence the trend of numbers in a population. The ‘need’ element could well be expressed in terms of the overall characteristics of the population, with candidates likely to consider the need to manage problems associated with either a youthful or ageing population. This need may have a social, economic, environmental or political dimension(s). Award marks based on the quality of explanation and breadth of the response using the marking levels below. Max 4 marks if no example. Level 3 (6–8) Response clearly explains why there was a need to manage natural increase in one country. Response is well founded in detailed knowledge and strong conceptual understanding of the topic. Examples used are appropriate and integrated effectively into the response. Level 2 (3–5) Response explains why there was a need to manage natural increase in one country. Response develops on a largely secure base of knowledge and understanding. Examples may lack detail or development. Level 1 (1–2) Response is largely descriptive about one country’s population policy. Knowledge is basic and understanding may be inaccurate. Examples are in name only or lacking entirely. Level 0 (0) No creditable response. 4(c) For your case study in (b), assess the success of the attempts to 15 manage natural increase. Candidates should consider the success or not of at least two attempts to manage natural increase. Assessment of the success should consider how far the attempt has achieved its aim, for example how far a pro-natalist policy has increased birth rate. The assessment may also consider the challenges which remain. There may be a dynamic element as a candidate considers the success of various attempts over a period. Award marks based on the quality of the response using the marking levels below. Level 4 (12–15) Response thoroughly assesses the success of the attempts to manage natural increase in the same country as (b). Examples used are appropriate and integrated effectively into the response. Response is well founded in detailed knowledge and strong conceptual understanding of the topic. Level 3 (8–11) Response assesses the success of the attempts to manage natural increase in the same country as (b). Examples may lack detail or development. Response develops on a largely secure base of knowledge and understanding. Level 2 (4–7) Response shows general knowledge and understanding of the attempts to manage natural increase in the same country as (b). Response is mainly descriptive or explanatory with limited use of examples and understanding of the topic may be partial or inaccurate. Some concluding remarks. General responses without the use of example(s) will not get above the middle of Level 2 (6 marks). Level 1 (1–3) Response may broadly discuss attempts to manage natural increase but does not address the question and does not come to a convincing conclusion. Response is descriptive, knowledge is basic, and understanding is poor. Level 0 (0) No creditable response. Migration
Q5 · Compare the processes of chain migration and stepped migration
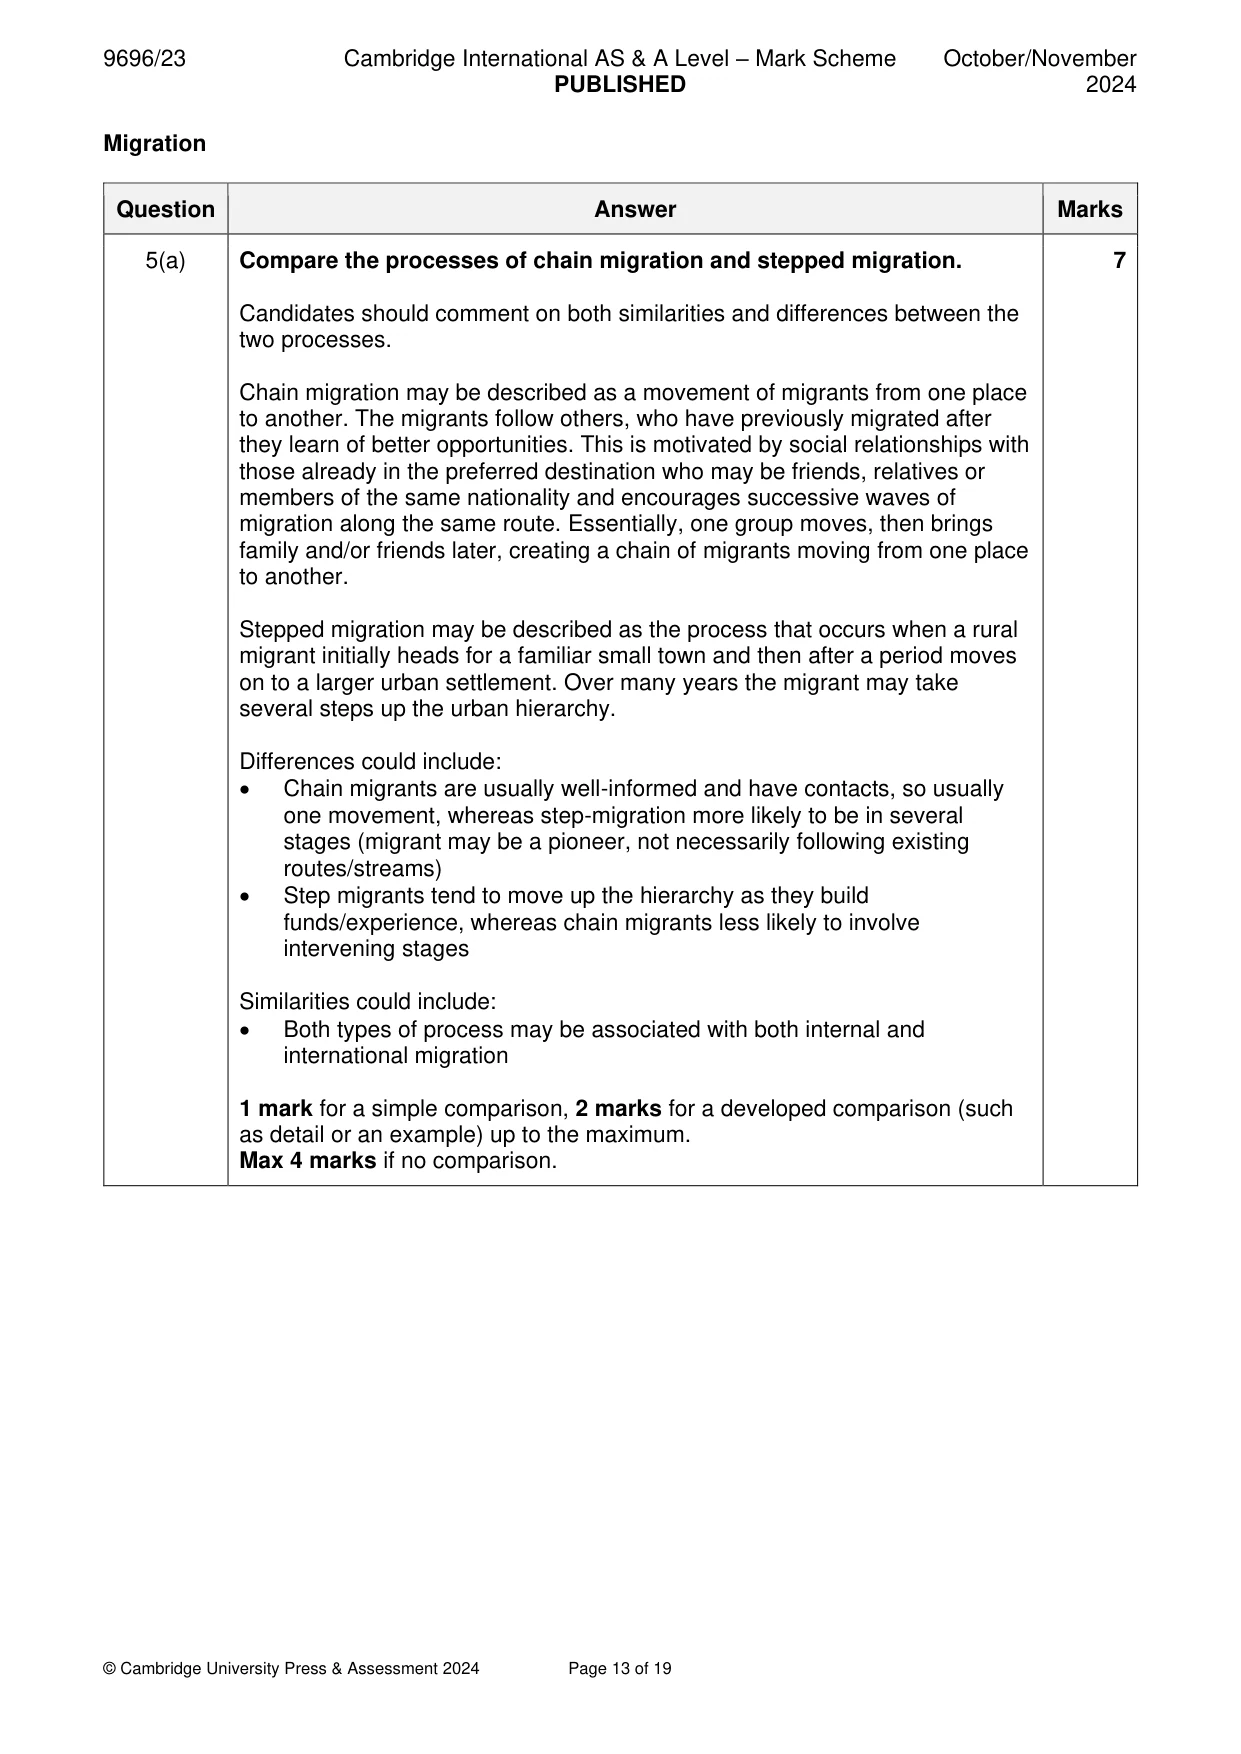
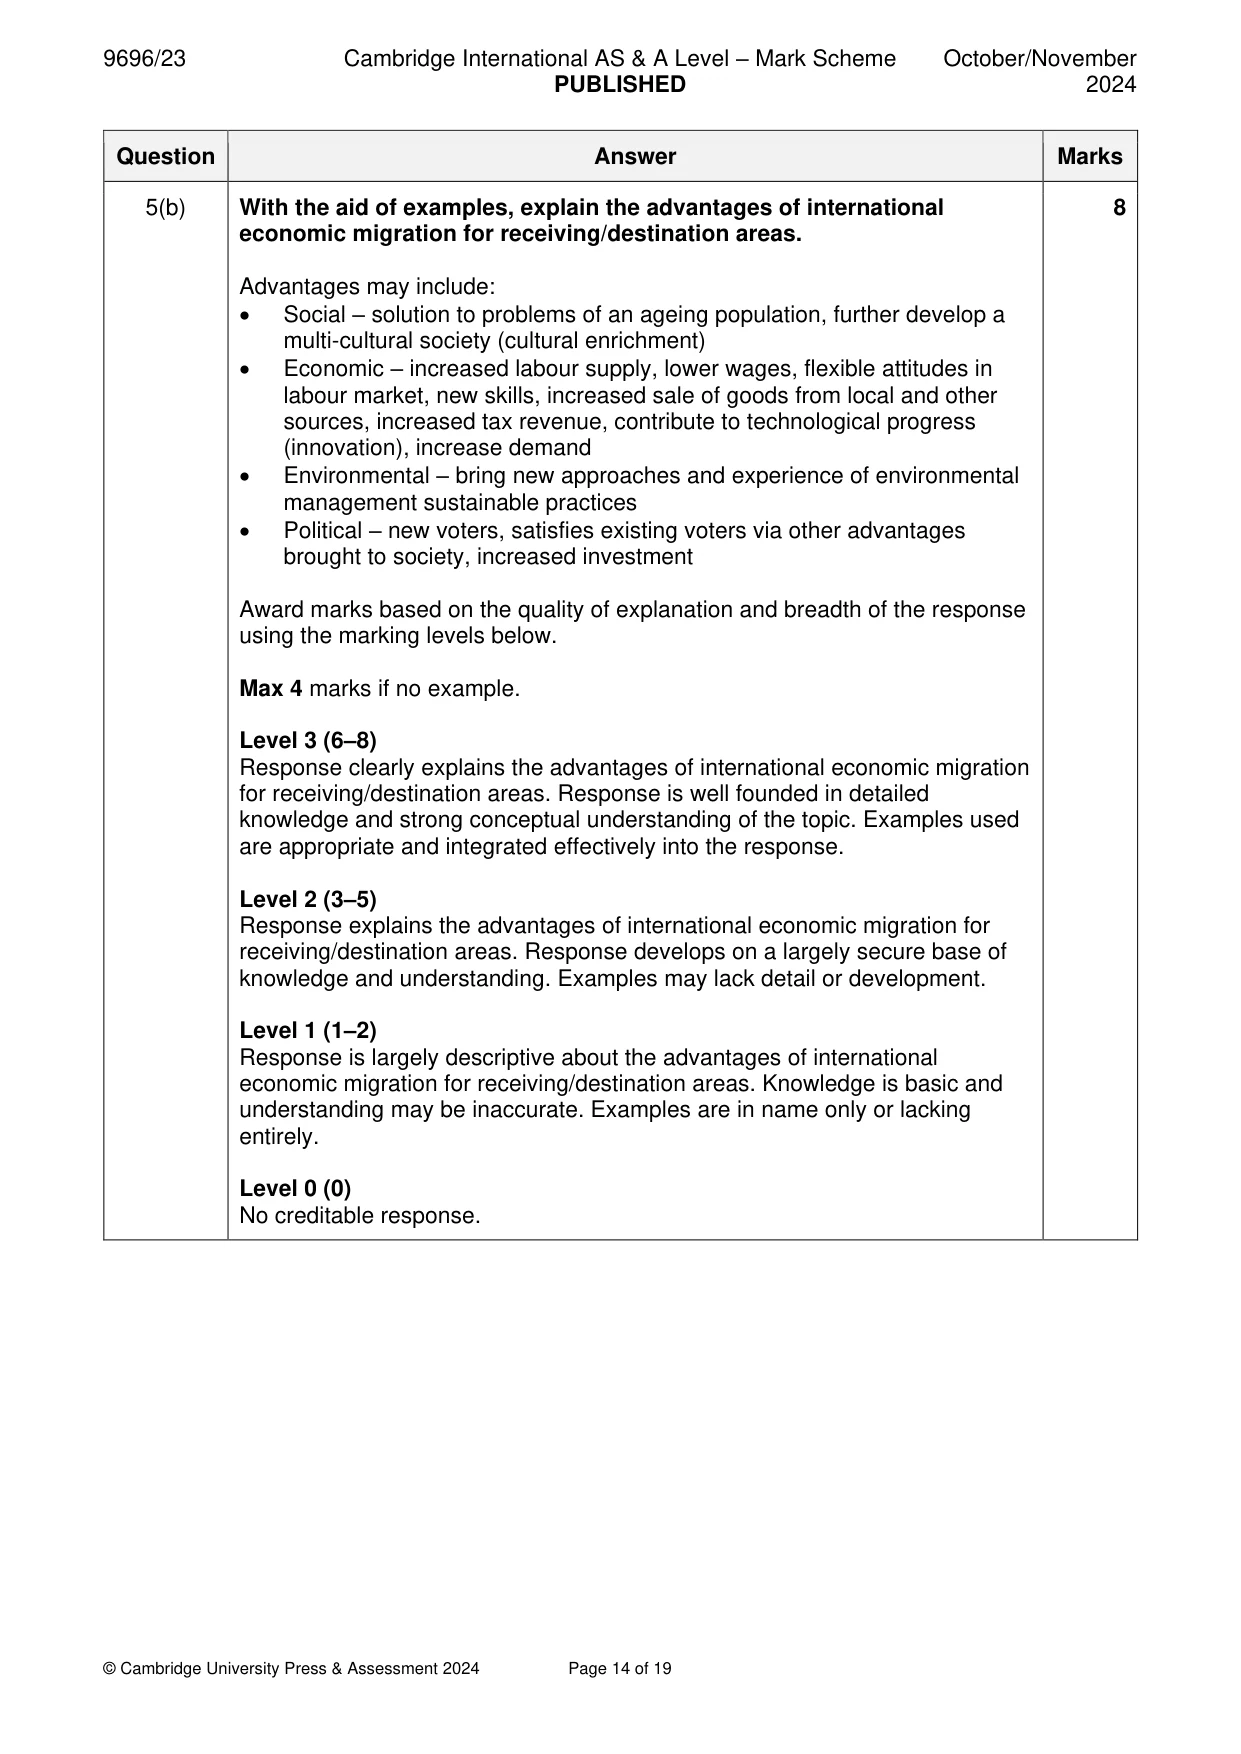
5 (a) Compare the processes of chain migration and stepped migration. [7] (b) With the aid of examples, explain the advantages of international economic migration for receiving/destination areas. [8] (c) ‘Age has a major impact on the patterns of migration.’ With the aid of examples, how far do you agree with this statement? [15] Settlement dynamics
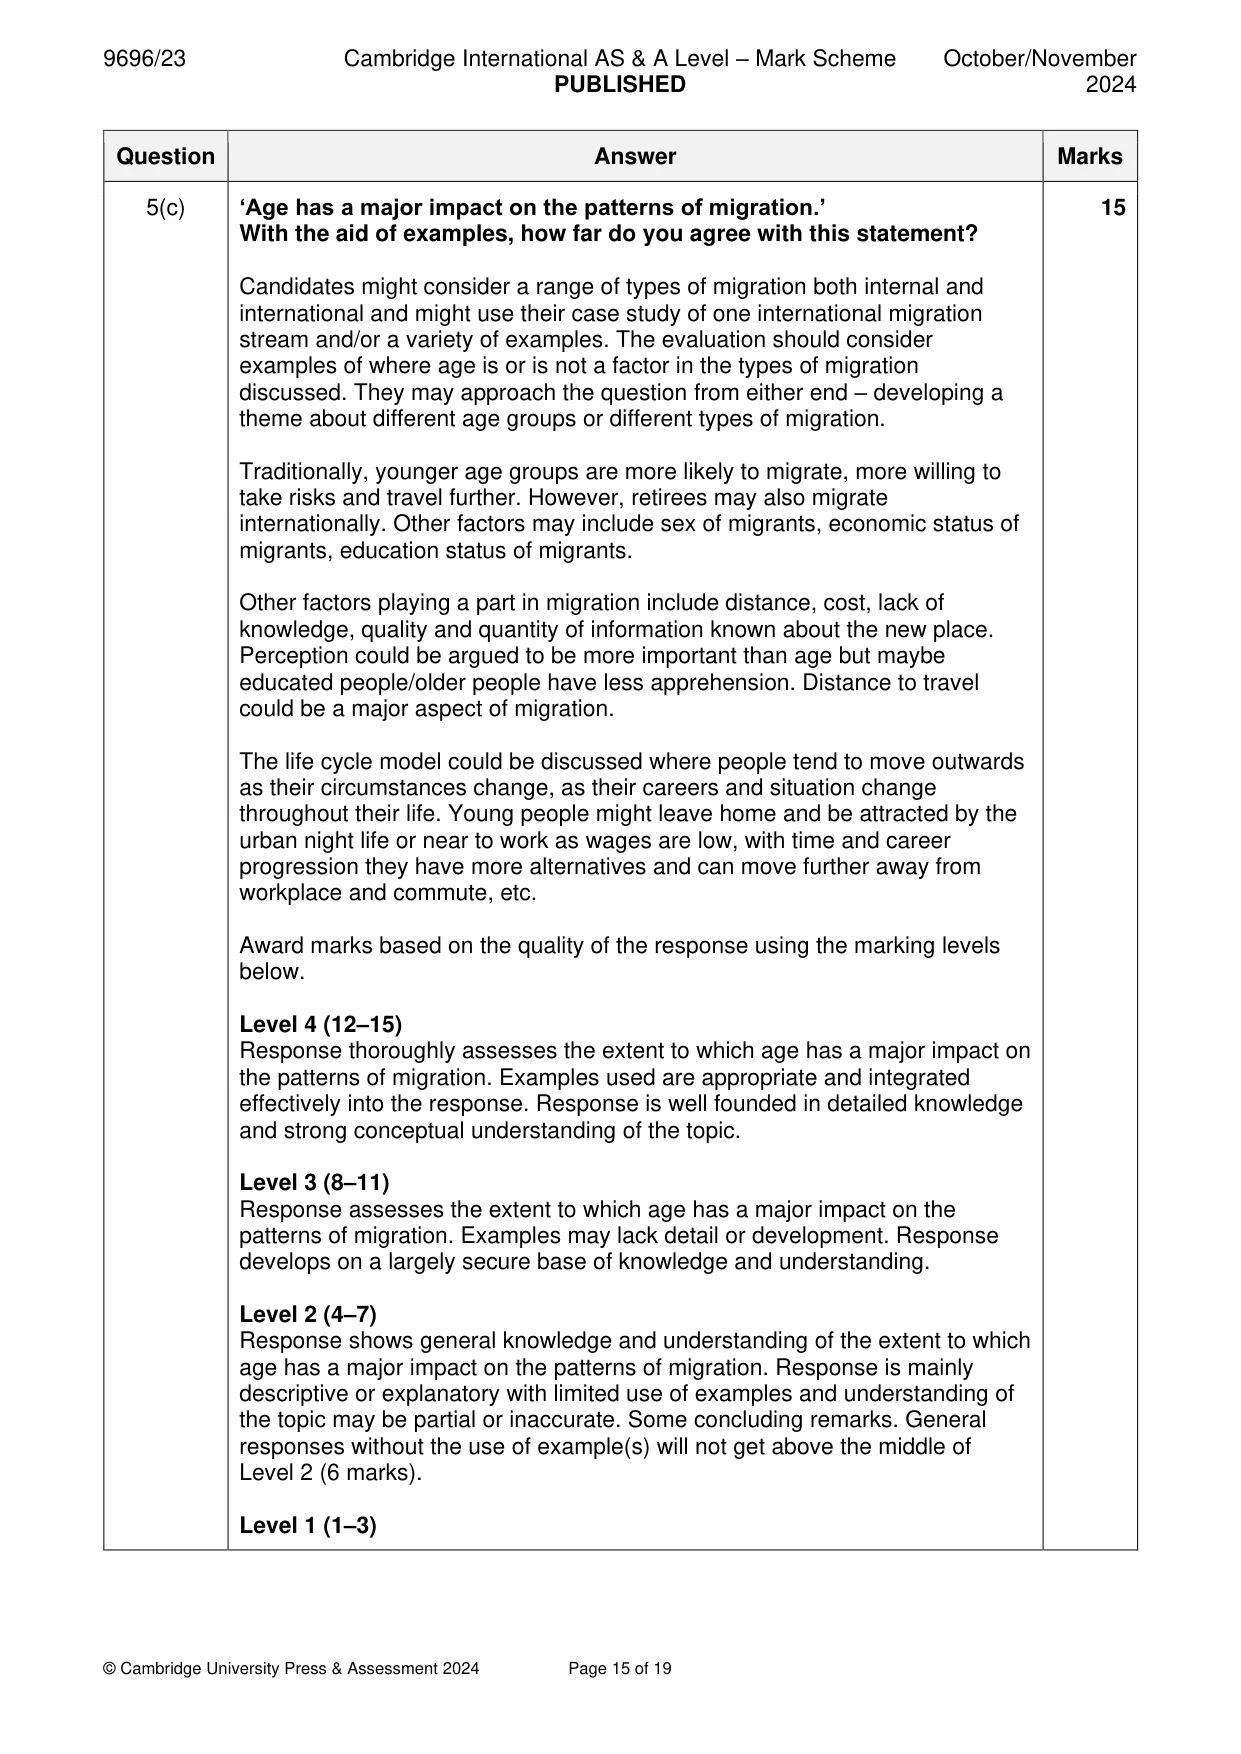
Mark scheme: 5(a) Compare the processes of chain migration and stepped migration. 7 Candidates should comment on both similarities and differences between the two processes. Chain migration may be described as a movement of migrants from one place to another. The migrants follow others, who have previously migrated after they learn of better opportunities. This is motivated by social relationships with those already in the preferred destination who may be friends, relatives or members of the same nationality and encourages successive waves of migration along the same route. Essentially, one group moves, then brings family and/or friends later, creating a chain of migrants moving from one place to another. Stepped migration may be described as the process that occurs when a rural migrant initially heads for a familiar small town and then after a period moves on to a larger urban settlement. Over many years the migrant may take several steps up the urban hierarchy. Differences could include: • Chain migrants are usually well-informed and have contacts, so usually one movement, whereas step-migration more likely to be in several stages (migrant may be a pioneer, not necessarily following existing routes/streams) • Step migrants tend to move up the hierarchy as they build funds/experience, whereas chain migrants less likely to involve intervening stages Similarities could include: • Both types of process may be associated with both internal and international migration 1 mark for a simple comparison, 2 marks for a developed comparison (such as detail or an example) up to the maximum. Max 4 marks if no comparison. 5(b) With the aid of examples, explain the advantages of international 8 economic migration for receiving/destination areas. Advantages may include: • Social – solution to problems of an ageing population, further develop a multi-cultural society (cultural enrichment) • Economic – increased labour supply, lower wages, flexible attitudes in labour market, new skills, increased sale of goods from local and other sources, increased tax revenue, contribute to technological progress (innovation), increase demand • Environmental – bring new approaches and experience of environmental management sustainable practices • Political – new voters, satisfies existing voters via other advantages brought to society, increased investment Award marks based on the quality of explanation and breadth of the response using the marking levels below. Max 4 marks if no example. Level 3 (6–8) Response clearly explains the advantages of international economic migration for receiving/destination areas. Response is well founded in detailed knowledge and strong conceptual understanding of the topic. Examples used are appropriate and integrated effectively into the response. Level 2 (3–5) Response explains the advantages of international economic migration for receiving/destination areas. Response develops on a largely secure base of knowledge and understanding. Examples may lack detail or development. Level 1 (1–2) Response is largely descriptive about the advantages of international economic migration for receiving/destination areas. Knowledge is basic and understanding may be inaccurate. Examples are in name only or lacking entirely. Level 0 (0) No creditable response. 5(c) ‘Age has a major impact on the patterns of migration.’ 15 With the aid of examples, how far do you agree with this statement? Candidates might consider a range of types of migration both internal and international and might use their case study of one international migration stream and/or a variety of examples. The evaluation should consider examples of where age is or is not a factor in the types of migration discussed. They may approach the question from either end – developing a theme about different age groups or different types of migration. Traditionally, younger age groups are more likely to migrate, more willing to take risks and travel further. However, retirees may also migrate internationally. Other factors may include sex of migrants, economic status of migrants, education status of migrants. Other factors playing a part in migration include distance, cost, lack of knowledge, quality and quantity of information known about the new place. Perception could be argued to be more important than age but maybe educated people/older people have less apprehension. Distance to travel could be a major aspect of migration. The life cycle model could be discussed where people tend to move outwards as their circumstances change, as their careers and situation change throughout their life. Young people might leave home and be attracted by the urban night life or near to work as wages are low, with time and career progression they have more alternatives and can move further away from workplace and commute, etc. Award marks based on the quality of the response using the marking levels below. Level 4 (12–15) Response thoroughly assesses the extent to which age has a major impact on the patterns of migration. Examples used are appropriate and integrated effectively into the response. Response is well founded in detailed knowledge and strong conceptual understanding of the topic. Level 3 (8–11) Response assesses the extent to which age has a major impact on the patterns of migration. Examples may lack detail or development. Response develops on a largely secure base of knowledge and understanding. Level 2 (4–7) Response shows general knowledge and understanding of the extent to which age has a major impact on the patterns of migration. Response is mainly descriptive or explanatory with limited use of examples and understanding of the topic may be partial or inaccurate. Some concluding remarks. General responses without the use of example(s) will not get above the middle of Level 2 (6 marks). Level 1 (1–3) Response may broadly discuss different patterns of migration but does not address the question and does not come to a convincing conclusion. Response is descriptive, knowledge is basic and understanding is poor. Level 0 (0) No creditable response. Settlement dynamics
Q6 · Define the term counterurbanisation
6 (a) (i) Define the term counterurbanisation. [3] (ii) Describe two problems for urban areas caused by counterurbanisation. [4] (b) With the aid of examples, explain why the provision of services is an issue in rural settlements in HICs. [8] (c) ‘Activities within urban areas are constantly changing in location.’ With the aid of examples, how far do you agree with this statement? [15]
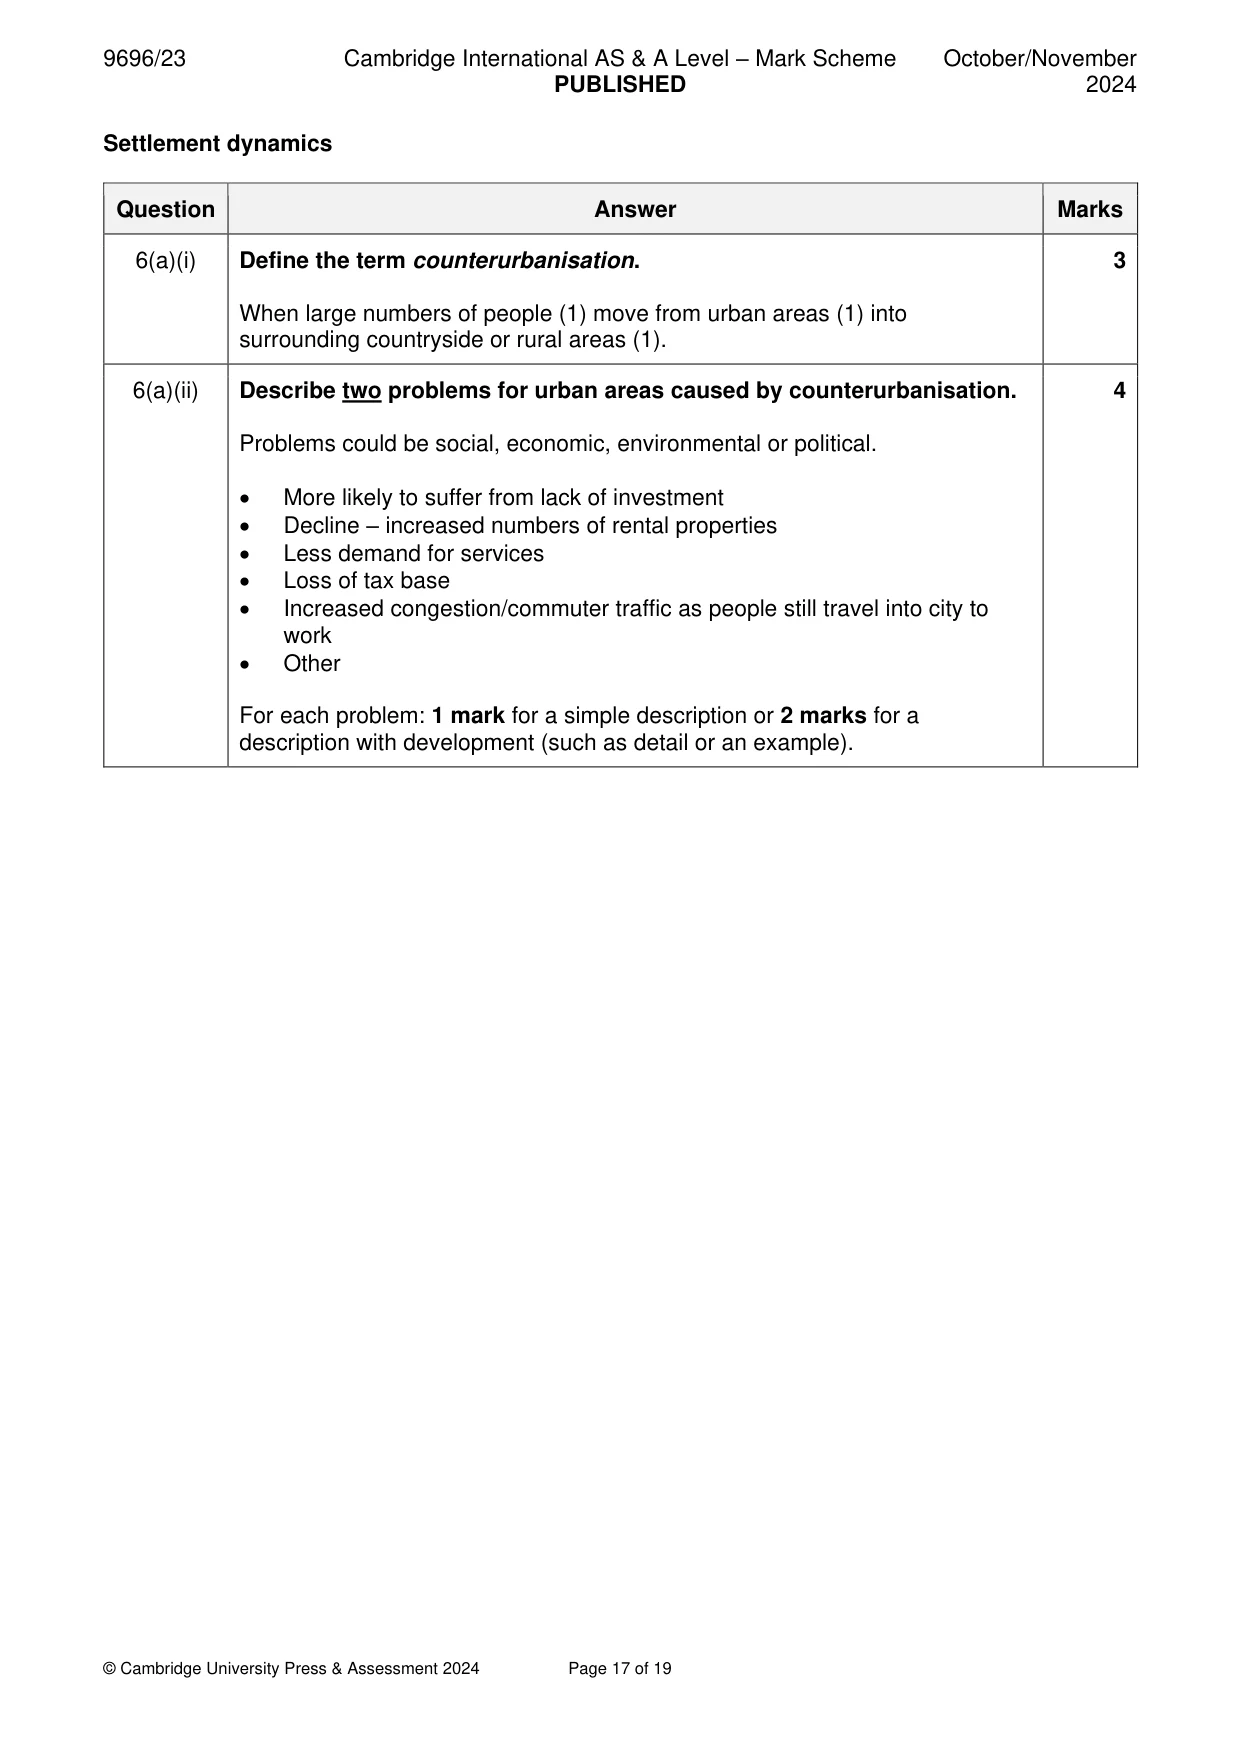
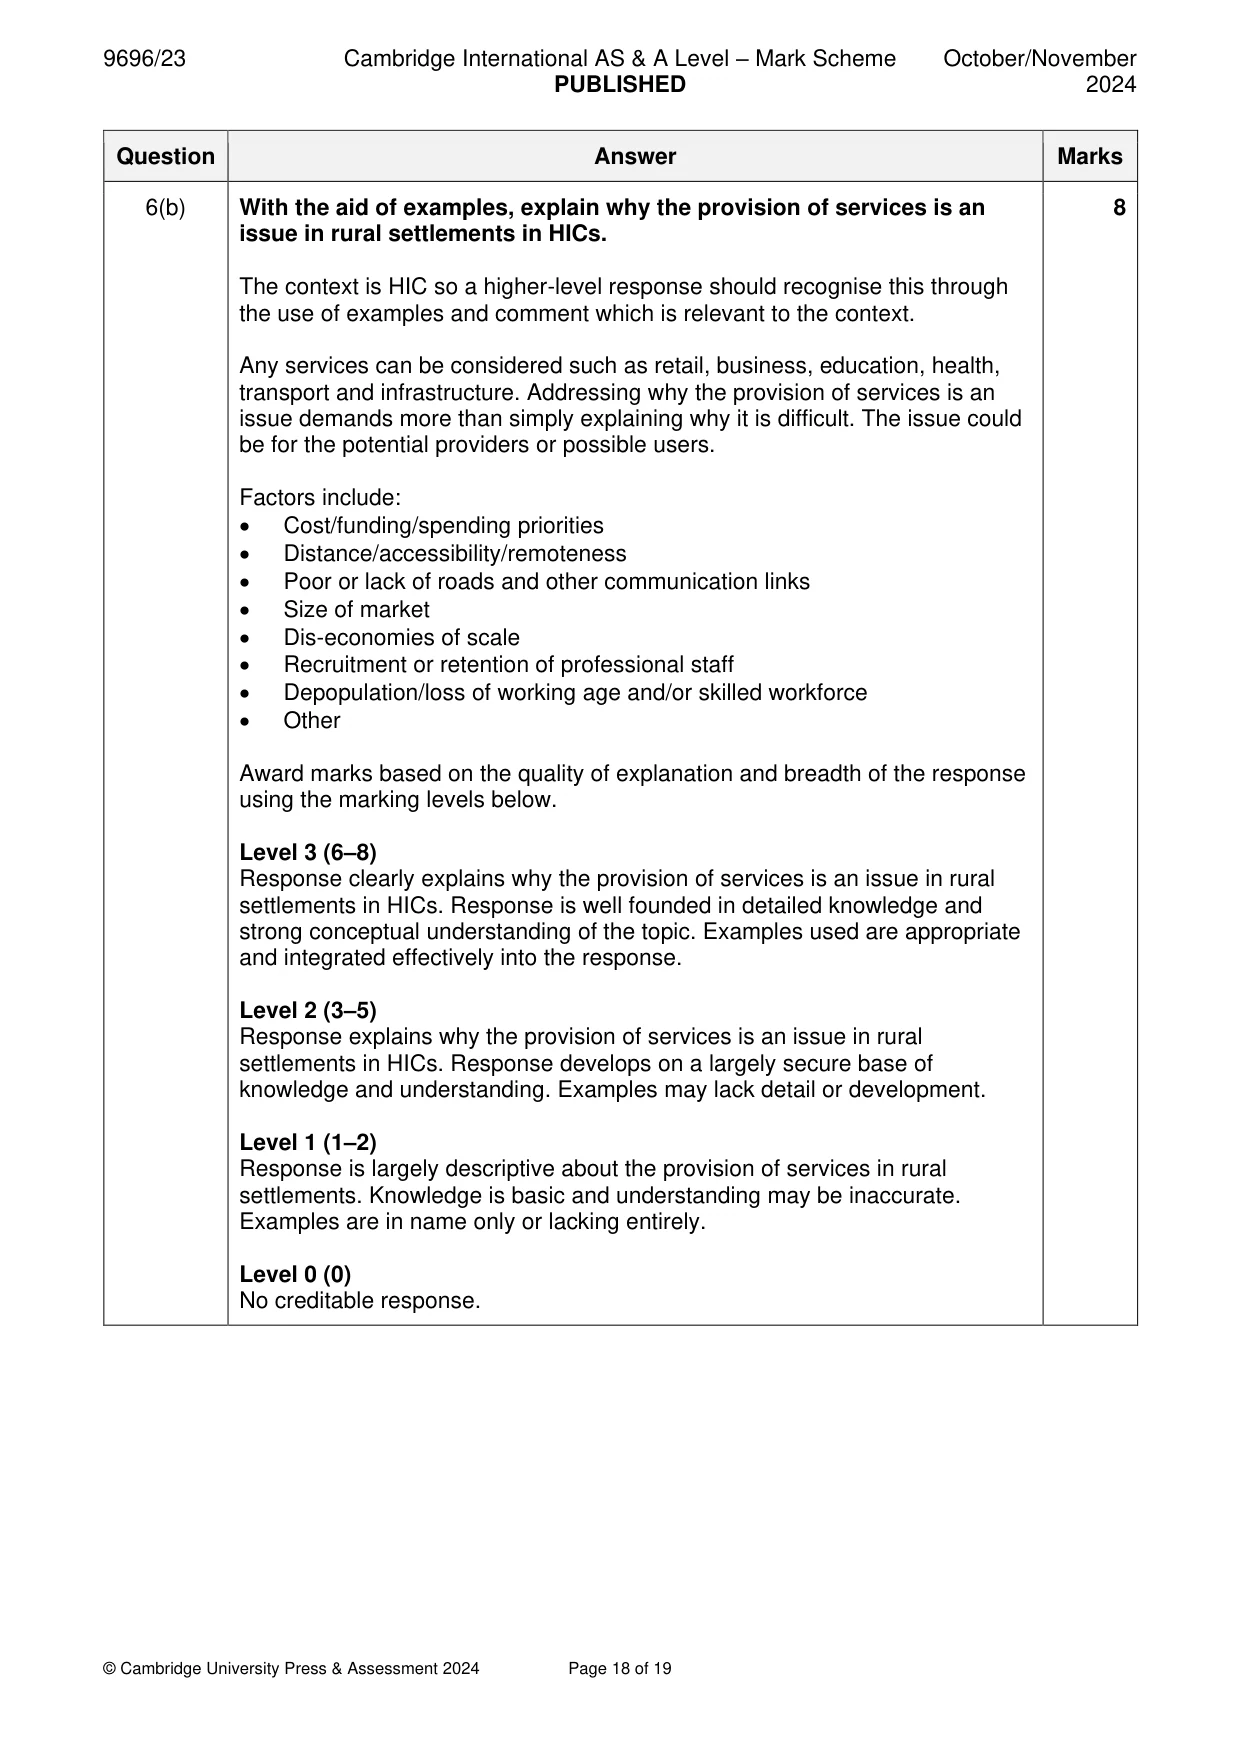
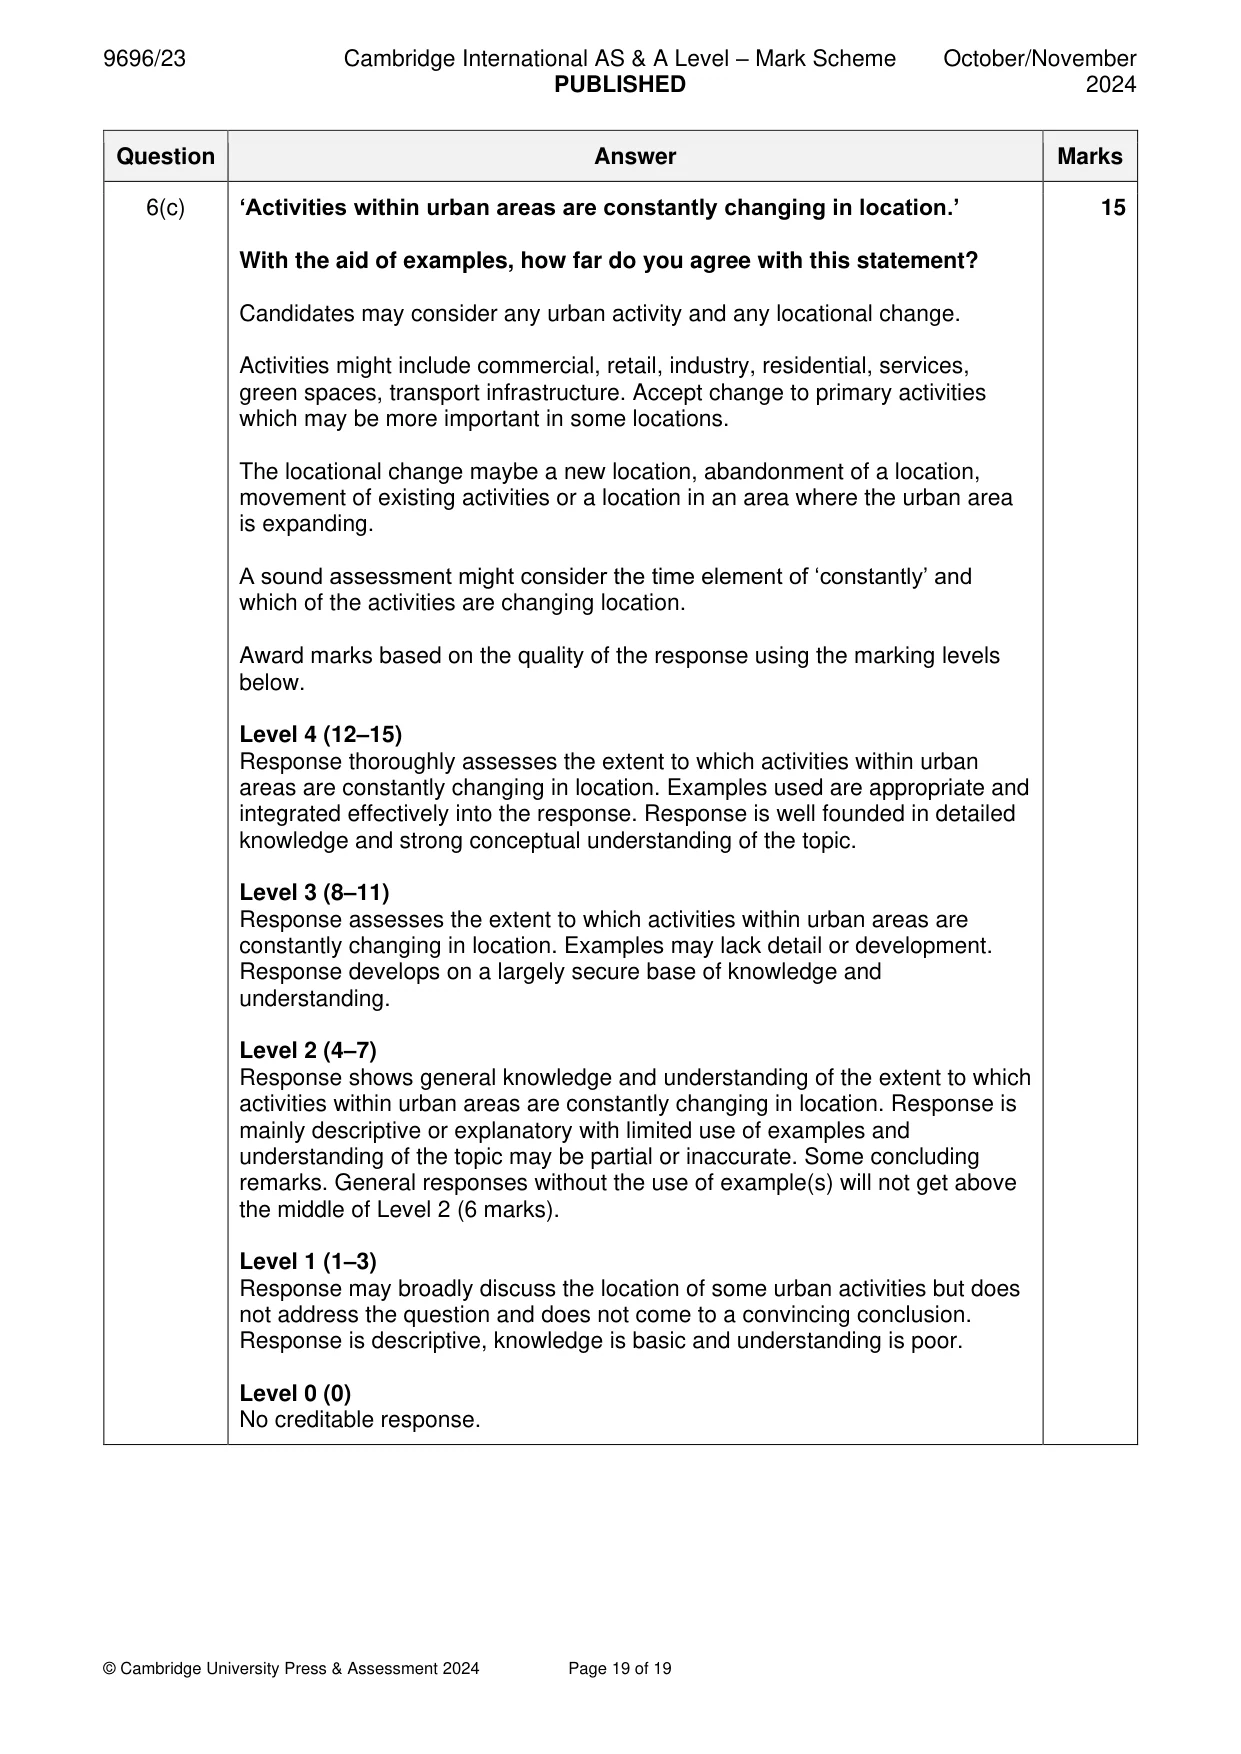
Mark scheme: 6(a)(i) Define the term counterurbanisation. 3 When large numbers of people (1) move from urban areas (1) into surrounding countryside or rural areas (1). 6(a)(ii) Describe two problems for urban areas caused by counterurbanisation. 4 Problems could be social, economic, environmental or political. • More likely to suffer from lack of investment • Decline – increased numbers of rental properties • Less demand for services • Loss of tax base • Increased congestion/commuter traffic as people still travel into city to work • Other For each problem: 1 mark for a simple description or 2 marks for a description with development (such as detail or an example). 6(b) With the aid of examples, explain why the provision of services is an 8 issue in rural settlements in HICs. The context is HIC so a higher-level response should recognise this through the use of examples and comment which is relevant to the context. Any services can be considered such as retail, business, education, health, transport and infrastructure. Addressing why the provision of services is an issue demands more than simply explaining why it is difficult. The issue could be for the potential providers or possible users. Factors include: • Cost/funding/spending priorities • Distance/accessibility/remoteness • Poor or lack of roads and other communication links • Size of market • Dis-economies of scale • Recruitment or retention of professional staff • Depopulation/loss of working age and/or skilled workforce • Other Award marks based on the quality of explanation and breadth of the response using the marking levels below. Level 3 (6–8) Response clearly explains why the provision of services is an issue in rural settlements in HICs. Response is well founded in detailed knowledge and strong conceptual understanding of the topic. Examples used are appropriate and integrated effectively into the response. Level 2 (3–5) Response explains why the provision of services is an issue in rural settlements in HICs. Response develops on a largely secure base of knowledge and understanding. Examples may lack detail or development. Level 1 (1–2) Response is largely descriptive about the provision of services in rural settlements. Knowledge is basic and understanding may be inaccurate. Examples are in name only or lacking entirely. Level 0 (0) No creditable response. 6(c) ‘Activities within urban areas are constantly changing in location.’ 15 With the aid of examples, how far do you agree with this statement? Candidates may consider any urban activity and any locational change. Activities might include commercial, retail, industry, residential, services, green spaces, transport infrastructure. Accept change to primary activities which may be more important in some locations. The locational change maybe a new location, abandonment of a location, movement of existing activities or a location in an area where the urban area is expanding. A sound assessment might consider the time element of ‘constantly’ and which of the activities are changing location. Award marks based on the quality of the response using the marking levels below. Level 4 (12–15) Response thoroughly assesses the extent to which activities within urban areas are constantly changing in location. Examples used are appropriate and integrated effectively into the response. Response is well founded in detailed knowledge and strong conceptual understanding of the topic. Level 3 (8–11) Response assesses the extent to which activities within urban areas are constantly changing in location. Examples may lack detail or development. Response develops on a largely secure base of knowledge and understanding. Level 2 (4–7) Response shows general knowledge and understanding of the extent to which activities within urban areas are constantly changing in location. Response is mainly descriptive or explanatory with limited use of examples and understanding of the topic may be partial or inaccurate. Some concluding remarks. General responses without the use of example(s) will not get above the middle of Level 2 (6 marks). Level 1 (1–3) Response may broadly discuss the location of some urban activities but does not address the question and does not come to a convincing conclusion. Response is descriptive, knowledge is basic and understanding is poor. Level 0 (0) No creditable response.
What was in this paper
The subtopics covered by these 6 questions, and how many questions each got. Open one in a new tab to see every Cambridge question on it.
What you needed in this session
Cambridge’s own grade thresholds for 2024 Oct/Nov, Paper 2 · Variant 3. A higher threshold means an easier paper — the bar moves with how the cohort did.