Cambridge A Level Geography 9696 — 2025 May/June Paper 2 · Variant 3
9696/23/M/J/25 · 6 questions · 60 marks · ≈68 min
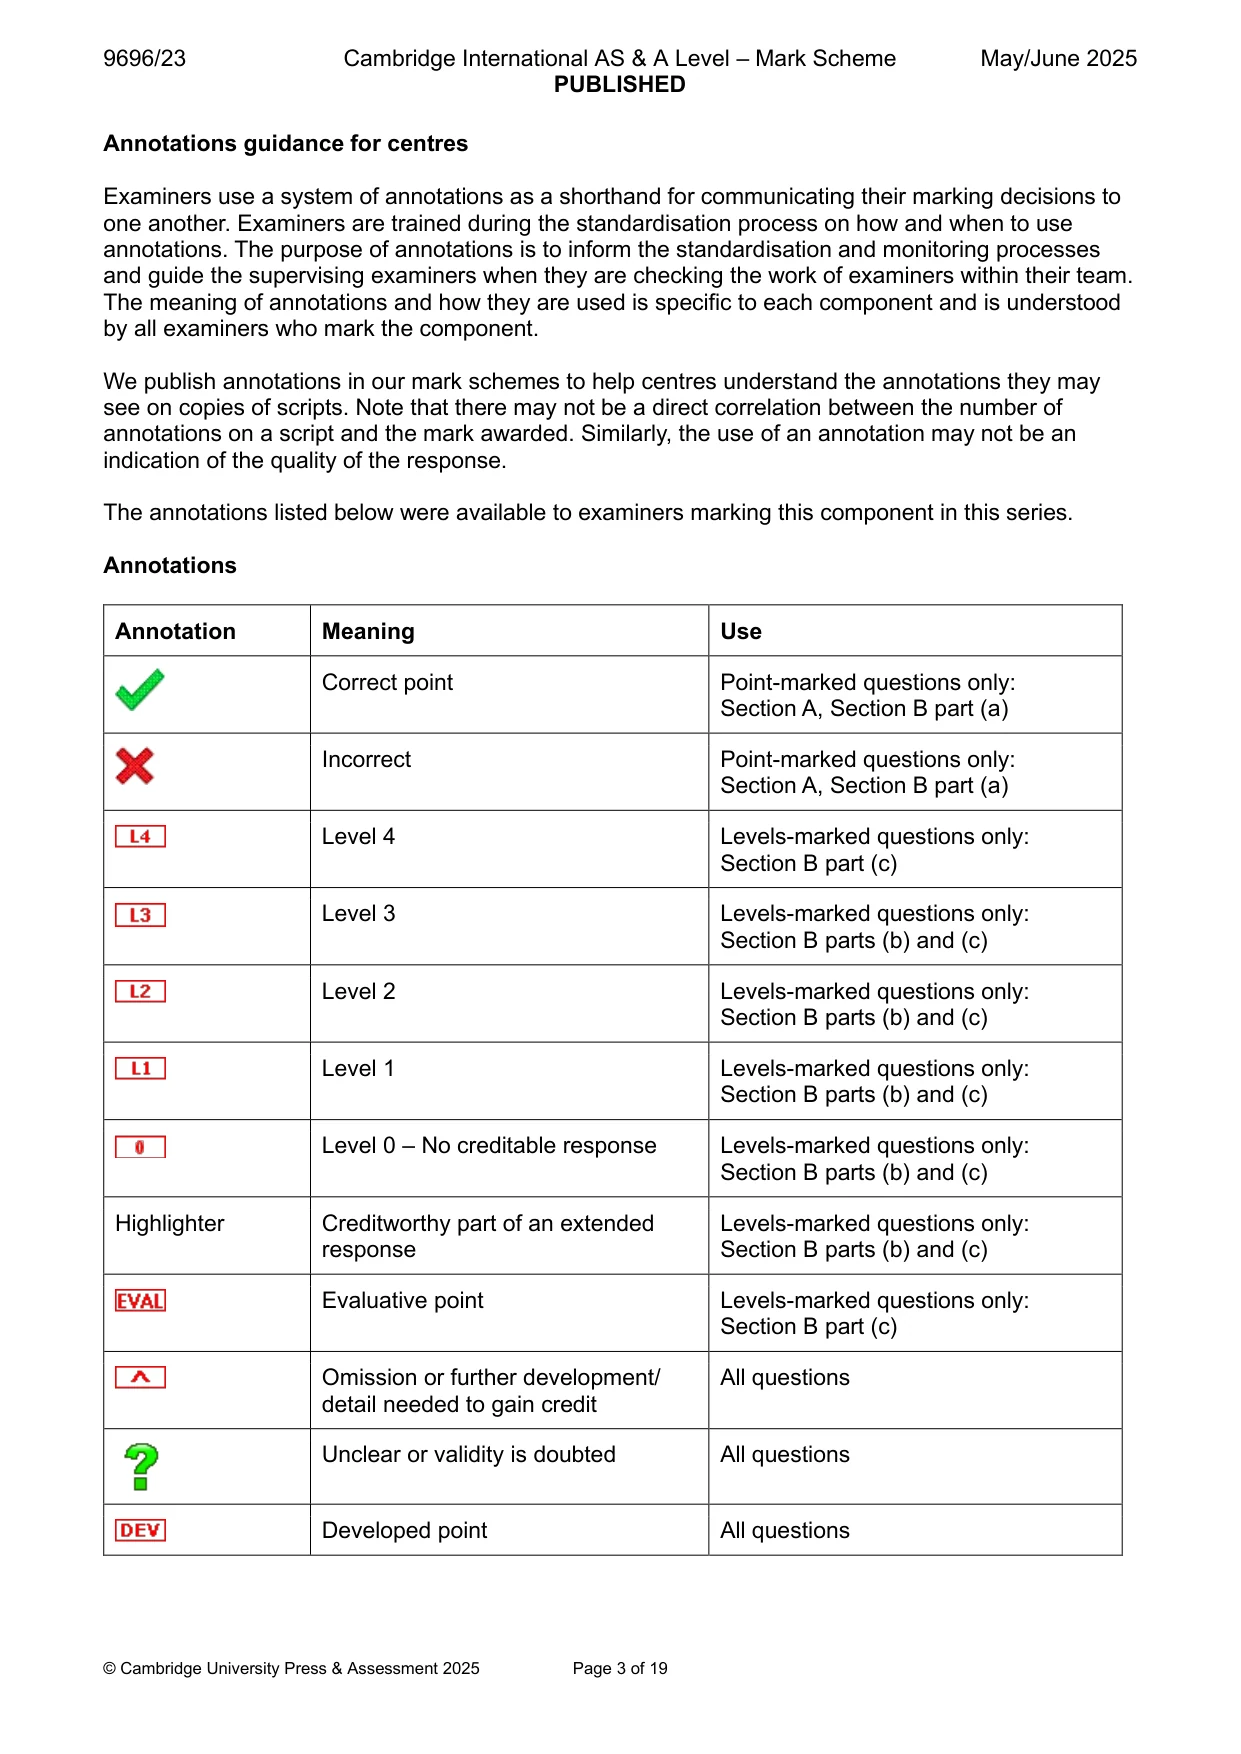
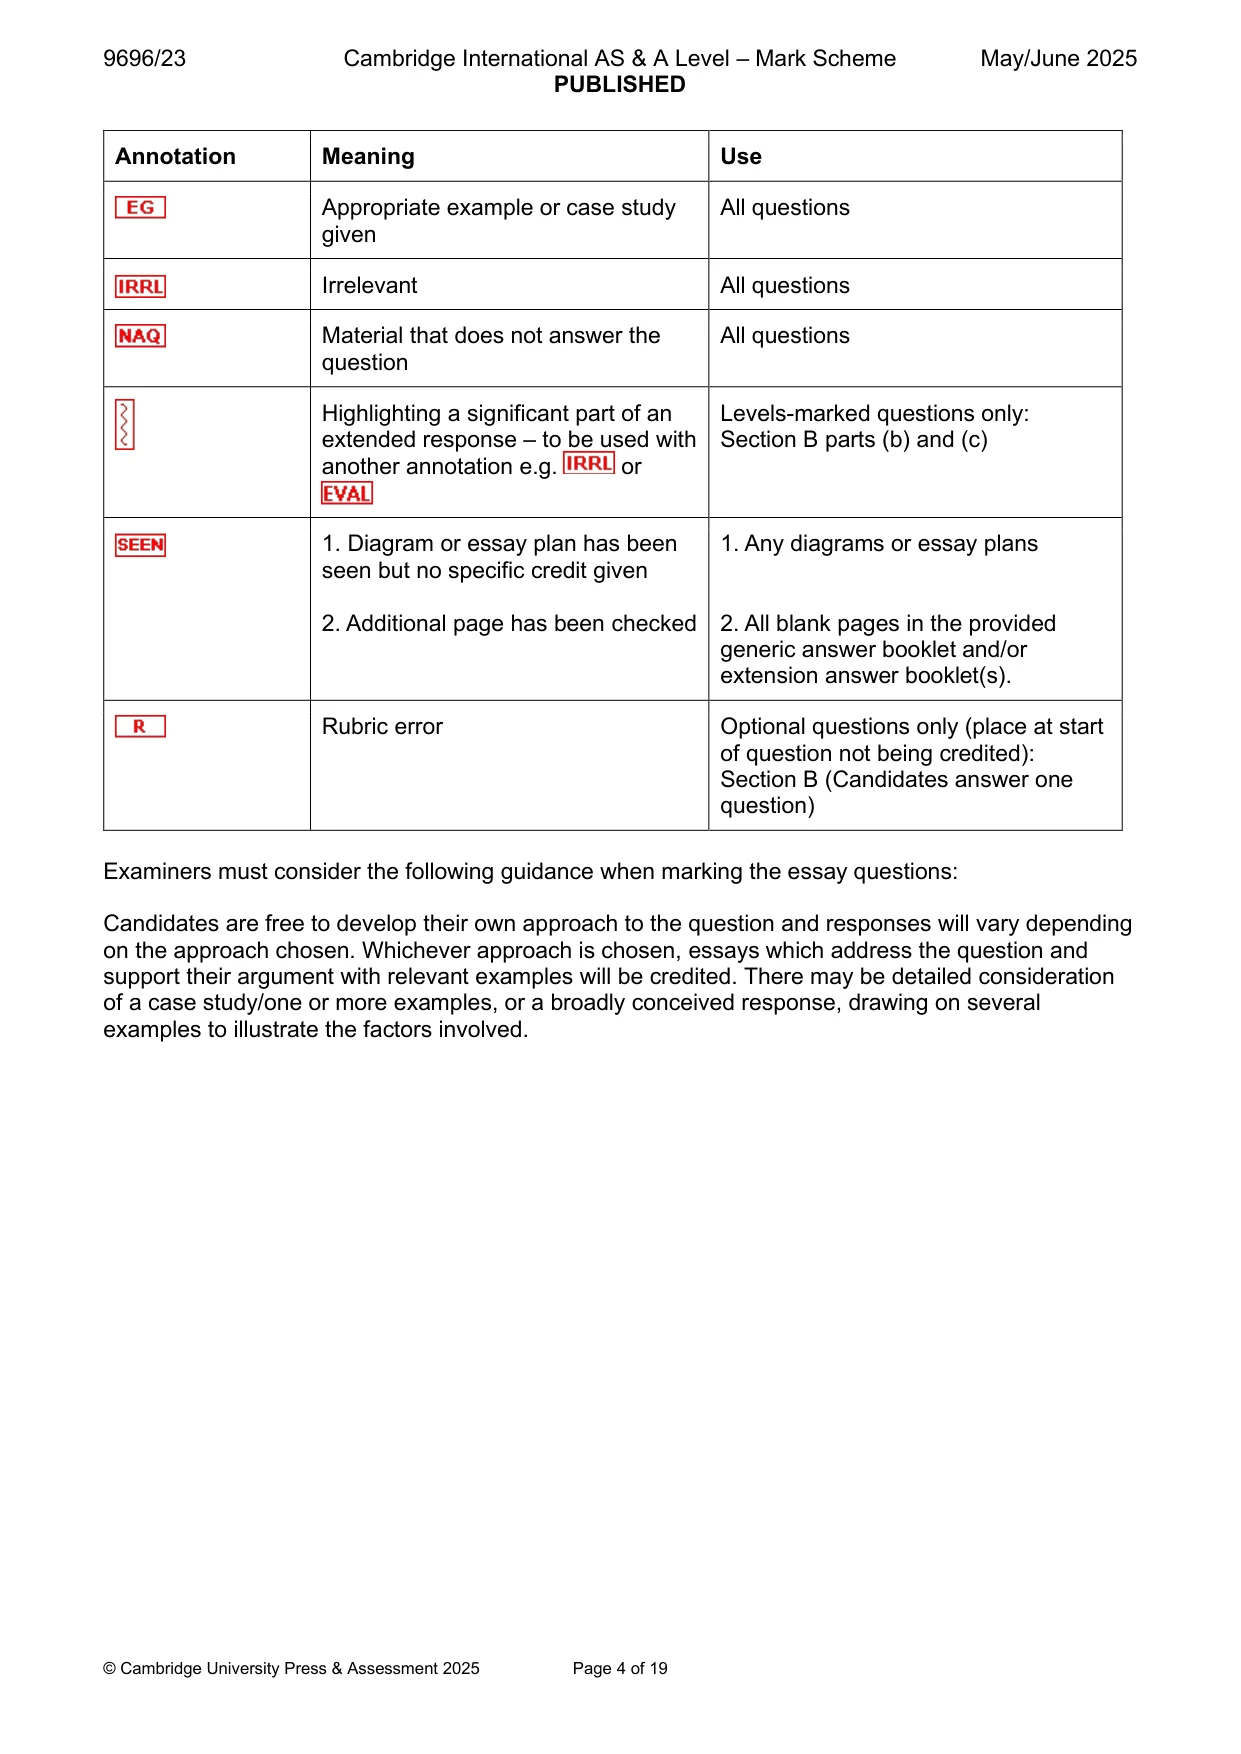
The question paper and its mark scheme, free to read here and free to download. This is Cambridge’s own paper, exactly as it was sat.
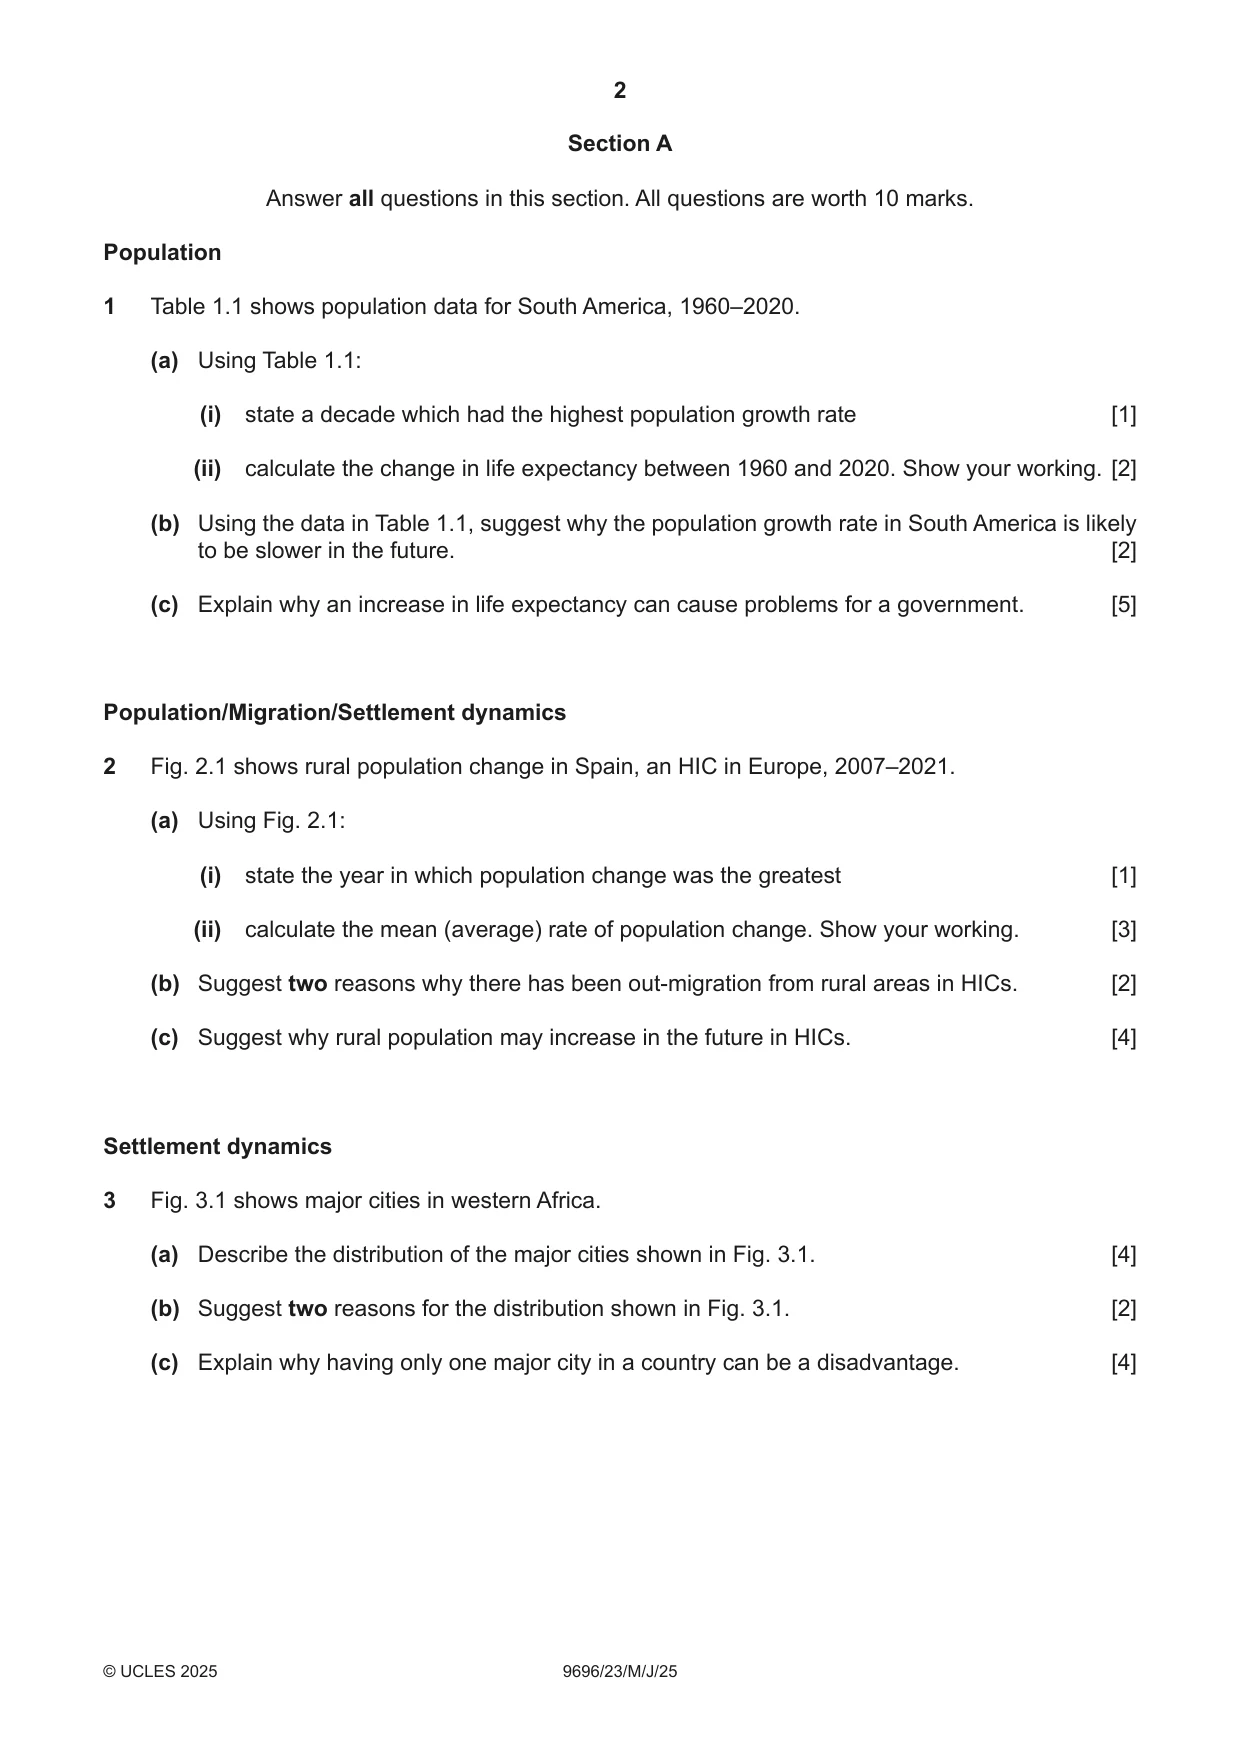
Question paper4 pages

Mark scheme19 pages
Answers below. Sit the paper first if you are practising.

Questions as text
Q1 · Population data for South America, 1960–2020
1 Table 1.1 shows population data for South America, 1960–2020. (a) Using Table 1.1: (i) state a decade which had the highest population growth rate [1] (ii) calculate the change in life expectancy between 1960 and 2020. Show your working. [2] (b) Using the data in Table 1.1, suggest why the population growth rate in South America is likely to be slower in the future. [2] (c) Explain why an increase in life expectancy can cause problems for a government. [5] Population/Migration/Settlement dynamics
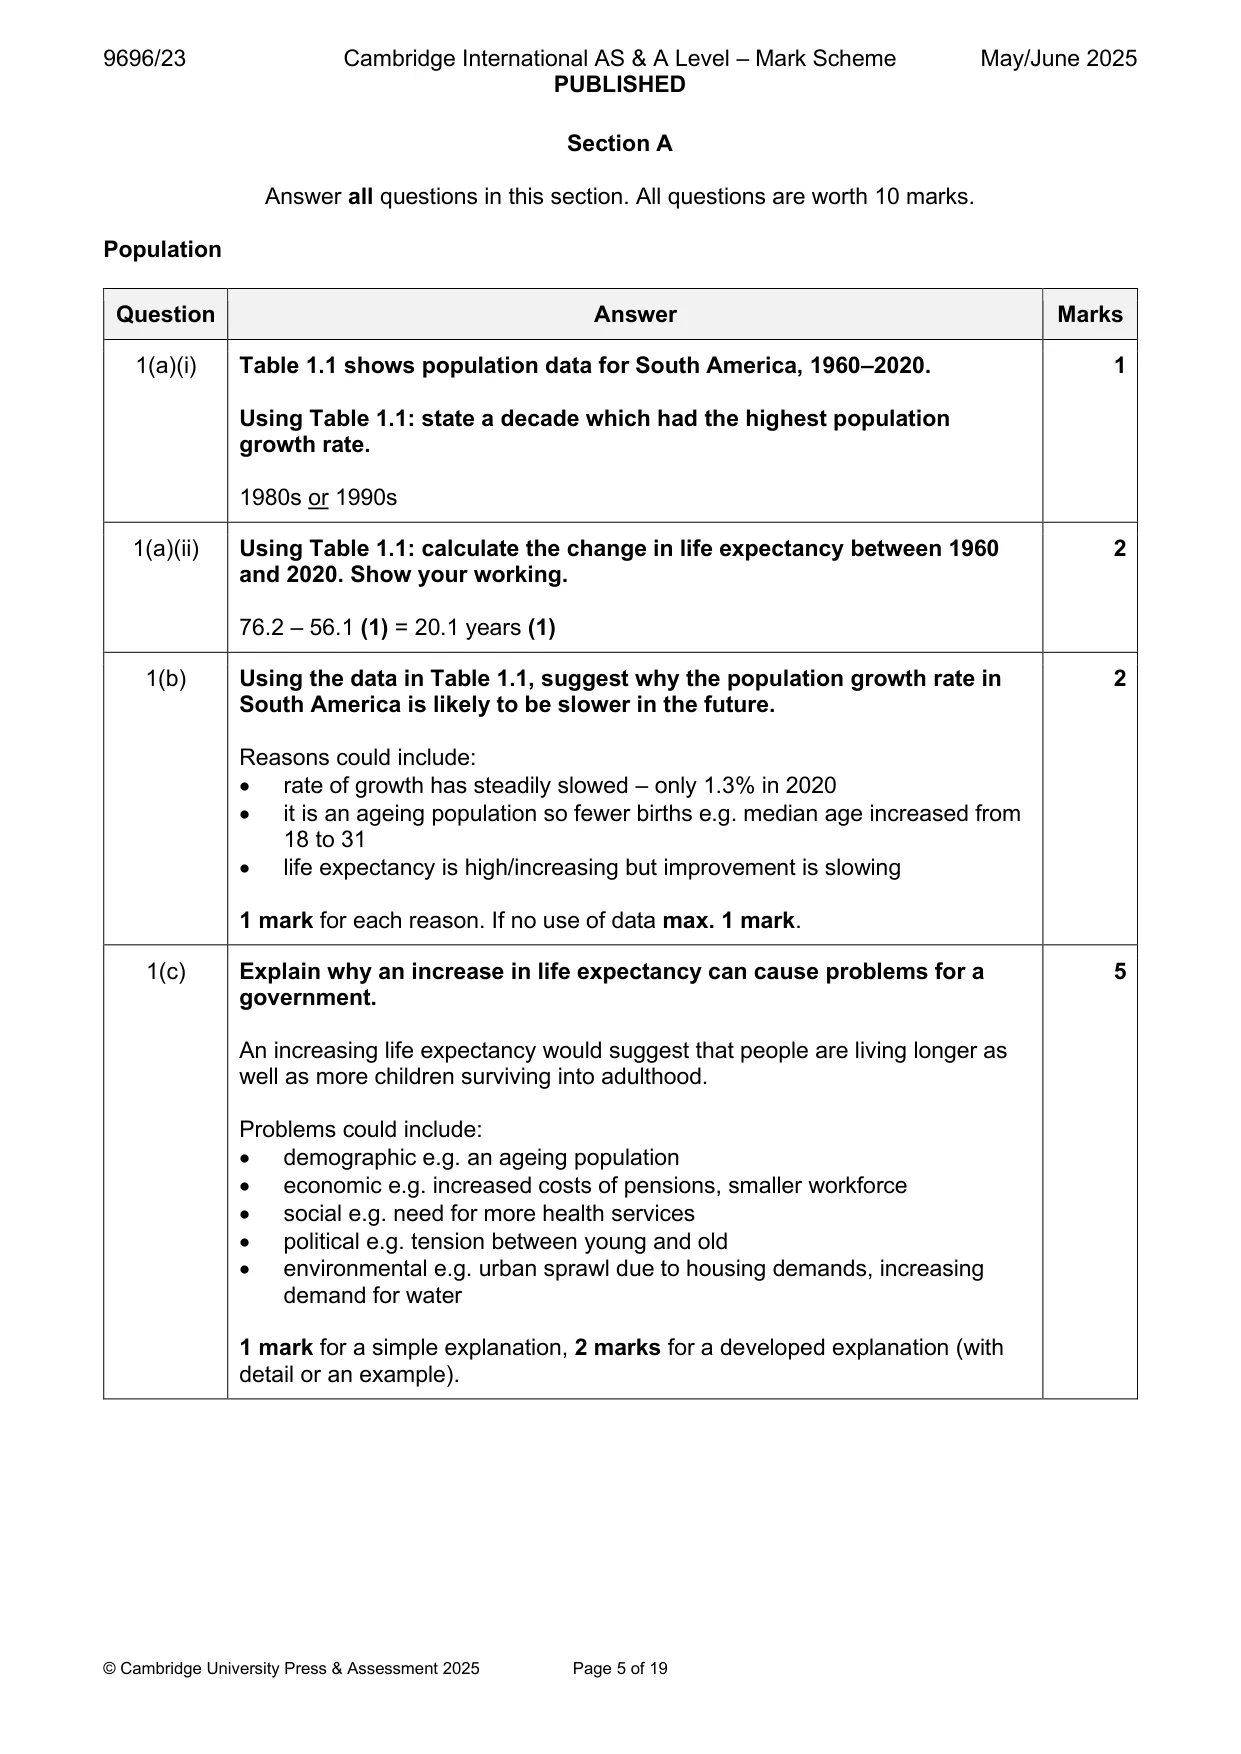
Mark scheme: Question Answer Marks 1(a)(i) Table 1.1 shows population data for South America, 1960–2020. 1 Using Table 1.1: state a decade which had the highest population growth rate. 1980s or 1990s 1(a)(ii) Using Table 1.1: calculate the change in life expectancy between 1960 2 and 2020. Show your working. 76.2 – 56.1 (1) = 20.1 years (1) 1(b) Using the data in Table 1.1, suggest why the population growth rate in 2 South America is likely to be slower in the future. Reasons could include: • rate of growth has steadily slowed – only 1.3% in 2020 • it is an ageing population so fewer births e.g. median age increased from 18 to 31 • life expectancy is high/increasing but improvement is slowing 1 mark for each reason. If no use of data max. 1 mark. 1(c) Explain why an increase in life expectancy can cause problems for a 5 government. An increasing life expectancy would suggest that people are living longer as well as more children surviving into adulthood. Problems could include: • demographic e.g. an ageing population • economic e.g. increased costs of pensions, smaller workforce • social e.g. need for more health services • political e.g. tension between young and old • environmental e.g. urban sprawl due to housing demands, increasing demand for water 1 mark for a simple explanation, 2 marks for a developed explanation (with detail or an example). Population/Migration/Settlement dynamics
Q2 · Rural population change in Spain, an HIC in Europe, 2007–2021
2 Fig. 2.1 shows rural population change in Spain, an HIC in Europe, 2007–2021. (a) Using Fig. 2.1: (i) state the year in which population change was the greatest [1] (ii) calculate the mean (average) rate of population change. Show your working. [3] (b) Suggest two reasons why there has been out-migration from rural areas in HICs. [2] (c) Suggest why rural population may increase in the future in HICs. [4] Settlement dynamics
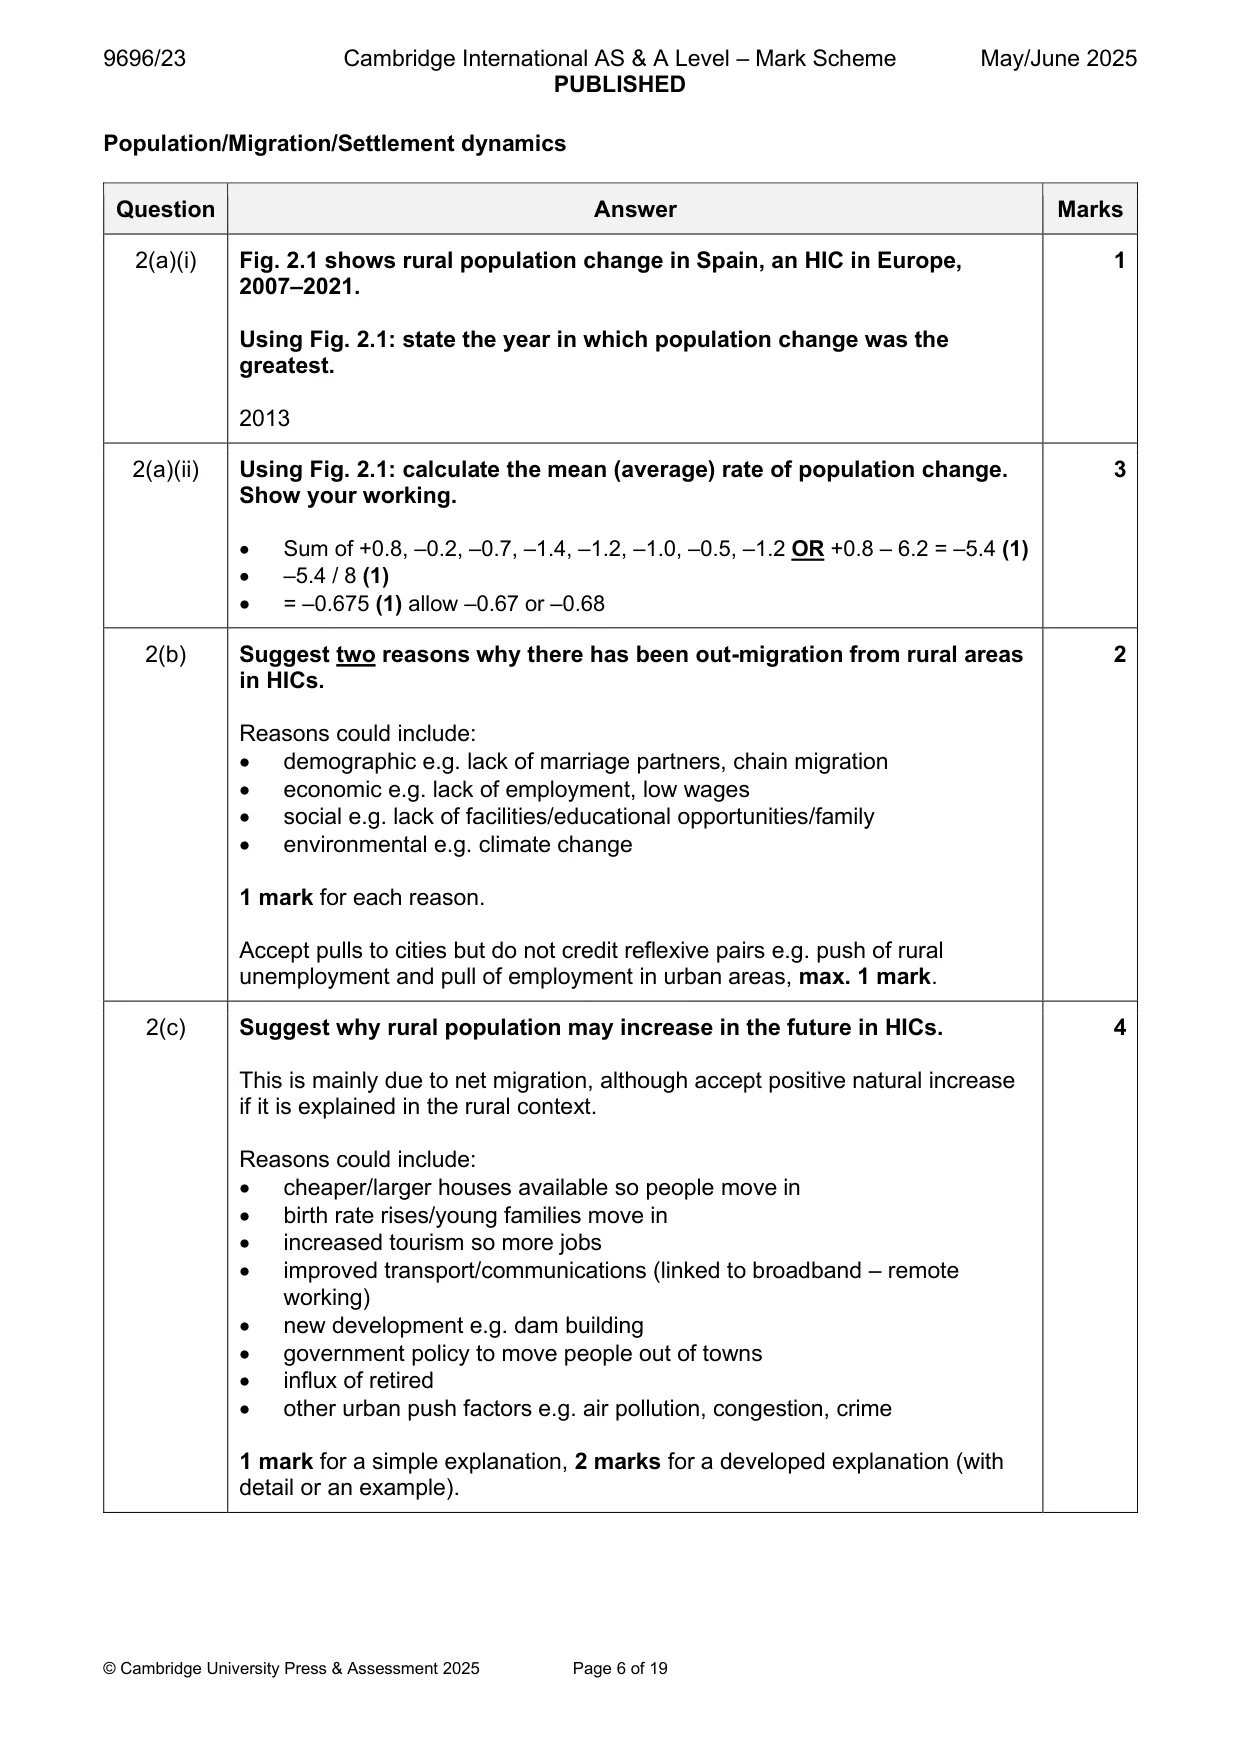
Mark scheme: 2(a)(i) Fig. 2.1 shows rural population change in Spain, an HIC in Europe, 1 2007–2021. Using Fig. 2.1: state the year in which population change was the greatest. 2013 2(a)(ii) Using Fig. 2.1: calculate the mean (average) rate of population change. 3 Show your working. • Sum of +0.8, –0.2, –0.7, –1.4, –1.2, –1.0, –0.5, –1.2 OR +0.8 – 6.2 = –5.4 (1) • –5.4 / 8 (1) • = –0.675 (1) allow –0.67 or –0.68 2(b) Suggest two reasons why there has been out-migration from rural areas 2 in HICs. Reasons could include: • demographic e.g. lack of marriage partners, chain migration • economic e.g. lack of employment, low wages • social e.g. lack of facilities/educational opportunities/family • environmental e.g. climate change 1 mark for each reason. Accept pulls to cities but do not credit reflexive pairs e.g. push of rural unemployment and pull of employment in urban areas, max. 1 mark. 2(c) Suggest why rural population may increase in the future in HICs. 4 This is mainly due to net migration, although accept positive natural increase if it is explained in the rural context. Reasons could include: • cheaper/larger houses available so people move in • birth rate rises/young families move in • increased tourism so more jobs • improved transport/communications (linked to broadband – remote working) • new development e.g. dam building • government policy to move people out of towns • influx of retired • other urban push factors e.g. air pollution, congestion, crime 1 mark for a simple explanation, 2 marks for a developed explanation (with detail or an example). Settlement dynamics
Q3 · Major cities in western Africa
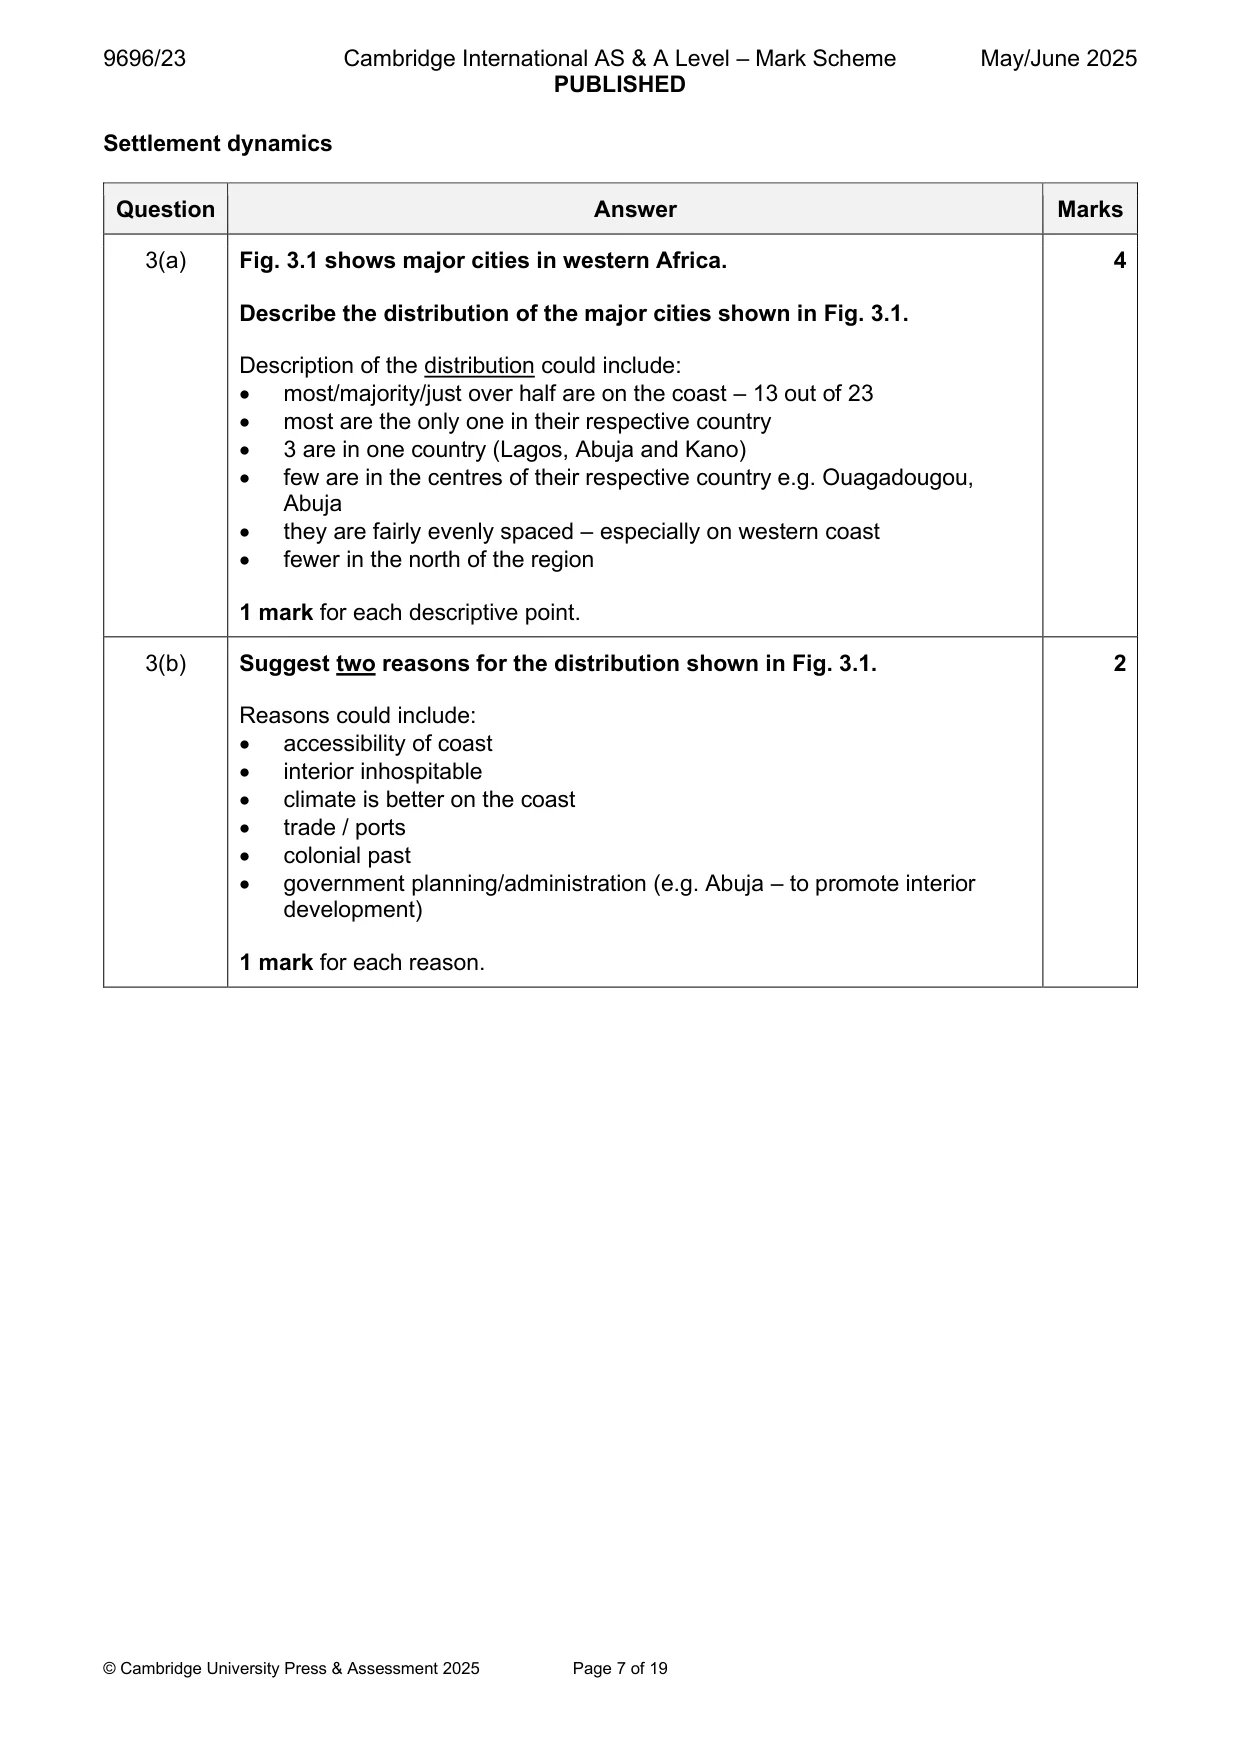
3 Fig. 3.1 shows major cities in western Africa. (a) Describe the distribution of the major cities shown in Fig. 3.1. [4] (b) Suggest two reasons for the distribution shown in Fig. 3.1. [2] (c) Explain why having only one major city in a country can be a disadvantage. [4]
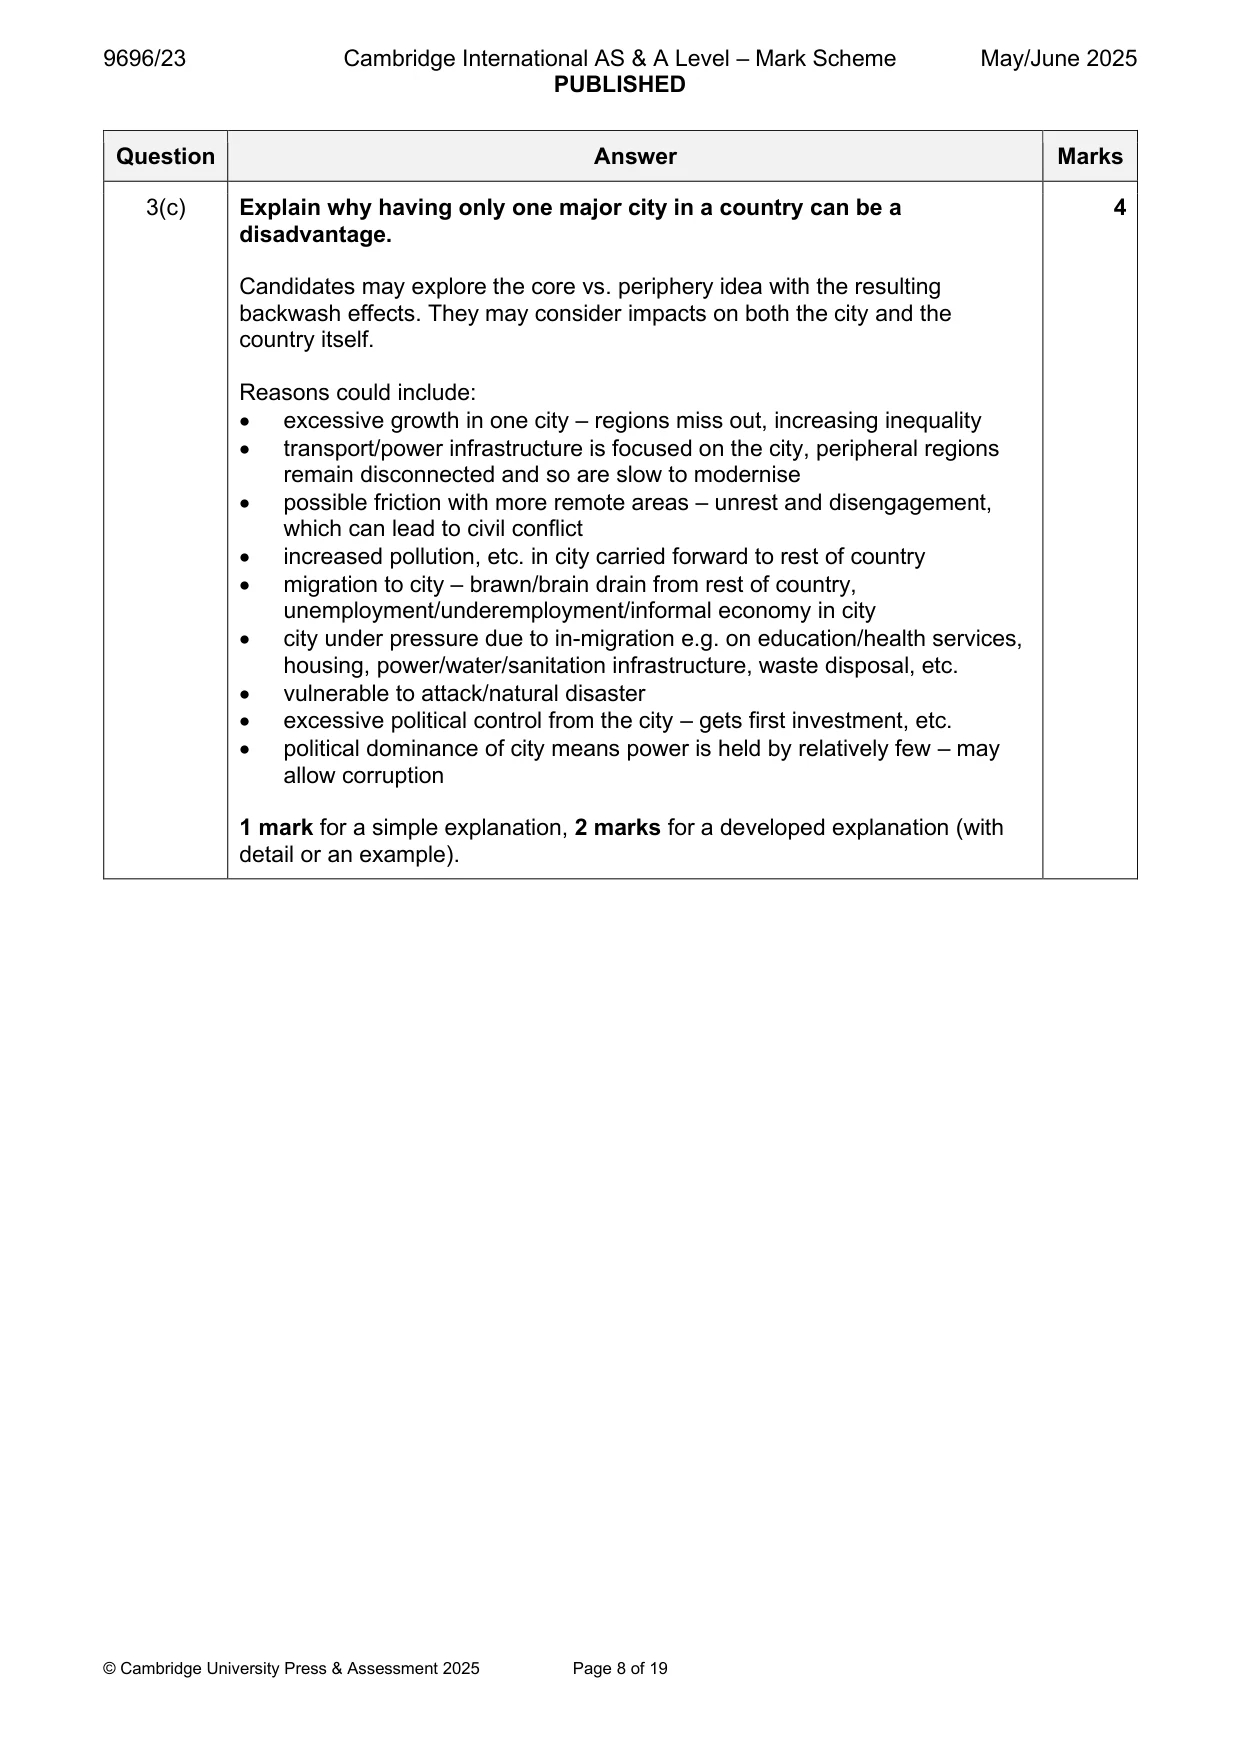
Mark scheme: 3(a) Fig. 3.1 shows major cities in western Africa. 4 Describe the distribution of the major cities shown in Fig. 3.1. Description of the distribution could include: • most/majority/just over half are on the coast – 13 out of 23 • most are the only one in their respective country • 3 are in one country (Lagos, Abuja and Kano) • few are in the centres of their respective country e.g. Ouagadougou, Abuja • they are fairly evenly spaced – especially on western coast • fewer in the north of the region 1 mark for each descriptive point. 3(b) Suggest two reasons for the distribution shown in Fig. 3.1. 2 Reasons could include: • accessibility of coast • interior inhospitable • climate is better on the coast • trade / ports • colonial past • government planning/administration (e.g. Abuja – to promote interior development) 1 mark for each reason. 3(c) Explain why having only one major city in a country can be a 4 disadvantage. Candidates may explore the core vs. periphery idea with the resulting backwash effects. They may consider impacts on both the city and the country itself. Reasons could include: • excessive growth in one city – regions miss out, increasing inequality • transport/power infrastructure is focused on the city, peripheral regions remain disconnected and so are slow to modernise • possible friction with more remote areas – unrest and disengagement, which can lead to civil conflict • increased pollution, etc. in city carried forward to rest of country • migration to city – brawn/brain drain from rest of country, unemployment/underemployment/informal economy in city • city under pressure due to in-migration e.g. on education/health services, housing, power/water/sanitation infrastructure, waste disposal, etc. • vulnerable to attack/natural disaster • excessive political control from the city – gets first investment, etc. • political dominance of city means power is held by relatively few – may allow corruption 1 mark for a simple explanation, 2 marks for a developed explanation (with detail or an example). Section B Answer one question from this section. All questions are worth 30 marks. Population
Q4 · Outline the concept of ‘optimum population’
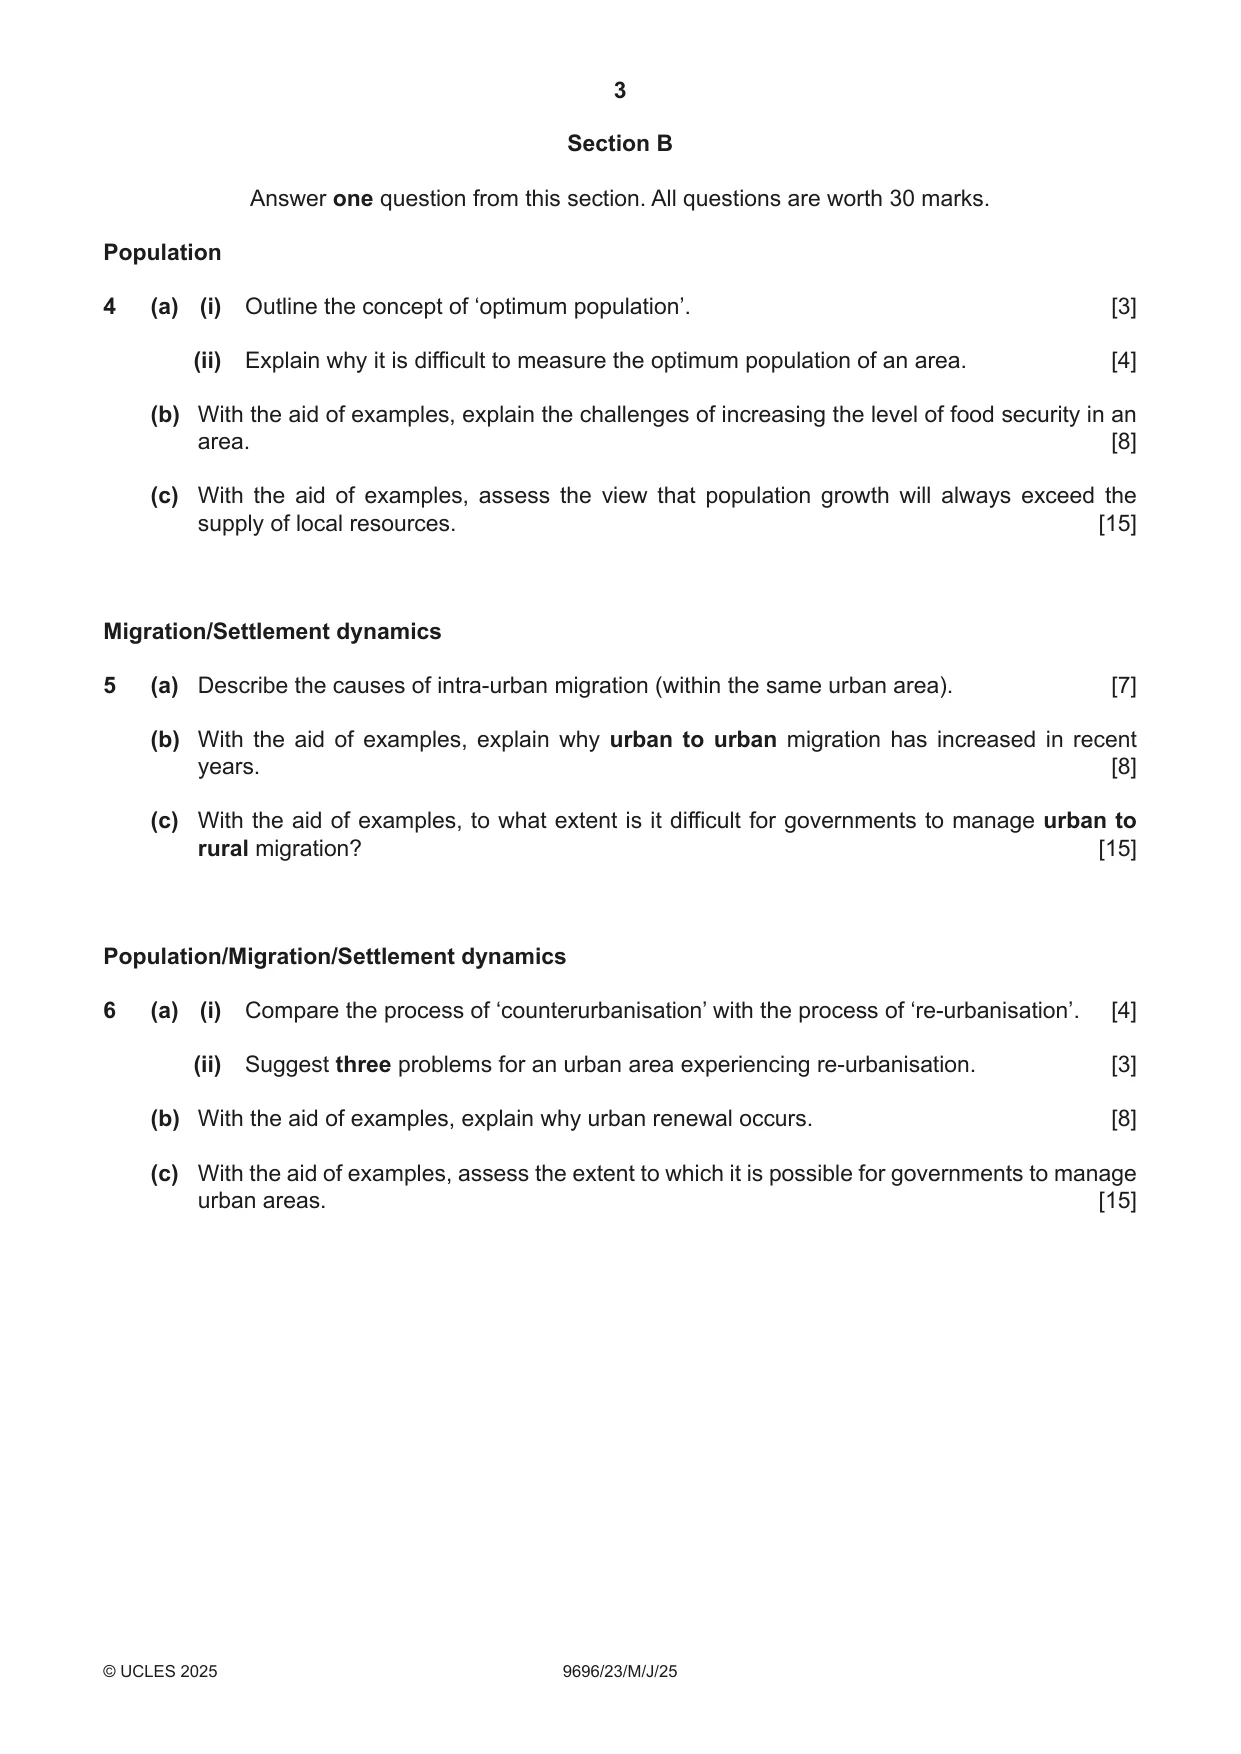
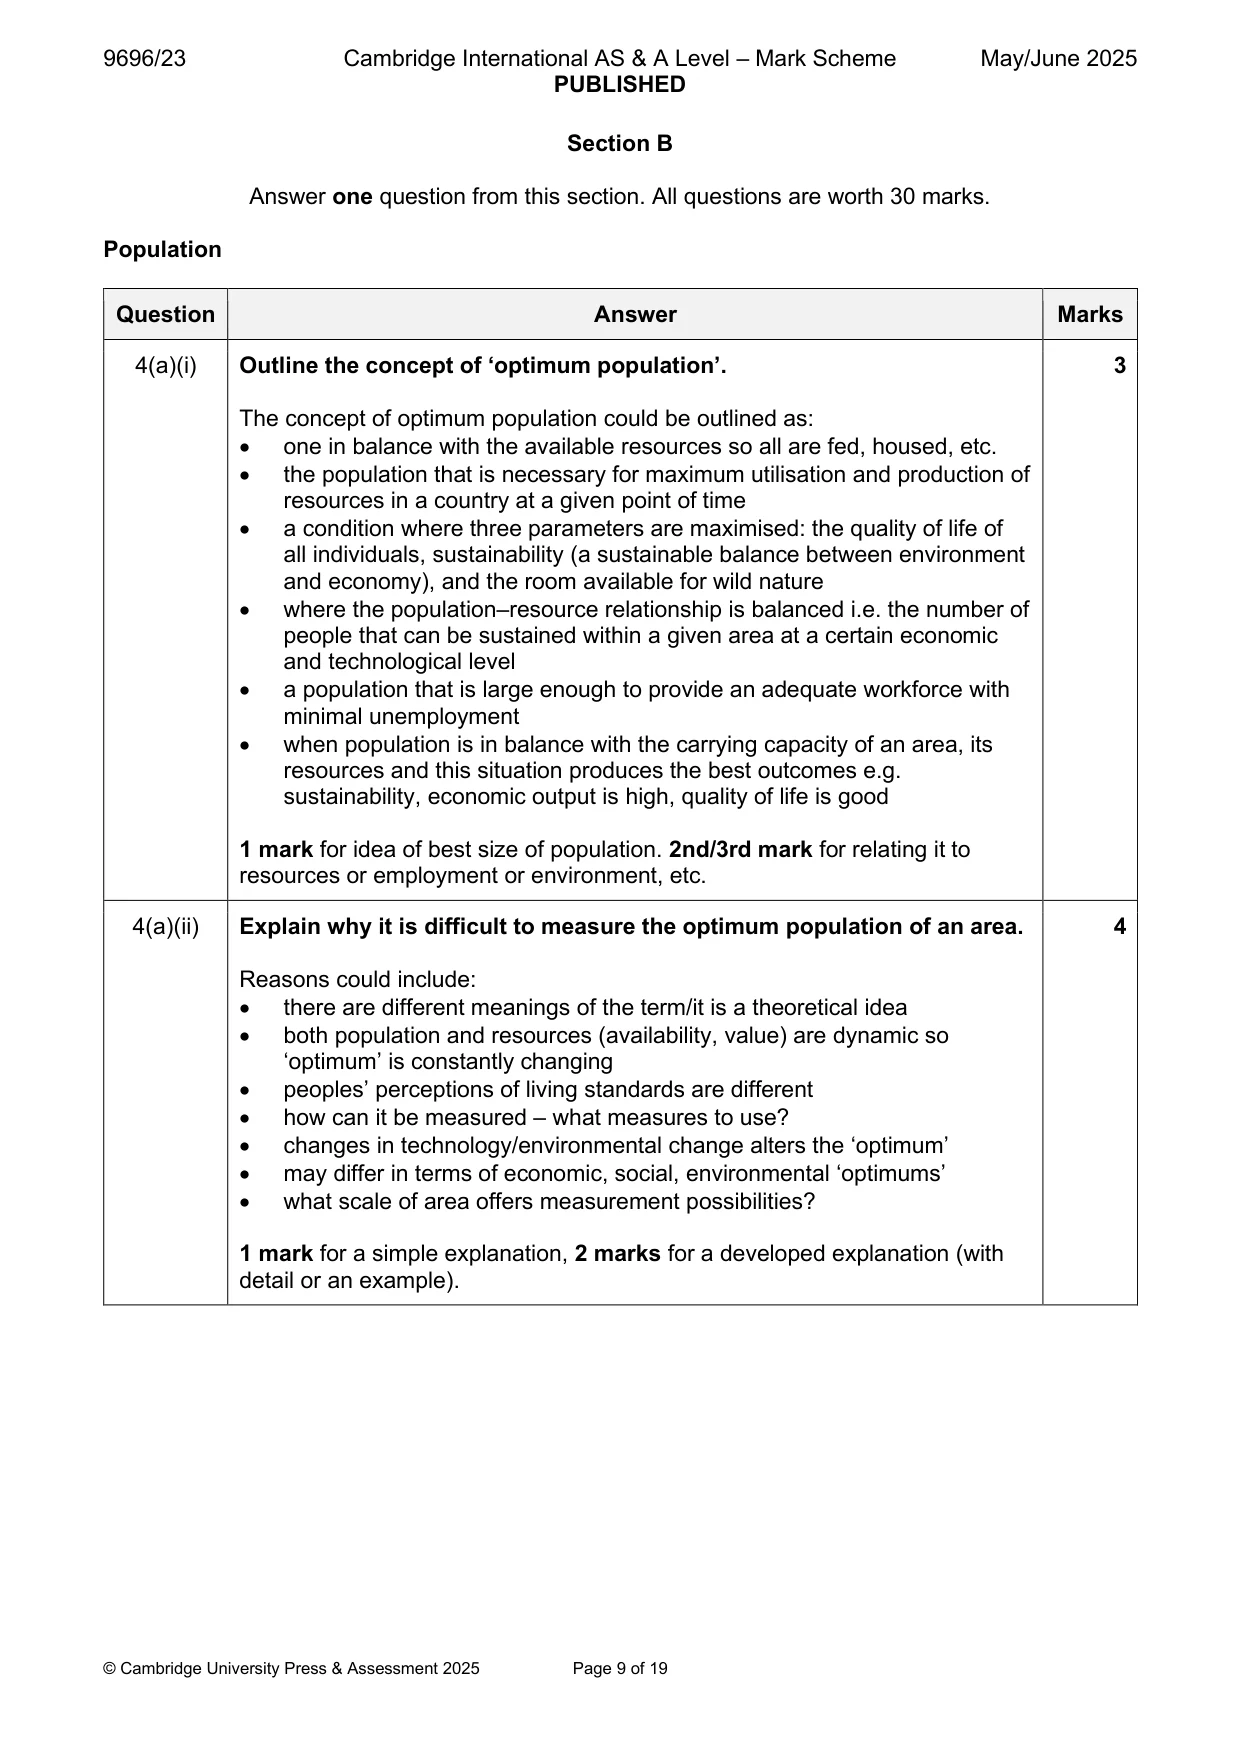
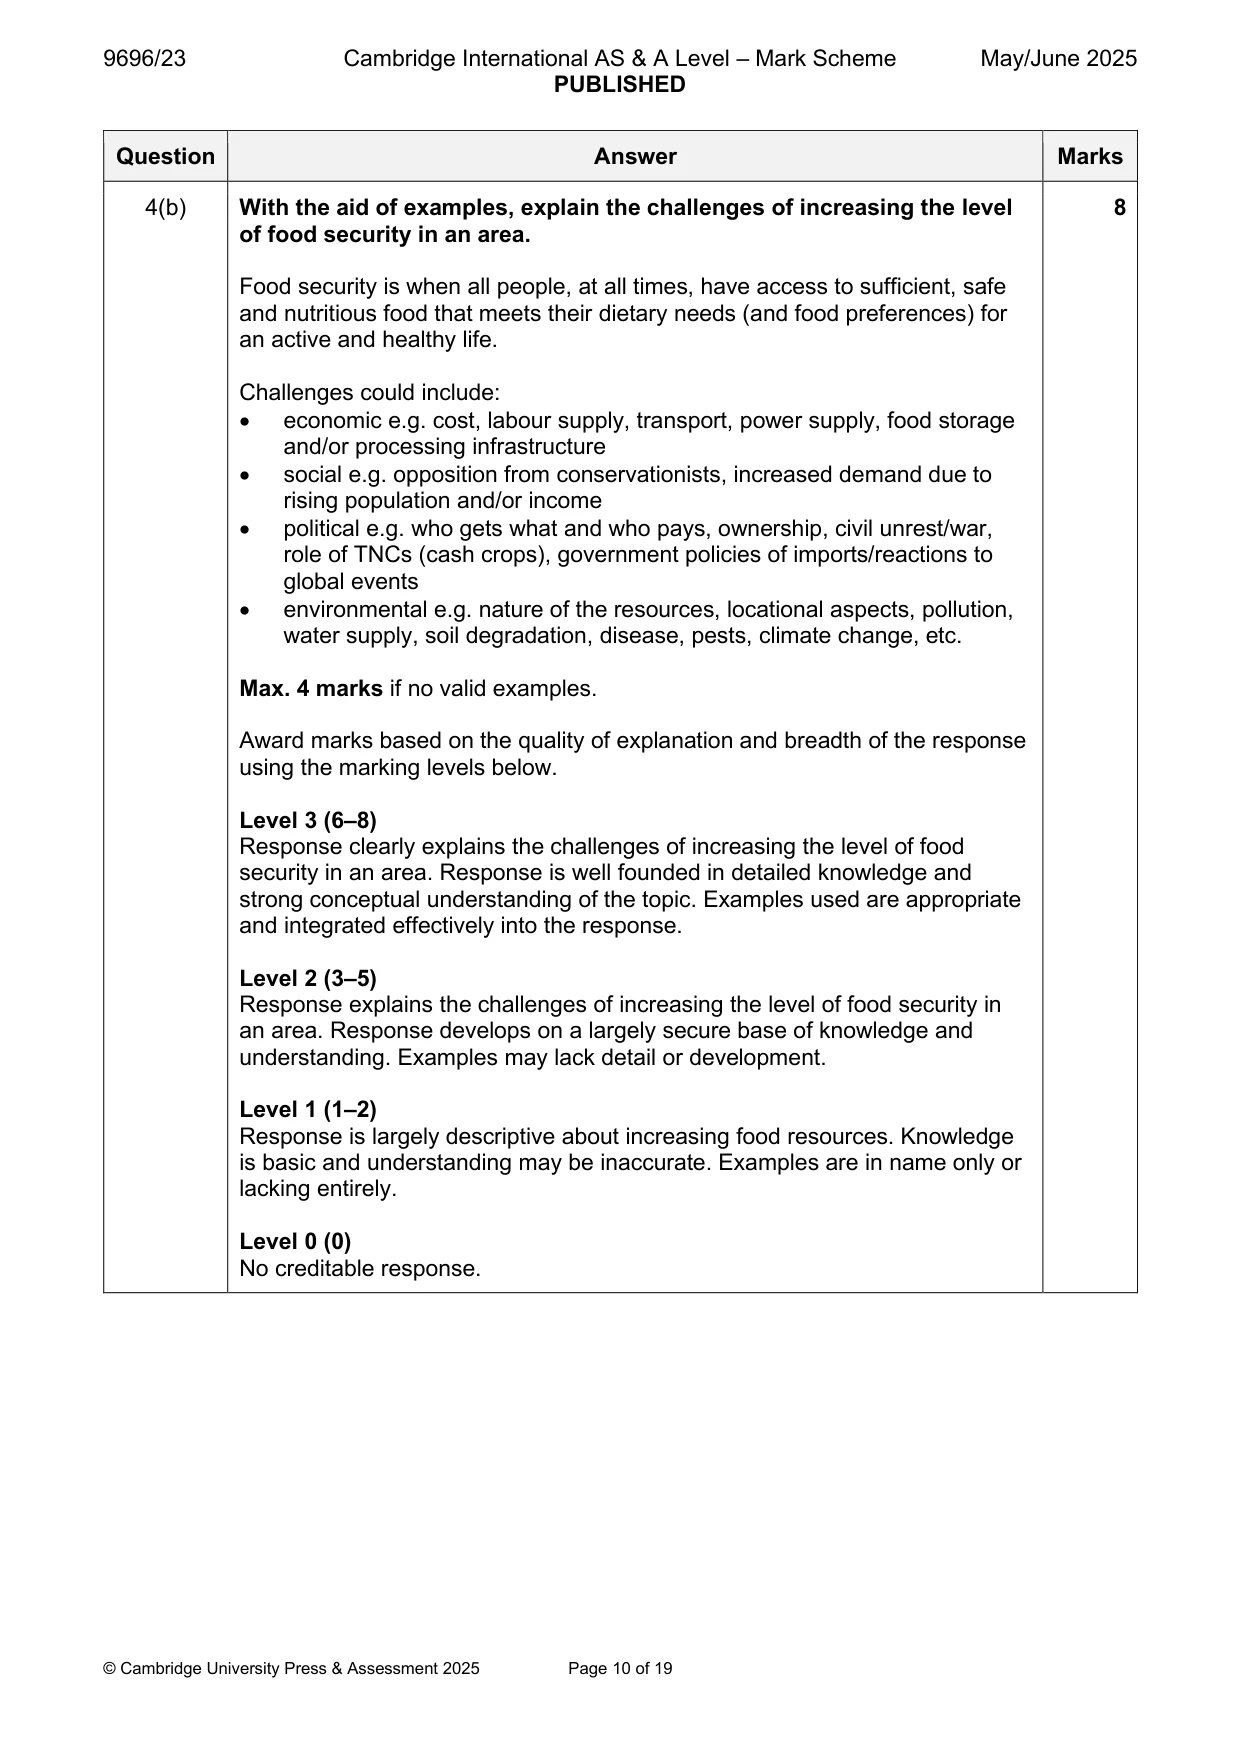
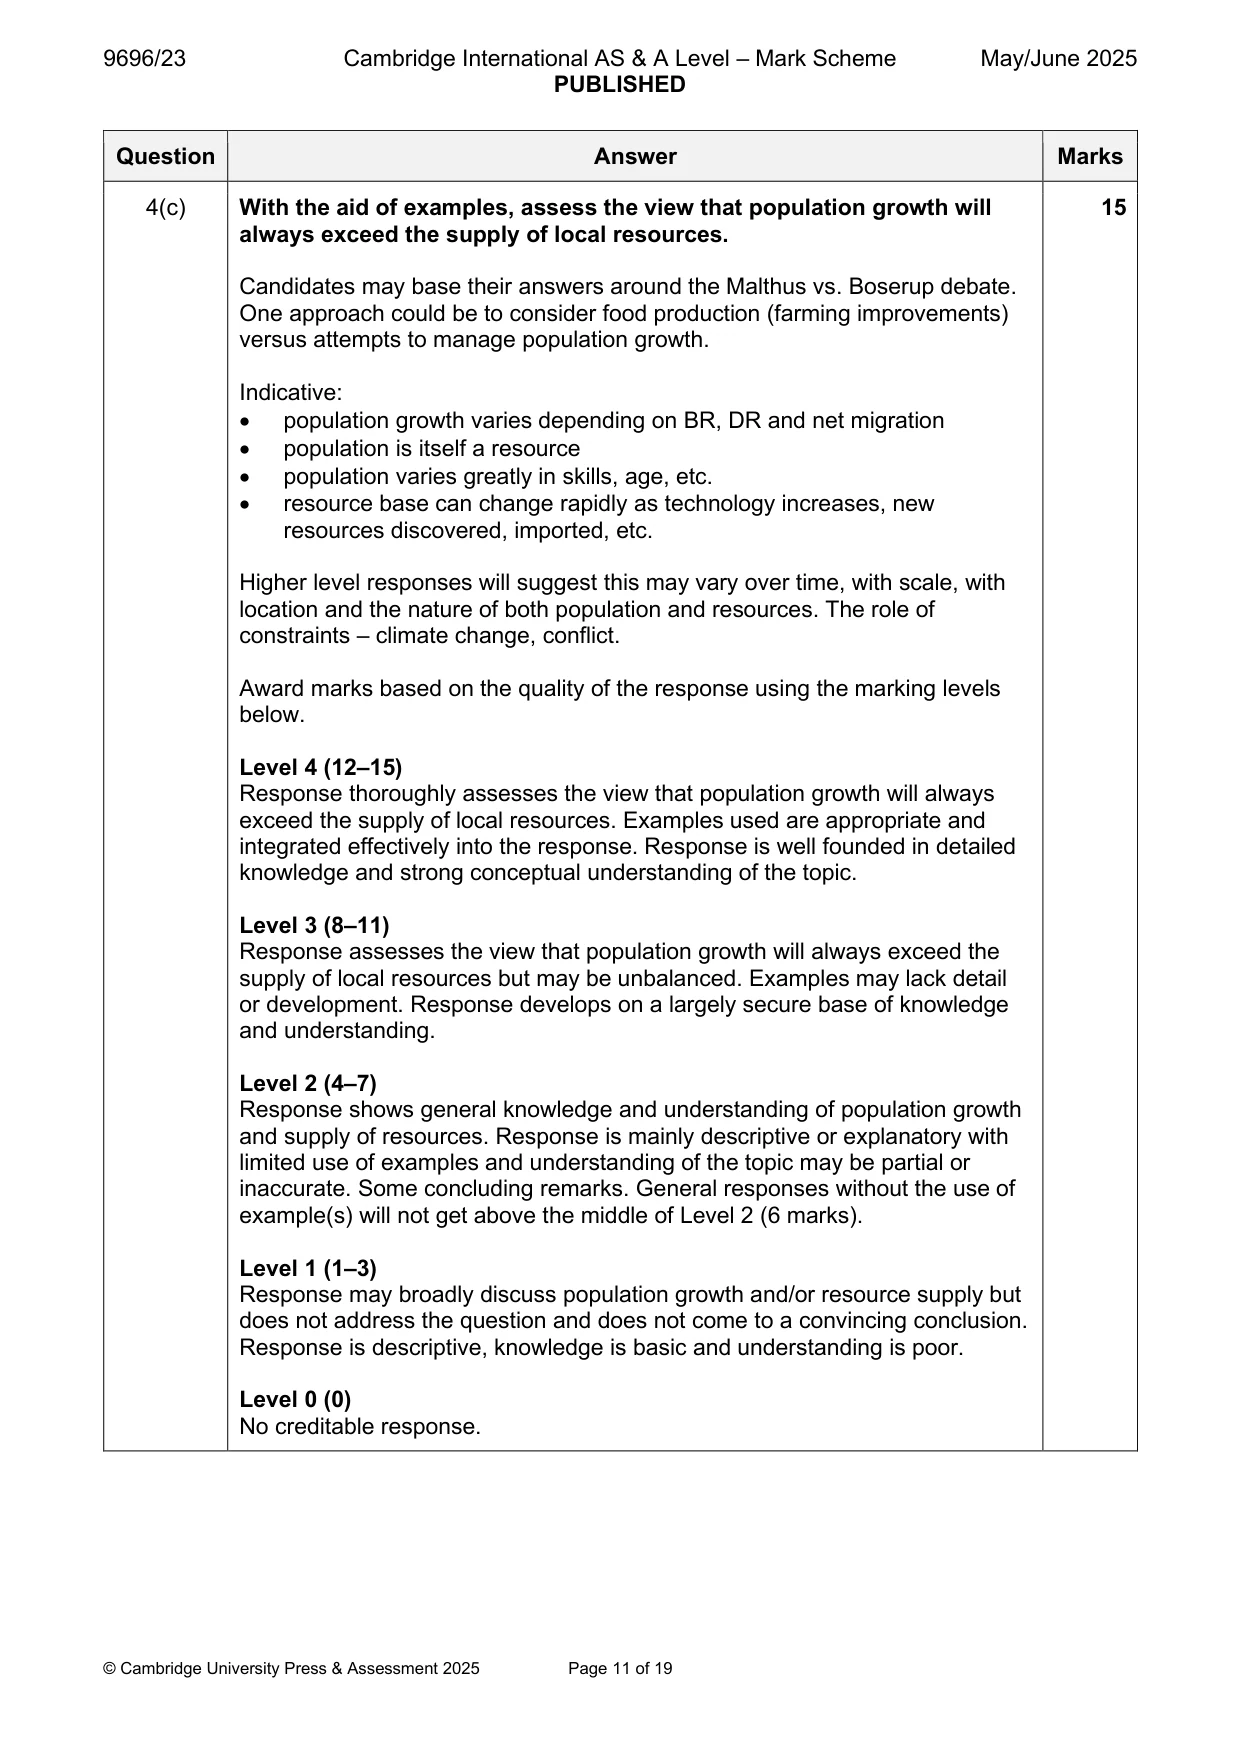
4 (a) (i) Outline the concept of ‘optimum population’. [3] (ii) Explain why it is difficult to measure the optimum population of an area. [4] (b) With the aid of examples, explain the challenges of increasing the level of food security in an area. [8] (c) With the aid of examples, assess the view that population growth will always exceed the supply of local resources. [15] Migration/Settlement dynamics
Mark scheme: 4(a)(i) Outline the concept of ‘optimum population’. 3 The concept of optimum population could be outlined as: • one in balance with the available resources so all are fed, housed, etc. • the population that is necessary for maximum utilisation and production of resources in a country at a given point of time • a condition where three parameters are maximised: the quality of life of all individuals, sustainability (a sustainable balance between environment and economy), and the room available for wild nature • where the population–resource relationship is balanced i.e. the number of people that can be sustained within a given area at a certain economic and technological level • a population that is large enough to provide an adequate workforce with minimal unemployment • when population is in balance with the carrying capacity of an area, its resources and this situation produces the best outcomes e.g. sustainability, economic output is high, quality of life is good 1 mark for idea of best size of population. 2nd/3rd mark for relating it to resources or employment or environment, etc. 4(a)(ii) Explain why it is difficult to measure the optimum population of an area. 4 Reasons could include: • there are different meanings of the term/it is a theoretical idea • both population and resources (availability, value) are dynamic so ‘optimum’ is constantly changing • peoples’ perceptions of living standards are different • how can it be measured – what measures to use? • changes in technology/environmental change alters the ‘optimum’ • may differ in terms of economic, social, environmental ‘optimums’ • what scale of area offers measurement possibilities? 1 mark for a simple explanation, 2 marks for a developed explanation (with detail or an example). 4(b) With the aid of examples, explain the challenges of increasing the level 8 of food security in an area. Food security is when all people, at all times, have access to sufficient, safe and nutritious food that meets their dietary needs (and food preferences) for an active and healthy life. Challenges could include: • economic e.g. cost, labour supply, transport, power supply, food storage and/or processing infrastructure • social e.g. opposition from conservationists, increased demand due to rising population and/or income • political e.g. who gets what and who pays, ownership, civil unrest/war, role of TNCs (cash crops), government policies of imports/reactions to global events • environmental e.g. nature of the resources, locational aspects, pollution, water supply, soil degradation, disease, pests, climate change, etc. Max. 4 marks if no valid examples. Award marks based on the quality of explanation and breadth of the response using the marking levels below. Level 3 (6–8) Response clearly explains the challenges of increasing the level of food security in an area. Response is well founded in detailed knowledge and strong conceptual understanding of the topic. Examples used are appropriate and integrated effectively into the response. Level 2 (3–5) Response explains the challenges of increasing the level of food security in an area. Response develops on a largely secure base of knowledge and understanding. Examples may lack detail or development. Level 1 (1–2) Response is largely descriptive about increasing food resources. Knowledge is basic and understanding may be inaccurate. Examples are in name only or lacking entirely. Level 0 (0) No creditable response. 4(c) With the aid of examples, assess the view that population growth will 15 always exceed the supply of local resources. Candidates may base their answers around the Malthus vs. Boserup debate. One approach could be to consider food production (farming improvements) versus attempts to manage population growth. Indicative: • population growth varies depending on BR, DR and net migration • population is itself a resource • population varies greatly in skills, age, etc. • resource base can change rapidly as technology increases, new resources discovered, imported, etc. Higher level responses will suggest this may vary over time, with scale, with location and the nature of both population and resources. The role of constraints – climate change, conflict. Award marks based on the quality of the response using the marking levels below. Level 4 (12–15) Response thoroughly assesses the view that population growth will always exceed the supply of local resources. Examples used are appropriate and integrated effectively into the response. Response is well founded in detailed knowledge and strong conceptual understanding of the topic. Level 3 (8–11) Response assesses the view that population growth will always exceed the supply of local resources but may be unbalanced. Examples may lack detail or development. Response develops on a largely secure base of knowledge and understanding. Level 2 (4–7) Response shows general knowledge and understanding of population growth and supply of resources. Response is mainly descriptive or explanatory with limited use of examples and understanding of the topic may be partial or inaccurate. Some concluding remarks. General responses without the use of example(s) will not get above the middle of Level 2 (6 marks). Level 1 (1–3) Response may broadly discuss population growth and/or resource supply but does not address the question and does not come to a convincing conclusion. Response is descriptive, knowledge is basic and understanding is poor. Level 0 (0) No creditable response. Migration/Settlement dynamics
Q5 · Describe the causes of intra-urban migration (within the same urban area)
5 (a) Describe the causes of intra-urban migration (within the same urban area). [7] (b) With the aid of examples, explain why urban to urban migration has increased in recent years. [8] (c) With the aid of examples, to what extent is it difficult for governments to manage urban to rural migration? [15] Population/Migration/Settlement dynamics
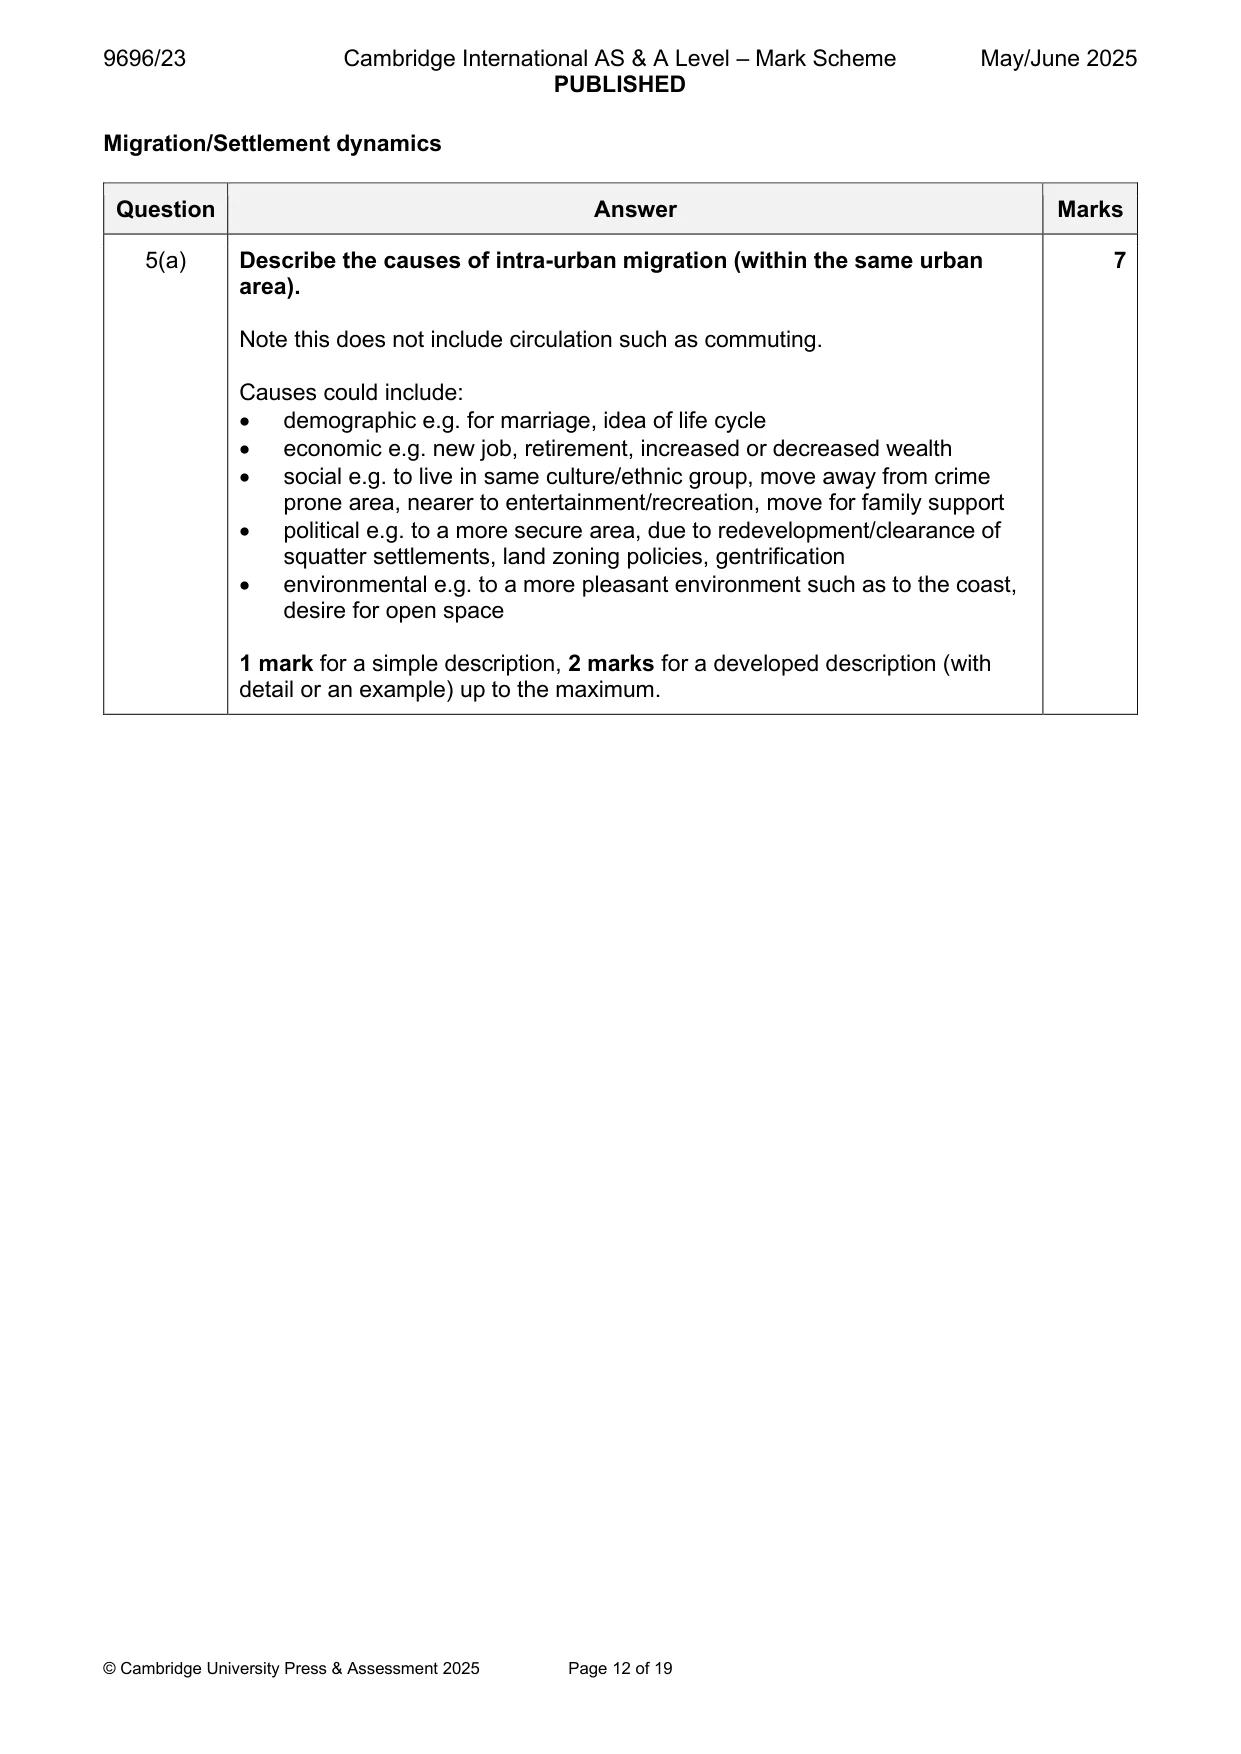
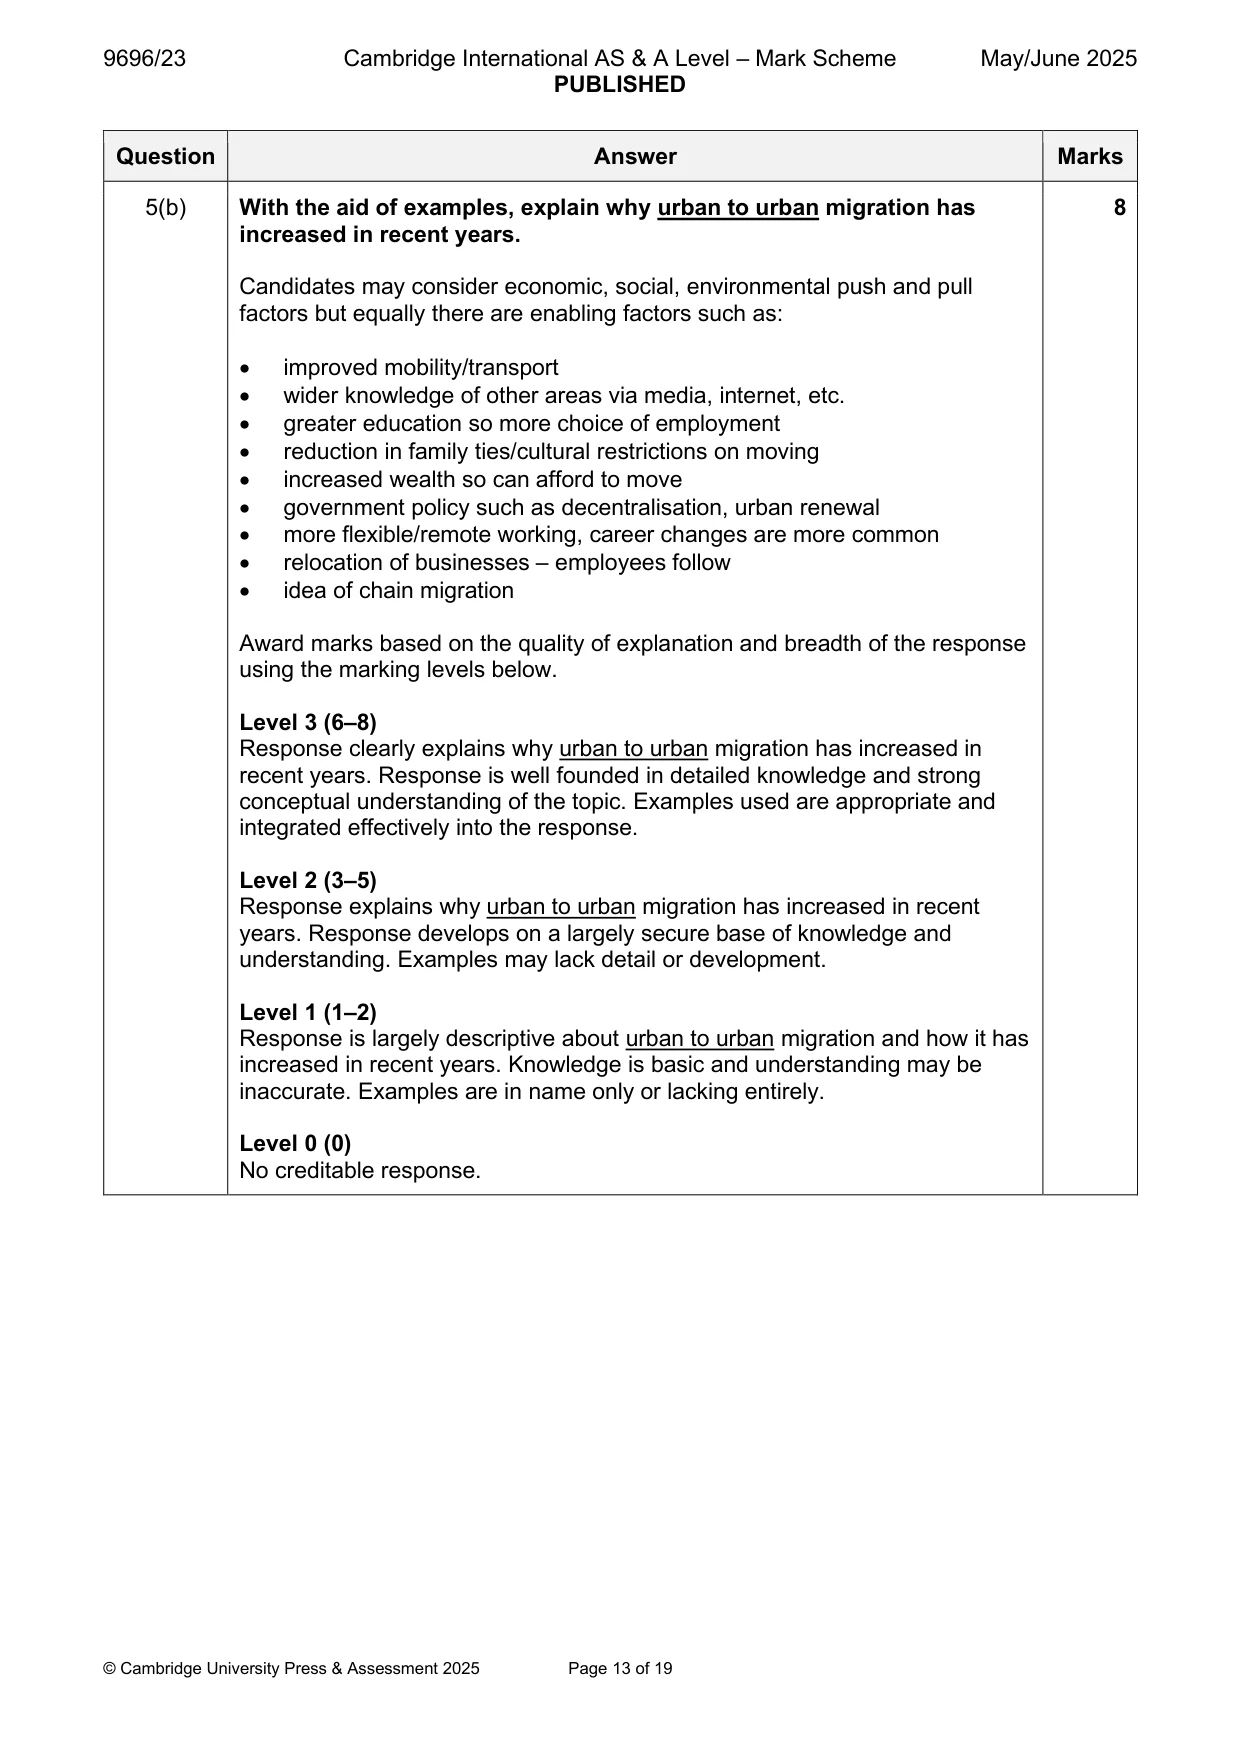
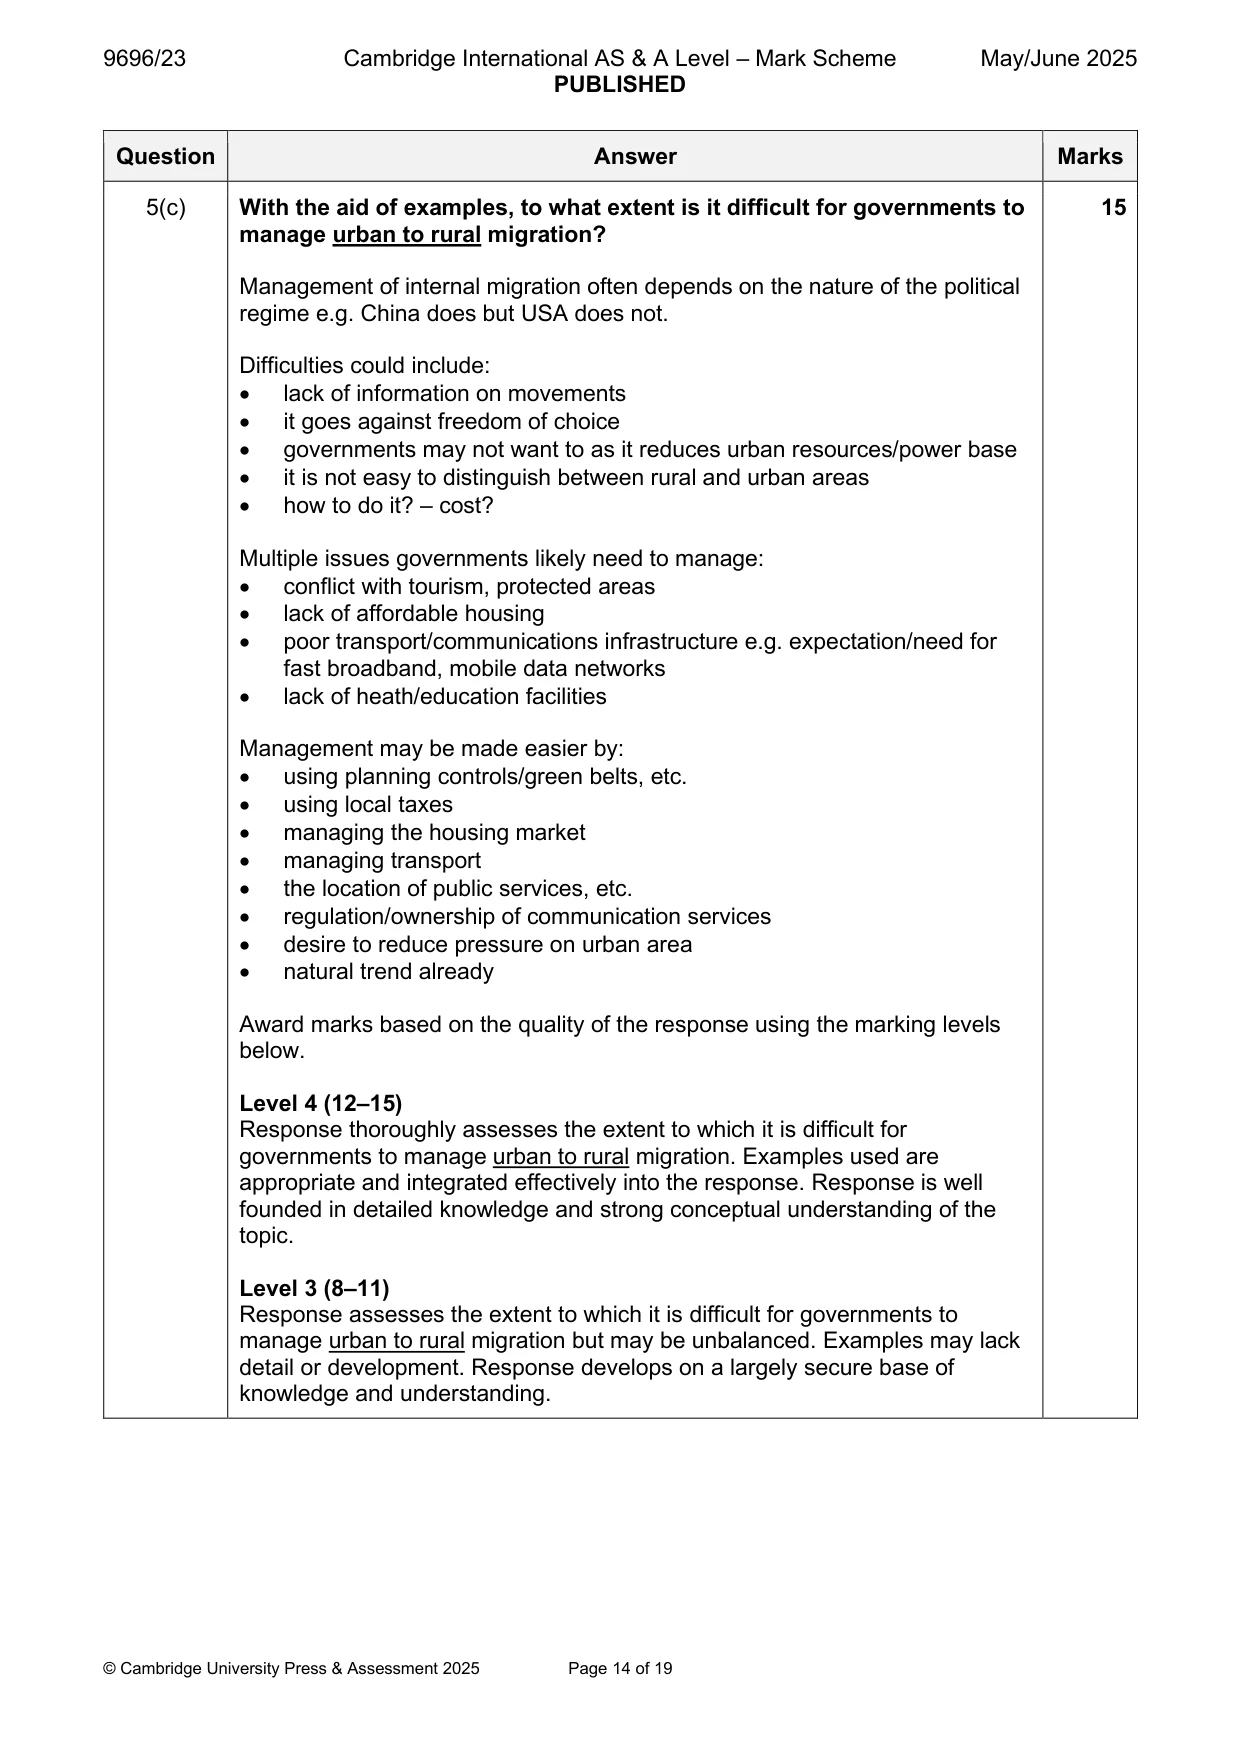
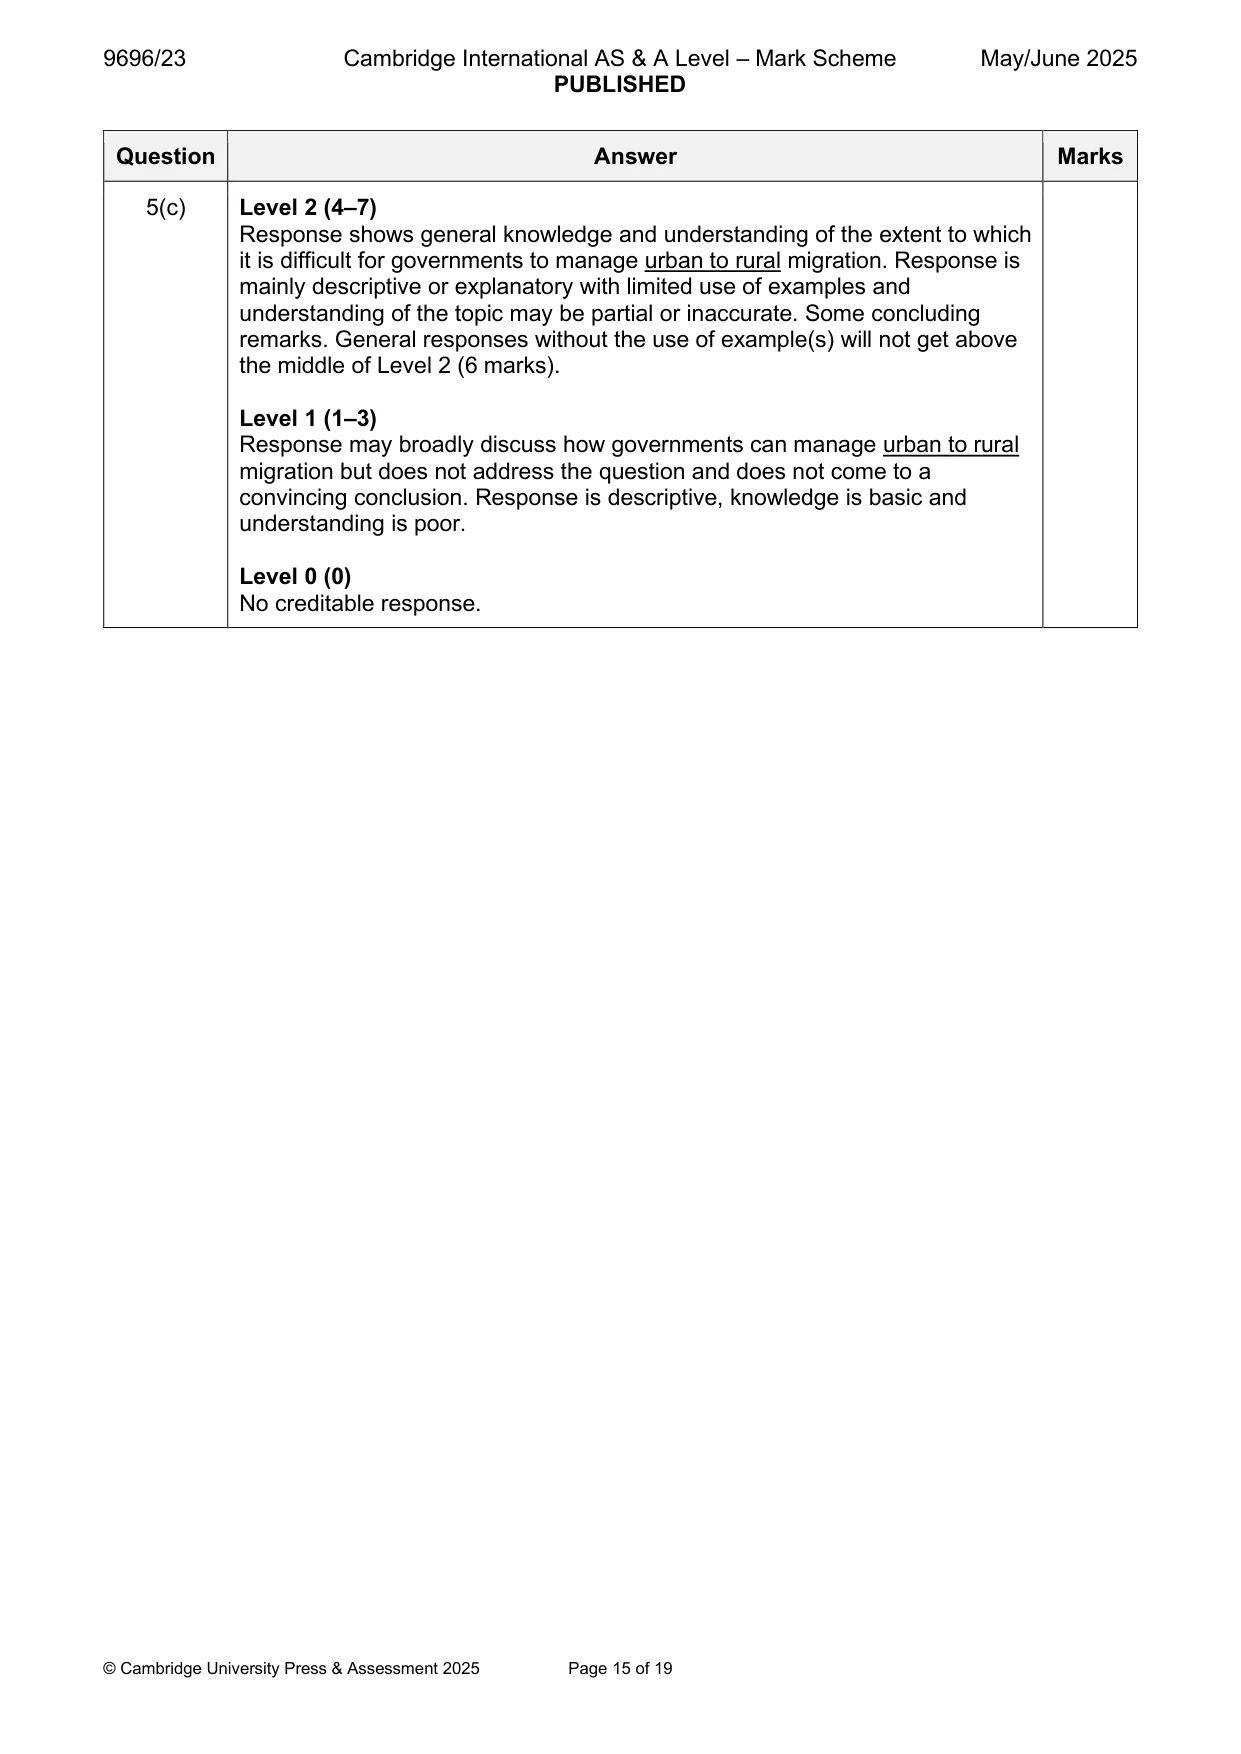
Mark scheme: 5(a) Describe the causes of intra-urban migration (within the same urban 7 area). Note this does not include circulation such as commuting. Causes could include: • demographic e.g. for marriage, idea of life cycle • economic e.g. new job, retirement, increased or decreased wealth • social e.g. to live in same culture/ethnic group, move away from crime prone area, nearer to entertainment/recreation, move for family support • political e.g. to a more secure area, due to redevelopment/clearance of squatter settlements, land zoning policies, gentrification • environmental e.g. to a more pleasant environment such as to the coast, desire for open space 1 mark for a simple description, 2 marks for a developed description (with detail or an example) up to the maximum. 5(b) With the aid of examples, explain why urban to urban migration has 8 increased in recent years. Candidates may consider economic, social, environmental push and pull factors but equally there are enabling factors such as: • improved mobility/transport • wider knowledge of other areas via media, internet, etc. • greater education so more choice of employment • reduction in family ties/cultural restrictions on moving • increased wealth so can afford to move • government policy such as decentralisation, urban renewal • more flexible/remote working, career changes are more common • relocation of businesses – employees follow • idea of chain migration Award marks based on the quality of explanation and breadth of the response using the marking levels below. Level 3 (6–8) Response clearly explains why urban to urban migration has increased in recent years. Response is well founded in detailed knowledge and strong conceptual understanding of the topic. Examples used are appropriate and integrated effectively into the response. Level 2 (3–5) Response explains why urban to urban migration has increased in recent years. Response develops on a largely secure base of knowledge and understanding. Examples may lack detail or development. Level 1 (1–2) Response is largely descriptive about urban to urban migration and how it has increased in recent years. Knowledge is basic and understanding may be inaccurate. Examples are in name only or lacking entirely. Level 0 (0) No creditable response. 5(c) With the aid of examples, to what extent is it difficult for governments to 15 manage urban to rural migration? Management of internal migration often depends on the nature of the political regime e.g. China does but USA does not. Difficulties could include: • lack of information on movements • it goes against freedom of choice • governments may not want to as it reduces urban resources/power base • it is not easy to distinguish between rural and urban areas • how to do it? – cost? Multiple issues governments likely need to manage: • conflict with tourism, protected areas • lack of affordable housing • poor transport/communications infrastructure e.g. expectation/need for fast broadband, mobile data networks • lack of heath/education facilities Management may be made easier by: • using planning controls/green belts, etc. • using local taxes • managing the housing market • managing transport • the location of public services, etc. • regulation/ownership of communication services • desire to reduce pressure on urban area • natural trend already Award marks based on the quality of the response using the marking levels below. Level 4 (12–15) Response thoroughly assesses the extent to which it is difficult for governments to manage urban to rural migration. Examples used are appropriate and integrated effectively into the response. Response is well founded in detailed knowledge and strong conceptual understanding of the topic. Level 3 (8–11) Response assesses the extent to which it is difficult for governments to manage urban to rural migration but may be unbalanced. Examples may lack detail or development. Response develops on a largely secure base of knowledge and understanding. 5(c) Level 2 (4–7) Response shows general knowledge and understanding of the extent to which it is difficult for governments to manage urban to rural migration. Response is mainly descriptive or explanatory with limited use of examples and understanding of the topic may be partial or inaccurate. Some concluding remarks. General responses without the use of example(s) will not get above the middle of Level 2 (6 marks). Level 1 (1–3) Response may broadly discuss how governments can manage urban to rural migration but does not address the question and does not come to a convincing conclusion. Response is descriptive, knowledge is basic and understanding is poor. Level 0 (0) No creditable response. Population/Migration/Settlement dynamics
Q6 · Compare the process of ‘counterurbanisation’ with the process of ‘re-urbanisation’
6 (a) (i) Compare the process of ‘counterurbanisation’ with the process of ‘re-urbanisation’. [4] (ii) Suggest three problems for an urban area experiencing re-urbanisation. [3] (b) With the aid of examples, explain why urban renewal occurs. [8] (c) With the aid of examples, assess the extent to which it is possible for governments to manage urban areas. [15]
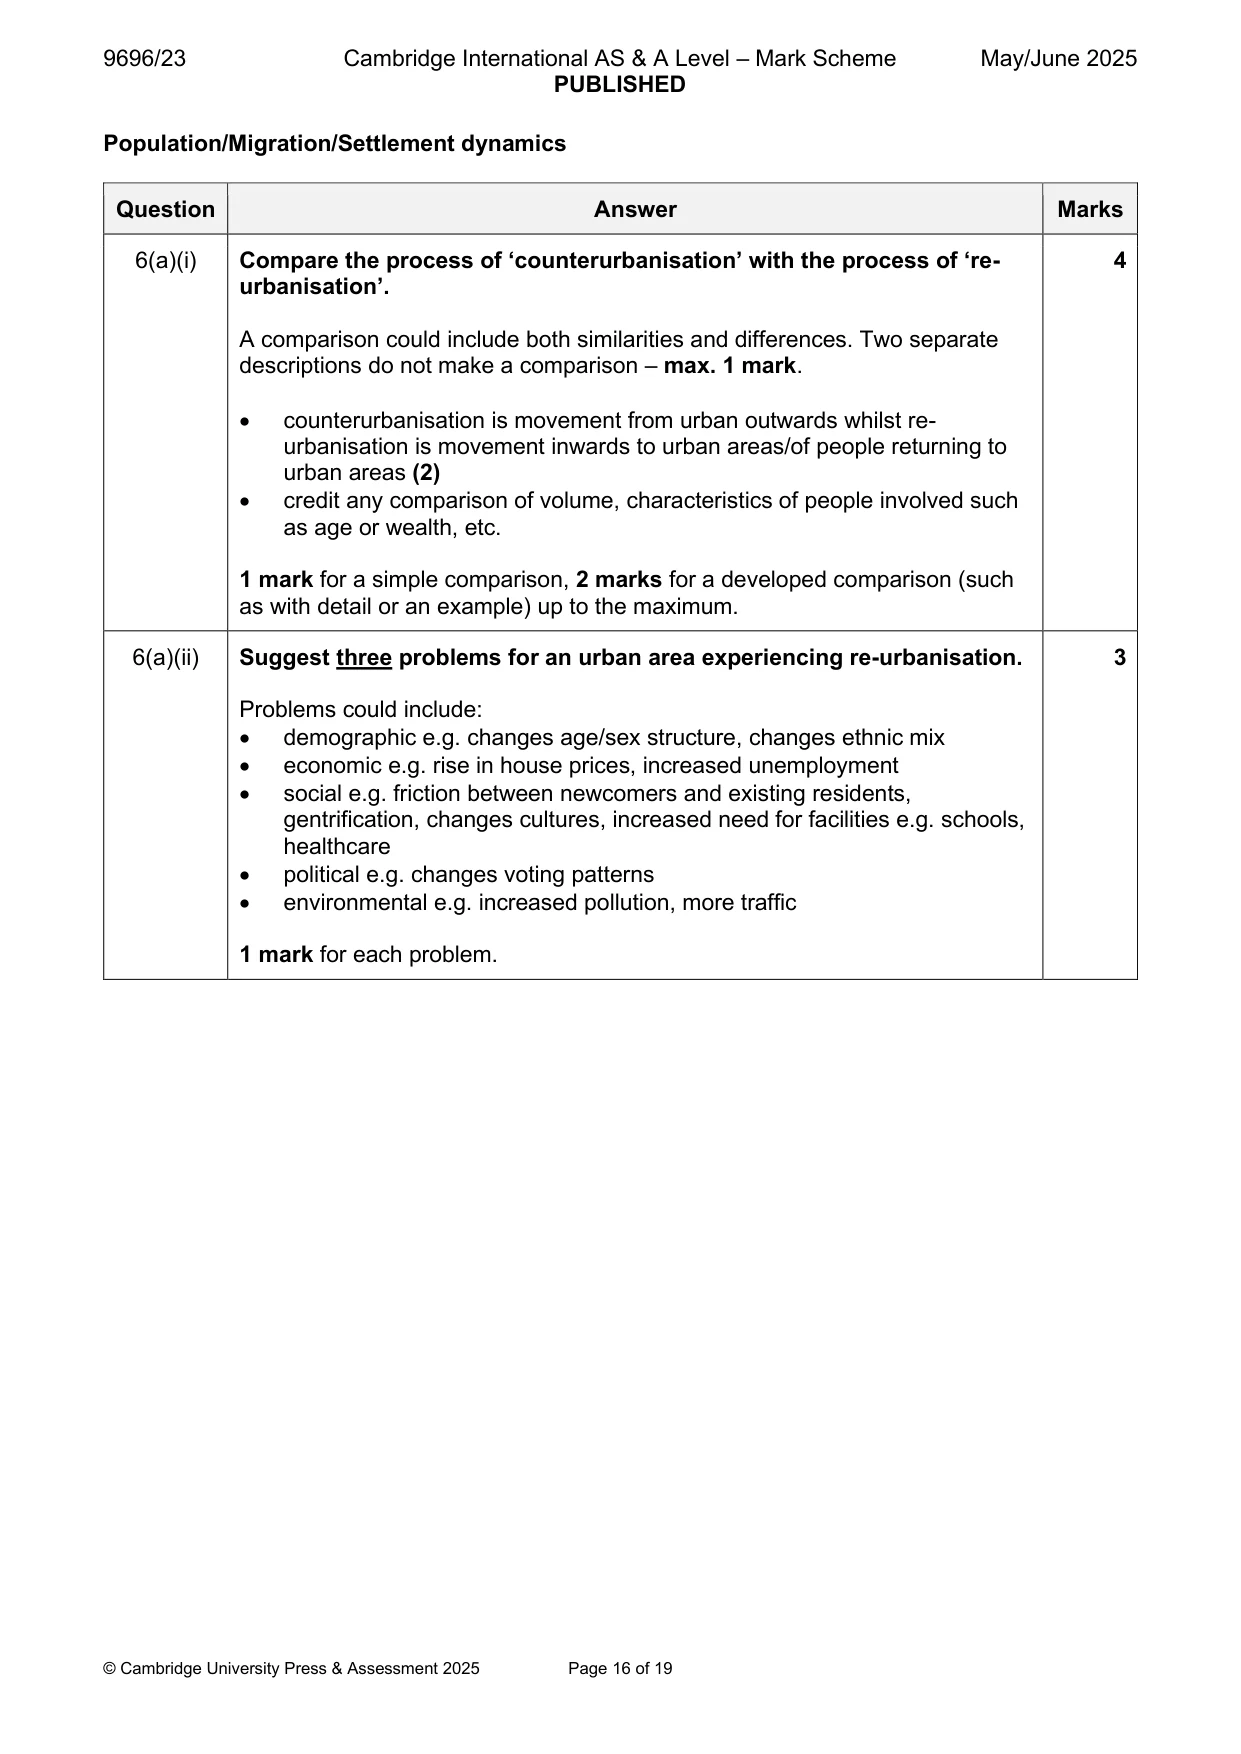
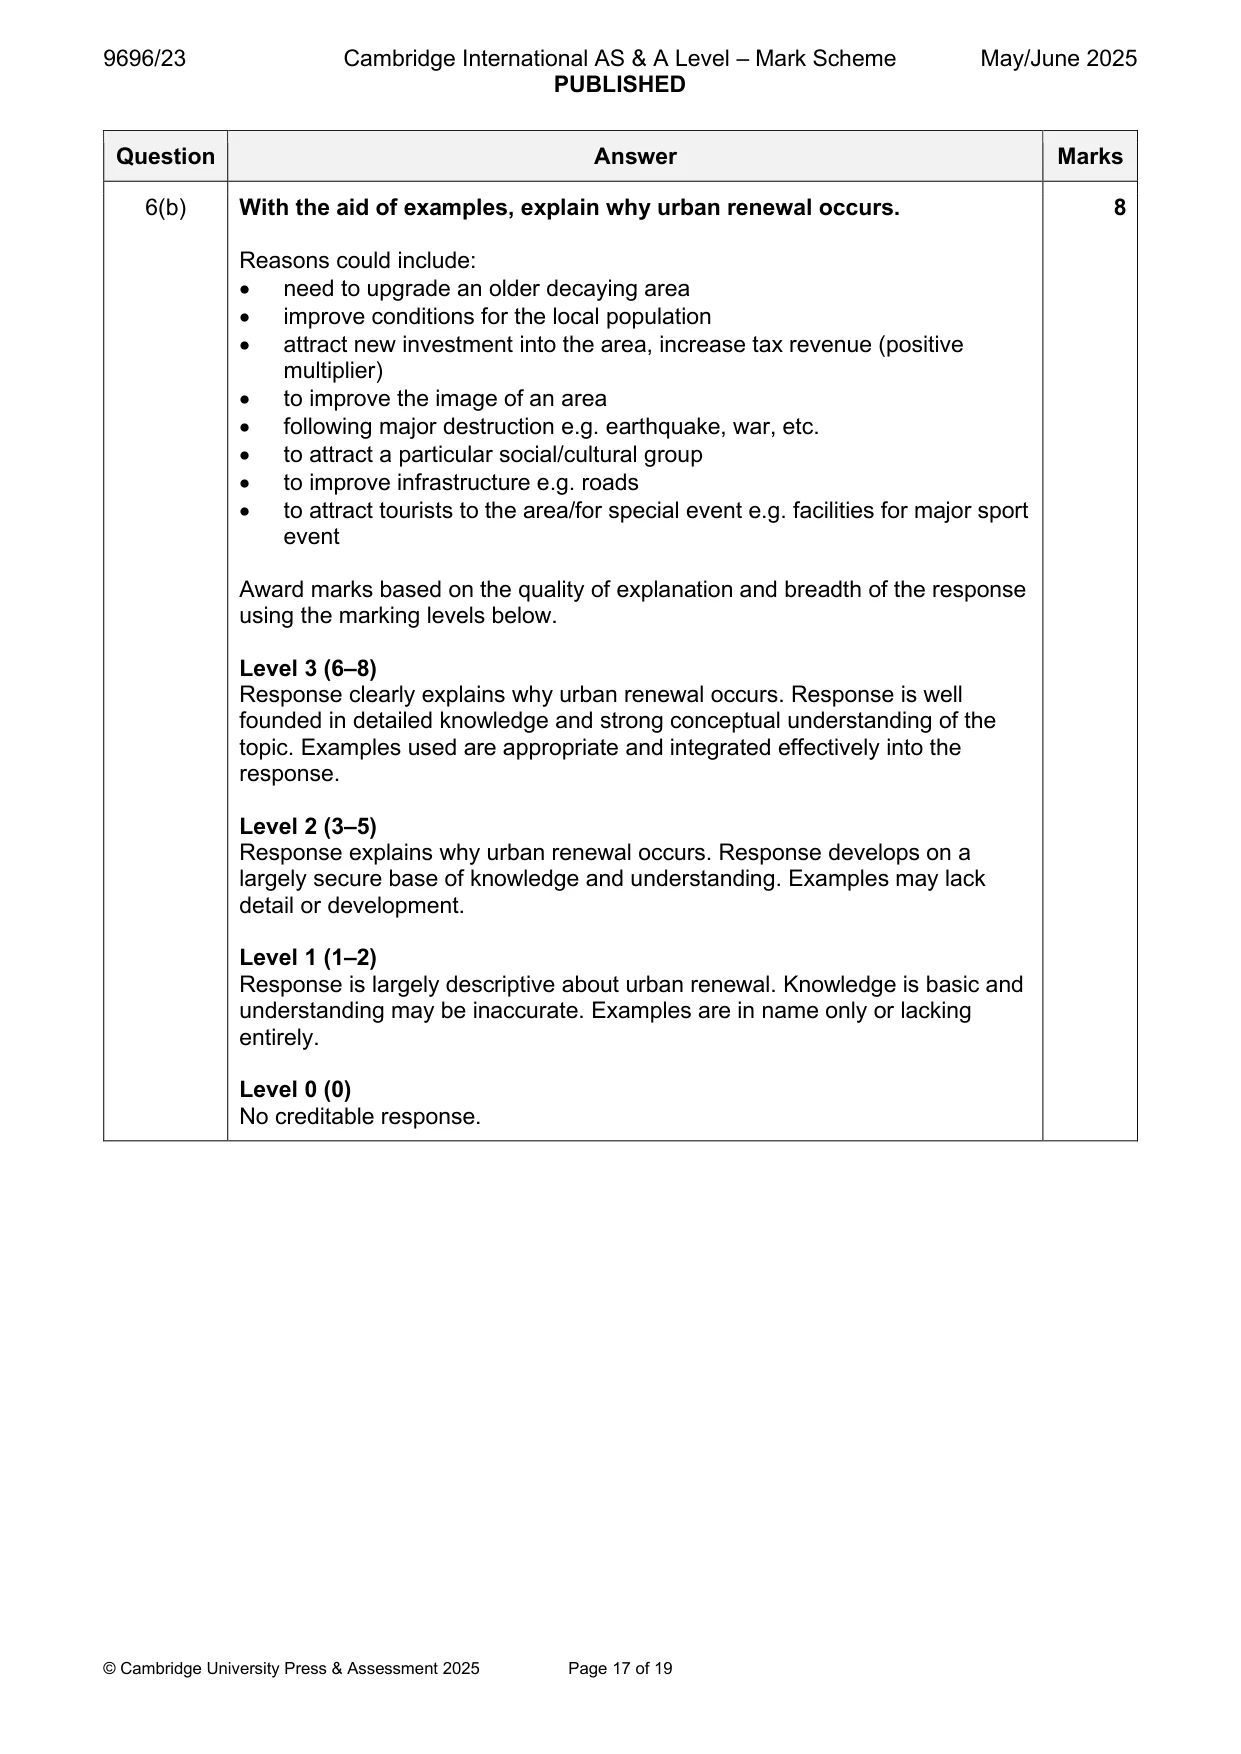
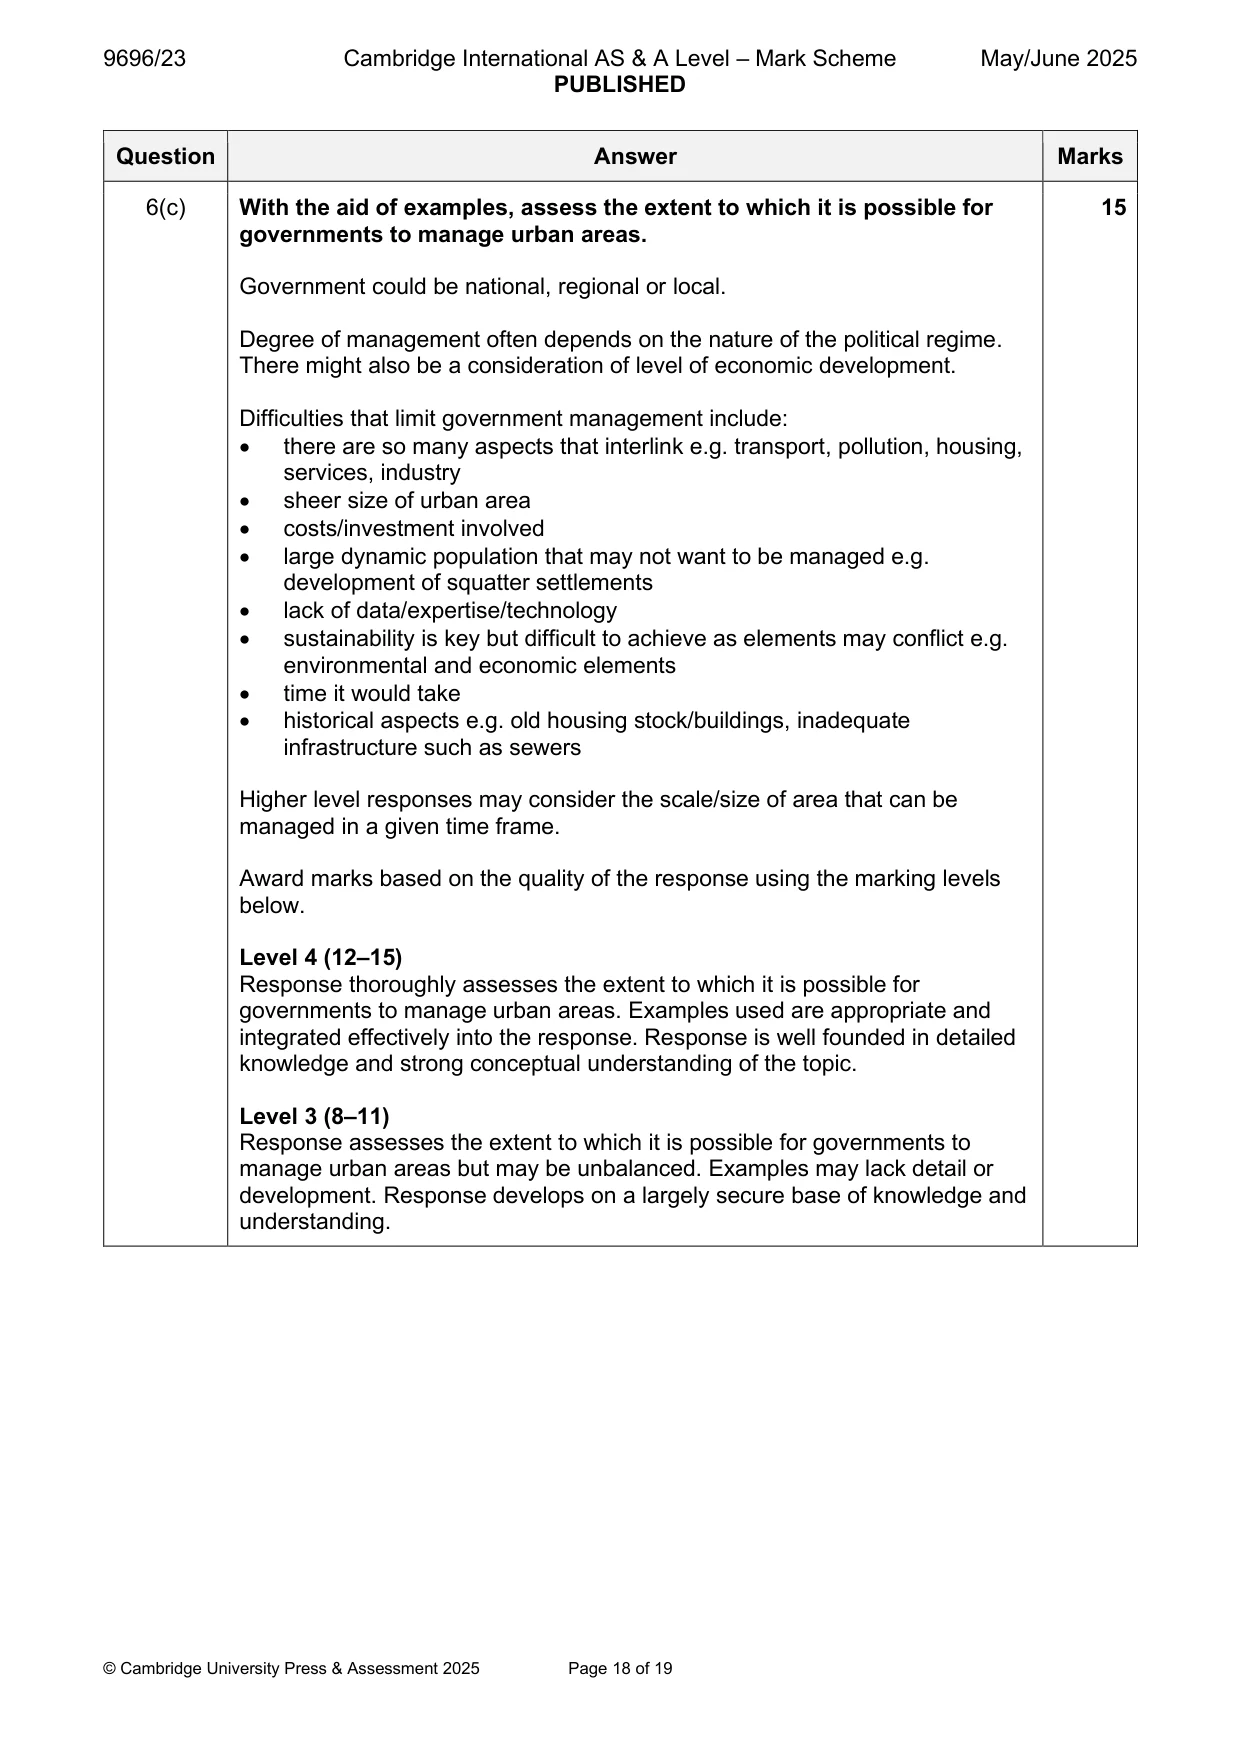
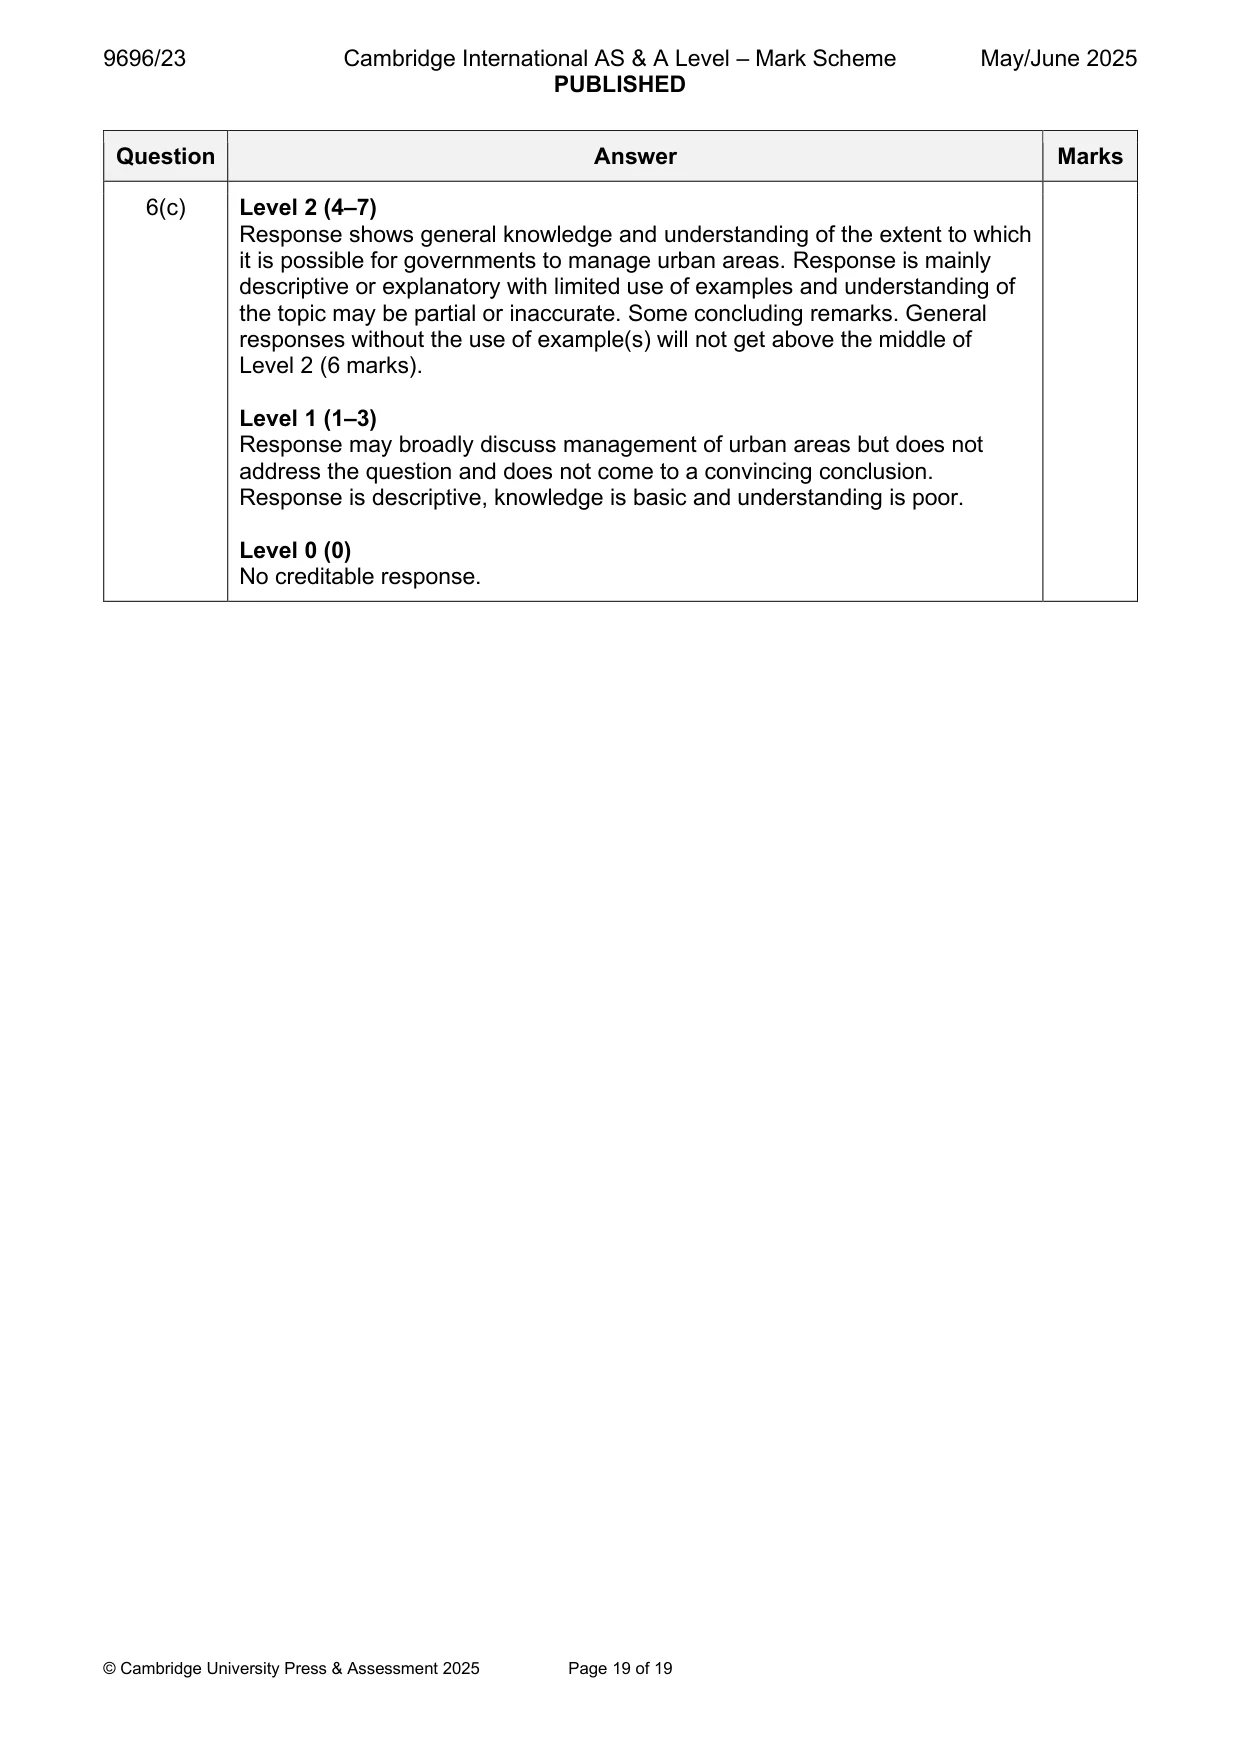
Mark scheme: 6(a)(i) Compare the process of ‘counterurbanisation’ with the process of ‘re- 4 urbanisation’. A comparison could include both similarities and differences. Two separate descriptions do not make a comparison – max. 1 mark. • counterurbanisation is movement from urban outwards whilst re- urbanisation is movement inwards to urban areas/of people returning to urban areas (2) • credit any comparison of volume, characteristics of people involved such as age or wealth, etc. 1 mark for a simple comparison, 2 marks for a developed comparison (such as with detail or an example) up to the maximum. 6(a)(ii) Suggest three problems for an urban area experiencing re-urbanisation. 3 Problems could include: • demographic e.g. changes age/sex structure, changes ethnic mix • economic e.g. rise in house prices, increased unemployment • social e.g. friction between newcomers and existing residents, gentrification, changes cultures, increased need for facilities e.g. schools, healthcare • political e.g. changes voting patterns • environmental e.g. increased pollution, more traffic 1 mark for each problem. 6(b) With the aid of examples, explain why urban renewal occurs. 8 Reasons could include: • need to upgrade an older decaying area • improve conditions for the local population • attract new investment into the area, increase tax revenue (positive multiplier) • to improve the image of an area • following major destruction e.g. earthquake, war, etc. • to attract a particular social/cultural group • to improve infrastructure e.g. roads • to attract tourists to the area/for special event e.g. facilities for major sport event Award marks based on the quality of explanation and breadth of the response using the marking levels below. Level 3 (6–8) Response clearly explains why urban renewal occurs. Response is well founded in detailed knowledge and strong conceptual understanding of the topic. Examples used are appropriate and integrated effectively into the response. Level 2 (3–5) Response explains why urban renewal occurs. Response develops on a largely secure base of knowledge and understanding. Examples may lack detail or development. Level 1 (1–2) Response is largely descriptive about urban renewal. Knowledge is basic and understanding may be inaccurate. Examples are in name only or lacking entirely. Level 0 (0) No creditable response. 6(c) With the aid of examples, assess the extent to which it is possible for 15 governments to manage urban areas. Government could be national, regional or local. Degree of management often depends on the nature of the political regime. There might also be a consideration of level of economic development. Difficulties that limit government management include: • there are so many aspects that interlink e.g. transport, pollution, housing, services, industry • sheer size of urban area • costs/investment involved • large dynamic population that may not want to be managed e.g. development of squatter settlements • lack of data/expertise/technology • sustainability is key but difficult to achieve as elements may conflict e.g. environmental and economic elements • time it would take • historical aspects e.g. old housing stock/buildings, inadequate infrastructure such as sewers Higher level responses may consider the scale/size of area that can be managed in a given time frame. Award marks based on the quality of the response using the marking levels below. Level 4 (12–15) Response thoroughly assesses the extent to which it is possible for governments to manage urban areas. Examples used are appropriate and integrated effectively into the response. Response is well founded in detailed knowledge and strong conceptual understanding of the topic. Level 3 (8–11) Response assesses the extent to which it is possible for governments to manage urban areas but may be unbalanced. Examples may lack detail or development. Response develops on a largely secure base of knowledge and understanding. 6(c) Level 2 (4–7) Response shows general knowledge and understanding of the extent to which it is possible for governments to manage urban areas. Response is mainly descriptive or explanatory with limited use of examples and understanding of the topic may be partial or inaccurate. Some concluding remarks. General responses without the use of example(s) will not get above the middle of Level 2 (6 marks). Level 1 (1–3) Response may broadly discuss management of urban areas but does not address the question and does not come to a convincing conclusion. Response is descriptive, knowledge is basic and understanding is poor. Level 0 (0) No creditable response.
What was in this paper
The subtopics covered by these 6 questions, and how many questions each got. Open one in a new tab to see every Cambridge question on it.
What you needed in this session
Cambridge’s own grade thresholds for 2025 May/June, Paper 2 · Variant 3. A higher threshold means an easier paper — the bar moves with how the cohort did.