Cambridge A Level Geography 9696 — 2025 Oct/Nov Paper 2 · Variant 2
9696/22/O/N/25 · 6 questions · 60 marks · ≈68 min
The question paper and its mark scheme, free to read here and free to download. This is Cambridge’s own paper, exactly as it was sat.
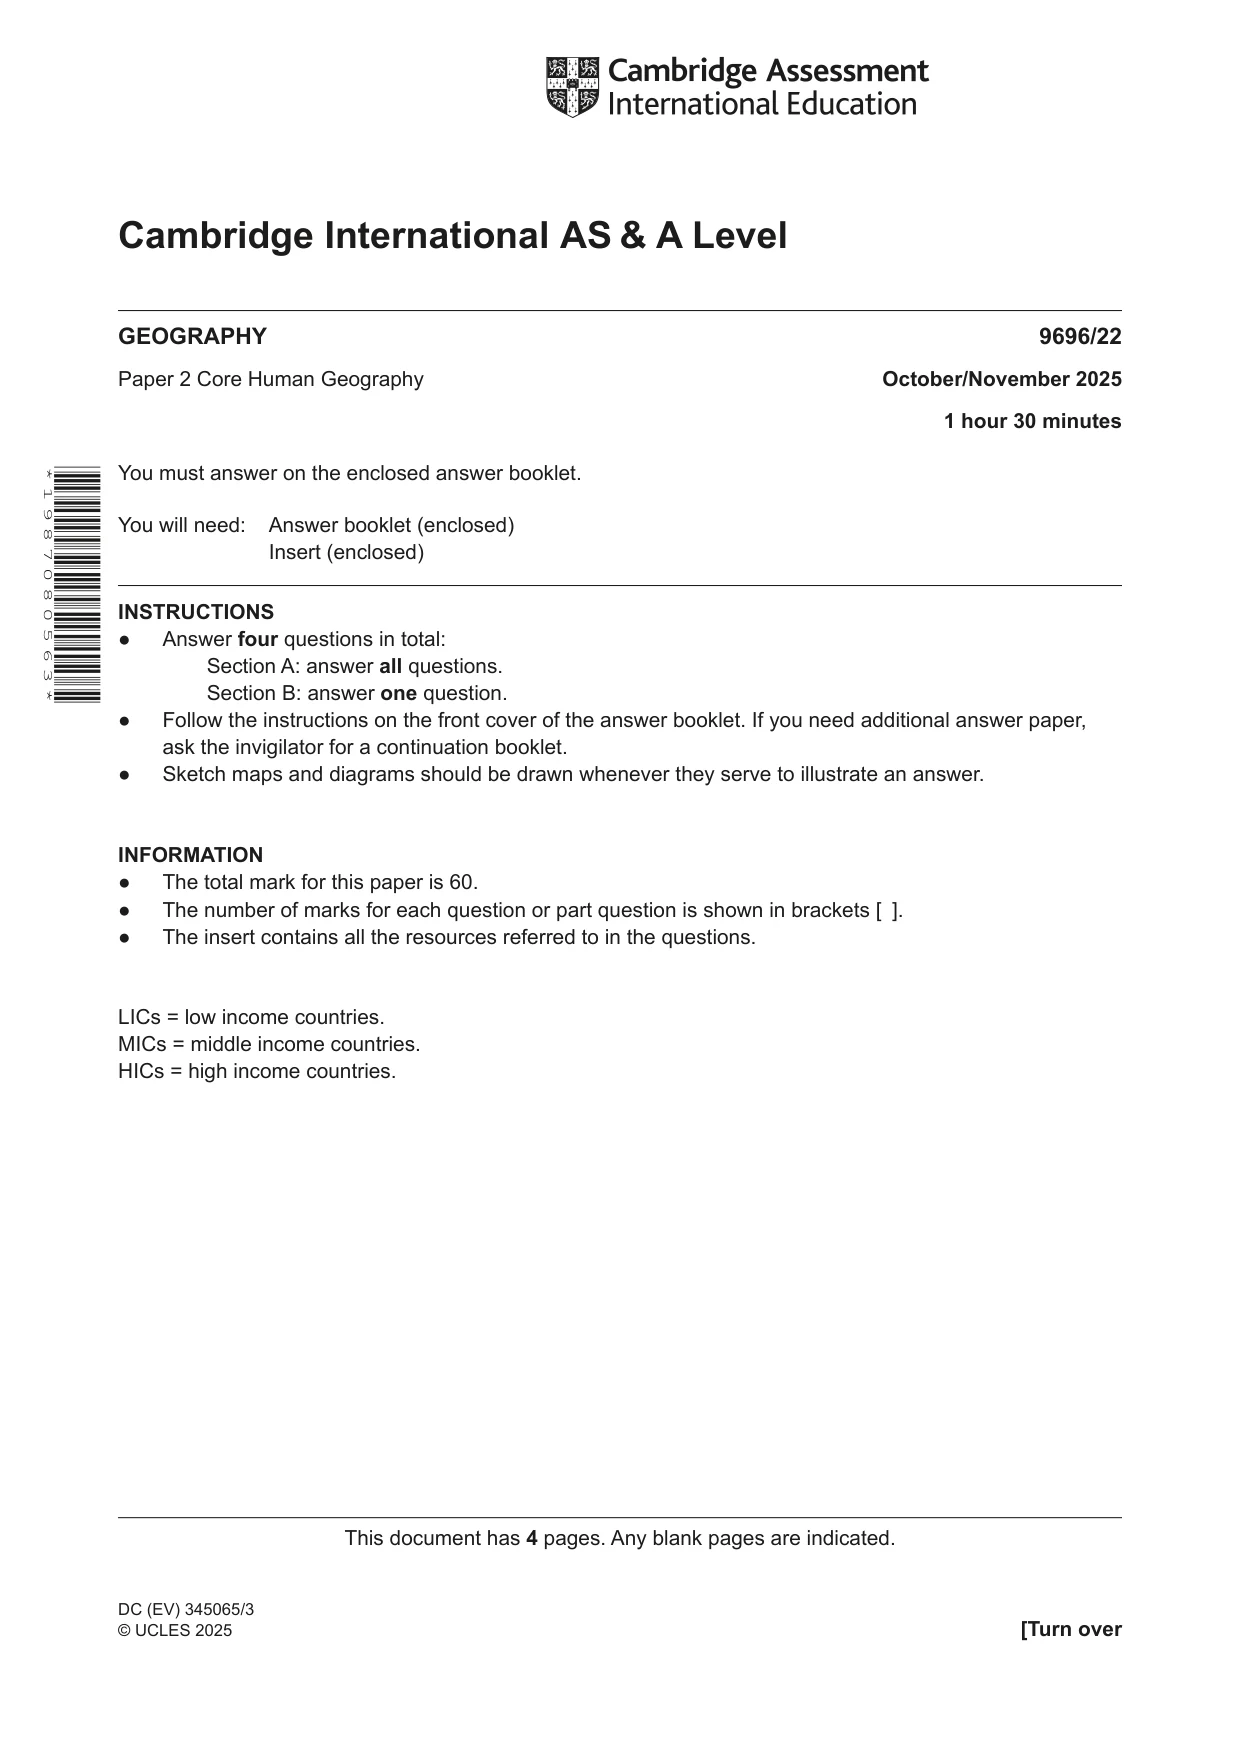
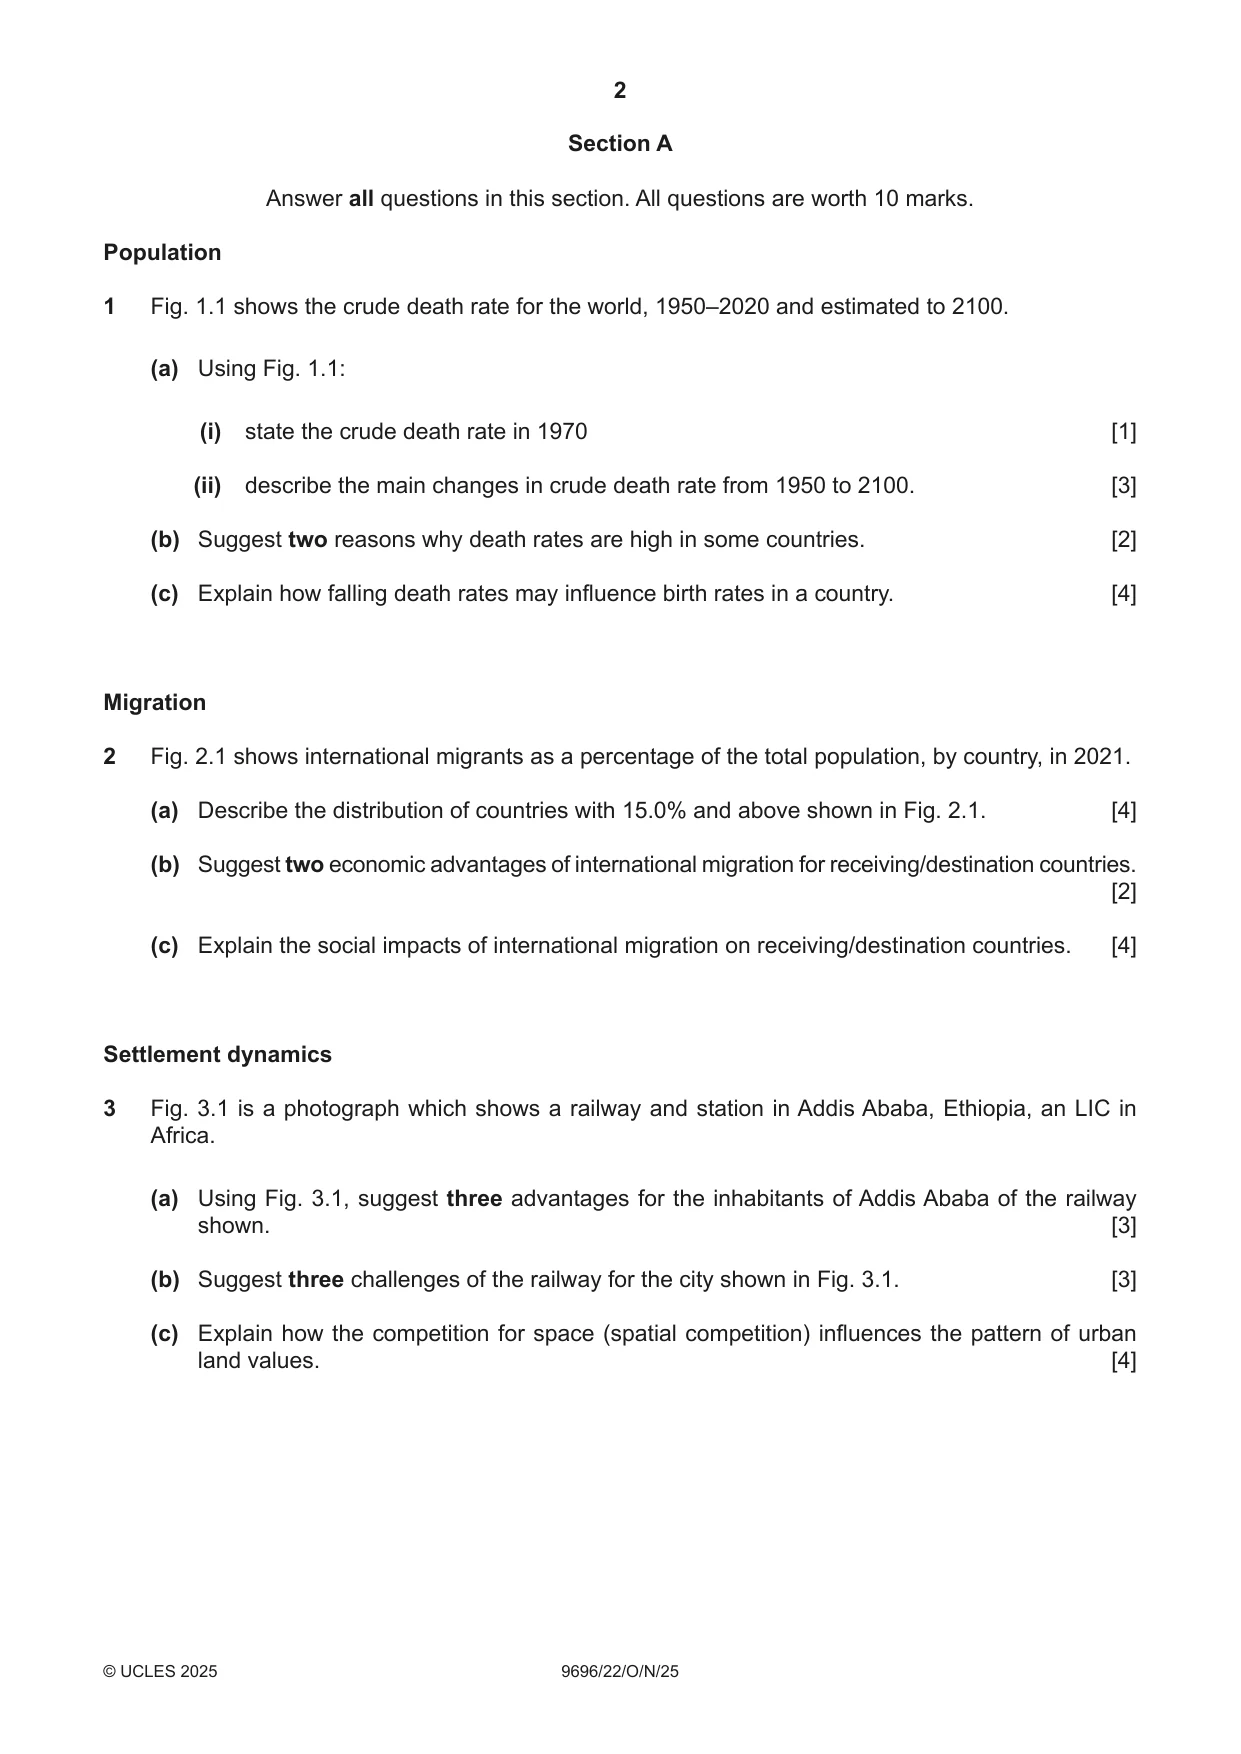
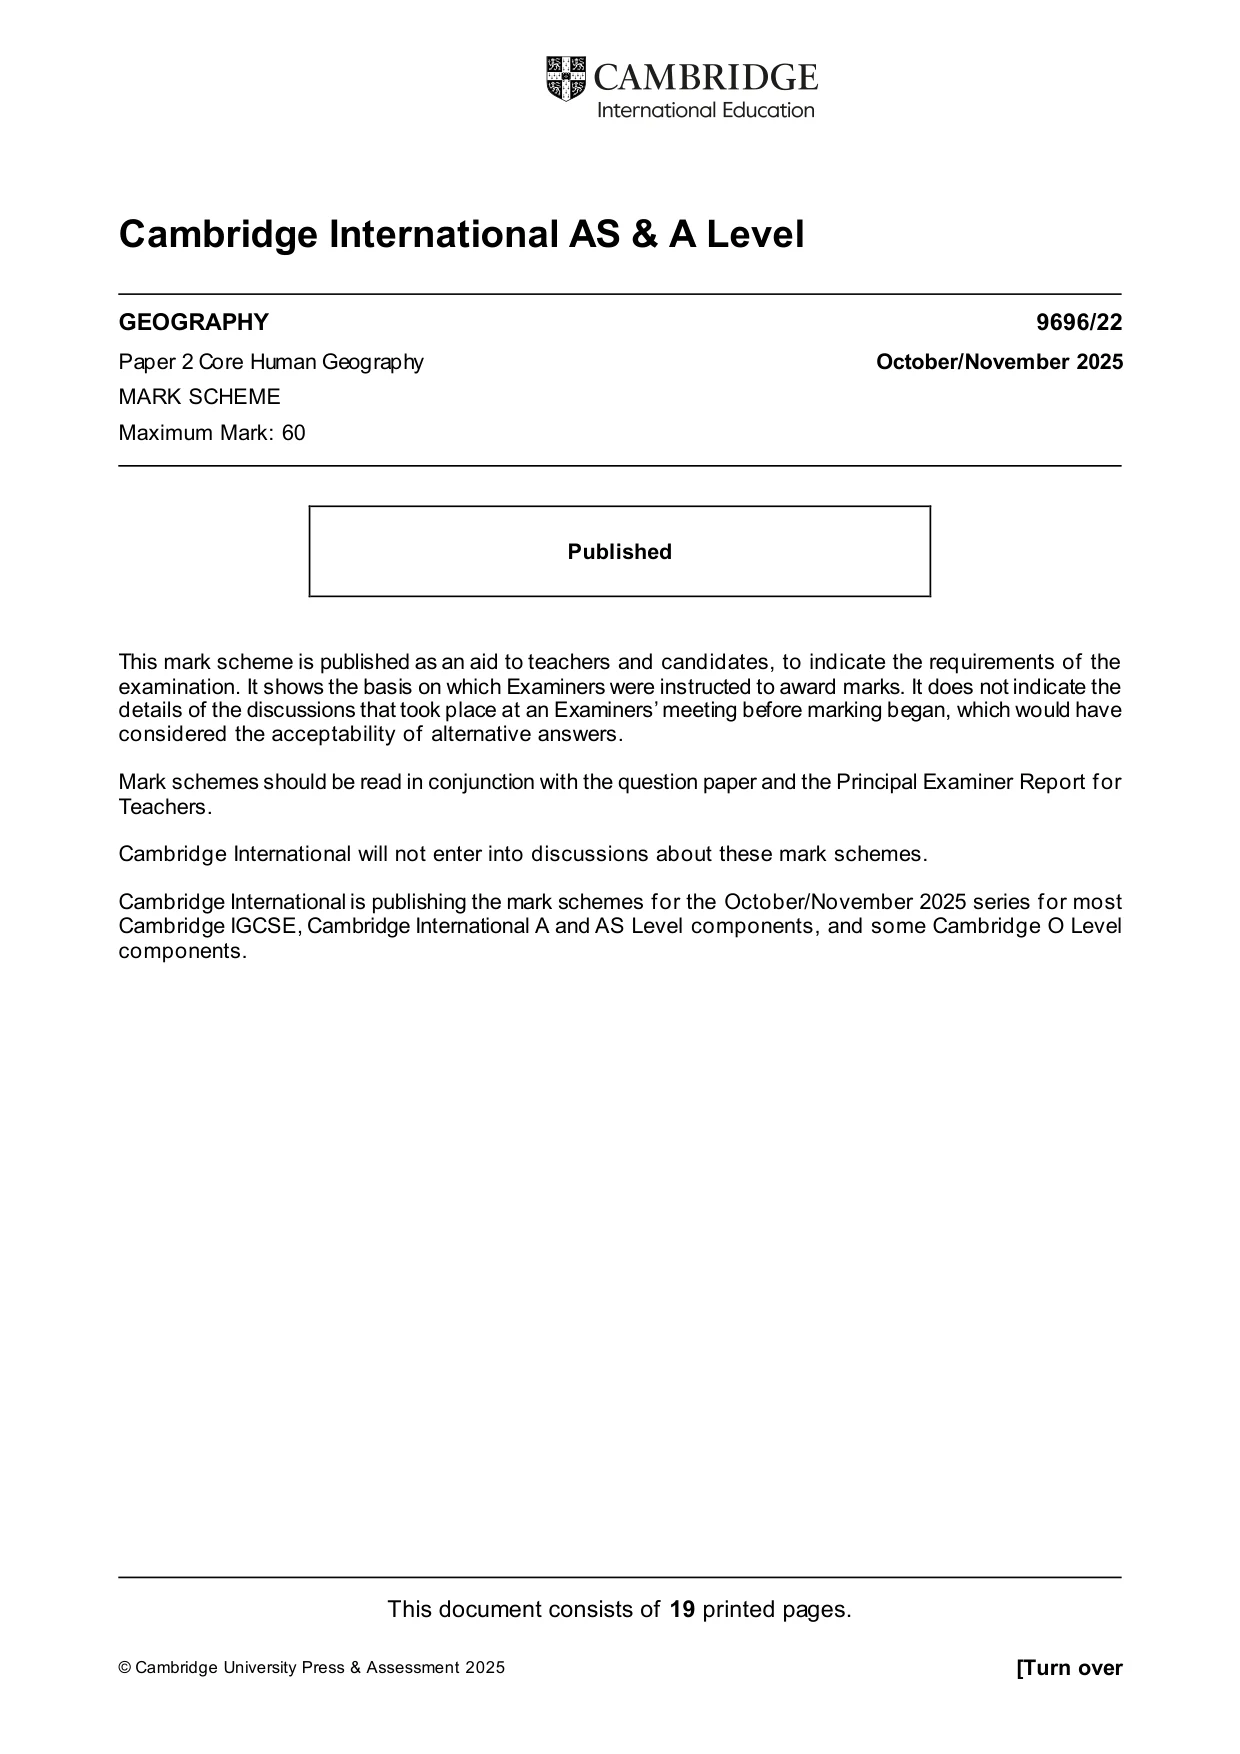
Question paper4 pages

Mark scheme19 pages
Answers below. Sit the paper first if you are practising.


Questions as text
Q1 · The crude death rate for the world, 1950–2020 and estimated to 2100
1 Fig. 1.1 shows the crude death rate for the world, 1950–2020 and estimated to 2100. (a) Using Fig. 1.1: (i) state the crude death rate in 1970 [1] (ii) describe the main changes in crude death rate from 1950 to 2100. [3] (b) Suggest two reasons why death rates are high in some countries. [2] (c) Explain how falling death rates may influence birth rates in a country. [4] Migration
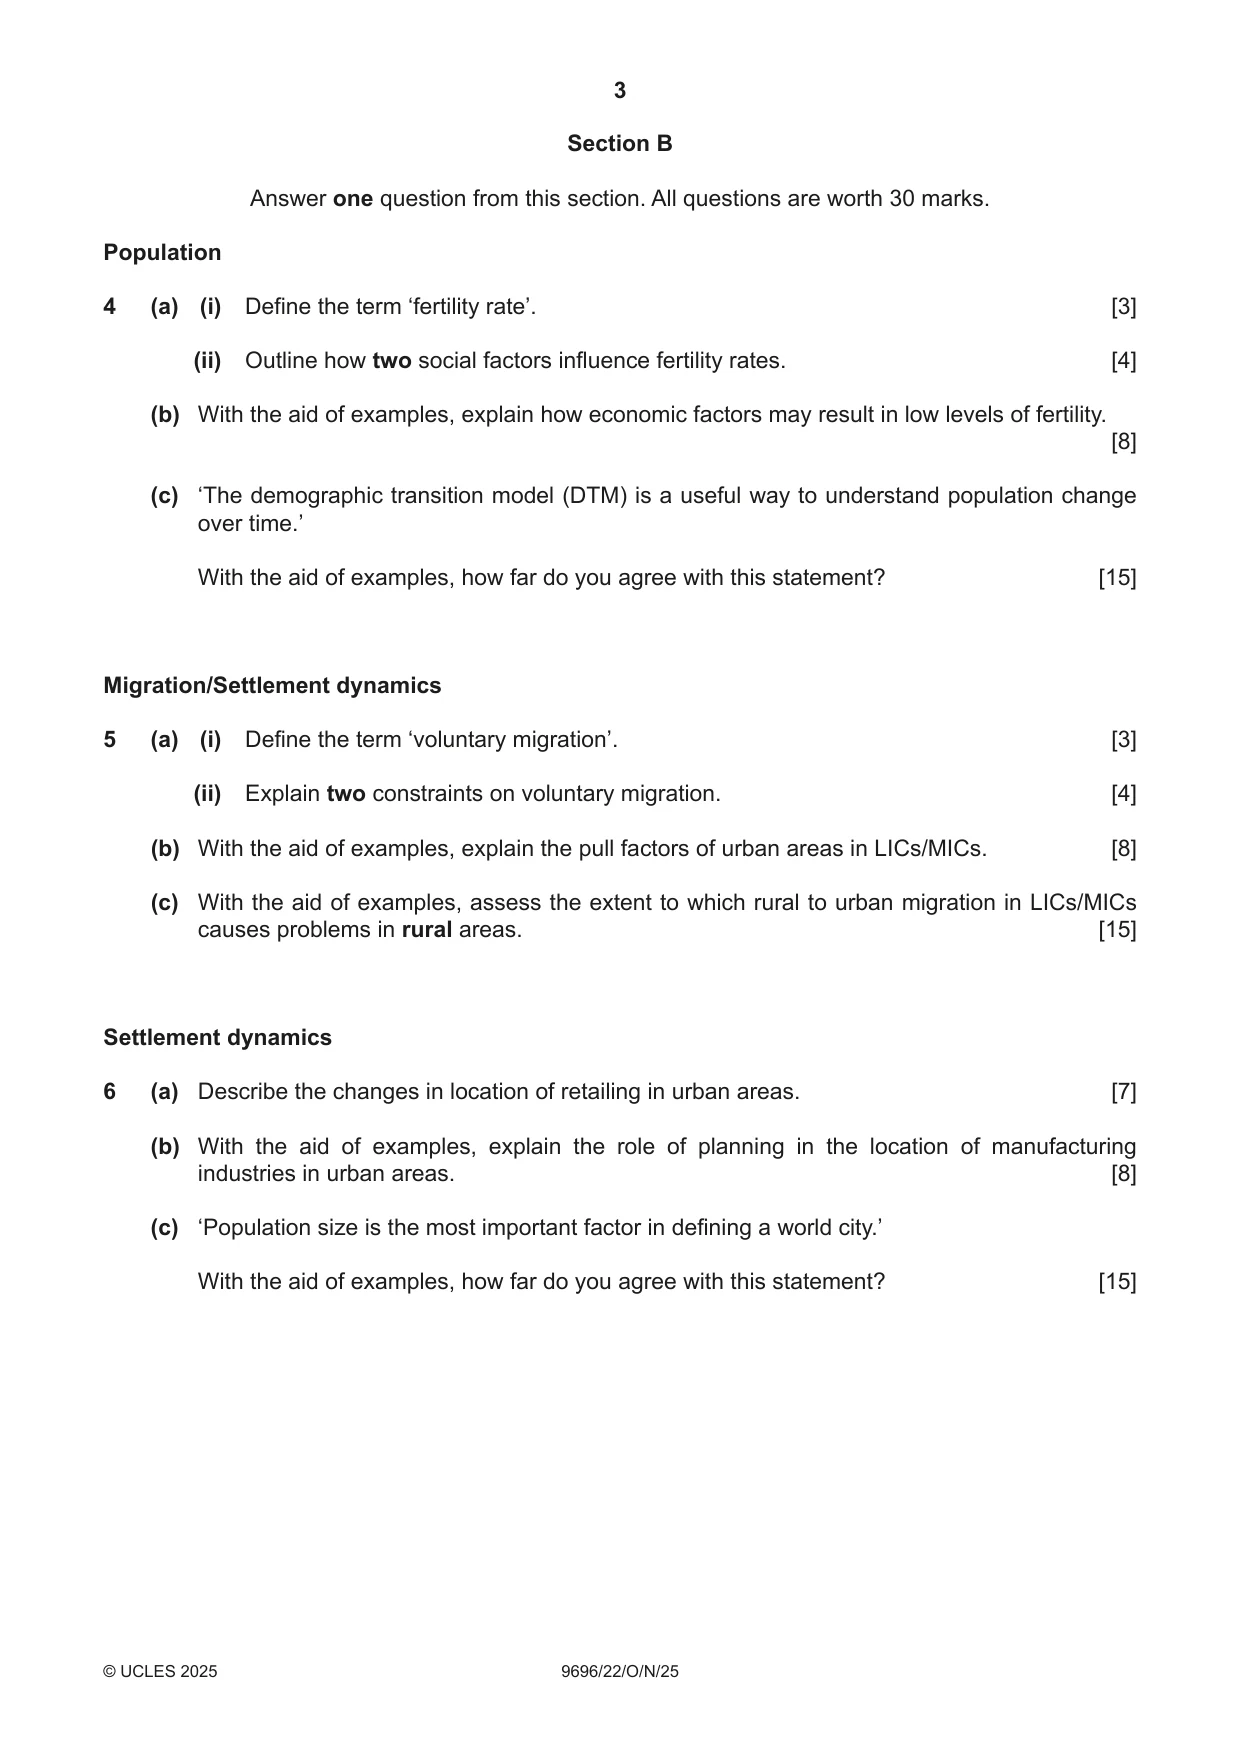
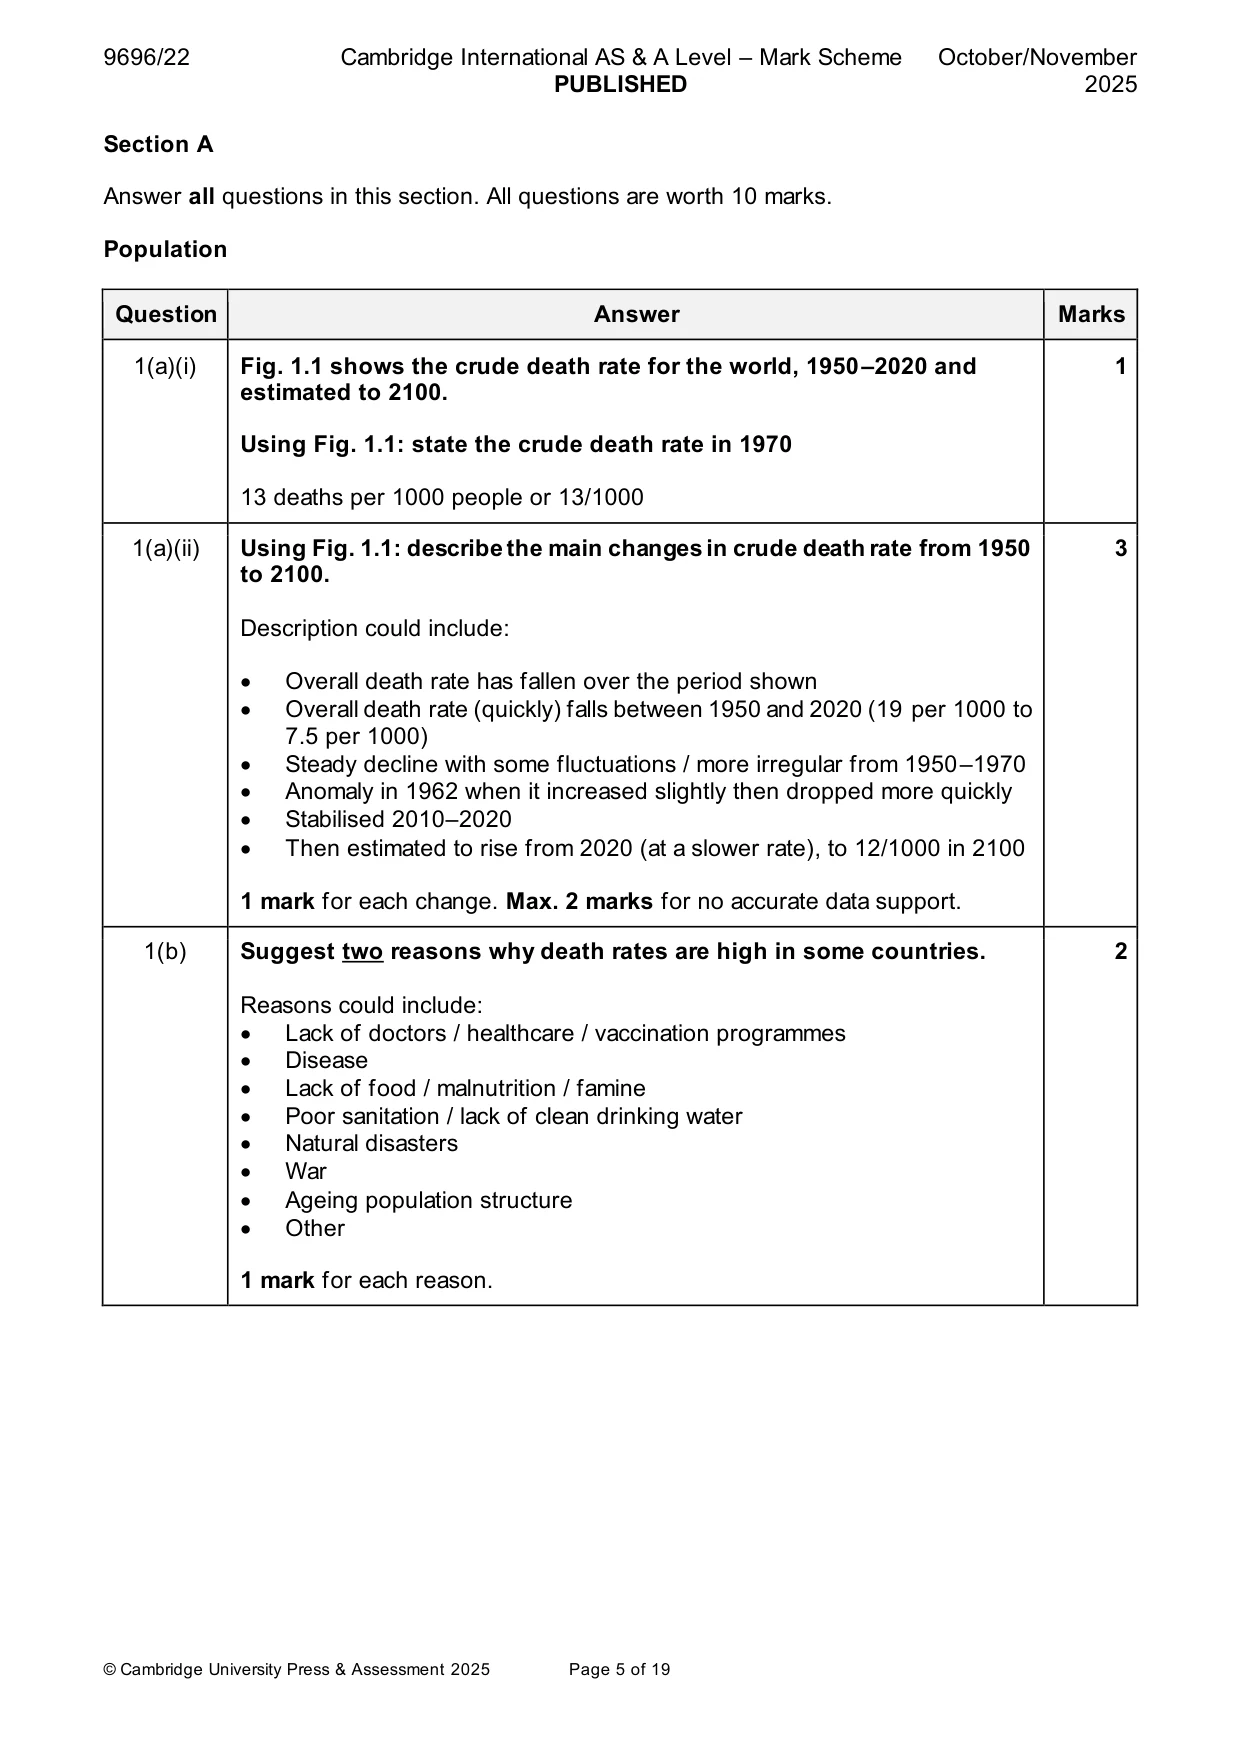
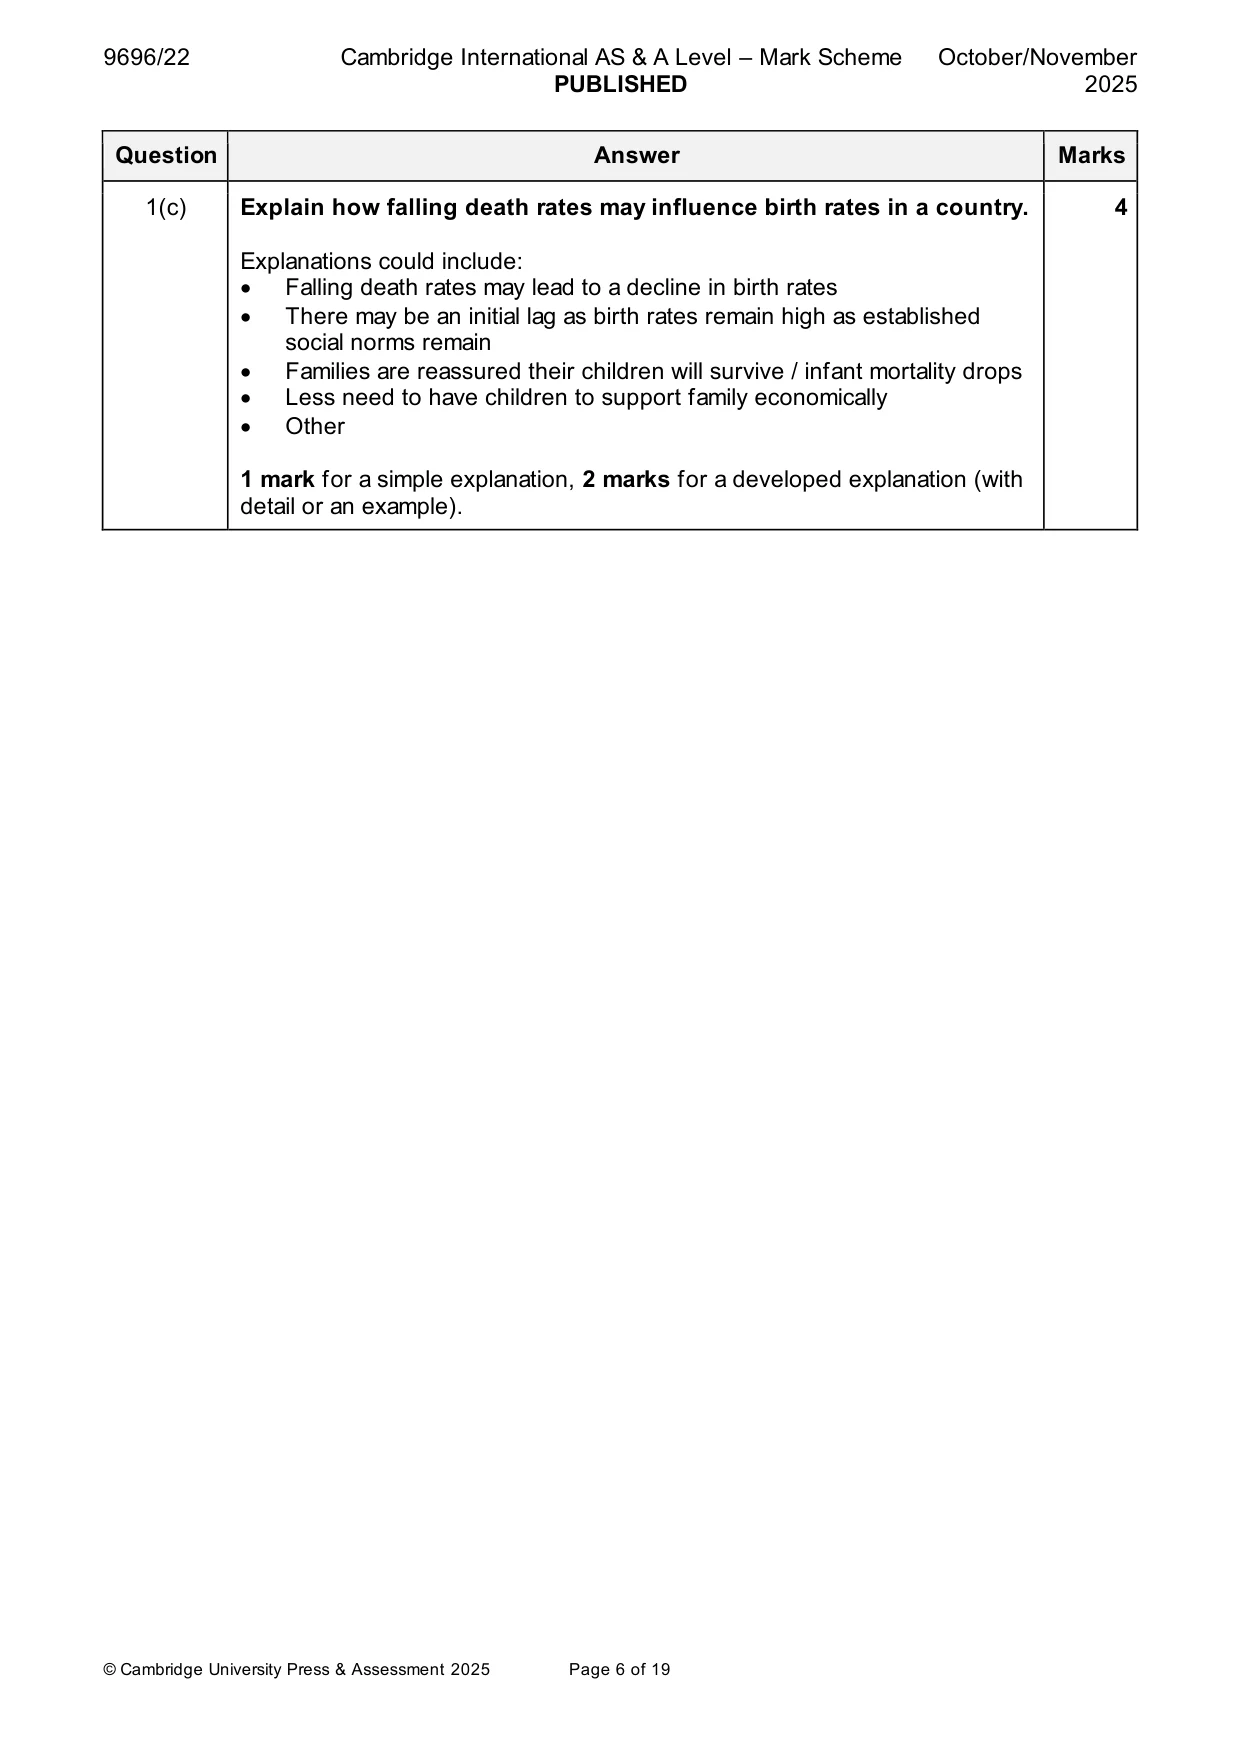
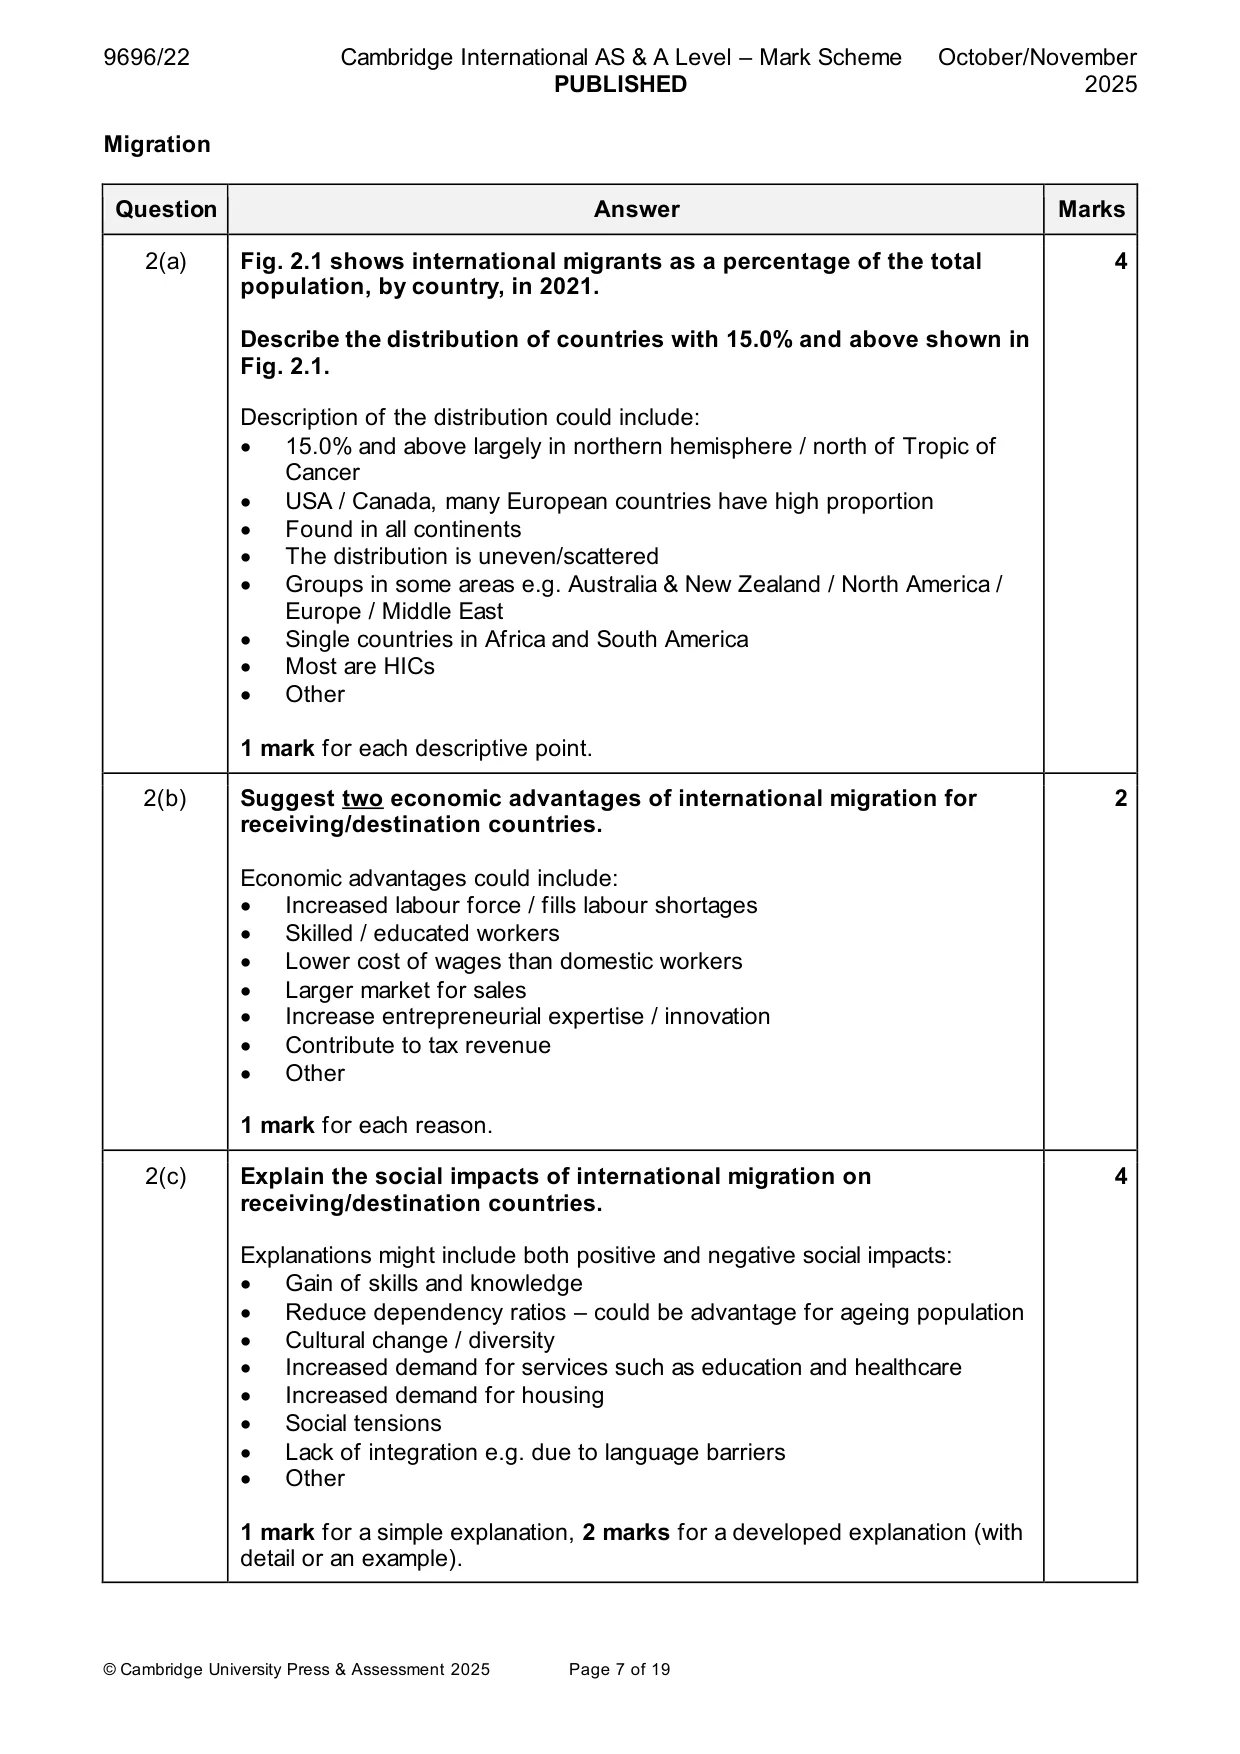
Mark scheme: Question Answer Marks 1(a)(i) Fig. 1.1 shows the crude death rate for the world, 1950–2020 and 1 estimated to 2100. Using Fig. 1.1: state the crude death rate in 1970 13 deaths per 1000 people or 13/1000 1(a)(ii) Using Fig. 1.1: describe the main changes in crude death rate from 1950 3 to 2100. Description could include: • Overall death rate has fallen over the period shown • Overall death rate (quickly) falls between 1950 and 2020 (19 per 1000 to 7.5 per 1000) • Steady decline with some fluctuations / more irregular from 1950–1970 • Anomaly in 1962 when it increased slightly then dropped more quickly • Stabilised 2010–2020 • Then estimated to rise from 2020 (at a slower rate), to 12/1000 in 2100 1 mark for each change. Max. 2 marks for no accurate data support. 1(b) Suggest two reasons why death rates are high in some countries. 2 Reasons could include: • Lack of doctors / healthcare / vaccination programmes • Disease • Lack of food / malnutrition / famine • Poor sanitation / lack of clean drinking water • Natural disasters • War • Ageing population structure • Other 1 mark for each reason. 1(c) Explain how falling death rates may influence birth rates in a country. 4 Explanations could include: • Falling death rates may lead to a decline in birth rates • There may be an initial lag as birth rates remain high as established social norms remain • Families are reassured their children will survive / infant mortality drops • Less need to have children to support family economically • Other 1 mark for a simple explanation, 2 marks for a developed explanation (with detail or an example). Migration
Q2 · International migrants as a percentage of the total population, by country, in 2021
2 Fig. 2.1 shows international migrants as a percentage of the total population, by country, in 2021. (a) Describe the distribution of countries with 15.0% and above shown in Fig. 2.1. [4] (b) Suggest two economic advantages of international migration for receiving/destination countries. [2] (c) Explain the social impacts of international migration on receiving/destination countries. [4] Settlement dynamics
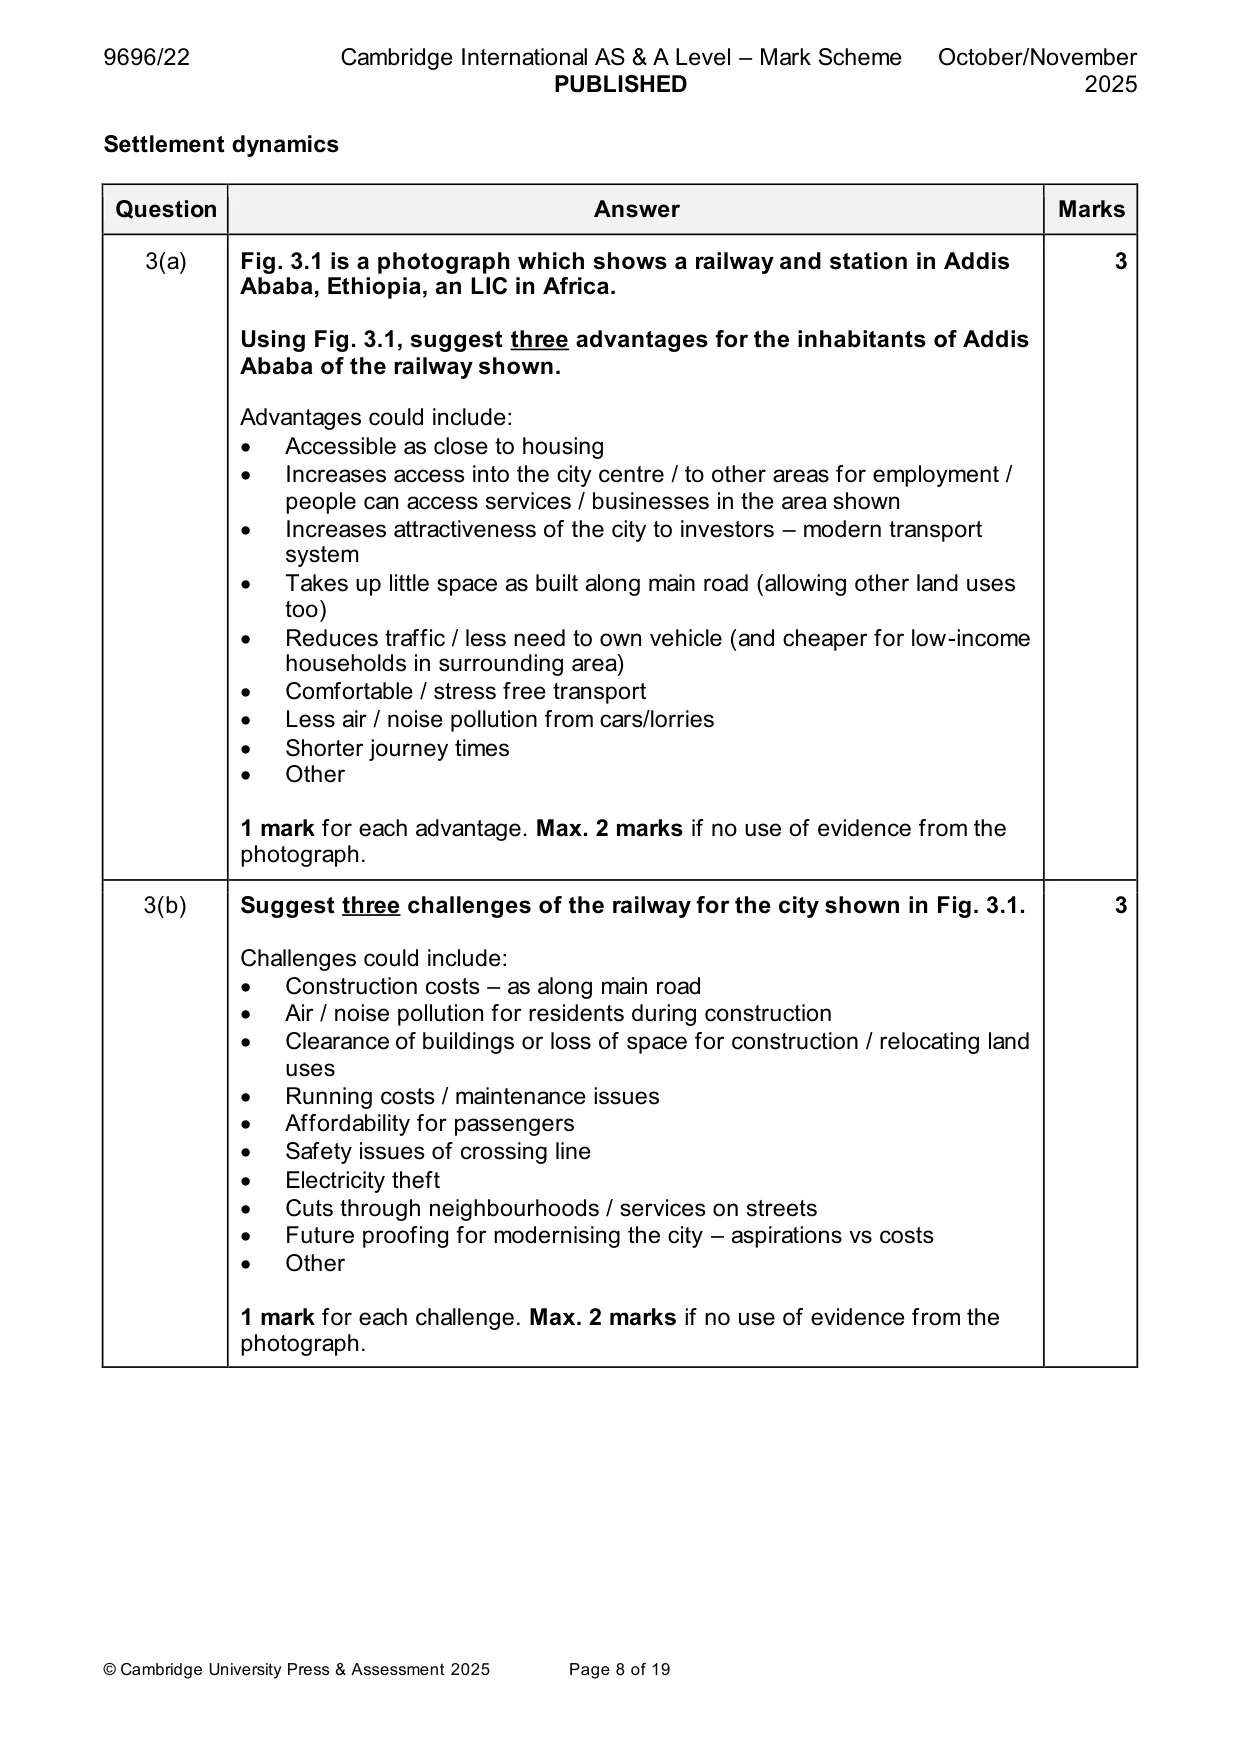
Mark scheme: 2(a) Fig. 2.1 shows international migrants as a percentage of the total 4 population, by country, in 2021. Describe the distribution of countries with 15.0% and above shown in Fig. 2.1. Description of the distribution could include: • 15.0% and above largely in northern hemisphere / north of Tropic of Cancer • USA / Canada, many European countries have high proportion • Found in all continents • The distribution is uneven/scattered • Groups in some areas e.g. Australia & New Zealand / North America / Europe / Middle East • Single countries in Africa and South America • Most are HICs • Other 1 mark for each descriptive point. 2(b) Suggest two economic advantages of international migration for 2 receiving/destination countries. Economic advantages could include: • Increased labour force / fills labour shortages • Skilled / educated workers • Lower cost of wages than domestic workers • Larger market for sales • Increase entrepreneurial expertise / innovation • Contribute to tax revenue • Other 1 mark for each reason. 2(c) Explain the social impacts of international migration on 4 receiving/destination countries. Explanations might include both positive and negative social impacts: • Gain of skills and knowledge • Reduce dependency ratios – could be advantage for ageing population • Cultural change / diversity • Increased demand for services such as education and healthcare • Increased demand for housing • Social tensions • Lack of integration e.g. due to language barriers • Other 1 mark for a simple explanation, 2 marks for a developed explanation (with detail or an example). Settlement dynamics
Q3 · A photograph which shows a railway and station in Addis Ababa, Ethiopia, an LIC in Africa
3 Fig. 3.1 is a photograph which shows a railway and station in Addis Ababa, Ethiopia, an LIC in Africa. (a) Using Fig. 3.1, suggest three advantages for the inhabitants of Addis Ababa of the railway shown. [3] (b) Suggest three challenges of the railway for the city shown in Fig. 3.1. [3] (c) Explain how the competition for space (spatial competition) influences the pattern of urban land values. [4]
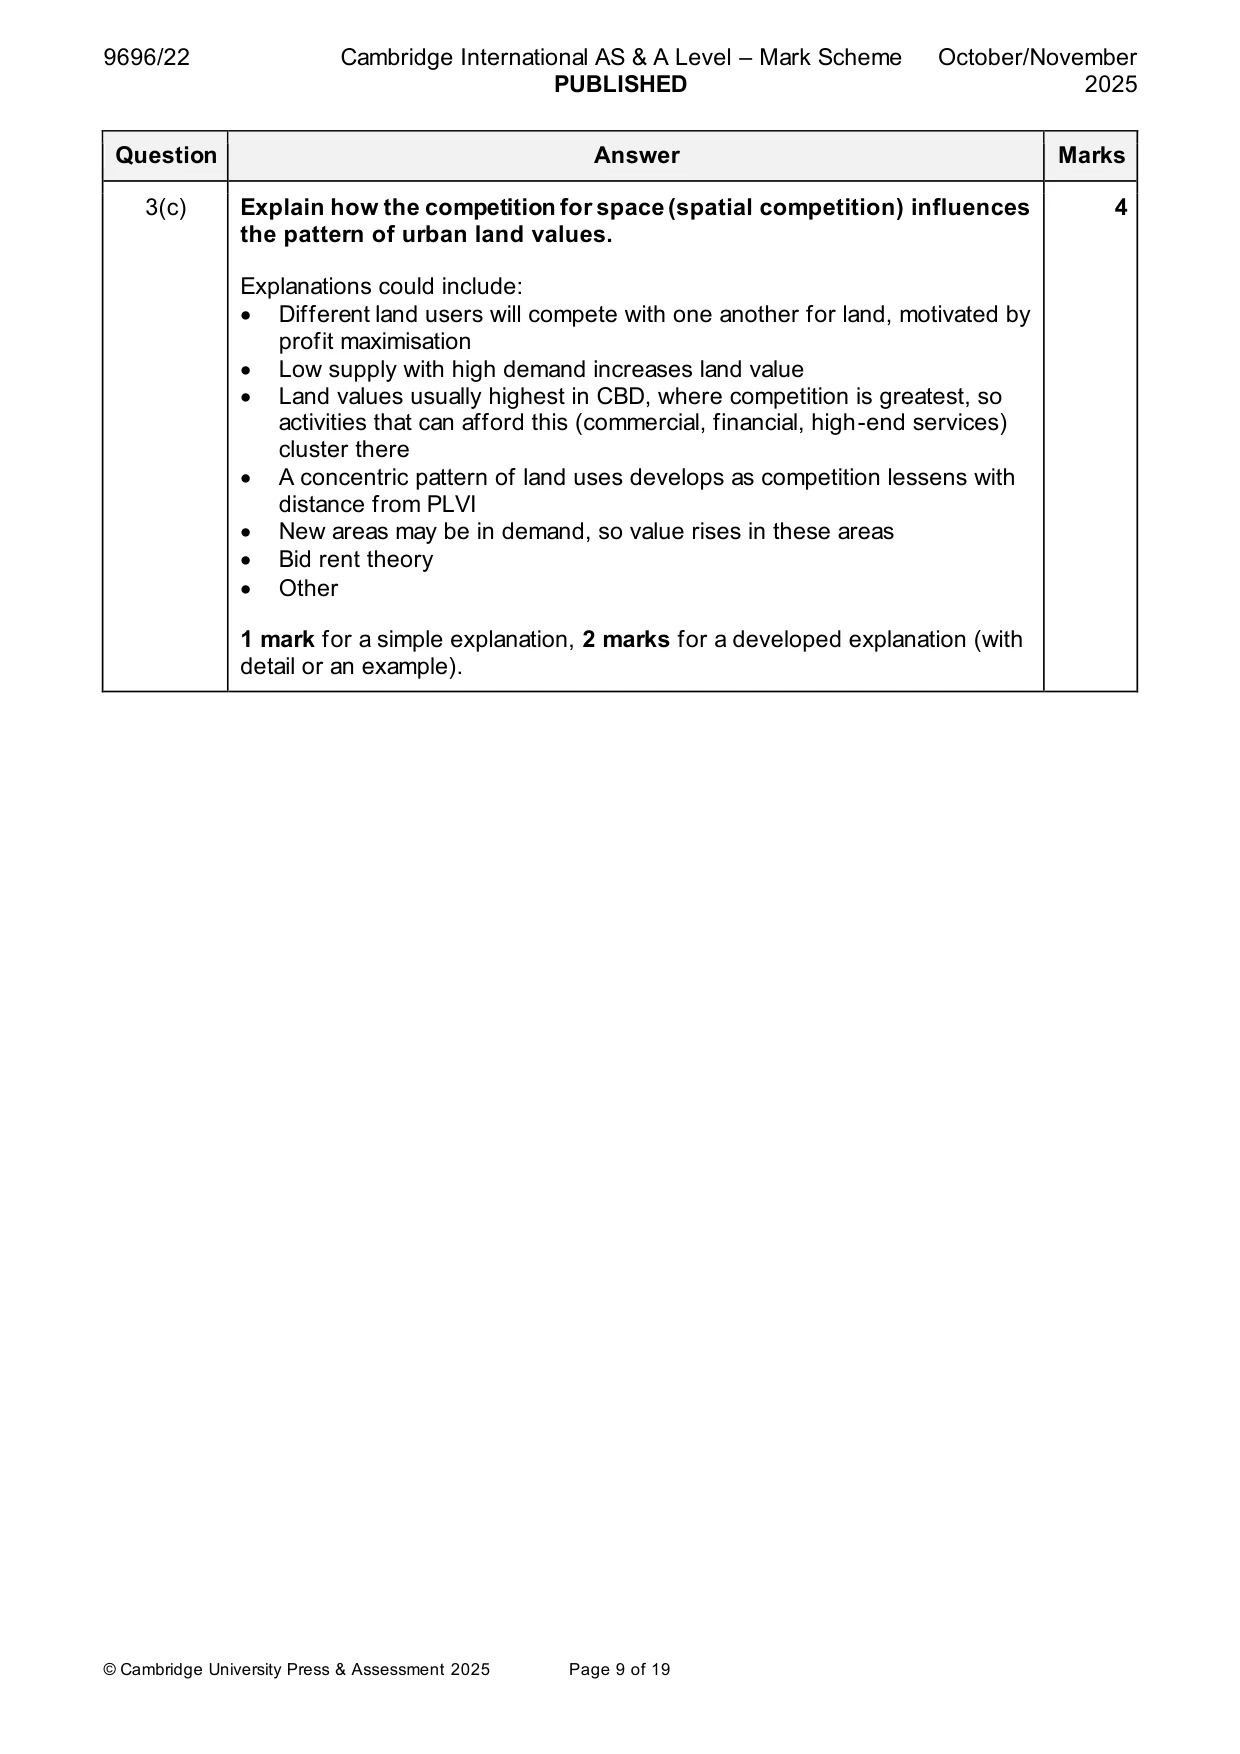
Mark scheme: 3(a) Fig. 3.1 is a photograph which shows a railway and station in Addis 3 Ababa, Ethiopia, an LIC in Africa. Using Fig. 3.1, suggest three advantages for the inhabitants of Addis Ababa of the railway shown. Advantages could include: • Accessible as close to housing • Increases access into the city centre / to other areas for employment / people can access services / businesses in the area shown • Increases attractiveness of the city to investors – modern transport system • Takes up little space as built along main road (allowing other land uses too) • Reduces traffic / less need to own vehicle (and cheaper for low-income households in surrounding area) • Comfortable / stress free transport • Less air / noise pollution from cars/lorries • Shorter journey times • Other 1 mark for each advantage. Max. 2 marks if no use of evidence from the photograph. 3(b) Suggest three challenges of the railway for the city shown in Fig. 3.1. 3 Challenges could include: • Construction costs – as along main road • Air / noise pollution for residents during construction • Clearance of buildings or loss of space for construction / relocating land uses • Running costs / maintenance issues • Affordability for passengers • Safety issues of crossing line • Electricity theft • Cuts through neighbourhoods / services on streets • Future proofing for modernising the city – aspirations vs costs • Other 1 mark for each challenge. Max. 2 marks if no use of evidence from the photograph. 3(c) Explain how the competition for space (spatial competition) influences 4 the pattern of urban land values. Explanations could include: • Different land users will compete with one another for land, motivated by profit maximisation • Low supply with high demand increases land value • Land values usually highest in CBD, where competition is greatest, so activities that can afford this (commercial, financial, high-end services) cluster there • A concentric pattern of land uses develops as competition lessens with distance from PLVI • New areas may be in demand, so value rises in these areas • Bid rent theory • Other 1 mark for a simple explanation, 2 marks for a developed explanation (with detail or an example). Section B Answer one question from this section. All questions are worth 30 marks. Population
Q4 · Define the term ‘fertility rate’
4 (a) (i) Define the term ‘fertility rate’. [3] (ii) Outline how two social factors influence fertility rates. [4] (b) With the aid of examples, explain how economic factors may result in low levels of fertility. [8] (c) ‘The demographic transition model (DTM) is a useful way to understand population change over time.’ With the aid of examples, how far do you agree with this statement? [15] Migration/Settlement dynamics
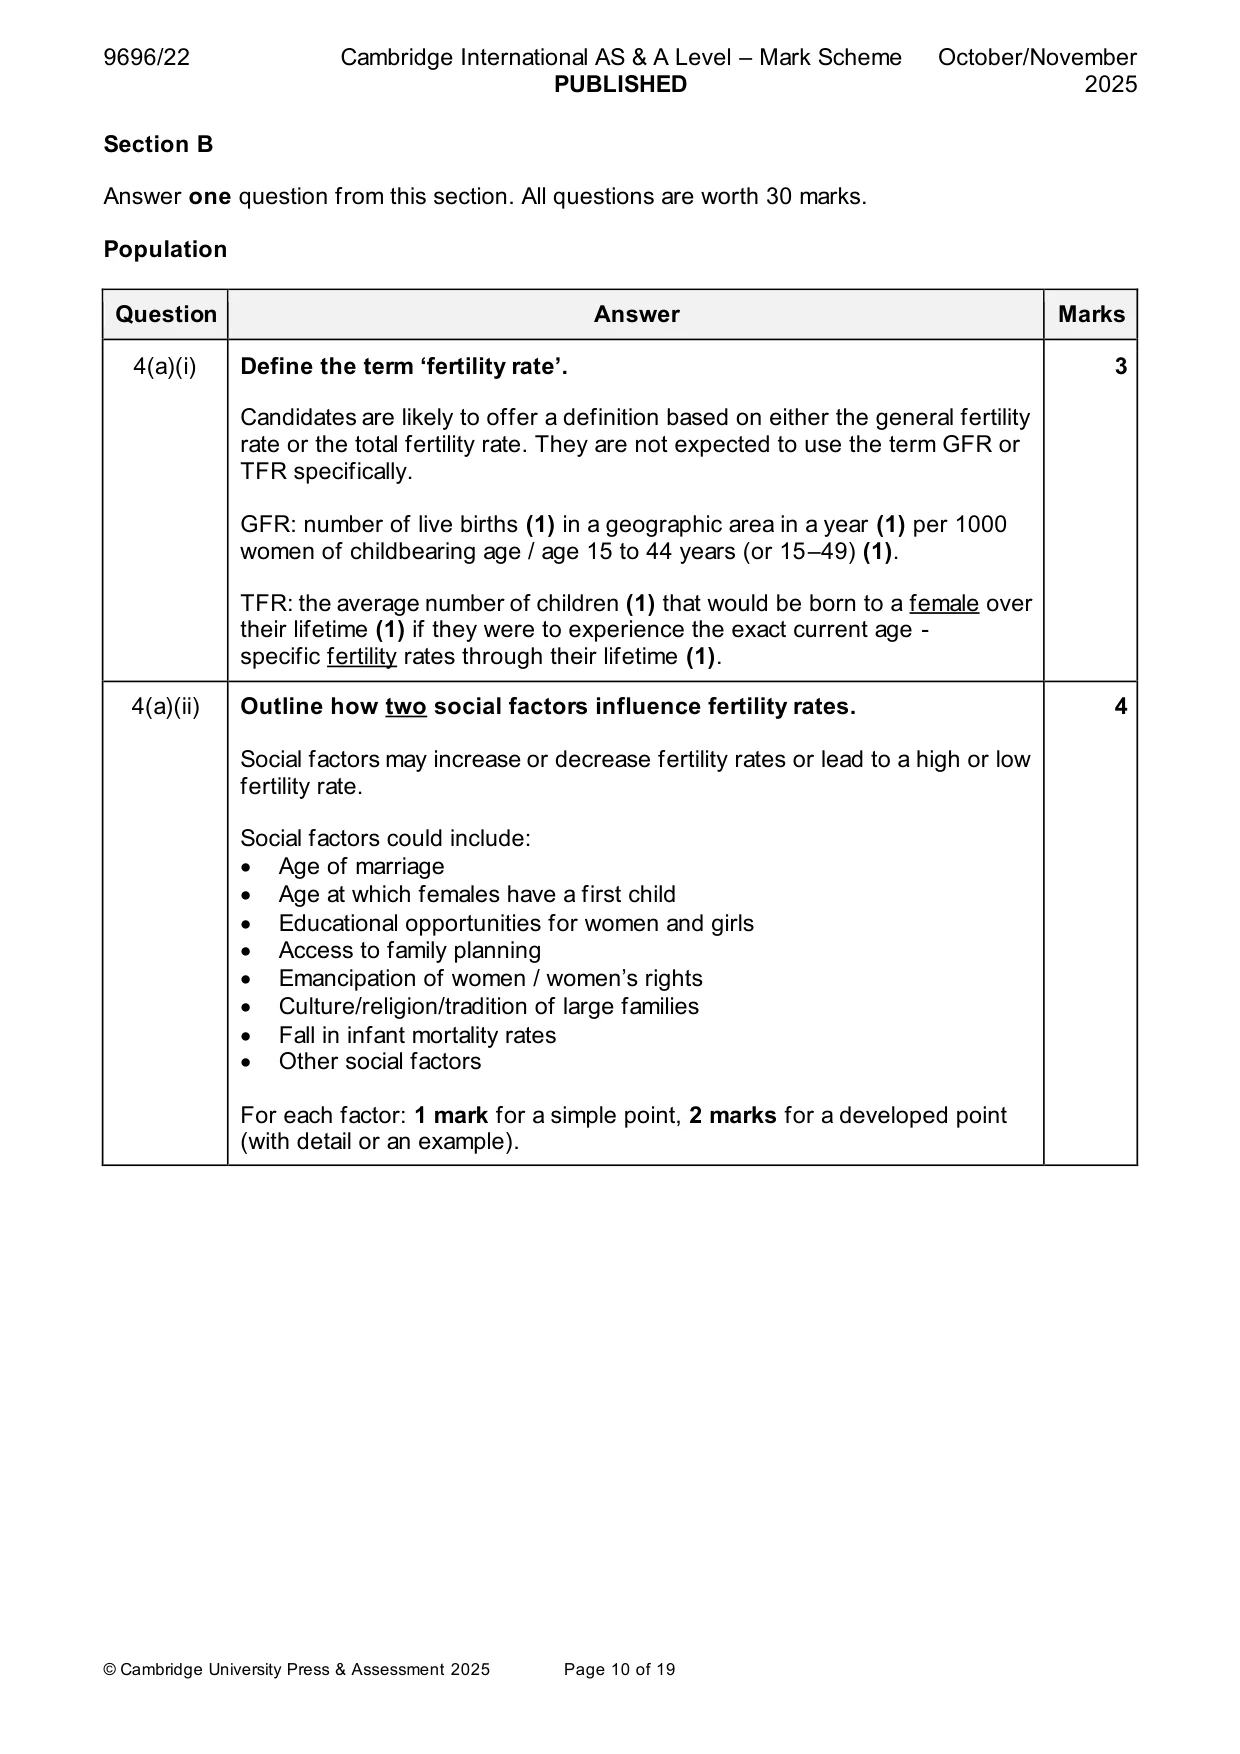
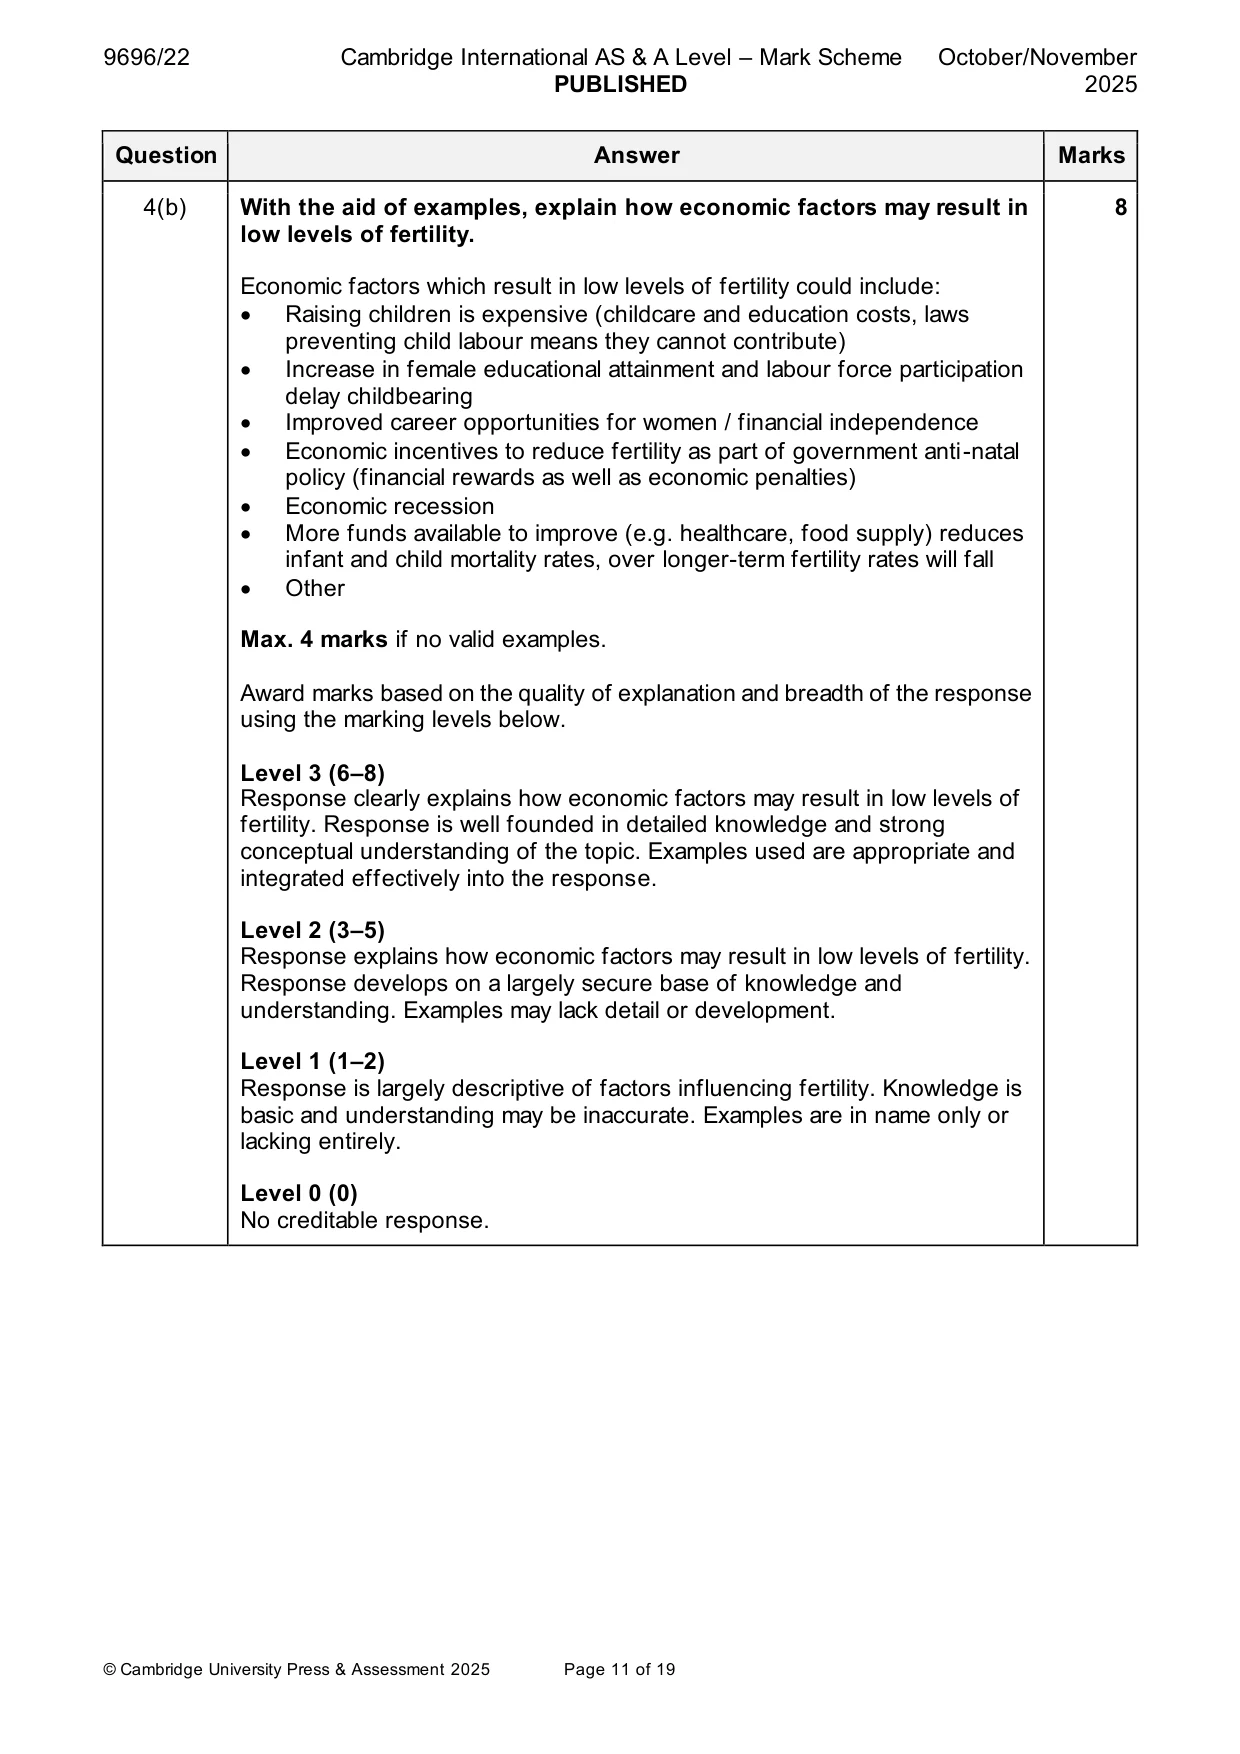
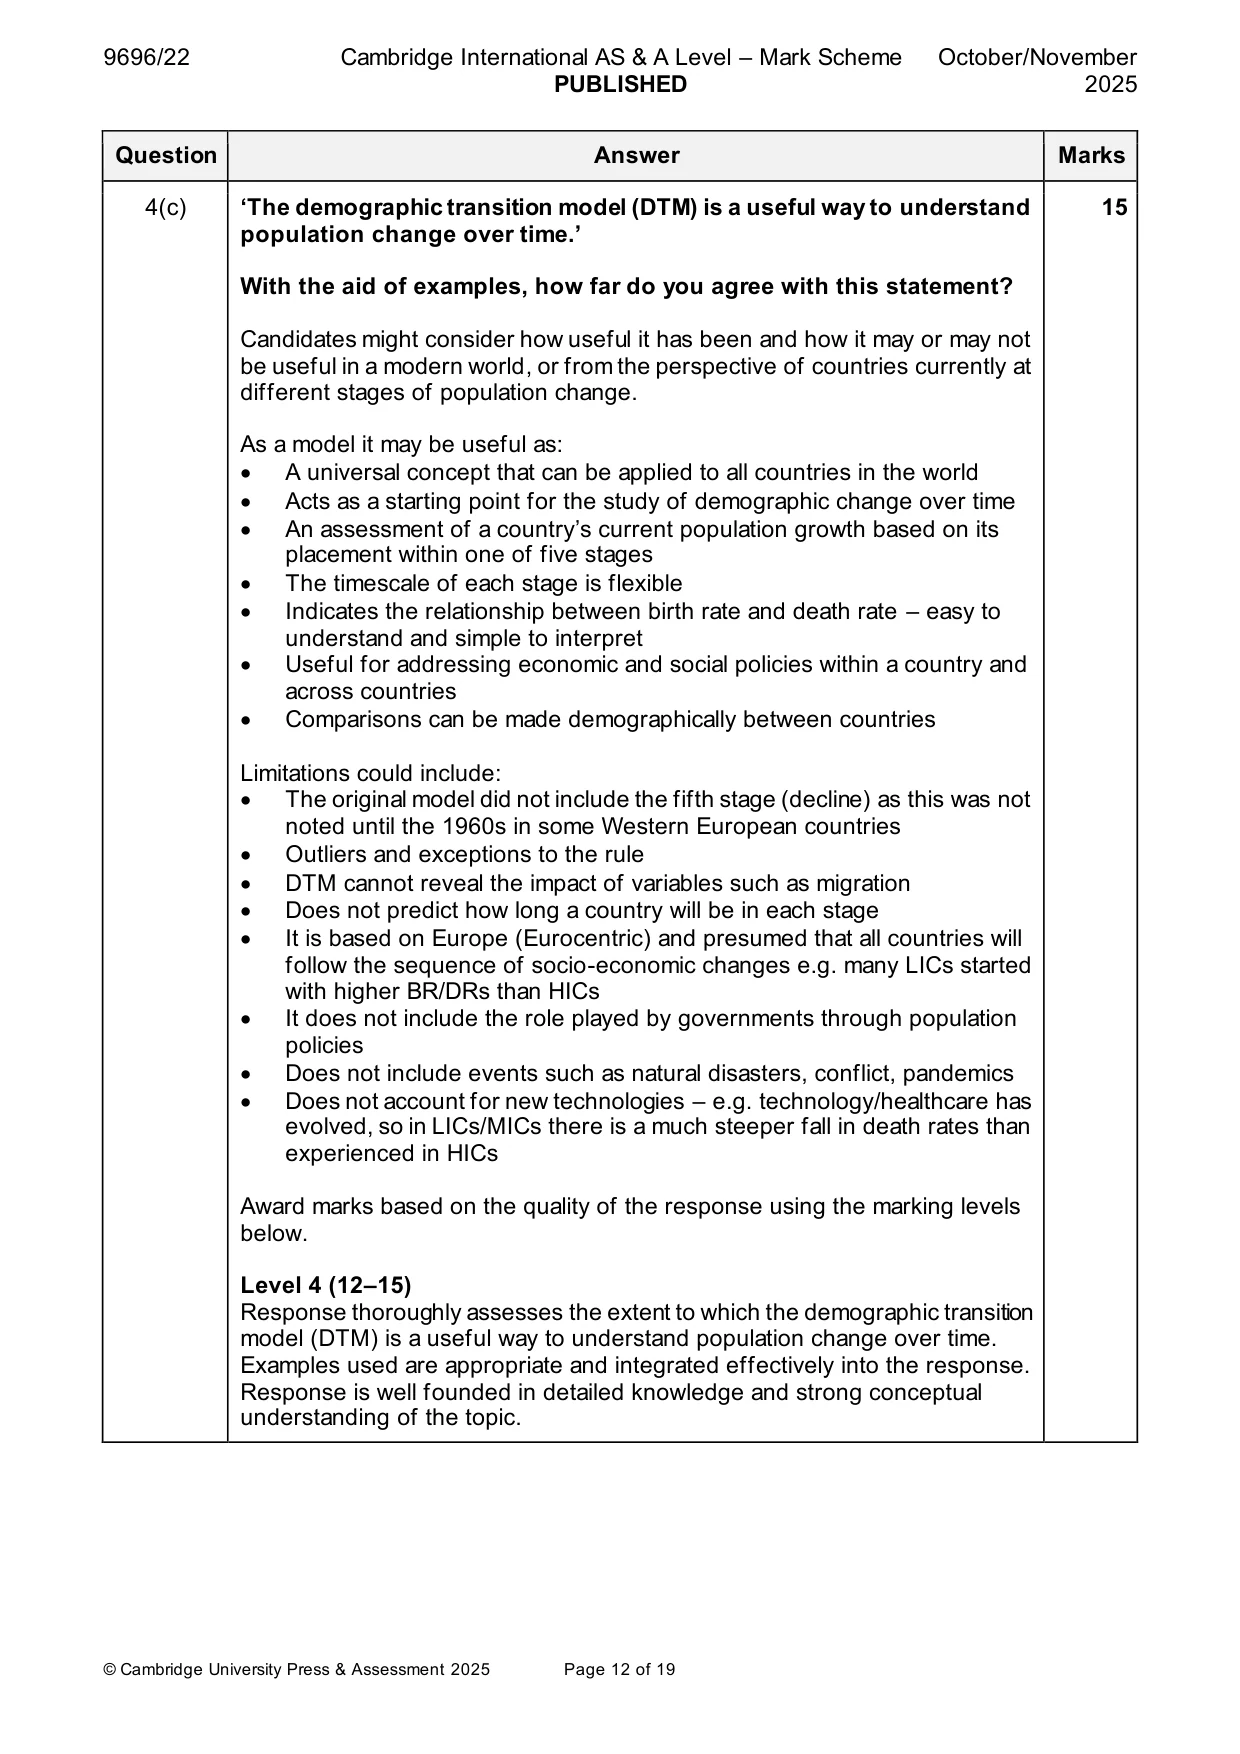
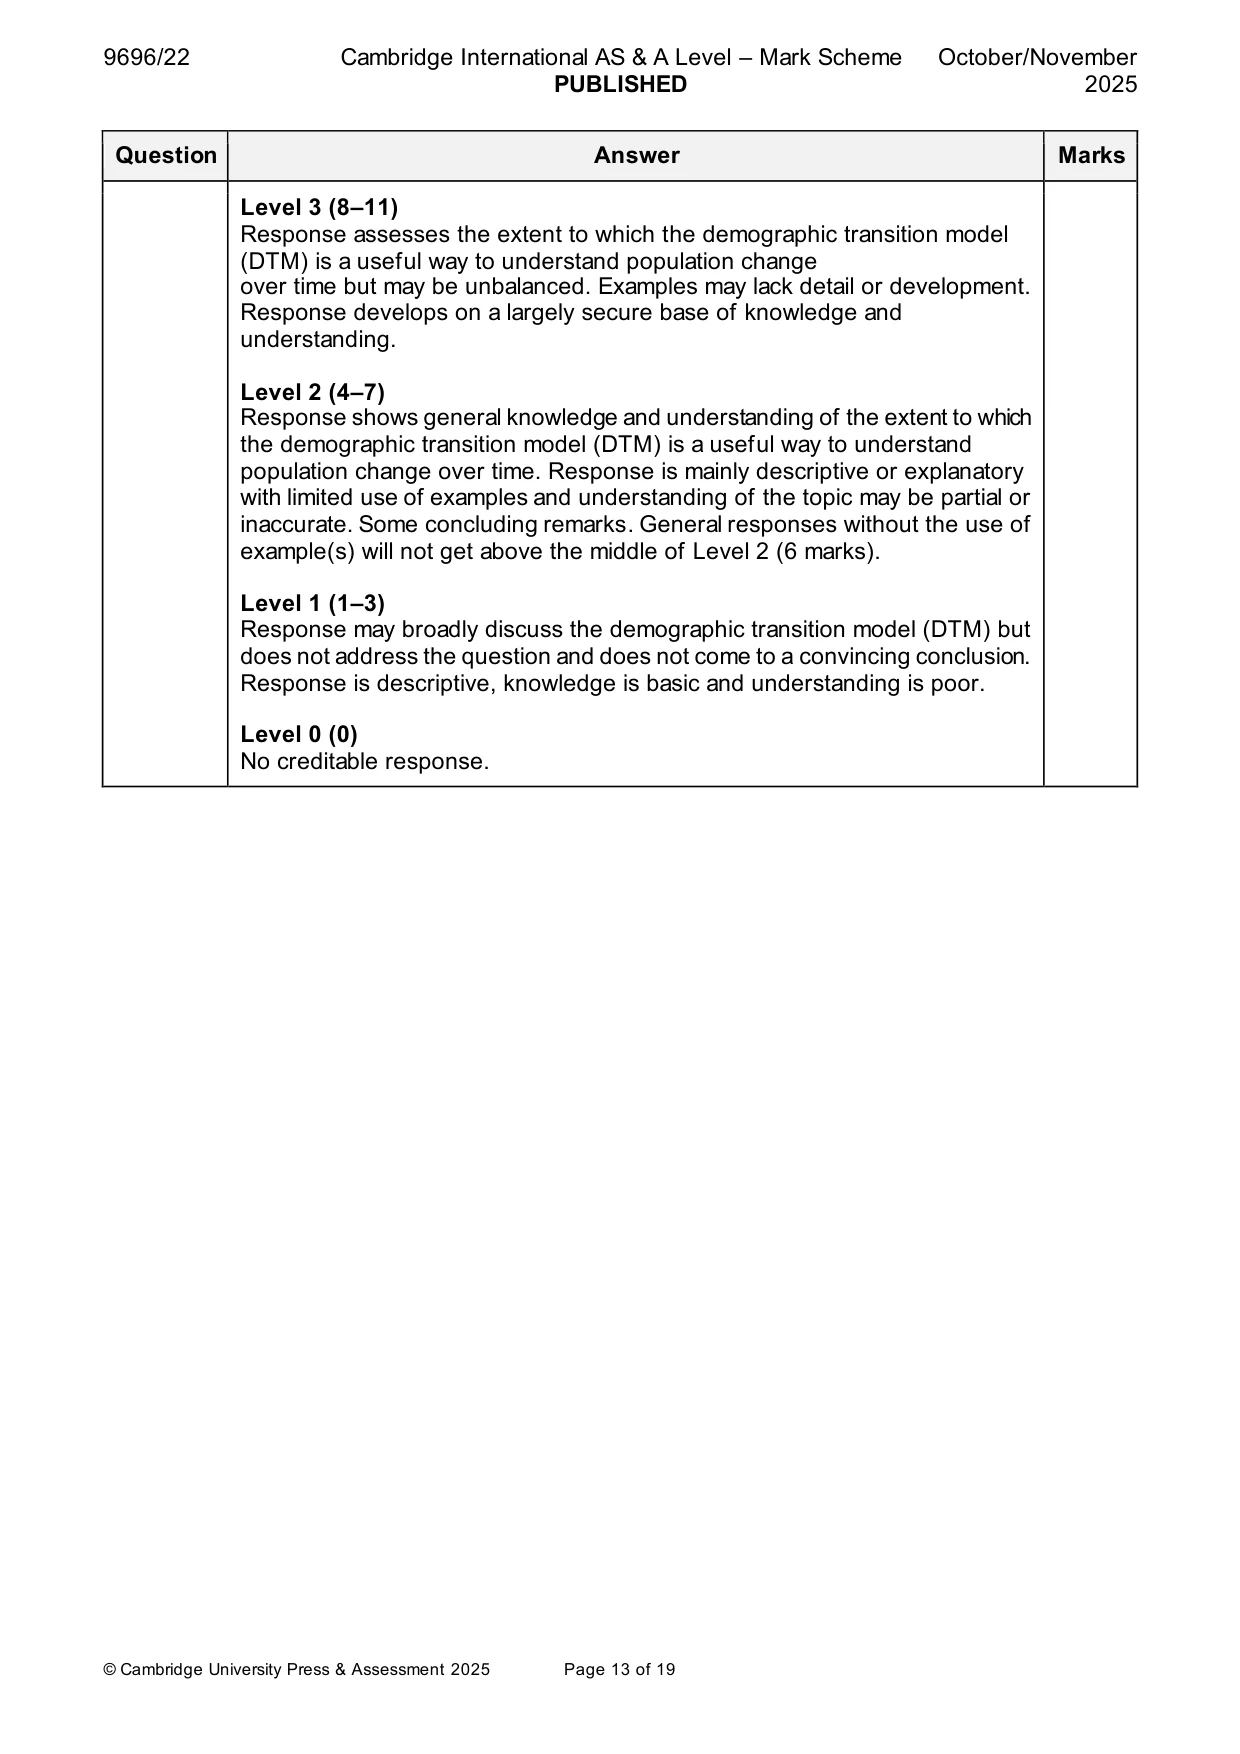
Mark scheme: 4(a)(i) Define the term ‘fertility rate’. 3 Candidates are likely to offer a definition based on either the general fertility rate or the total fertility rate. They are not expected to use the term GFR or TFR specifically. GFR: number of live births (1) in a geographic area in a year (1) per 1000 women of childbearing age / age 15 to 44 years (or 15–49) (1). TFR: the average number of children (1) that would be born to a female over their lifetime (1) if they were to experience the exact current age - specific fertility rates through their lifetime (1). 4(a)(ii) Outline how two social factors influence fertility rates. 4 Social factors may increase or decrease fertility rates or lead to a high or low fertility rate. Social factors could include: • Age of marriage • Age at which females have a first child • Educational opportunities for women and girls • Access to family planning • Emancipation of women / women’s rights • Culture/religion/tradition of large families • Fall in infant mortality rates • Other social factors For each factor: 1 mark for a simple point, 2 marks for a developed point (with detail or an example). 4(b) With the aid of examples, explain how economic factors may result in 8 low levels of fertility. Economic factors which result in low levels of fertility could include: • Raising children is expensive (childcare and education costs, laws preventing child labour means they cannot contribute) • Increase in female educational attainment and labour force participation delay childbearing • Improved career opportunities for women / financial independence • Economic incentives to reduce fertility as part of government anti-natal policy (financial rewards as well as economic penalties) • Economic recession • More funds available to improve (e.g. healthcare, food supply) reduces infant and child mortality rates, over longer-term fertility rates will fall • Other Max. 4 marks if no valid examples. Award marks based on the quality of explanation and breadth of the response using the marking levels below. Level 3 (6–8) Response clearly explains how economic factors may result in low levels of fertility. Response is well founded in detailed knowledge and strong conceptual understanding of the topic. Examples used are appropriate and integrated effectively into the response. Level 2 (3–5) Response explains how economic factors may result in low levels of fertility. Response develops on a largely secure base of knowledge and understanding. Examples may lack detail or development. Level 1 (1–2) Response is largely descriptive of factors influencing fertility. Knowledge is basic and understanding may be inaccurate. Examples are in name only or lacking entirely. Level 0 (0) No creditable response. 4(c) ‘The demographic transition model (DTM) is a useful way to understand 15 population change over time.’ With the aid of examples, how far do you agree with this statement? Candidates might consider how useful it has been and how it may or may not be useful in a modern world, or from the perspective of countries currently at different stages of population change. As a model it may be useful as: • A universal concept that can be applied to all countries in the world • Acts as a starting point for the study of demographic change over time • An assessment of a country’s current population growth based on its placement within one of five stages • The timescale of each stage is flexible • Indicates the relationship between birth rate and death rate – easy to understand and simple to interpret • Useful for addressing economic and social policies within a country and across countries • Comparisons can be made demographically between countries Limitations could include: • The original model did not include the fifth stage (decline) as this was not noted until the 1960s in some Western European countries • Outliers and exceptions to the rule • DTM cannot reveal the impact of variables such as migration • Does not predict how long a country will be in each stage • It is based on Europe (Eurocentric) and presumed that all countries will follow the sequence of socio-economic changes e.g. many LICs started with higher BR/DRs than HICs • It does not include the role played by governments through population policies • Does not include events such as natural disasters, conflict, pandemics • Does not account for new technologies – e.g. technology/healthcare has evolved, so in LICs/MICs there is a much steeper fall in death rates than experienced in HICs Award marks based on the quality of the response using the marking levels below. Level 4 (12–15) Response thoroughly assesses the extent to which the demographic transition model (DTM) is a useful way to understand population change over time. Examples used are appropriate and integrated effectively into the response. Response is well founded in detailed knowledge and strong conceptual understanding of the topic. Level 3 (8–11) Response assesses the extent to which the demographic transition model (DTM) is a useful way to understand population change over time but may be unbalanced. Examples may lack detail or development. Response develops on a largely secure base of knowledge and understanding. Level 2 (4–7) Response shows general knowledge and understanding of the extent to which the demographic transition model (DTM) is a useful way to understand population change over time. Response is mainly descriptive or explanatory with limited use of examples and understanding of the topic may be partial or inaccurate. Some concluding remarks. General responses without the use of example(s) will not get above the middle of Level 2 (6 marks). Level 1 (1–3) Response may broadly discuss the demographic transition model (DTM) but does not address the question and does not come to a convincing conclusion. Response is descriptive, knowledge is basic and understanding is poor. Level 0 (0) No creditable response. Migration/Settlement dynamics
Q5 · Define the term ‘voluntary migration’
5 (a) (i) Define the term ‘voluntary migration’. [3] (ii) Explain two constraints on voluntary migration. [4] (b) With the aid of examples, explain the pull factors of urban areas in LICs/MICs. [8] (c) With the aid of examples, assess the extent to which rural to urban migration in LICs/MICs causes problems in rural areas. [15] Settlement dynamics
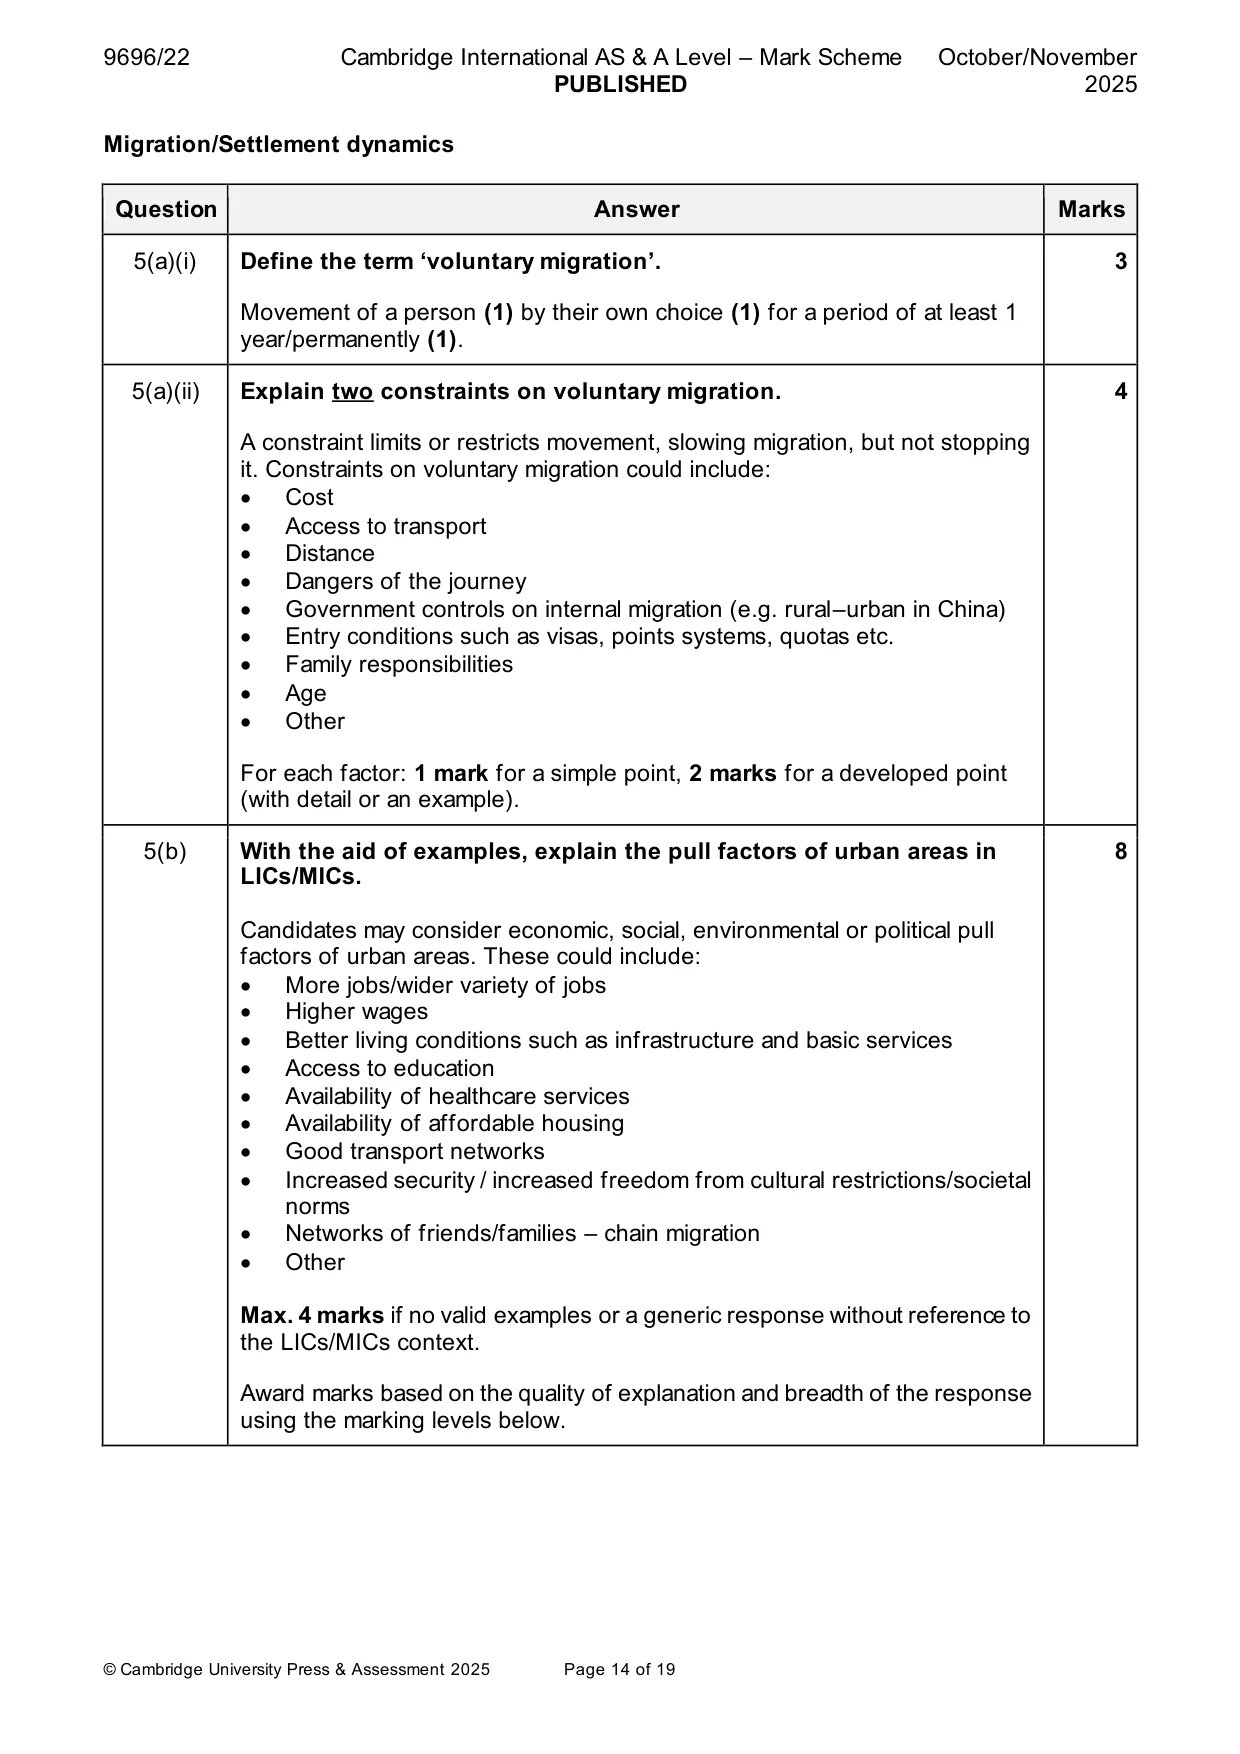
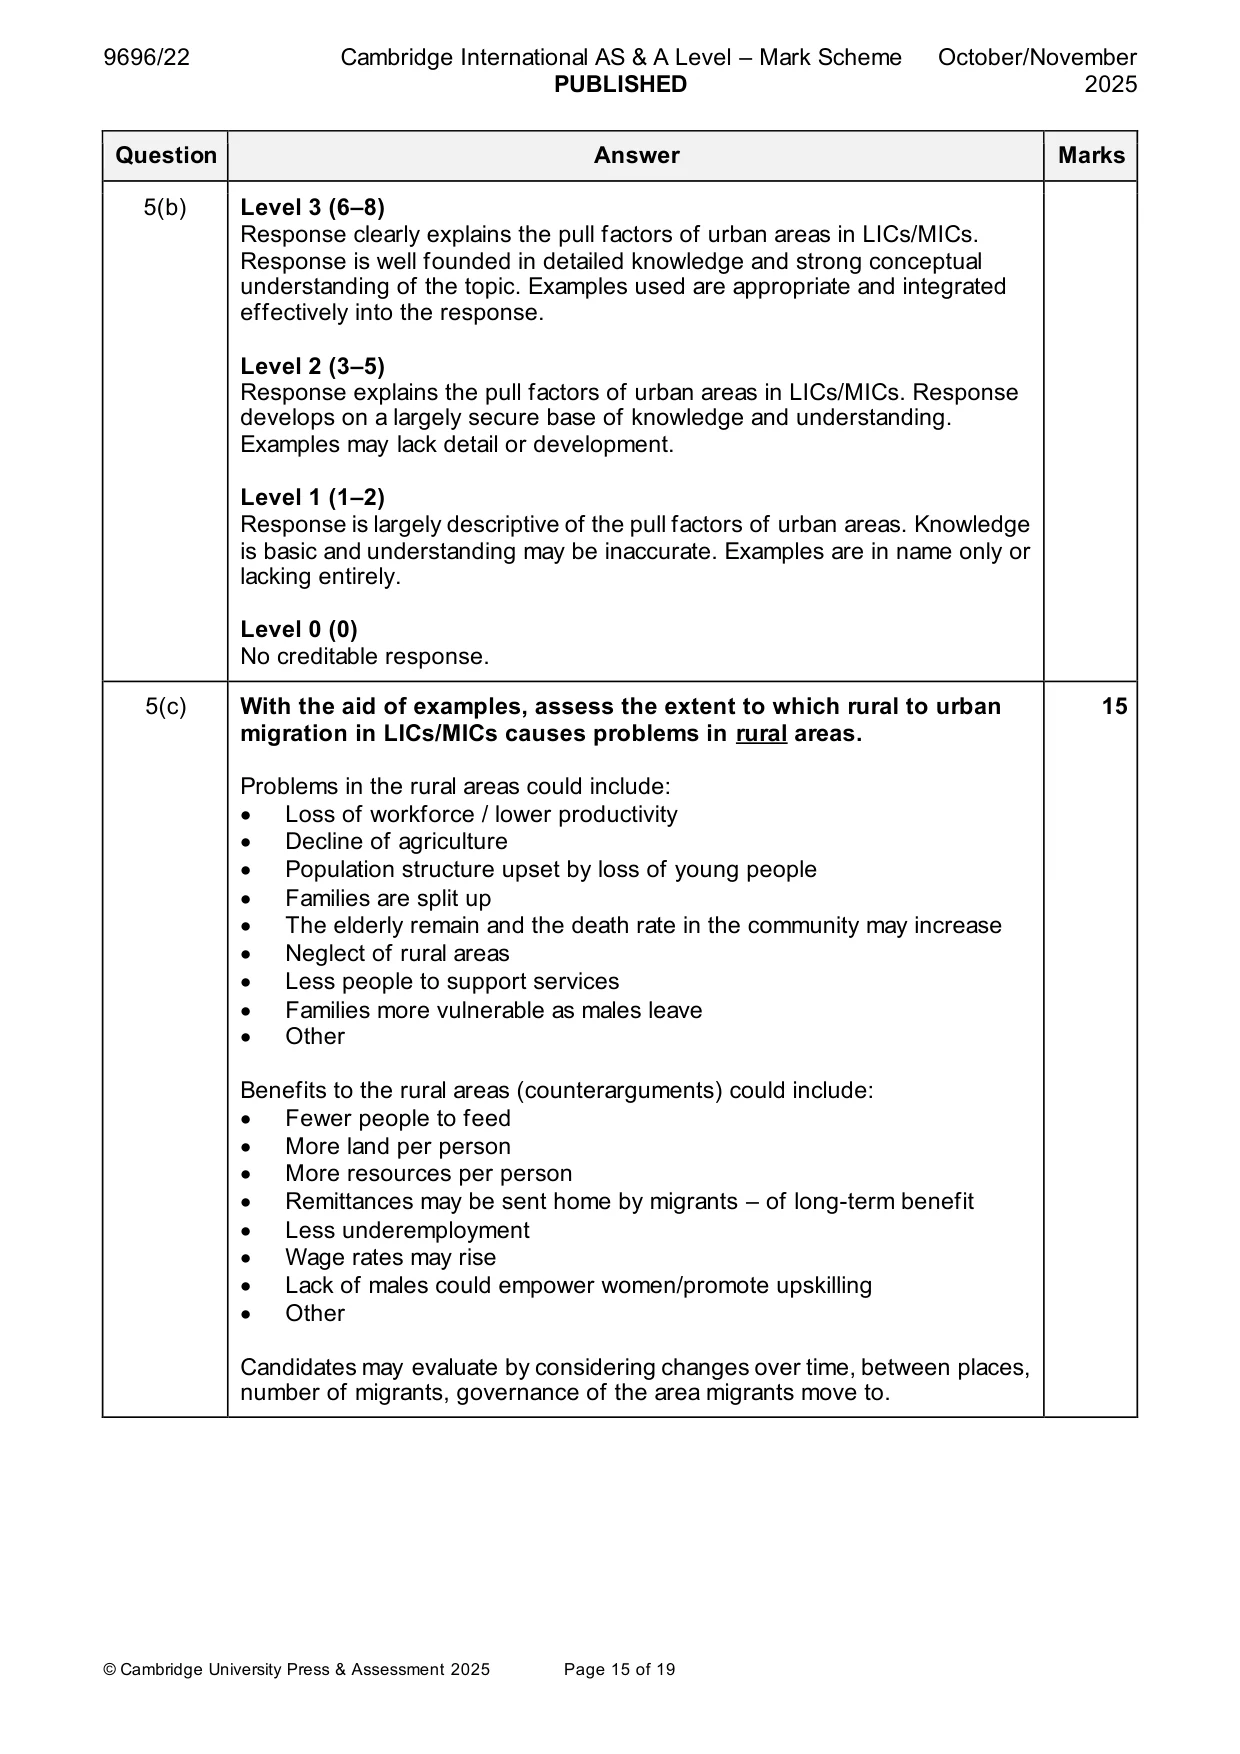
Mark scheme: 5(a)(i) Define the term ‘voluntary migration’. 3 Movement of a person (1) by their own choice (1) for a period of at least 1 year/permanently (1). 5(a)(ii) Explain two constraints on voluntary migration. 4 A constraint limits or restricts movement, slowing migration, but not stopping it. Constraints on voluntary migration could include: • Cost • Access to transport • Distance • Dangers of the journey • Government controls on internal migration (e.g. rural–urban in China) • Entry conditions such as visas, points systems, quotas etc. • Family responsibilities • Age • Other For each factor: 1 mark for a simple point, 2 marks for a developed point (with detail or an example). 5(b) With the aid of examples, explain the pull factors of urban areas in 8 LICs/MICs. Candidates may consider economic, social, environmental or political pull factors of urban areas. These could include: • More jobs/wider variety of jobs • Higher wages • Better living conditions such as infrastructure and basic services • Access to education • Availability of healthcare services • Availability of affordable housing • Good transport networks • Increased security / increased freedom from cultural restrictions/societal norms • Networks of friends/families – chain migration • Other Max. 4 marks if no valid examples or a generic response without reference to the LICs/MICs context. Award marks based on the quality of explanation and breadth of the response using the marking levels below. 5(b) Level 3 (6–8) Response clearly explains the pull factors of urban areas in LICs/MICs. Response is well founded in detailed knowledge and strong conceptual understanding of the topic. Examples used are appropriate and integrated effectively into the response. Level 2 (3–5) Response explains the pull factors of urban areas in LICs/MICs. Response develops on a largely secure base of knowledge and understanding. Examples may lack detail or development. Level 1 (1–2) Response is largely descriptive of the pull factors of urban areas. Knowledge is basic and understanding may be inaccurate. Examples are in name only or lacking entirely. Level 0 (0) No creditable response. 5(c) With the aid of examples, assess the extent to which rural to urban 15 migration in LICs/MICs causes problems in rural areas. Problems in the rural areas could include: • Loss of workforce / lower productivity • Decline of agriculture • Population structure upset by loss of young people • Families are split up • The elderly remain and the death rate in the community may increase • Neglect of rural areas • Less people to support services • Families more vulnerable as males leave • Other Benefits to the rural areas (counterarguments) could include: • Fewer people to feed • More land per person • More resources per person • Remittances may be sent home by migrants – of long-term benefit • Less underemployment • Wage rates may rise • Lack of males could empower women/promote upskilling • Other Candidates may evaluate by considering changes over time, between places, number of migrants, governance of the area migrants move to. 5(c) Award marks based on the quality of the response using the marking levels below. Level 4 (12–15) Response thoroughly assesses the extent to which rural to urban migration in LICs/MICs causes problems in rural areas. Examples used are appropriate and integrated effectively into the response. Response is well founded in detailed knowledge and strong conceptual understanding of the topic. Level 3 (8–11) Response assesses the extent to which rural to urban migration in LICs/MICs causes problems in rural areas but may be unbalanced. Examples may lack detail or development. Response develops on a largely secure base of knowledge and understanding. Level 2 (4–7) Response shows general knowledge and understanding of the extent to which rural to urban migration in LICs/MICs causes problems in rural areas. Response is mainly descriptive or explanatory with limited use of examples and understanding of the topic may be partial or inaccurate. Some concluding remarks. General responses without the use of example(s) will not get above the middle of Level 2 (6 marks). Level 1 (1–3) Response may broadly discuss rural to urban migration or problems in rural areas but does not address the question and does not come to a convincing conclusion. Response is descriptive, knowledge is basic and understanding is poor. Level 0 (0) No creditable response. Settlement dynamics
Q6 · Describe the changes in location of retailing in urban areas
6 (a) Describe the changes in location of retailing in urban areas. [7] (b) With the aid of examples, explain the role of planning in the location of manufacturing industries in urban areas. [8] (c) ‘Population size is the most important factor in defining a world city.’ With the aid of examples, how far do you agree with this statement? [15]
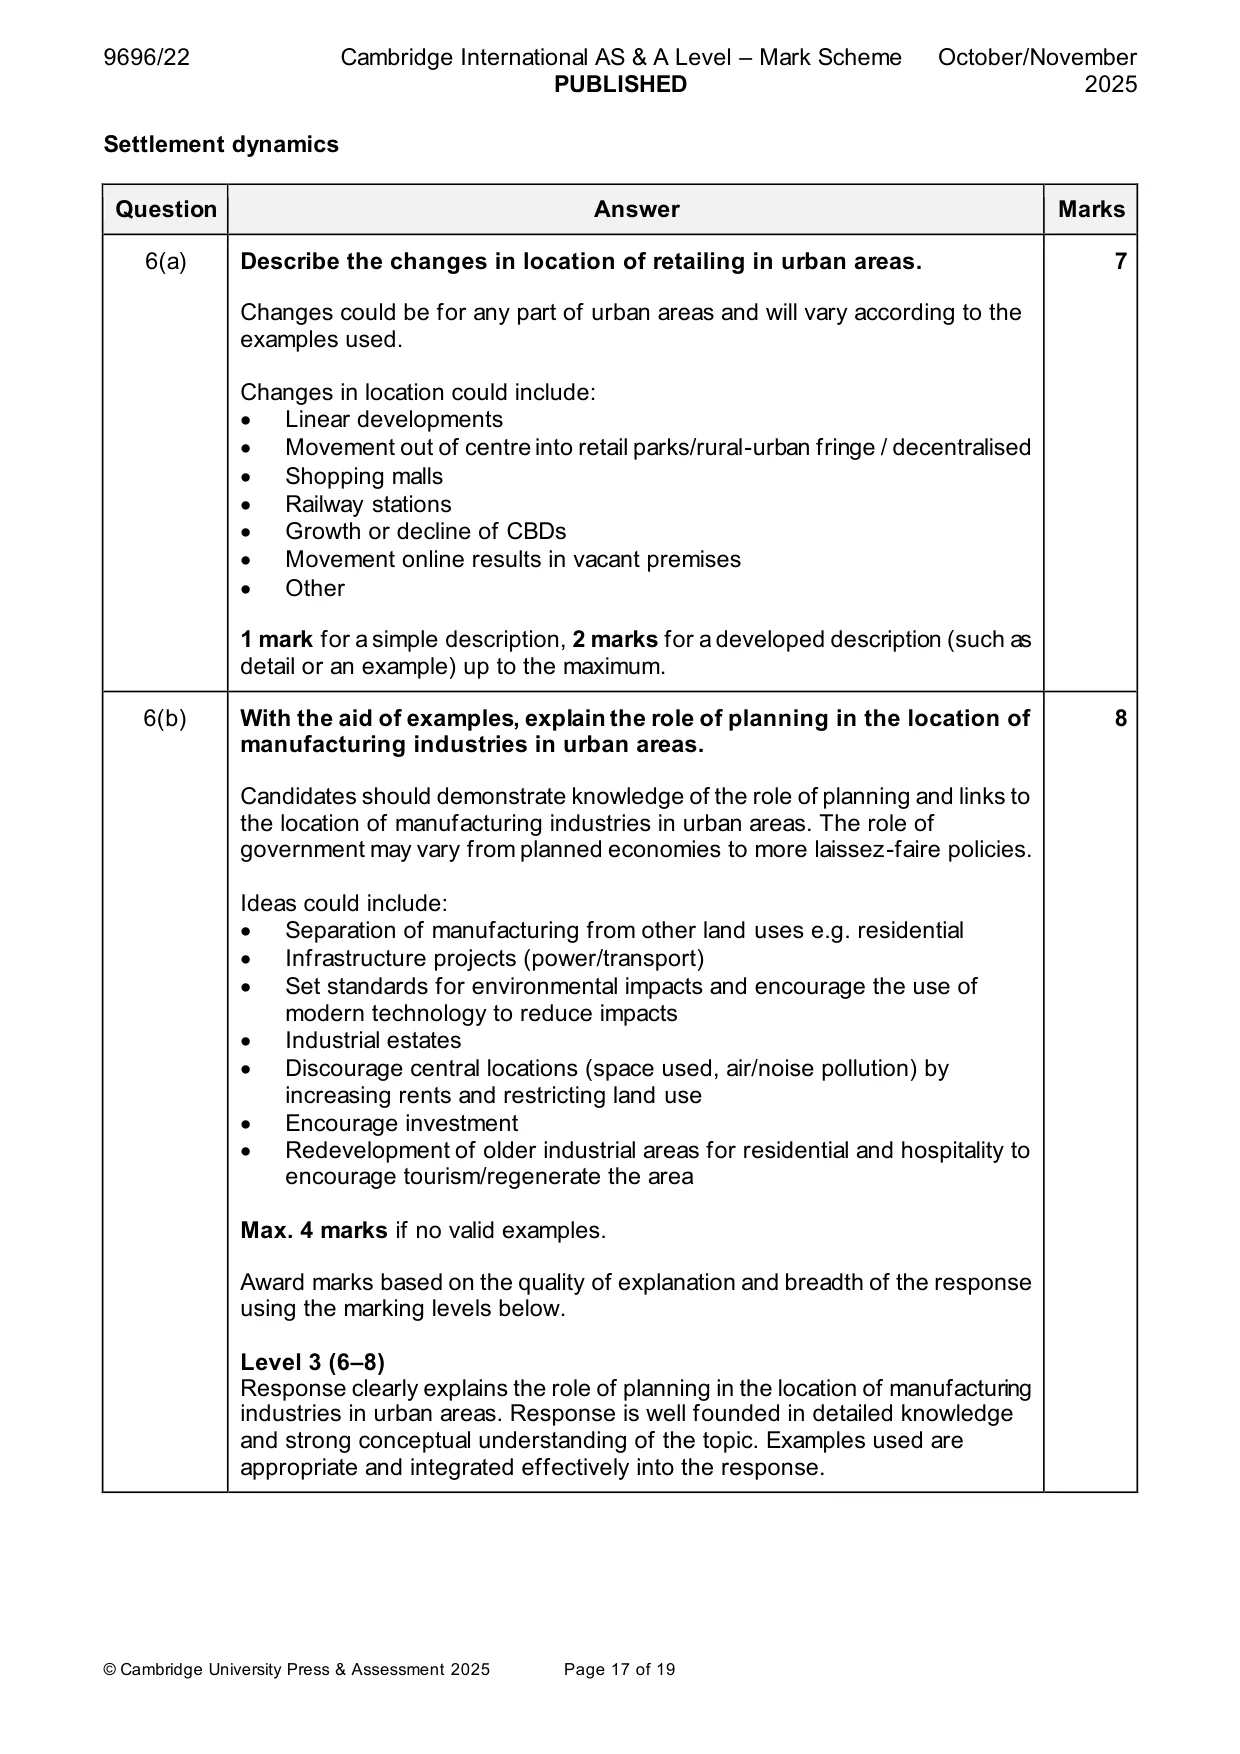
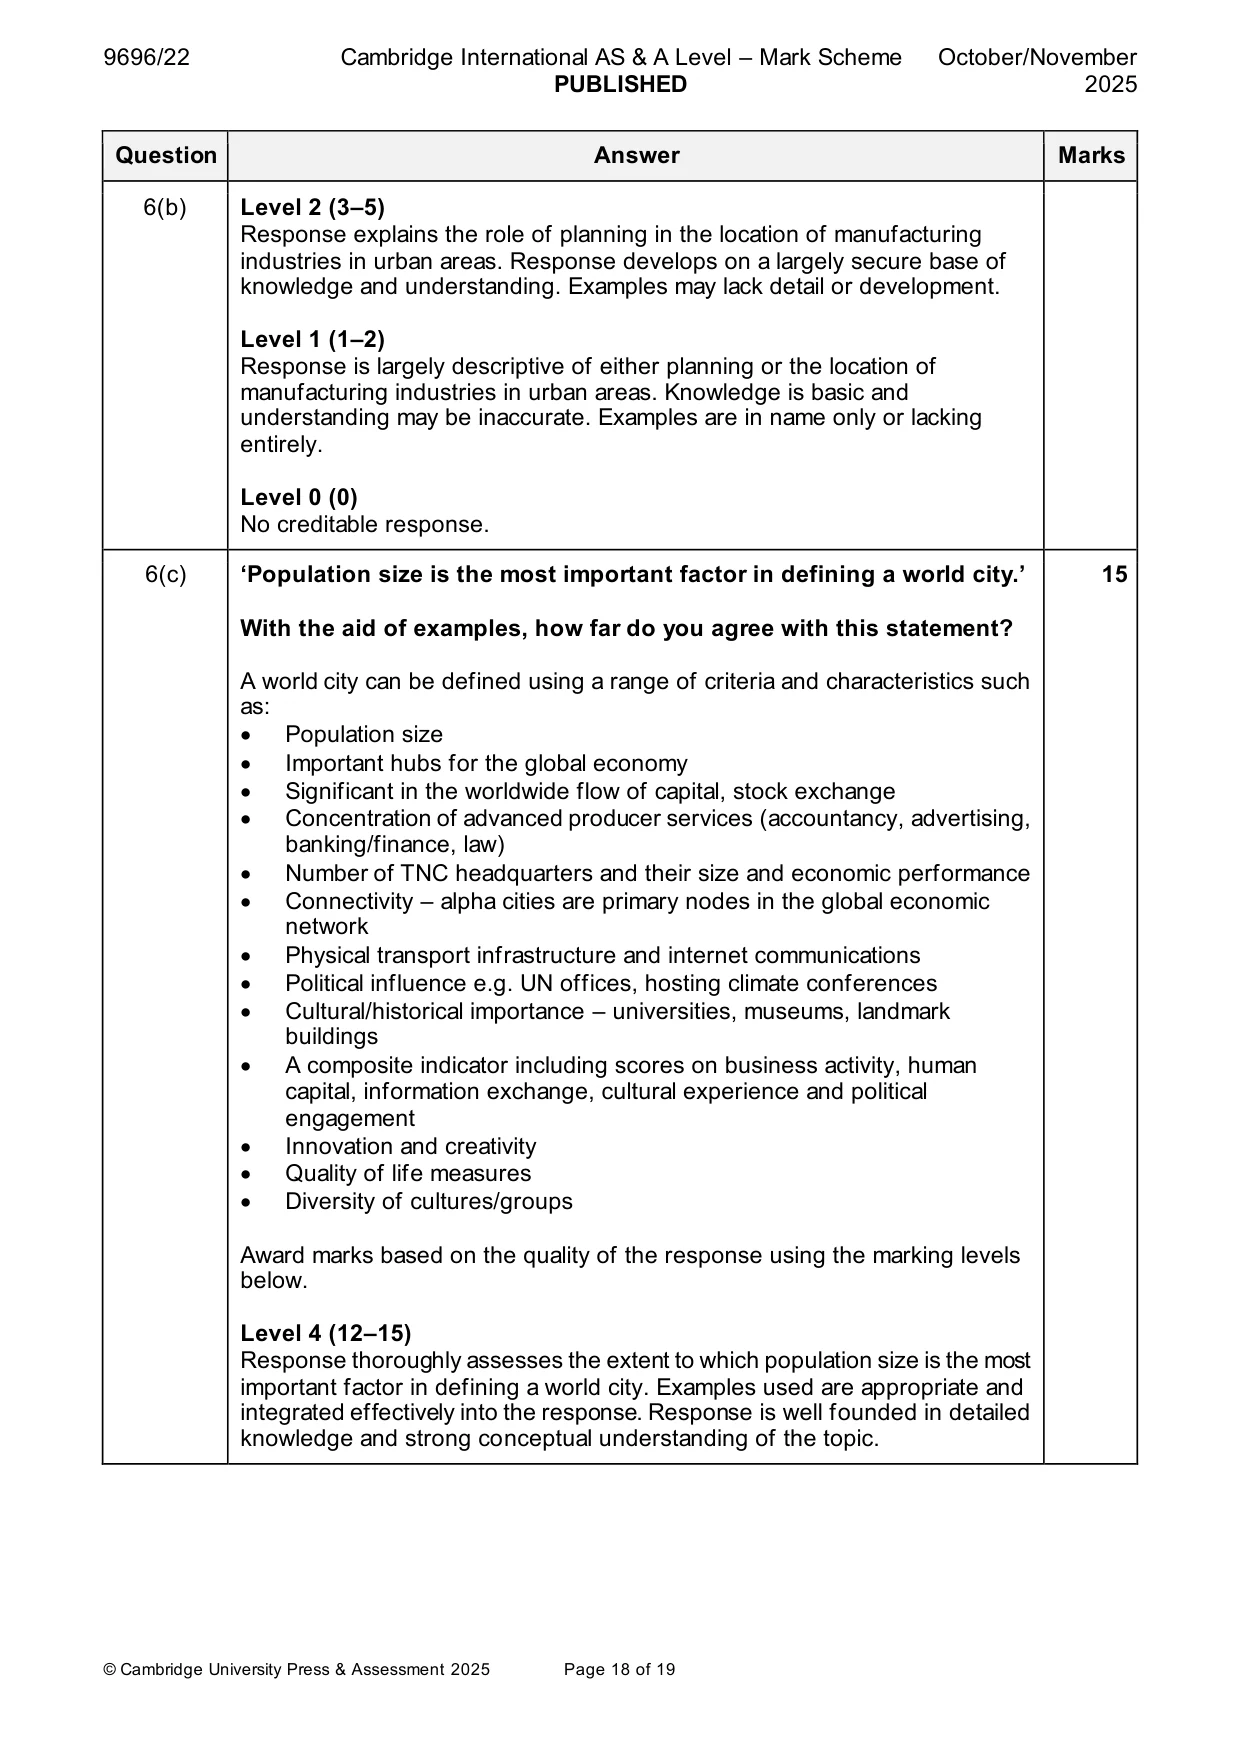
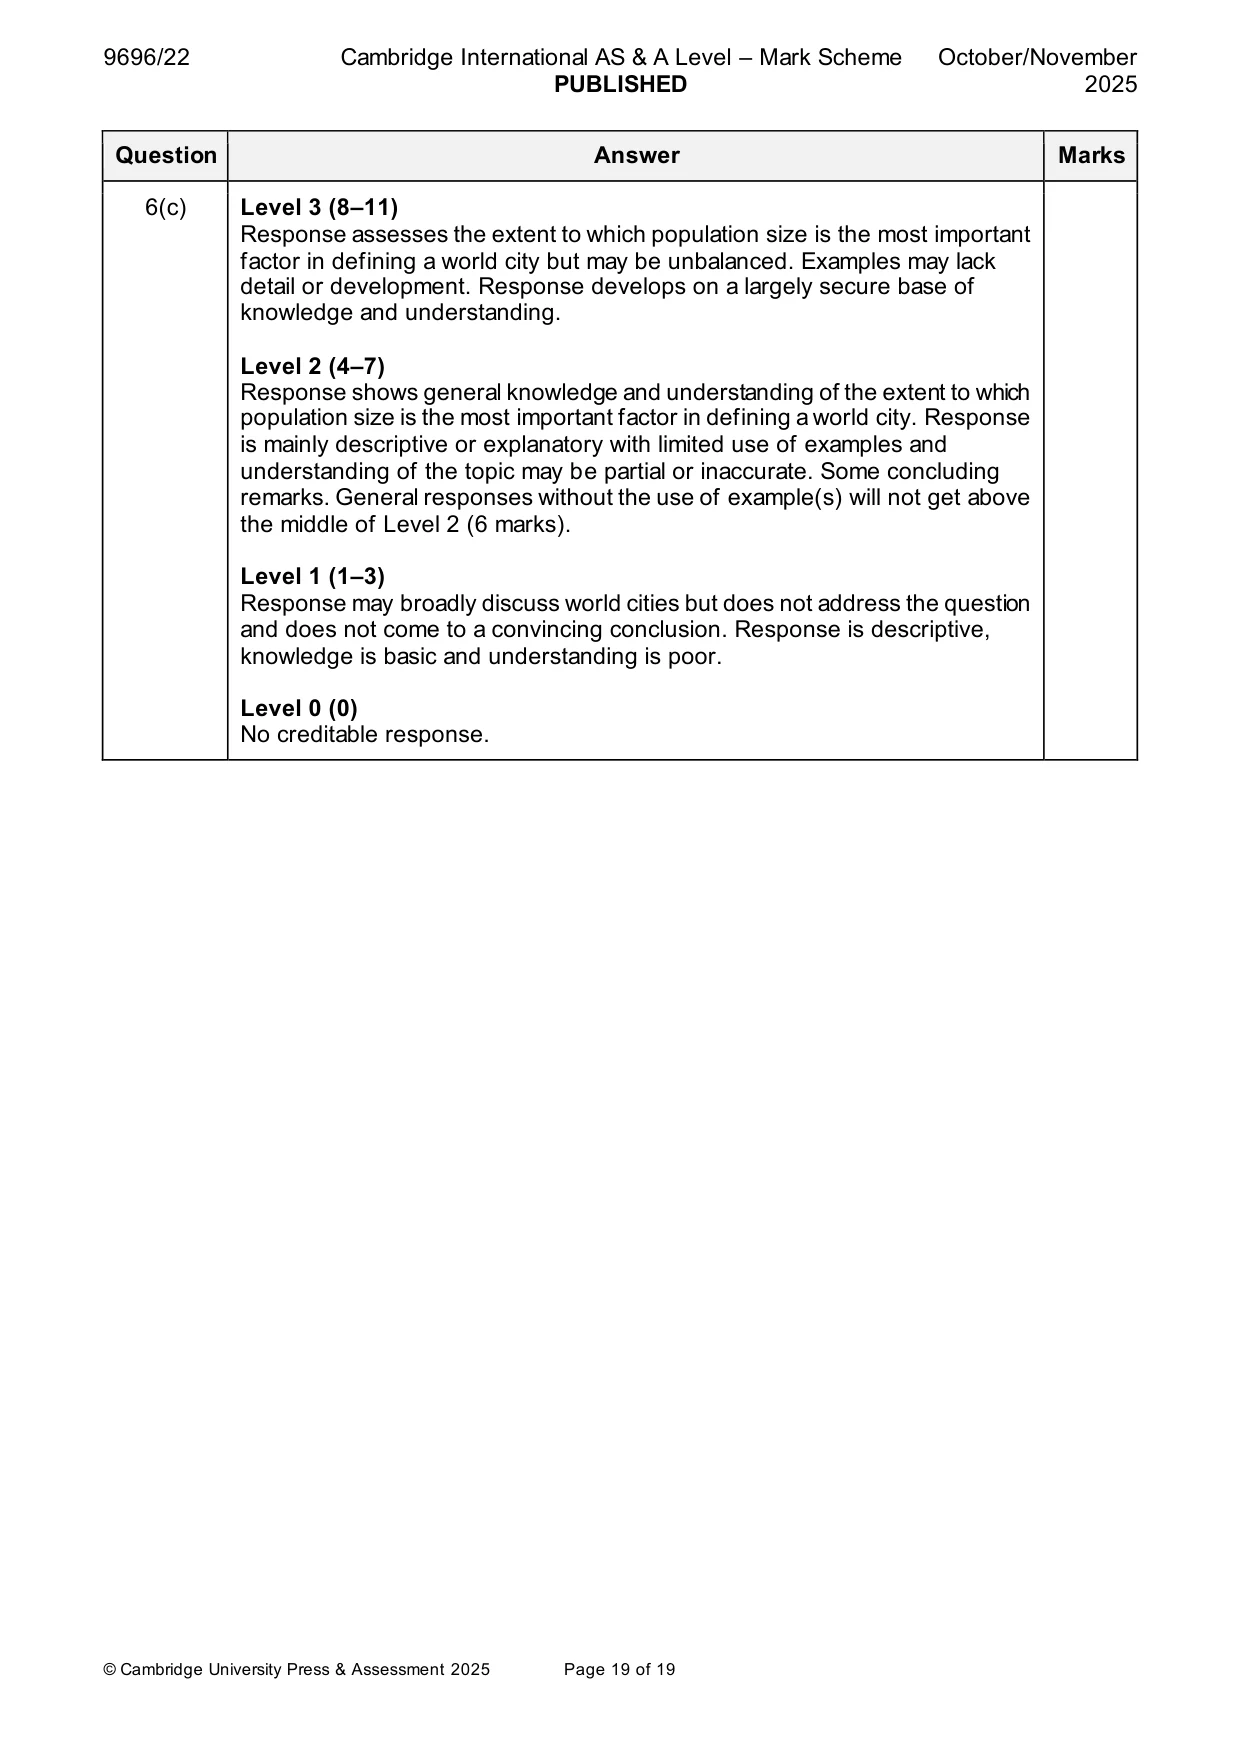
Mark scheme: 6(a) Describe the changes in location of retailing in urban areas. 7 Changes could be for any part of urban areas and will vary according to the examples used. Changes in location could include: • Linear developments • Movement out of centre into retail parks/rural-urban fringe / decentralised • Shopping malls • Railway stations • Growth or decline of CBDs • Movement online results in vacant premises • Other 1 mark for a simple description, 2 marks for a developed description (such as detail or an example) up to the maximum. 6(b) With the aid of examples, explain the role of planning in the location of 8 manufacturing industries in urban areas. Candidates should demonstrate knowledge of the role of planning and links to the location of manufacturing industries in urban areas. The role of government may vary from planned economies to more laissez-faire policies. Ideas could include: • Separation of manufacturing from other land uses e.g. residential • Infrastructure projects (power/transport) • Set standards for environmental impacts and encourage the use of modern technology to reduce impacts • Industrial estates • Discourage central locations (space used, air/noise pollution) by increasing rents and restricting land use • Encourage investment • Redevelopment of older industrial areas for residential and hospitality to encourage tourism/regenerate the area Max. 4 marks if no valid examples. Award marks based on the quality of explanation and breadth of the response using the marking levels below. Level 3 (6–8) Response clearly explains the role of planning in the location of manufacturing industries in urban areas. Response is well founded in detailed knowledge and strong conceptual understanding of the topic. Examples used are appropriate and integrated effectively into the response. 6(b) Level 2 (3–5) Response explains the role of planning in the location of manufacturing industries in urban areas. Response develops on a largely secure base of knowledge and understanding. Examples may lack detail or development. Level 1 (1–2) Response is largely descriptive of either planning or the location of manufacturing industries in urban areas. Knowledge is basic and understanding may be inaccurate. Examples are in name only or lacking entirely. Level 0 (0) No creditable response. 6(c) ‘Population size is the most important factor in defining a world city.’ 15 With the aid of examples, how far do you agree with this statement? A world city can be defined using a range of criteria and characteristics such as: • Population size • Important hubs for the global economy • Significant in the worldwide flow of capital, stock exchange • Concentration of advanced producer services (accountancy, advertising, banking/finance, law) • Number of TNC headquarters and their size and economic performance • Connectivity – alpha cities are primary nodes in the global economic network • Physical transport infrastructure and internet communications • Political influence e.g. UN offices, hosting climate conferences • Cultural/historical importance – universities, museums, landmark buildings • A composite indicator including scores on business activity, human capital, information exchange, cultural experience and political engagement • Innovation and creativity • Quality of life measures • Diversity of cultures/groups Award marks based on the quality of the response using the marking levels below. Level 4 (12–15) Response thoroughly assesses the extent to which population size is the most important factor in defining a world city. Examples used are appropriate and integrated effectively into the response. Response is well founded in detailed knowledge and strong conceptual understanding of the topic. 6(c) Level 3 (8–11) Response assesses the extent to which population size is the most important factor in defining a world city but may be unbalanced. Examples may lack detail or development. Response develops on a largely secure base of knowledge and understanding. Level 2 (4–7) Response shows general knowledge and understanding of the extent to which population size is the most important factor in defining a world city. Response is mainly descriptive or explanatory with limited use of examples and understanding of the topic may be partial or inaccurate. Some concluding remarks. General responses without the use of example(s) will not get above the middle of Level 2 (6 marks). Level 1 (1–3) Response may broadly discuss world cities but does not address the question and does not come to a convincing conclusion. Response is descriptive, knowledge is basic and understanding is poor. Level 0 (0) No creditable response.
What was in this paper
The subtopics covered by these 6 questions, and how many questions each got. Open one in a new tab to see every Cambridge question on it.
What you needed in this session
Cambridge’s own grade thresholds for 2025 Oct/Nov, Paper 2 · Variant 2. A higher threshold means an easier paper — the bar moves with how the cohort did.