Cambridge A Level Geography 9696 — 2023 May/June Paper 2 · Variant 3
9696/23/M/J/23 · 6 questions · 60 marks · ≈68 min
The question paper and its mark scheme, free to read here and free to download. This is Cambridge’s own paper, exactly as it was sat.
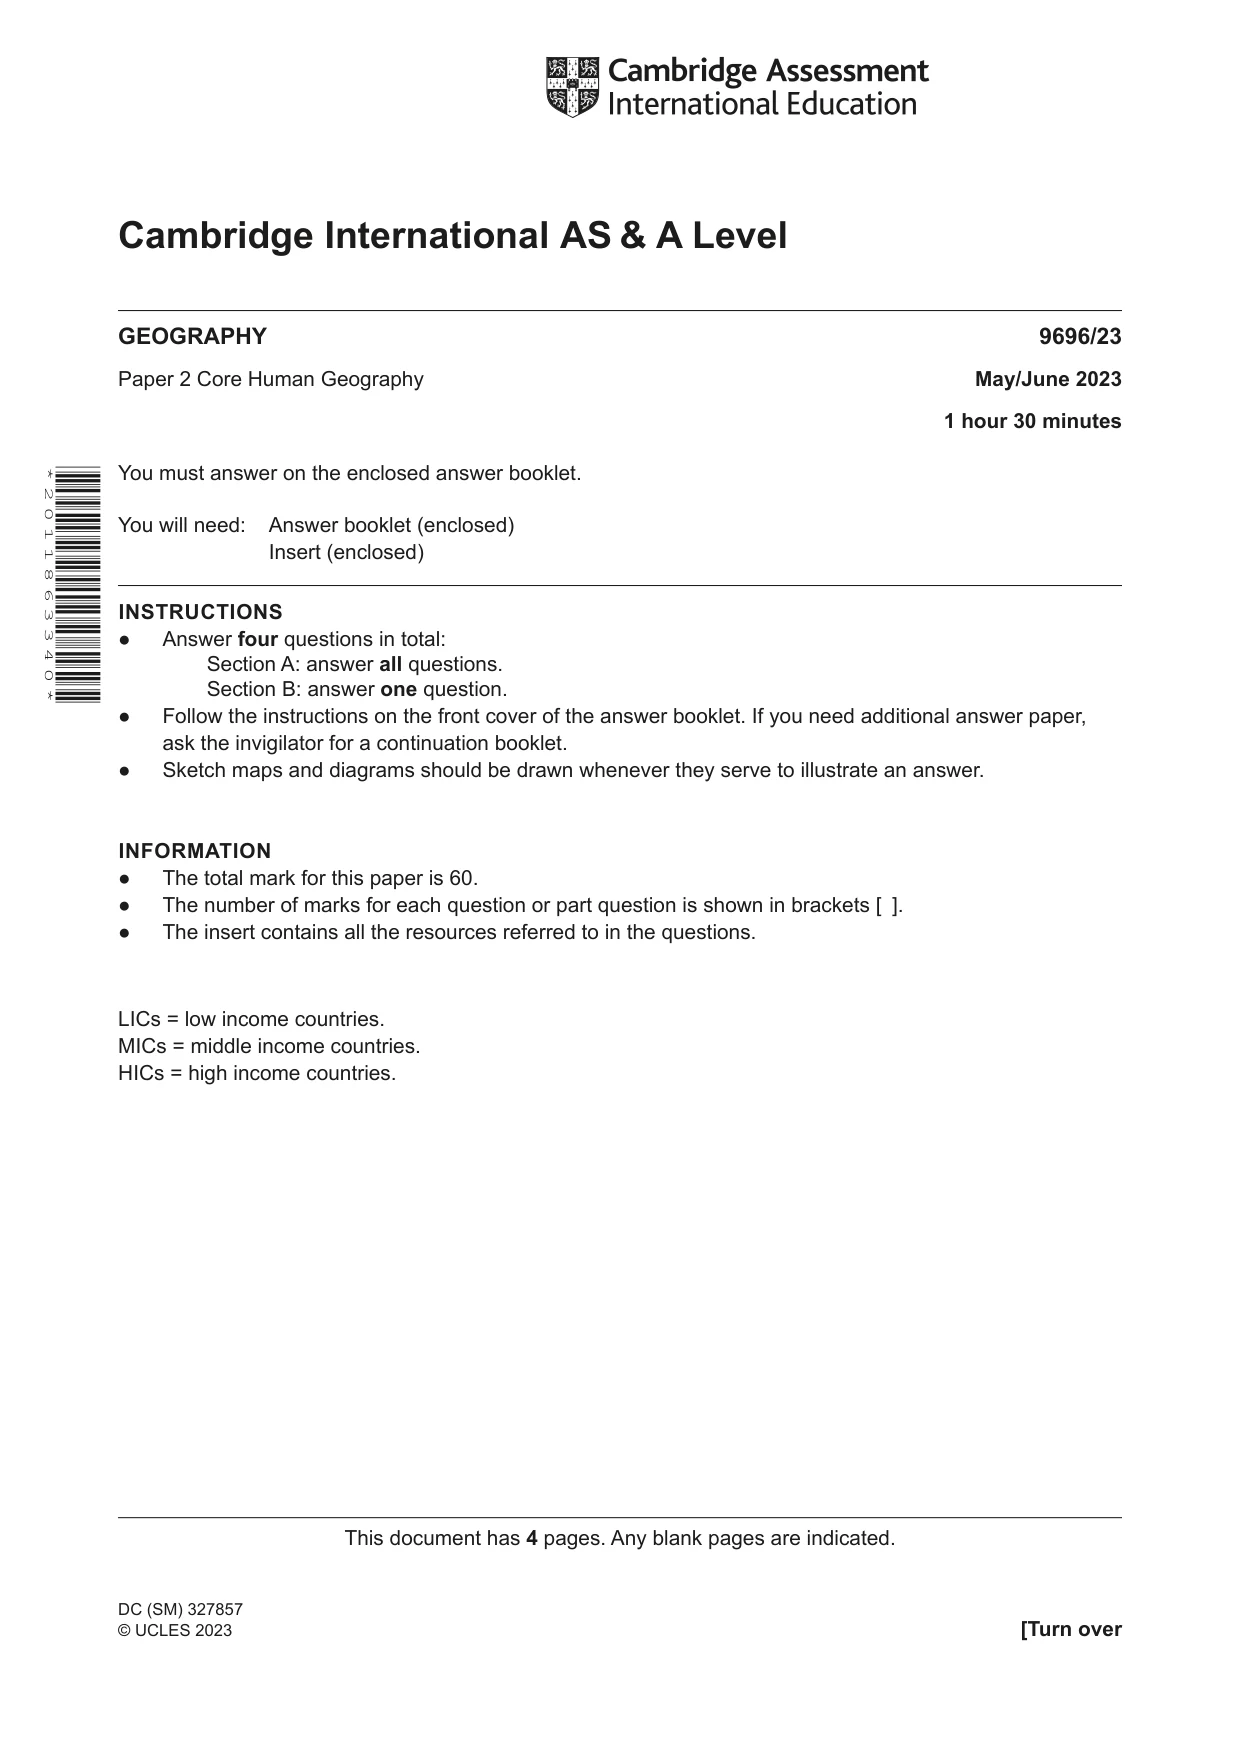
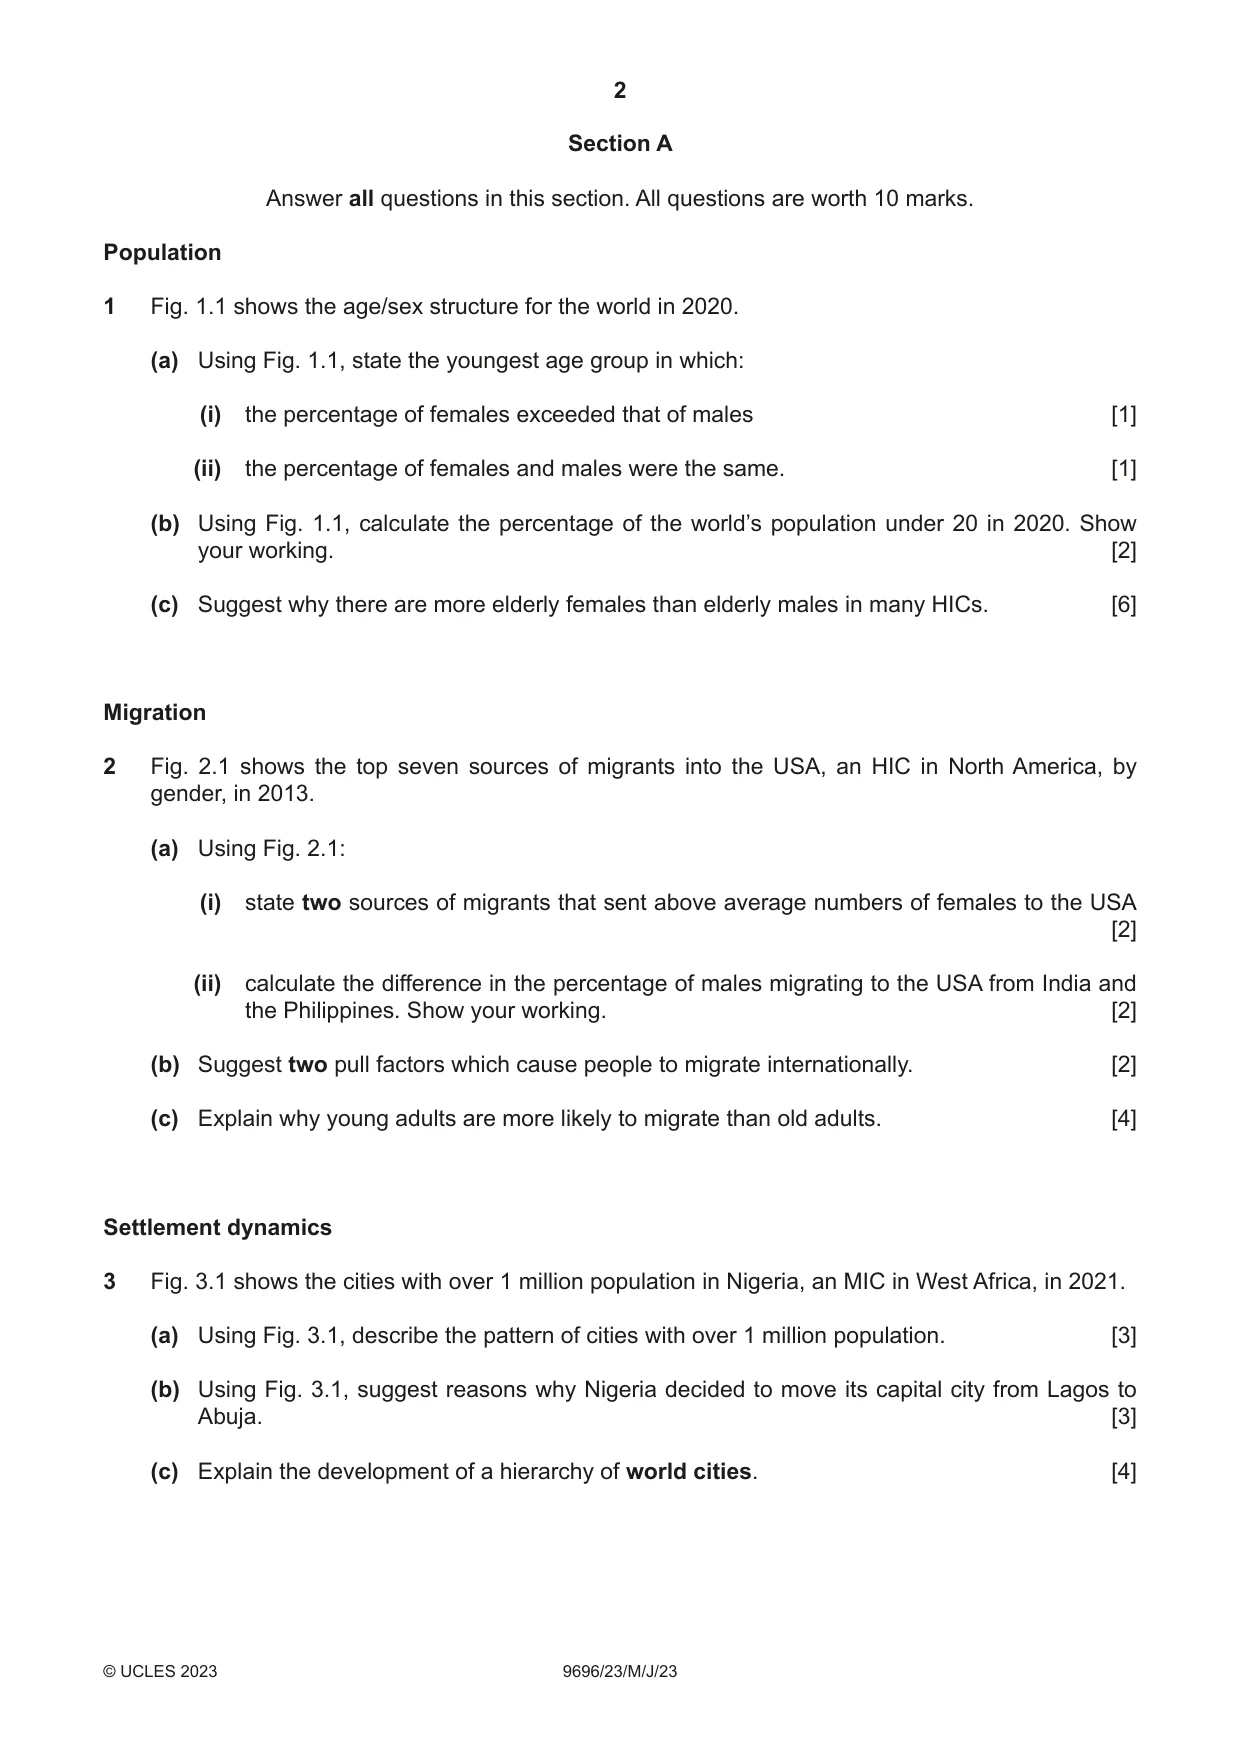
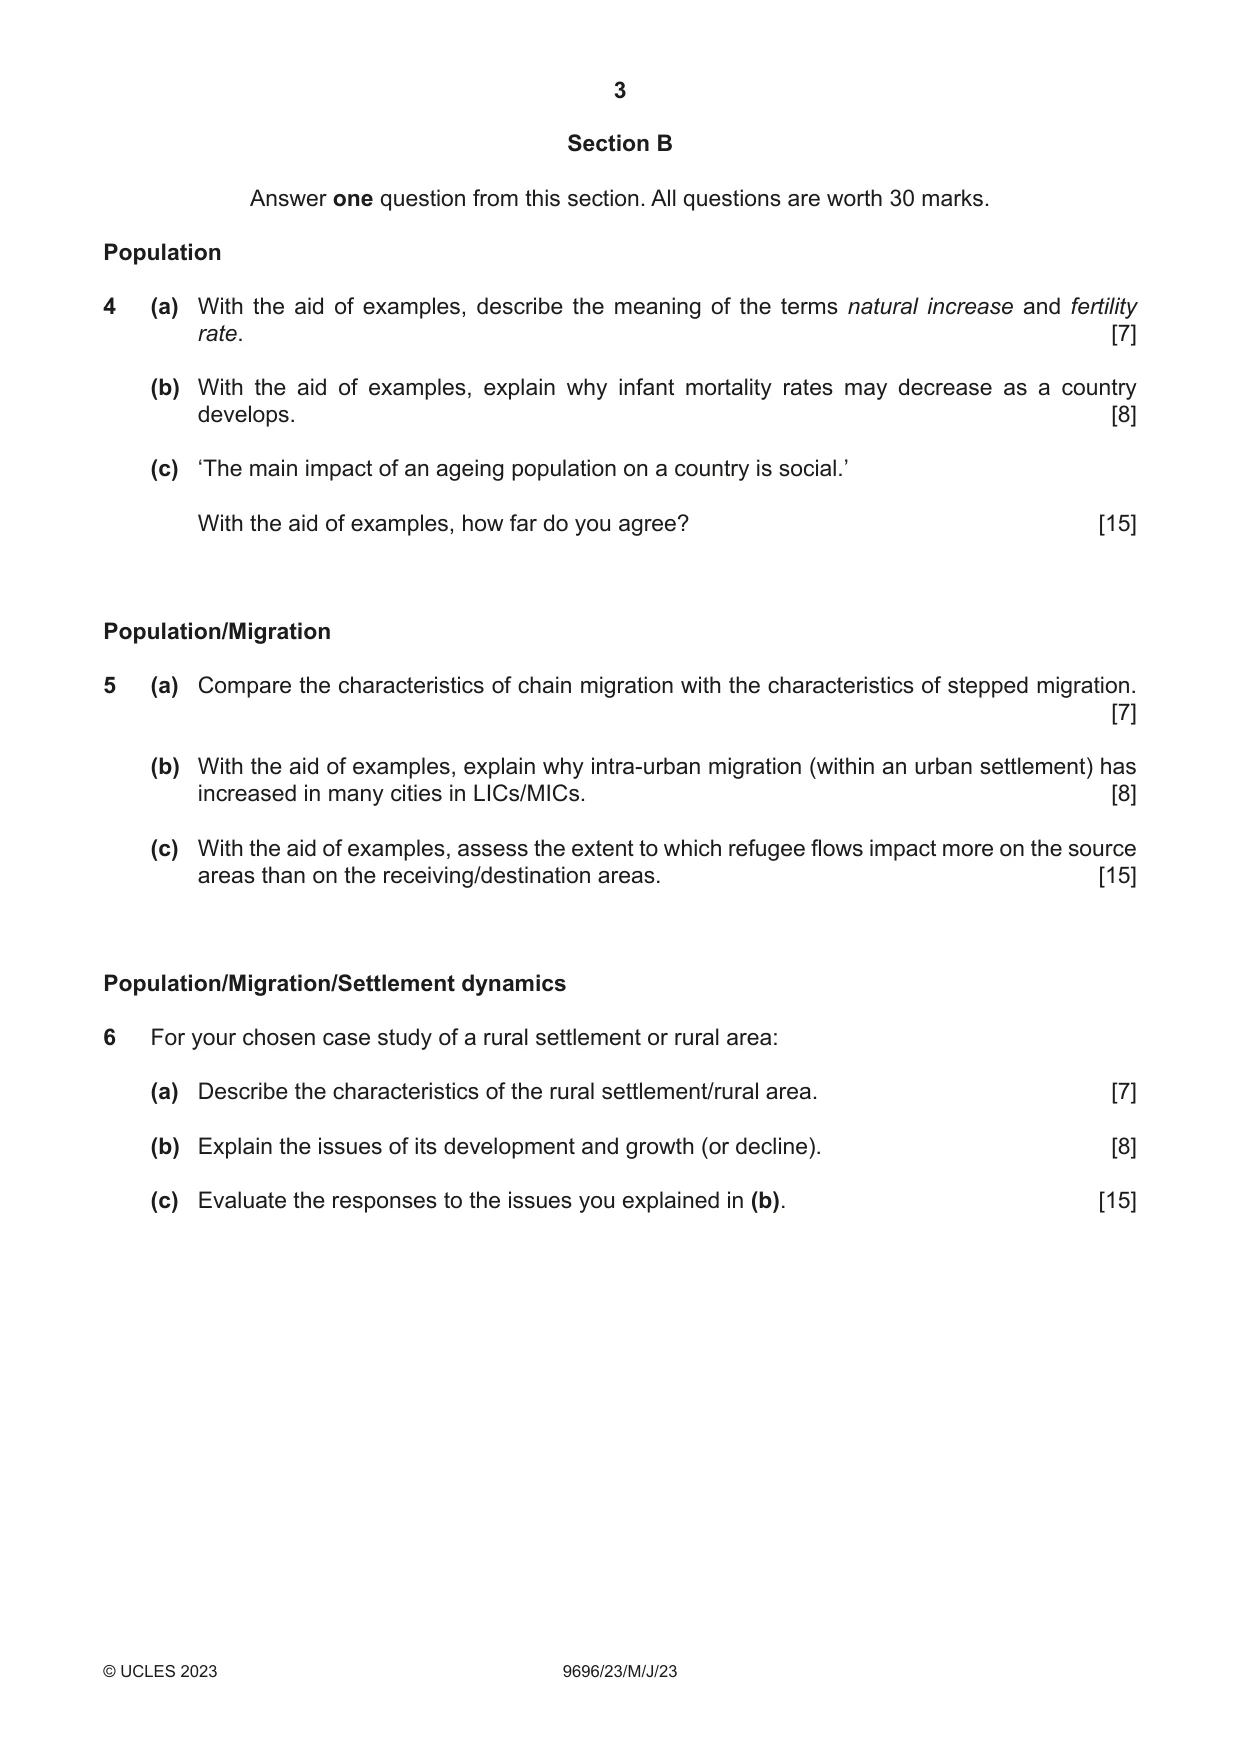
Question paper4 pages

Mark scheme18 pages
Answers below. Sit the paper first if you are practising.



Questions as text
Q1 · The age/sex structure for the world in 2020
1 Fig. 1.1 shows the age/sex structure for the world in 2020. (a) Using Fig. 1.1, state the youngest age group in which: (i) the percentage of females exceeded that of males [1] (ii) the percentage of females and males were the same. [1] (b) Using Fig. 1.1, calculate the percentage of the world’s population under 20 in 2020. Show your working. [2] (c) Suggest why there are more elderly females than elderly males in many HICs. [6] Migration
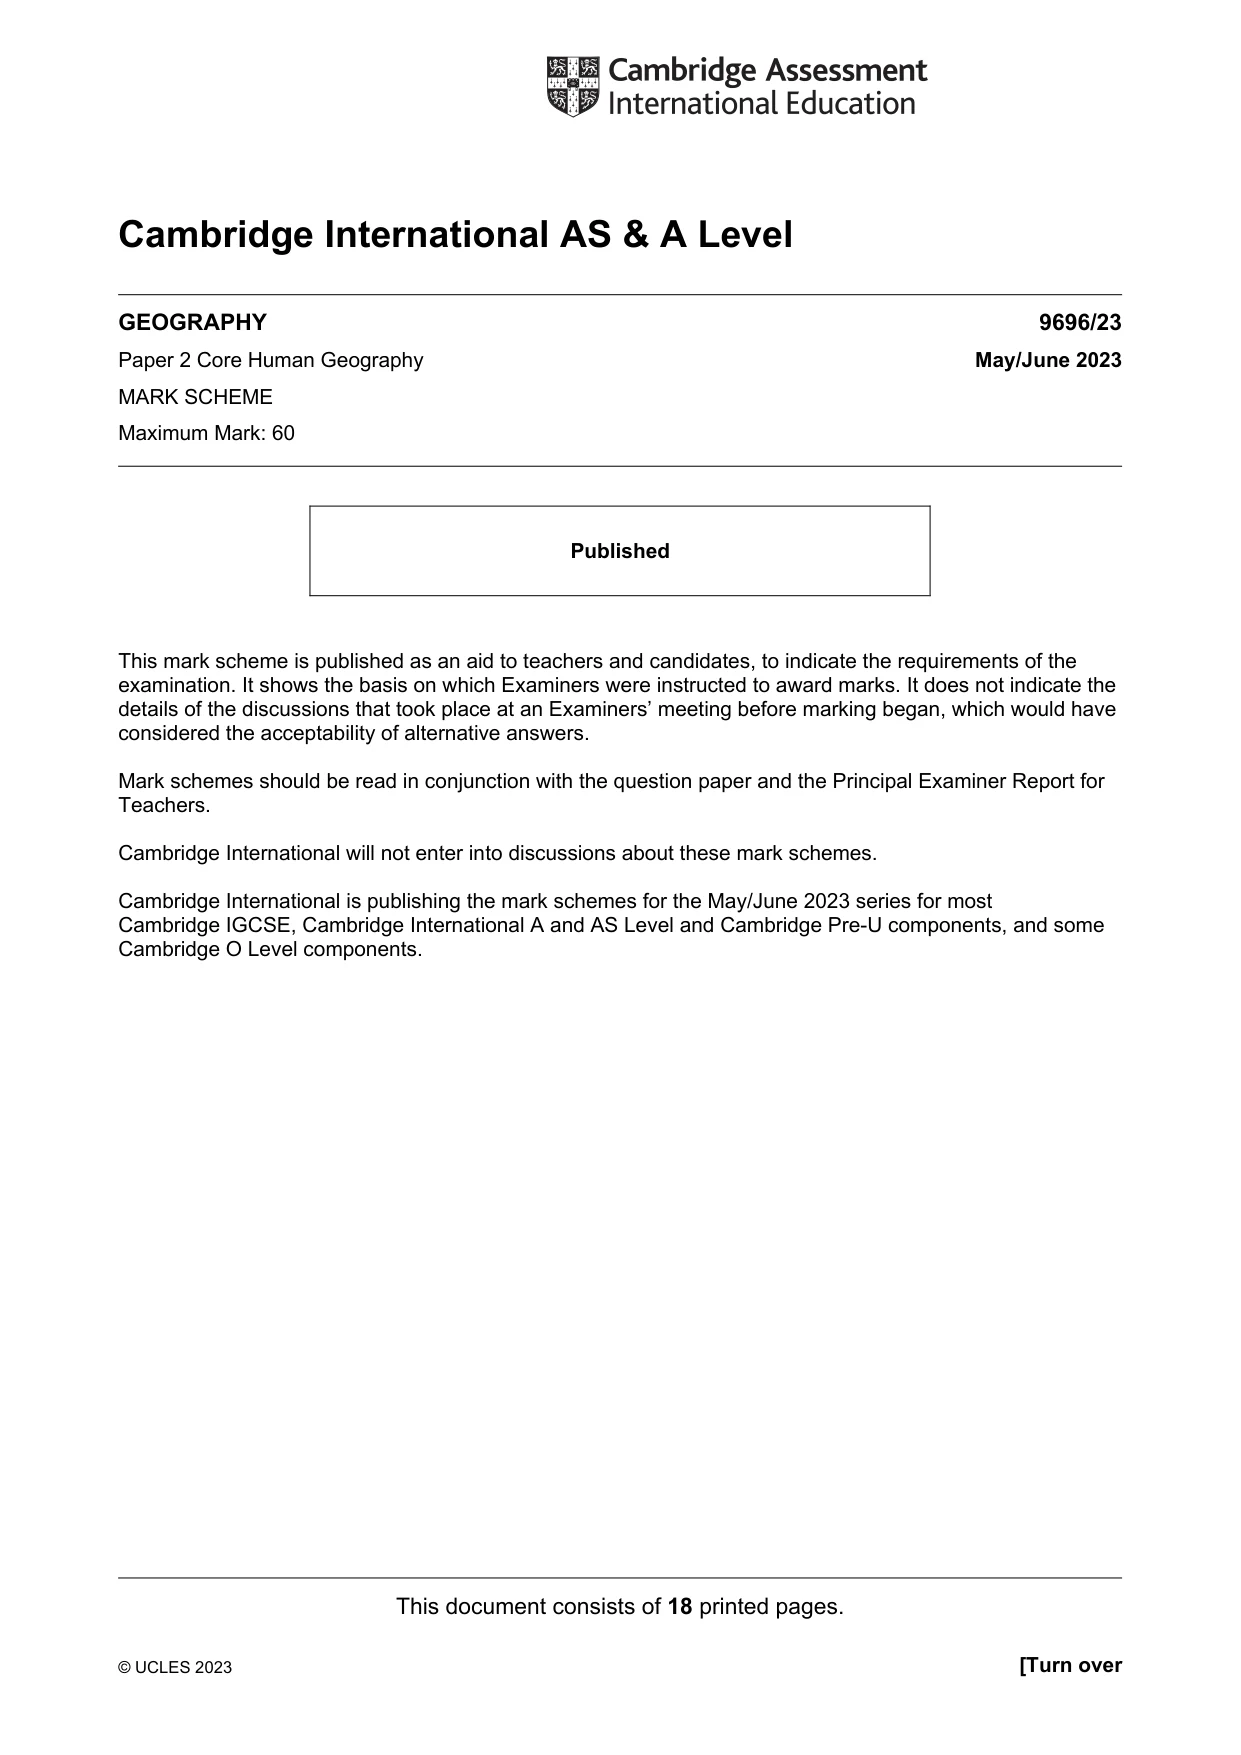
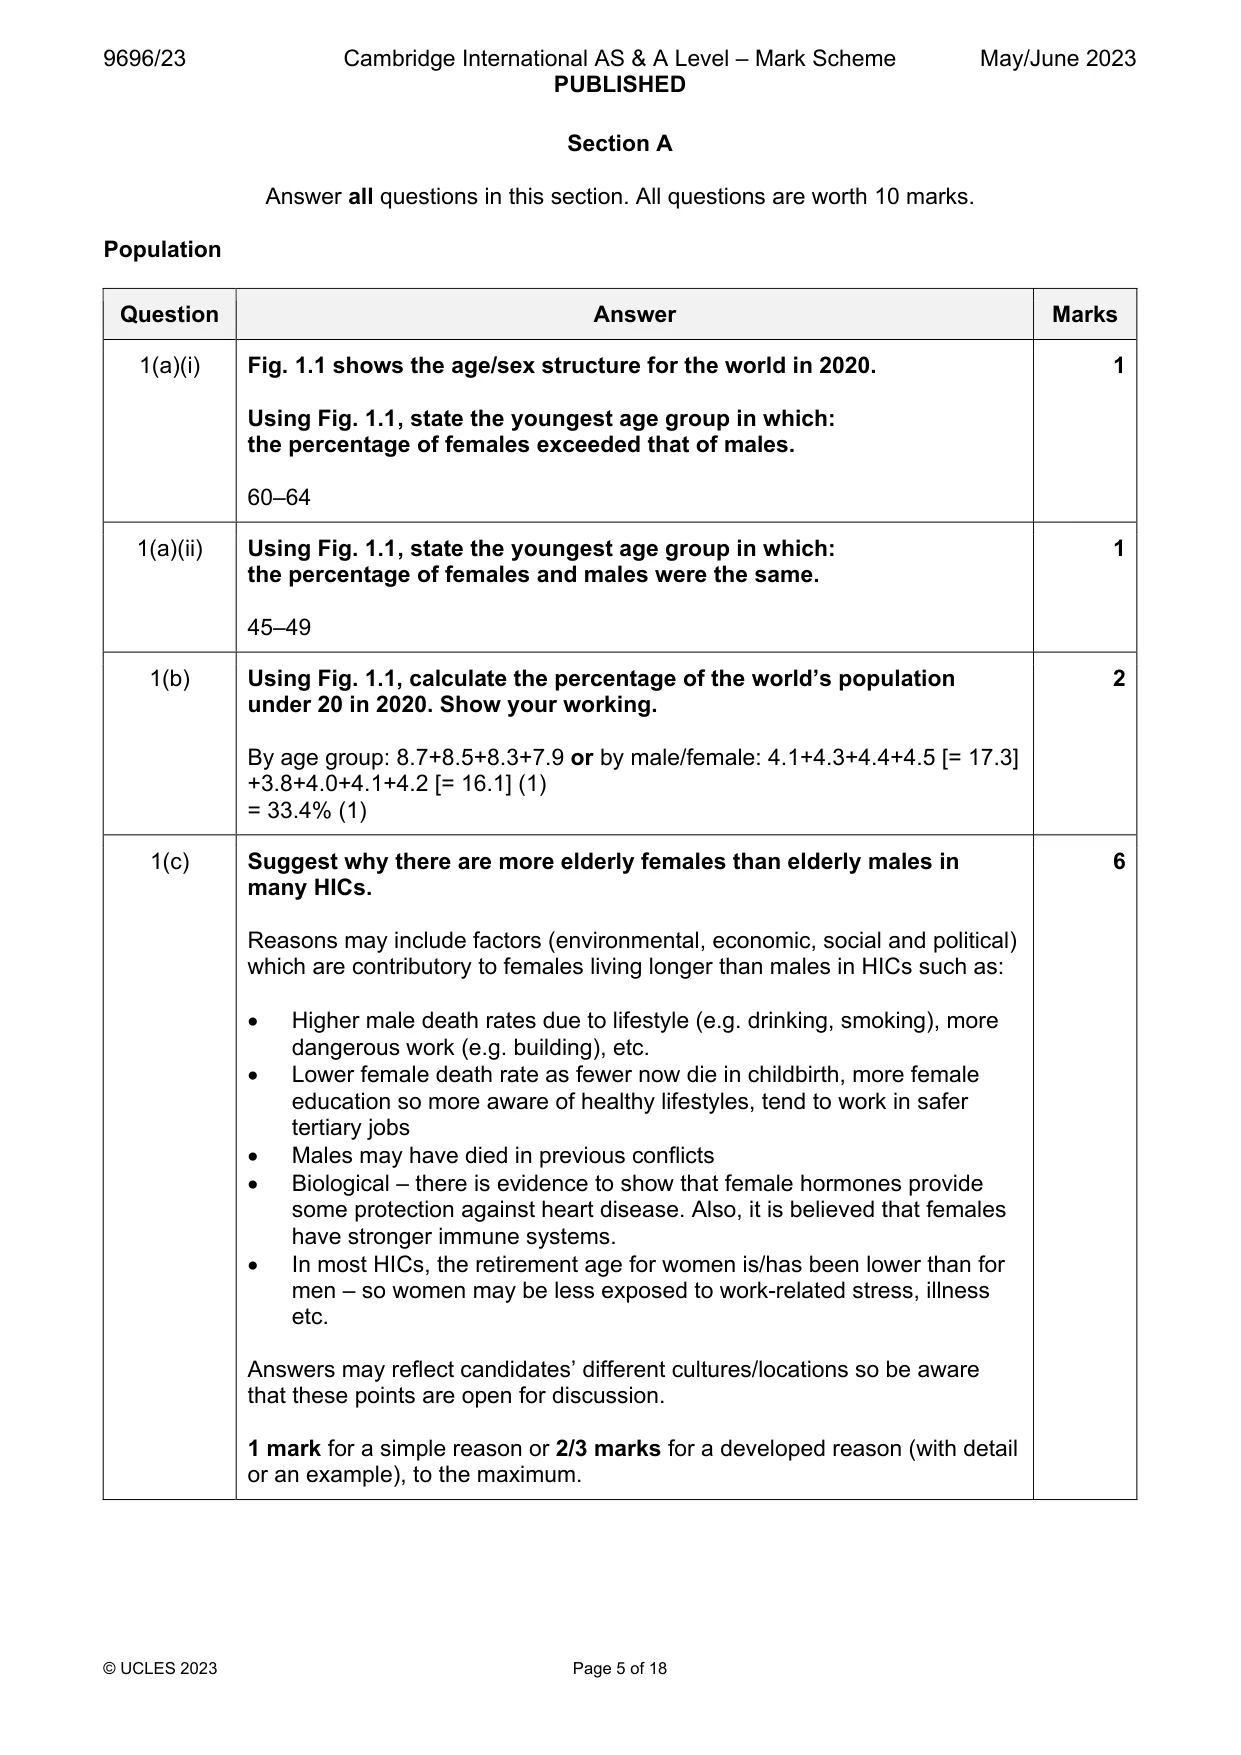
Mark scheme: Question Answer Marks 1(a)(i) Fig. 1.1 shows the age/sex structure for the world in 2020. 1 Using Fig. 1.1 , state the youngest age group in which: the percentage of females exceeded that of males. 60–64 1(a)(ii) Using Fig. 1.1 , state the youngest age group in which: 1 the percentage of females and males were the same. 45–49 1(b) Using Fig. 1.1, calculate the percentage of the world’s population 2 under 20 in 2020. Show your working. By age group: 8.7+8.5+8.3+7.9 or by male/female: 4.1+4.3+4.4+4.5 [= 17.3] +3.8+4.0+4.1+4.2 [= 16.1] (1) = 33.4% (1) 1(c) Suggest why there are more elderly females than elderly males in 6 many HICs. Reasons may include factors (environmental, economic, social and political) which are contributory to females living longer than males in HICs such as: Higher male death rates due to lifestyle (e.g. drinking, smoking), more dangerous work (e.g. building), etc. Lower female death rate as fewer now die in childbirth, more female education so more aware of healthy lifestyles, tend to work in safer tertiary jobs Males may have died in previous conflicts Biological – there is evidence to show that female hormones provide some protection against heart disease. Also, it is believed that females have stronger immune systems. In most HICs, the retirement age for women is/has been lower than for men – so women may be less exposed to work-related stress, illness etc. Answers may reflect candidates’ different cultures/locations so be aware that these points are open for discussion. 1 mark for a simple reason or 2/3 marks for a developed reason (with detail or an example), to the maximum. Migration
Q2 · The top seven sources of migrants into the USA, an HIC in North America, by gender, in…
2 Fig. 2.1 shows the top seven sources of migrants into the USA, an HIC in North America, by gender, in 2013. (a) Using Fig. 2.1: (i) state two sources of migrants that sent above average numbers of females to the USA [2] (ii) calculate the difference in the percentage of males migrating to the USA from India and the Philippines. Show your working. [2] (b) Suggest two pull factors which cause people to migrate internationally. [2] (c) Explain why young adults are more likely to migrate than old adults. [4] Settlement dynamics
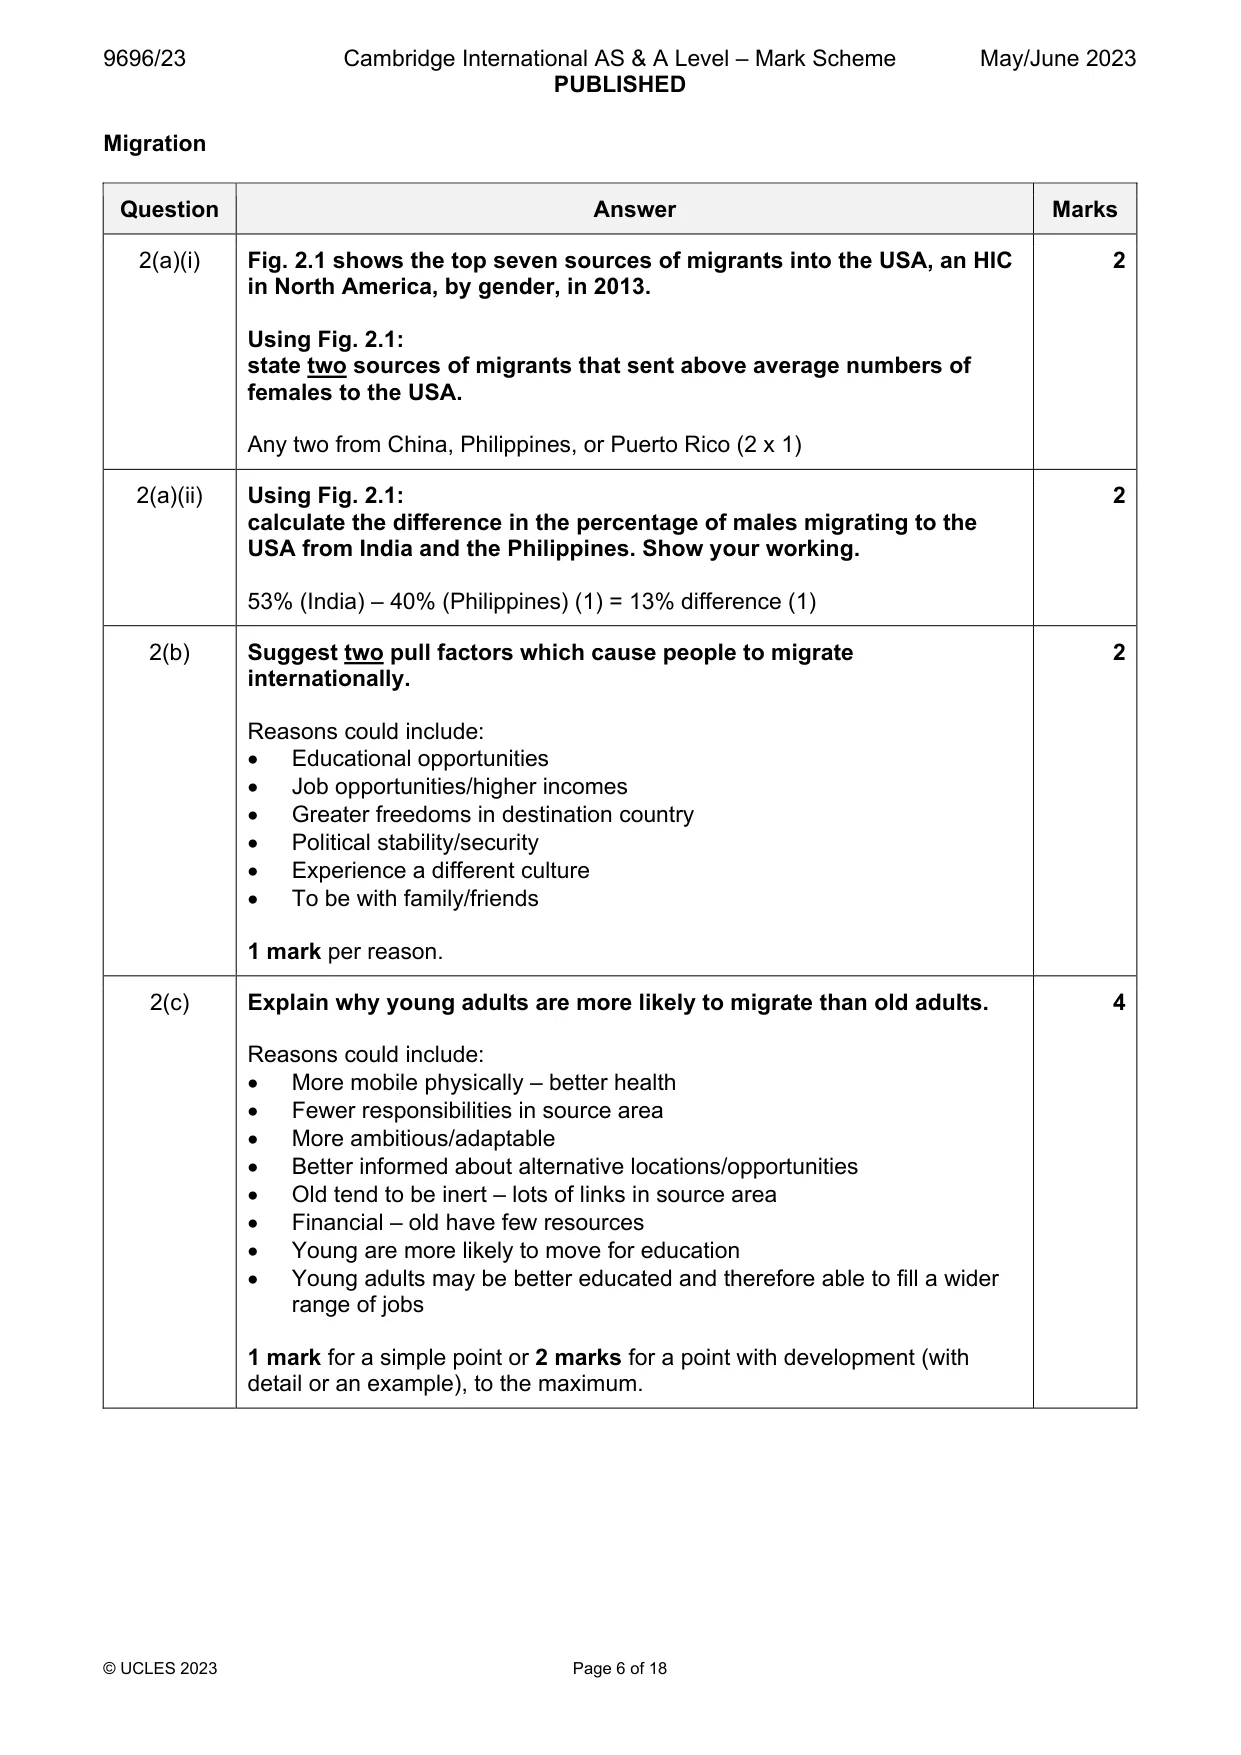
Mark scheme: 2(a)(i) Fig. 2.1 shows the top seven sources of migrants into the USA, an HIC 2 in North America, by gender, in 2013. Using Fig. 2.1: state two sources of migrants that sent above average numbers of females to the USA. Any two from China, Philippines, or Puerto Rico (2 x 1) 2(a)(ii) Using Fig. 2.1: 2 calculate the difference in the percentage of males migrating to the USA from India and the Philippines. Show your working. 53% (India) – 40% (Philippines) (1) = 13% difference (1) 2(b) Suggest two pull factors which cause people to migrate 2 internationally. Reasons could include: Educational opportunities Job opportunities/higher incomes Greater freedoms in destination country Political stability/security Experience a different culture To be with family/friends 1 mark per reason. 2(c) Explain why young adults are more likely to migrate than old adults. 4 Reasons could include: More mobile physically – better health Fewer responsibilities in source area More ambitious/adaptable Better informed about alternative locations/opportunities Old tend to be inert – lots of links in source area Financial – old have few resources Young are more likely to move for education Young adults may be better educated and therefore able to fill a wider range of jobs 1 mark for a simple point or 2 marks for a point with development (with detail or an example), to the maximum. Settlement dynamics
Q3 · The cities with over 1 million population in Nigeria, an MIC in West Africa, in 2021
3 Fig. 3.1 shows the cities with over 1 million population in Nigeria, an MIC in West Africa, in 2021. (a) Using Fig. 3.1, describe the pattern of cities with over 1 million population. [3] (b) Using Fig. 3.1, suggest reasons why Nigeria decided to move its capital city from Lagos to Abuja. [3] (c) Explain the development of a hierarchy of world cities. [4]
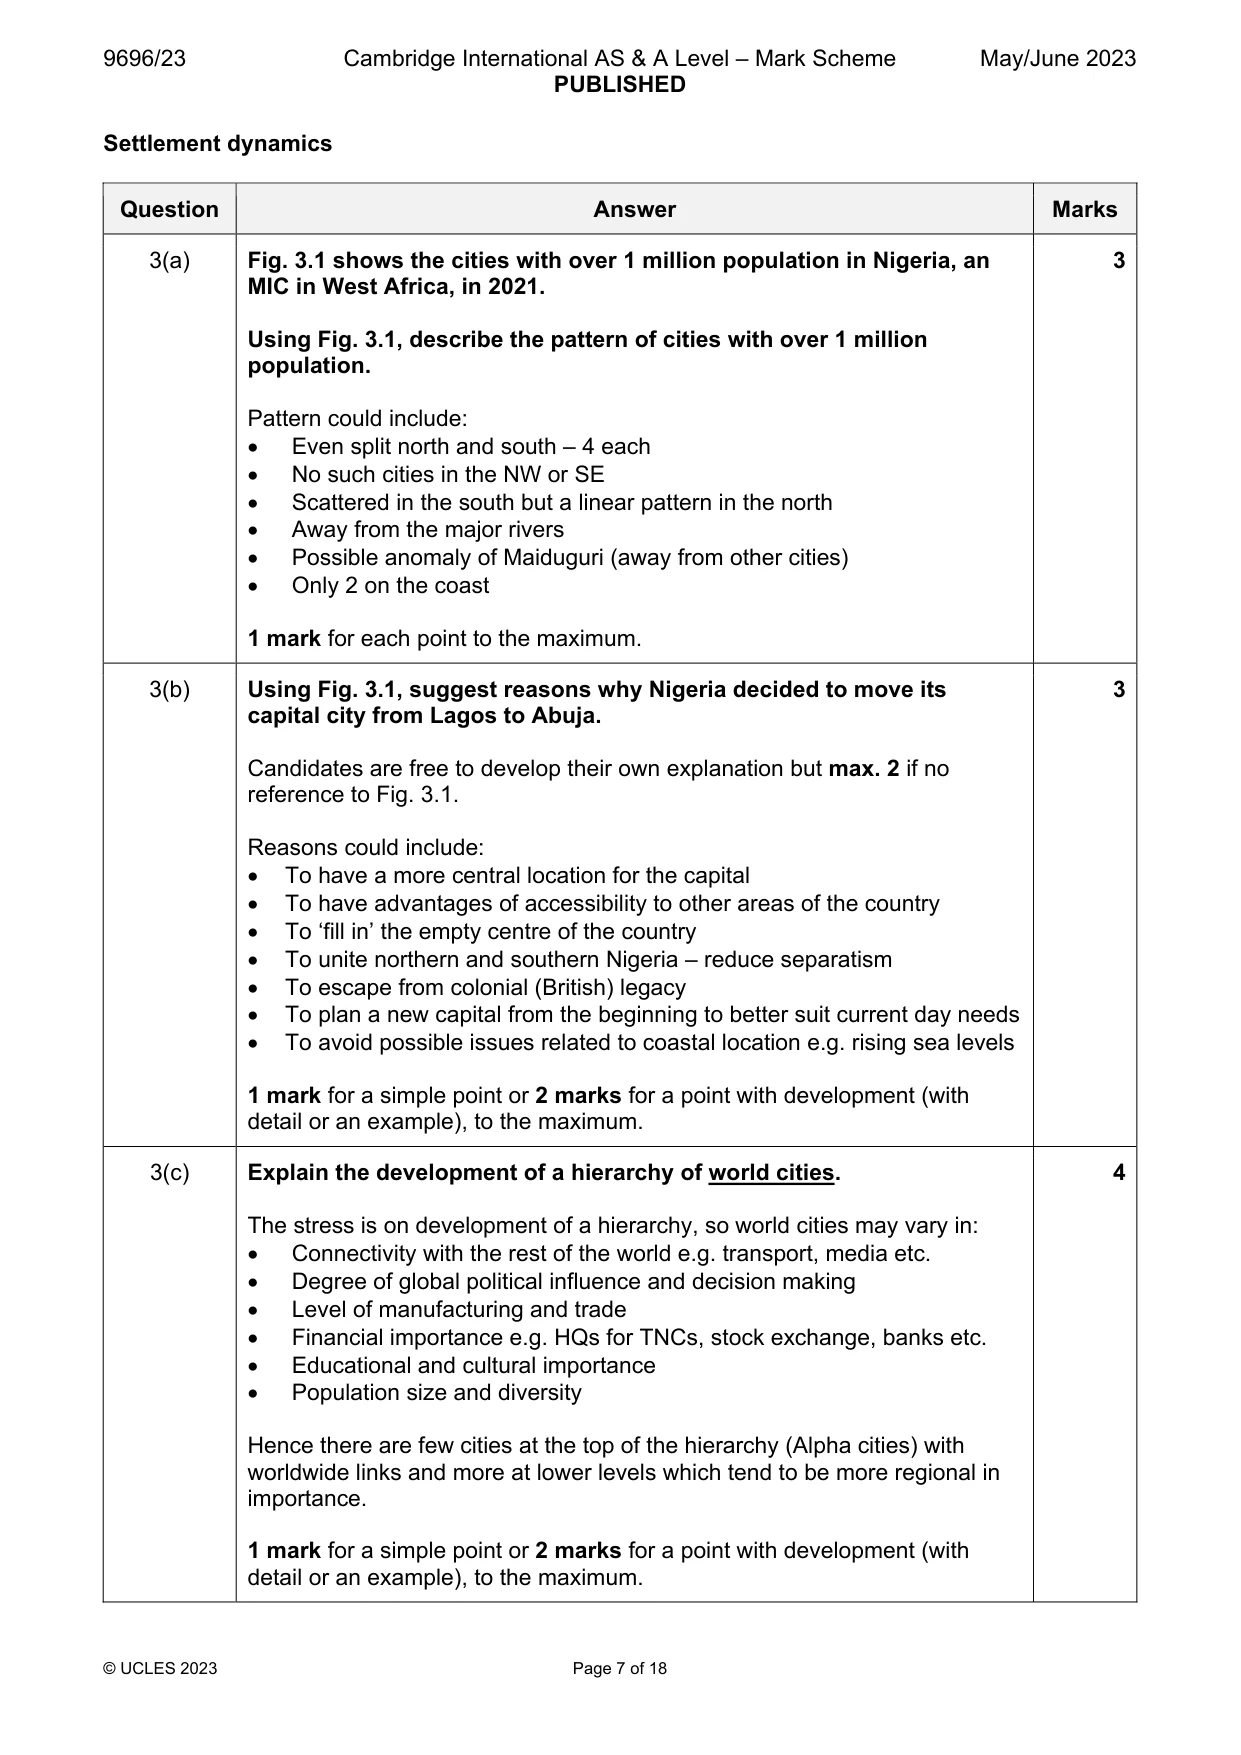
Mark scheme: 3(a) Fig. 3.1 shows the cities with over 1 million population in Nigeria, an 3 MIC in West Africa, in 2021. Using Fig. 3.1, describe the pattern of cities with over 1 million population. Pattern could include: Even split north and south – 4 each No such cities in the NW or SE Scattered in the south but a linear pattern in the north Away from the major rivers Possible anomaly of Maiduguri (away from other cities) Only 2 on the coast 1 mark for each point to the maximum. 3(b) Using Fig. 3.1, suggest reasons why Nigeria decided to move its 3 capital city from Lagos to Abuja. Candidates are free to develop their own explanation but max. 2 if no reference to Fig. 3.1. Reasons could include: To have a more central location for the capital To have advantages of accessibility to other areas of the country To ‘fill in’ the empty centre of the country To unite northern and southern Nigeria – reduce separatism To escape from colonial (British) legacy To plan a new capital from the beginning to better suit current day needs To avoid possible issues related to coastal location e.g. rising sea levels 1 mark for a simple point or 2 marks for a point with development (with detail or an example), to the maximum. 3(c) Explain the development of a hierarchy of world cities. 4 The stress is on development of a hierarchy, so world cities may vary in: Connectivity with the rest of the world e.g. transport, media etc. Degree of global political influence and decision making Level of manufacturing and trade Financial importance e.g. HQs for TNCs, stock exchange, banks etc. Educational and cultural importance Population size and diversity Hence there are few cities at the top of the hierarchy (Alpha cities) with worldwide links and more at lower levels which tend to be more regional in importance. 1 mark for a simple point or 2 marks for a point with development (with detail or an example), to the maximum. Section B Answer one question from this section. All questions are worth 30 marks. Population
Q4 · With the aid of examples, describe the meaning of the terms natural increase and…
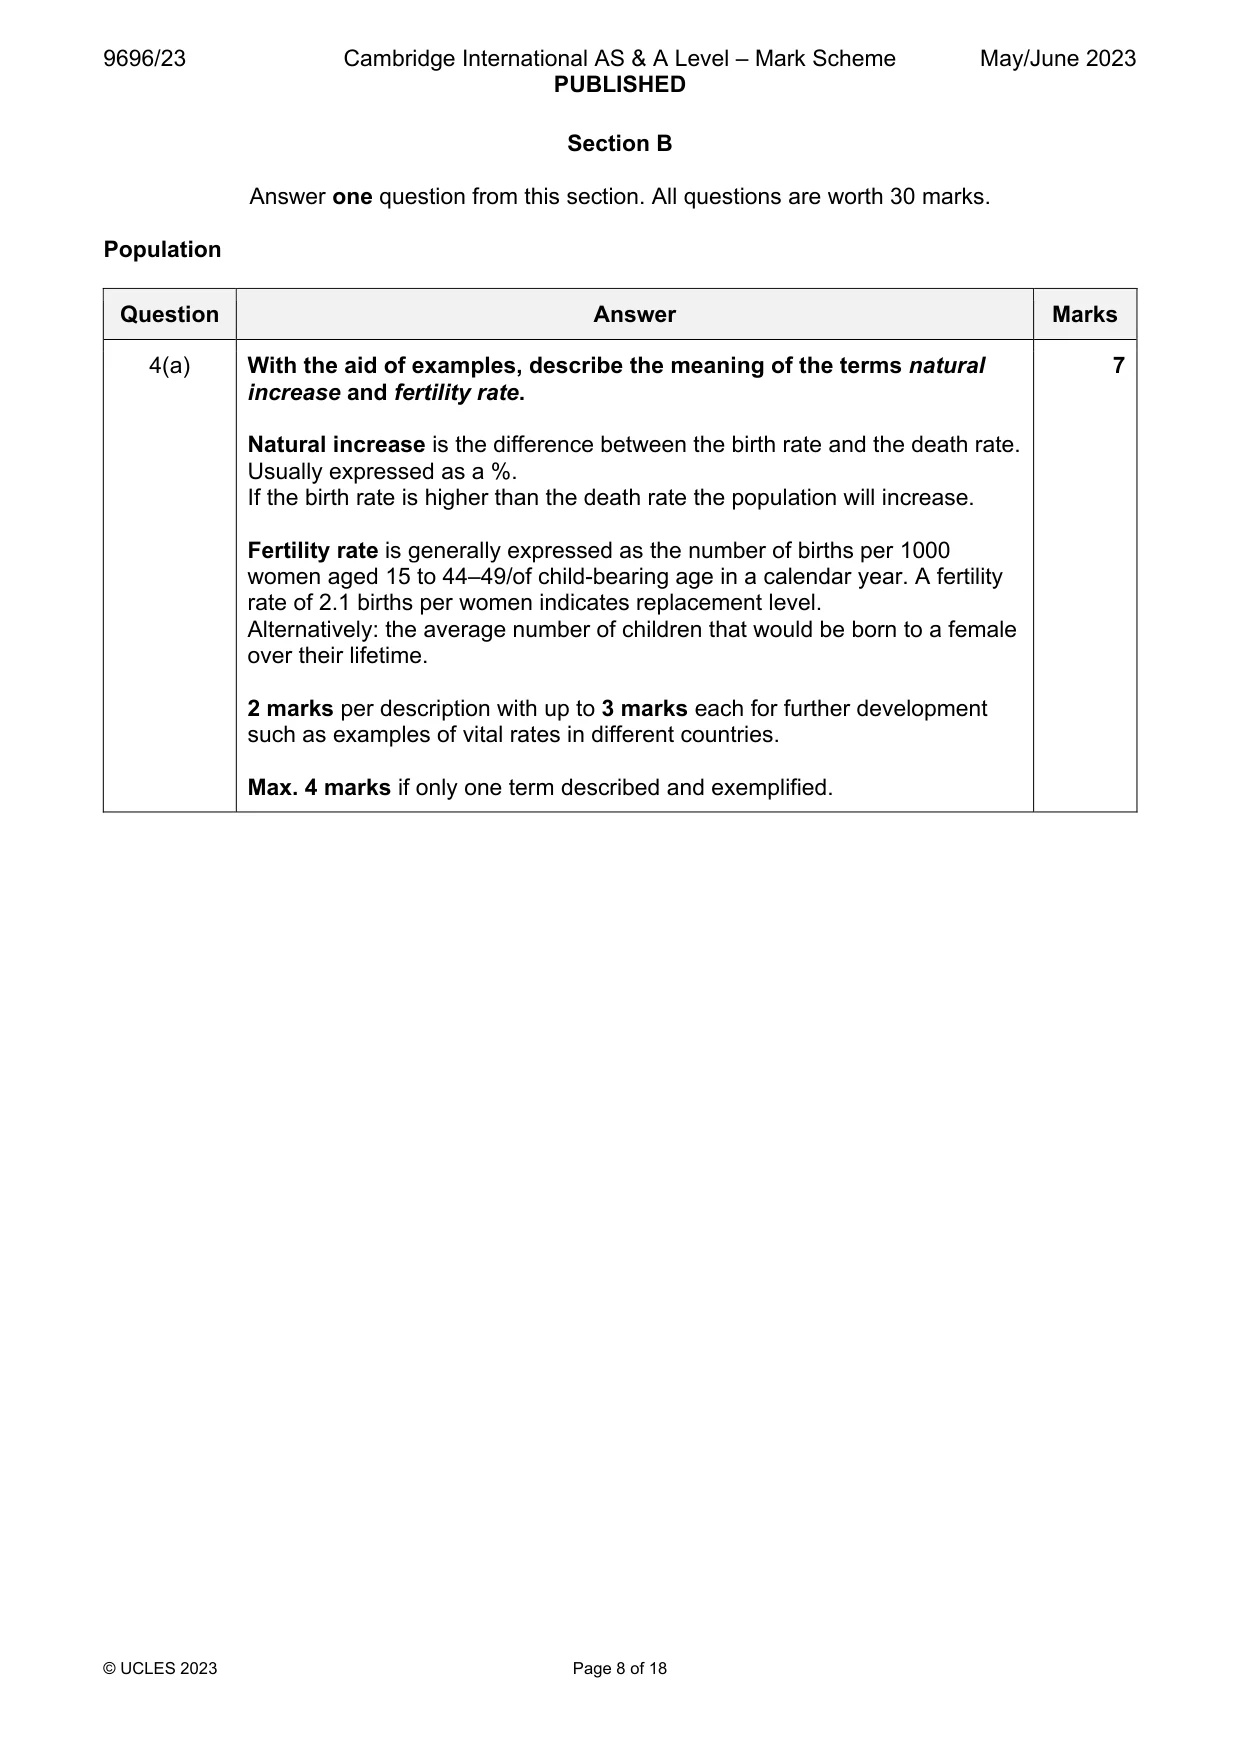
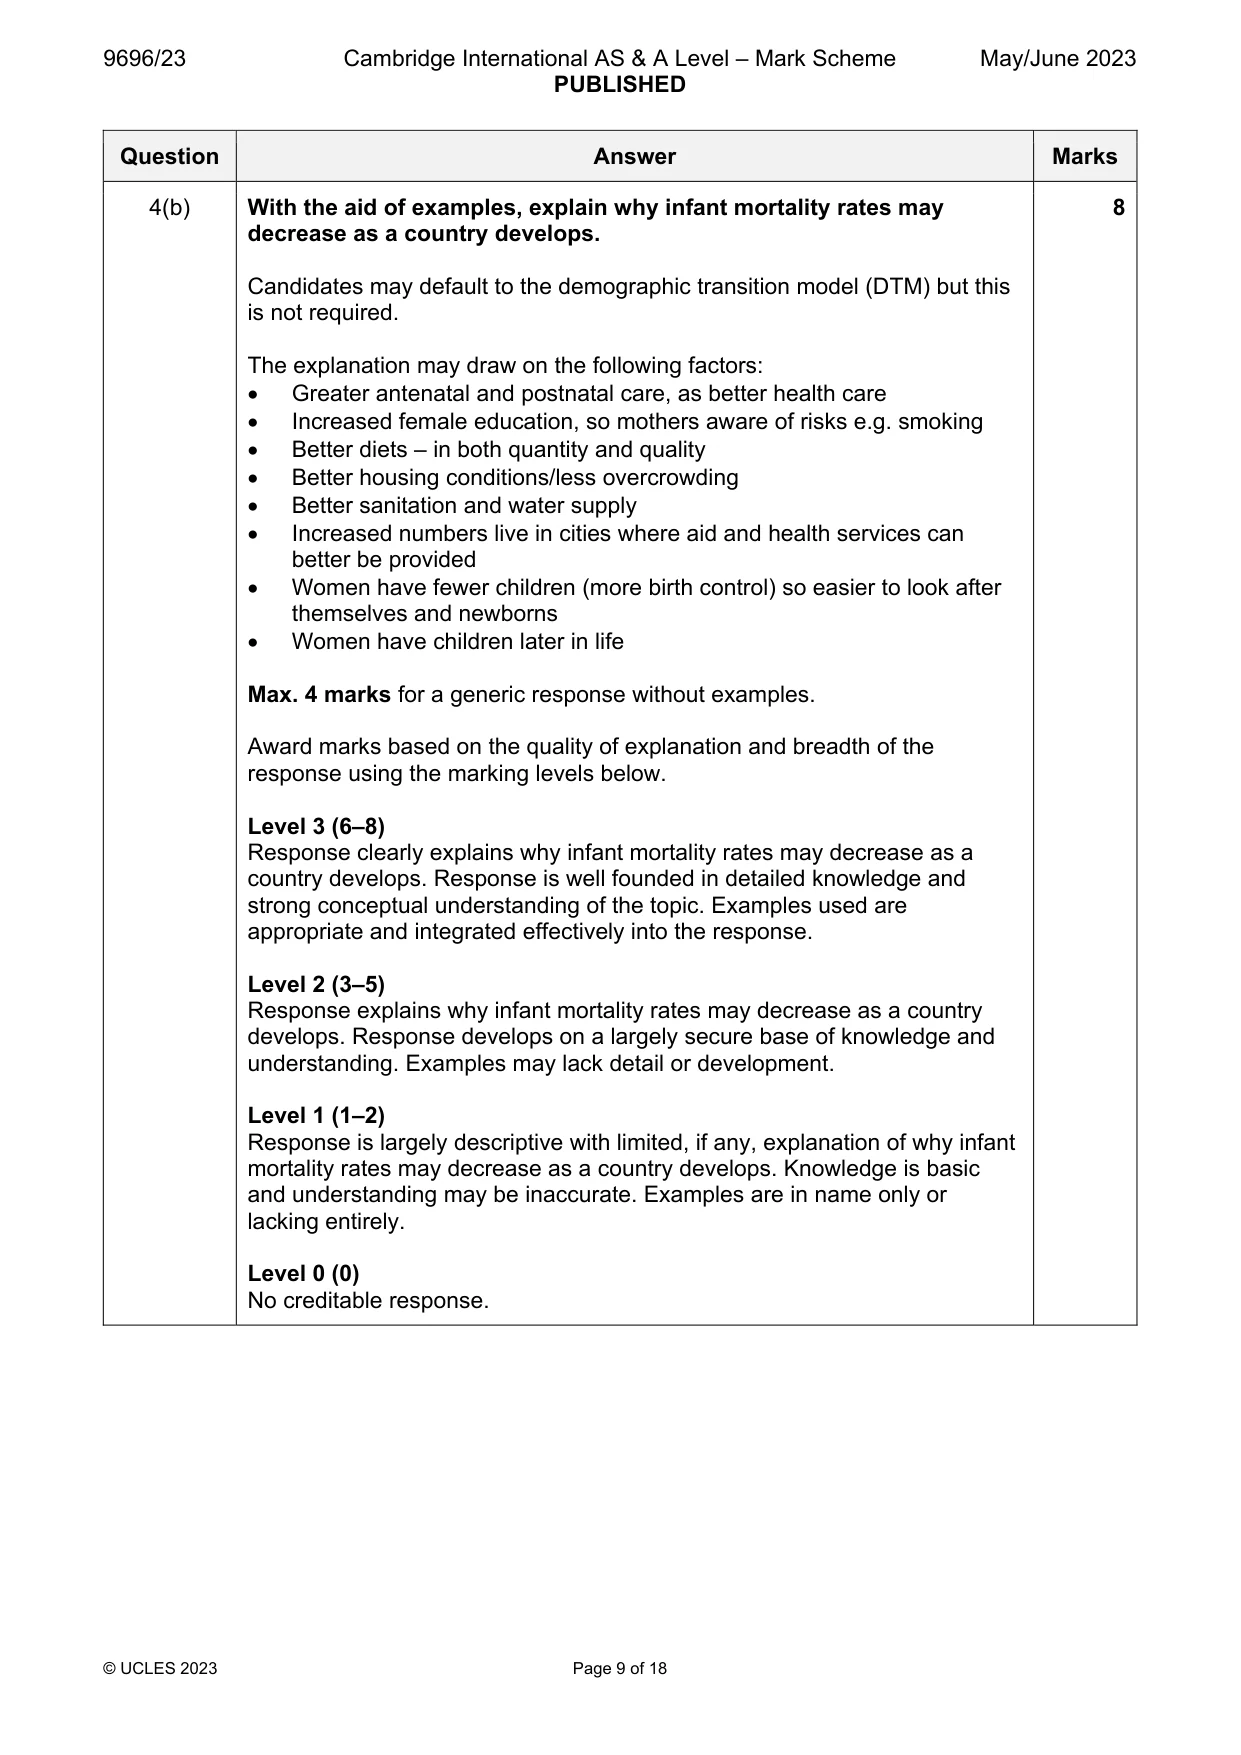
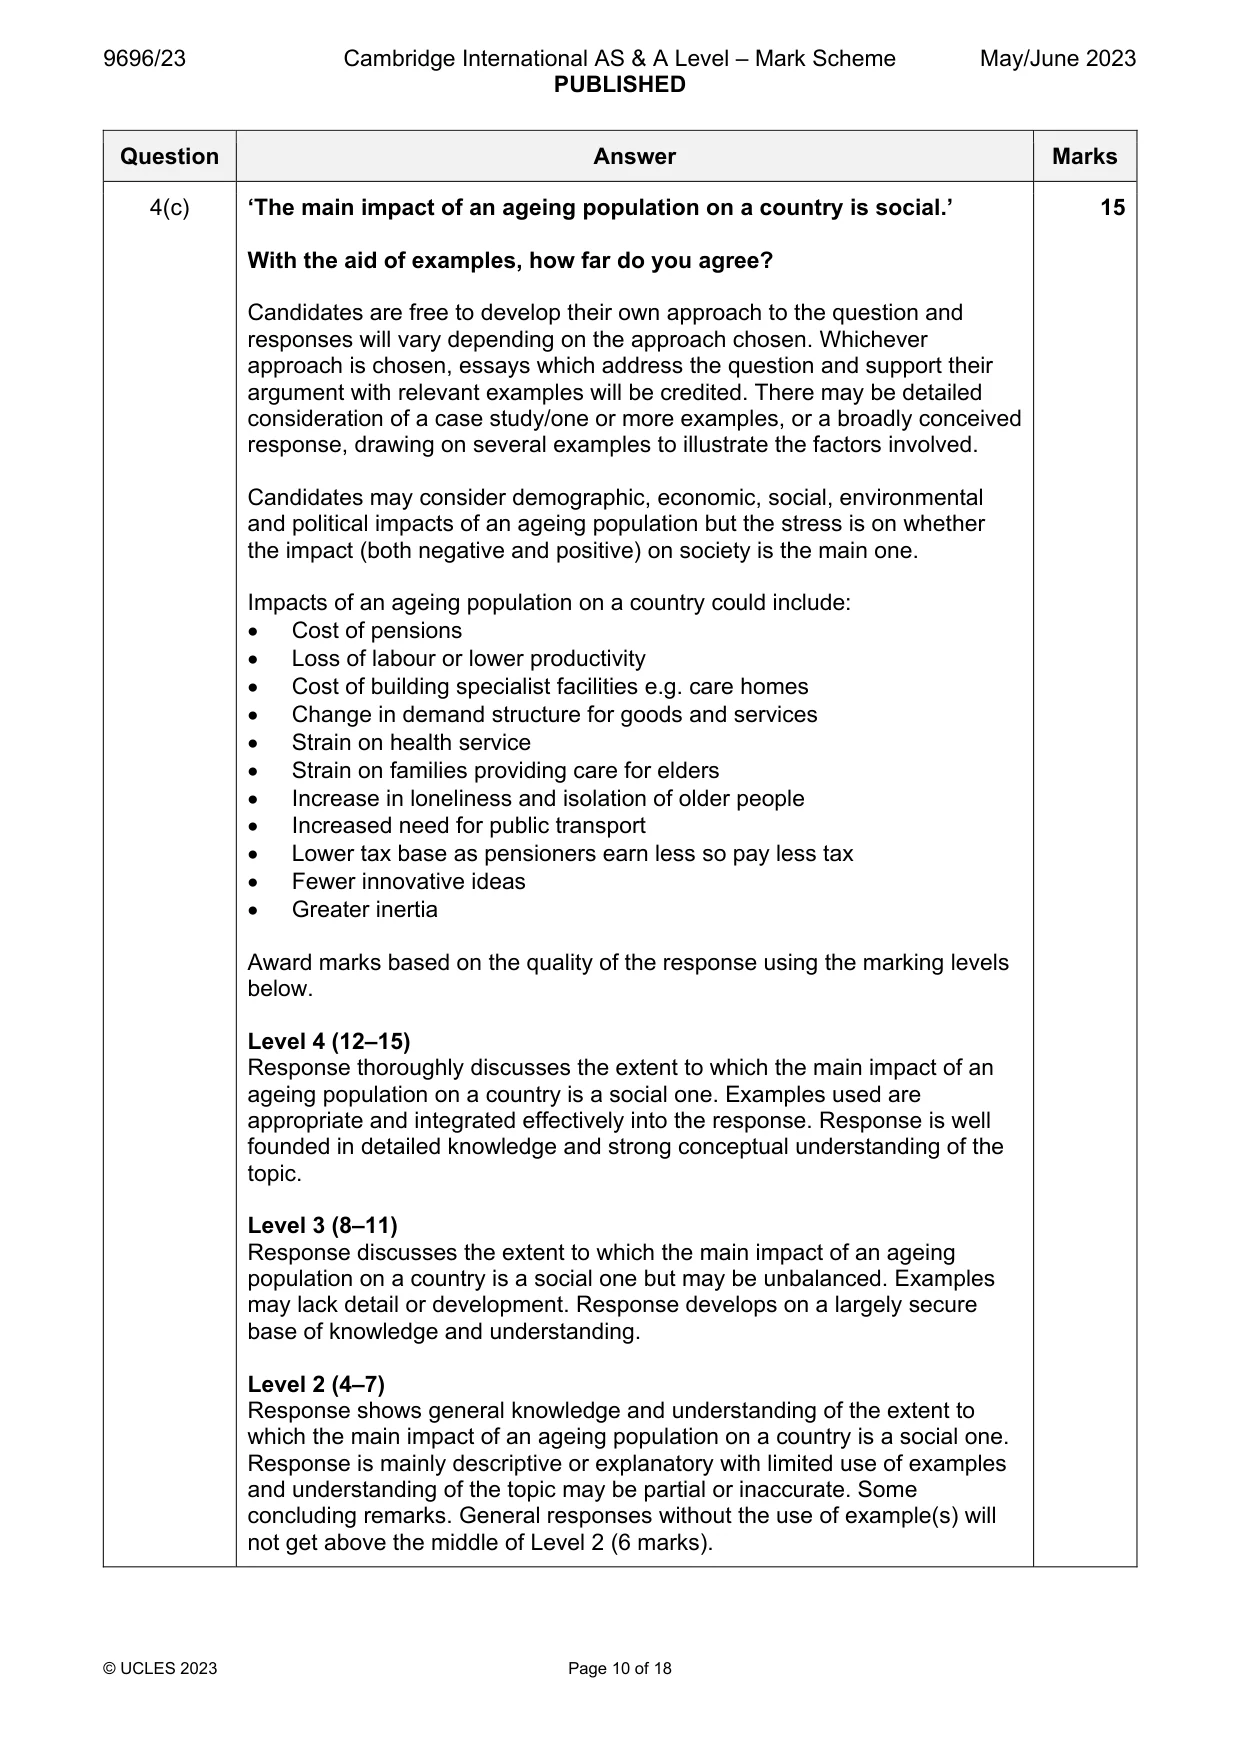
4 (a) With the aid of examples, describe the meaning of the terms natural increase and fertility rate. [7] (b) With the aid of examples, explain why infant mortality rates may decrease as a country develops. [8] (c) ‘The main impact of an ageing population on a country is social.’ With the aid of examples, how far do you agree? [15] Population/Migration
Mark scheme: 4(a) With the aid of examples, describe the meaning of the terms natural 7 increase and fertility rate. Natural increase is the difference between the birth rate and the death rate. Usually expressed as a %. If the birth rate is higher than the death rate the population will increase. Fertility rate is generally expressed as the number of births per 1000 women aged 15 to 44–49/of child-bearing age in a calendar year. A fertility rate of 2.1 births per women indicates replacement level. Alternatively: the average number of children that would be born to a female over their lifetime. 2 marks per description with up to 3 marks each for further development such as examples of vital rates in different countries. Max. 4 marks if only one term described and exemplified. 4(b) With the aid of examples, explain why infant mortality rates may 8 decrease as a country develops. Candidates may default to the demographic transition model (DTM) but this is not required. The explanation may draw on the following factors: Greater antenatal and postnatal care, as better health care Increased female education, so mothers aware of risks e.g. smoking Better diets – in both quantity and quality Better housing conditions/less overcrowding Better sanitation and water supply Increased numbers live in cities where aid and health services can better be provided Women have fewer children (more birth control) so easier to look after themselves and newborns Women have children later in life Max. 4 marks for a generic response without examples. Award marks based on the quality of explanation and breadth of the response using the marking levels below. Level 3 (6–8) Response clearly explains why infant mortality rates may decrease as a country develops. Response is well founded in detailed knowledge and strong conceptual understanding of the topic. Examples used are appropriate and integrated effectively into the response. Level 2 (3–5) Response explains why infant mortality rates may decrease as a country develops. Response develops on a largely secure base of knowledge and understanding. Examples may lack detail or development. Level 1 (1–2) Response is largely descriptive with limited, if any, explanation of why infant mortality rates may decrease as a country develops. Knowledge is basic and understanding may be inaccurate. Examples are in name only or lacking entirely. Level 0 (0) No creditable response. 4(c) ‘The main impact of an ageing population on a country is social.’ 15 With the aid of examples, how far do you agree? Candidates are free to develop their own approach to the question and responses will vary depending on the approach chosen. Whichever approach is chosen, essays which address the question and support their argument with relevant examples will be credited. There may be detailed consideration of a case study/one or more examples, or a broadly conceived response, drawing on several examples to illustrate the factors involved. Candidates may consider demographic, economic, social, environmental and political impacts of an ageing population but the stress is on whether the impact (both negative and positive) on society is the main one. Impacts of an ageing population on a country could include: Cost of pensions Loss of labour or lower productivity Cost of building specialist facilities e.g. care homes Change in demand structure for goods and services Strain on health service Strain on families providing care for elders Increase in loneliness and isolation of older people Increased need for public transport Lower tax base as pensioners earn less so pay less tax Fewer innovative ideas Greater inertia Award marks based on the quality of the response using the marking levels below. Level 4 (12–15) Response thoroughly discusses the extent to which the main impact of an ageing population on a country is a social one. Examples used are appropriate and integrated effectively into the response. Response is well founded in detailed knowledge and strong conceptual understanding of the topic. Level 3 (8–11) Response discusses the extent to which the main impact of an ageing population on a country is a social one but may be unbalanced. Examples may lack detail or development. Response develops on a largely secure base of knowledge and understanding. Level 2 (4–7) Response shows general knowledge and understanding of the extent to which the main impact of an ageing population on a country is a social one. Response is mainly descriptive or explanatory with limited use of examples and understanding of the topic may be partial or inaccurate. Some concluding remarks. General responses without the use of example(s) will not get above the middle of Level 2 (6 marks). 4(c) Level 1 (1–3) Response may broadly discuss the role of an ageing population but does not address the question and does not come to a convincing conclusion. Response is descriptive, knowledge is basic and understanding is poor. Level 0 (0) No creditable response. Population/Migration
Q5 · Compare the characteristics of chain migration with the characteristics of stepped…
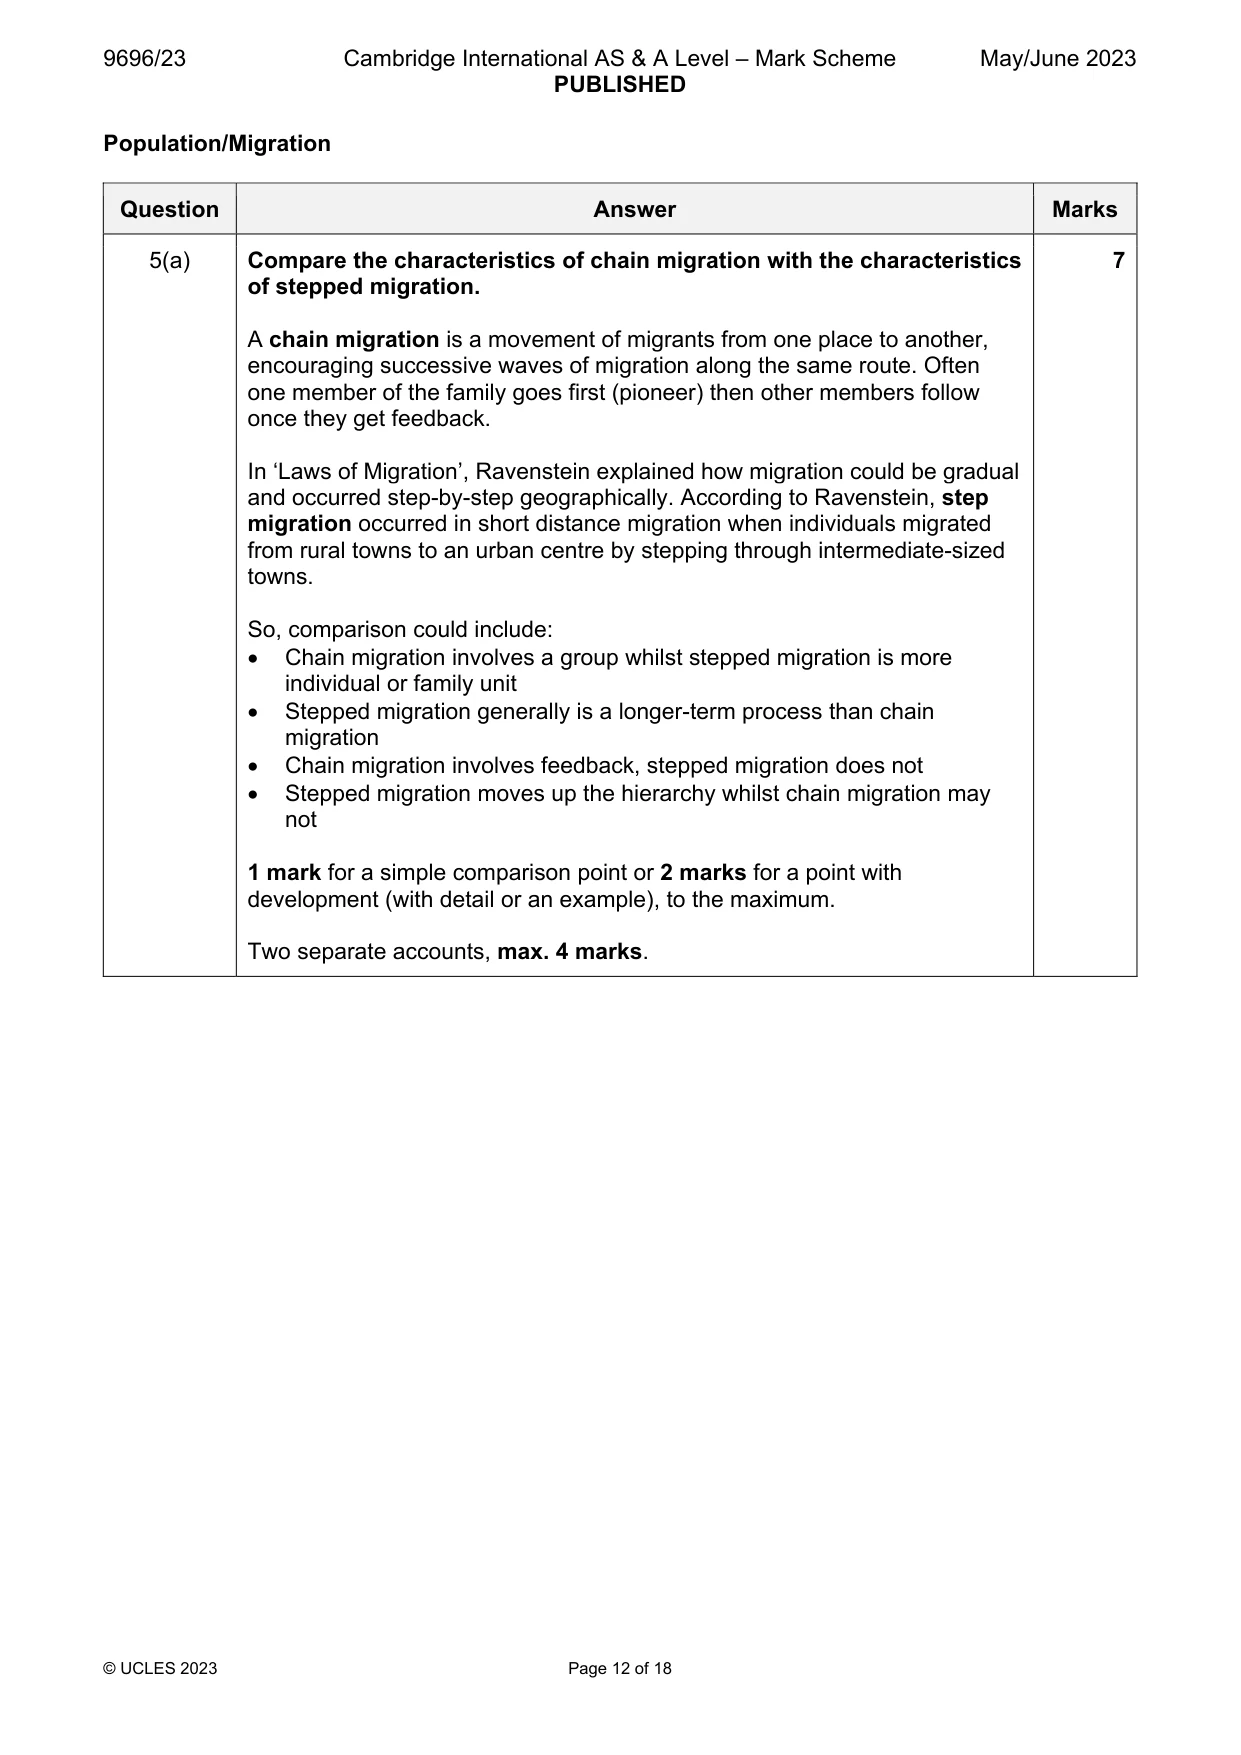
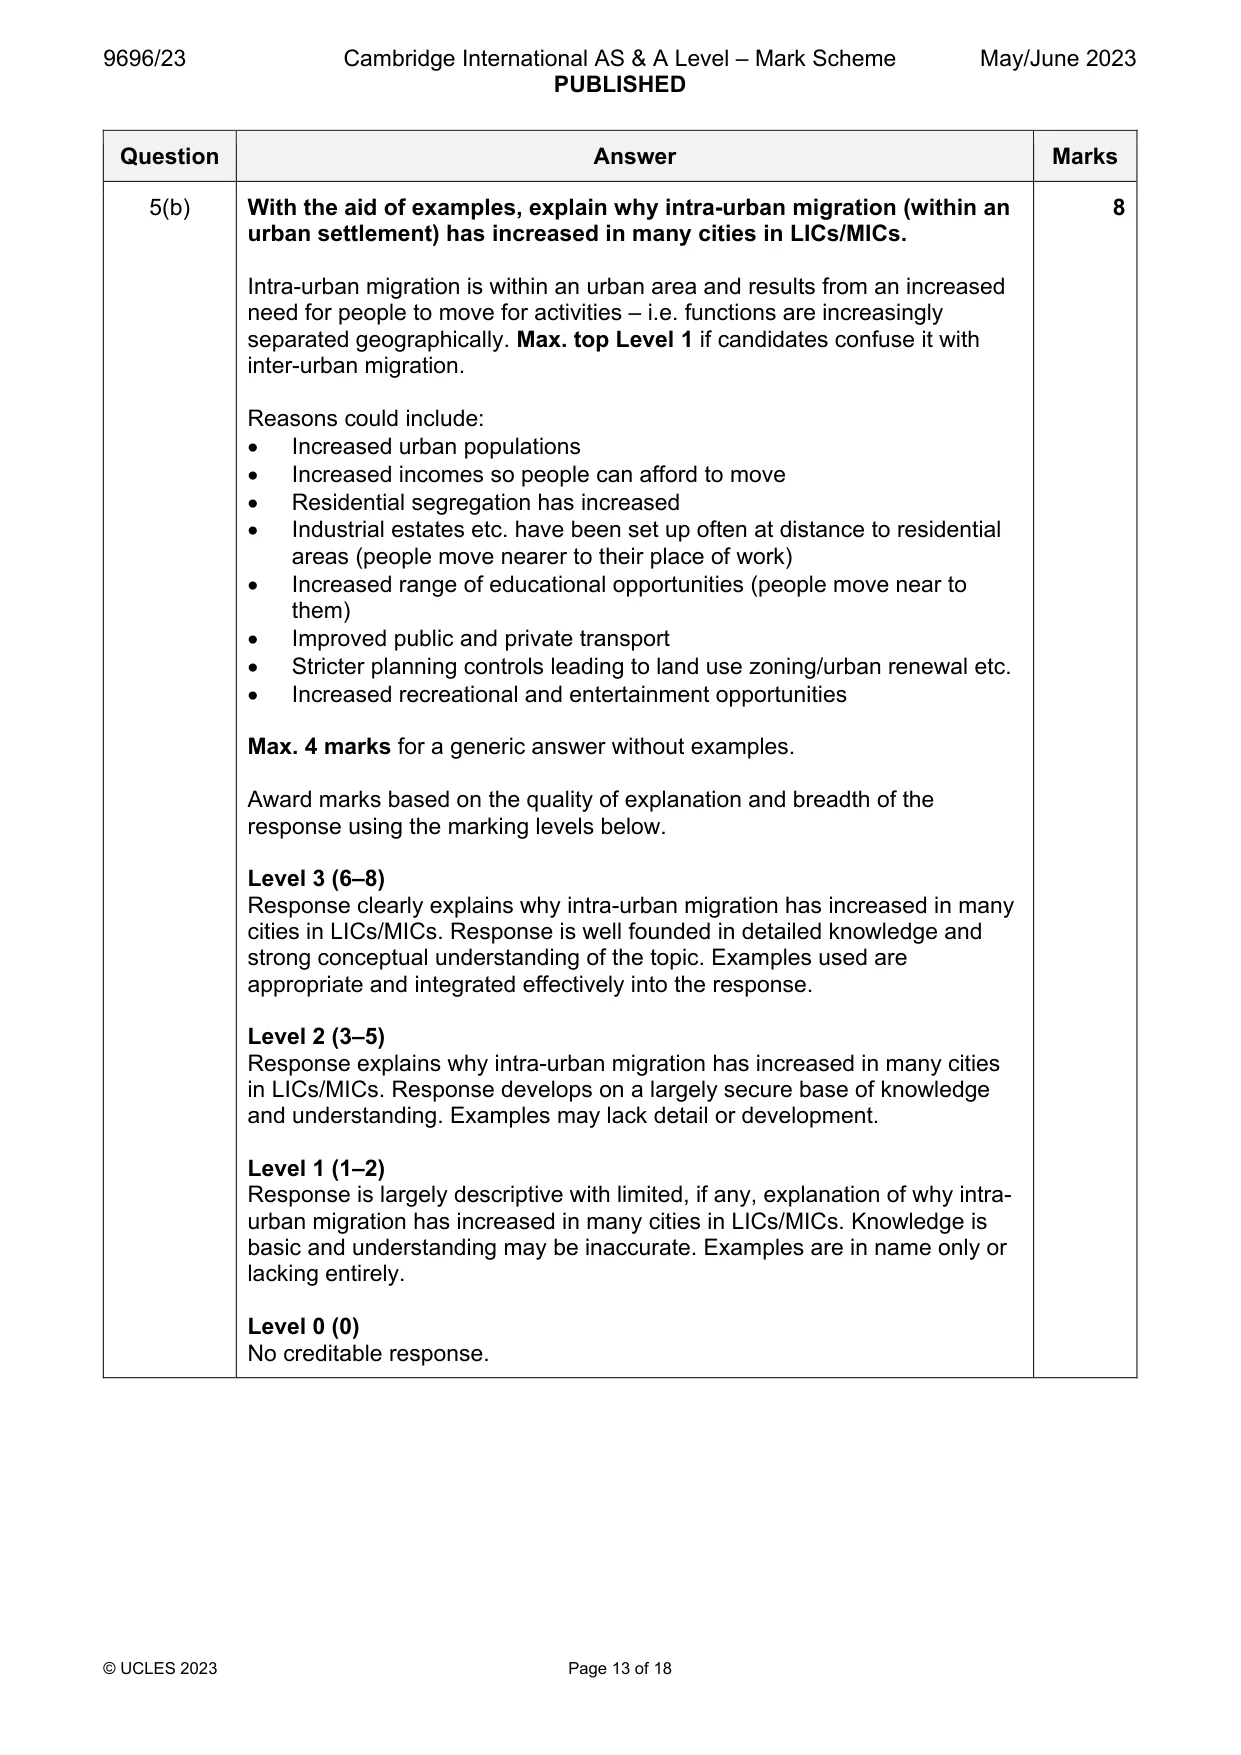
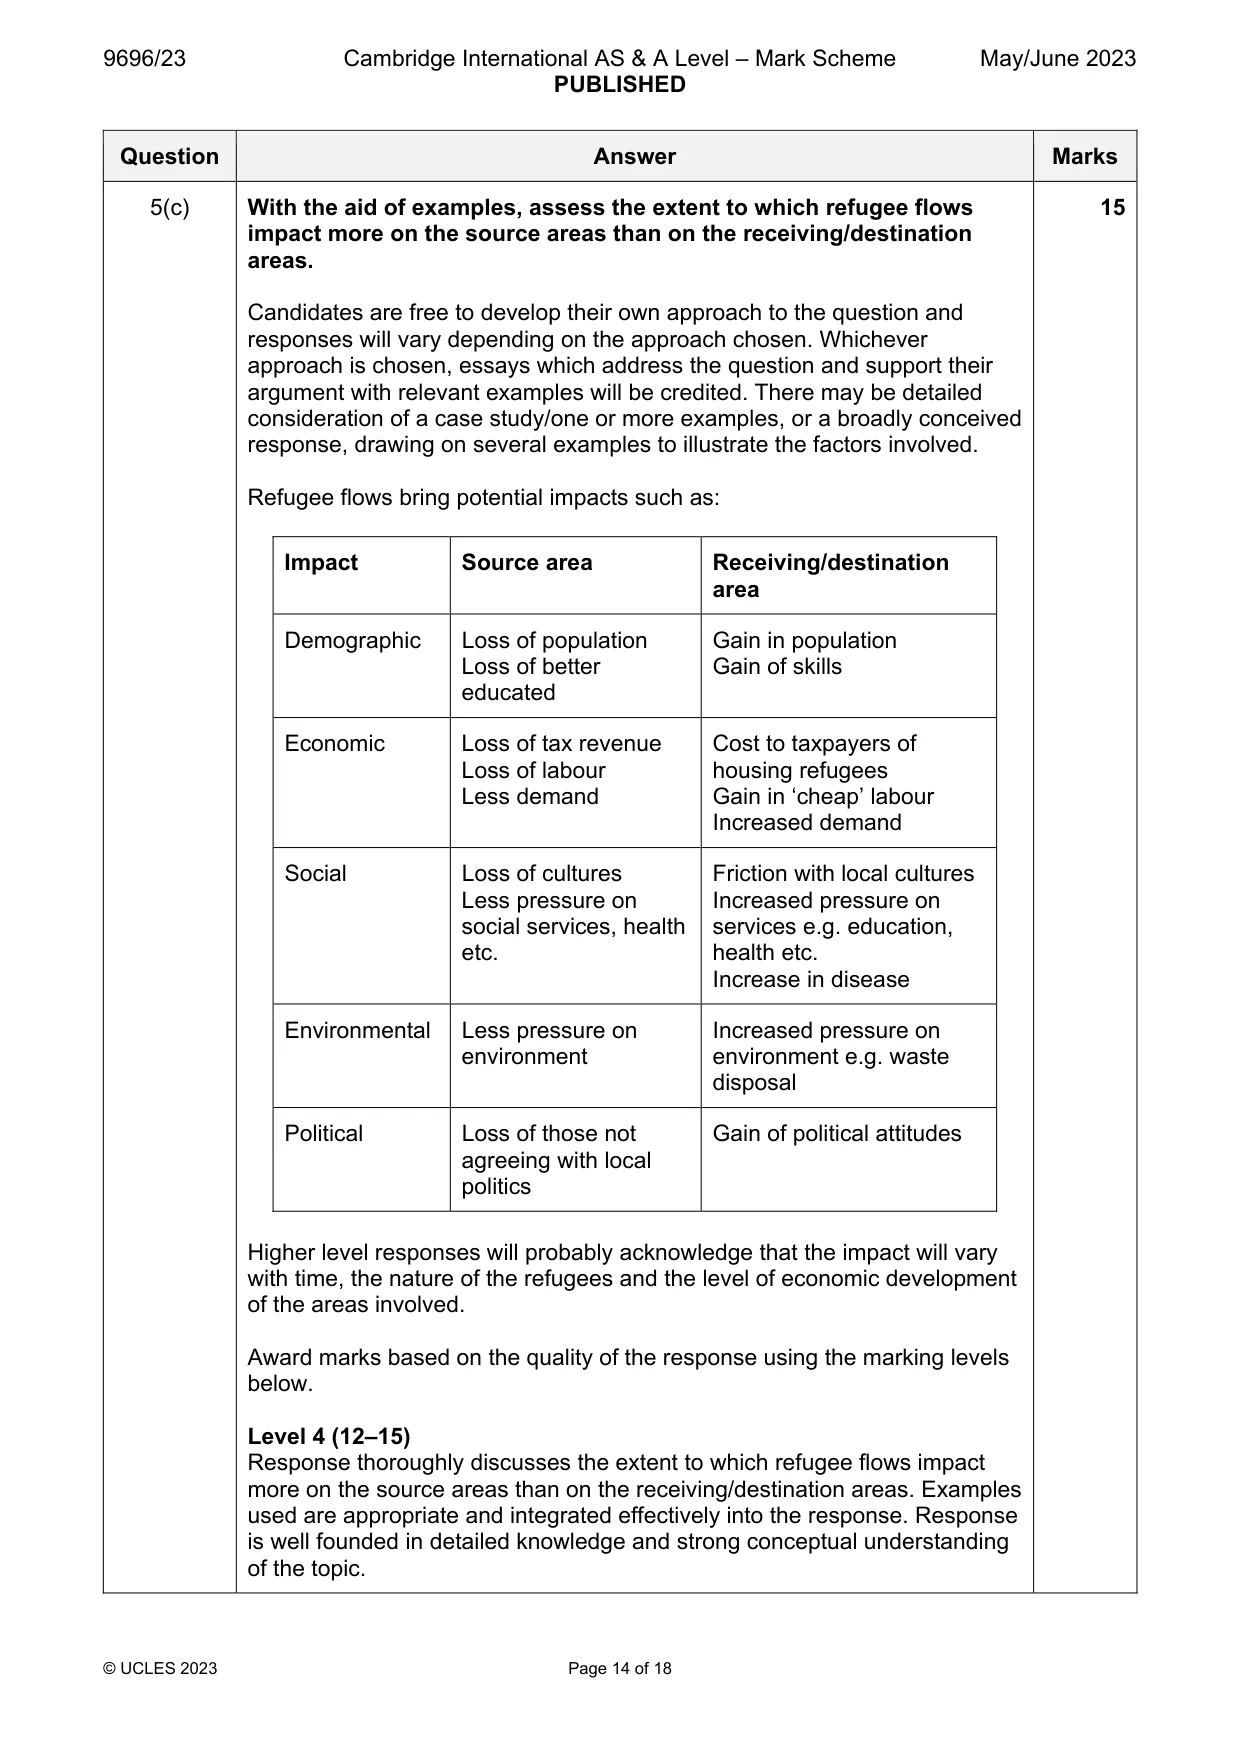
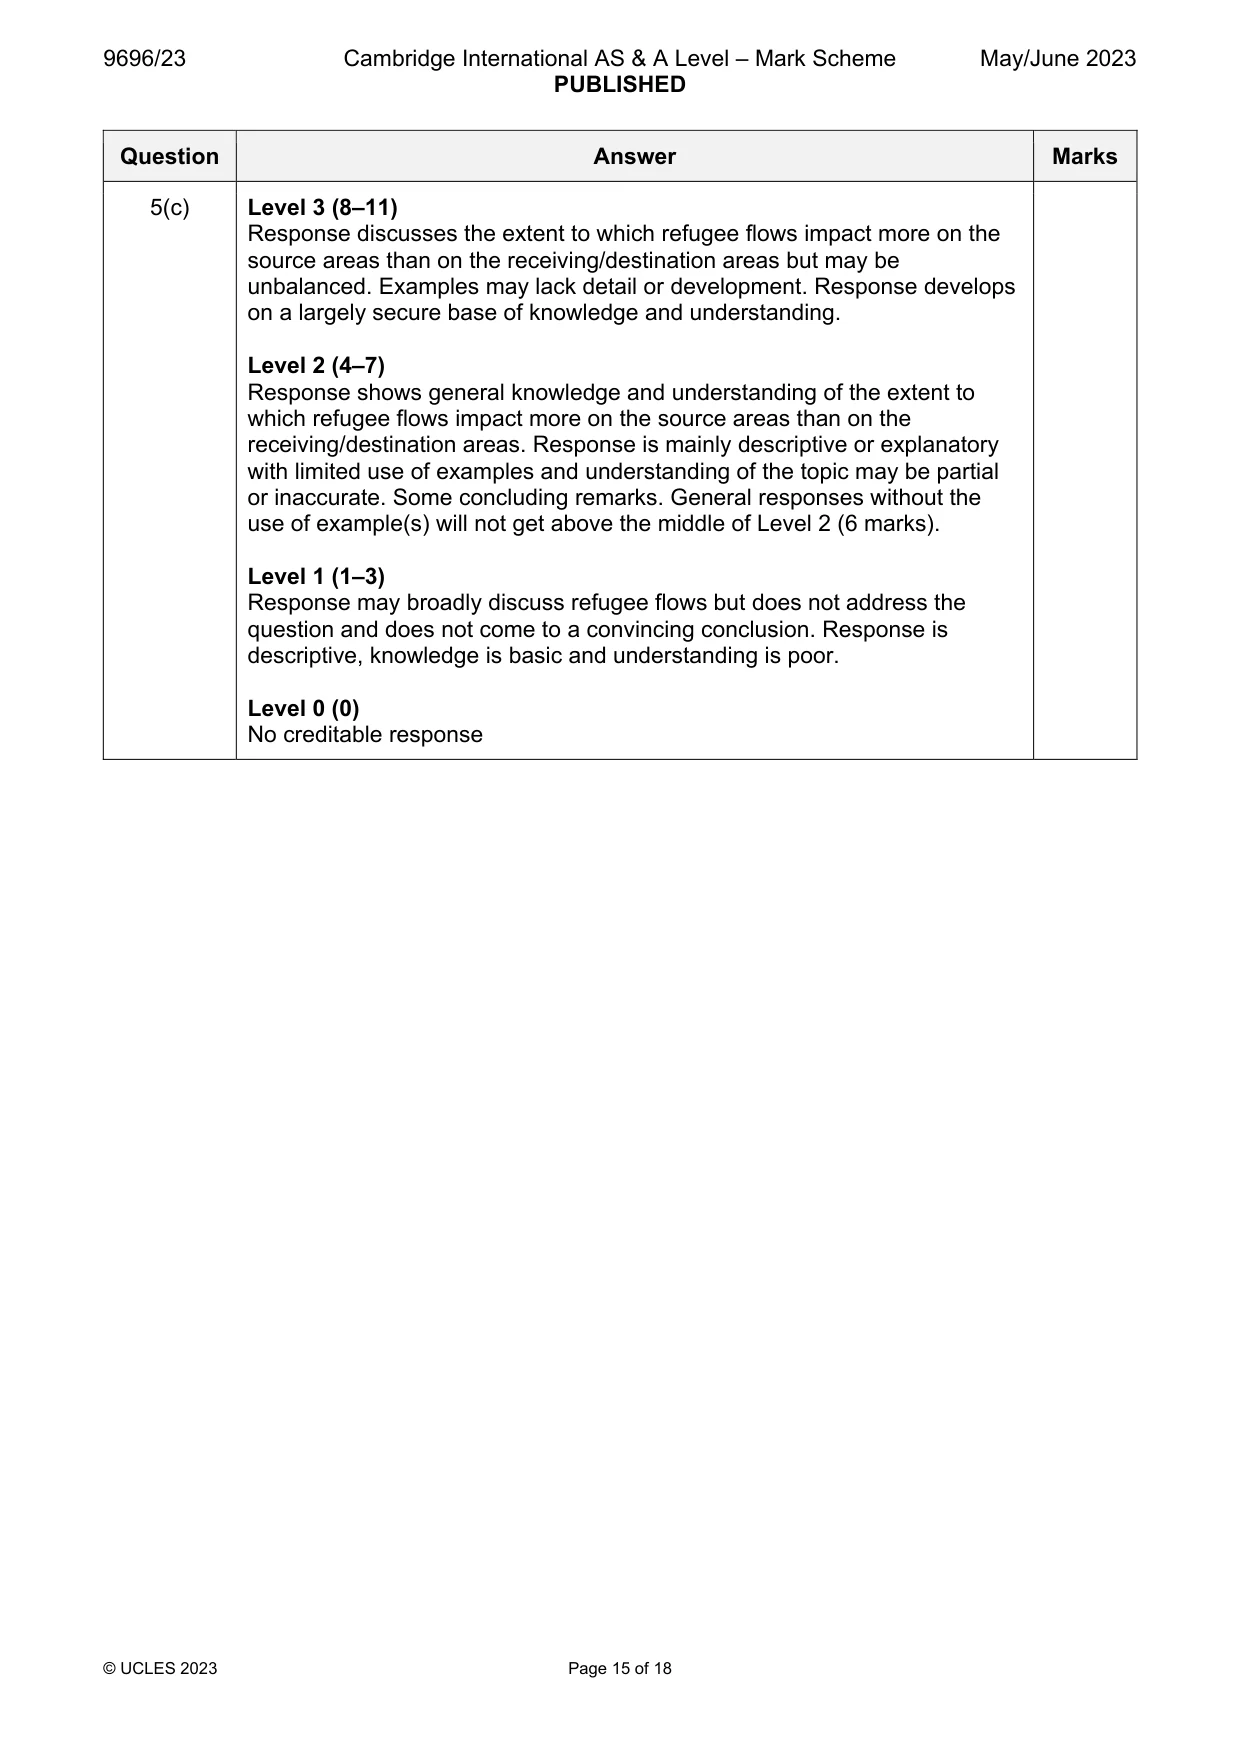
5 (a) Compare the characteristics of chain migration with the characteristics of stepped migration. [7] (b) With the aid of examples, explain why intra-urban migration (within an urban settlement) has increased in many cities in LICs/MICs. [8] (c) With the aid of examples, assess the extent to which refugee flows impact more on the source areas than on the receiving/destination areas. [15] Population/Migration/Settlement dynamics
Mark scheme: 5(a) Compare the characteristics of chain migration with the characteristics 7 of stepped migration. A chain migration is a movement of migrants from one place to another, encouraging successive waves of migration along the same route. Often one member of the family goes first (pioneer) then other members follow once they get feedback. In ‘Laws of Migration’, Ravenstein explained how migration could be gradual and occurred step-by-step geographically. According to Ravenstein, step migration occurred in short distance migration when individuals migrated from rural towns to an urban centre by stepping through intermediate-sized towns. So, comparison could include: Chain migration involves a group whilst stepped migration is more individual or family unit Stepped migration generally is a longer-term process than chain migration Chain migration involves feedback, stepped migration does not Stepped migration moves up the hierarchy whilst chain migration may not 1 mark for a simple comparison point or 2 marks for a point with development (with detail or an example), to the maximum. Two separate accounts, max. 4 marks. 5(b) With the aid of examples, explain why intra-urban migration (within an 8 urban settlement) has increased in many cities in LICs/MICs. Intra-urban migration is within an urban area and results from an increased need for people to move for activities – i.e. functions are increasingly separated geographically. Max. top Level 1 if candidates confuse it with inter-urban migration. Reasons could include: Increased urban populations Increased incomes so people can afford to move Residential segregation has increased Industrial estates etc. have been set up often at distance to residential areas (people move nearer to their place of work) Increased range of educational opportunities (people move near to them) Improved public and private transport Stricter planning controls leading to land use zoning/urban renewal etc. Increased recreational and entertainment opportunities Max. 4 marks for a generic answer without examples. Award marks based on the quality of explanation and breadth of the response using the marking levels below. Level 3 (6–8) Response clearly explains why intra-urban migration has increased in many cities in LICs/MICs. Response is well founded in detailed knowledge and strong conceptual understanding of the topic. Examples used are appropriate and integrated effectively into the response. Level 2 (3–5) Response explains why intra-urban migration has increased in many cities in LICs/MICs. Response develops on a largely secure base of knowledge and understanding. Examples may lack detail or development. Level 1 (1–2) Response is largely descriptive with limited, if any, explanation of why intra- urban migration has increased in many cities in LICs/MICs. Knowledge is basic and understanding may be inaccurate. Examples are in name only or lacking entirely. Level 0 (0) No creditable response. 5(c) With the aid of examples, assess the extent to which refugee flows 15 impact more on the source areas than on the receiving/destination areas. Candidates are free to develop their own approach to the question and responses will vary depending on the approach chosen. Whichever approach is chosen, essays which address the question and support their argument with relevant examples will be credited. There may be detailed consideration of a case study/one or more examples, or a broadly conceived response, drawing on several examples to illustrate the factors involved. Refugee flows bring potential impacts such as: Impact Source area Receiving/destination area Demographic Loss of population Gain in population Loss of better Gain of skills educated Economic Loss of tax revenue Cost to taxpayers of Loss of labour housing refugees Less demand Gain in ‘cheap’ labour Increased demand Social Loss of cultures Friction with local cultures Less pressure on Increased pressure on social services, health services e.g. education, etc. health etc. Increase in disease Environmental Less pressure on Increased pressure on environment environment e.g. waste disposal Political Loss of those not Gain of political attitudes agreeing with local politics Higher level responses will probably acknowledge that the impact will vary with time, the nature of the refugees and the level of economic development of the areas involved. Award marks based on the quality of the response using the marking levels below. Level 4 (12–15) Response thoroughly discusses the extent to which refugee flows impact more on the source areas than on the receiving/destination areas. Examples used are appropriate and integrated effectively into the response. Response is well founded in detailed knowledge and strong conceptual understanding of the topic. 5(c) Level 3 (8–11) Response discusses the extent to which refugee flows impact more on the source areas than on the receiving/destination areas but may be unbalanced. Examples may lack detail or development. Response develops on a largely secure base of knowledge and understanding. Level 2 (4–7) Response shows general knowledge and understanding of the extent to which refugee flows impact more on the source areas than on the receiving/destination areas. Response is mainly descriptive or explanatory with limited use of examples and understanding of the topic may be partial or inaccurate. Some concluding remarks. General responses without the use of example(s) will not get above the middle of Level 2 (6 marks). Level 1 (1–3) Response may broadly discuss refugee flows but does not address the question and does not come to a convincing conclusion. Response is descriptive, knowledge is basic and understanding is poor. Level 0 (0) No creditable response Population/Migration/Settlement dynamics
Q6 · For your chosen case study of a rural settlement or rural area: (a) Describe the…
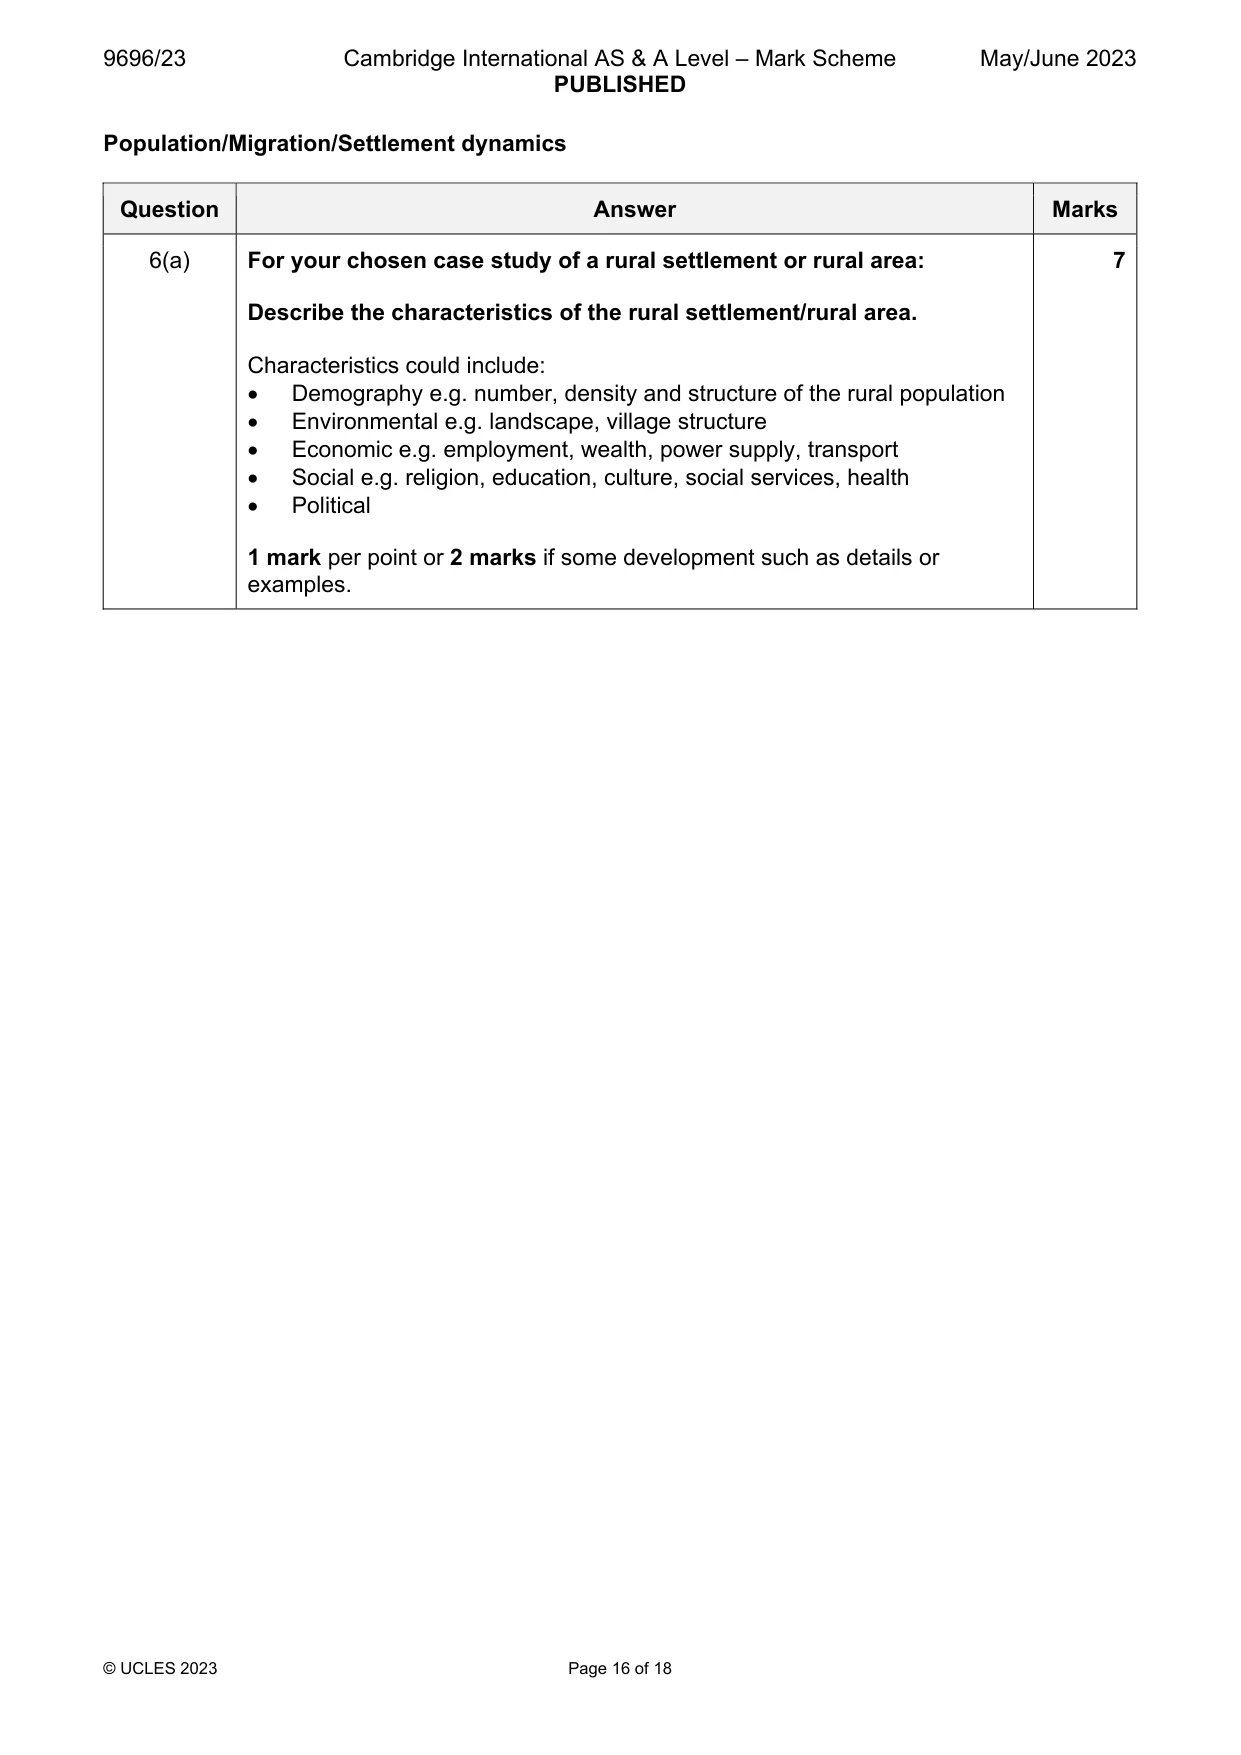
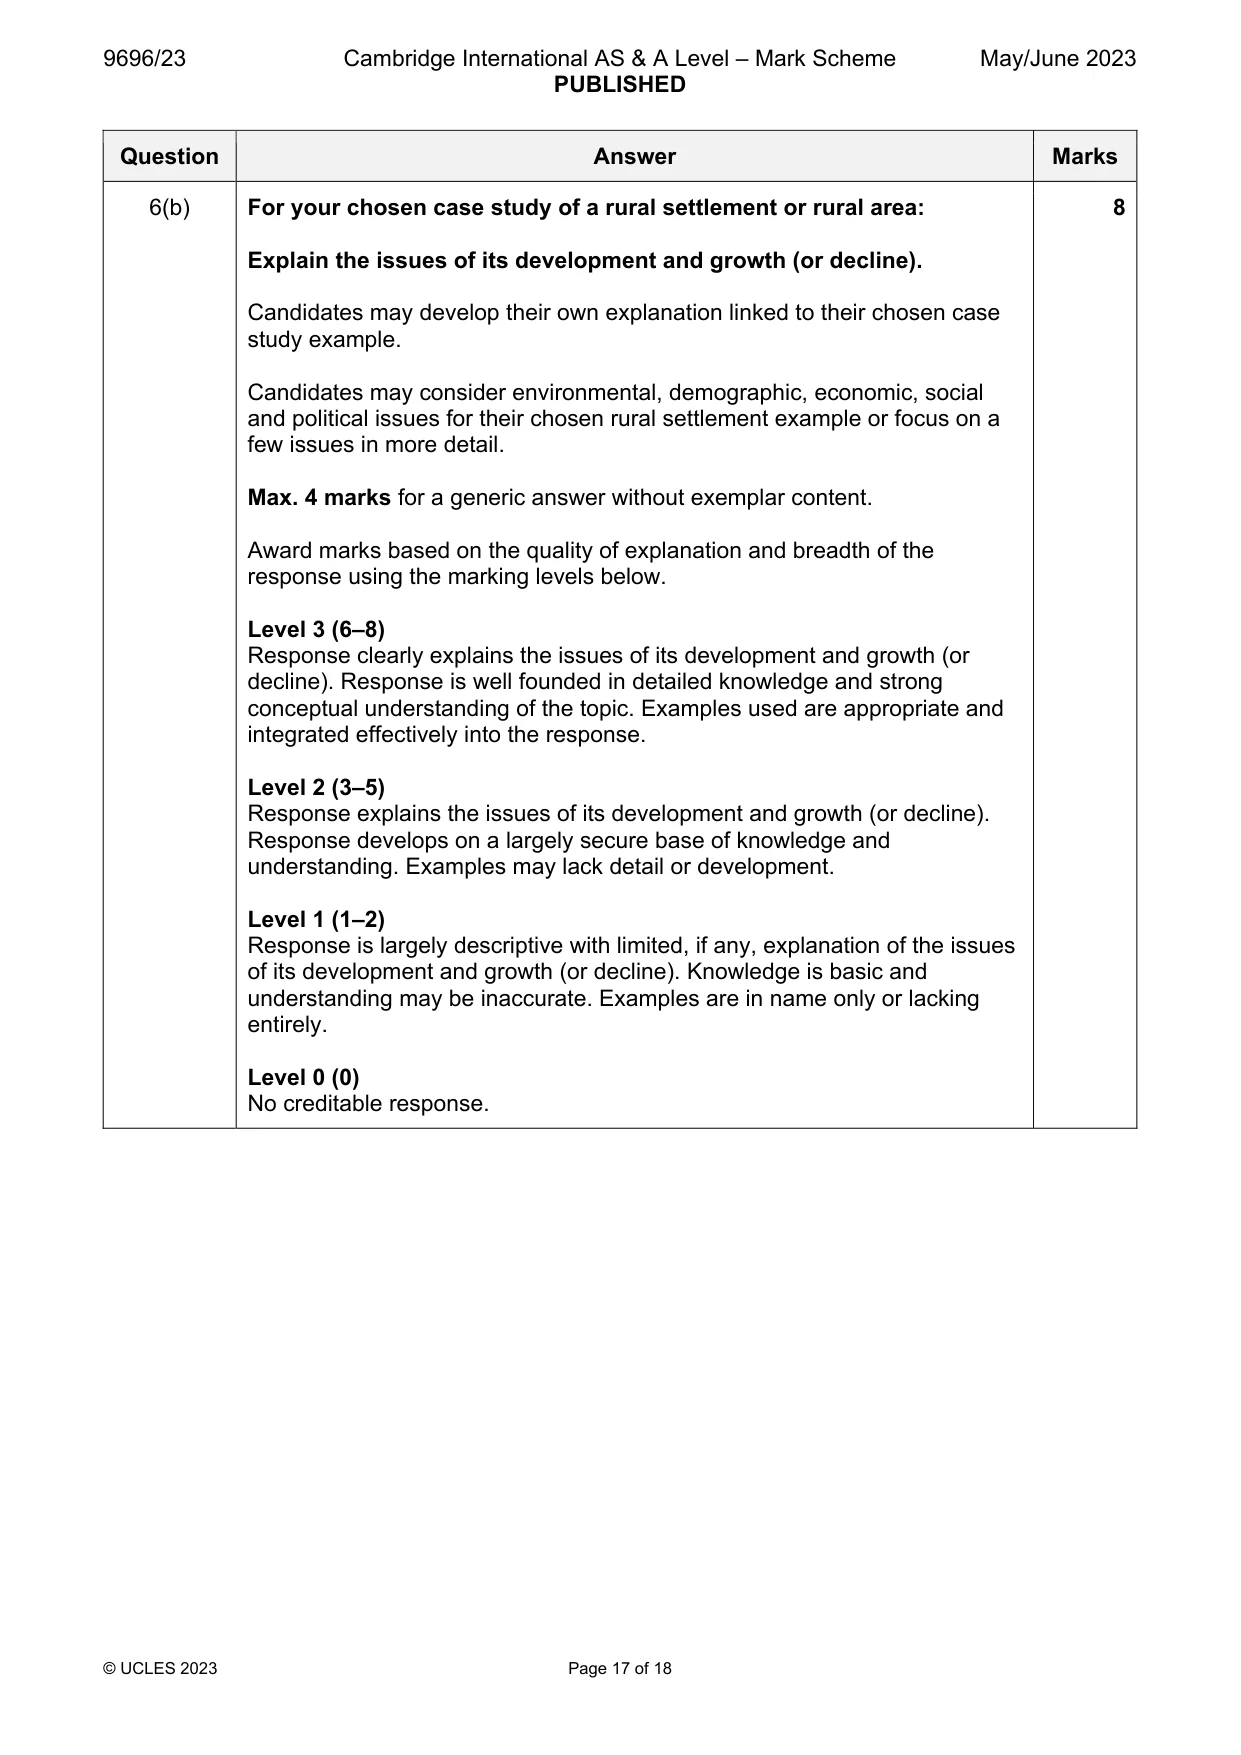
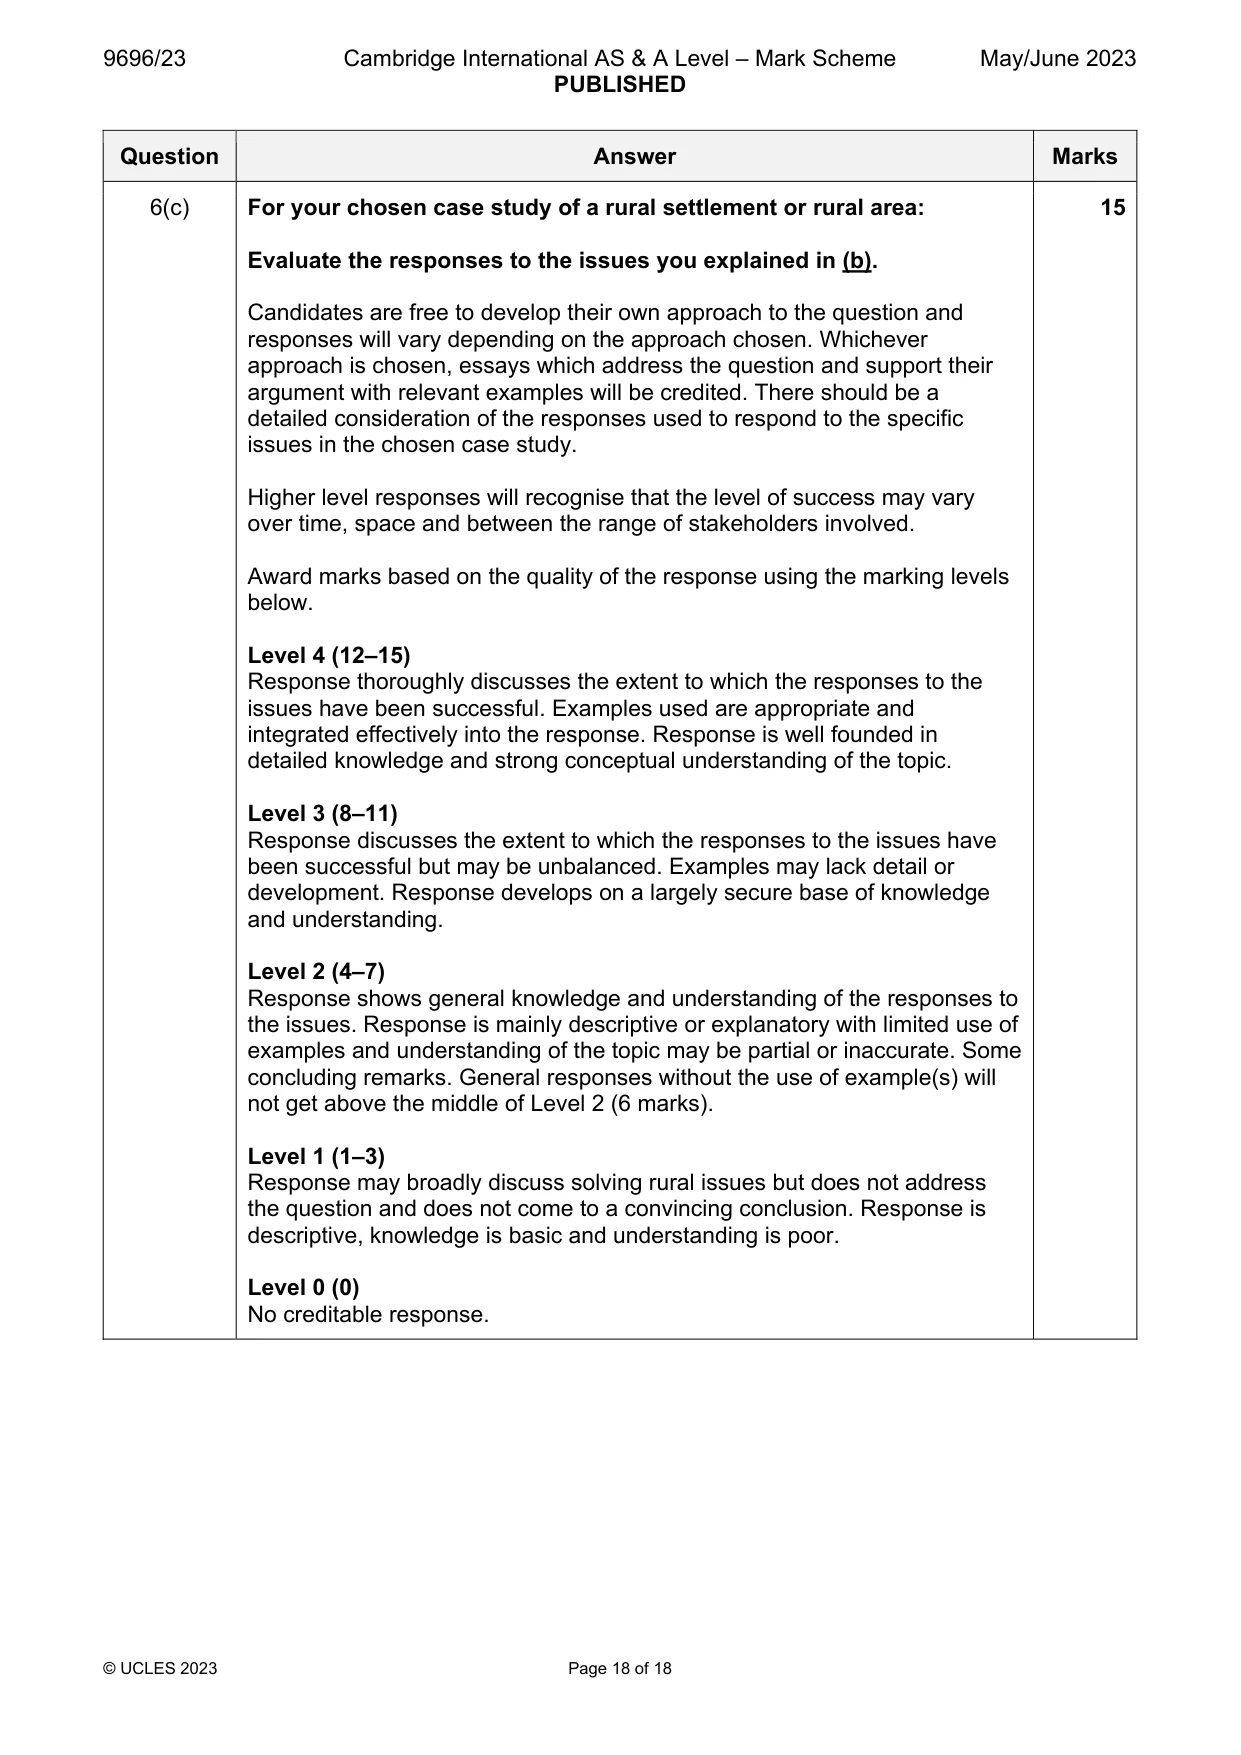
6 For your chosen case study of a rural settlement or rural area: (a) Describe the characteristics of the rural settlement/rural area. [7] (b) Explain the issues of its development and growth (or decline). [8] (c) Evaluate the responses to the issues you explained in (b). [15]
Mark scheme: 6(a) For your chosen case study of a rural settlement or rural area: 7 Describe the characteristics of the rural settlement/rural area. Characteristics could include: Demography e.g. number, density and structure of the rural population Environmental e.g. landscape, village structure Economic e.g. employment, wealth, power supply, transport Social e.g. religion, education, culture, social services, health Political 1 mark per point or 2 marks if some development such as details or examples. 6(b) For your chosen case study of a rural settlement or rural area: 8 Explain the issues of its development and growth (or decline). Candidates may develop their own explanation linked to their chosen case study example. Candidates may consider environmental, demographic, economic, social and political issues for their chosen rural settlement example or focus on a few issues in more detail. Max. 4 marks for a generic answer without exemplar content. Award marks based on the quality of explanation and breadth of the response using the marking levels below. Level 3 (6–8) Response clearly explains the issues of its development and growth (or decline). Response is well founded in detailed knowledge and strong conceptual understanding of the topic. Examples used are appropriate and integrated effectively into the response. Level 2 (3–5) Response explains the issues of its development and growth (or decline). Response develops on a largely secure base of knowledge and understanding. Examples may lack detail or development. Level 1 (1–2) Response is largely descriptive with limited, if any, explanation of the issues of its development and growth (or decline). Knowledge is basic and understanding may be inaccurate. Examples are in name only or lacking entirely. Level 0 (0) No creditable response. 6(c) For your chosen case study of a rural settlement or rural area: 15 Evaluate the responses to the issues you explained in (b). Candidates are free to develop their own approach to the question and responses will vary depending on the approach chosen. Whichever approach is chosen, essays which address the question and support their argument with relevant examples will be credited. There should be a detailed consideration of the responses used to respond to the specific issues in the chosen case study. Higher level responses will recognise that the level of success may vary over time, space and between the range of stakeholders involved. Award marks based on the quality of the response using the marking levels below. Level 4 (12–15) Response thoroughly discusses the extent to which the responses to the issues have been successful. Examples used are appropriate and integrated effectively into the response. Response is well founded in detailed knowledge and strong conceptual understanding of the topic. Level 3 (8–11) Response discusses the extent to which the responses to the issues have been successful but may be unbalanced. Examples may lack detail or development. Response develops on a largely secure base of knowledge and understanding. Level 2 (4–7) Response shows general knowledge and understanding of the responses to the issues. Response is mainly descriptive or explanatory with limited use of examples and understanding of the topic may be partial or inaccurate. Some concluding remarks. General responses without the use of example(s) will not get above the middle of Level 2 (6 marks). Level 1 (1–3) Response may broadly discuss solving rural issues but does not address the question and does not come to a convincing conclusion. Response is descriptive, knowledge is basic and understanding is poor. Level 0 (0) No creditable response.
What was in this paper
The subtopics covered by these 6 questions, and how many questions each got. Open one in a new tab to see every Cambridge question on it.
What you needed in this session
Cambridge’s own grade thresholds for 2023 May/June, Paper 2 · Variant 3. A higher threshold means an easier paper — the bar moves with how the cohort did.