Cambridge A Level Geography 9696 — 2023 Oct/Nov Paper 2 · Variant 3
9696/23/O/N/23 · 6 questions · 60 marks · ≈68 min
The question paper and its mark scheme, free to read here and free to download. This is Cambridge’s own paper, exactly as it was sat.
Question paper4 pages

Mark scheme17 pages
Answers below. Sit the paper first if you are practising.

Questions as text
Q1 · The number of births and deaths in the UK, an HIC in Europe, 1951–2018
1 Fig. 1.1 shows the number of births and deaths in the UK, an HIC in Europe, 1951–2018. (a) Using Fig. 1.1, state the year when: (i) natural increase was zero [1] (ii) natural increase was the highest. [1] (b) Outline evidence from Fig. 1.1 which suggests that the UK was in Stage 4 of the demographic transition model for the time period shown. [3] (c) Explain the issues caused by an ageing population for a country. [5] Population/Migration
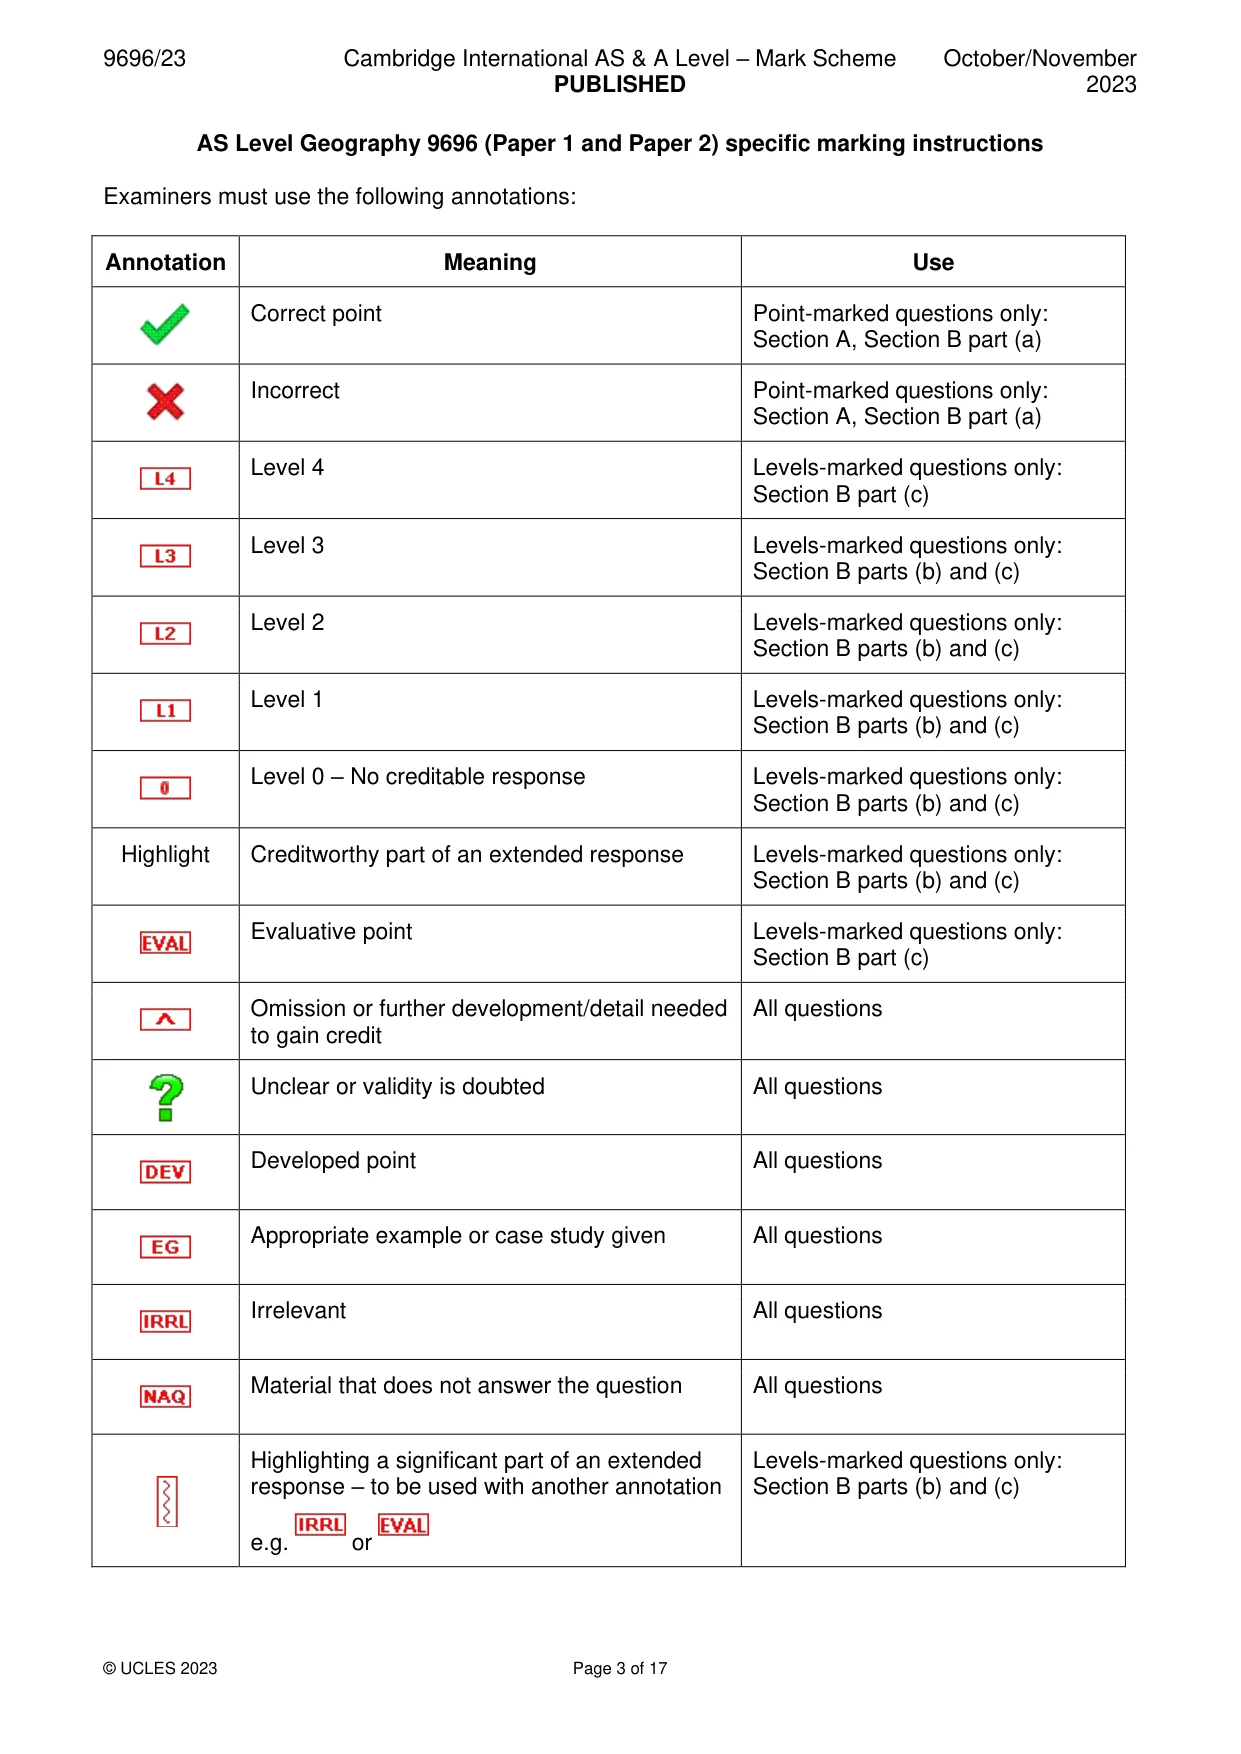
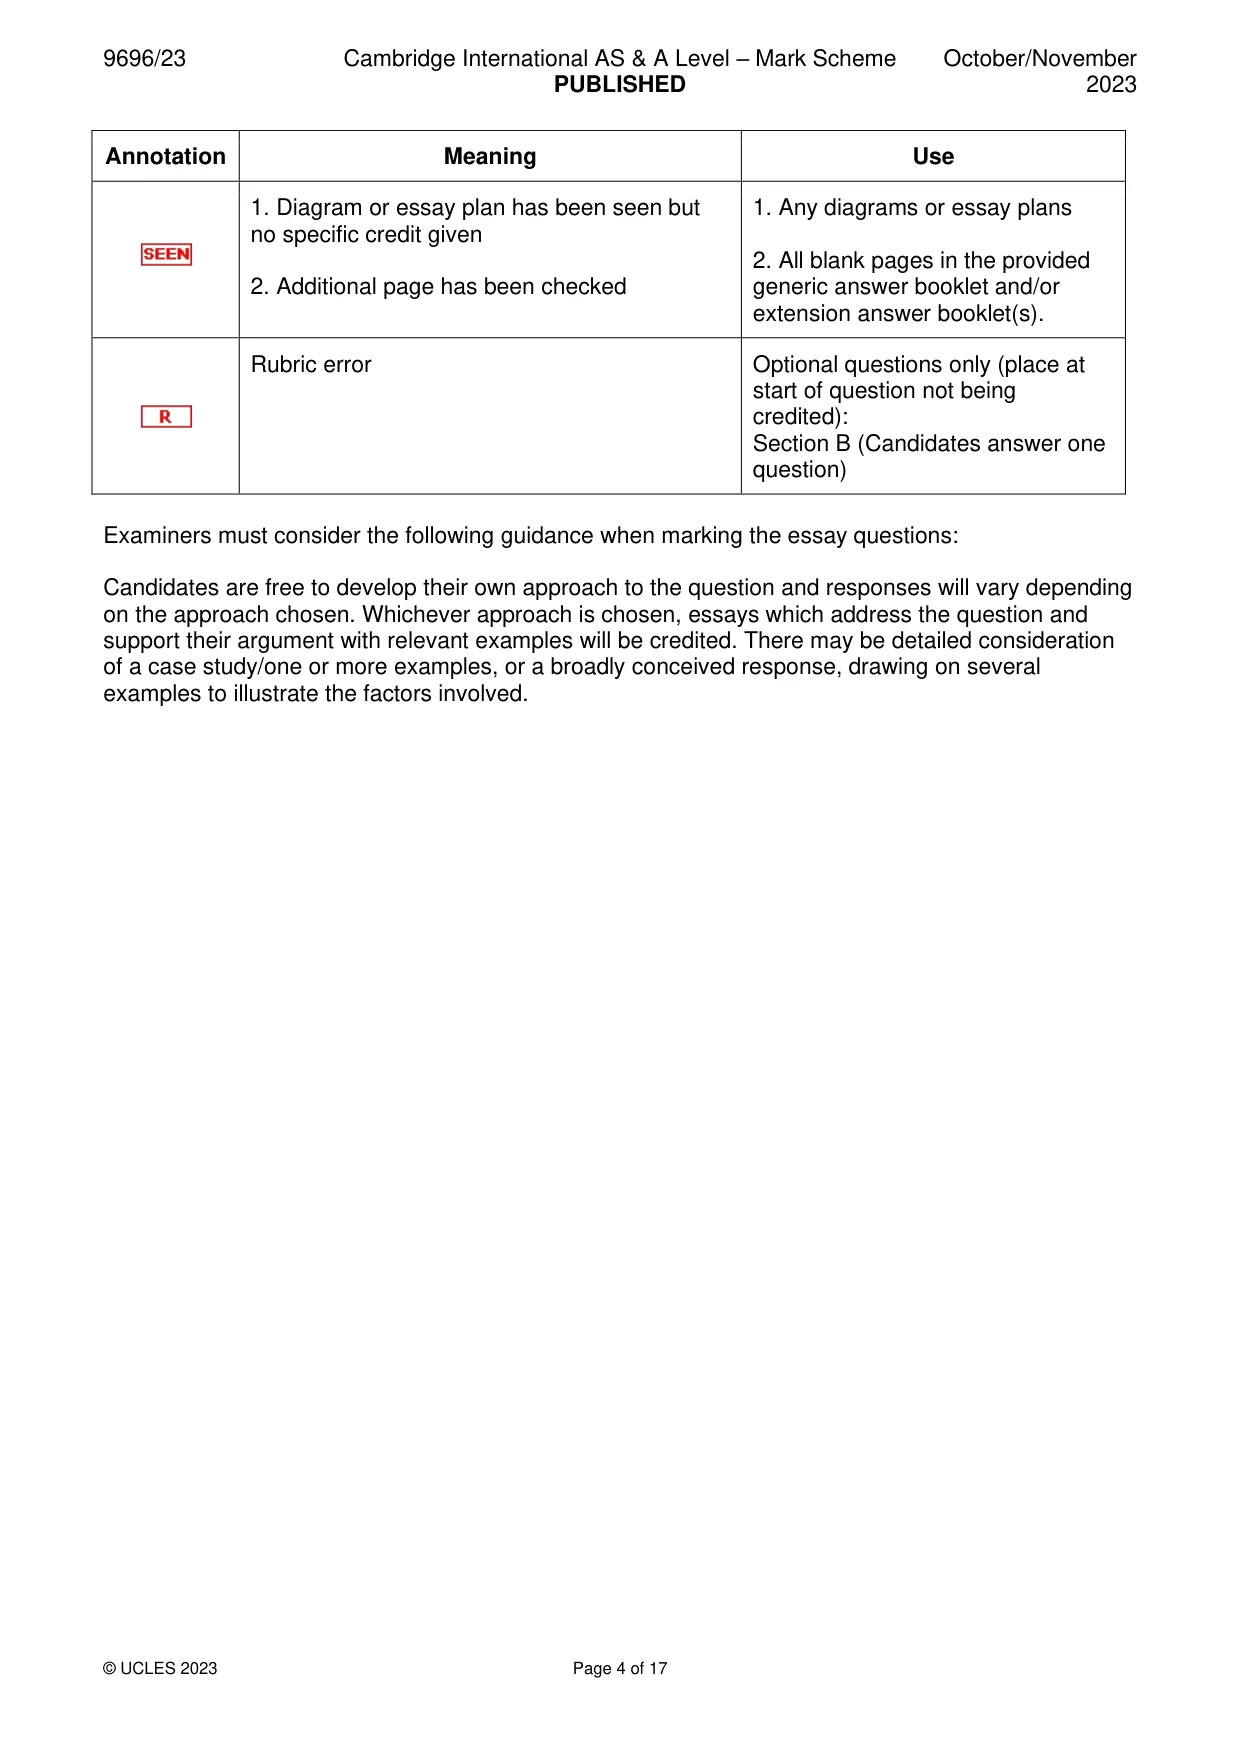
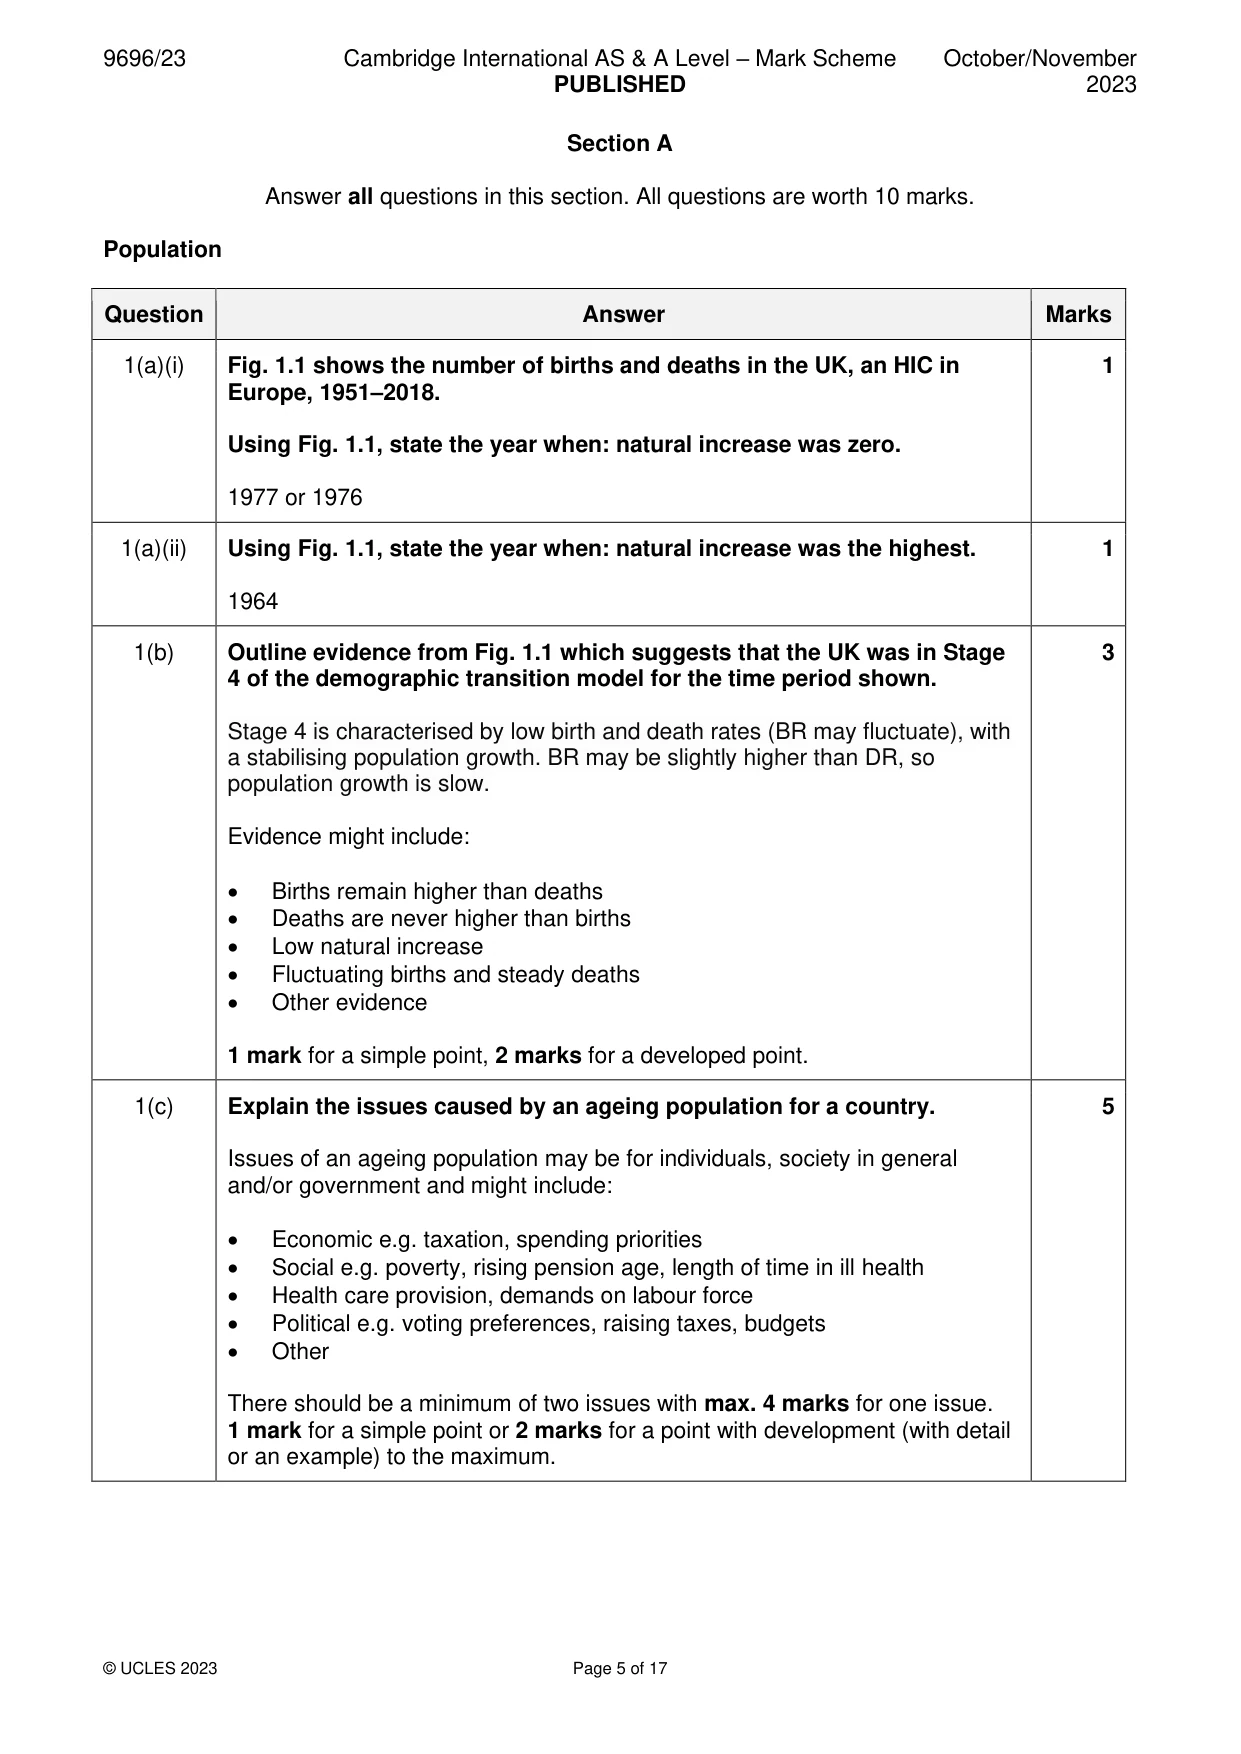
Mark scheme: Question Answer Marks 1(a)(i) Fig. 1.1 shows the number of births and deaths in the UK, an HIC in 1 Europe, 1951–2018. Using Fig. 1.1, state the year when: natural increase was zero. 1977 or 1976 1(a)(ii) Using Fig. 1.1, state the year when: natural increase was the highest. 1 1964 1(b) Outline evidence from Fig. 1.1 which suggests that the UK was in Stage 3 4 of the demographic transition model for the time period shown. Stage 4 is characterised by low birth and death rates (BR may fluctuate), with a stabilising population growth. BR may be slightly higher than DR, so population growth is slow. Evidence might include: • Births remain higher than deaths • Deaths are never higher than births • Low natural increase • Fluctuating births and steady deaths • Other evidence 1 mark for a simple point, 2 marks for a developed point. 1(c) Explain the issues caused by an ageing population for a country. 5 Issues of an ageing population may be for individuals, society in general and/or government and might include: • Economic e.g. taxation, spending priorities • Social e.g. poverty, rising pension age, length of time in ill health • Health care provision, demands on labour force • Political e.g. voting preferences, raising taxes, budgets • Other There should be a minimum of two issues with max. 4 marks for one issue. 1 mark for a simple point or 2 marks for a point with development (with detail or an example) to the maximum. Population/Migration
Q2 · The age distribution of the total world population and of international migrants in 2019
2 Fig. 2.1 shows the age distribution of the total world population and of international migrants in 2019. (a) Using Fig. 2.1: (i) state the age group with the highest percentage of international migrants [1] (ii) compare the age structure of the total world population with the age structure of the international migrant population. [3] (b) Suggest two reasons for the international migrant age structure shown in Fig. 2.1. [2] (c) Explain the problems of forced (involuntary) international migration for receiving/destination countries. [4] Settlement dynamics
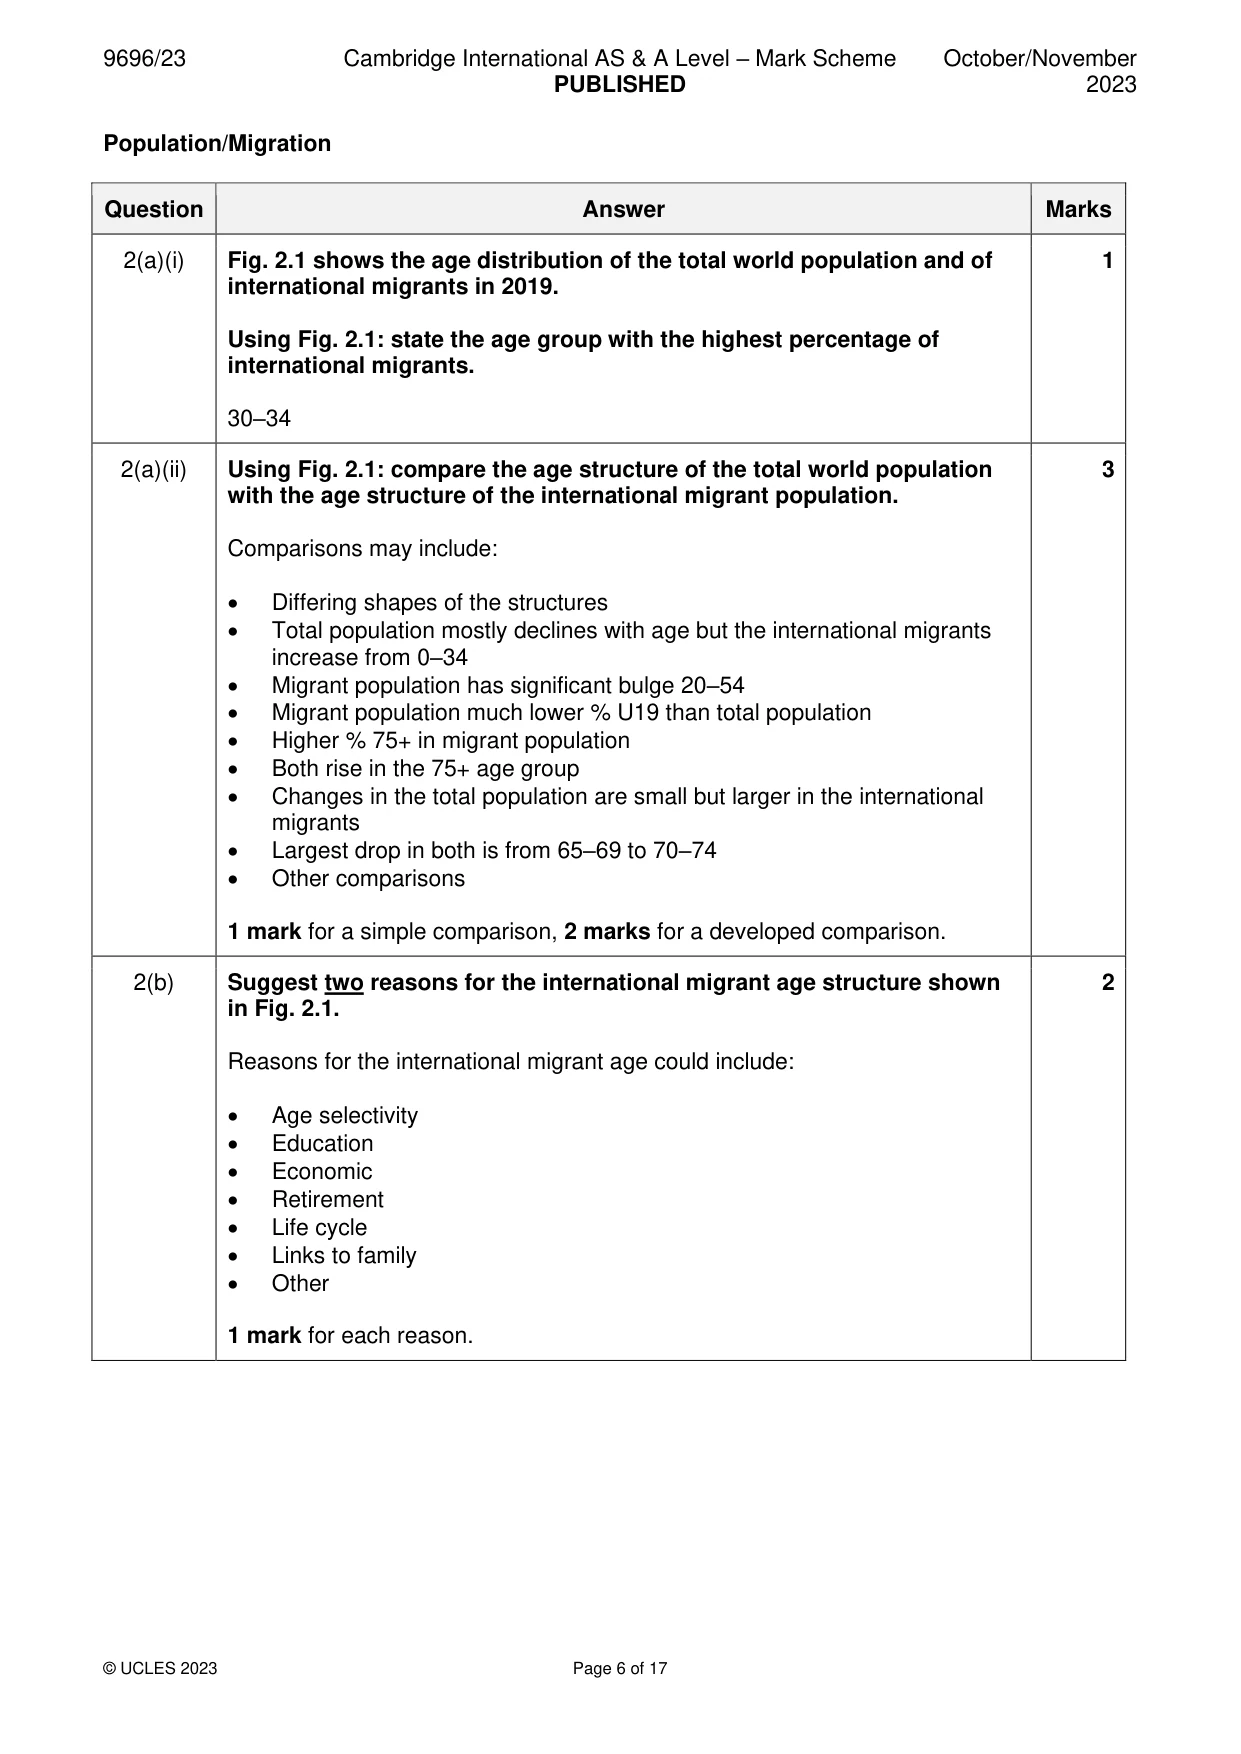
Mark scheme: 2(a)(i) Fig. 2.1 shows the age distribution of the total world population and of 1 international migrants in 2019. Using Fig. 2.1: state the age group with the highest percentage of international migrants. 30–34 2(a)(ii) Using Fig. 2.1: compare the age structure of the total world population 3 with the age structure of the international migrant population. Comparisons may include: • Differing shapes of the structures • Total population mostly declines with age but the international migrants increase from 0–34 • Migrant population has significant bulge 20–54 • Migrant population much lower % U19 than total population • Higher % 75+ in migrant population • Both rise in the 75+ age group • Changes in the total population are small but larger in the international migrants • Largest drop in both is from 65–69 to 70–74 • Other comparisons 1 mark for a simple comparison, 2 marks for a developed comparison. 2(b) Suggest two reasons for the international migrant age structure shown 2 in Fig. 2.1. Reasons for the international migrant age could include: • Age selectivity • Education • Economic • Retirement • Life cycle • Links to family • Other 1 mark for each reason. 2(c) Explain the problems of forced (involuntary) international migration for 4 receiving/destination countries. Receiving/destination countries may face problems from forced (involuntary) international migration such as: • Numbers and short time span of influx • Provision of resources/facilities (needs qualifying, e.g. food, shelter, water, sanitation) • Longer term problems such as education, and changes to the labour market • Social/cultural issues • Other For each problem: 1 mark for a simple point, 2 marks for a developed point, up to a max. 3 marks. Minimum of two problems required for full marks. Settlement dynamics
Q3 · A photograph which shows the Metro de Lima, a railway in Lima, Peru, an MIC in South…
3 Fig. 3.1 is a photograph which shows the Metro de Lima, a railway in Lima, Peru, an MIC in South America. (a) Using Fig. 3.1, suggest three advantages of the railway shown for the city and its residents. [3] (b) Suggest two challenges in constructing the railway shown in Fig. 3.1. [3] (c) Explain why urban renewal occurs in HIC cities. [4]
Mark scheme: 3(a) Fig. 3.1 is a photograph which shows the Metro de Lima, a railway in 3 Lima, Peru, an MIC in South America. Using Fig. 3.1, suggest three advantages of the railway shown for the city and its residents. Advantages might include: • Rapid transport / faster journeys • The view from the train (tourism) • Away from pollution of roads / reduces pollution • Covers/connects a large distance • Separate from pedestrians • Provides transport for people without cars • Provides employment / revenue for the city • Reduces traffic congestion • Other 1 mark for each advantage. 3(b) Suggest two challenges in constructing the railway shown in Fig. 3.1. 3 Challenges in the construction may have been: • Cost of build and/or land / compensation payments • Clearance of existing buildings • Noise and disruption during construction • Movement of materials and construction machinery • Other For each challenge: point mark as 2+1 / 1+2 with a simple point 1 mark or a point with development (with detail or an example) 2 marks. 3(c) Explain why urban renewal occurs in HIC cities. 4 Urban renewal occurs in HIC cities for a variety of reasons such as: • Age and upgrading of older properties • Change of use as activities move out of areas such as the inner city / CBD • Deindustrialisation • Environmental improvements • Infrastructural improvements • Attempts at reimaging • Other 1 mark for a simple point or 2 marks for a point with development (with detail or an example) to the maximum. Section B Answer one question from this section. All questions are worth 30 marks. Population
Q4 · Outline the concept of carrying capacity
4 (a) (i) Outline the concept of carrying capacity. [3] (ii) Suggest two environmental consequences of exceeding carrying capacity. [4] (b) With the aid of examples, explain the consequences of underpopulation for a country. [8] (c) ‘Management of natural increase is the best way to achieve optimum population for an area.’ With the aid of examples, how far do you agree with this statement? [15] Population/Migration/Settlement dynamics
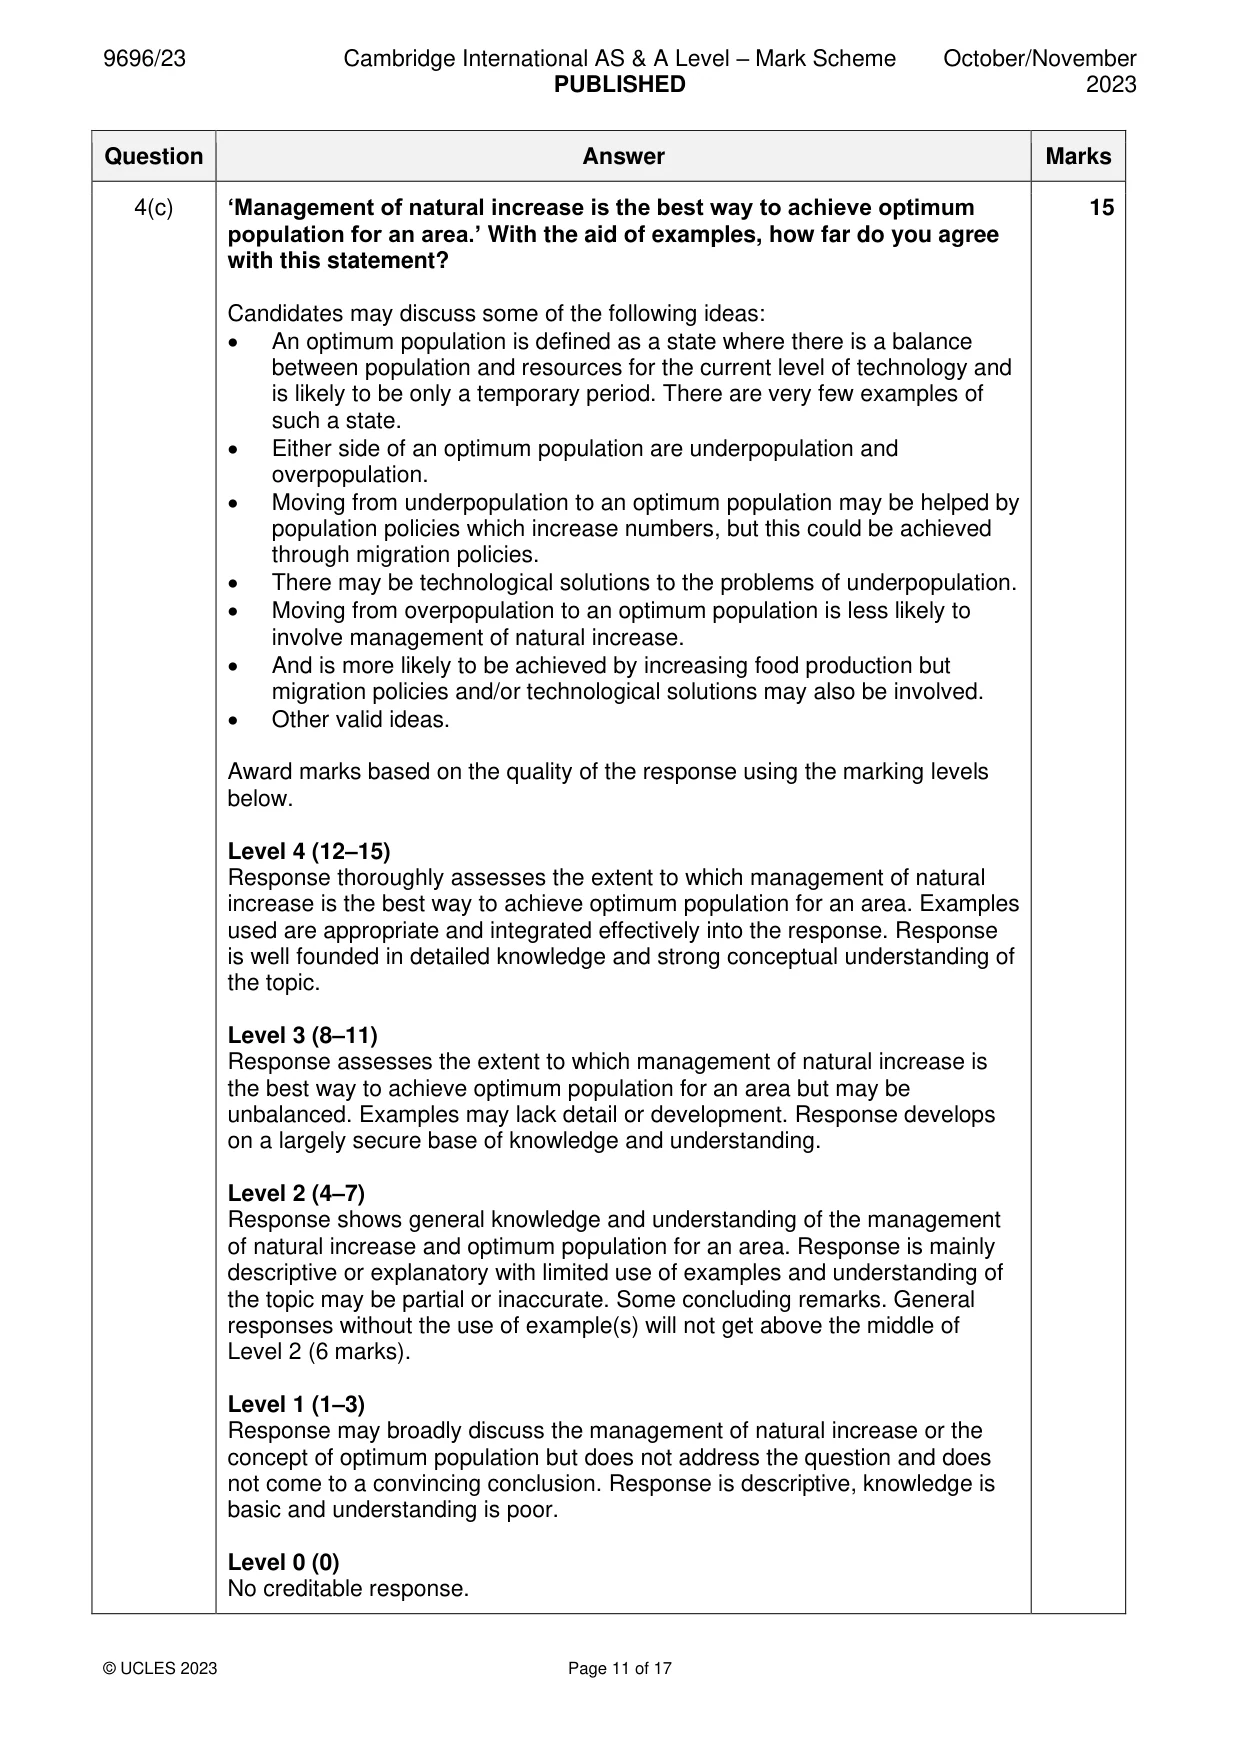
Mark scheme: 4(a)(i) Outline the concept of carrying capacity. 3 This may be marked with two marks for reference to: the largest population (1) that the resources of an environment can support (1) and a further mark for reference to sustainability and / or not causing damage to the environment for future generations (1). 4(a)(ii) Suggest two environmental consequences of exceeding carrying 4 capacity. Environmental consequences of exceeding carrying capacity may come from either the population numbers and/or the resource use and may well be linked together. Environmental consequences may include: • Soil erosion • Water shortage • Pollution (should be qualified) • Species extinction • Resource depletion • Other For each environmental consequence: 1 mark for a simple point, 2 marks for a developed point. 4(b) With the aid of examples, explain the consequences of underpopulation 8 for a country. Consequences of underpopulation for a country may include: • Underutilisation of resources • Labour shortages leading to high wages • Increased immigration to fill labour shortages and consequent impact on economy and/or society • Service provision is difficult / unprofitable • Other Candidates should explain at least two consequences of underpopulation. Max. 4 marks for a response without examples. Award marks based on the quality of explanation and breadth of the response using the marking levels below. Level 3 (6–8) Response clearly explains the consequences of underpopulation for a country. Response is well founded in detailed knowledge and strong conceptual understanding of the topic. Examples used are appropriate and integrated effectively into the response. Level 2 (3–5) Response explains the consequences of underpopulation for a country. Response develops on a largely secure base of knowledge and understanding. Examples may lack detail or development. Level 1 (1–2) Response is largely descriptive about the consequences of underpopulation. Knowledge is basic and understanding may be inaccurate. Examples are in name only or lacking entirely. Level 0 (0) No creditable response. 4(c) ‘Management of natural increase is the best way to achieve optimum 15 population for an area.’ With the aid of examples, how far do you agree with this statement? Candidates may discuss some of the following ideas: • An optimum population is defined as a state where there is a balance between population and resources for the current level of technology and is likely to be only a temporary period. There are very few examples of such a state. • Either side of an optimum population are underpopulation and overpopulation. • Moving from underpopulation to an optimum population may be helped by population policies which increase numbers, but this could be achieved through migration policies. • There may be technological solutions to the problems of underpopulation. • Moving from overpopulation to an optimum population is less likely to involve management of natural increase. • And is more likely to be achieved by increasing food production but migration policies and/or technological solutions may also be involved. • Other valid ideas. Award marks based on the quality of the response using the marking levels below. Level 4 (12–15) Response thoroughly assesses the extent to which management of natural increase is the best way to achieve optimum population for an area. Examples used are appropriate and integrated effectively into the response. Response is well founded in detailed knowledge and strong conceptual understanding of the topic. Level 3 (8–11) Response assesses the extent to which management of natural increase is the best way to achieve optimum population for an area but may be unbalanced. Examples may lack detail or development. Response develops on a largely secure base of knowledge and understanding. Level 2 (4–7) Response shows general knowledge and understanding of the management of natural increase and optimum population for an area. Response is mainly descriptive or explanatory with limited use of examples and understanding of the topic may be partial or inaccurate. Some concluding remarks. General responses without the use of example(s) will not get above the middle of Level 2 (6 marks). Level 1 (1–3) Response may broadly discuss the management of natural increase or the concept of optimum population but does not address the question and does not come to a convincing conclusion. Response is descriptive, knowledge is basic and understanding is poor. Level 0 (0) No creditable response. Population/Migration/Settlement dynamics
Q5 · Define the term voluntary migration
5 (a) (i) Define the term voluntary migration. [3] (ii) Describe two physical barriers to migration. [4] (b) With the aid of examples, explain the economic impacts of rural to urban migration on rural source areas in LICs/MICs. [8] (c) ‘Push factors are the main cause of urban to rural migration in HICs.’ With the aid of examples, how far do you agree with this statement? [15] Settlement dynamics
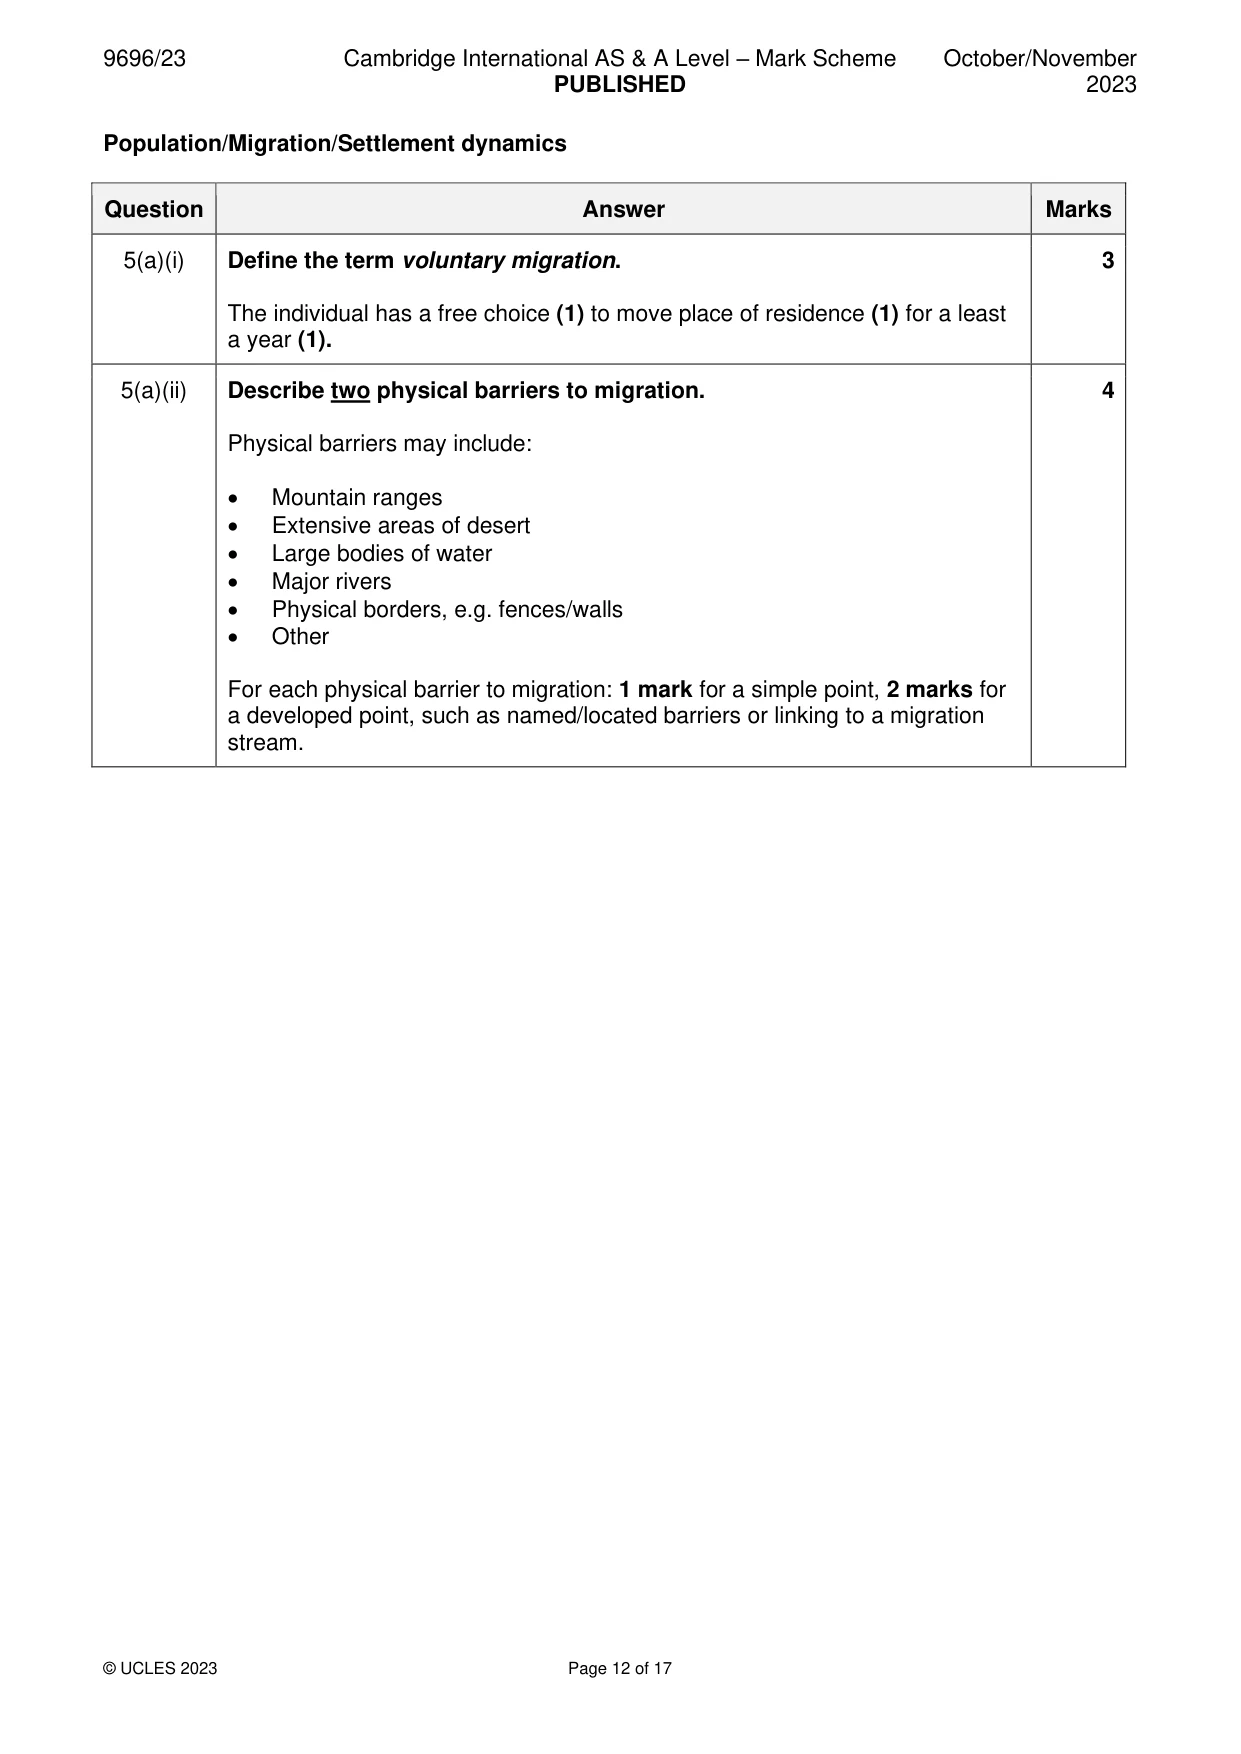
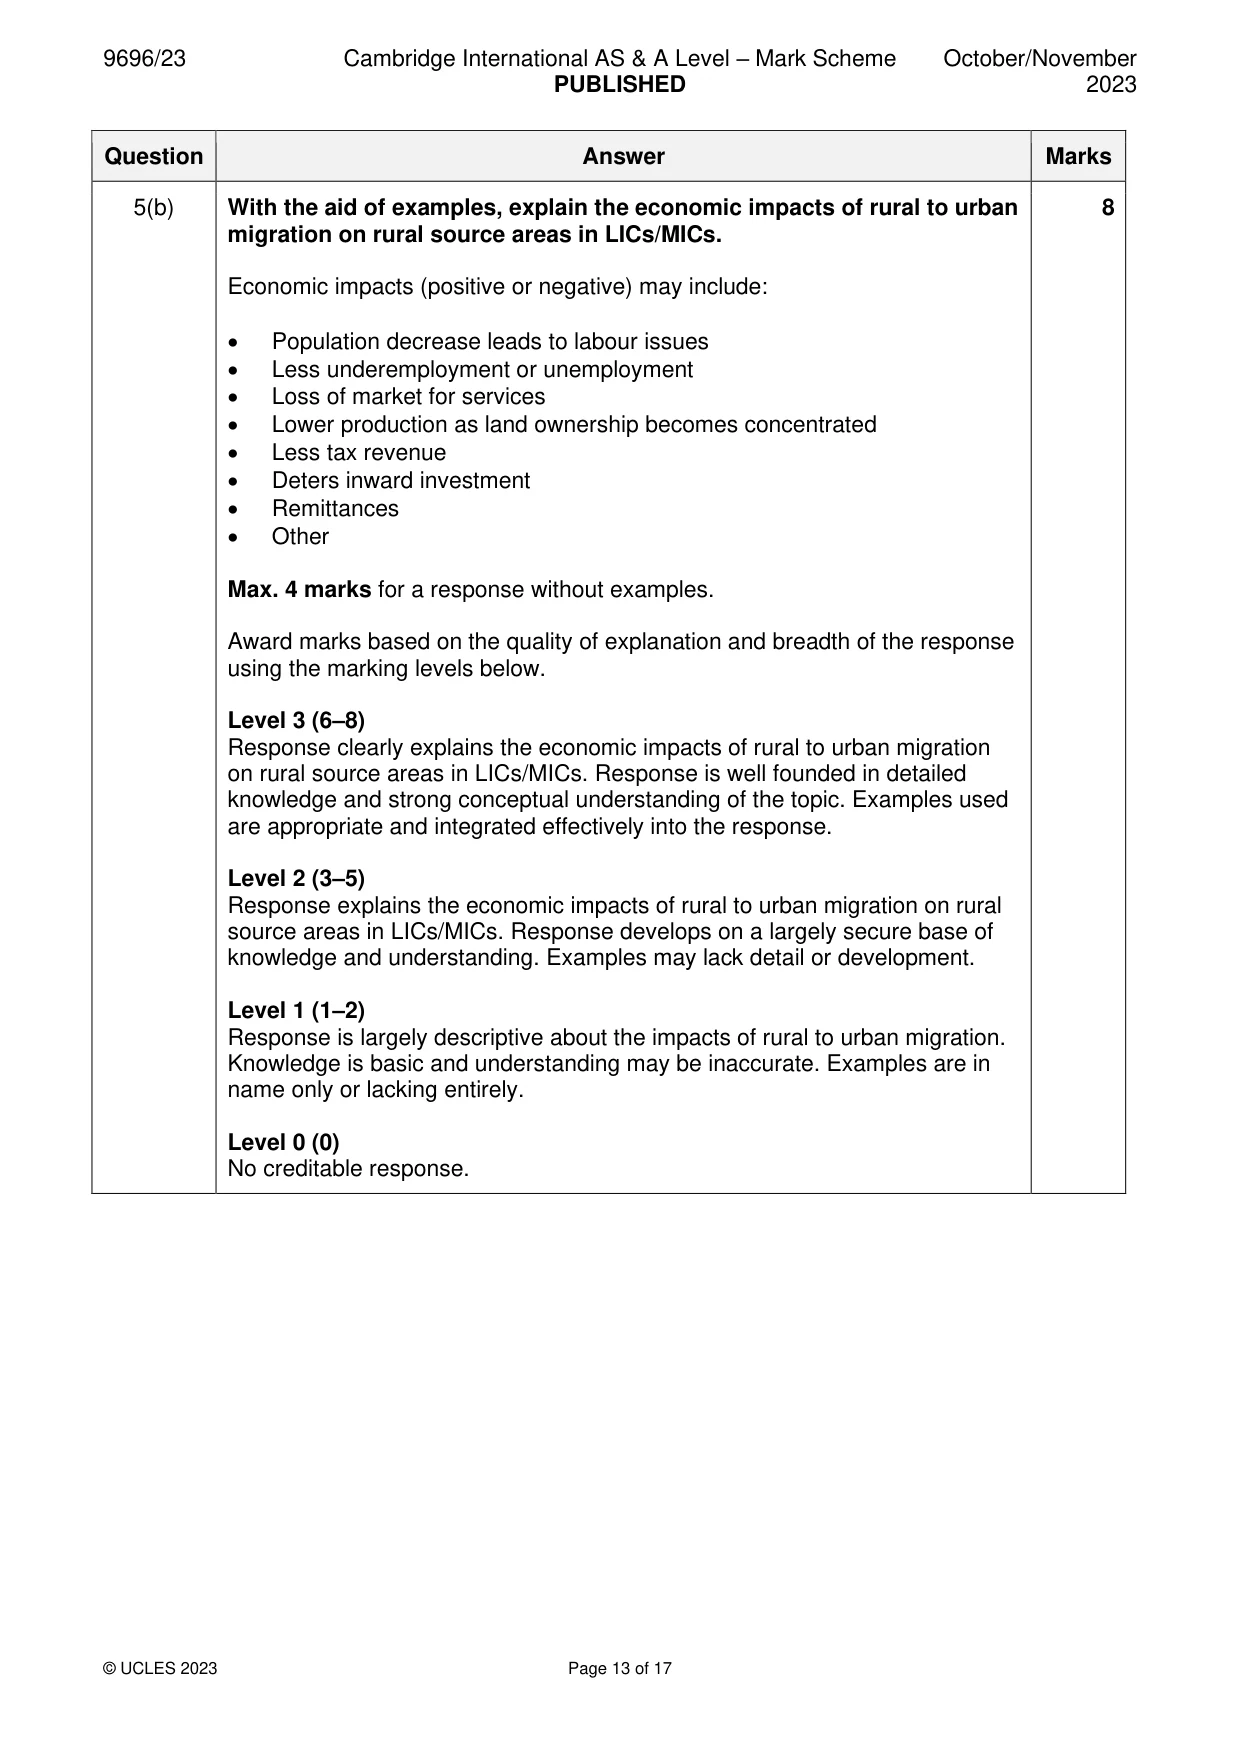
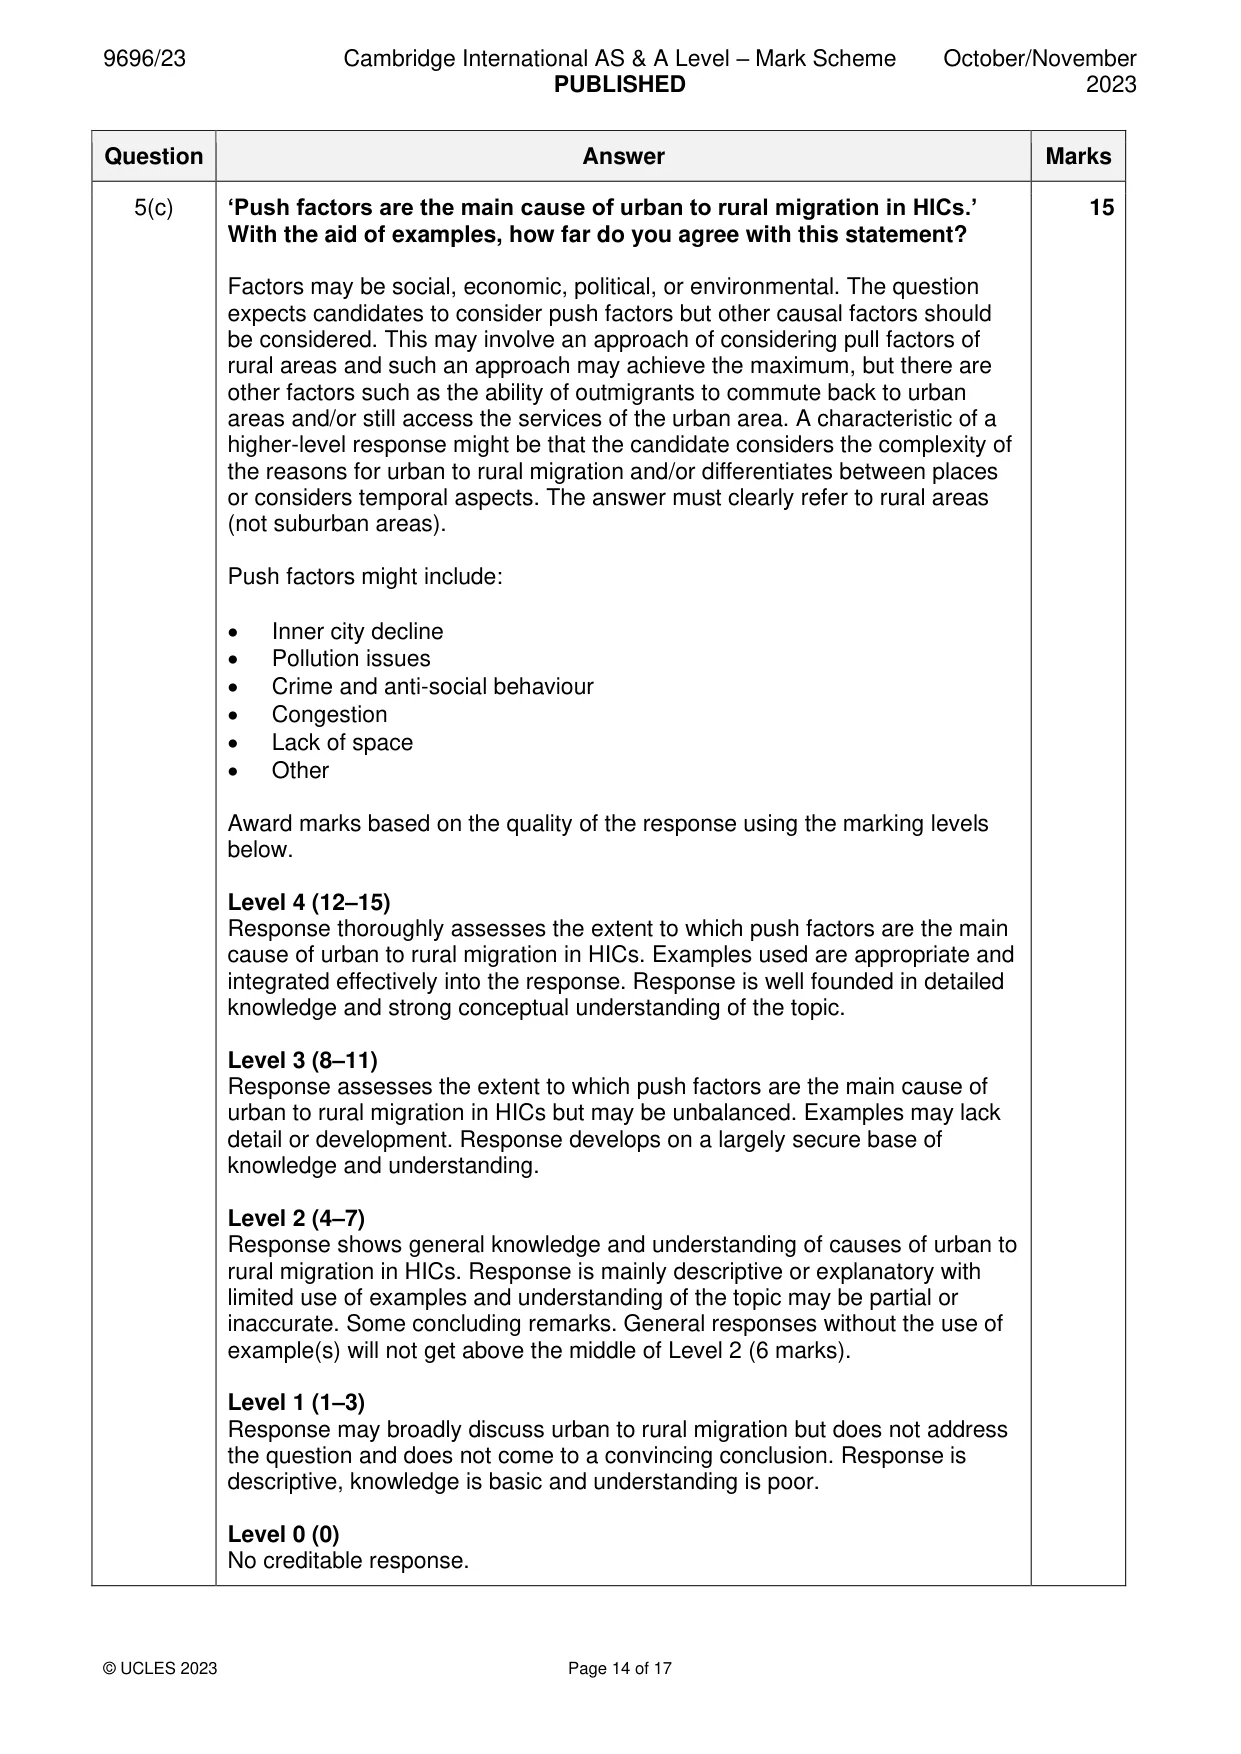
Mark scheme: 5(a)(i) Define the term voluntary migration. 3 The individual has a free choice (1) to move place of residence (1) for a least a year (1). 5(a)(ii) Describe two physical barriers to migration. 4 Physical barriers may include: • Mountain ranges • Extensive areas of desert • Large bodies of water • Major rivers • Physical borders, e.g. fences/walls • Other For each physical barrier to migration: 1 mark for a simple point, 2 marks for a developed point, such as named/located barriers or linking to a migration stream. 5(b) With the aid of examples, explain the economic impacts of rural to urban 8 migration on rural source areas in LICs/MICs. Economic impacts (positive or negative) may include: • Population decrease leads to labour issues • Less underemployment or unemployment • Loss of market for services • Lower production as land ownership becomes concentrated • Less tax revenue • Deters inward investment • Remittances • Other Max. 4 marks for a response without examples. Award marks based on the quality of explanation and breadth of the response using the marking levels below. Level 3 (6–8) Response clearly explains the economic impacts of rural to urban migration on rural source areas in LICs/MICs. Response is well founded in detailed knowledge and strong conceptual understanding of the topic. Examples used are appropriate and integrated effectively into the response. Level 2 (3–5) Response explains the economic impacts of rural to urban migration on rural source areas in LICs/MICs. Response develops on a largely secure base of knowledge and understanding. Examples may lack detail or development. Level 1 (1–2) Response is largely descriptive about the impacts of rural to urban migration. Knowledge is basic and understanding may be inaccurate. Examples are in name only or lacking entirely. Level 0 (0) No creditable response. 5(c) ‘Push factors are the main cause of urban to rural migration in HICs.’ 15 With the aid of examples, how far do you agree with this statement? Factors may be social, economic, political, or environmental. The question expects candidates to consider push factors but other causal factors should be considered. This may involve an approach of considering pull factors of rural areas and such an approach may achieve the maximum, but there are other factors such as the ability of outmigrants to commute back to urban areas and/or still access the services of the urban area. A characteristic of a higher-level response might be that the candidate considers the complexity of the reasons for urban to rural migration and/or differentiates between places or considers temporal aspects. The answer must clearly refer to rural areas (not suburban areas). Push factors might include: • Inner city decline • Pollution issues • Crime and anti-social behaviour • Congestion • Lack of space • Other Award marks based on the quality of the response using the marking levels below. Level 4 (12–15) Response thoroughly assesses the extent to which push factors are the main cause of urban to rural migration in HICs. Examples used are appropriate and integrated effectively into the response. Response is well founded in detailed knowledge and strong conceptual understanding of the topic. Level 3 (8–11) Response assesses the extent to which push factors are the main cause of urban to rural migration in HICs but may be unbalanced. Examples may lack detail or development. Response develops on a largely secure base of knowledge and understanding. Level 2 (4–7) Response shows general knowledge and understanding of causes of urban to rural migration in HICs. Response is mainly descriptive or explanatory with limited use of examples and understanding of the topic may be partial or inaccurate. Some concluding remarks. General responses without the use of example(s) will not get above the middle of Level 2 (6 marks). Level 1 (1–3) Response may broadly discuss urban to rural migration but does not address the question and does not come to a convincing conclusion. Response is descriptive, knowledge is basic and understanding is poor. Level 0 (0) No creditable response. Settlement dynamics
Q6 · Outline the main recent urban trends in HICs
6 (a) Outline the main recent urban trends in HICs. [7] (b) For your case study of a shanty town (squatter settlement) in an LIC or MIC, explain the challenges for its management. [8] (c) Evaluate the success of the attempted solutions to the challenges you explained in (b). [15]
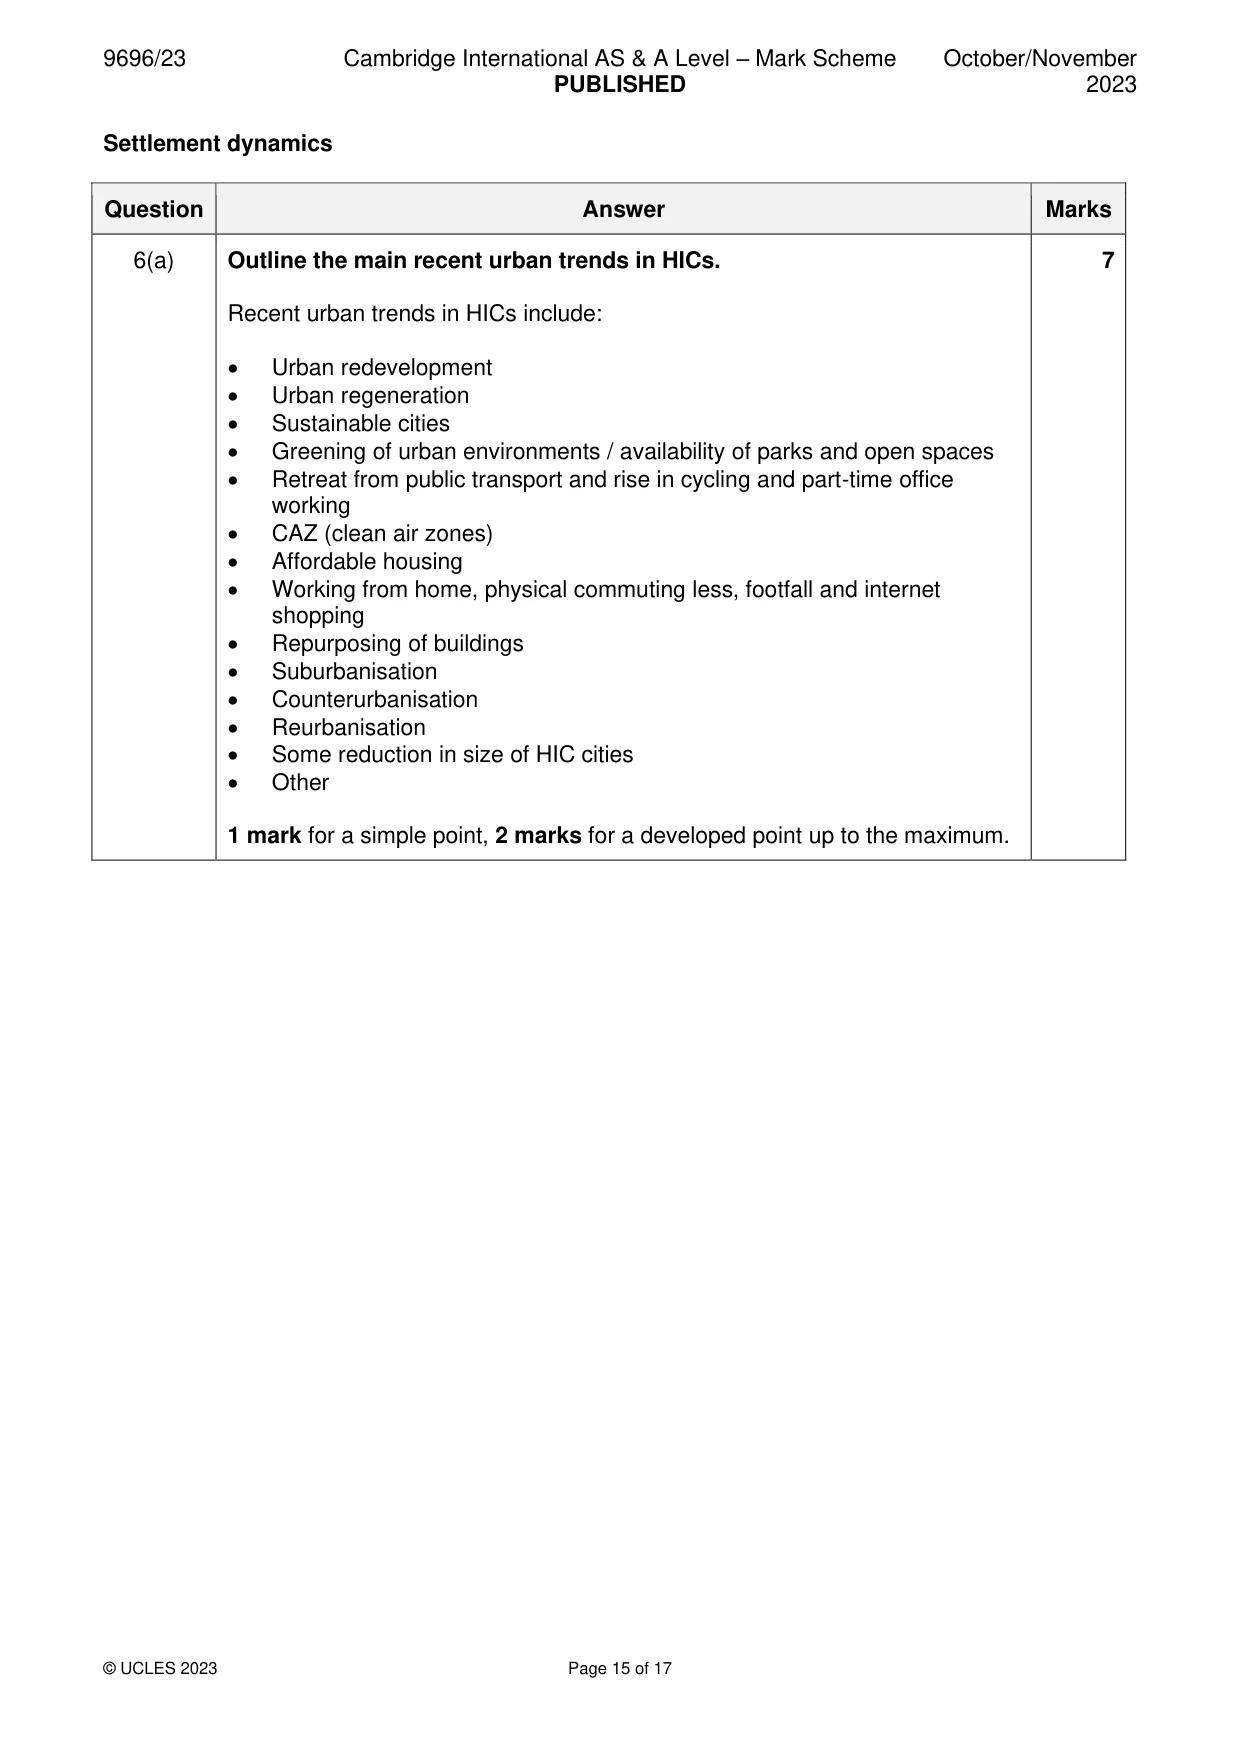
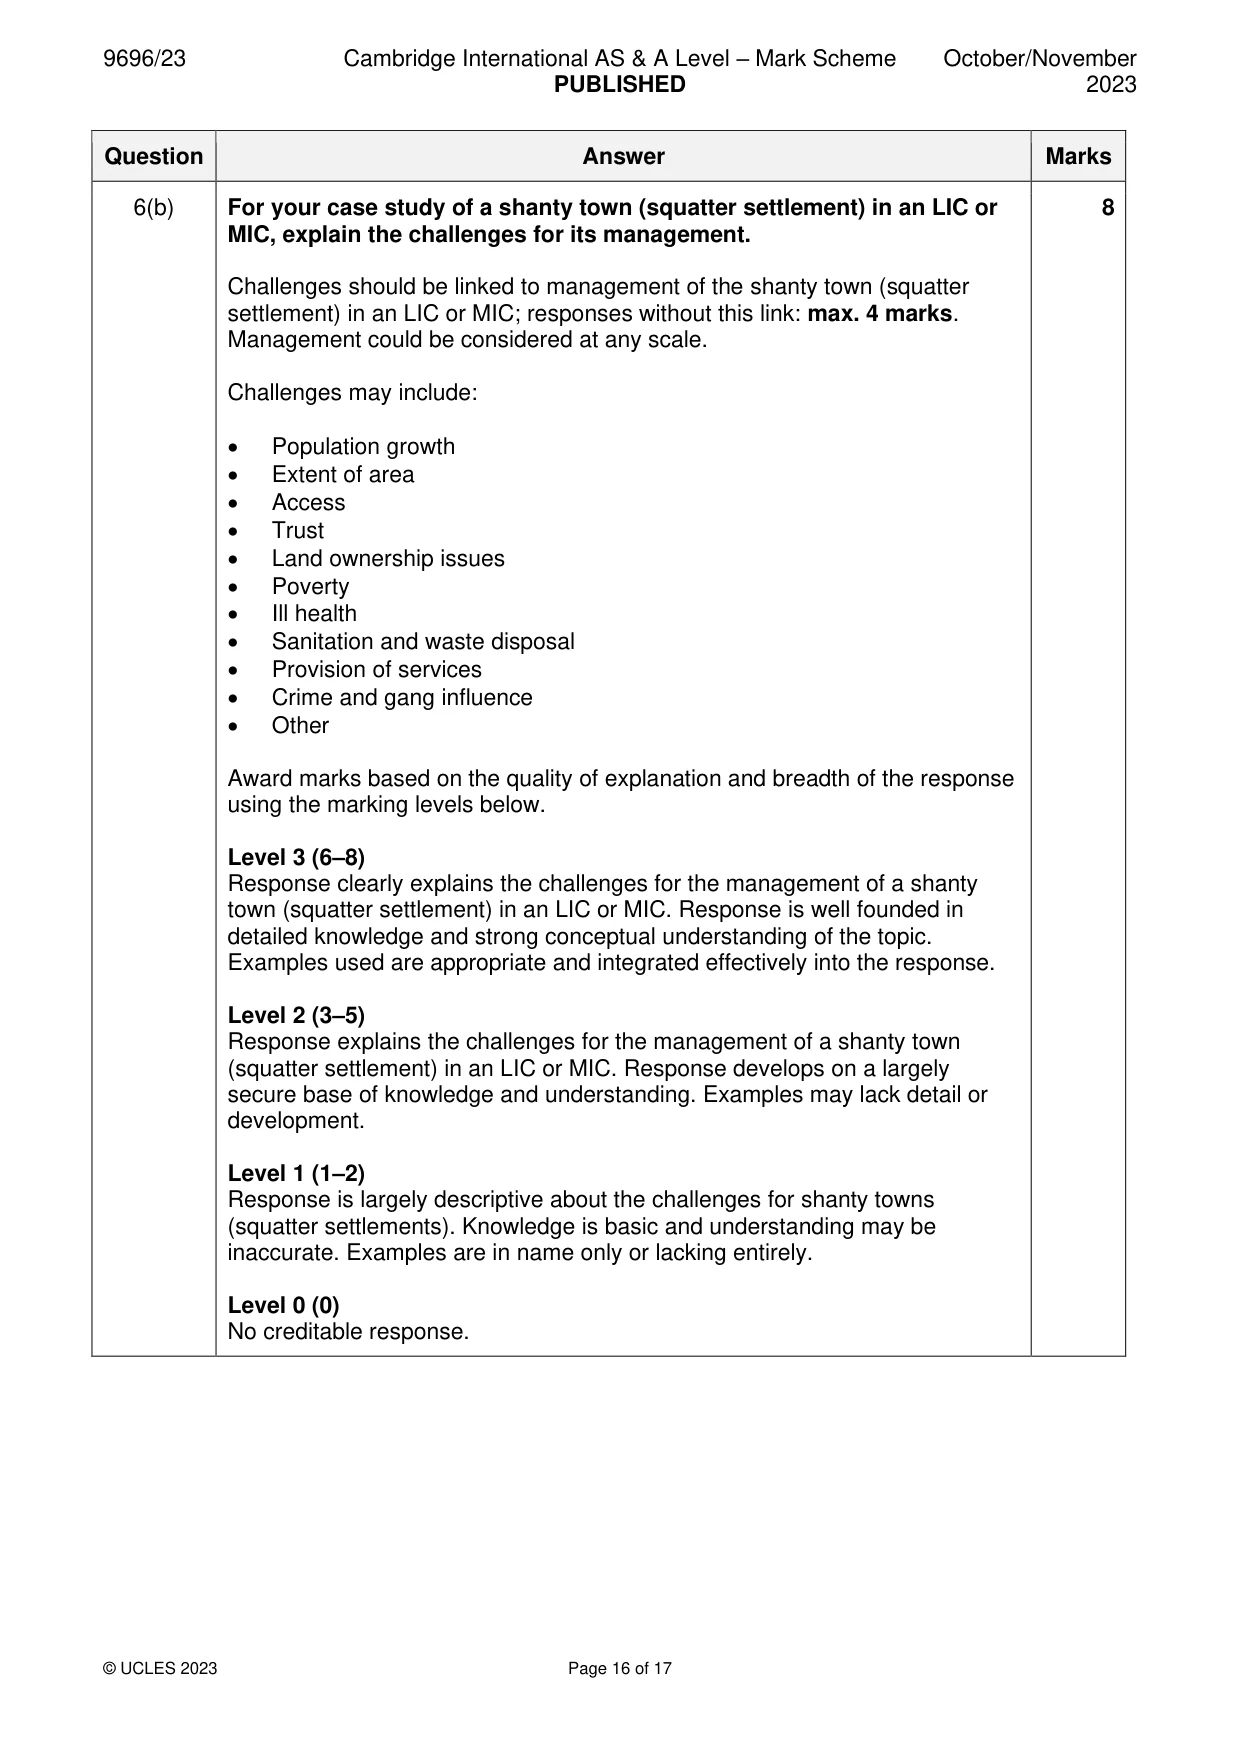
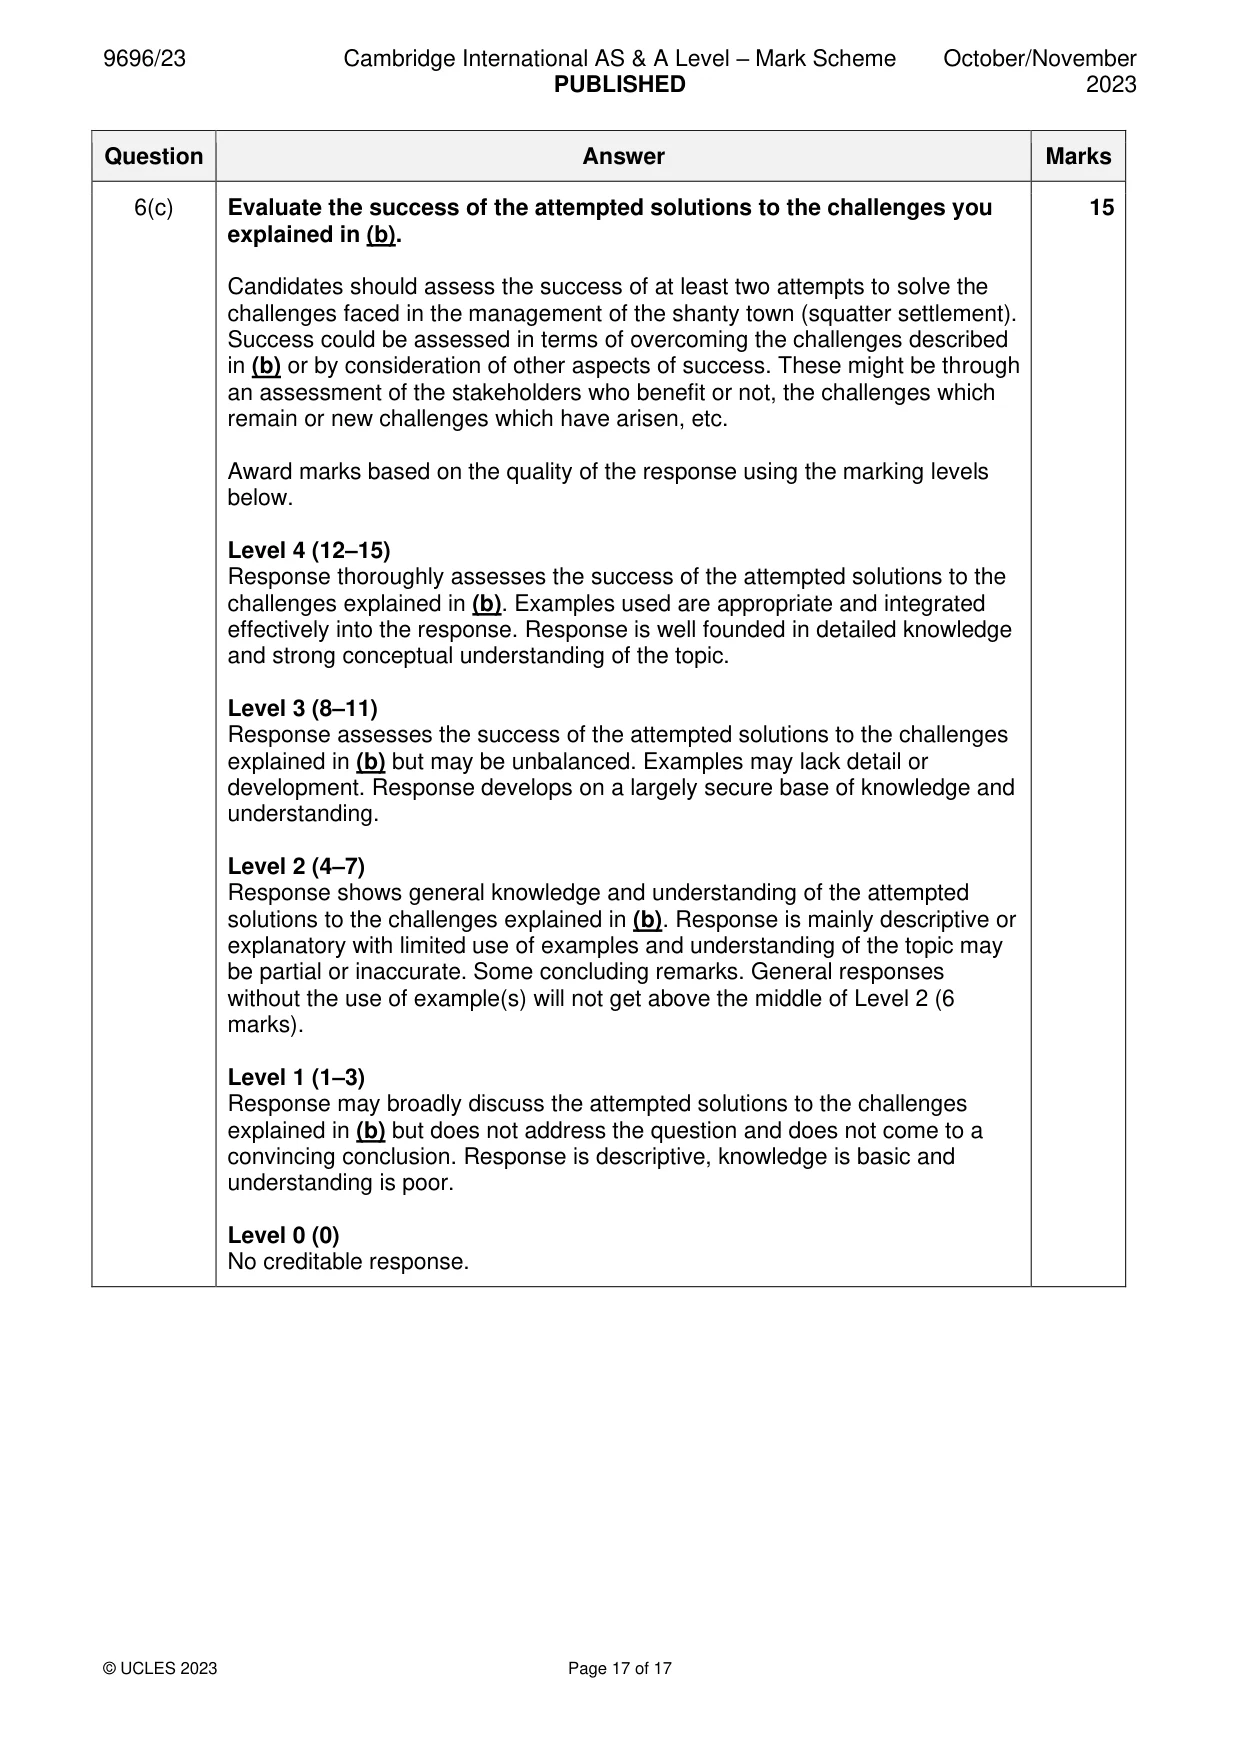
Mark scheme: 6(a) Outline the main recent urban trends in HICs. 7 Recent urban trends in HICs include: • Urban redevelopment • Urban regeneration • Sustainable cities • Greening of urban environments / availability of parks and open spaces • Retreat from public transport and rise in cycling and part-time office working • CAZ (clean air zones) • Affordable housing • Working from home, physical commuting less, footfall and internet shopping • Repurposing of buildings • Suburbanisation • Counterurbanisation • Reurbanisation • Some reduction in size of HIC cities • Other 1 mark for a simple point, 2 marks for a developed point up to the maximum. 6(b) For your case study of a shanty town (squatter settlement) in an LIC or 8 MIC, explain the challenges for its management. Challenges should be linked to management of the shanty town (squatter settlement) in an LIC or MIC; responses without this link: max. 4 marks. Management could be considered at any scale. Challenges may include: • Population growth • Extent of area • Access • Trust • Land ownership issues • Poverty • Ill health • Sanitation and waste disposal • Provision of services • Crime and gang influence • Other Award marks based on the quality of explanation and breadth of the response using the marking levels below. Level 3 (6–8) Response clearly explains the challenges for the management of a shanty town (squatter settlement) in an LIC or MIC. Response is well founded in detailed knowledge and strong conceptual understanding of the topic. Examples used are appropriate and integrated effectively into the response. Level 2 (3–5) Response explains the challenges for the management of a shanty town (squatter settlement) in an LIC or MIC. Response develops on a largely secure base of knowledge and understanding. Examples may lack detail or development. Level 1 (1–2) Response is largely descriptive about the challenges for shanty towns (squatter settlements). Knowledge is basic and understanding may be inaccurate. Examples are in name only or lacking entirely. Level 0 (0) No creditable response. 6(c) Evaluate the success of the attempted solutions to the challenges you 15 explained in (b). Candidates should assess the success of at least two attempts to solve the challenges faced in the management of the shanty town (squatter settlement). Success could be assessed in terms of overcoming the challenges described in (b) or by consideration of other aspects of success. These might be through an assessment of the stakeholders who benefit or not, the challenges which remain or new challenges which have arisen, etc. Award marks based on the quality of the response using the marking levels below. Level 4 (12–15) Response thoroughly assesses the success of the attempted solutions to the challenges explained in (b). Examples used are appropriate and integrated effectively into the response. Response is well founded in detailed knowledge and strong conceptual understanding of the topic. Level 3 (8–11) Response assesses the success of the attempted solutions to the challenges explained in (b) but may be unbalanced. Examples may lack detail or development. Response develops on a largely secure base of knowledge and understanding. Level 2 (4–7) Response shows general knowledge and understanding of the attempted solutions to the challenges explained in (b). Response is mainly descriptive or explanatory with limited use of examples and understanding of the topic may be partial or inaccurate. Some concluding remarks. General responses without the use of example(s) will not get above the middle of Level 2 (6 marks). Level 1 (1–3) Response may broadly discuss the attempted solutions to the challenges explained in (b) but does not address the question and does not come to a convincing conclusion. Response is descriptive, knowledge is basic and understanding is poor. Level 0 (0) No creditable response.
What was in this paper
The subtopics covered by these 6 questions, and how many questions each got. Open one in a new tab to see every Cambridge question on it.
What you needed in this session
Cambridge’s own grade thresholds for 2023 Oct/Nov, Paper 2 · Variant 3. A higher threshold means an easier paper — the bar moves with how the cohort did.