Cambridge A Level Geography 9696 — 2025 May/June Paper 3 · Variant 3
9696/33/M/J/25 · 11 questions · 60 marks · ≈68 min
The question paper and its mark scheme, free to read here and free to download. This is Cambridge’s own paper, exactly as it was sat.
Question paper4 pages

Mark scheme29 pages
Answers below. Sit the paper first if you are practising.












Questions as text
Q1 · A photograph which shows vegetation in a seasonally humid tropical (savanna) ecosystem in…
1 Fig. 1.1 is a photograph which shows vegetation in a seasonally humid tropical (savanna) ecosystem in Botswana, Africa. (a) Describe four characteristics of the vegetation shown in Fig. 1.1. [4] (b) Explain how the seasonally humid tropical climate has influenced the characteristics of the vegetation shown in Fig. 1.1. [6]
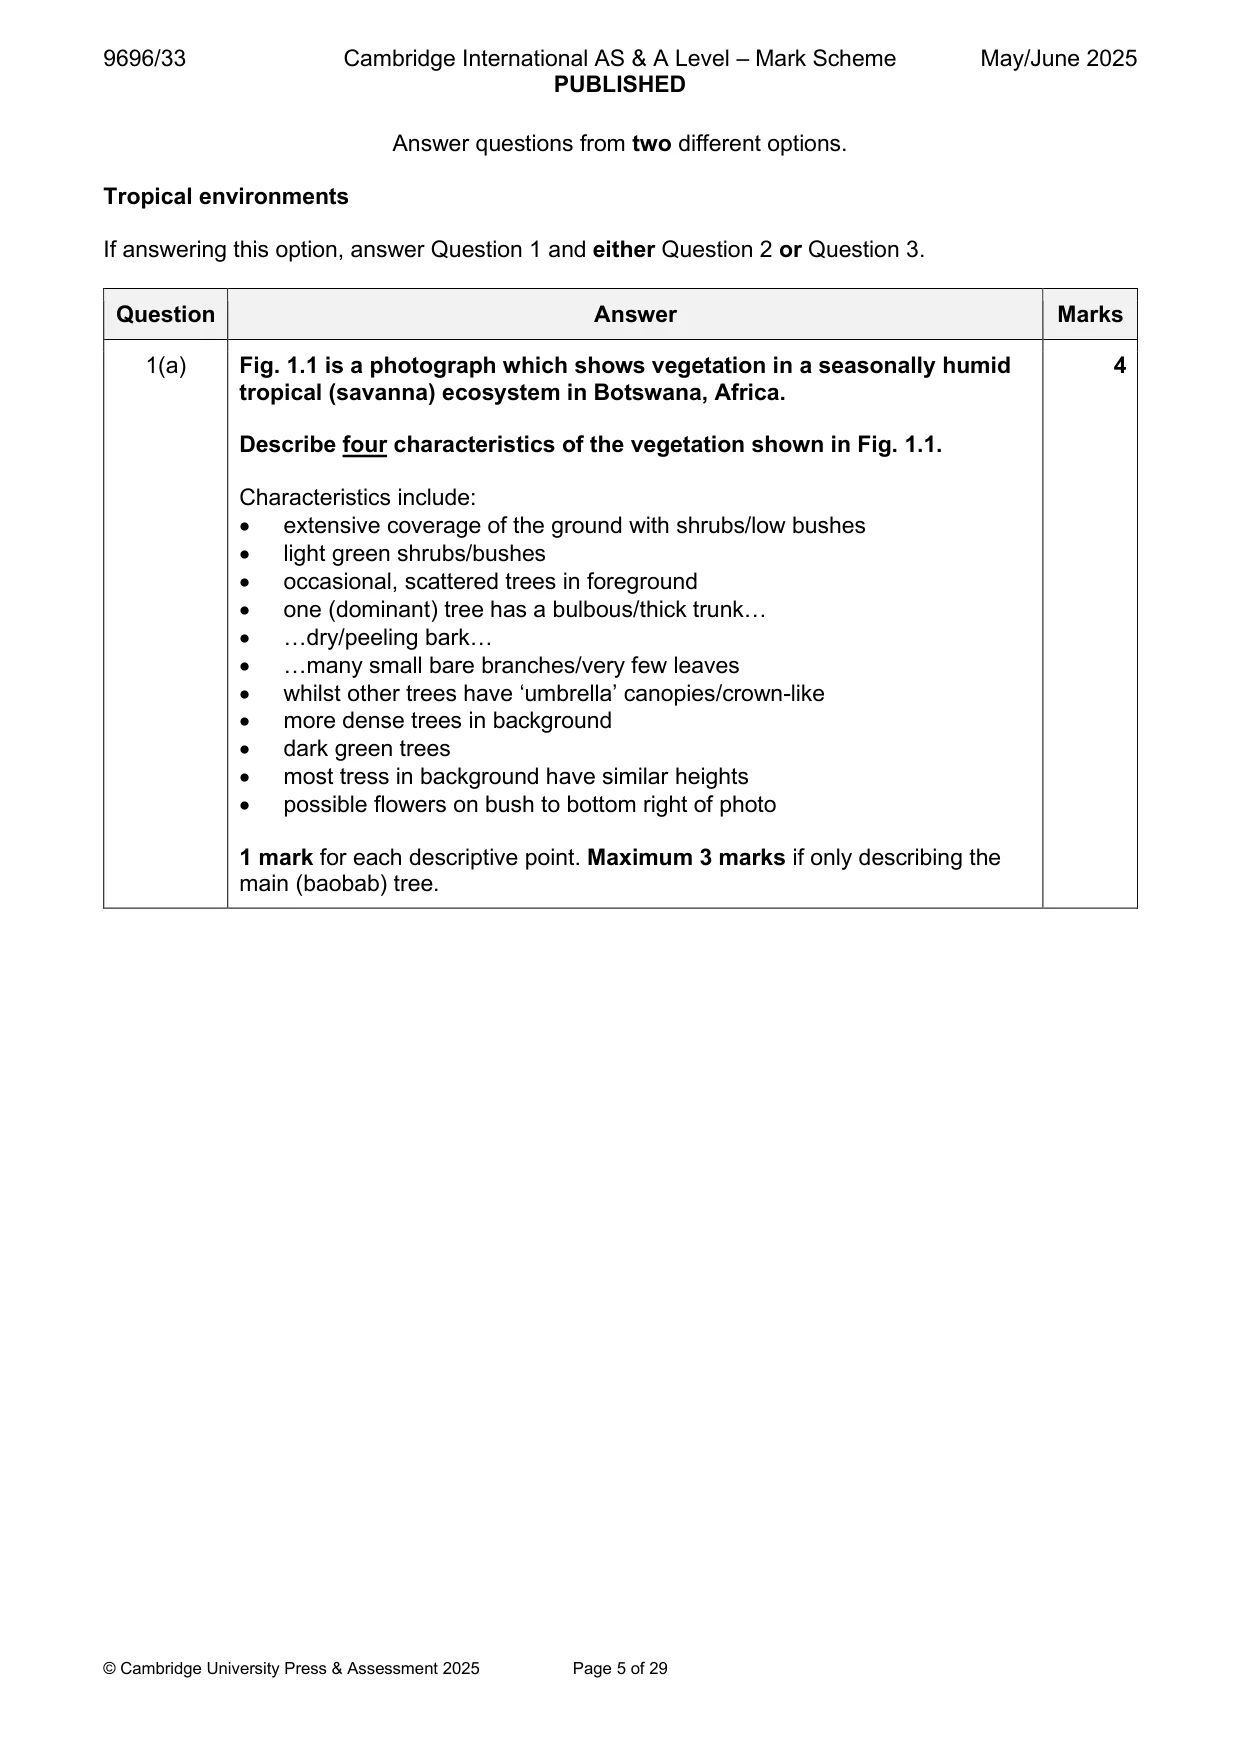
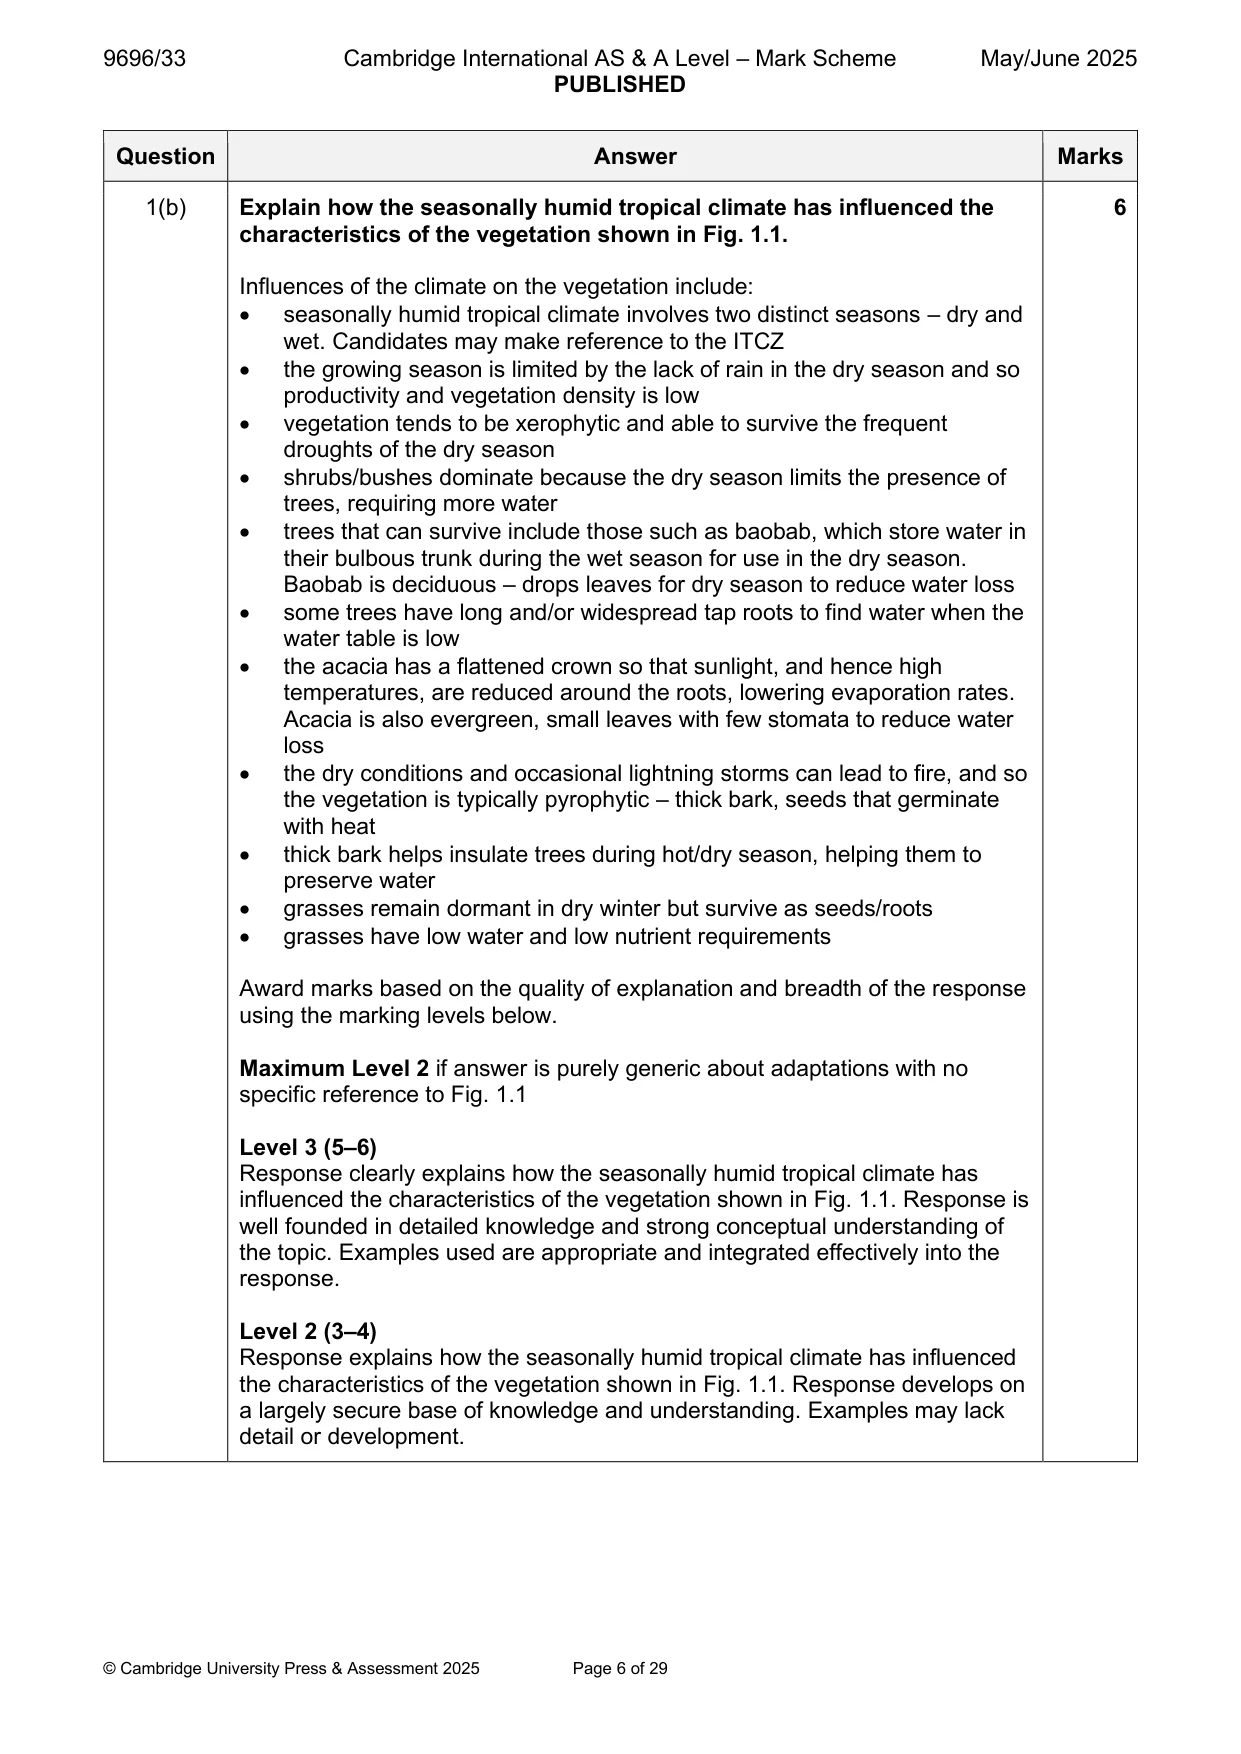
Mark scheme: Question Answer Marks 1(a) Fig. 1.1 is a photograph which shows vegetation in a seasonally humid 4 tropical (savanna) ecosystem in Botswana, Africa. Describe four characteristics of the vegetation shown in Fig. 1.1. Characteristics include: • extensive coverage of the ground with shrubs/low bushes • light green shrubs/bushes • occasional, scattered trees in foreground • one (dominant) tree has a bulbous/thick trunk… • …dry/peeling bark… • …many small bare branches/very few leaves • whilst other trees have ‘umbrella’ canopies/crown-like • more dense trees in background • dark green trees • most tress in background have similar heights • possible flowers on bush to bottom right of photo 1 mark for each descriptive point. Maximum 3 marks if only describing the main (baobab) tree. 1(b) Explain how the seasonally humid tropical climate has influenced the 6 characteristics of the vegetation shown in Fig. 1.1. Influences of the climate on the vegetation include: • seasonally humid tropical climate involves two distinct seasons – dry and wet. Candidates may make reference to the ITCZ • the growing season is limited by the lack of rain in the dry season and so productivity and vegetation density is low • vegetation tends to be xerophytic and able to survive the frequent droughts of the dry season • shrubs/bushes dominate because the dry season limits the presence of trees, requiring more water • trees that can survive include those such as baobab, which store water in their bulbous trunk during the wet season for use in the dry season. Baobab is deciduous – drops leaves for dry season to reduce water loss • some trees have long and/or widespread tap roots to find water when the water table is low • the acacia has a flattened crown so that sunlight, and hence high temperatures, are reduced around the roots, lowering evaporation rates. Acacia is also evergreen, small leaves with few stomata to reduce water loss • the dry conditions and occasional lightning storms can lead to fire, and so the vegetation is typically pyrophytic – thick bark, seeds that germinate with heat • thick bark helps insulate trees during hot/dry season, helping them to preserve water • grasses remain dormant in dry winter but survive as seeds/roots • grasses have low water and low nutrient requirements Award marks based on the quality of explanation and breadth of the response using the marking levels below. Maximum Level 2 if answer is purely generic about adaptations with no specific reference to Fig. 1.1 Level 3 (5–6) Response clearly explains how the seasonally humid tropical climate has influenced the characteristics of the vegetation shown in Fig. 1.1. Response is well founded in detailed knowledge and strong conceptual understanding of the topic. Examples used are appropriate and integrated effectively into the response. Level 2 (3–4) Response explains how the seasonally humid tropical climate has influenced the characteristics of the vegetation shown in Fig. 1.1. Response develops on a largely secure base of knowledge and understanding. Examples may lack detail or development. 1(b) Level 1 (1–2) Response describes how the seasonally humid tropical climate has influenced the characteristics of the vegetation shown in Fig. 1.1. Knowledge is basic and understanding may be inaccurate. Examples are in name only or lacking entirely. Level 0 (0) No creditable response.
Q2 · ‘The characteristics of the humid tropical climate are mainly caused by the intertropical…
2 ‘The characteristics of the humid tropical climate are mainly caused by the intertropical convergence zone (ITCZ).’ How far do you agree with this statement? [20]
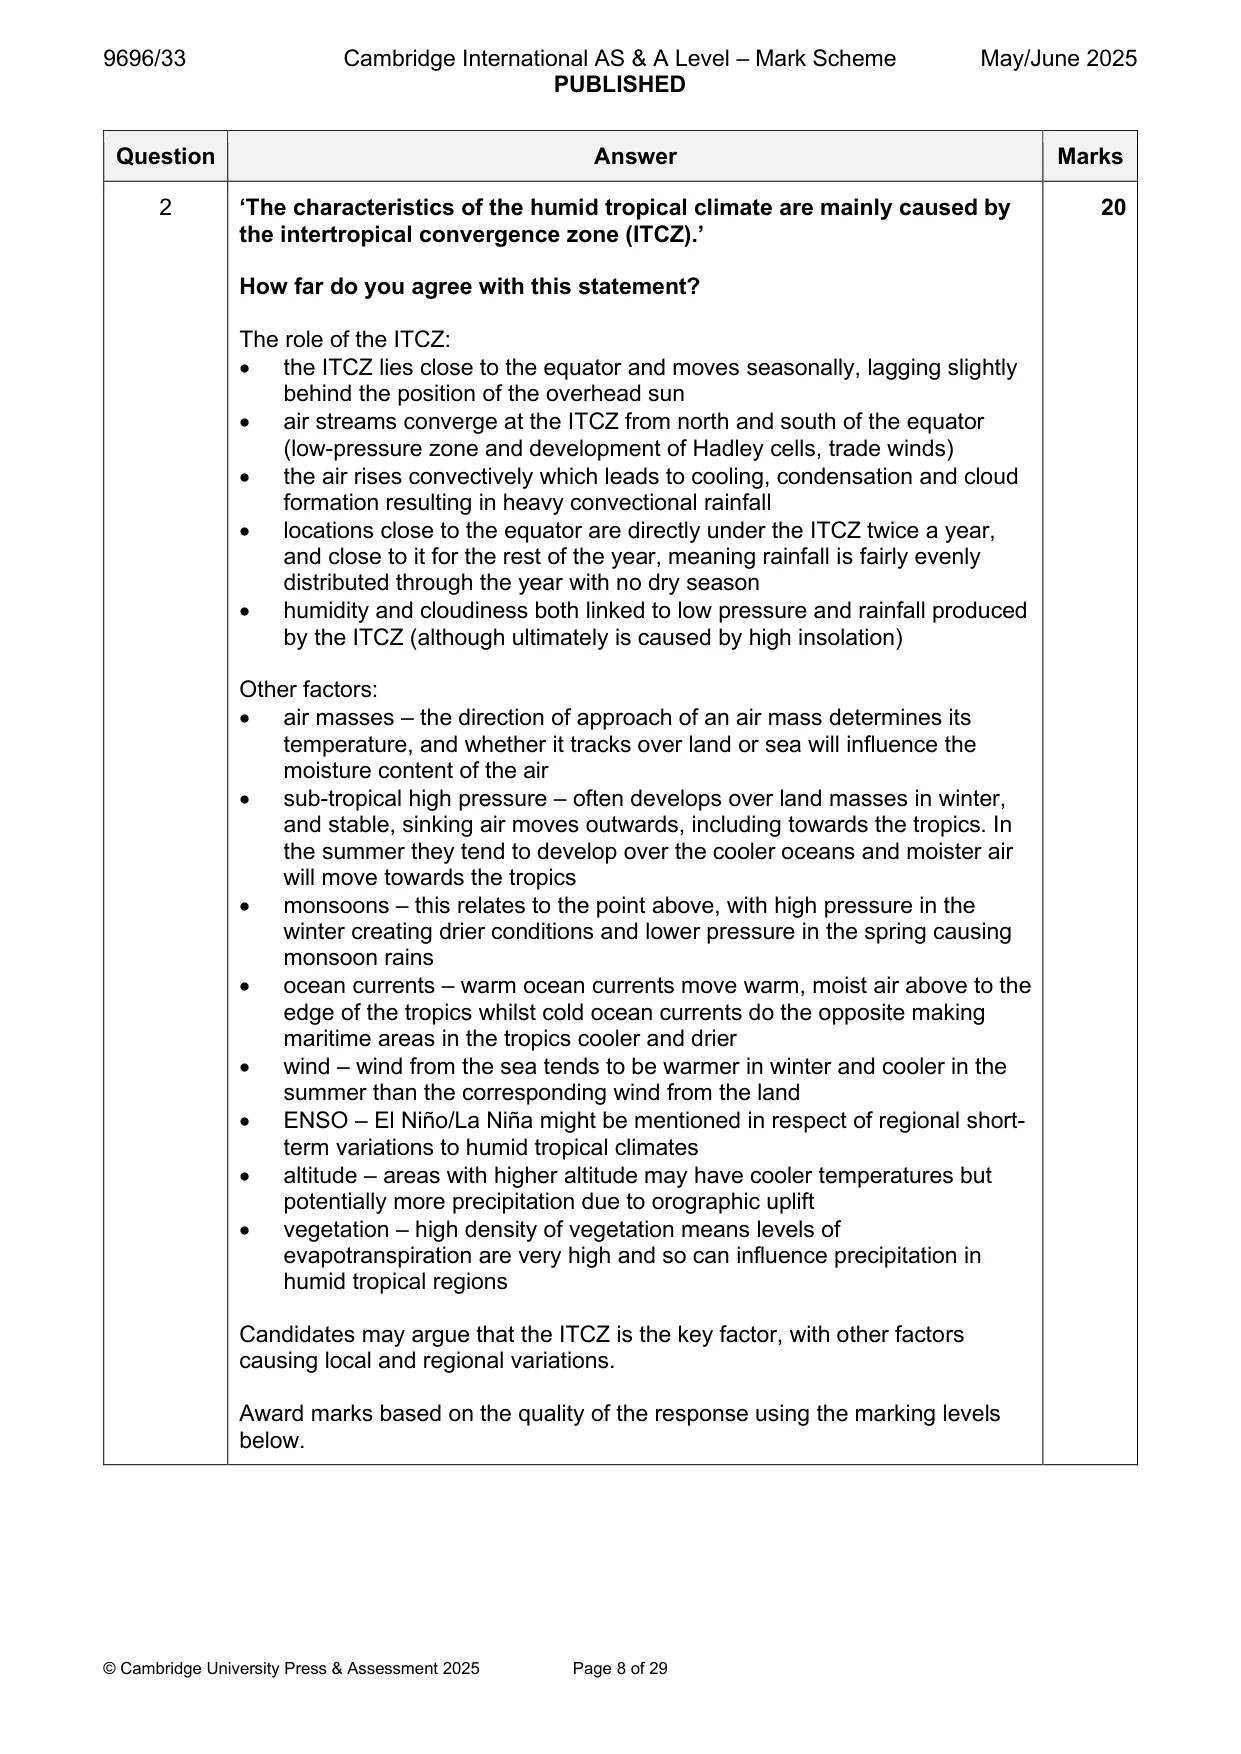
Mark scheme: 2 ‘The characteristics of the humid tropical climate are mainly caused by 20 the intertropical convergence zone (ITCZ).’ How far do you agree with this statement? The role of the ITCZ: • the ITCZ lies close to the equator and moves seasonally, lagging slightly behind the position of the overhead sun • air streams converge at the ITCZ from north and south of the equator (low-pressure zone and development of Hadley cells, trade winds) • the air rises convectively which leads to cooling, condensation and cloud formation resulting in heavy convectional rainfall • locations close to the equator are directly under the ITCZ twice a year, and close to it for the rest of the year, meaning rainfall is fairly evenly distributed through the year with no dry season • humidity and cloudiness both linked to low pressure and rainfall produced by the ITCZ (although ultimately is caused by high insolation) Other factors: • air masses – the direction of approach of an air mass determines its temperature, and whether it tracks over land or sea will influence the moisture content of the air • sub-tropical high pressure – often develops over land masses in winter, and stable, sinking air moves outwards, including towards the tropics. In the summer they tend to develop over the cooler oceans and moister air will move towards the tropics • monsoons – this relates to the point above, with high pressure in the winter creating drier conditions and lower pressure in the spring causing monsoon rains • ocean currents – warm ocean currents move warm, moist air above to the edge of the tropics whilst cold ocean currents do the opposite making maritime areas in the tropics cooler and drier • wind – wind from the sea tends to be warmer in winter and cooler in the summer than the corresponding wind from the land • ENSO – El Niño/La Niña might be mentioned in respect of regional short- term variations to humid tropical climates • altitude – areas with higher altitude may have cooler temperatures but potentially more precipitation due to orographic uplift • vegetation – high density of vegetation means levels of evapotranspiration are very high and so can influence precipitation in humid tropical regions Candidates may argue that the ITCZ is the key factor, with other factors causing local and regional variations. Award marks based on the quality of the response using the marking levels below. 2 Level 4 (16–20) Response thoroughly discusses the extent to which the characteristics of the humid tropical climate are mainly caused by the intertropical convergence zone (ITCZ). An effective and sustained evaluation with a sound conclusion. Response is well founded in detailed exemplar knowledge and strong conceptual understanding of the topic. Examples used are appropriate and integrated effectively into the response. Level 3 (11–15) Response discusses the extent to which the characteristics of the humid tropical climate are mainly caused by the intertropical convergence zone (ITCZ). Response is broadly evaluative in character, comprising some explanatory or narrative content and a conclusion. Response develops on a largely secure base of knowledge and understanding with the use of example(s). Level 2 (6–10) Response demonstrates some knowledge and understanding of the extent to which the characteristics of the humid tropical climate are mainly caused by the intertropical convergence zone (ITCZ). Response is mainly descriptive or explanatory in approach and contains a brief or thinly supported evaluation. Responses without the use of example(s) to support the response will not get above the middle of Level 2 (8 marks). Level 1 (1–5) Response makes a few general points about the causes of the characteristics of the humid tropical climate. A descriptive response comprising a few simple points. Knowledge is basic and understanding may be poor and lack relevance to the question set. Level 0 (0) No creditable response.
Q3 · Assess the relative importance of the factors influencing tropical soil formation
3 Assess the relative importance of the factors influencing tropical soil formation. [20] Coastal environments If answering this option, answer Question 4 and either Question 5 or Question 6.
Mark scheme: 3 Assess the relative importance of the factors influencing tropical soil 20 formation. Influencing factors include: • climate – rainfall (length of wet/dry seasons as well as quantity), temperature • vegetation – type, density • organisms – micro-organisms, insects, burrowing animals • relief – altitude, gradient, aspect • parent material – bedrock and superficial deposits, affects mineral composition and texture • time – the medium through which the other factors operate; soil formation is a slow process • fire – releasing nutrients from vegetation • human influence – use of heavy machinery, agricultural practices (overgrazing, monocultures, fertilisers, irrigation, etc.), fire. Changes the characteristics of soil more than having an influence on formation. Tropical soils include: • oxisols/latosols • tropical red earths • tropical brown earths Soil forming processes include: • lateritization • humification • leaching/illuviation • weathering – rates/types Candidates may consider the importance of these factors at different scales (local to widespread) and/or over time. Award marks based on the quality of the response using the marking levels below. Level 4 (16–20) Response thoroughly discusses the relative importance of the factors influencing tropical soil formation. An effective and sustained evaluation with a sound conclusion. Response is well founded in detailed exemplar knowledge and strong conceptual understanding of the topic. Examples used are appropriate and integrated effectively into the response. Level 3 (11–15) Response discusses the relative importance of the factors influencing tropical soil formation. Response is broadly evaluative in character, comprising some explanatory or narrative content and a conclusion. Response develops on a largely secure base of knowledge and understanding with the use of example(s). 3 Level 2 (6–10) Response demonstrates some knowledge and understanding of the relative importance of the factors influencing tropical soil formation. Response is mainly descriptive or explanatory in approach and contains a brief or thinly supported evaluation. Responses without the use of example(s) to support the response will not get above the middle of Level 2 (8 marks). Level 1 (1–5) Response makes a few general points about factors influencing tropical soil formation. A descriptive response comprising a few simple points. Knowledge is basic and understanding may be poor and lack relevance to the question set. Level 0 (0) No creditable response. Coastal environments If answering this option, answer Question 4 and either Question 5 or Question 6.
Q4 · Beach volume changes along the coastline in Netarts Bay, Oregon, USA, 1997–99
4 Fig. 4.1 shows beach volume changes along the coastline in Netarts Bay, Oregon, USA, 1997–99. (a) Describe the pattern of beach volume changes shown in Fig. 4.1. [4] (b) Suggest two reasons for the pattern shown in Fig. 4.1. [6]
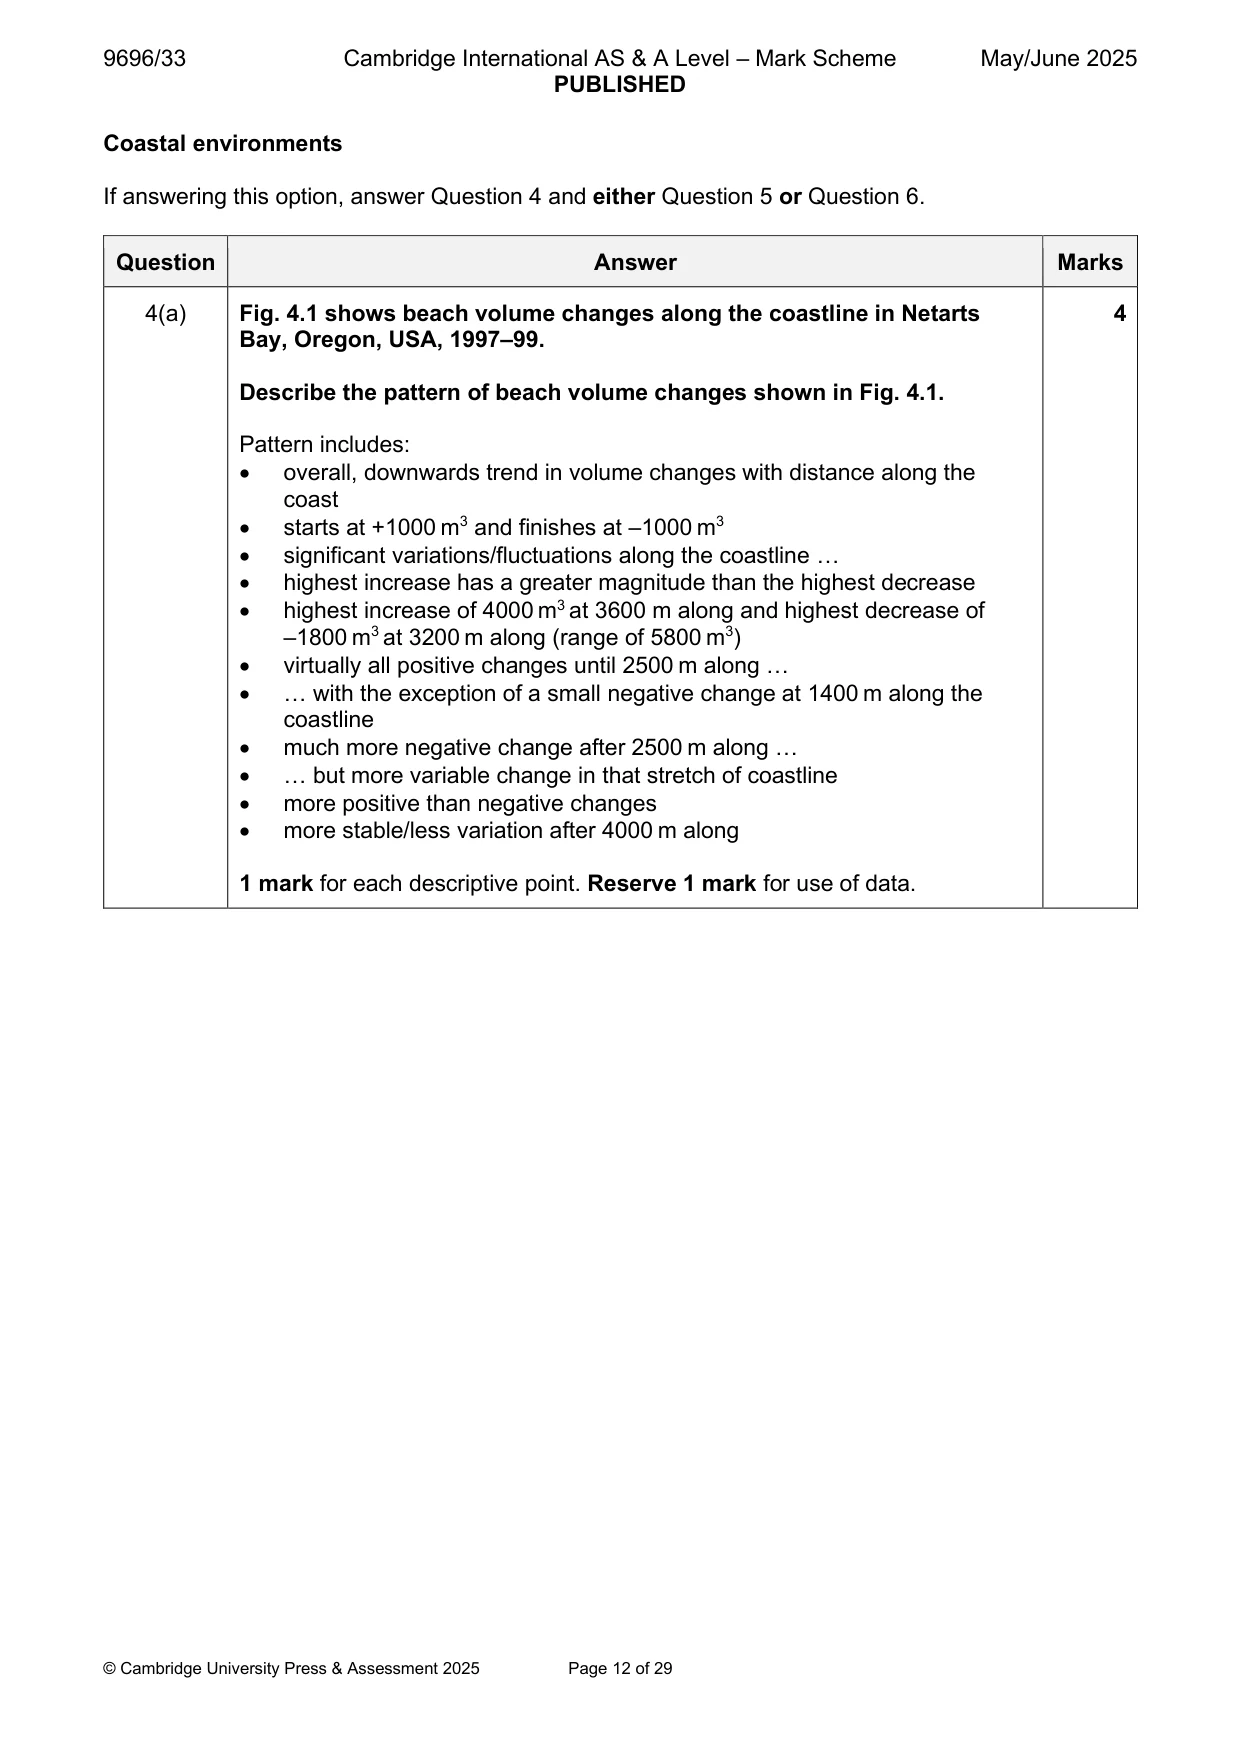
Mark scheme: 4(a) Fig. 4.1 shows beach volume changes along the coastline in Netarts 4 Bay, Oregon, USA, 1997–99. Describe the pattern of beach volume changes shown in Fig. 4.1. Pattern includes: • overall, downwards trend in volume changes with distance along the coast • starts at +1000 m3 and finishes at –1000 m3 • significant variations/fluctuations along the coastline … • highest increase has a greater magnitude than the highest decrease • highest increase of 4000 m3 at 3600 m along and highest decrease of –1800 m3 at 3200 m along (range of 5800 m3) • virtually all positive changes until 2500 m along … • … with the exception of a small negative change at 1400 m along the coastline • much more negative change after 2500 m along … • … but more variable change in that stretch of coastline • more positive than negative changes • more stable/less variation after 4000 m along 1 mark for each descriptive point. Reserve 1 mark for use of data. 4(b) Suggest two reasons for the pattern shown in Fig. 4.1. 6 Reasons could include: • exposure to higher energy, more erosive waves in some places resulting in volume loss • dominance of lower energy waves leading to deposition in more sheltered areas (bays potentially) resulting in volume gain • influence of longshore drift, removing sediment from areas with volume loss and transporting it to areas with volume gain • human activity – role of groynes trapping sediment in places causing volume gain; beach nourishment/recharge in areas of volume gain; sediment removal in areas of loss; role of artificial offshore bars/reefs • nature of sediment – sand or shingle may influence change due to weight of sediment • wave refraction – changes in depth of water may alter the direction and strength of waves leading to more erosion or deposition • increasing sediment supply from offshore bars, rivers, sand dunes, etc. Award marks based on the quality of explanation and breadth of the response using the marking levels below. Level 3 (5–6) Response clearly explains two reasons for the pattern shown in Fig. 4.1. Response is well founded in detailed knowledge and strong conceptual understanding of the topic. Examples used are appropriate and integrated effectively into the response. Level 2 (3–4) Response explains two reasons or clearly explains one reason for the pattern shown in Fig. 4.1. Response develops on a largely secure base of knowledge and understanding. Examples may lack detail or development. Level 1 (1–2) Response explains one or two reasons for the pattern shown in Fig. 4.1. Knowledge is basic and understanding may be inaccurate. Examples are in name only or lacking entirely. Level 0 (0) No creditable response.
Q5 · To what extent are erosional landforms influenced by sub-aerial processes in coastal…
5 To what extent are erosional landforms influenced by sub-aerial processes in coastal environments? [20]
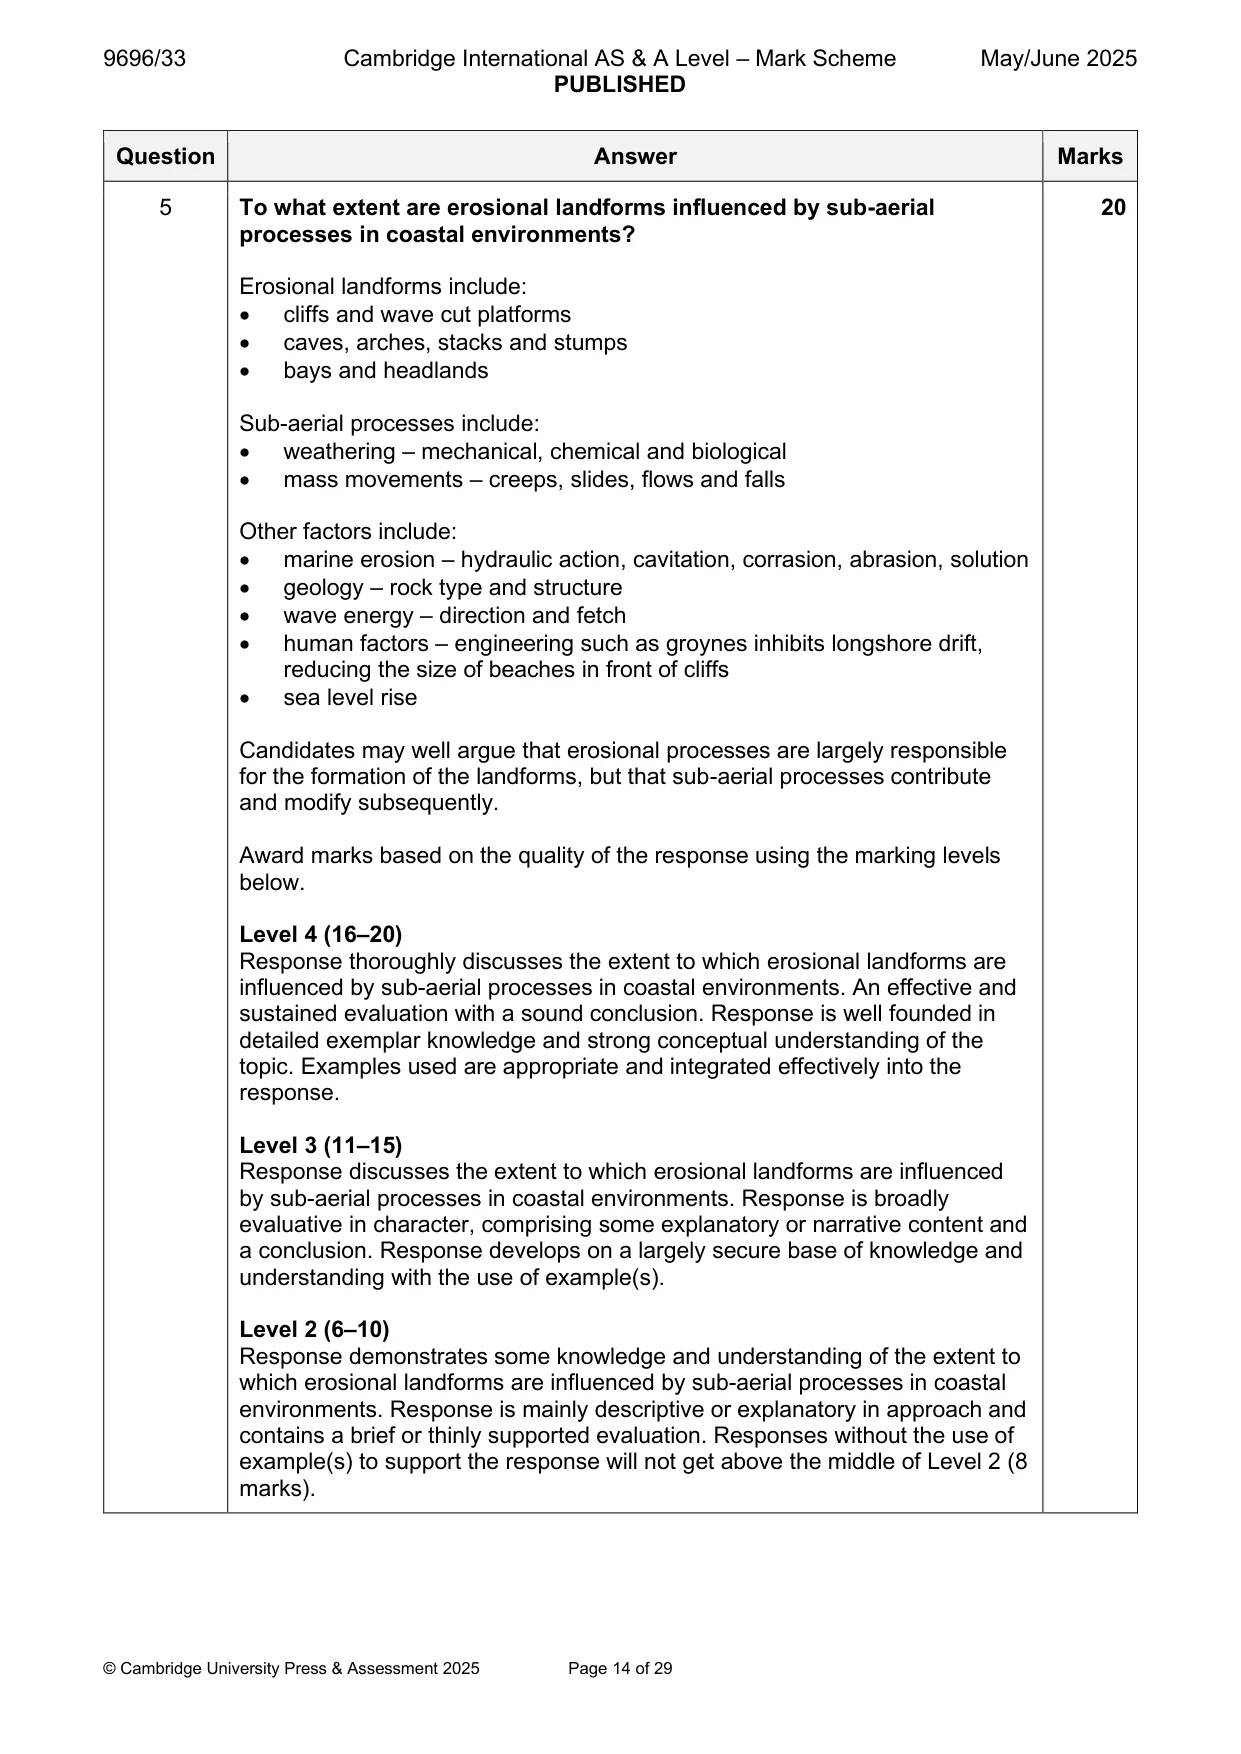
Mark scheme: 5 To what extent are erosional landforms influenced by sub-aerial 20 processes in coastal environments? Erosional landforms include: • cliffs and wave cut platforms • caves, arches, stacks and stumps • bays and headlands Sub-aerial processes include: • weathering – mechanical, chemical and biological • mass movements – creeps, slides, flows and falls Other factors include: • marine erosion – hydraulic action, cavitation, corrasion, abrasion, solution • geology – rock type and structure • wave energy – direction and fetch • human factors – engineering such as groynes inhibits longshore drift, reducing the size of beaches in front of cliffs • sea level rise Candidates may well argue that erosional processes are largely responsible for the formation of the landforms, but that sub-aerial processes contribute and modify subsequently. Award marks based on the quality of the response using the marking levels below. Level 4 (16–20) Response thoroughly discusses the extent to which erosional landforms are influenced by sub-aerial processes in coastal environments. An effective and sustained evaluation with a sound conclusion. Response is well founded in detailed exemplar knowledge and strong conceptual understanding of the topic. Examples used are appropriate and integrated effectively into the response. Level 3 (11–15) Response discusses the extent to which erosional landforms are influenced by sub-aerial processes in coastal environments. Response is broadly evaluative in character, comprising some explanatory or narrative content and a conclusion. Response develops on a largely secure base of knowledge and understanding with the use of example(s). Level 2 (6–10) Response demonstrates some knowledge and understanding of the extent to which erosional landforms are influenced by sub-aerial processes in coastal environments. Response is mainly descriptive or explanatory in approach and contains a brief or thinly supported evaluation. Responses without the use of example(s) to support the response will not get above the middle of Level 2 (8 marks). 5 Level 1 (1–5) Response makes a few general points about the influence of sub-aerial processes on erosional landforms. A descriptive response comprising a few simple points. Knowledge is basic and understanding may be poor and lack relevance to the question set. Level 0 (0) No creditable response.
Q6 · Hazardous environments If answering this option, answer Question 7 and either Question 8…
Hazardous environments If answering this option, answer Question 7 and either Question 8 or Question 9.
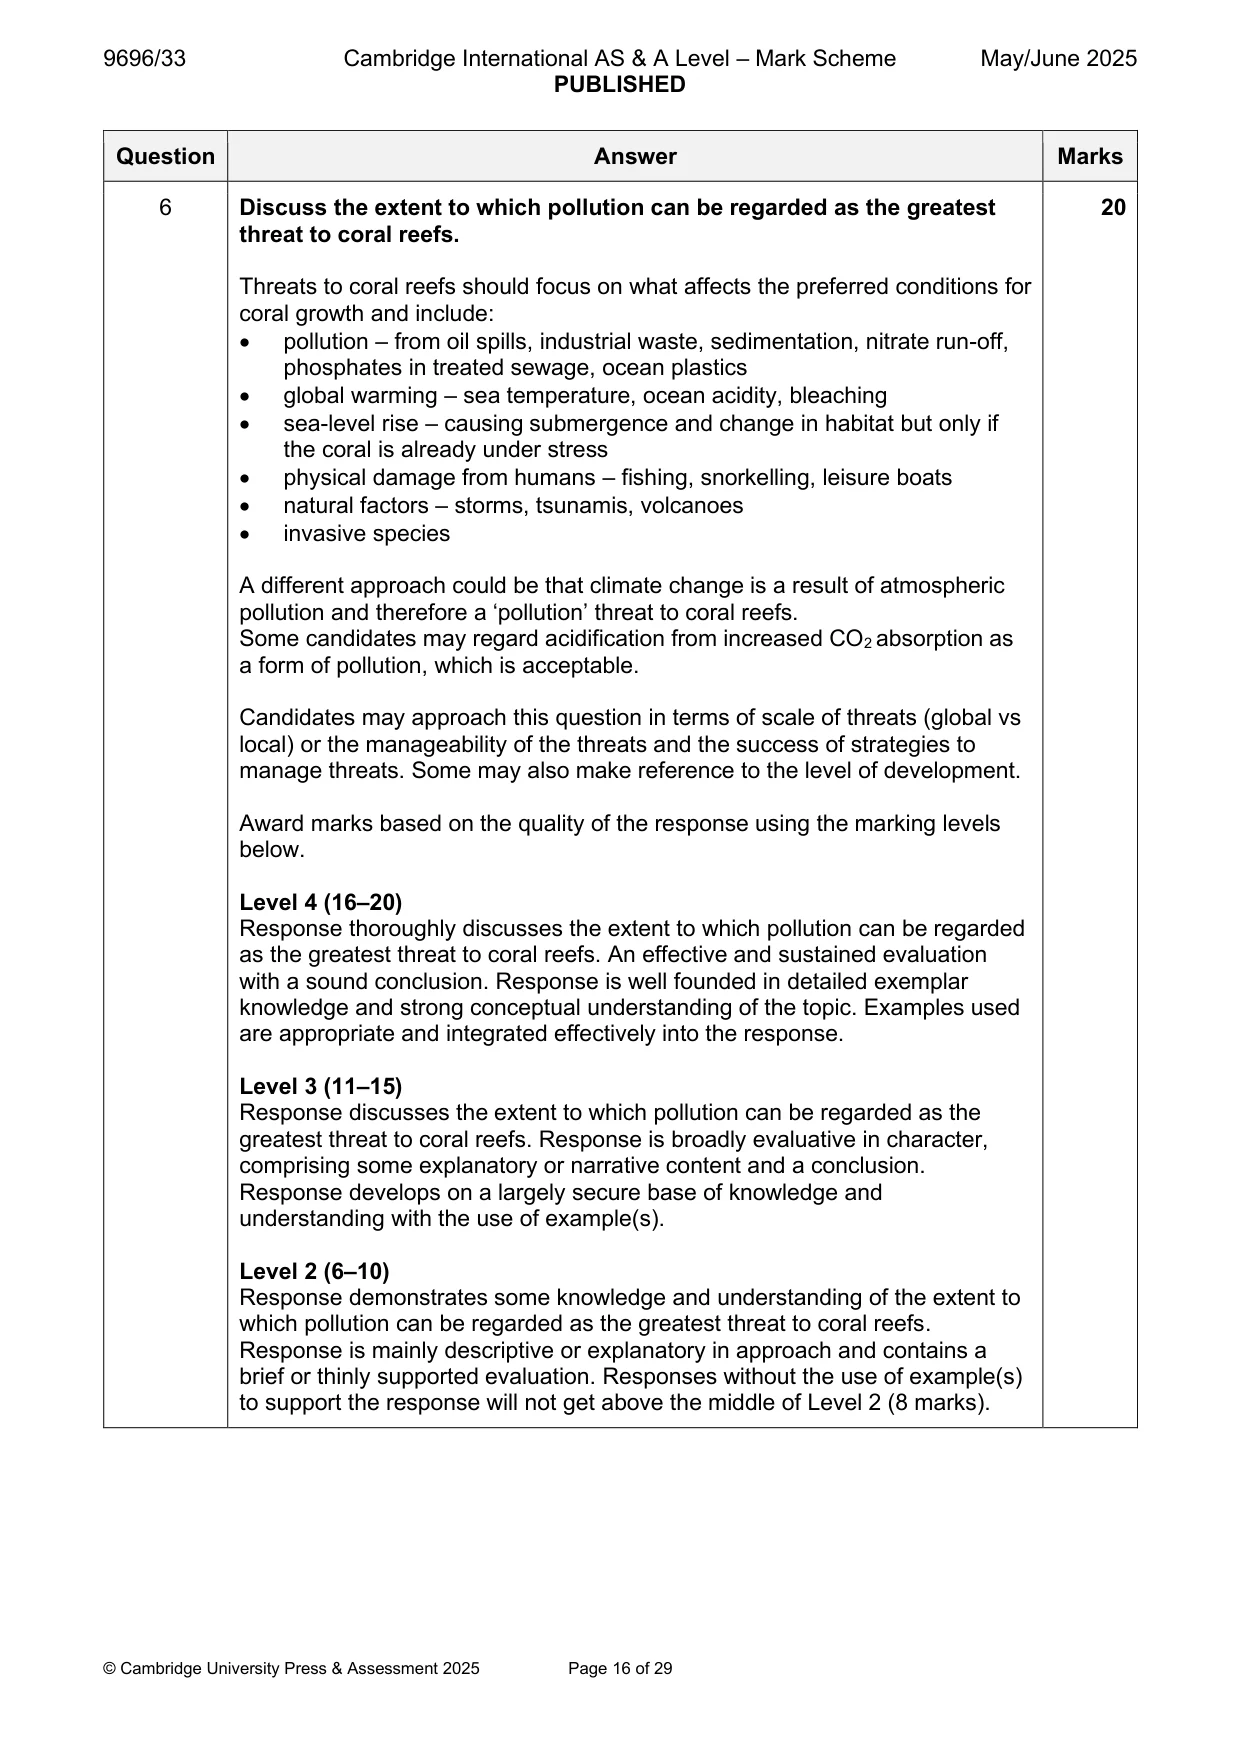
Mark scheme: 6 Discuss the extent to which pollution can be regarded as the greatest 20 threat to coral reefs. Threats to coral reefs should focus on what affects the preferred conditions for coral growth and include: • pollution – from oil spills, industrial waste, sedimentation, nitrate run-off, phosphates in treated sewage, ocean plastics • global warming – sea temperature, ocean acidity, bleaching • sea-level rise – causing submergence and change in habitat but only if the coral is already under stress • physical damage from humans – fishing, snorkelling, leisure boats • natural factors – storms, tsunamis, volcanoes • invasive species A different approach could be that climate change is a result of atmospheric pollution and therefore a ‘pollution’ threat to coral reefs. Some candidates may regard acidification from increased CO2 absorption as a form of pollution, which is acceptable. Candidates may approach this question in terms of scale of threats (global vs local) or the manageability of the threats and the success of strategies to manage threats. Some may also make reference to the level of development. Award marks based on the quality of the response using the marking levels below. Level 4 (16–20) Response thoroughly discusses the extent to which pollution can be regarded as the greatest threat to coral reefs. An effective and sustained evaluation with a sound conclusion. Response is well founded in detailed exemplar knowledge and strong conceptual understanding of the topic. Examples used are appropriate and integrated effectively into the response. Level 3 (11–15) Response discusses the extent to which pollution can be regarded as the greatest threat to coral reefs. Response is broadly evaluative in character, comprising some explanatory or narrative content and a conclusion. Response develops on a largely secure base of knowledge and understanding with the use of example(s). Level 2 (6–10) Response demonstrates some knowledge and understanding of the extent to which pollution can be regarded as the greatest threat to coral reefs. Response is mainly descriptive or explanatory in approach and contains a brief or thinly supported evaluation. Responses without the use of example(s) to support the response will not get above the middle of Level 2 (8 marks). 6 Level 1 (1–5) Response makes a few general points about threats to coral reefs. A descriptive response comprising a few simple points. Knowledge is basic and understanding may be poor and lack relevance to the question set. Level 0 (0) No creditable response. Hazardous environments If answering this option, answer Question 7 and either Question 8 or Question 9.
Q7 · The Typhoon Haiyan storm surge, San Pedro Bay, Philippines, 2013
7 Fig. 7.1 shows the Typhoon Haiyan storm surge, San Pedro Bay, Philippines, 2013. (a) Describe the variations in the height of the storm surge shown in Fig. 7.1. [3] (b) Suggest reasons for the variations you described in (a). [7]
Mark scheme: 7(a) Fig. 7.1 shows the Typhoon Haiyan storm surge, San Pedro Bay, 3 Philippines, 2013. Describe the variations in the height of the storm surge shown in Fig. 7.1. Variations include: • increasing height to the N/NW/into the bay OR decreasing height to the S/SE/out of the bay • minimum of 0 m to SE, maximum of 8 m at head of the bay (between Tacloban city and Basey) • height decreases slightly into the river estuary, dropping to 6/7 m in the narrow channel in the far north • rate of height change increases with distance NW/into the bay (and the increase is more significant towards the NW) • waves generally higher on the West than the East of San Pedro Bay 1 mark for each descriptive point. Use of data for maximum marks. 7(b) Suggest reasons for the variations you described in (a). 7 Reasons could include: • height increases with increasing wind speed as winds blow over a greater distance of open sea • height increases as surge steepens due to friction from sea floor in shallowing water – maybe shallower on the Western side as storm surge is higher there • height increases due to funnelling effect of the narrowing bay – waves are squeezed upwards as the bay narrows • height increases as pressure falls during the movement of a developing low-pressure system, allow water to rise up • height decreases in river estuary due to shelter from wind strength Award marks based on the quality of explanation and breadth of the response using the marking levels below. Level 3 (6–7) Response clearly explains two or more reasons for the variations in the height of the storm surge described in (a). Response is well founded in detailed knowledge and strong conceptual understanding of the topic. Examples used are appropriate and integrated effectively into the response. Level 2 (3–5) Response explains two reasons or clearly explains one reason (max. 4) for the variations in the height of the storm surge described in (a). Response develops on a largely secure base of knowledge and understanding. Examples may lack detail or development. Level 1 (1–2) Response explains one or two reasons for the variations in the height of the storm surge described in (a). Knowledge is basic and understanding may be inaccurate. Examples are in name only or lacking entirely. Level 0 (0) No creditable response.
Q8 · ‘Soil liquefaction is the most significant hazard resulting from earthquakes.’ How far do…
8 ‘Soil liquefaction is the most significant hazard resulting from earthquakes.’ How far do you agree with this view? [20]
Mark scheme: 8 ‘Soil liquefaction is the most significant hazard resulting from 20 earthquakes.’ How far do you agree with this view? Earthquake hazards include: • soil liquefaction – ground shaking separates water and sediment causing buildings to collapse, but only in loose sediments • ground shaking – even without liquefaction, building foundations can fracture and cause collapse, so widespread hazard • ground deformation – movement and change of shape of the ground can be destructive if occurring under buildings or infrastructure • landslides – ground shaking can decrease frictional forms of slopes leading to landslides or other mass movements, but only on slopes • tsunami – displacement of the sea floor in an earthquake can trigger a tsunami, but only affecting coastal areas Candidates may consider how significance is quantified; loss of life, number made homeless, number of injuries, monetary cost. Significance will vary depending upon the nature of the ground material in a locality. Manageability of hazards is relevant and there may be comments on how level of development affects this. Award marks based on the quality of the response using the marking levels below. Level 4 (16–20) Response thoroughly discusses the extent to which soil liquefaction is the most significant hazard resulting from earthquakes. An effective and sustained evaluation with a sound conclusion. Response is well founded in detailed exemplar knowledge and strong conceptual understanding of the topic. Examples used are appropriate and integrated effectively into the response. Level 3 (11–15) Response discusses the extent to which soil liquefaction is the most significant hazard resulting from earthquakes. Response is broadly evaluative in character, comprising some explanatory or narrative content and a conclusion. Response develops on a largely secure base of knowledge and understanding with the use of example(s). Level 2 (6–10) Response demonstrates some knowledge and understanding of the extent to which soil liquefaction is the most significant hazard resulting from earthquakes. Response is mainly descriptive or explanatory in approach and contains a brief or thinly supported evaluation. Responses without the use of example(s) to support the response will not get above the middle of Level 2 (8 marks). 8 Level 1 (1–5) Response makes a few general points about hazards resulting from earthquakes. A descriptive response comprising a few simple points. Knowledge is basic and understanding may be poor and lack relevance to the question set. Level 0 (0) No creditable response.
Q9 · Assess the effectiveness of different ways of managing hazards resulting from atmospheric…
9 Assess the effectiveness of different ways of managing hazards resulting from atmospheric disturbances. [20] Hot arid and semi-arid environments If answering this option, answer Question 10 and either Question 11 or Question 12.
Mark scheme: 9 Assess the effectiveness of different ways of managing hazards 20 resulting from atmospheric disturbances. Hazards from large-scale atmospheric disturbances (cyclones, hurricanes, typhoons) include: • storm surges • coastal flooding • intense rainfall (leading to severe river floods and mass movement) • high winds Hazards from small-scale atmospheric disturbances (tornadoes) include: • intense precipitation (rain leading to flash flooding and hail) • high winds • pressure imbalances • lightning Ways of managing hazards include: • weather forecasting, prediction and monitoring • building regulation and land use zoning • emergency planning, including evacuation drills, shelters and emergency service provision • education • flood channels, embankments, sea walls Candidates should focus on the management of the hazards themselves, rather than the disturbance in general. They could distinguish between the management of large-scale atmospheric disturbances and small-scale atmospheric disturbances. They may consider how effectiveness can be quantified; accuracy of predictions (large-scale are easier to predict/monitor than small-scale), lives saved, cost-benefit. They may argue that effectiveness depends on the level of economic development of the location and/or effectiveness of governance. Award marks based on the quality of the response using the marking levels below. Level 4 (16–20) Response thoroughly discusses the effectiveness of different ways of managing hazards resulting from atmospheric disturbances. An effective and sustained evaluation with a sound conclusion. Response is well founded in detailed exemplar knowledge and strong conceptual understanding of the topic. Examples used are appropriate and integrated effectively into the response. 9 Level 3 (11–15) Response discusses the effectiveness of different ways of managing hazards resulting from atmospheric disturbances. Response is broadly evaluative in character, comprising some explanatory or narrative content and a conclusion. Response develops on a largely secure base of knowledge and understanding with the use of example(s). Level 2 (6–10) Response demonstrates some knowledge and understanding of the effectiveness of different ways of managing hazards resulting from atmospheric disturbances. Response is mainly descriptive or explanatory in approach and contains a brief or thinly supported evaluation. Responses without the use of example(s) to support the response will not get above the middle of Level 2 (8 marks). Level 1 (1–5) Response makes a few general points about different ways of managing hazards resulting from atmospheric disturbances. A descriptive response comprising a few simple points. Knowledge is basic and understanding may be poor and lack relevance to the question set. Level 0 (0) No creditable response. Hot arid and semi-arid environments If answering this option, answer Question 10 and either Question 11 or Question 12.
Q10 · A climate graph for Lajamanu, Northern Territory, Australia
10 Fig. 10.1 is a climate graph for Lajamanu, Northern Territory, Australia. (a) Describe the climate of Lajamanu shown in Fig. 10.1. [4] (b) Suggest two reasons for the climate you described in (a). [6]
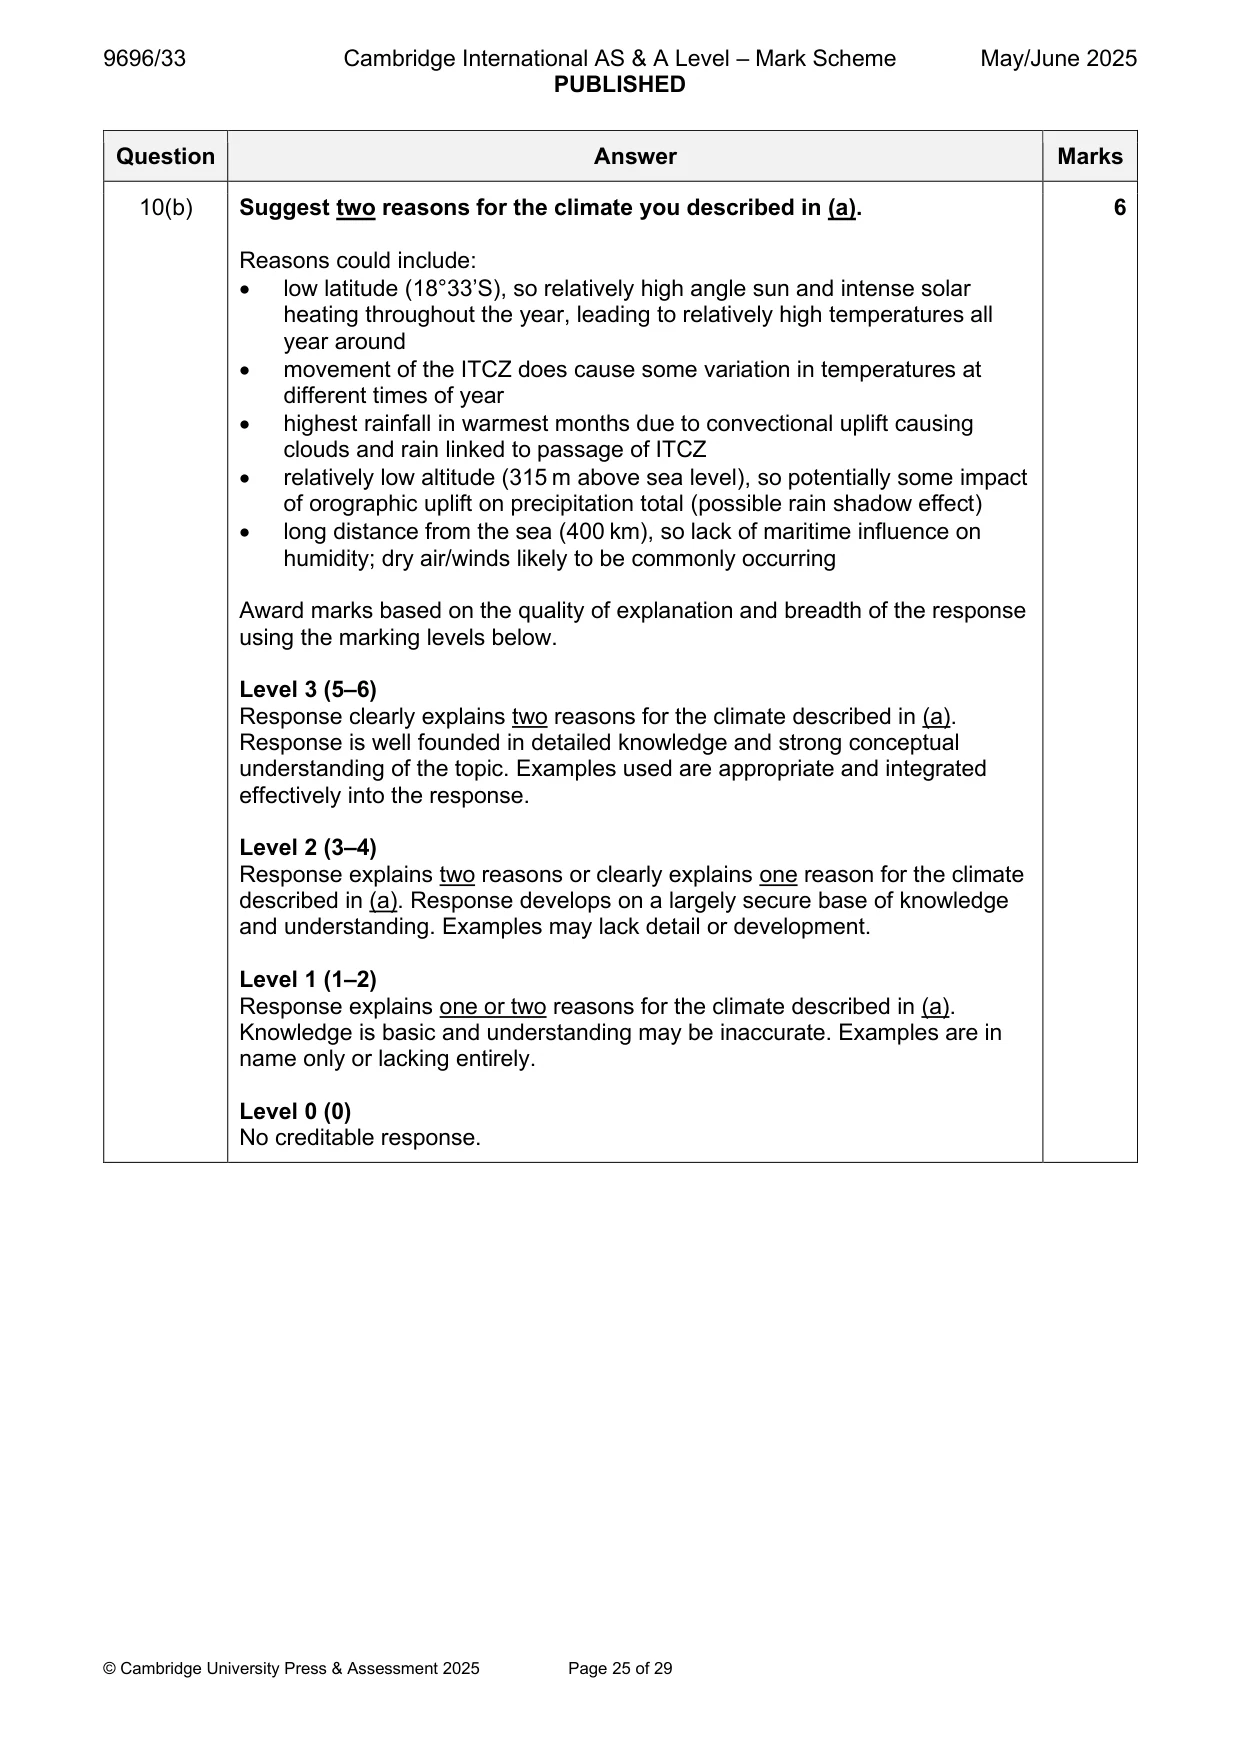
Mark scheme: 10(a) Fig. 10.1 is a climate graph for Lajamanu, Northern Territory, Australia. 4 Describe the climate of Lajamanu shown in Fig. 10.1. Features of the climate include: • low temperature range of 12°C • maximum temperature 32°C in November/minimum temperature 20°C in June/July • low annual precipitation, approximately 530–550 mm in total • seasonal pattern of precipitation with dry season in cooler months April– October, wetter in hotter months November–March • maximum precipitation just over 150 mm in February/minimum precipitation 0 mm in August/high variation in precipitation • when precipitation is high temperature is high 1 mark for each descriptive point. Use of data as evidence and reference to both temperature and precipitation for maximum marks. 10(b) Suggest two reasons for the climate you described in (a). 6 Reasons could include: • low latitude (18°33’S), so relatively high angle sun and intense solar heating throughout the year, leading to relatively high temperatures all year around • movement of the ITCZ does cause some variation in temperatures at different times of year • highest rainfall in warmest months due to convectional uplift causing clouds and rain linked to passage of ITCZ • relatively low altitude (315 m above sea level), so potentially some impact of orographic uplift on precipitation total (possible rain shadow effect) • long distance from the sea (400 km), so lack of maritime influence on humidity; dry air/winds likely to be commonly occurring Award marks based on the quality of explanation and breadth of the response using the marking levels below. Level 3 (5–6) Response clearly explains two reasons for the climate described in (a). Response is well founded in detailed knowledge and strong conceptual understanding of the topic. Examples used are appropriate and integrated effectively into the response. Level 2 (3–4) Response explains two reasons or clearly explains one reason for the climate described in (a). Response develops on a largely secure base of knowledge and understanding. Examples may lack detail or development. Level 1 (1–2) Response explains one or two reasons for the climate described in (a). Knowledge is basic and understanding may be inaccurate. Examples are in name only or lacking entirely. Level 0 (0) No creditable response.
Q11 · Assess the influence of water action on the formation of landforms in hot arid and…
11 Assess the influence of water action on the formation of landforms in hot arid and semi-arid environments. [20]
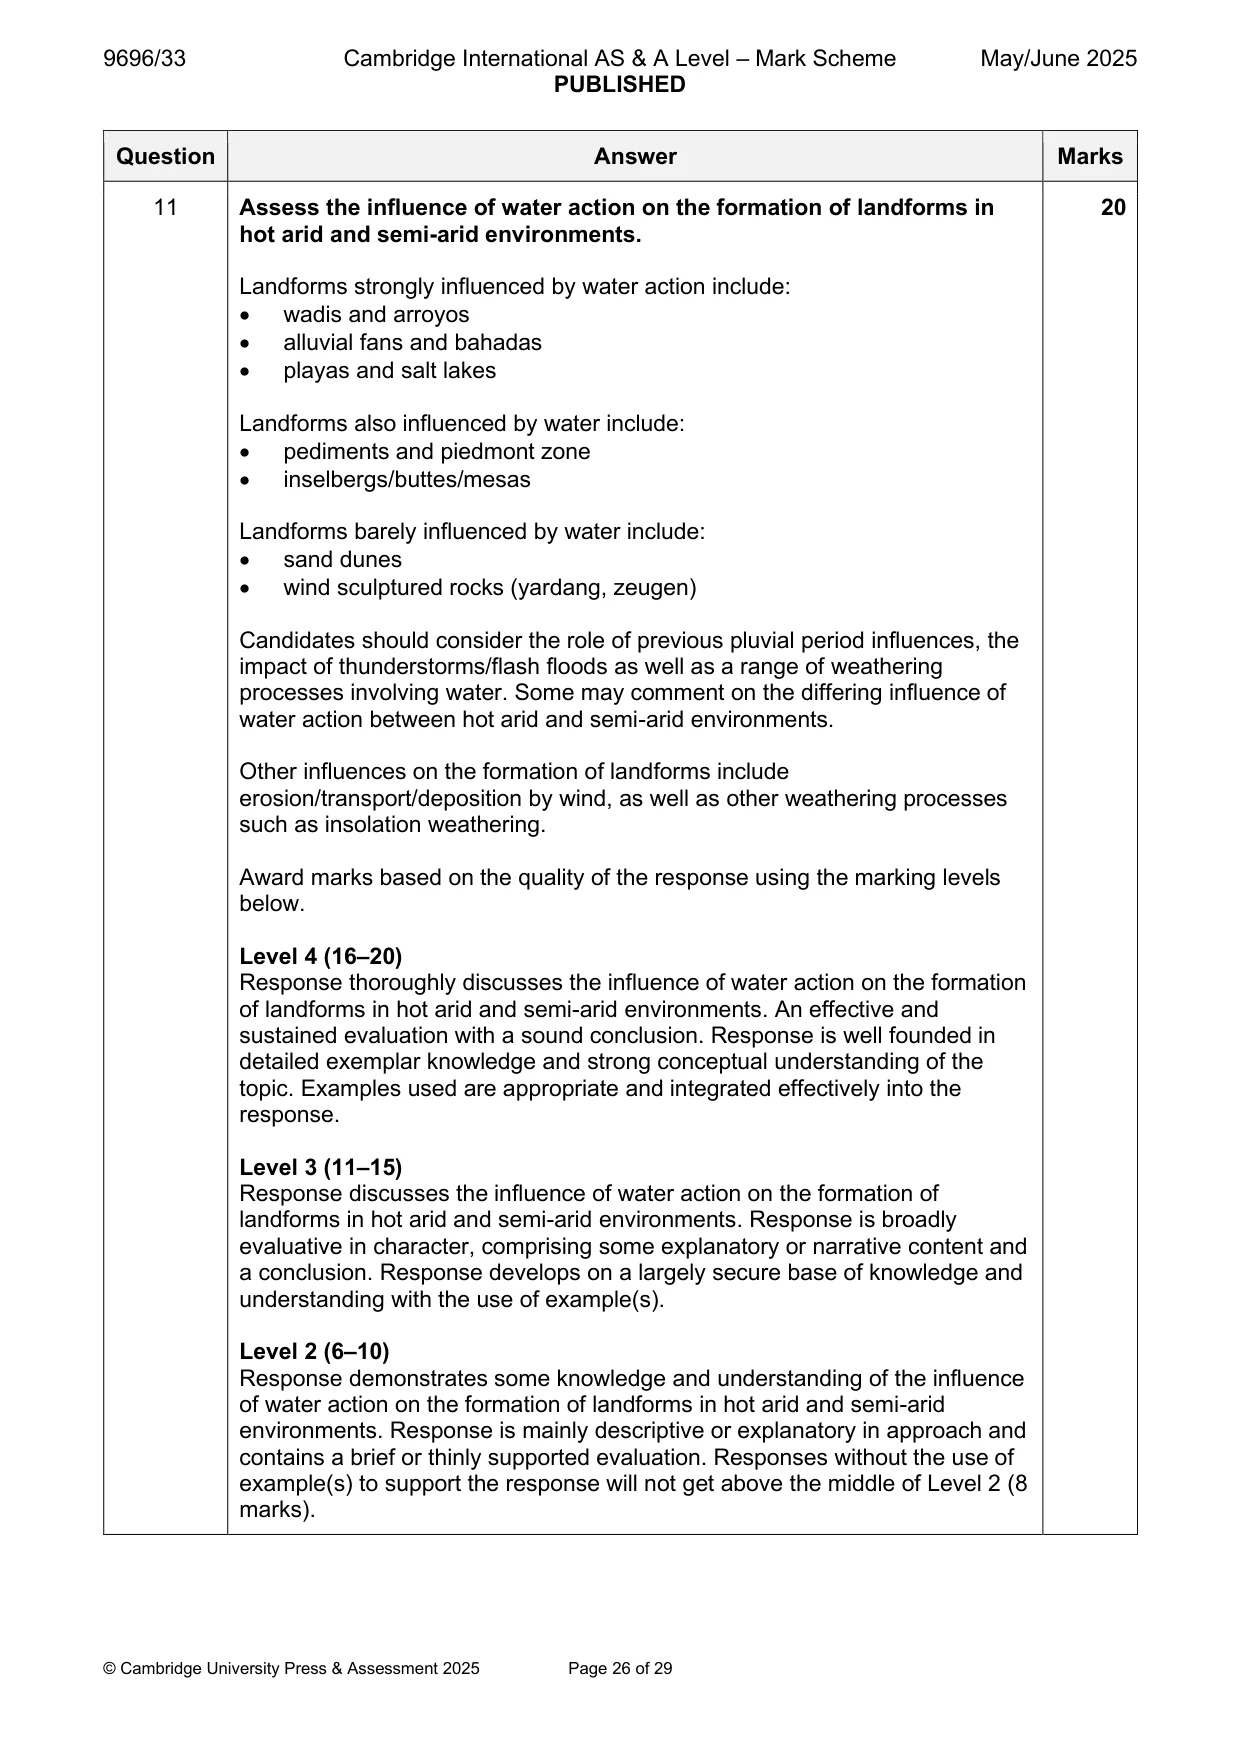
Mark scheme: 11 Assess the influence of water action on the formation of landforms in 20 hot arid and semi-arid environments. Landforms strongly influenced by water action include: • wadis and arroyos • alluvial fans and bahadas • playas and salt lakes Landforms also influenced by water include: • pediments and piedmont zone • inselbergs/buttes/mesas Landforms barely influenced by water include: • sand dunes • wind sculptured rocks (yardang, zeugen) Candidates should consider the role of previous pluvial period influences, the impact of thunderstorms/flash floods as well as a range of weathering processes involving water. Some may comment on the differing influence of water action between hot arid and semi-arid environments. Other influences on the formation of landforms include erosion/transport/deposition by wind, as well as other weathering processes such as insolation weathering. Award marks based on the quality of the response using the marking levels below. Level 4 (16–20) Response thoroughly discusses the influence of water action on the formation of landforms in hot arid and semi-arid environments. An effective and sustained evaluation with a sound conclusion. Response is well founded in detailed exemplar knowledge and strong conceptual understanding of the topic. Examples used are appropriate and integrated effectively into the response. Level 3 (11–15) Response discusses the influence of water action on the formation of landforms in hot arid and semi-arid environments. Response is broadly evaluative in character, comprising some explanatory or narrative content and a conclusion. Response develops on a largely secure base of knowledge and understanding with the use of example(s). Level 2 (6–10) Response demonstrates some knowledge and understanding of the influence of water action on the formation of landforms in hot arid and semi-arid environments. Response is mainly descriptive or explanatory in approach and contains a brief or thinly supported evaluation. Responses without the use of example(s) to support the response will not get above the middle of Level 2 (8 marks). 11 Level 1 (1–5) Response makes a few general points about the influence of water action on the formation of landforms in hot arid and semi-arid environments. A descriptive response comprising a few simple points. Knowledge is basic and understanding may be poor and lack relevance to the question set. Level 0 (0) No creditable response.
What was in this paper
The subtopics covered by these 11 questions, and how many questions each got. Open one in a new tab to see every Cambridge question on it.
2Humid tropical (rainforest) ecosystems and seasonally humid tropical (savanna) ecosystems2Characteristics and formation of coastal landforms1Coastal processes1Hazards resulting from tectonic processes1Hot arid and semi-arid climates1Landforms of hot arid and semi-arid environments1Sustainable management in hazardous environments1Tropical climates1What you needed in this session
Cambridge’s own grade thresholds for 2025 May/June, Paper 3 · Variant 3. A higher threshold means an easier paper — the bar moves with how the cohort did.