Cambridge A Level Geography 9696 — 2025 May/June Paper 2 · Variant 2
9696/22/M/J/25 · 6 questions · 60 marks · ≈68 min
The question paper and its mark scheme, free to read here and free to download. This is Cambridge’s own paper, exactly as it was sat.
Question paper4 pages

Mark scheme20 pages
Answers below. Sit the paper first if you are practising.

Questions as text
Q1 · The population change for Australia (an HIC in Oceania) and Romania (an MIC in Europe)…
1 Fig. 1.1 shows the population change for Australia (an HIC in Oceania) and Romania (an MIC in Europe), 1980–2020. (a) Using Fig. 1.1, compare the population change for Australia and Romania. [3] (b) Suggest two reasons for the population change in Romania between 1990 and 2020. [3] (c) Explain why some countries with large areas have relatively low population numbers. [4] Population/Migration/Settlement dynamics
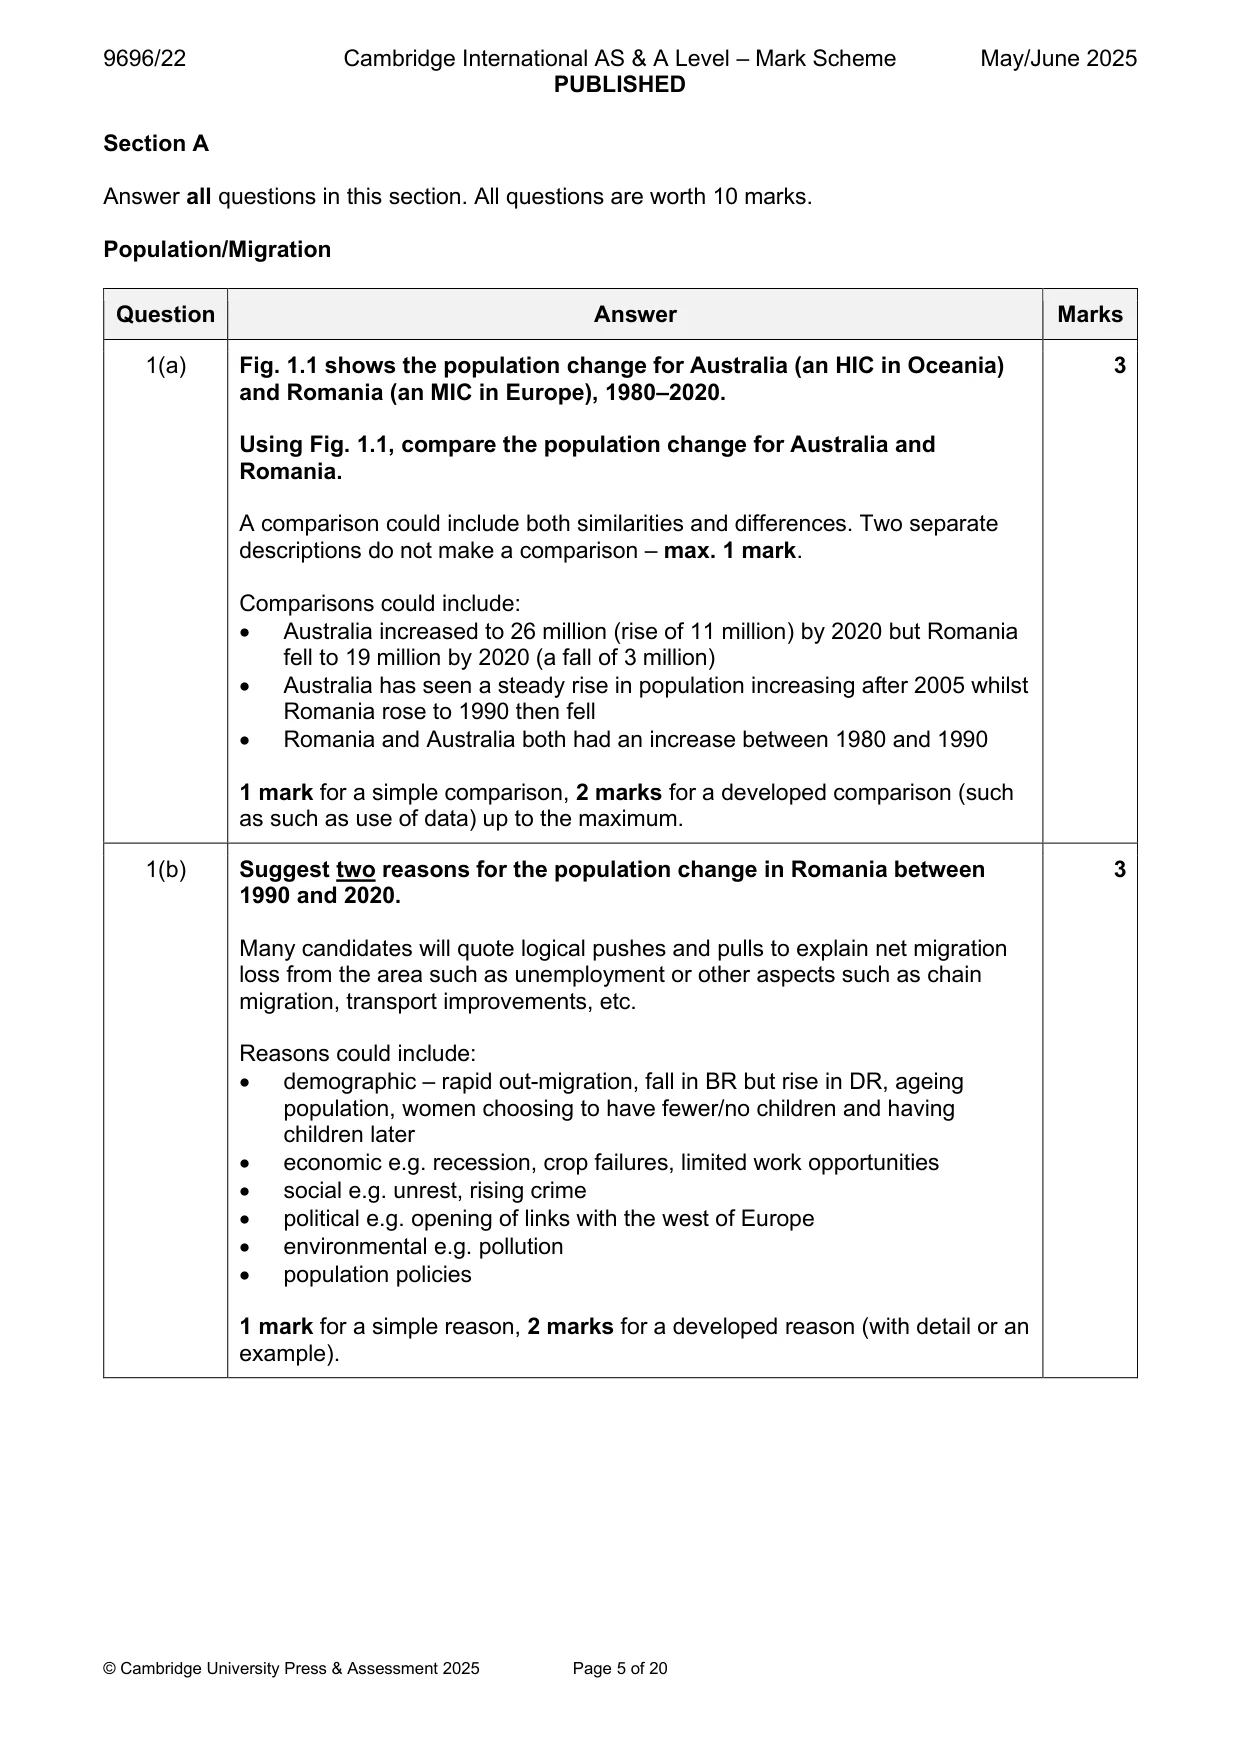
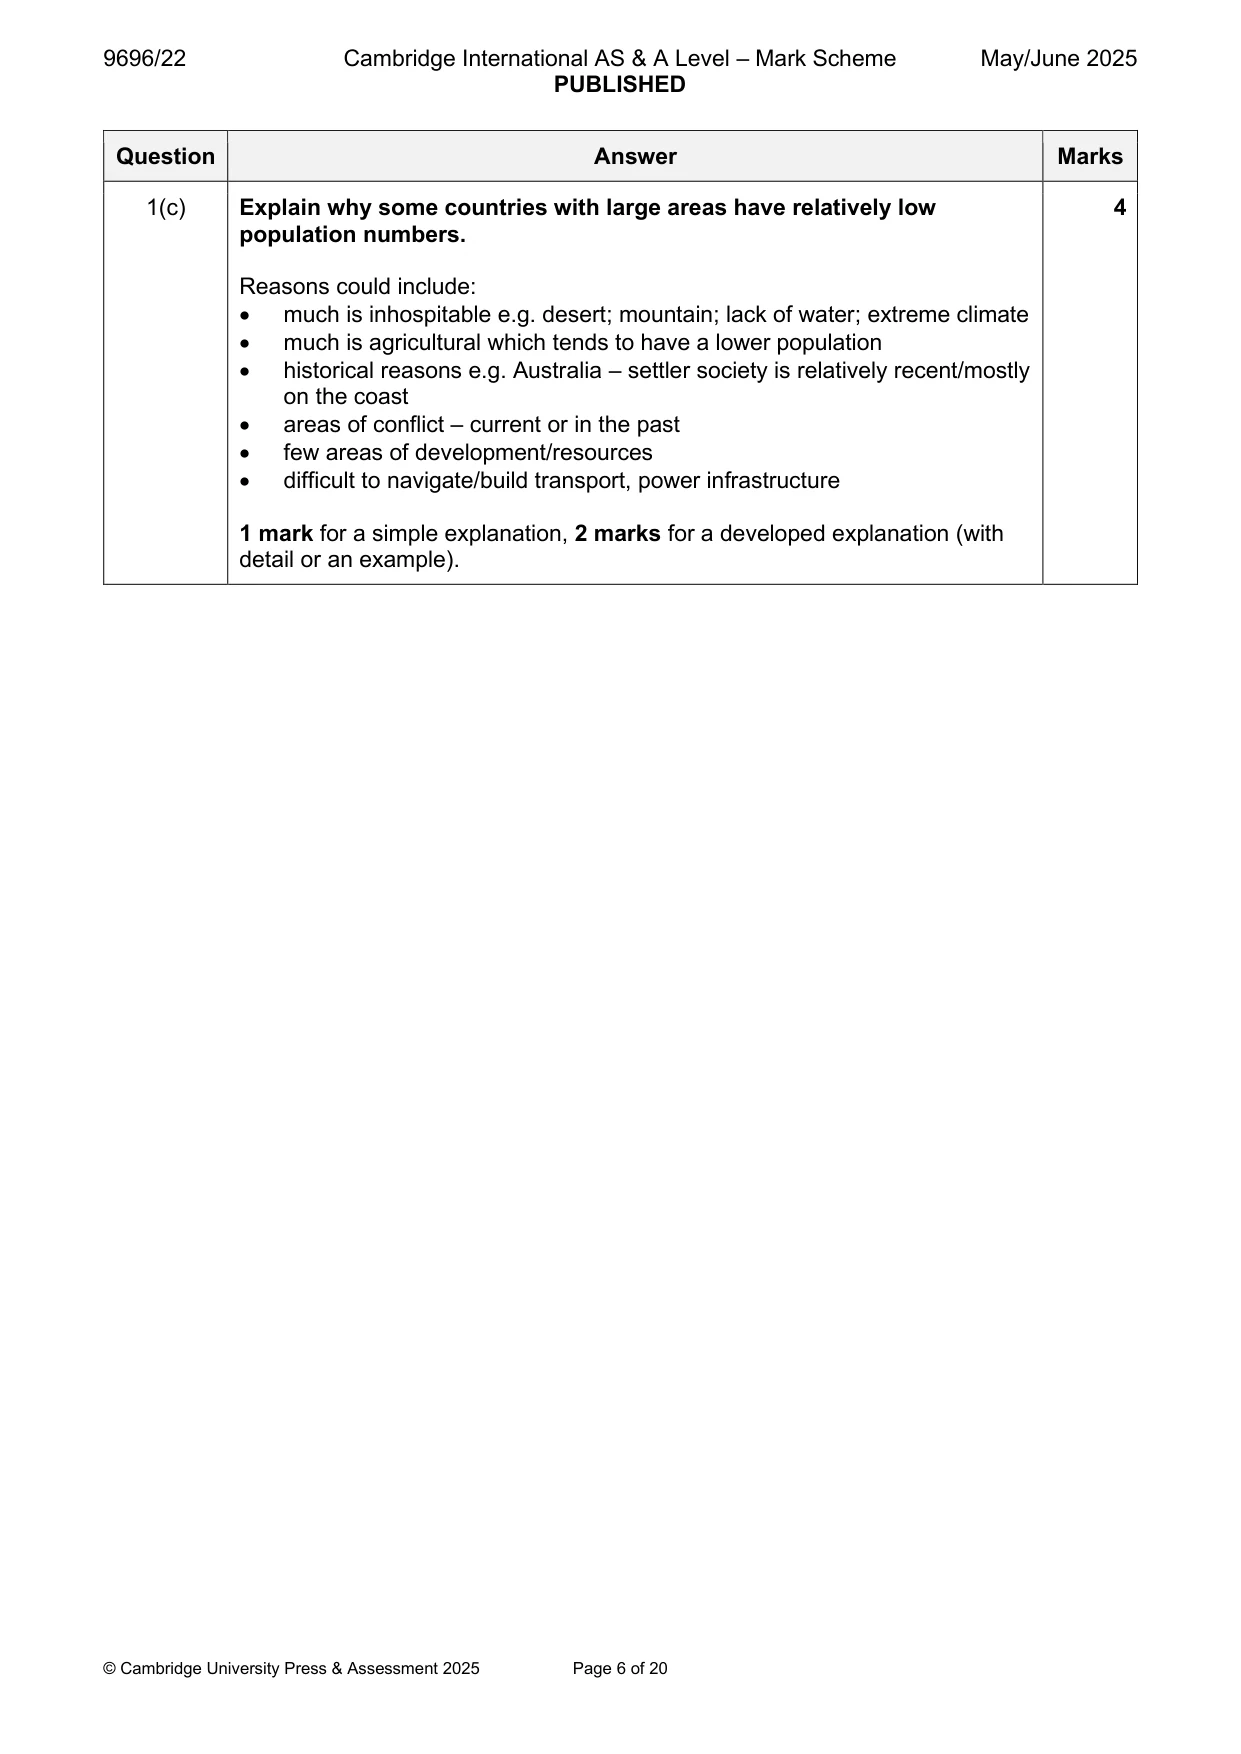
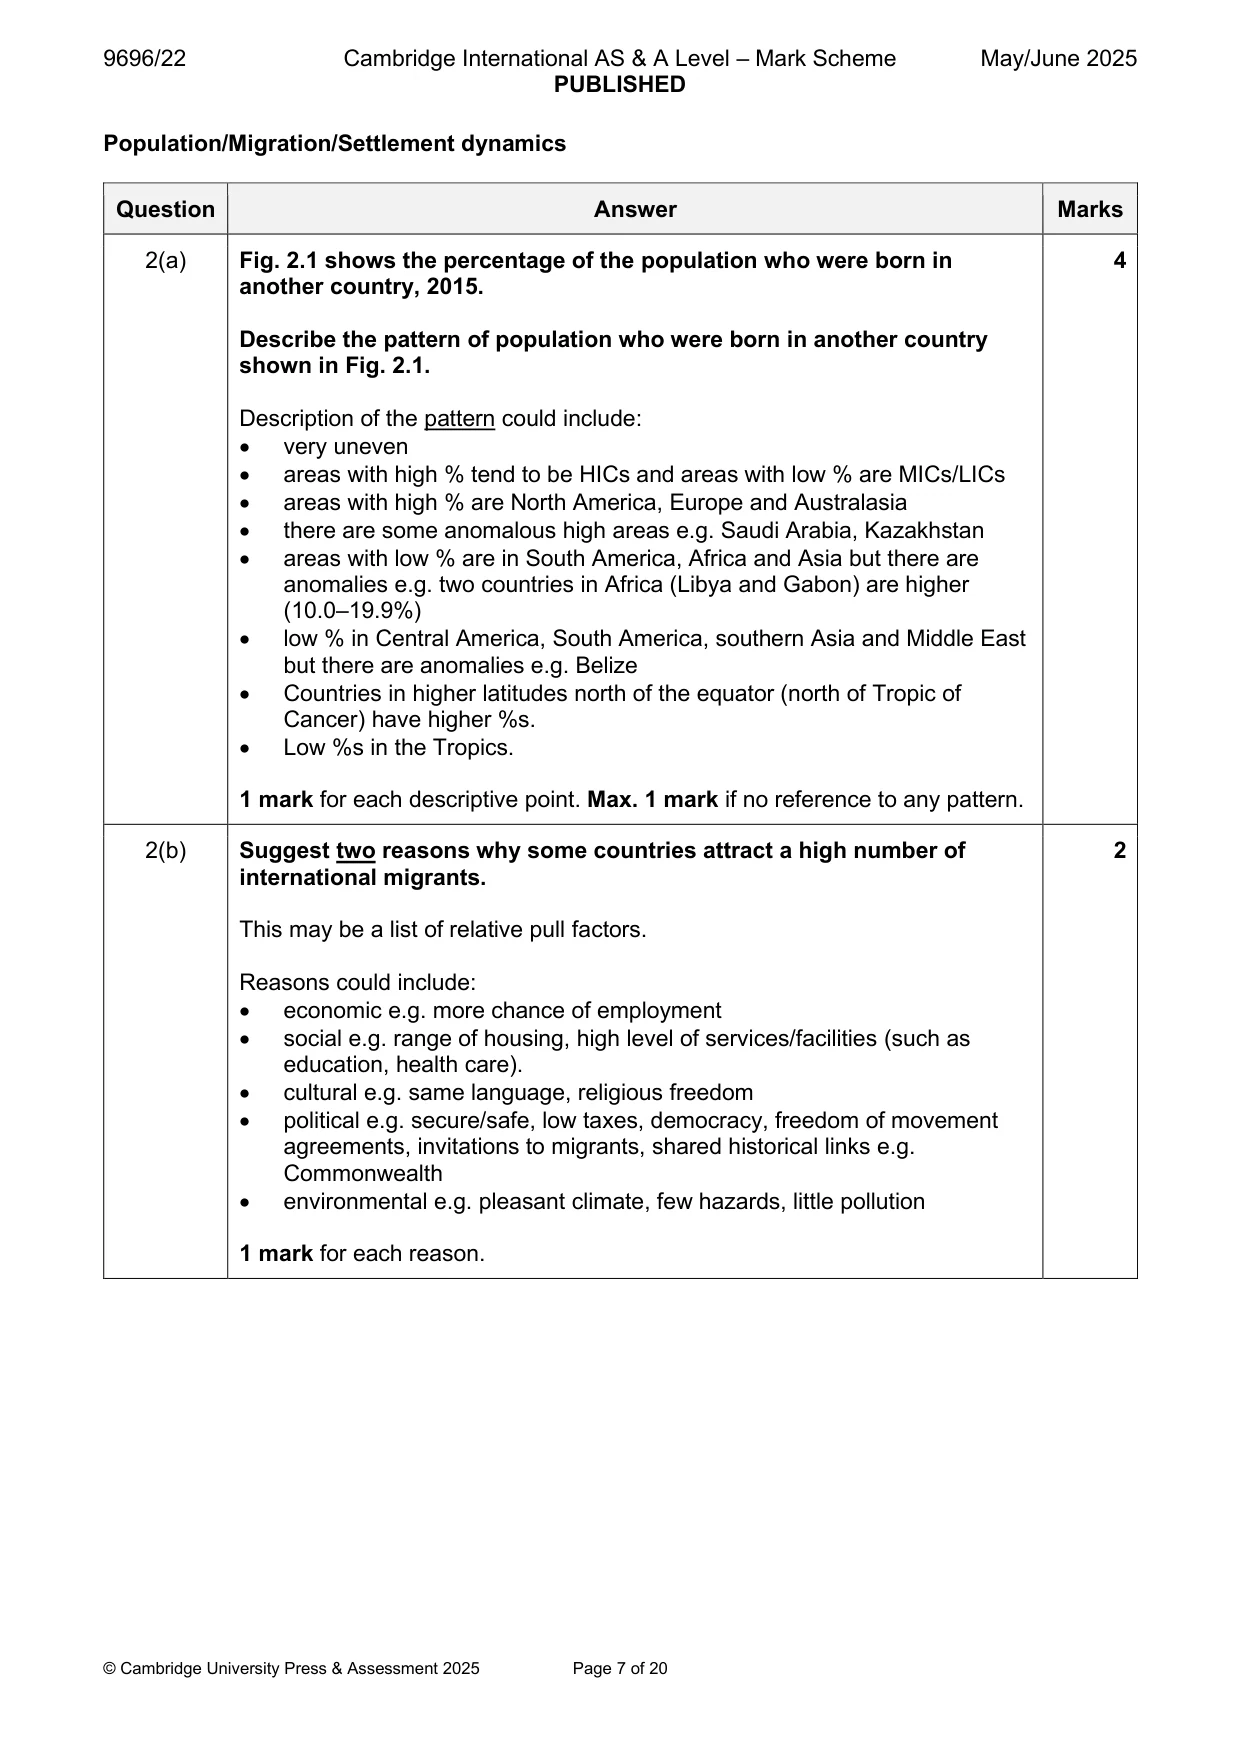
Mark scheme: Question Answer Marks 1(a) Fig. 1.1 shows the population change for Australia (an HIC in Oceania) 3 and Romania (an MIC in Europe), 1980–2020. Using Fig. 1.1, compare the population change for Australia and Romania. A comparison could include both similarities and differences. Two separate descriptions do not make a comparison – max. 1 mark. Comparisons could include: • Australia increased to 26 million (rise of 11 million) by 2020 but Romania fell to 19 million by 2020 (a fall of 3 million) • Australia has seen a steady rise in population increasing after 2005 whilst Romania rose to 1990 then fell • Romania and Australia both had an increase between 1980 and 1990 1 mark for a simple comparison, 2 marks for a developed comparison (such as such as use of data) up to the maximum. 1(b) Suggest two reasons for the population change in Romania between 3 1990 and 2020. Many candidates will quote logical pushes and pulls to explain net migration loss from the area such as unemployment or other aspects such as chain migration, transport improvements, etc. Reasons could include: • demographic – rapid out-migration, fall in BR but rise in DR, ageing population, women choosing to have fewer/no children and having children later • economic e.g. recession, crop failures, limited work opportunities • social e.g. unrest, rising crime • political e.g. opening of links with the west of Europe • environmental e.g. pollution • population policies 1 mark for a simple reason, 2 marks for a developed reason (with detail or an example). 1(c) Explain why some countries with large areas have relatively low 4 population numbers. Reasons could include: • much is inhospitable e.g. desert; mountain; lack of water; extreme climate • much is agricultural which tends to have a lower population • historical reasons e.g. Australia – settler society is relatively recent/mostly on the coast • areas of conflict – current or in the past • few areas of development/resources • difficult to navigate/build transport, power infrastructure 1 mark for a simple explanation, 2 marks for a developed explanation (with detail or an example). Population/Migration/Settlement dynamics
Q2 · The percentage of the population who were born in another country, 2015
2 Fig. 2.1 shows the percentage of the population who were born in another country, 2015. (a) Describe the pattern of population who were born in another country shown in Fig. 2.1. [4] (b) Suggest two reasons why some countries attract a high number of international migrants. [2] (c) Explain why international migrants are often concentrated in inner city areas of the receiving/ destination country. [4] Settlement dynamics
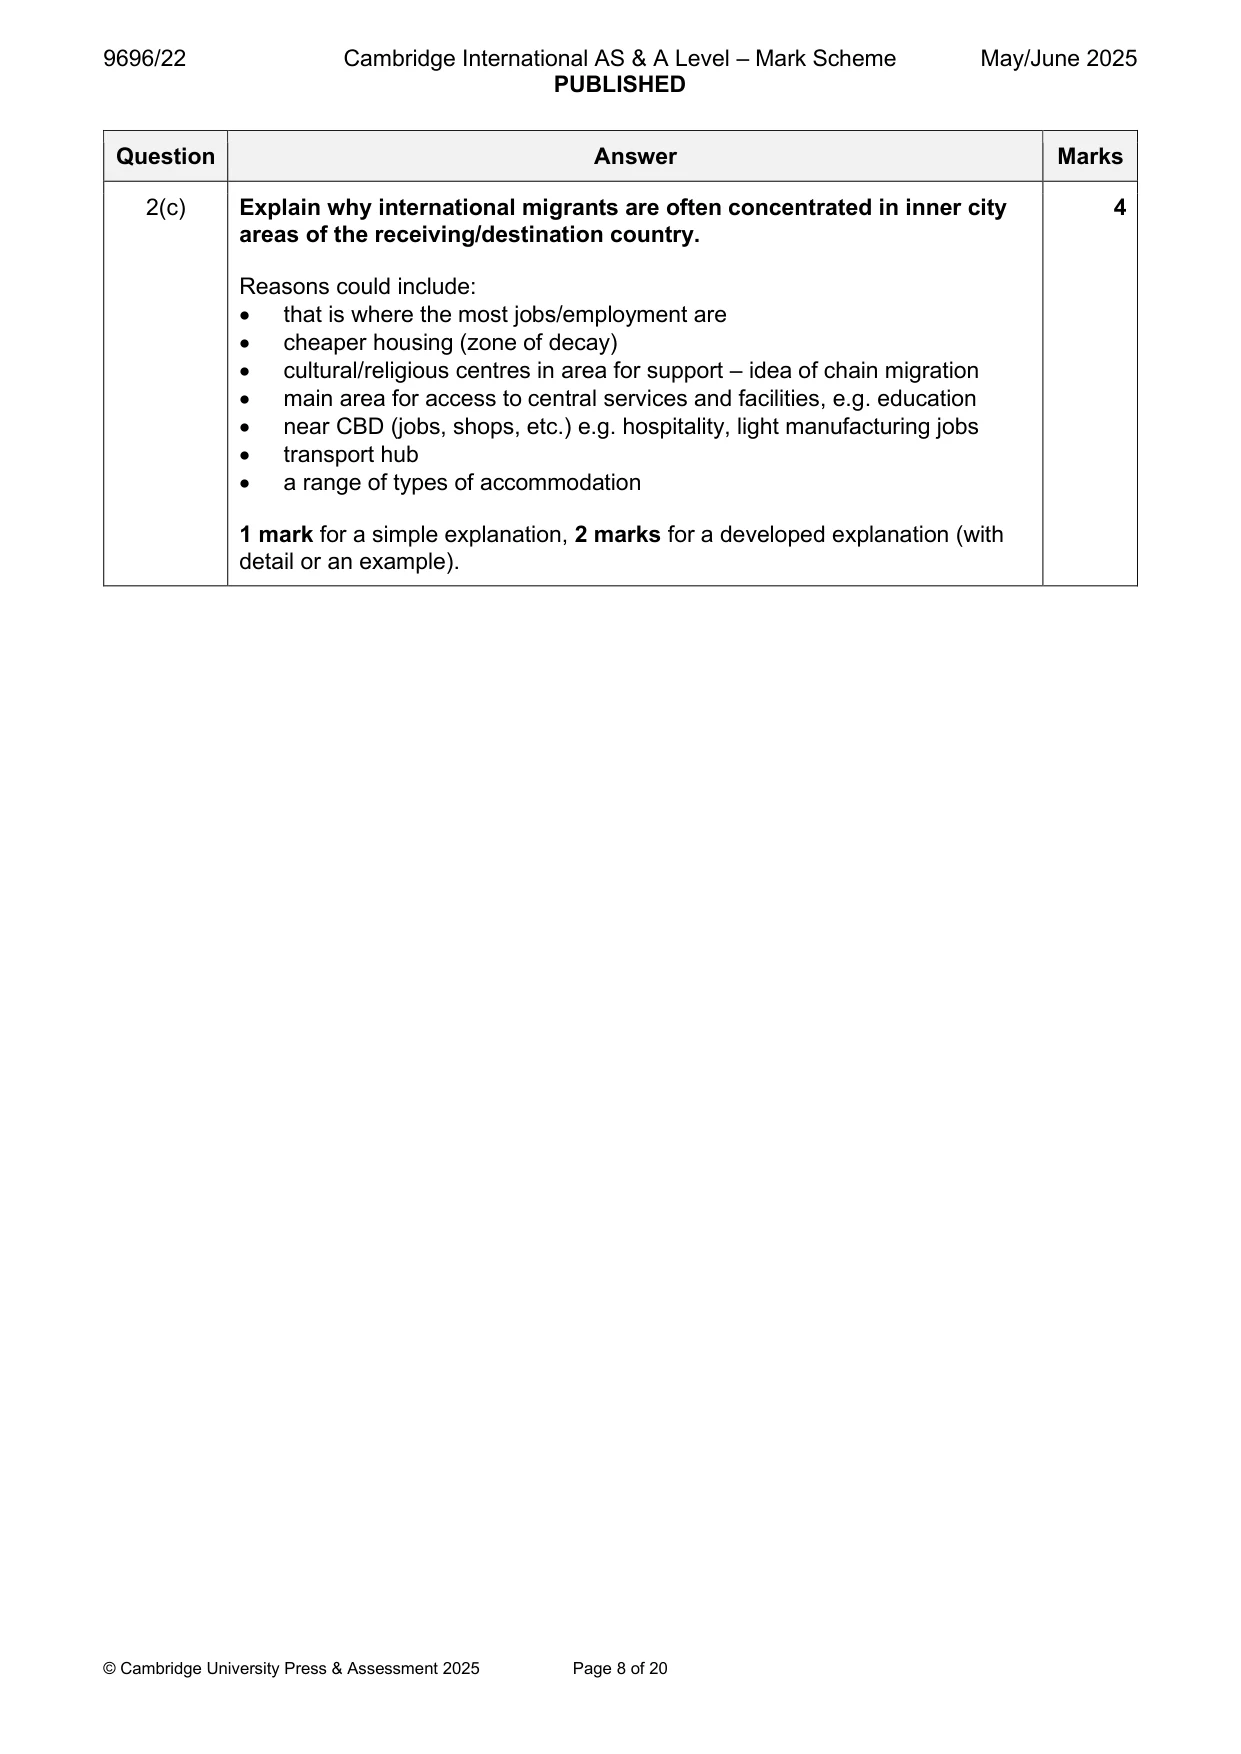
Mark scheme: 2(a) Fig. 2.1 shows the percentage of the population who were born in 4 another country, 2015. Describe the pattern of population who were born in another country shown in Fig. 2.1. Description of the pattern could include: • very uneven • areas with high % tend to be HICs and areas with low % are MICs/LICs • areas with high % are North America, Europe and Australasia • there are some anomalous high areas e.g. Saudi Arabia, Kazakhstan • areas with low % are in South America, Africa and Asia but there are anomalies e.g. two countries in Africa (Libya and Gabon) are higher (10.0–19.9%) • low % in Central America, South America, southern Asia and Middle East but there are anomalies e.g. Belize • Countries in higher latitudes north of the equator (north of Tropic of Cancer) have higher %s. • Low %s in the Tropics. 1 mark for each descriptive point. Max. 1 mark if no reference to any pattern. 2(b) Suggest two reasons why some countries attract a high number of 2 international migrants. This may be a list of relative pull factors. Reasons could include: • economic e.g. more chance of employment • social e.g. range of housing, high level of services/facilities (such as education, health care). • cultural e.g. same language, religious freedom • political e.g. secure/safe, low taxes, democracy, freedom of movement agreements, invitations to migrants, shared historical links e.g. Commonwealth • environmental e.g. pleasant climate, few hazards, little pollution 1 mark for each reason. 2(c) Explain why international migrants are often concentrated in inner city 4 areas of the receiving/destination country. Reasons could include: • that is where the most jobs/employment are • cheaper housing (zone of decay) • cultural/religious centres in area for support – idea of chain migration • main area for access to central services and facilities, e.g. education • near CBD (jobs, shops, etc.) e.g. hospitality, light manufacturing jobs • transport hub • a range of types of accommodation 1 mark for a simple explanation, 2 marks for a developed explanation (with detail or an example). Settlement dynamics
Q3 · A photograph which shows a settlement in the Comas district of Lima, Peru, an MIC in…
3 Fig. 3.1 is a photograph which shows a settlement in the Comas district of Lima, Peru, an MIC in South America. (a) Suggest three problems for the people living in the settlement shown in Fig. 3.1. [3] (b) Suggest two advantages for the people of living in the settlement shown in Fig. 3.1. [2] (c) Explain why it is often difficult for a government to improve shanty towns (squatter settlements). [5]
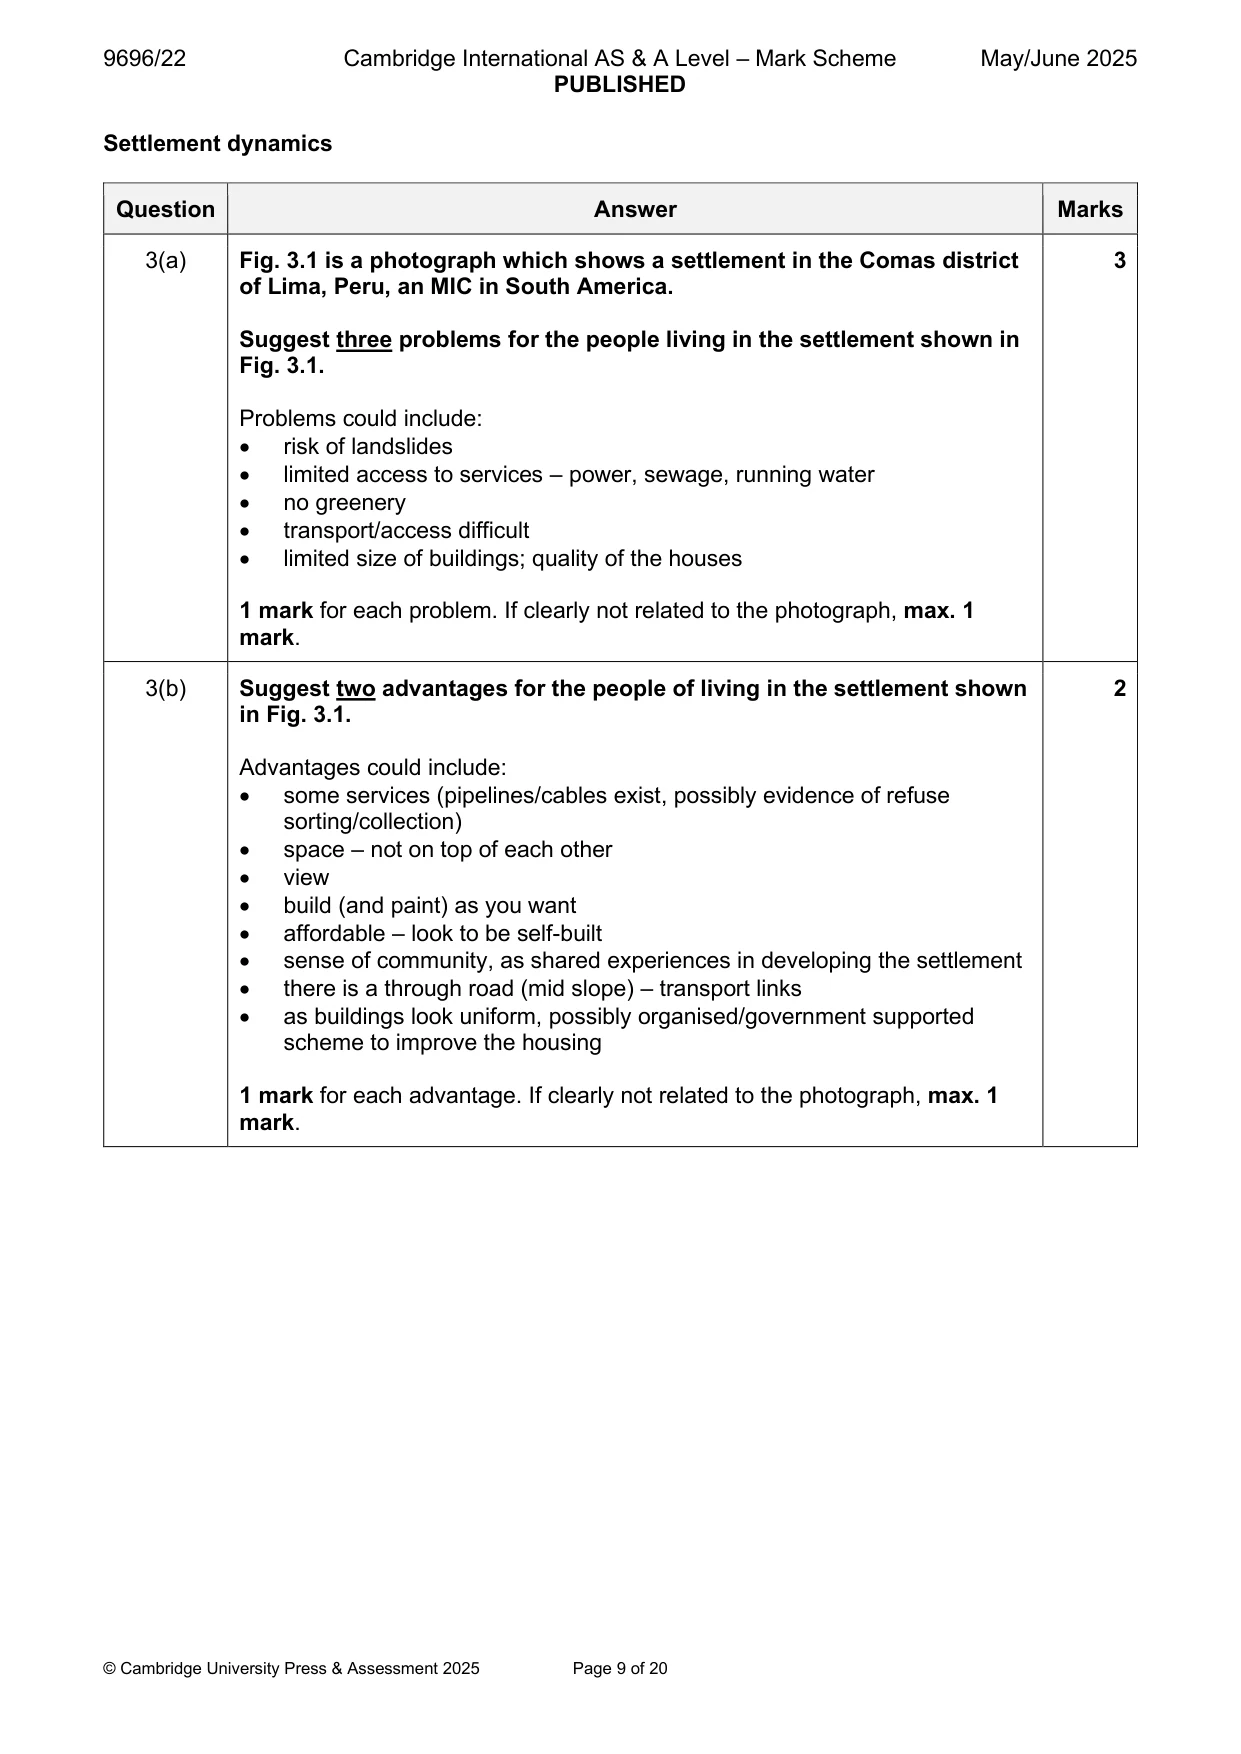
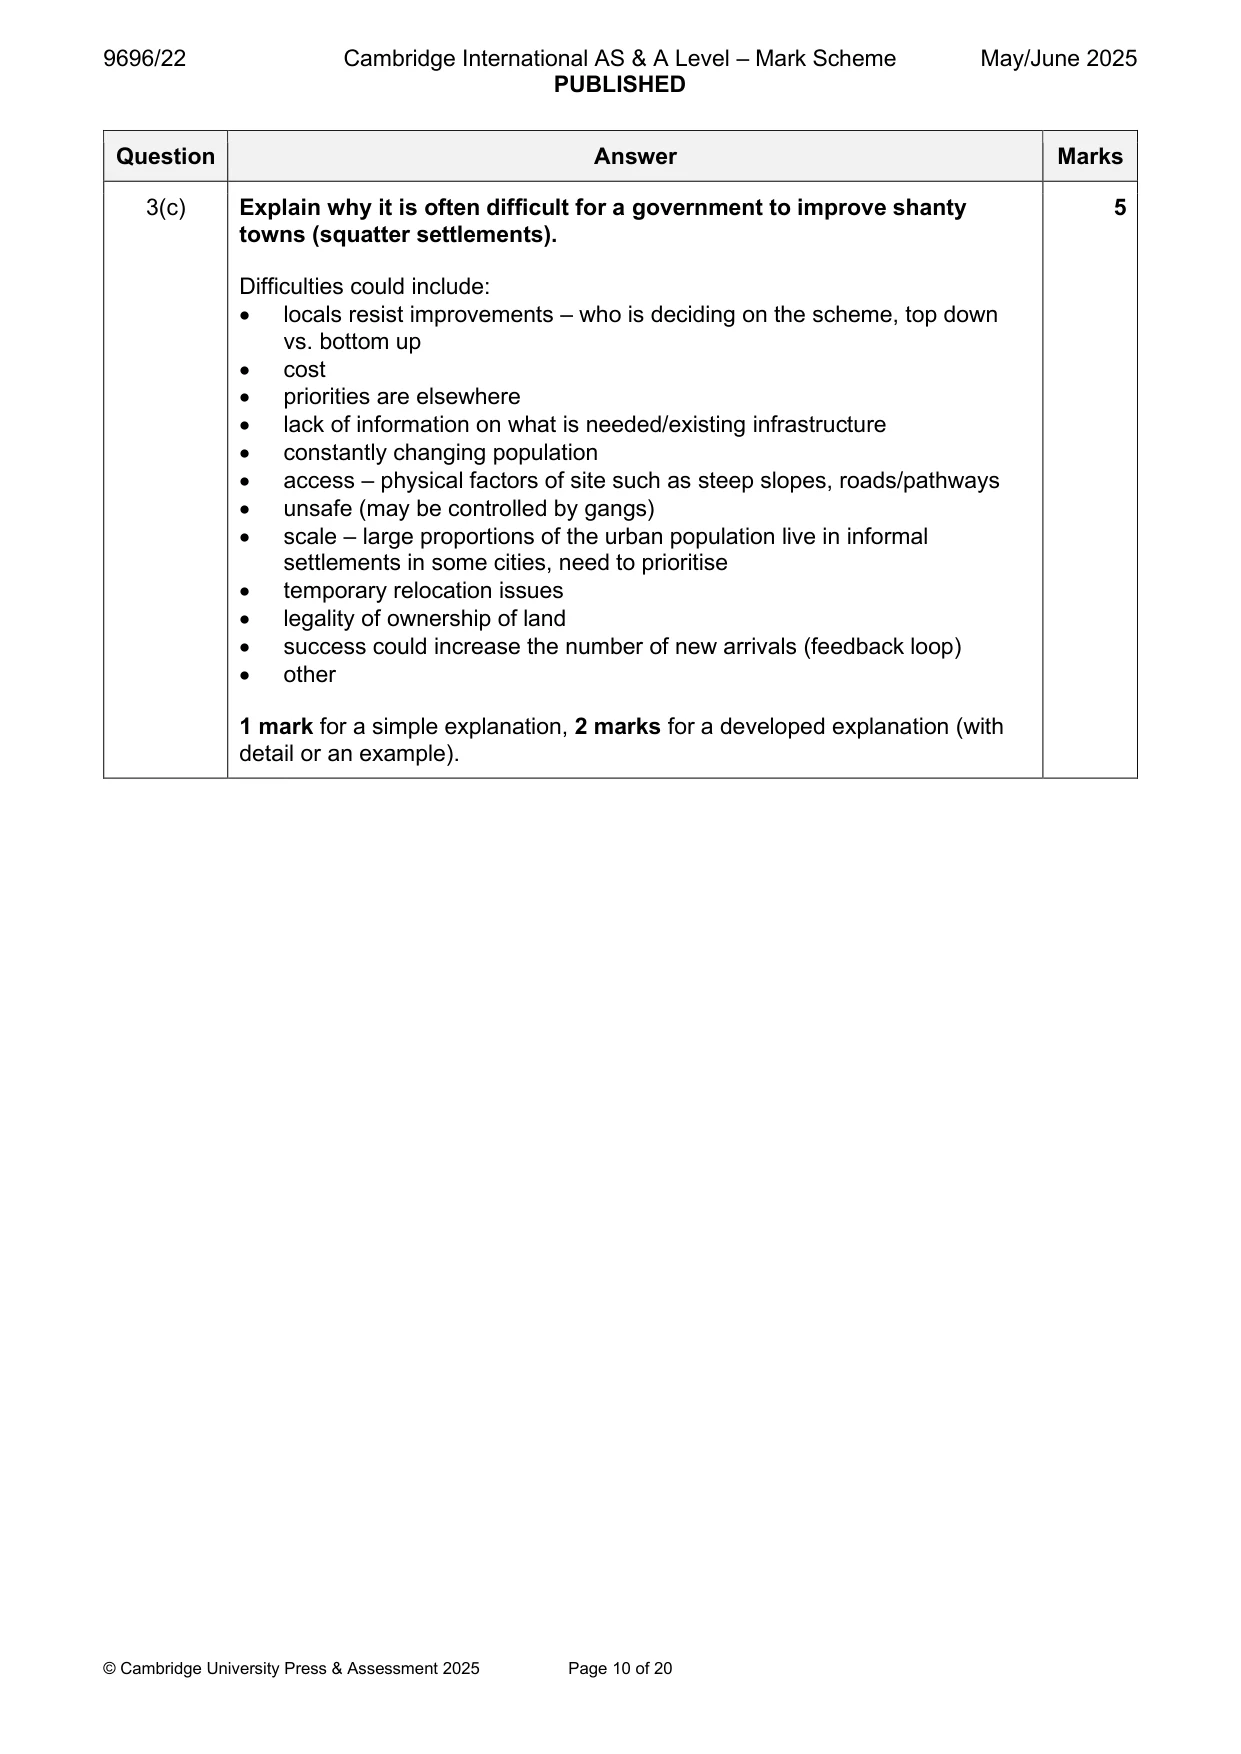
Mark scheme: 3(a) Fig. 3.1 is a photograph which shows a settlement in the Comas district 3 of Lima, Peru, an MIC in South America. Suggest three problems for the people living in the settlement shown in Fig. 3.1. Problems could include: • risk of landslides • limited access to services – power, sewage, running water • no greenery • transport/access difficult • limited size of buildings; quality of the houses 1 mark for each problem. If clearly not related to the photograph, max. 1 mark. 3(b) Suggest two advantages for the people of living in the settlement shown 2 in Fig. 3.1. Advantages could include: • some services (pipelines/cables exist, possibly evidence of refuse sorting/collection) • space – not on top of each other • view • build (and paint) as you want • affordable – look to be self-built • sense of community, as shared experiences in developing the settlement • there is a through road (mid slope) – transport links • as buildings look uniform, possibly organised/government supported scheme to improve the housing 1 mark for each advantage. If clearly not related to the photograph, max. 1 mark. 3(c) Explain why it is often difficult for a government to improve shanty 5 towns (squatter settlements). Difficulties could include: • locals resist improvements – who is deciding on the scheme, top down vs. bottom up • cost • priorities are elsewhere • lack of information on what is needed/existing infrastructure • constantly changing population • access – physical factors of site such as steep slopes, roads/pathways • unsafe (may be controlled by gangs) • scale – large proportions of the urban population live in informal settlements in some cities, need to prioritise • temporary relocation issues • legality of ownership of land • success could increase the number of new arrivals (feedback loop) • other 1 mark for a simple explanation, 2 marks for a developed explanation (with detail or an example). Section B Answer one question from this section. All questions are worth 30 marks. Population
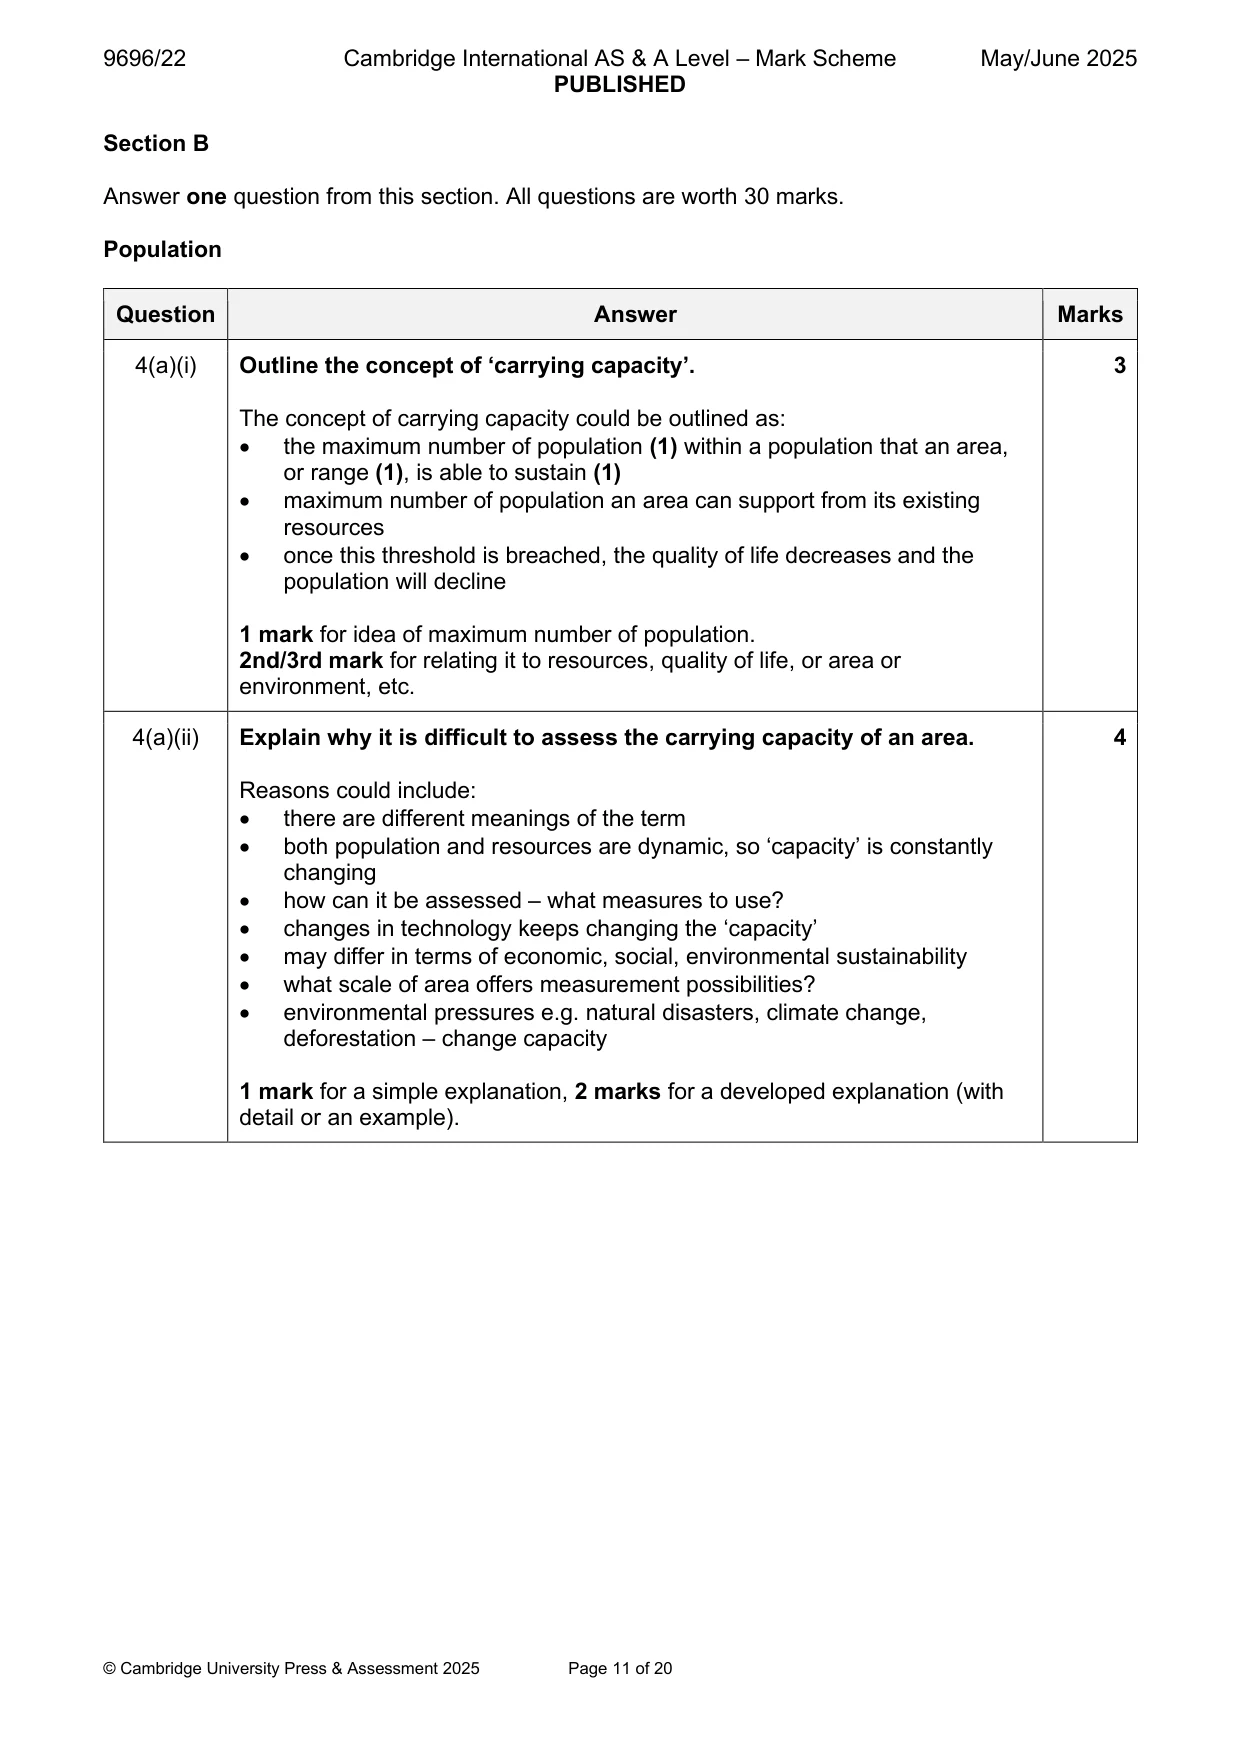
Q4 · Outline the concept of ‘carrying capacity’
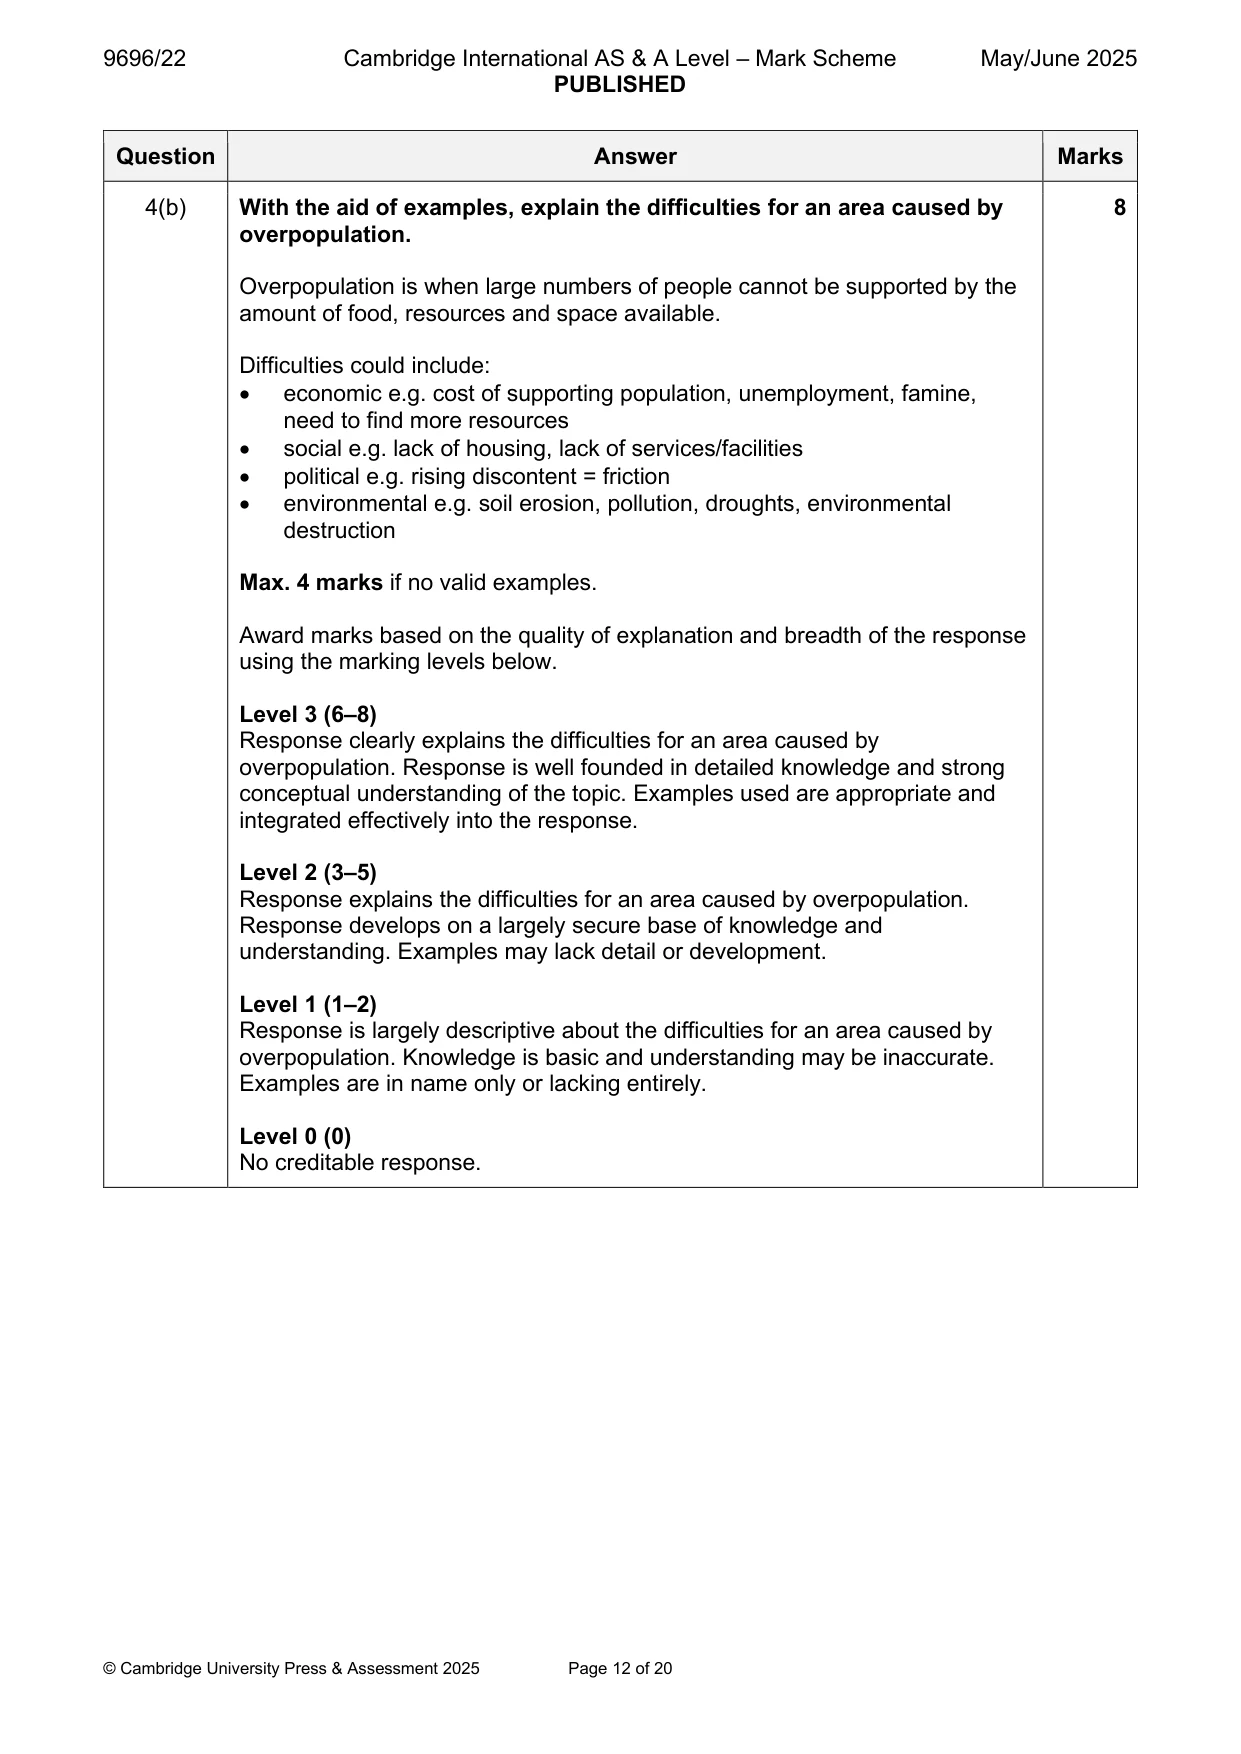
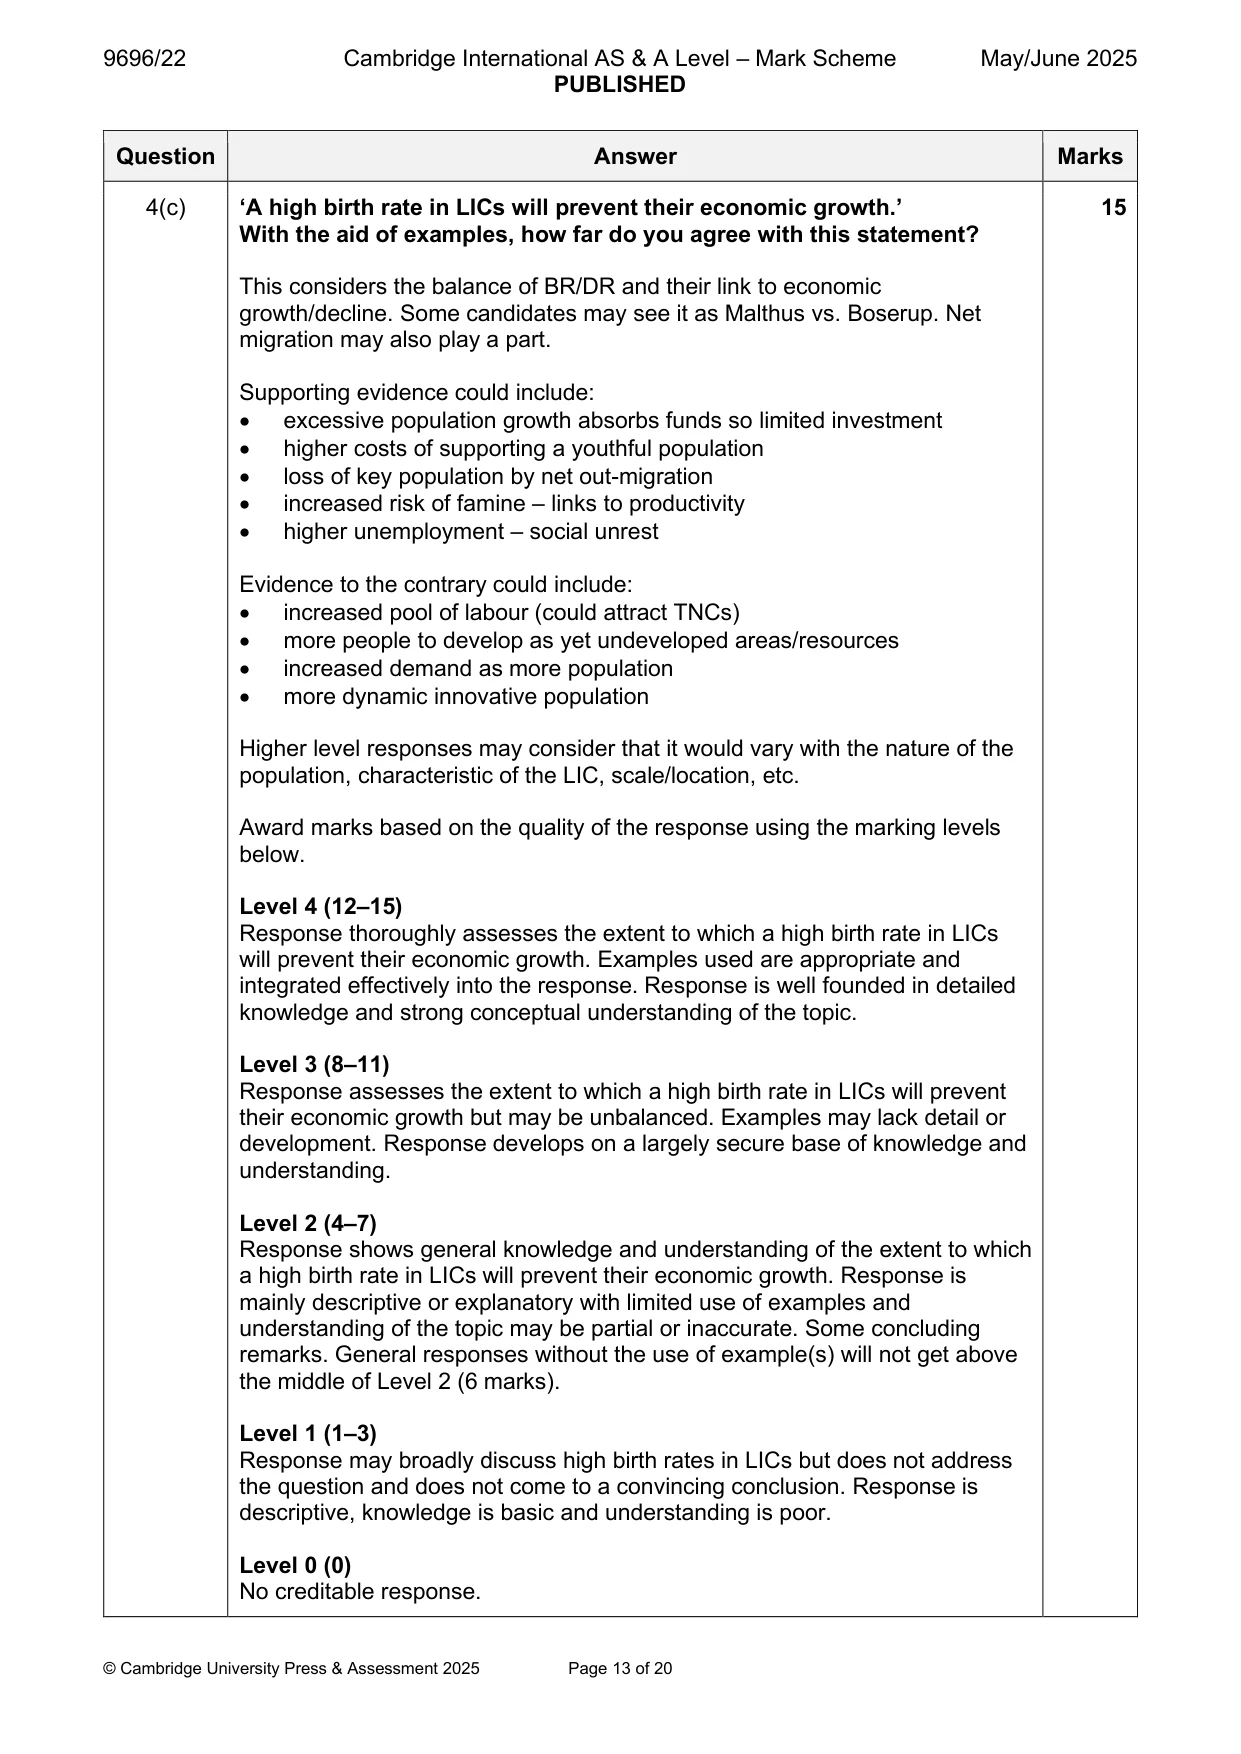
4 (a) (i) Outline the concept of ‘carrying capacity’. [3] (ii) Explain why it is difficult to assess the carrying capacity of an area. [4] (b) With the aid of examples, explain the difficulties for an area caused by overpopulation. [8] (c) ‘A high birth rate in LICs will prevent their economic growth.’ With the aid of examples, how far do you agree with this statement? [15] Migration/Settlement dynamics
Mark scheme: 4(a)(i) Outline the concept of ‘carrying capacity’. 3 The concept of carrying capacity could be outlined as: • the maximum number of population (1) within a population that an area, or range (1), is able to sustain (1) • maximum number of population an area can support from its existing resources • once this threshold is breached, the quality of life decreases and the population will decline 1 mark for idea of maximum number of population. 2nd/3rd mark for relating it to resources, quality of life, or area or environment, etc. 4(a)(ii) Explain why it is difficult to assess the carrying capacity of an area. 4 Reasons could include: • there are different meanings of the term • both population and resources are dynamic, so ‘capacity’ is constantly changing • how can it be assessed – what measures to use? • changes in technology keeps changing the ‘capacity’ • may differ in terms of economic, social, environmental sustainability • what scale of area offers measurement possibilities? • environmental pressures e.g. natural disasters, climate change, deforestation – change capacity 1 mark for a simple explanation, 2 marks for a developed explanation (with detail or an example). 4(b) With the aid of examples, explain the difficulties for an area caused by 8 overpopulation. Overpopulation is when large numbers of people cannot be supported by the amount of food, resources and space available. Difficulties could include: • economic e.g. cost of supporting population, unemployment, famine, need to find more resources • social e.g. lack of housing, lack of services/facilities • political e.g. rising discontent = friction • environmental e.g. soil erosion, pollution, droughts, environmental destruction Max. 4 marks if no valid examples. Award marks based on the quality of explanation and breadth of the response using the marking levels below. Level 3 (6–8) Response clearly explains the difficulties for an area caused by overpopulation. Response is well founded in detailed knowledge and strong conceptual understanding of the topic. Examples used are appropriate and integrated effectively into the response. Level 2 (3–5) Response explains the difficulties for an area caused by overpopulation. Response develops on a largely secure base of knowledge and understanding. Examples may lack detail or development. Level 1 (1–2) Response is largely descriptive about the difficulties for an area caused by overpopulation. Knowledge is basic and understanding may be inaccurate. Examples are in name only or lacking entirely. Level 0 (0) No creditable response. 4(c) ‘A high birth rate in LICs will prevent their economic growth.’ 15 With the aid of examples, how far do you agree with this statement? This considers the balance of BR/DR and their link to economic growth/decline. Some candidates may see it as Malthus vs. Boserup. Net migration may also play a part. Supporting evidence could include: • excessive population growth absorbs funds so limited investment • higher costs of supporting a youthful population • loss of key population by net out-migration • increased risk of famine – links to productivity • higher unemployment – social unrest Evidence to the contrary could include: • increased pool of labour (could attract TNCs) • more people to develop as yet undeveloped areas/resources • increased demand as more population • more dynamic innovative population Higher level responses may consider that it would vary with the nature of the population, characteristic of the LIC, scale/location, etc. Award marks based on the quality of the response using the marking levels below. Level 4 (12–15) Response thoroughly assesses the extent to which a high birth rate in LICs will prevent their economic growth. Examples used are appropriate and integrated effectively into the response. Response is well founded in detailed knowledge and strong conceptual understanding of the topic. Level 3 (8–11) Response assesses the extent to which a high birth rate in LICs will prevent their economic growth but may be unbalanced. Examples may lack detail or development. Response develops on a largely secure base of knowledge and understanding. Level 2 (4–7) Response shows general knowledge and understanding of the extent to which a high birth rate in LICs will prevent their economic growth. Response is mainly descriptive or explanatory with limited use of examples and understanding of the topic may be partial or inaccurate. Some concluding remarks. General responses without the use of example(s) will not get above the middle of Level 2 (6 marks). Level 1 (1–3) Response may broadly discuss high birth rates in LICs but does not address the question and does not come to a convincing conclusion. Response is descriptive, knowledge is basic and understanding is poor. Level 0 (0) No creditable response. Migration/Settlement dynamics
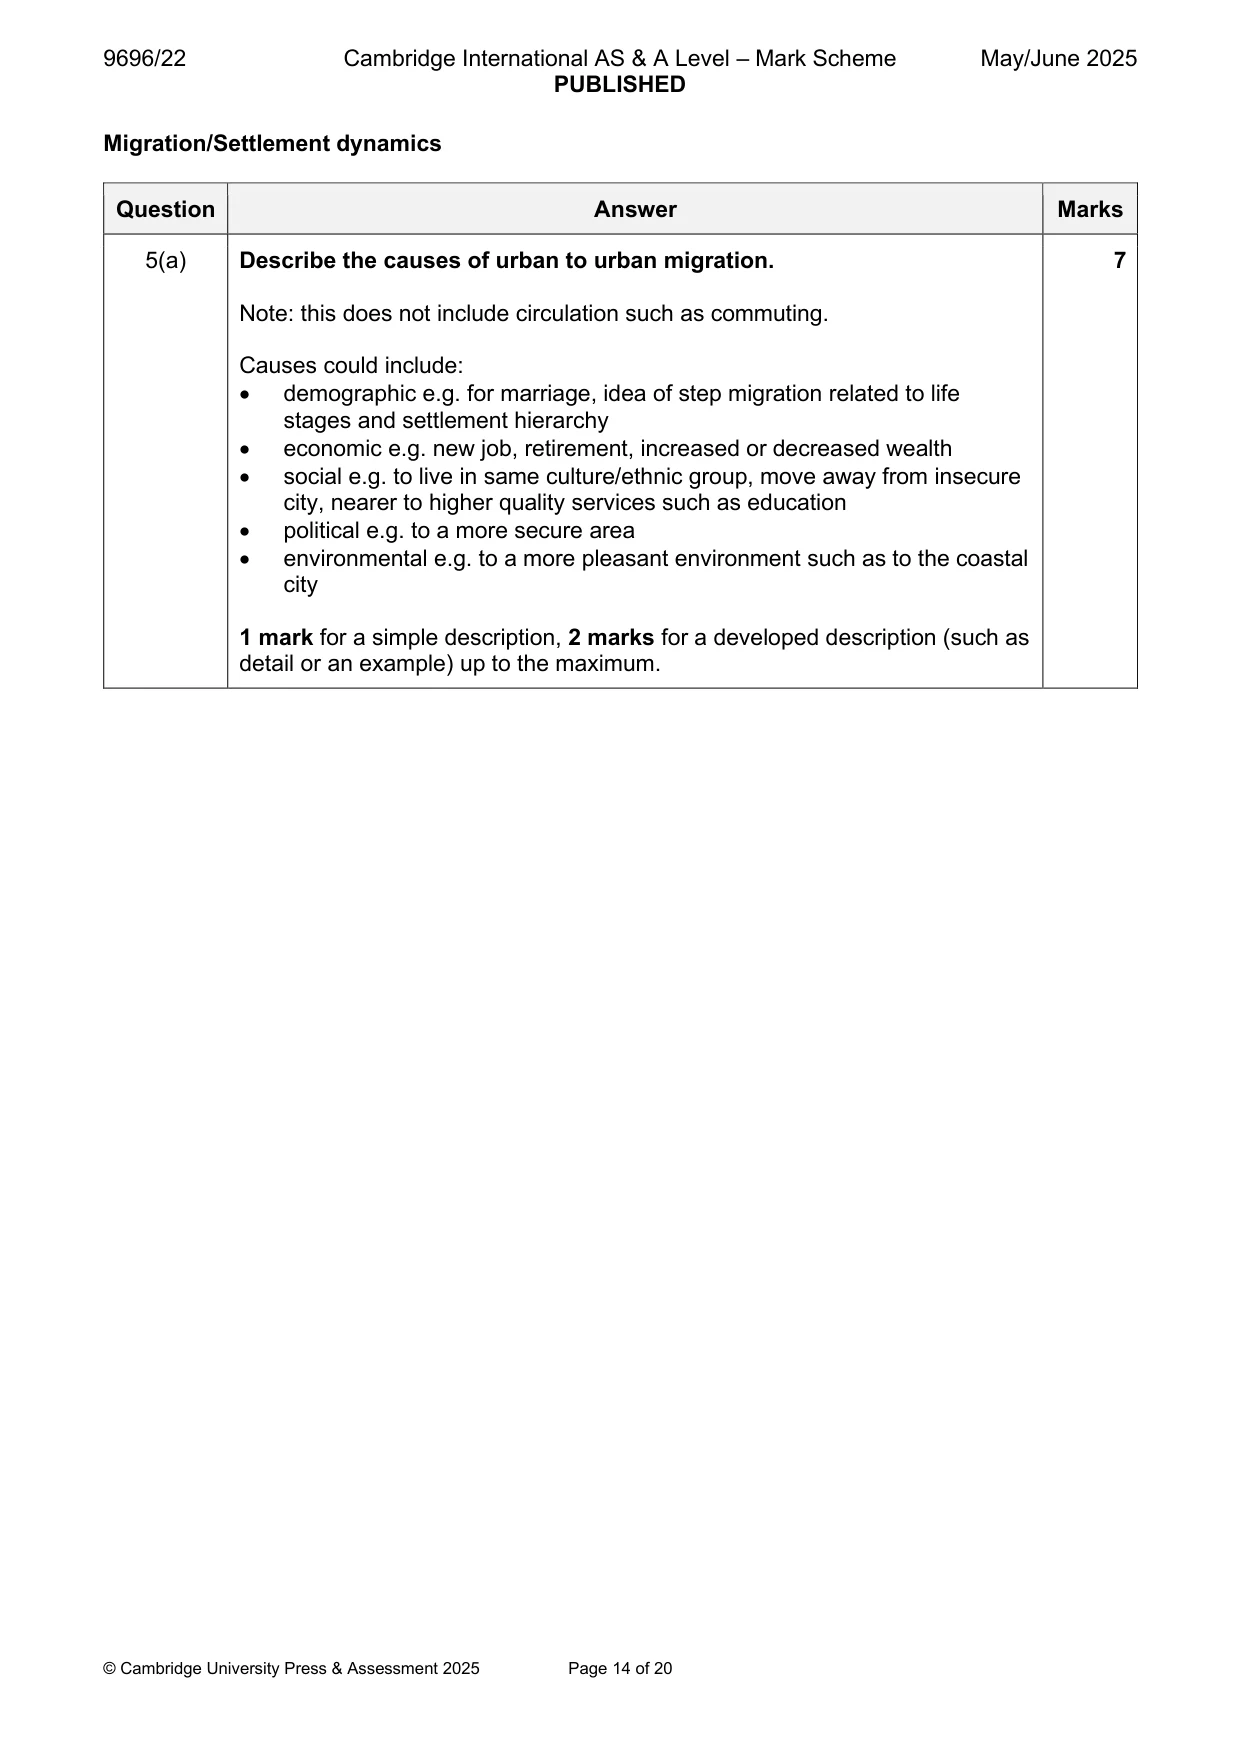
Q5 · Describe the causes of urban to urban migration
5 (a) Describe the causes of urban to urban migration. [7] (b) With the aid of examples, explain why intra-urban migration (within the same urban area) has increased in recent years. [8] (c) With the aid of examples, how far do you agree that it is difficult for governments to manage rural to urban migration? [15] Population/Migration/Settlement dynamics
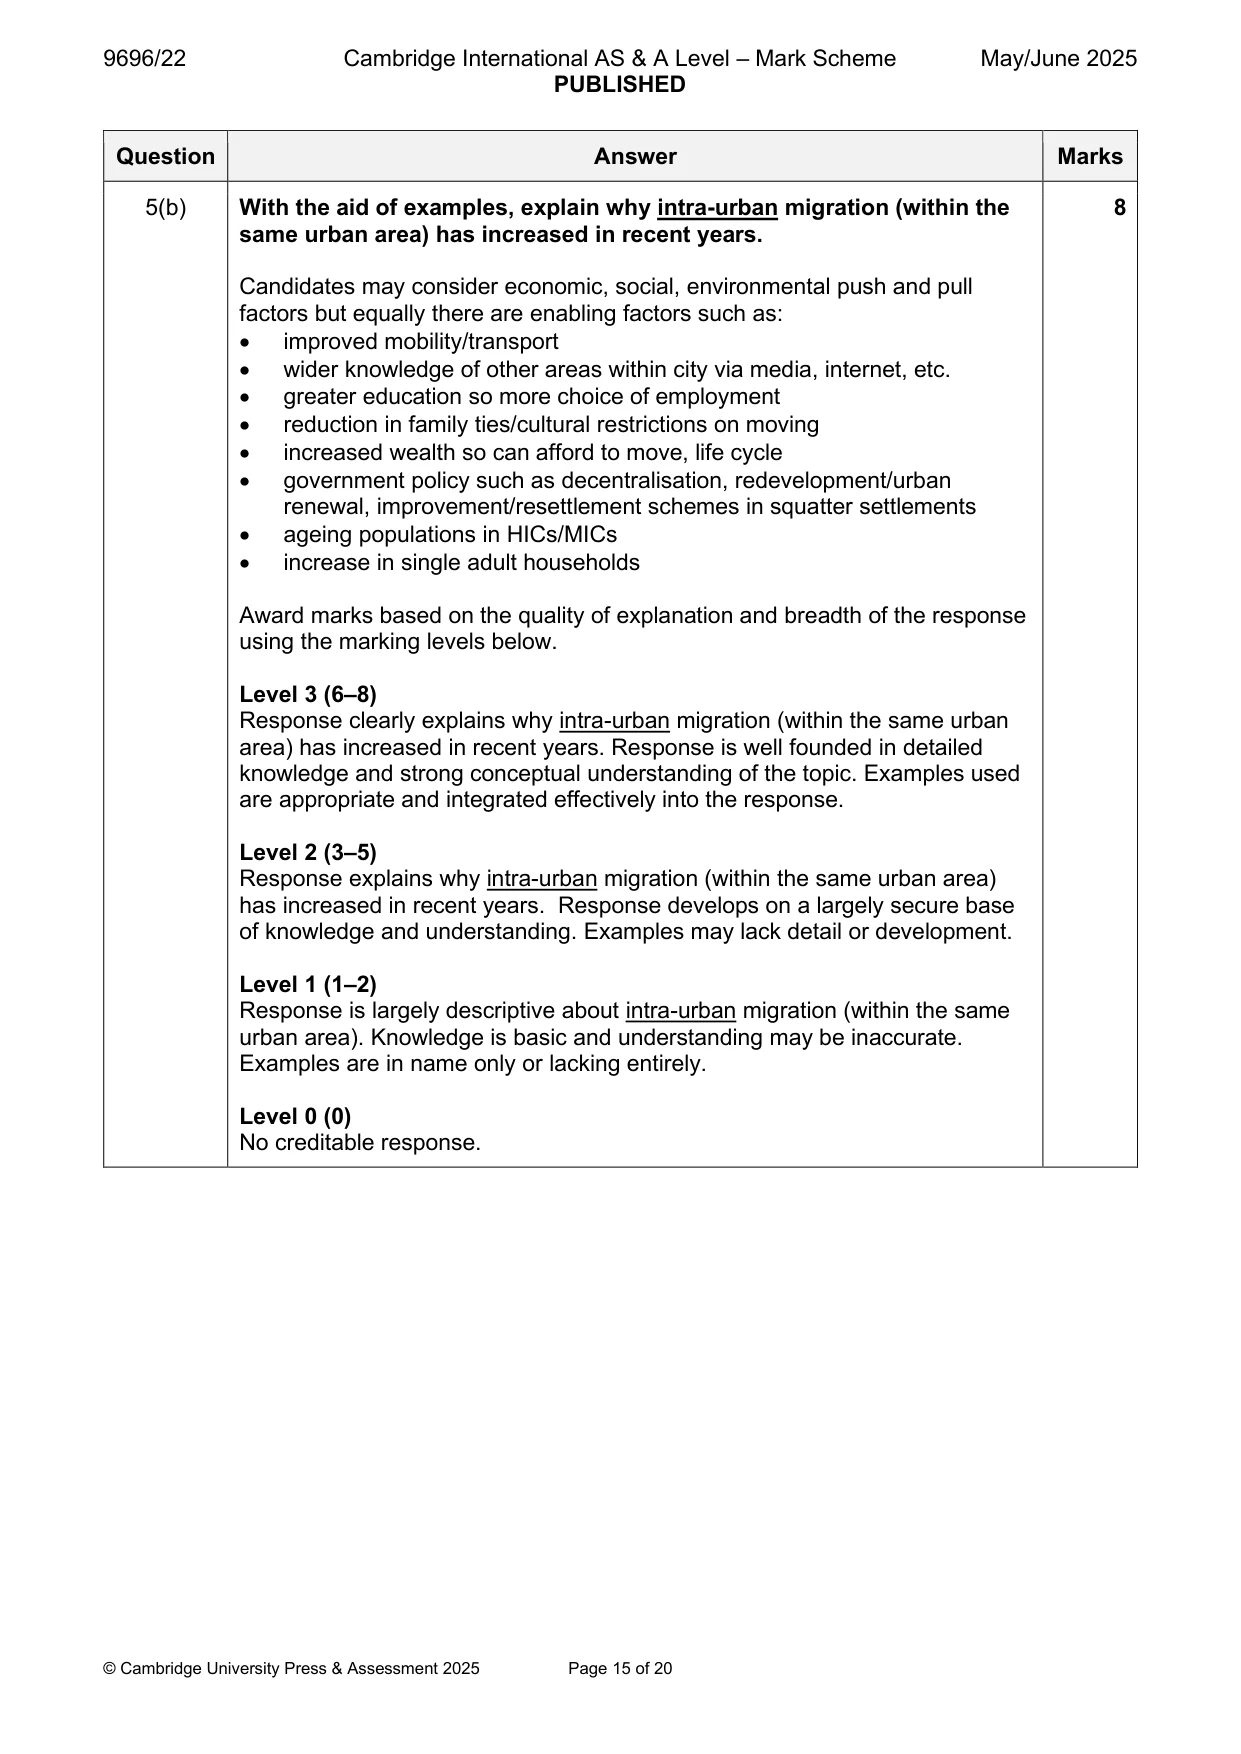
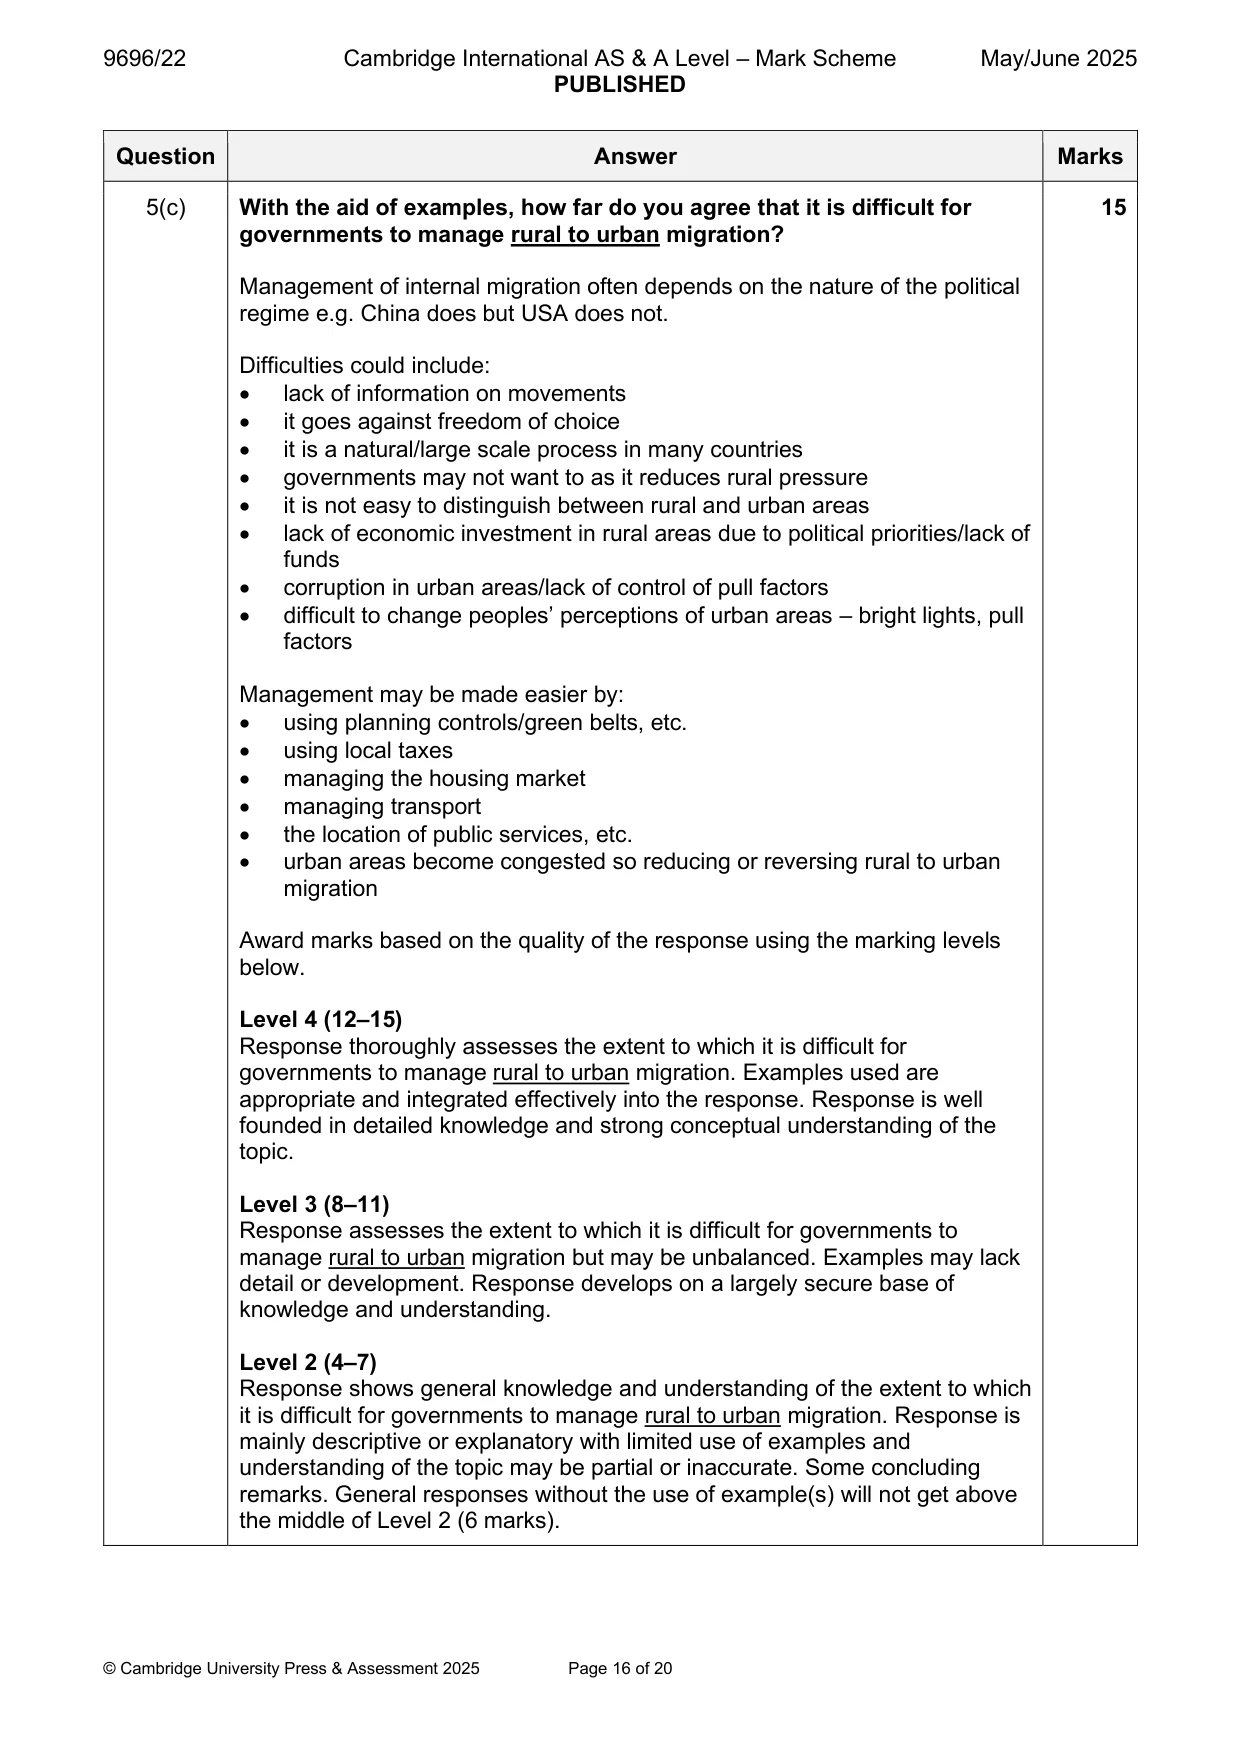
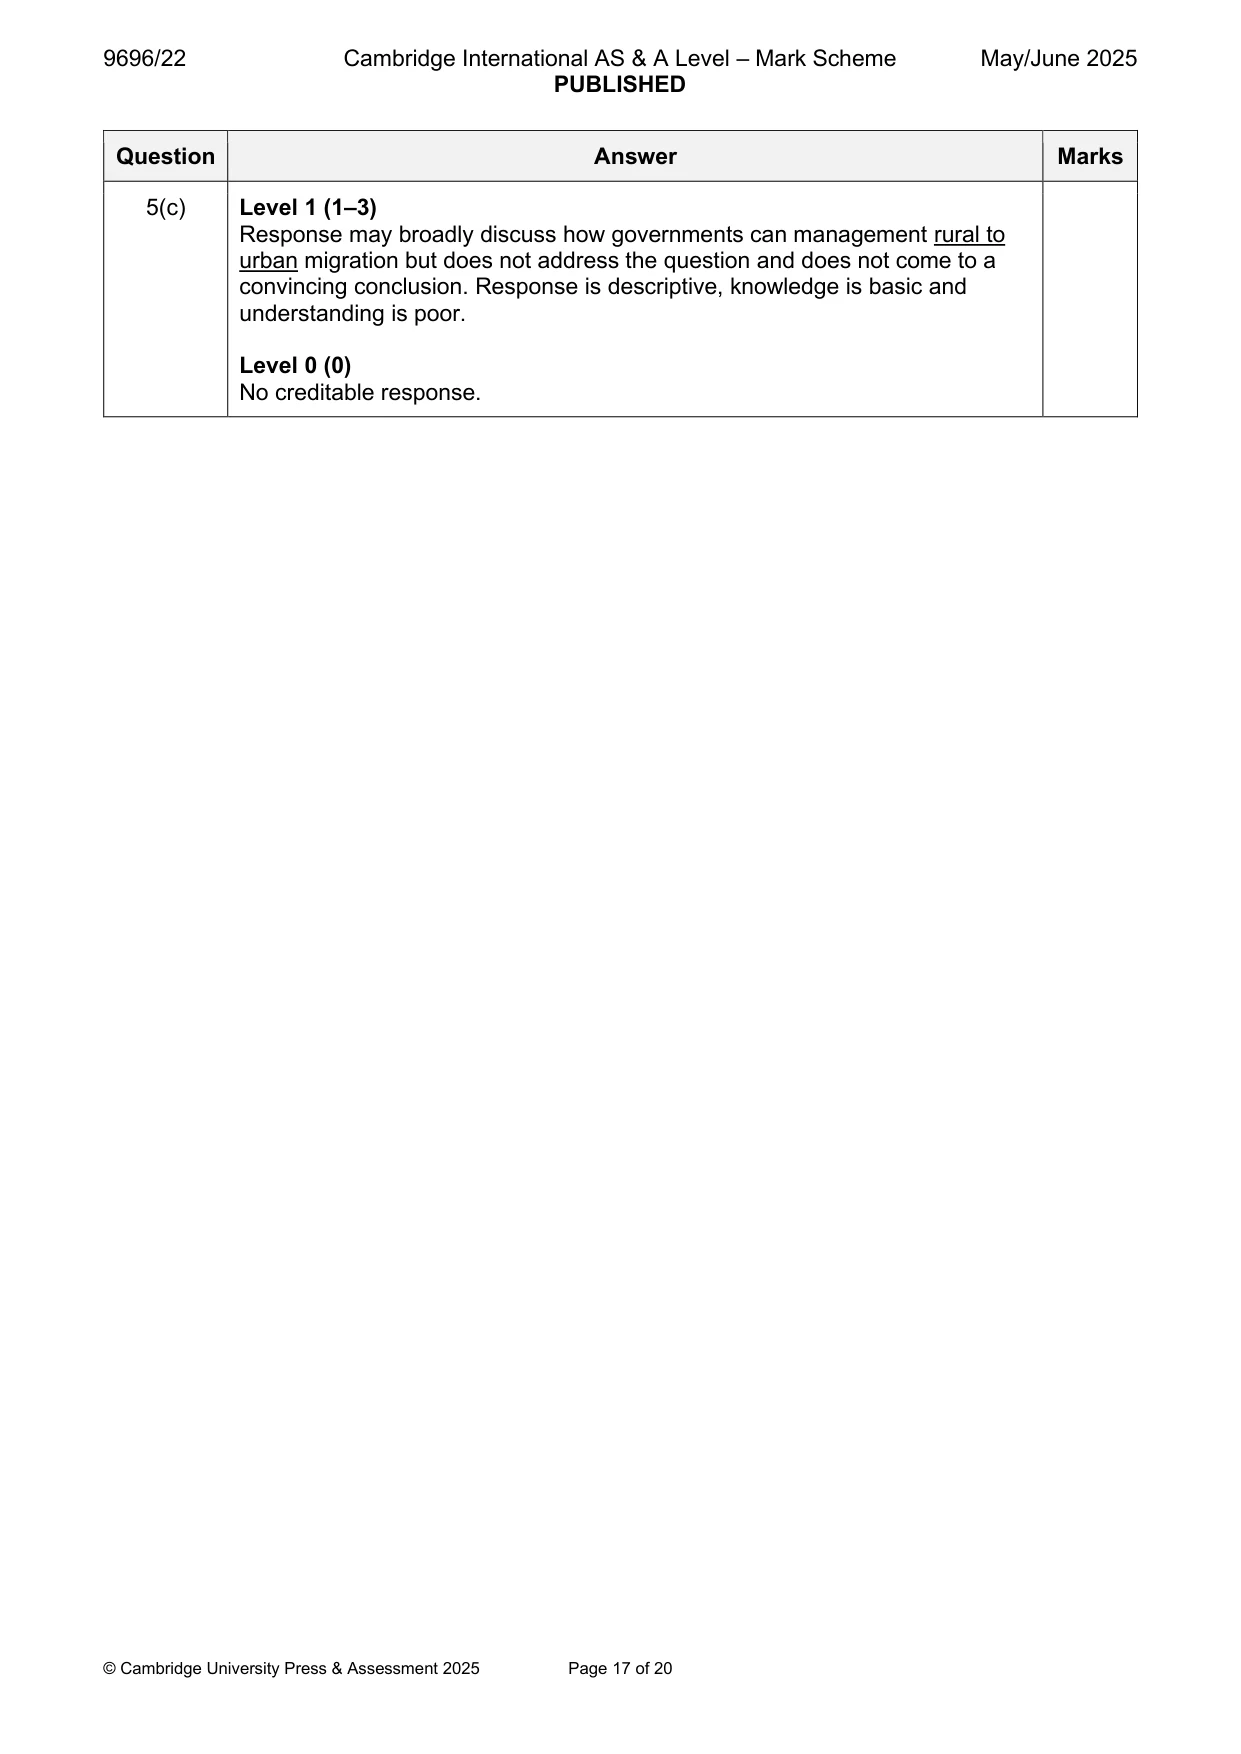
Mark scheme: 5(a) Describe the causes of urban to urban migration. 7 Note: this does not include circulation such as commuting. Causes could include: • demographic e.g. for marriage, idea of step migration related to life stages and settlement hierarchy • economic e.g. new job, retirement, increased or decreased wealth • social e.g. to live in same culture/ethnic group, move away from insecure city, nearer to higher quality services such as education • political e.g. to a more secure area • environmental e.g. to a more pleasant environment such as to the coastal city 1 mark for a simple description, 2 marks for a developed description (such as detail or an example) up to the maximum. 5(b) With the aid of examples, explain why intra-urban migration (within the 8 same urban area) has increased in recent years. Candidates may consider economic, social, environmental push and pull factors but equally there are enabling factors such as: • improved mobility/transport • wider knowledge of other areas within city via media, internet, etc. • greater education so more choice of employment • reduction in family ties/cultural restrictions on moving • increased wealth so can afford to move, life cycle • government policy such as decentralisation, redevelopment/urban renewal, improvement/resettlement schemes in squatter settlements • ageing populations in HICs/MICs • increase in single adult households Award marks based on the quality of explanation and breadth of the response using the marking levels below. Level 3 (6–8) Response clearly explains why intra-urban migration (within the same urban area) has increased in recent years. Response is well founded in detailed knowledge and strong conceptual understanding of the topic. Examples used are appropriate and integrated effectively into the response. Level 2 (3–5) Response explains why intra-urban migration (within the same urban area) has increased in recent years. Response develops on a largely secure base of knowledge and understanding. Examples may lack detail or development. Level 1 (1–2) Response is largely descriptive about intra-urban migration (within the same urban area). Knowledge is basic and understanding may be inaccurate. Examples are in name only or lacking entirely. Level 0 (0) No creditable response. 5(c) With the aid of examples, how far do you agree that it is difficult for 15 governments to manage rural to urban migration? Management of internal migration often depends on the nature of the political regime e.g. China does but USA does not. Difficulties could include: • lack of information on movements • it goes against freedom of choice • it is a natural/large scale process in many countries • governments may not want to as it reduces rural pressure • it is not easy to distinguish between rural and urban areas • lack of economic investment in rural areas due to political priorities/lack of funds • corruption in urban areas/lack of control of pull factors • difficult to change peoples’ perceptions of urban areas – bright lights, pull factors Management may be made easier by: • using planning controls/green belts, etc. • using local taxes • managing the housing market • managing transport • the location of public services, etc. • urban areas become congested so reducing or reversing rural to urban migration Award marks based on the quality of the response using the marking levels below. Level 4 (12–15) Response thoroughly assesses the extent to which it is difficult for governments to manage rural to urban migration. Examples used are appropriate and integrated effectively into the response. Response is well founded in detailed knowledge and strong conceptual understanding of the topic. Level 3 (8–11) Response assesses the extent to which it is difficult for governments to manage rural to urban migration but may be unbalanced. Examples may lack detail or development. Response develops on a largely secure base of knowledge and understanding. Level 2 (4–7) Response shows general knowledge and understanding of the extent to which it is difficult for governments to manage rural to urban migration. Response is mainly descriptive or explanatory with limited use of examples and understanding of the topic may be partial or inaccurate. Some concluding remarks. General responses without the use of example(s) will not get above the middle of Level 2 (6 marks). 5(c) Level 1 (1–3) Response may broadly discuss how governments can management rural to urban migration but does not address the question and does not come to a convincing conclusion. Response is descriptive, knowledge is basic and understanding is poor. Level 0 (0) No creditable response. Population/Migration/Settlement dynamics
Q6 · Describe the characteristics of central business districts (CBDs)
6 (a) Describe the characteristics of central business districts (CBDs). [7] (b) With the aid of examples, explain why there are challenges for many CBDs. [8] (c) ‘There is a limit to how large a city can grow in size.’ With the aid of examples, how far do you agree with this statement? [15]
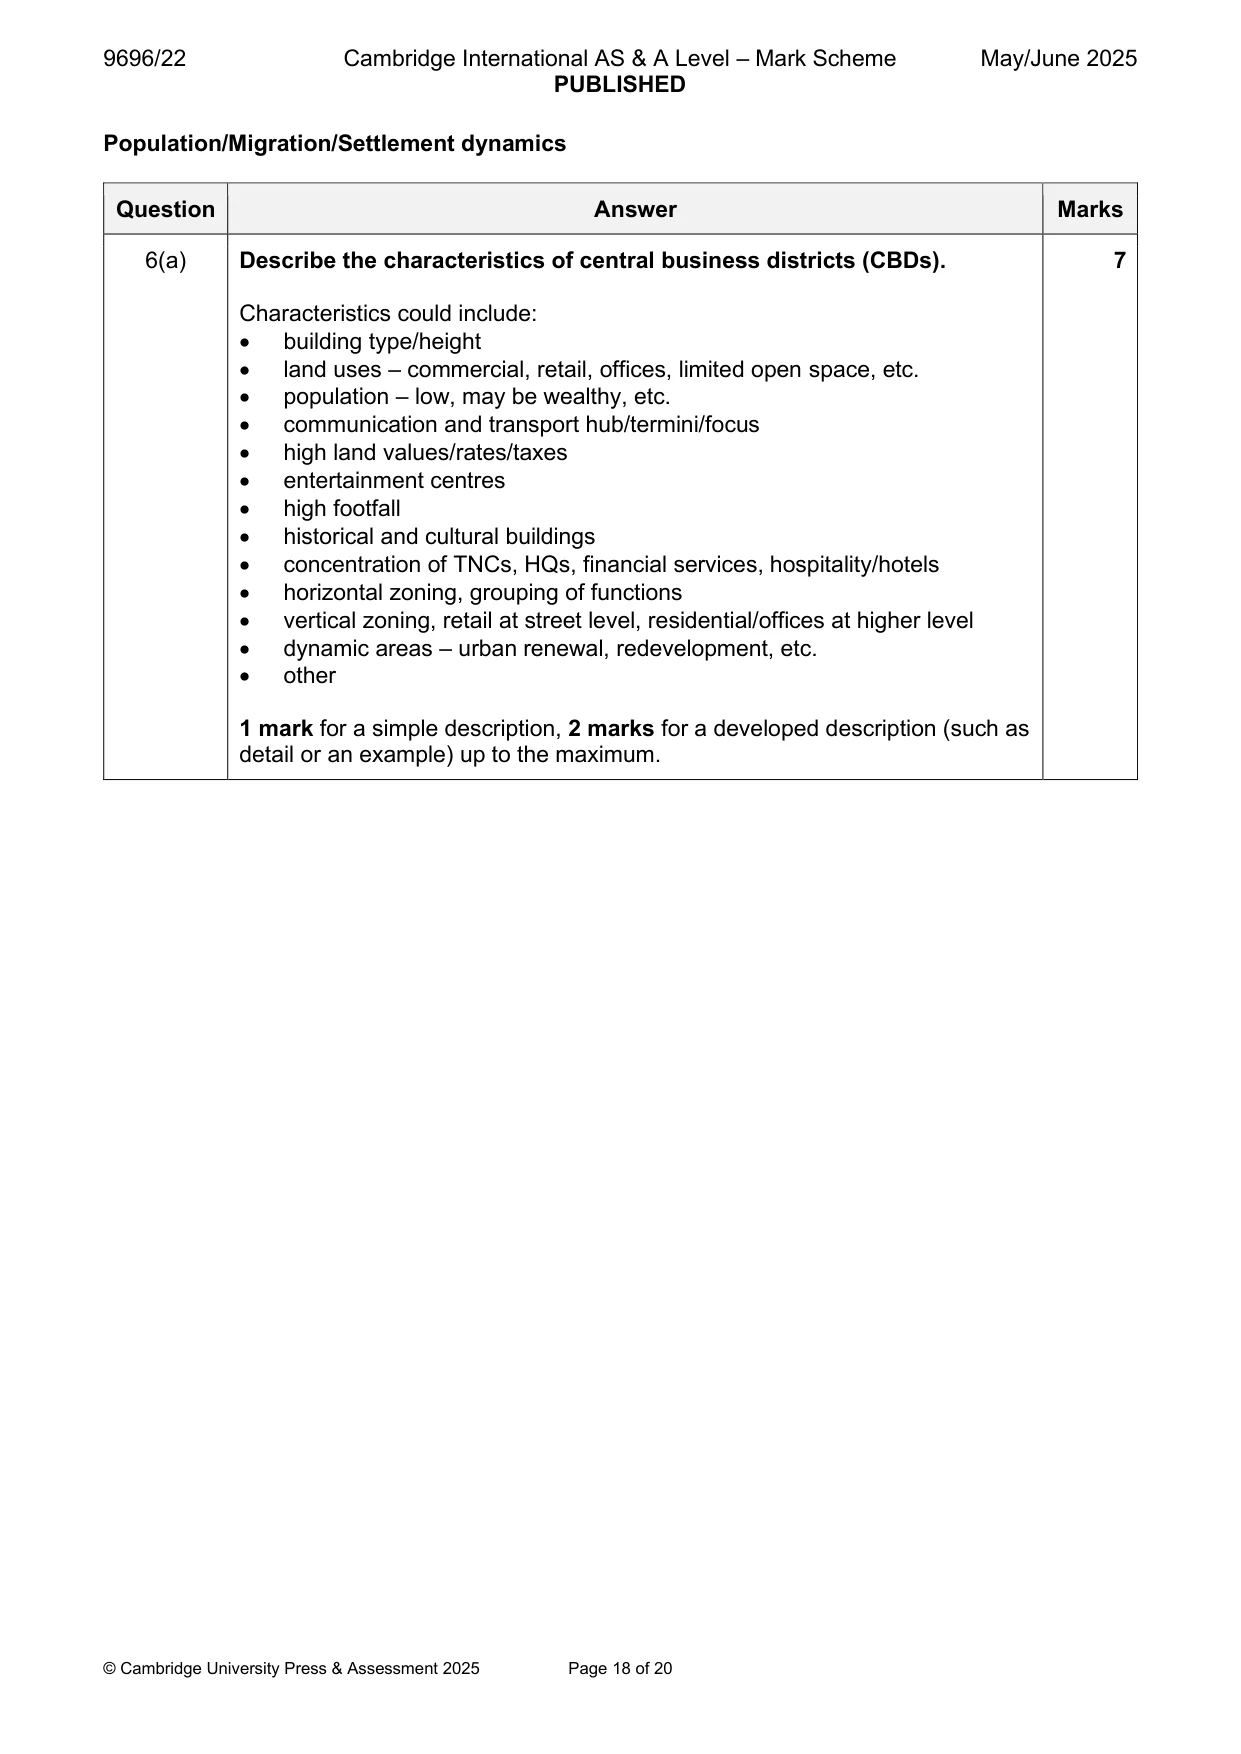
Mark scheme: 6(a) Describe the characteristics of central business districts (CBDs). 7 Characteristics could include: • building type/height • land uses – commercial, retail, offices, limited open space, etc. • population – low, may be wealthy, etc. • communication and transport hub/termini/focus • high land values/rates/taxes • entertainment centres • high footfall • historical and cultural buildings • concentration of TNCs, HQs, financial services, hospitality/hotels • horizontal zoning, grouping of functions • vertical zoning, retail at street level, residential/offices at higher level • dynamic areas – urban renewal, redevelopment, etc. • other 1 mark for a simple description, 2 marks for a developed description (such as detail or an example) up to the maximum. 6(b) With the aid of examples, explain why there are challenges for many 8 CBDs. Note: challenges may differ between HICs and MICs/LICs. Challenges could include: • demographic e.g. loss of population – idea of hollow centre • economic e.g. movement out of offices, shops, etc. to cheaper peripheral sites, traffic congestion/pollution charges, ageing infrastructure • social e.g. social tensions, increased crime • political e.g. terror attacks, taxation issues, redevelopment (such as conflicts between developers/environmental groups) • environmental e.g. air pollution, micro-climate, physical space Max. 4 marks if no valid examples. Award marks based on the quality of explanation and breadth of the response using the marking levels below. Level 3 (6–8) Response clearly explains why there are challenges for many CBDs. Response is well founded in detailed knowledge and strong conceptual understanding of the topic. Examples used are appropriate and integrated effectively into the response. Level 2 (3–5) Response explains why there are challenges for many CBDs. Response develops on a largely secure base of knowledge and understanding. Examples may lack detail or development. Level 1 (1–2) Response is largely descriptive about CBDs. Knowledge is basic and understanding may be inaccurate. Examples are in name only or lacking entirely. Level 0 (0) No creditable response. 6(c) ‘There is a limit to how large a city can grow in size.’ 15 With the aid of examples, how far do you agree with this statement? Candidates may consider this is about diseconomies of scale so may agree due to increased problems such as: • demographic e.g. excessive population • economic e.g. increased transport costs, power supply, job availability • social e.g. increased social fragmentation/tension, increased costs of providing services • political e.g. difficult to plan/control, green belt policies • environmental e.g. increased pollution/waste, micro-climate • physical e.g. urban sprawl constrained by relief/coast/river Other candidates may disagree and consider the benefits of larger scale operation or even consider the concept of megalopolis. Population can increase if a city grows upwards and population density increases. Candidates could also consider over time – urbanisation is ‘complete’ in HICs, but happening with economic development in MICs/LICs, possibly linking to demographic transition. Award marks based on the quality of the response using the marking levels below. Level 4 (12–15) Response thoroughly assesses the extent to which there is a limit to how large a city can grow in size. Examples used are appropriate and integrated effectively into the response. Response is well founded in detailed knowledge and strong conceptual understanding of the topic. Level 3 (8–11) Response assesses the extent to which there is a limit to how large a city can grow in size but may be unbalanced. Examples may lack detail or development. Response develops on a largely secure base of knowledge and understanding. Level 2 (4–7) Response shows general knowledge and understanding of the extent to which there is a limit to how large a city can grow in size. Response is mainly descriptive or explanatory with limited use of examples and understanding of the topic may be partial or inaccurate. Some concluding remarks. General responses without the use of example(s) will not get above the middle of Level 2 (6 marks). Level 1 (1–3) Response may broadly discuss city growth but does not address the question and does not come to a convincing conclusion. Response is descriptive, knowledge is basic and understanding is poor. Level 0 (0) No creditable response.
What was in this paper
The subtopics covered by these 6 questions, and how many questions each got. Open one in a new tab to see every Cambridge question on it.
What you needed in this session
Cambridge’s own grade thresholds for 2025 May/June, Paper 2 · Variant 2. A higher threshold means an easier paper — the bar moves with how the cohort did.