Cambridge A Level Geography 9696 — 2024 Oct/Nov Paper 2 · Variant 2
9696/22/O/N/24 · 6 questions · 60 marks · ≈68 min
The question paper and its mark scheme, free to read here and free to download. This is Cambridge’s own paper, exactly as it was sat.
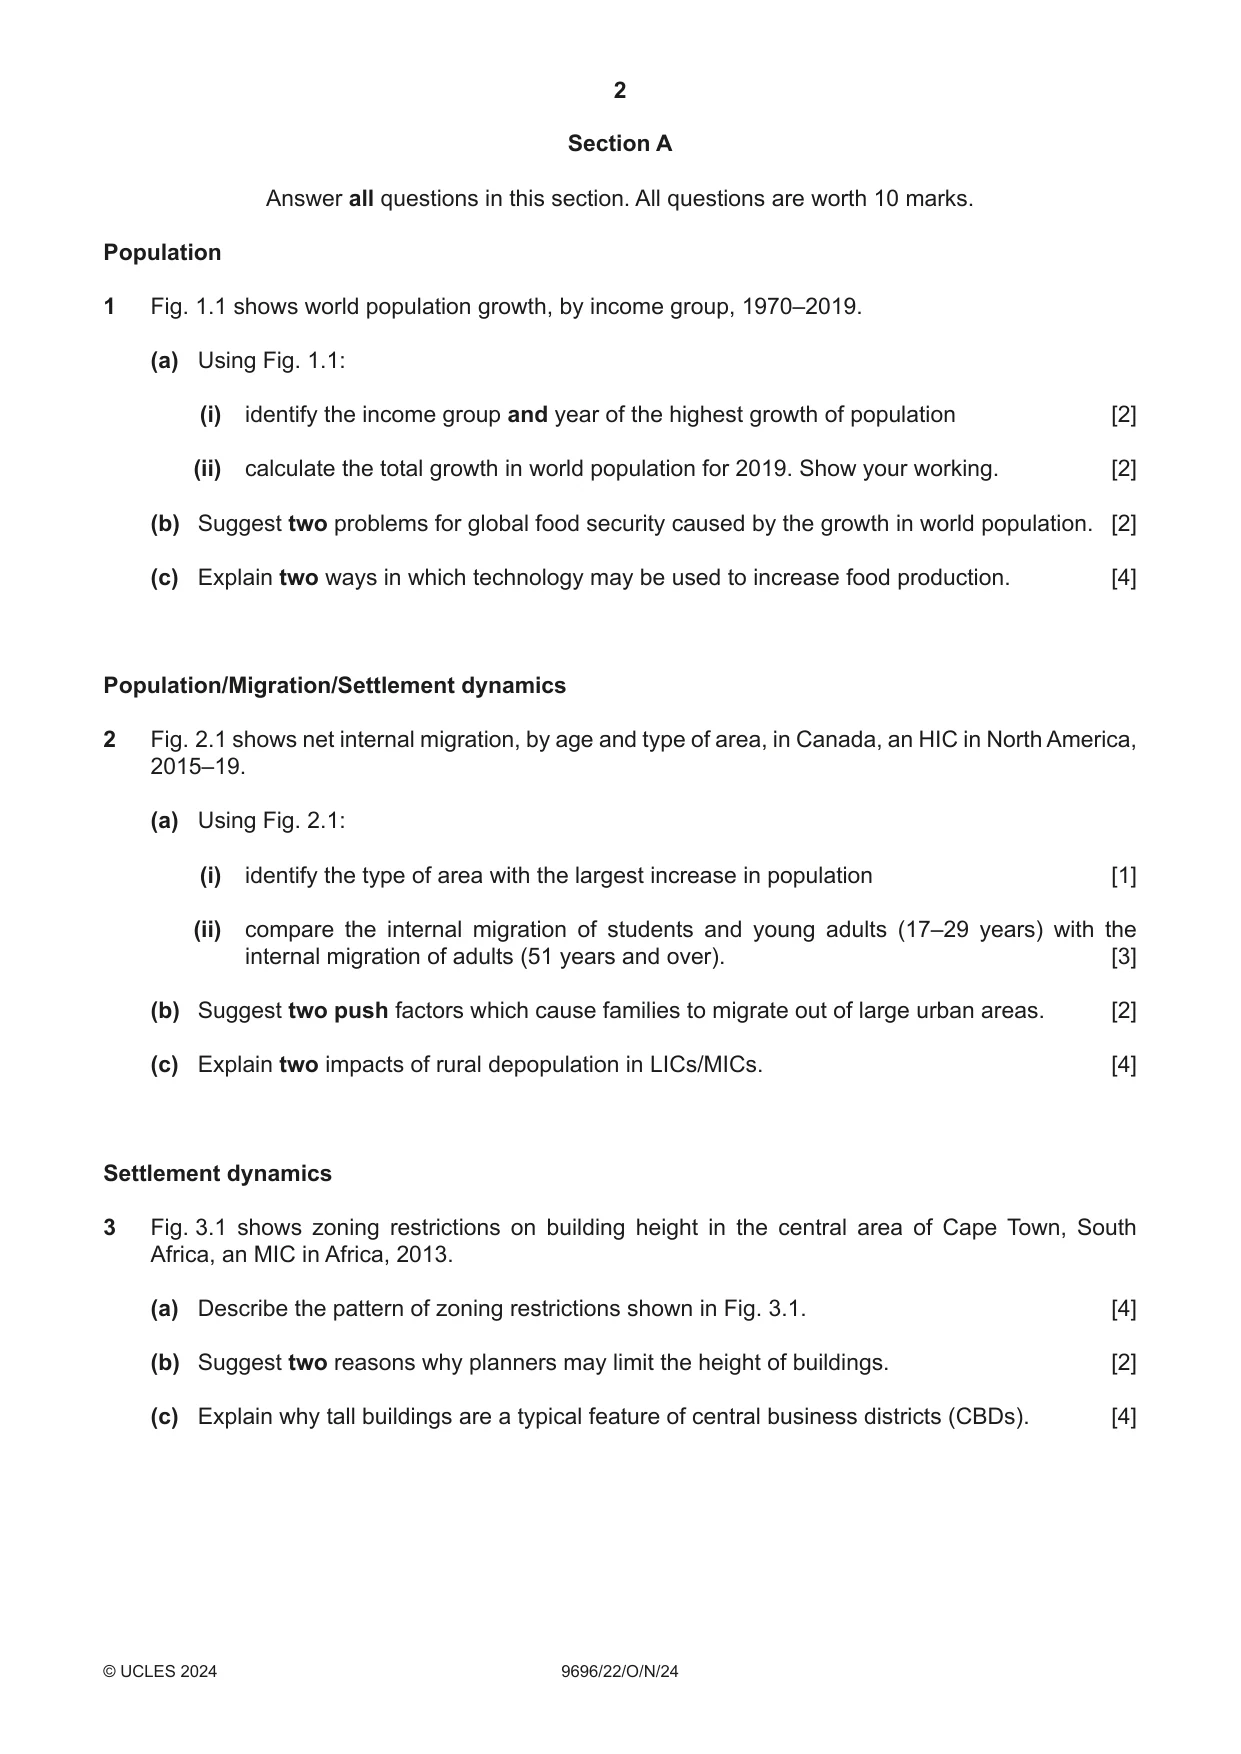
Question paper4 pages

Mark scheme18 pages
Answers below. Sit the paper first if you are practising.

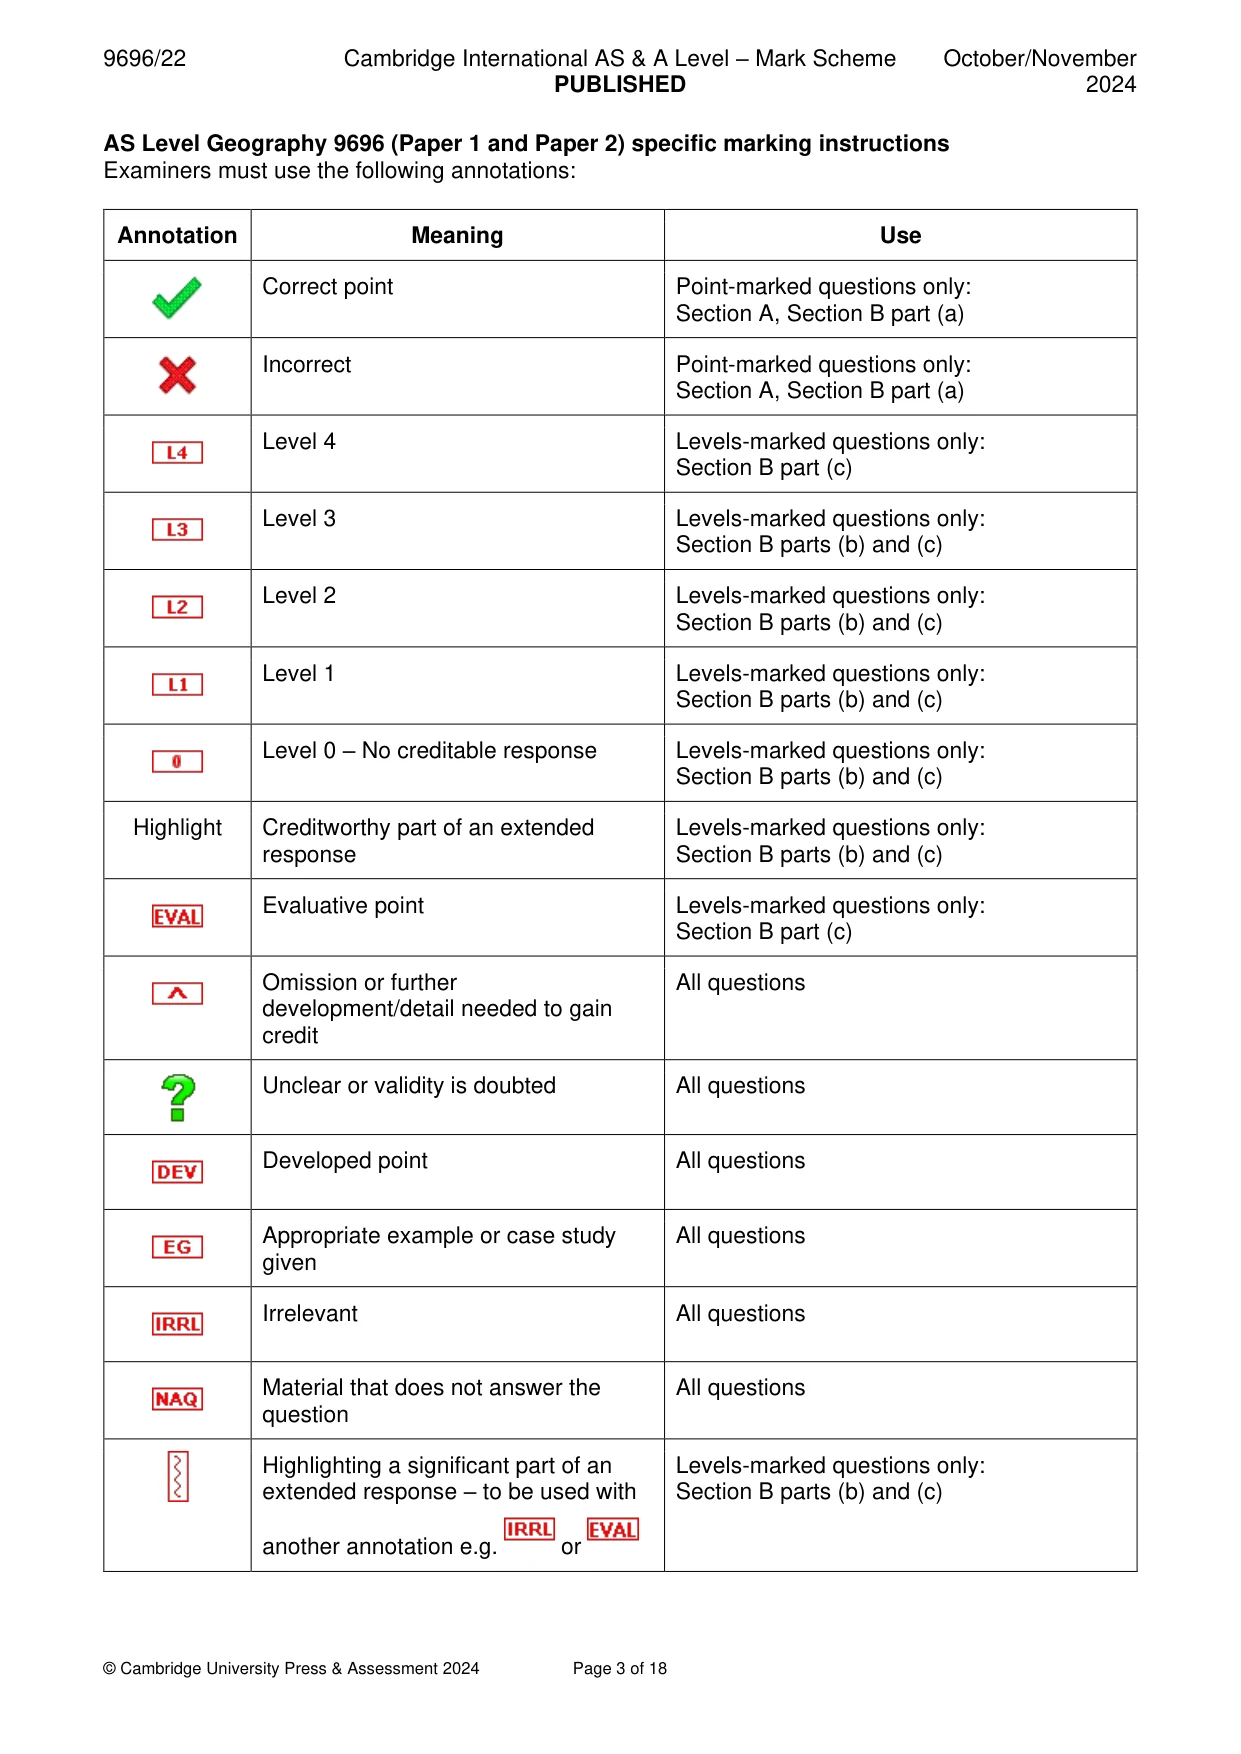
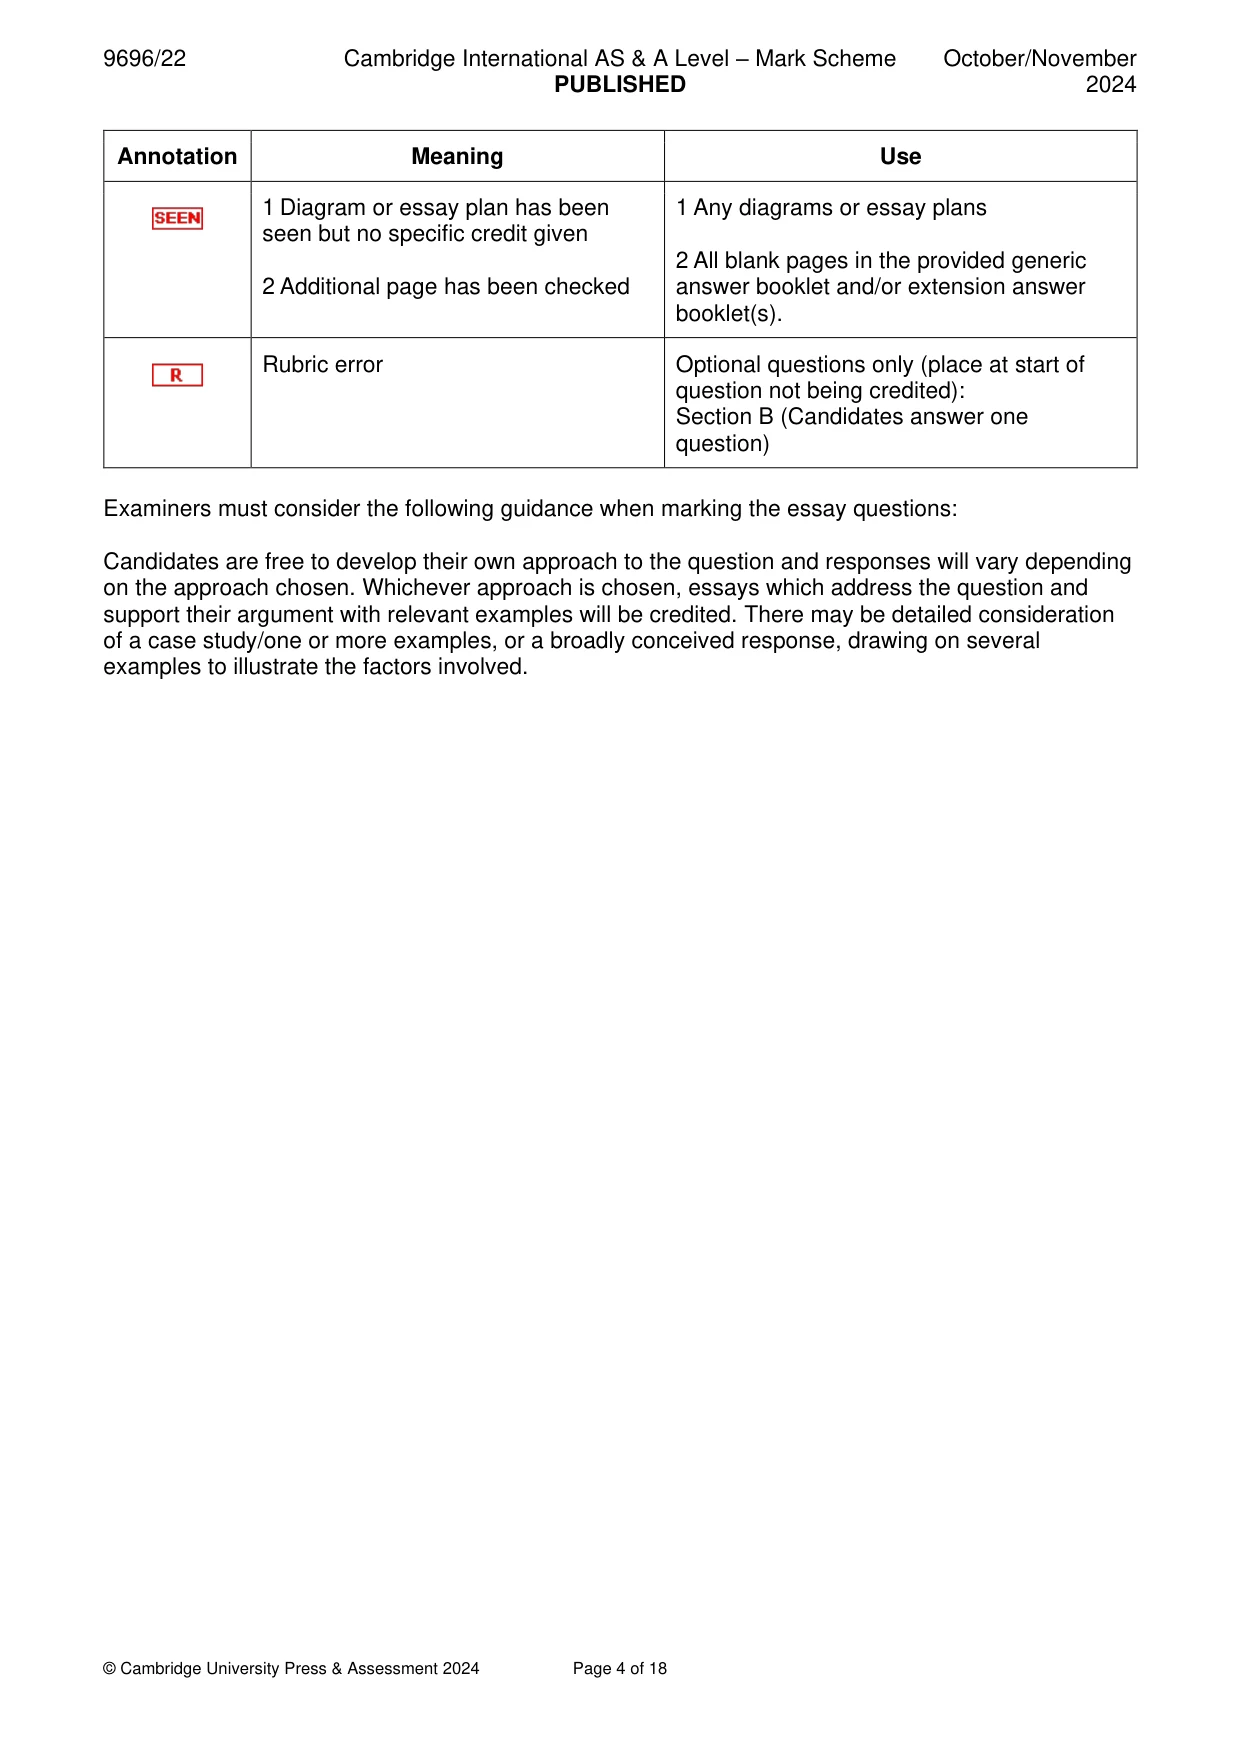
Questions as text
Q1 · World population growth, by income group, 1970–2019
1 Fig. 1.1 shows world population growth, by income group, 1970–2019. (a) Using Fig. 1.1: (i) identify the income group and year of the highest growth of population [2] (ii) calculate the total growth in world population for 2019. Show your working. [2] (b) Suggest two problems for global food security caused by the growth in world population. [2] (c) Explain two ways in which technology may be used to increase food production. [4] Population/Migration/Settlement dynamics
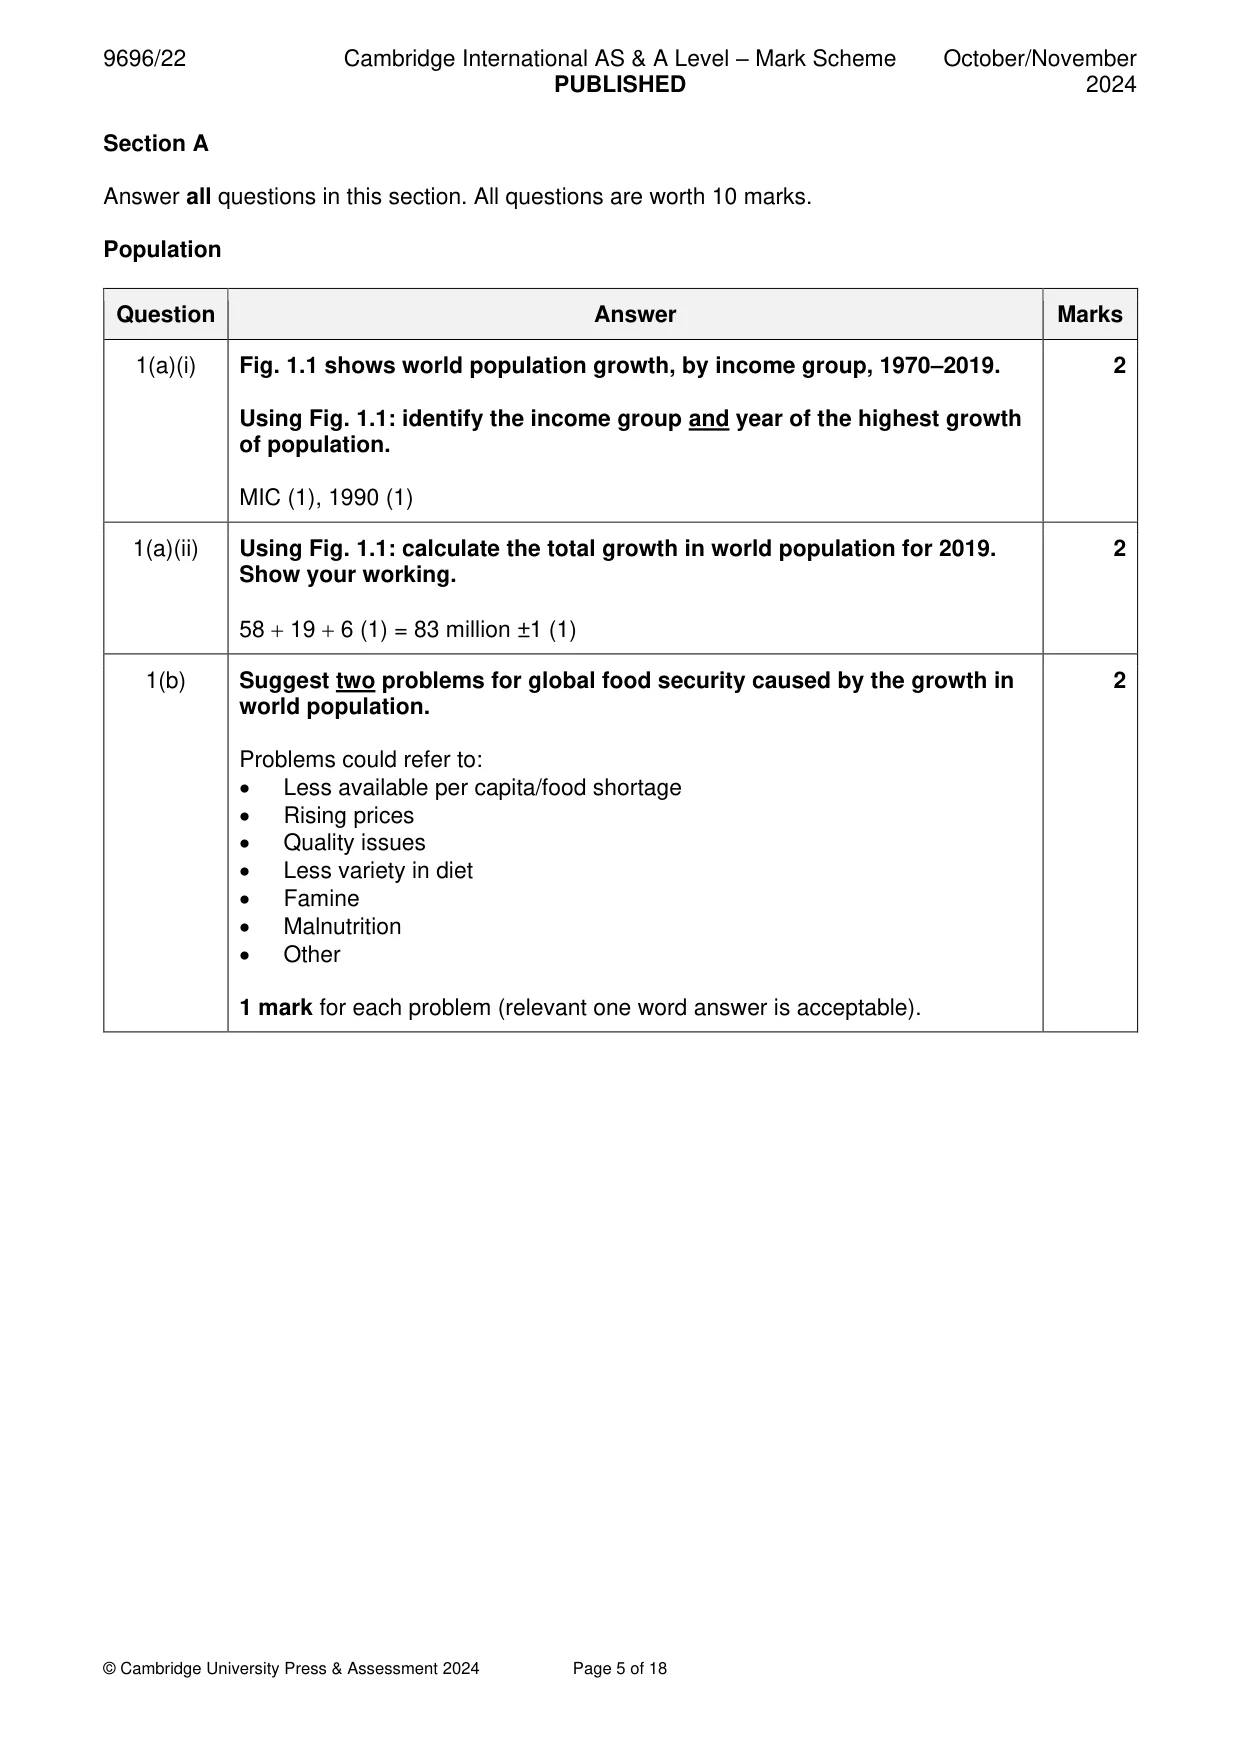
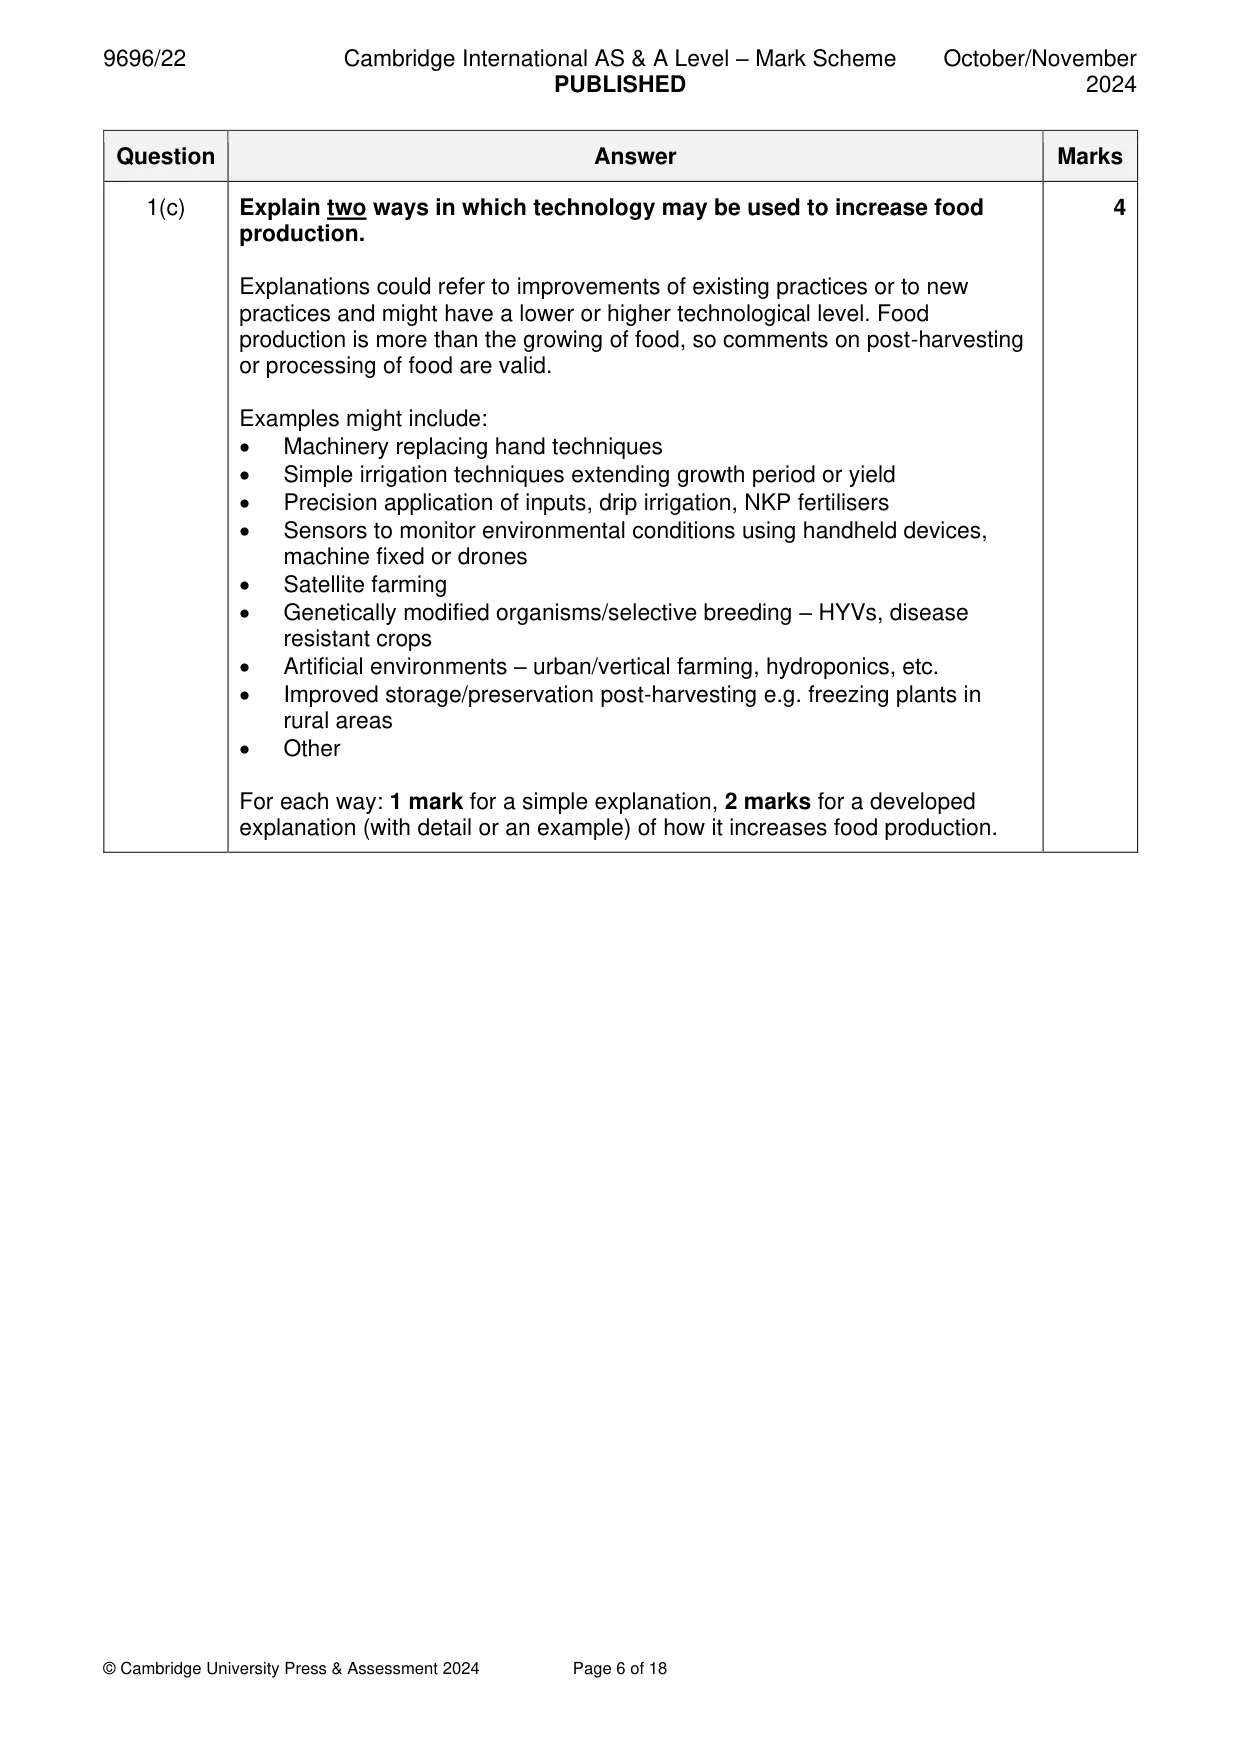
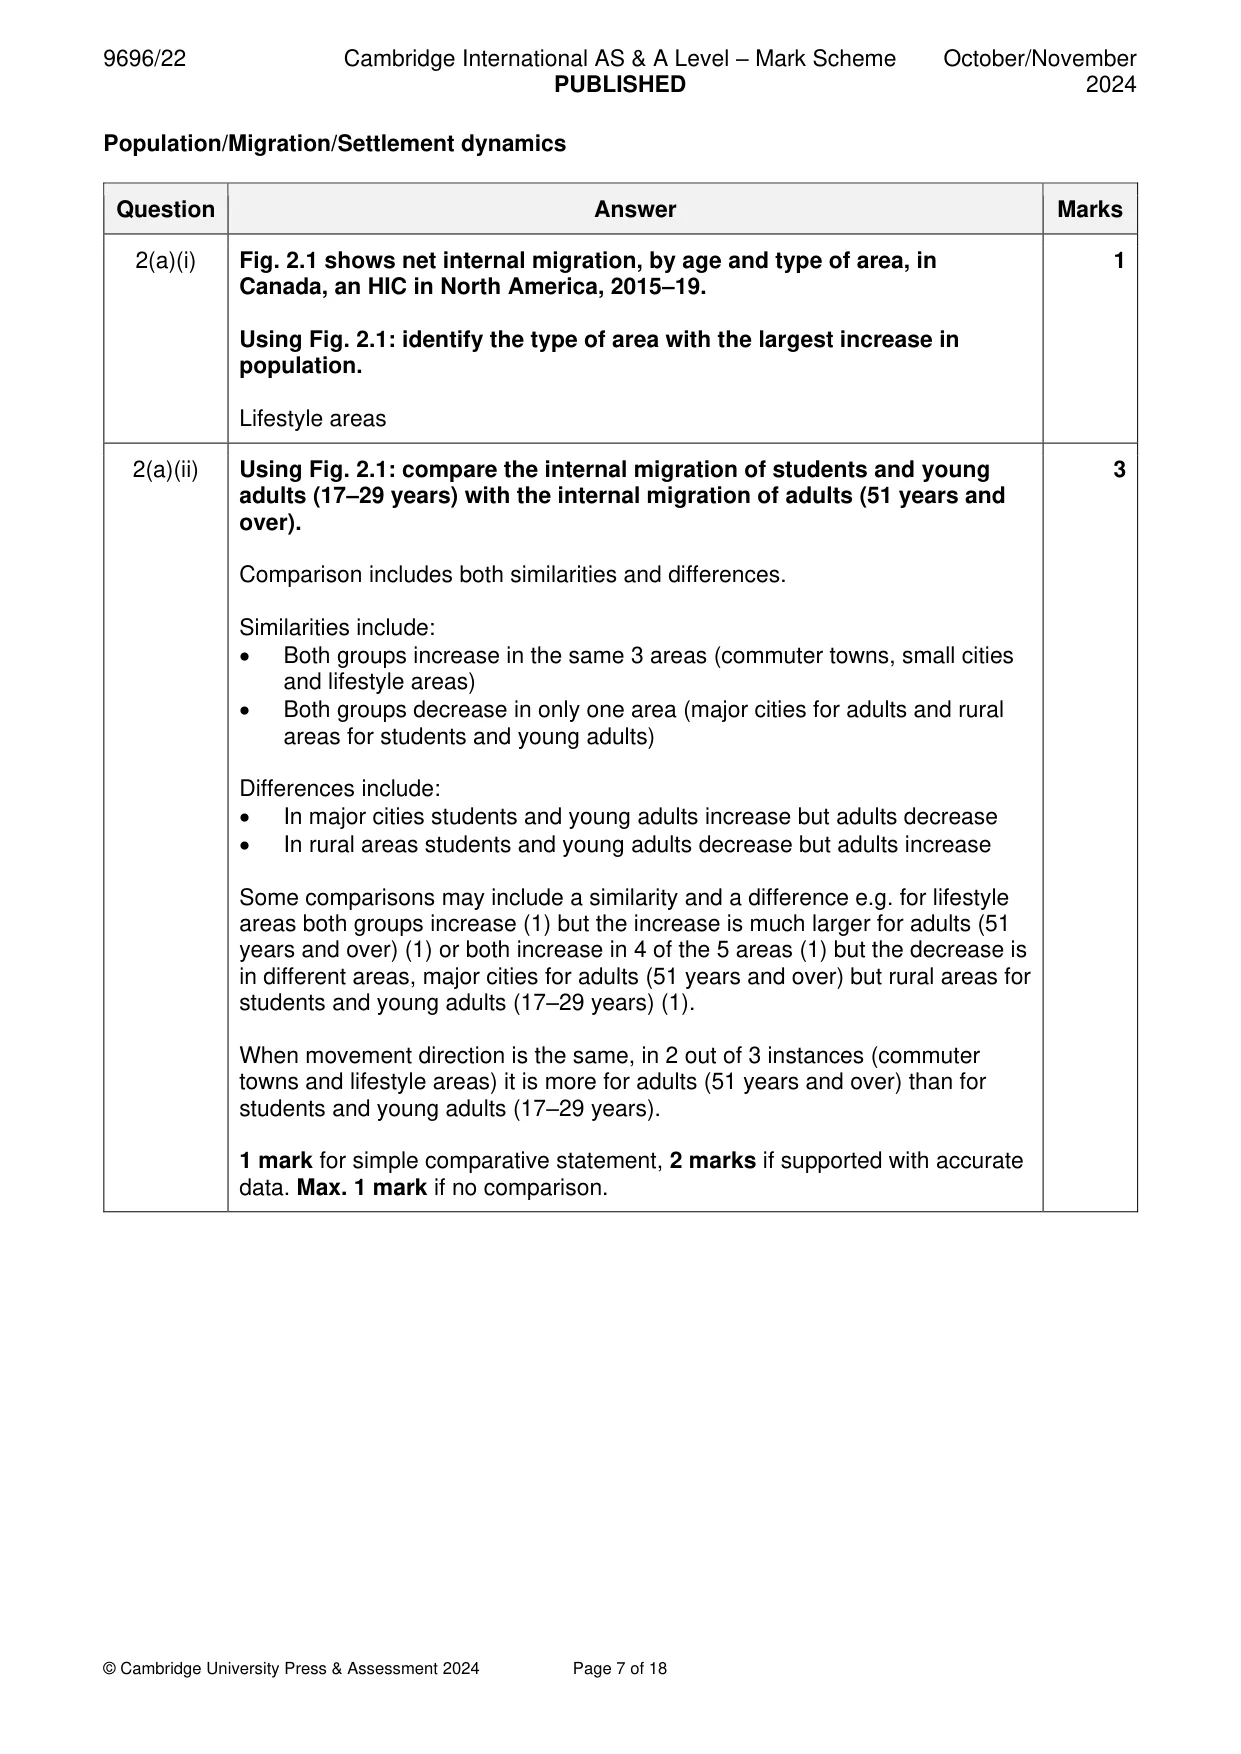
Mark scheme: Question Answer Marks 1(a)(i) Fig. 1.1 shows world population growth, by income group, 1970–2019. 2 Using Fig. 1.1: identify the income group and year of the highest growth of population. MIC (1), 1990 (1) 1(a)(ii) Using Fig. 1.1: calculate the total growth in world population for 2019. 2 Show your working. 58 + 19 + 6 (1) = 83 million ±1 (1) 1(b) Suggest two problems for global food security caused by the growth in 2 world population. Problems could refer to: • Less available per capita/food shortage • Rising prices • Quality issues • Less variety in diet • Famine • Malnutrition • Other 1 mark for each problem (relevant one word answer is acceptable). 1(c) Explain two ways in which technology may be used to increase food 4 production. Explanations could refer to improvements of existing practices or to new practices and might have a lower or higher technological level. Food production is more than the growing of food, so comments on post-harvesting or processing of food are valid. Examples might include: • Machinery replacing hand techniques • Simple irrigation techniques extending growth period or yield • Precision application of inputs, drip irrigation, NKP fertilisers • Sensors to monitor environmental conditions using handheld devices, machine fixed or drones • Satellite farming • Genetically modified organisms/selective breeding – HYVs, disease resistant crops • Artificial environments – urban/vertical farming, hydroponics, etc. • Improved storage/preservation post-harvesting e.g. freezing plants in rural areas • Other For each way: 1 mark for a simple explanation, 2 marks for a developed explanation (with detail or an example) of how it increases food production. Population/Migration/Settlement dynamics
Q2 · Net internal migration, by age and type of area, in Canada, an HIC in North America…
2 Fig. 2.1 shows net internal migration, by age and type of area, in Canada, an HIC in North America, 2015–19. (a) Using Fig. 2.1: (i) identify the type of area with the largest increase in population [1] (ii) compare the internal migration of students and young adults (17–29 years) with the internal migration of adults (51 years and over). [3] (b) Suggest two push factors which cause families to migrate out of large urban areas. [2] (c) Explain two impacts of rural depopulation in LICs/MICs. [4] Settlement dynamics
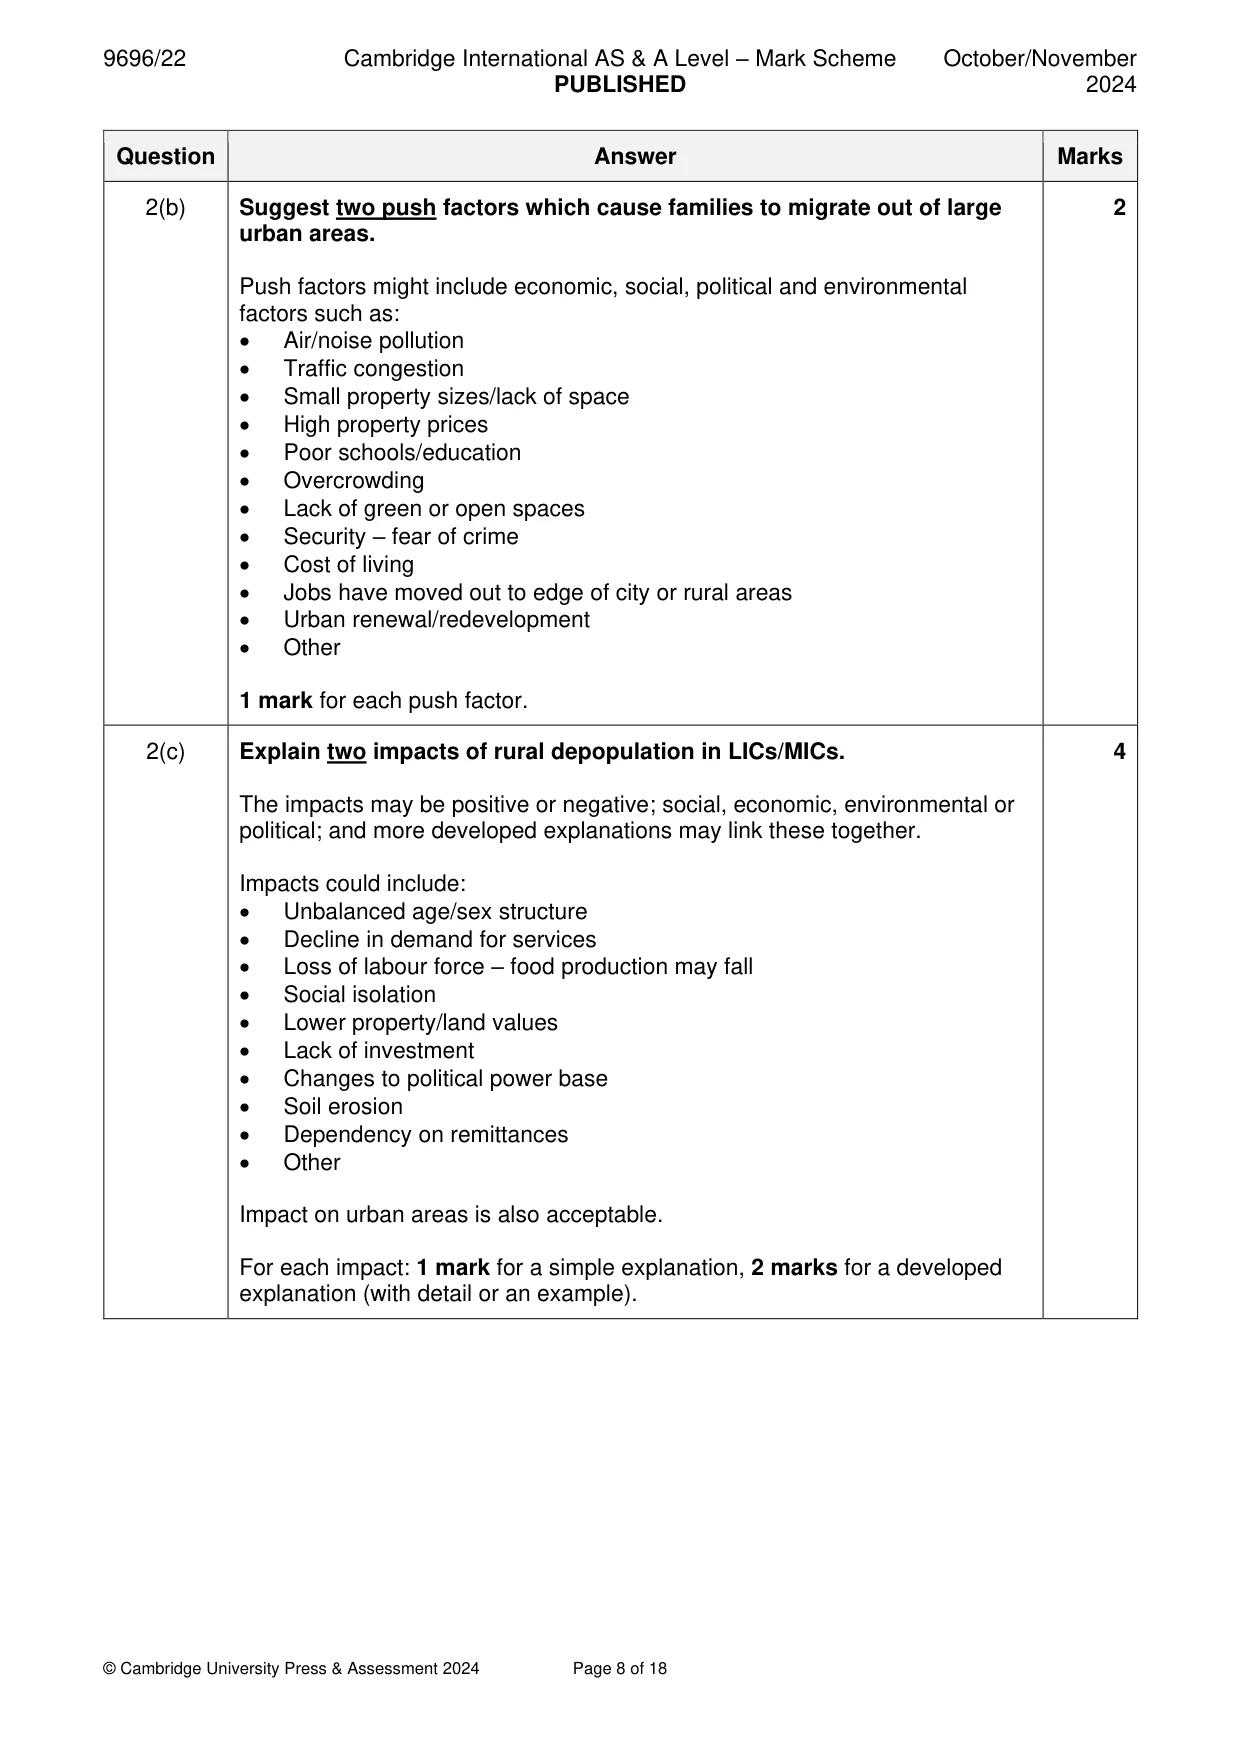
Mark scheme: 2(a)(i) Fig. 2.1 shows net internal migration, by age and type of area, in 1 Canada, an HIC in North America, 2015–19. Using Fig. 2.1: identify the type of area with the largest increase in population. Lifestyle areas 2(a)(ii) Using Fig. 2.1: compare the internal migration of students and young 3 adults (17–29 years) with the internal migration of adults (51 years and over). Comparison includes both similarities and differences. Similarities include: • Both groups increase in the same 3 areas (commuter towns, small cities and lifestyle areas) • Both groups decrease in only one area (major cities for adults and rural areas for students and young adults) Differences include: • In major cities students and young adults increase but adults decrease • In rural areas students and young adults decrease but adults increase Some comparisons may include a similarity and a difference e.g. for lifestyle areas both groups increase (1) but the increase is much larger for adults (51 years and over) (1) or both increase in 4 of the 5 areas (1) but the decrease is in different areas, major cities for adults (51 years and over) but rural areas for students and young adults (17–29 years) (1). When movement direction is the same, in 2 out of 3 instances (commuter towns and lifestyle areas) it is more for adults (51 years and over) than for students and young adults (17–29 years). 1 mark for simple comparative statement, 2 marks if supported with accurate data. Max. 1 mark if no comparison. 2(b) Suggest two push factors which cause families to migrate out of large 2 urban areas. Push factors might include economic, social, political and environmental factors such as: • Air/noise pollution • Traffic congestion • Small property sizes/lack of space • High property prices • Poor schools/education • Overcrowding • Lack of green or open spaces • Security – fear of crime • Cost of living • Jobs have moved out to edge of city or rural areas • Urban renewal/redevelopment • Other 1 mark for each push factor. 2(c) Explain two impacts of rural depopulation in LICs/MICs. 4 The impacts may be positive or negative; social, economic, environmental or political; and more developed explanations may link these together. Impacts could include: • Unbalanced age/sex structure • Decline in demand for services • Loss of labour force – food production may fall • Social isolation • Lower property/land values • Lack of investment • Changes to political power base • Soil erosion • Dependency on remittances • Other Impact on urban areas is also acceptable. For each impact: 1 mark for a simple explanation, 2 marks for a developed explanation (with detail or an example). Settlement dynamics
Q3 · Zoning restrictions on building height in the central area of Cape Town, South Africa, an…
3 Fig. 3.1 shows zoning restrictions on building height in the central area of Cape Town, South Africa, an MIC in Africa, 2013. (a) Describe the pattern of zoning restrictions shown in Fig. 3.1. [4] (b) Suggest two reasons why planners may limit the height of buildings. [2] (c) Explain why tall buildings are a typical feature of central business districts (CBDs). [4]
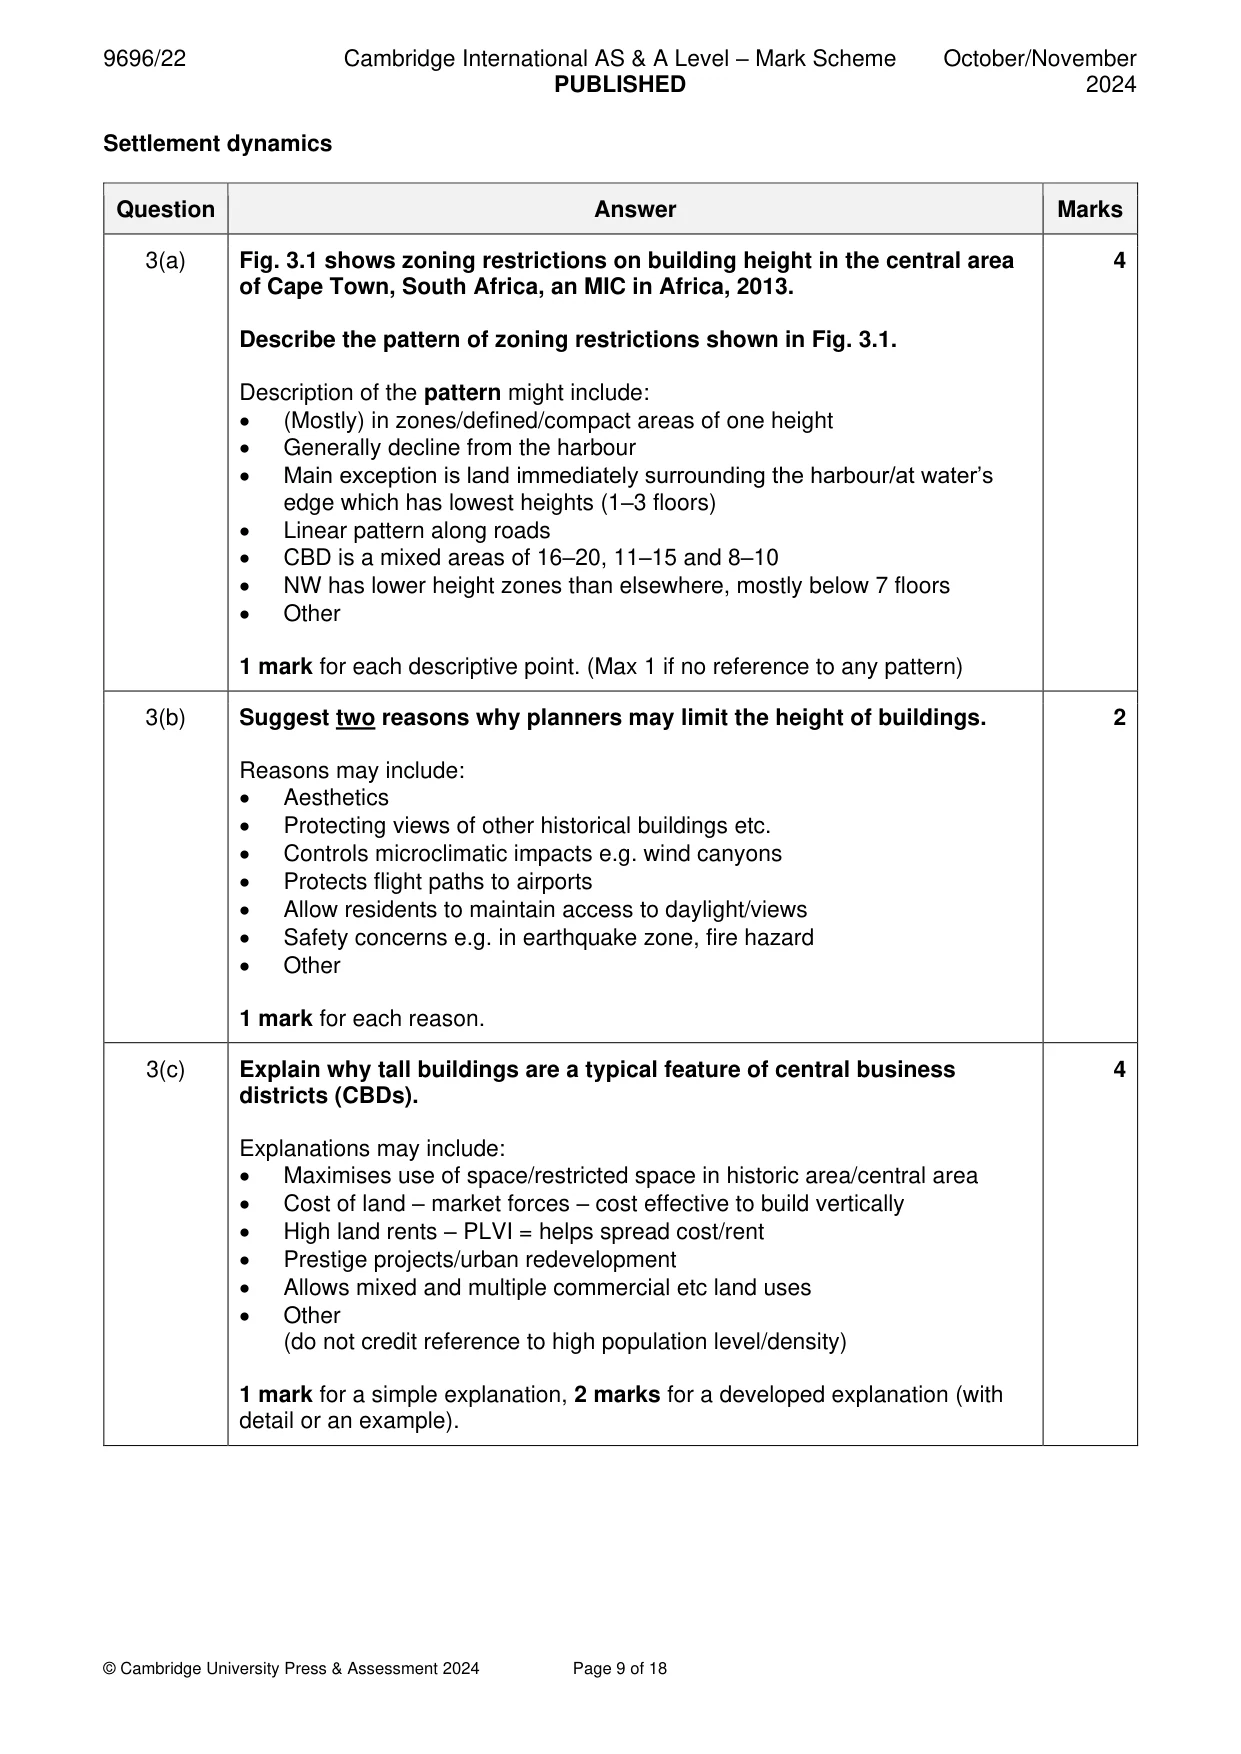
Mark scheme: 3(a) Fig. 3.1 shows zoning restrictions on building height in the central area 4 of Cape Town, South Africa, an MIC in Africa, 2013. Describe the pattern of zoning restrictions shown in Fig. 3.1. Description of the pattern might include: • (Mostly) in zones/defined/compact areas of one height • Generally decline from the harbour • Main exception is land immediately surrounding the harbour/at water’s edge which has lowest heights (1–3 floors) • Linear pattern along roads • CBD is a mixed areas of 16–20, 11–15 and 8–10 • NW has lower height zones than elsewhere, mostly below 7 floors • Other 1 mark for each descriptive point. (Max 1 if no reference to any pattern) 3(b) Suggest two reasons why planners may limit the height of buildings. 2 Reasons may include: • Aesthetics • Protecting views of other historical buildings etc. • Controls microclimatic impacts e.g. wind canyons • Protects flight paths to airports • Allow residents to maintain access to daylight/views • Safety concerns e.g. in earthquake zone, fire hazard • Other 1 mark for each reason. 3(c) Explain why tall buildings are a typical feature of central business 4 districts (CBDs). Explanations may include: • Maximises use of space/restricted space in historic area/central area • Cost of land – market forces – cost effective to build vertically • High land rents – PLVI = helps spread cost/rent • Prestige projects/urban redevelopment • Allows mixed and multiple commercial etc land uses • Other (do not credit reference to high population level/density) 1 mark for a simple explanation, 2 marks for a developed explanation (with detail or an example). Section B Answer one question from this section. All questions are worth 30 marks. Population
Q4 · Compare the economic issues of a youthful population with those of an ageing population
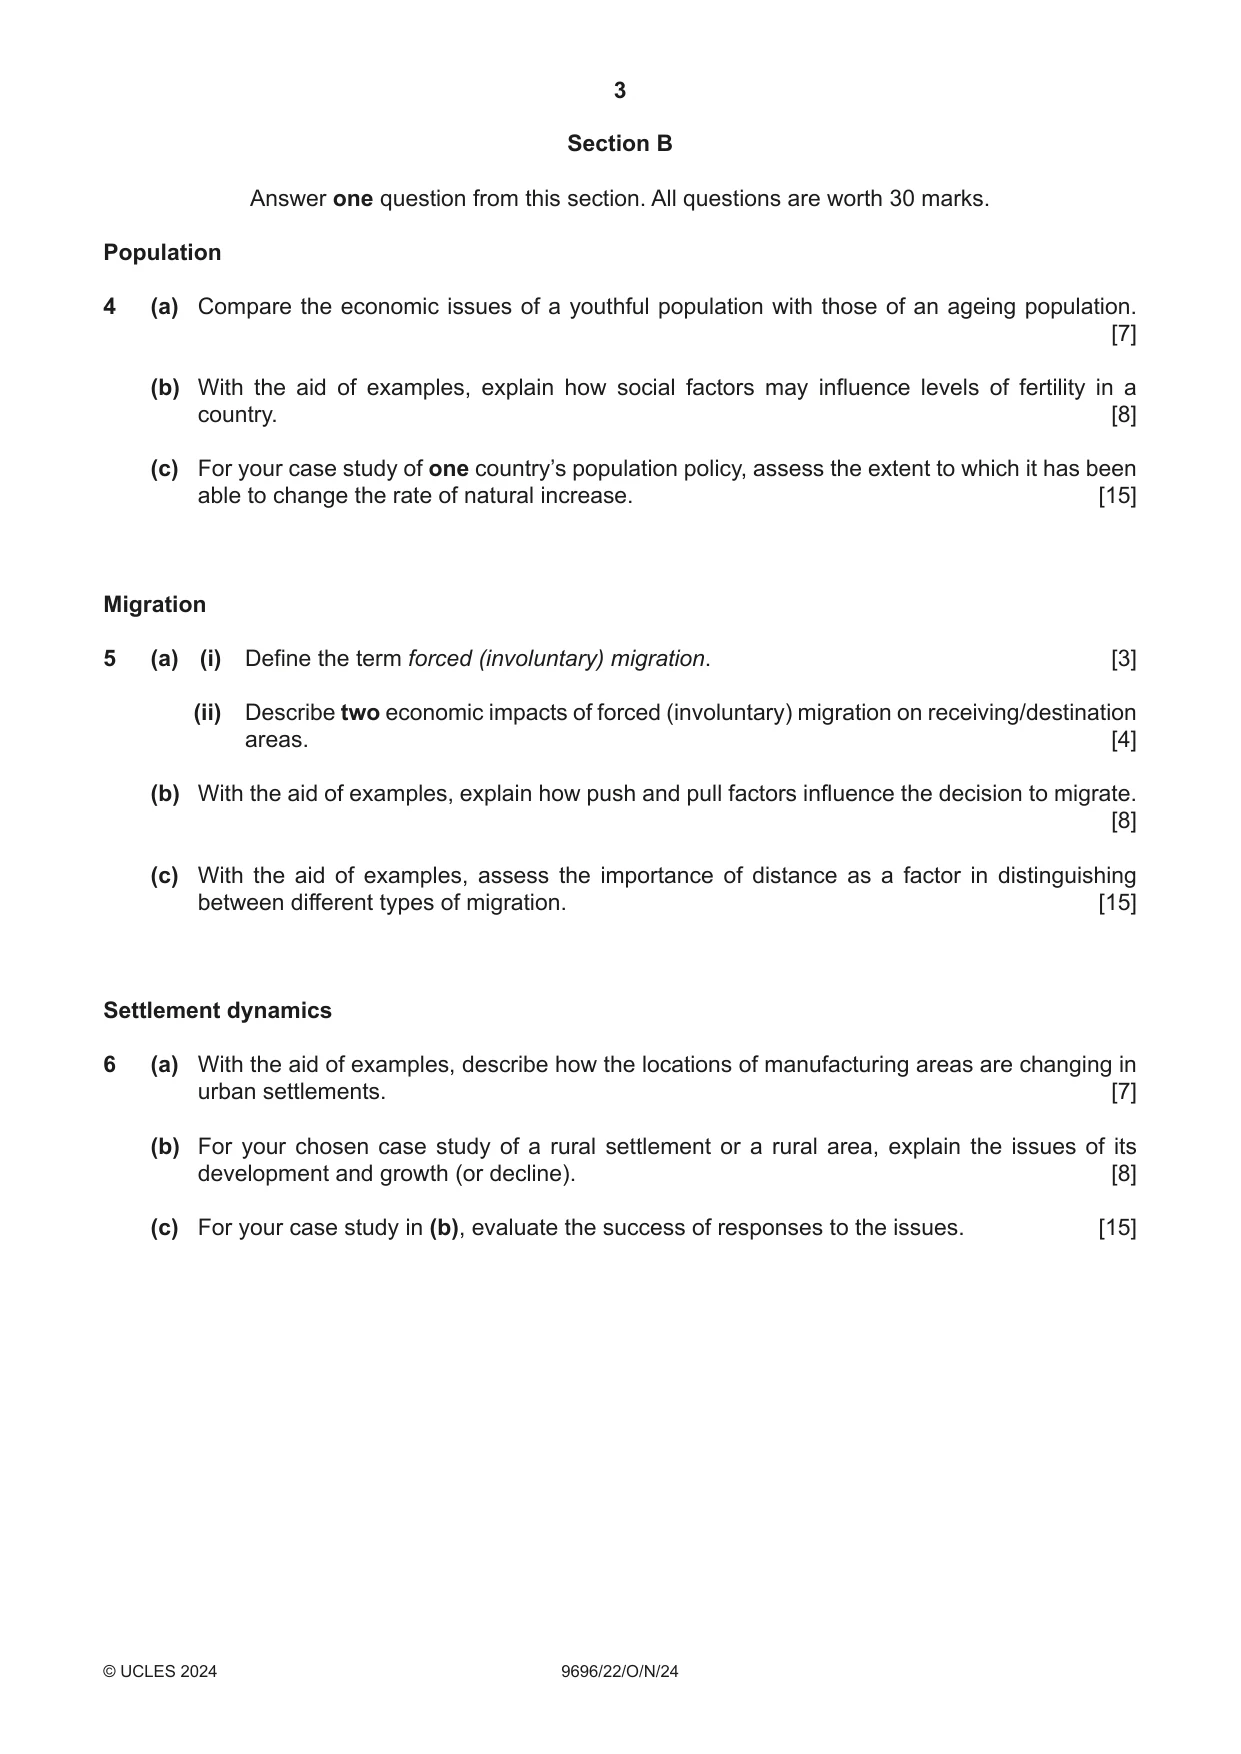
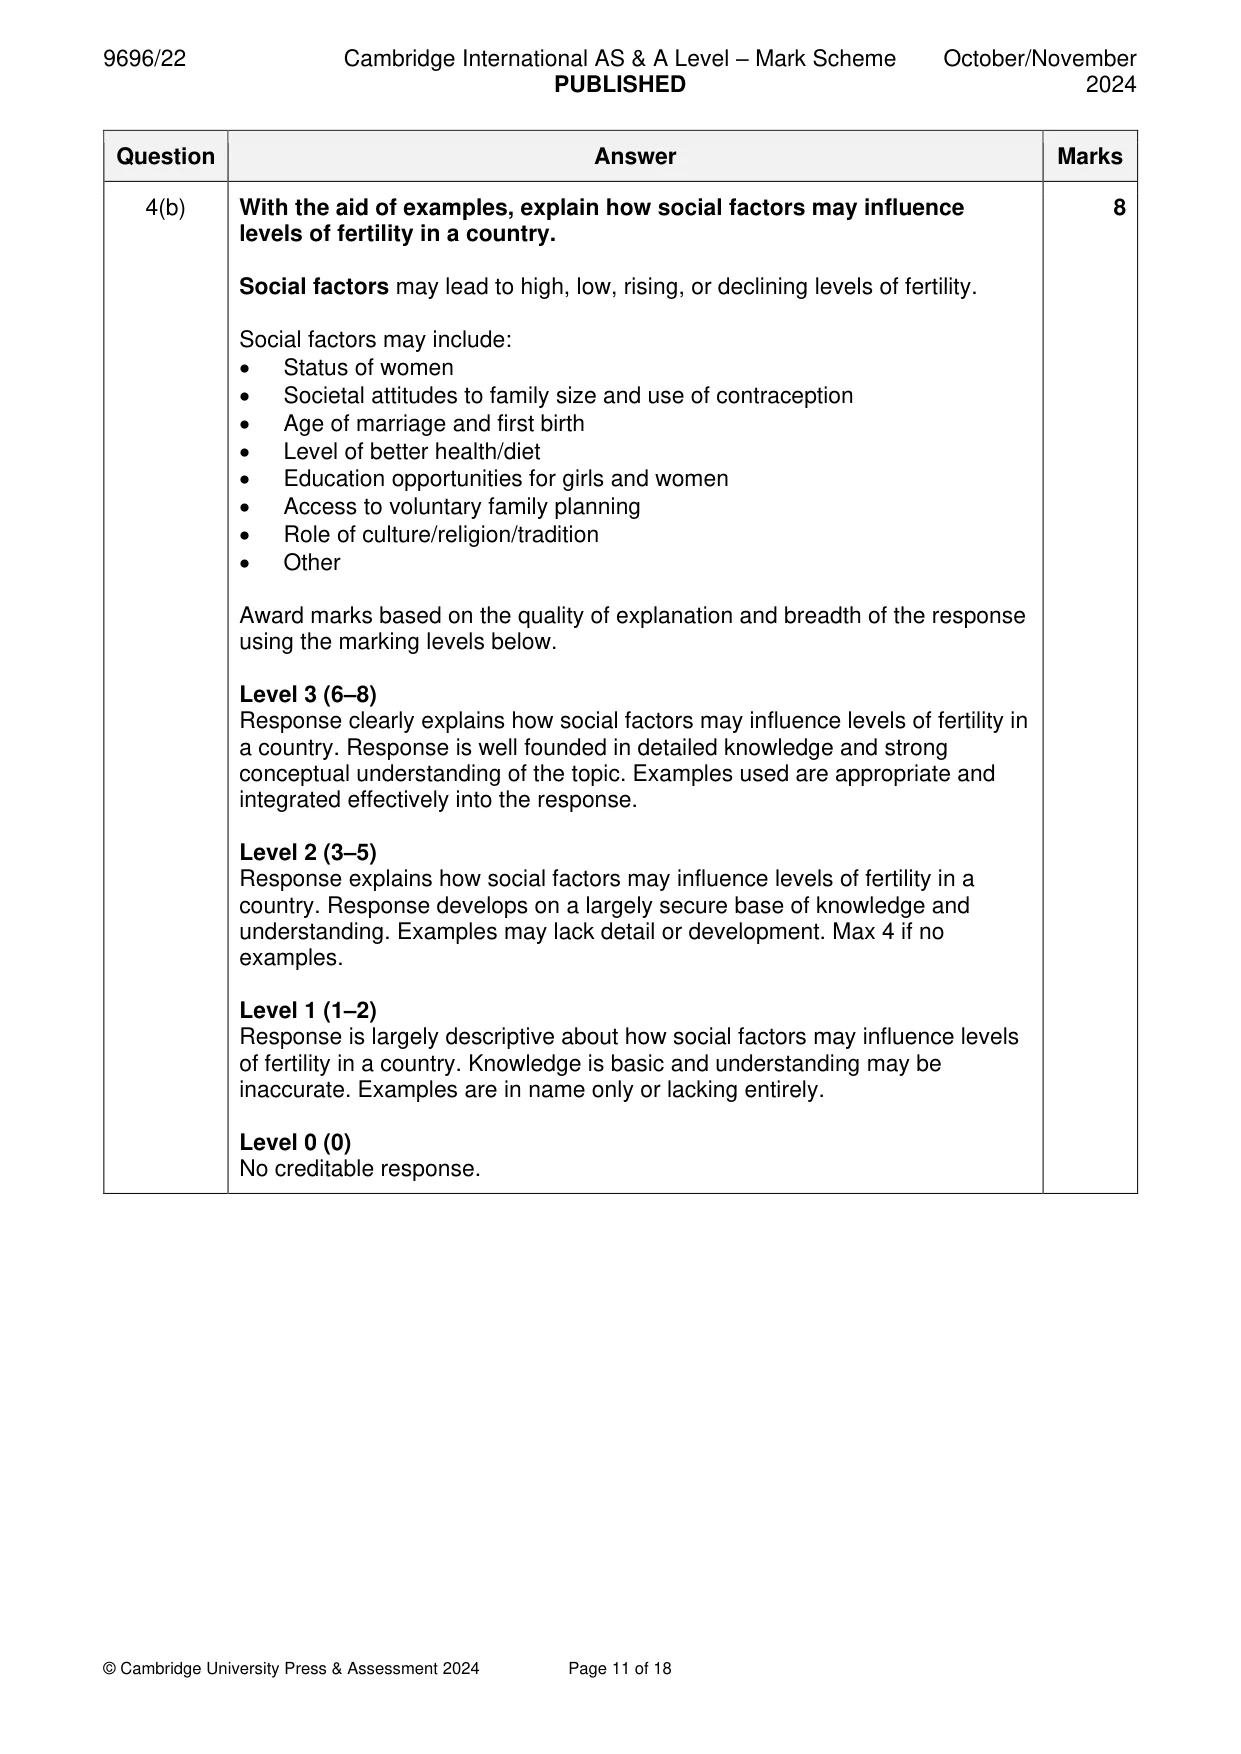
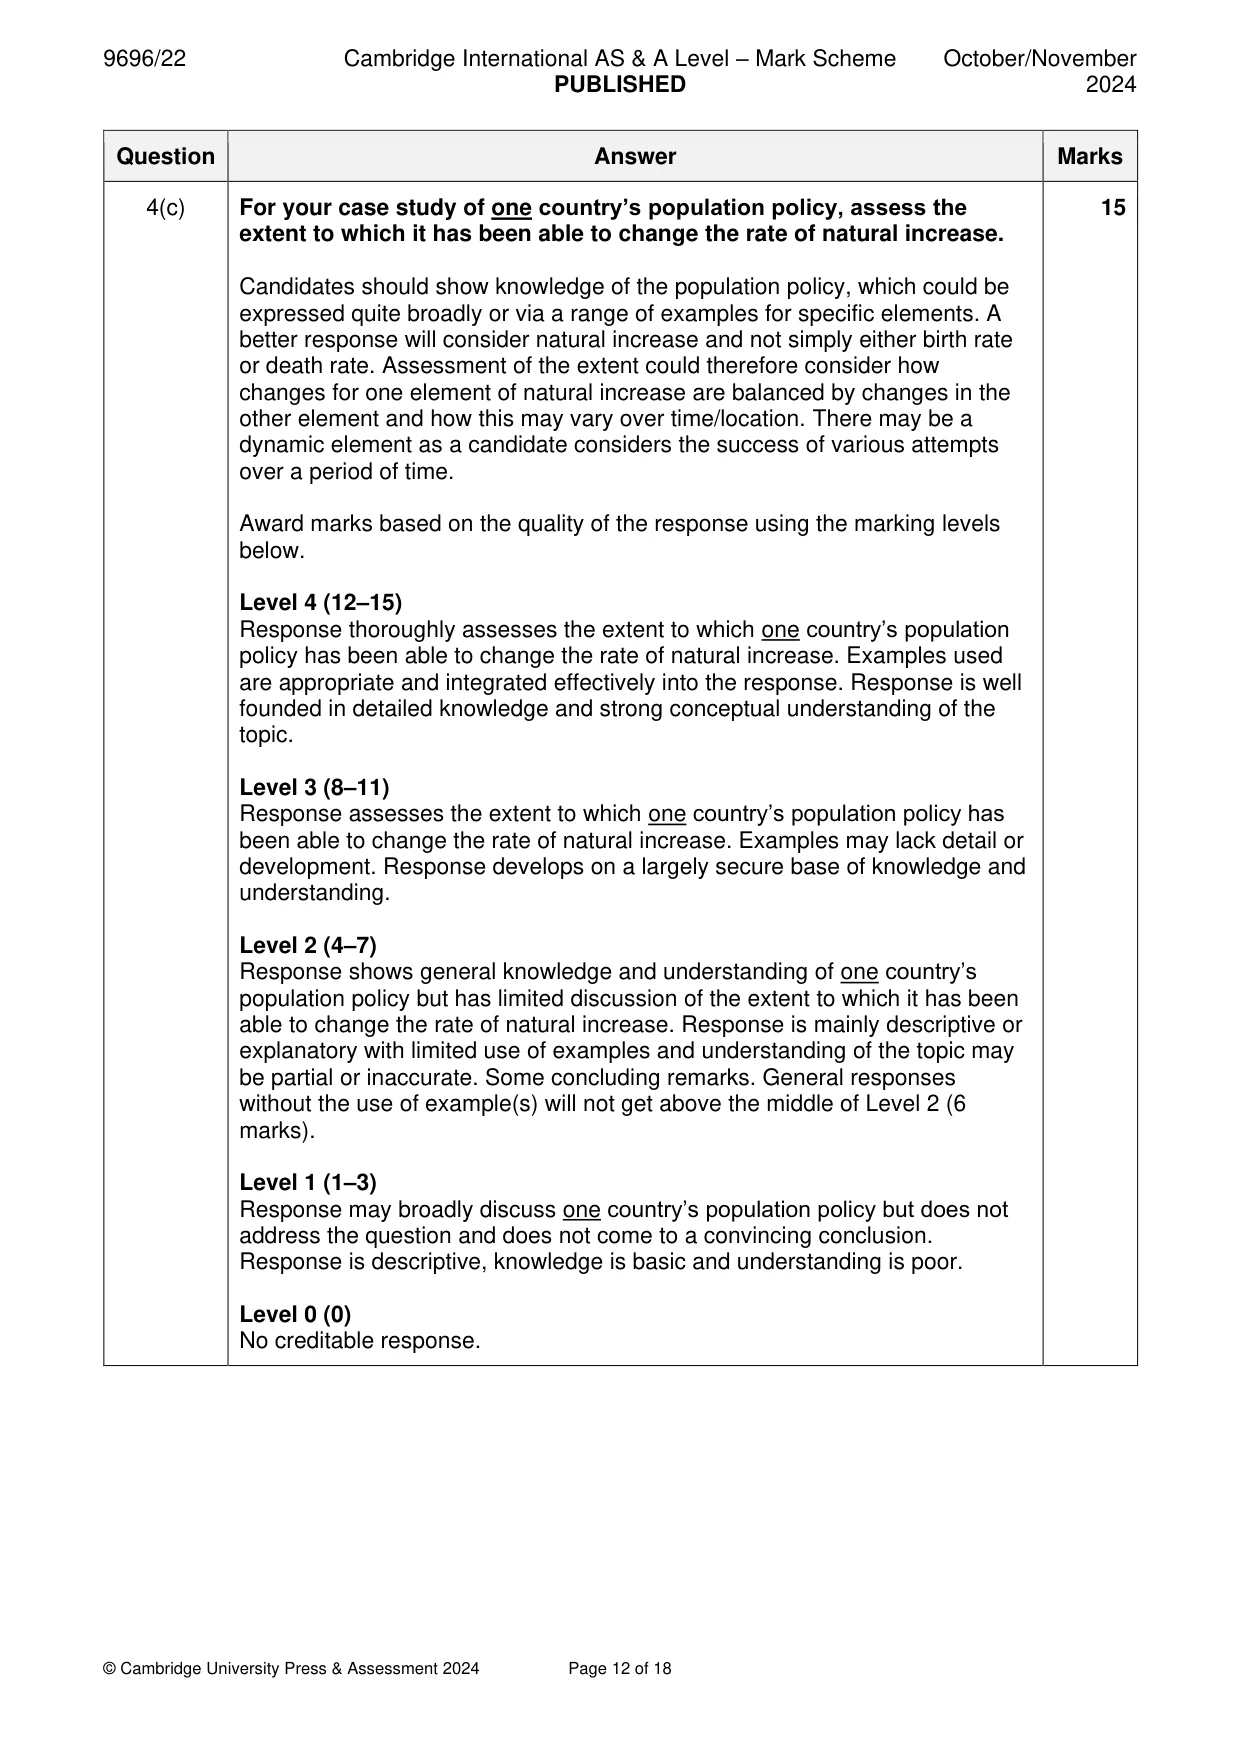
4 (a) Compare the economic issues of a youthful population with those of an ageing population. [7] (b) With the aid of examples, explain how social factors may influence levels of fertility in a country. [8] (c) For your case study of one country’s population policy, assess the extent to which it has been able to change the rate of natural increase. [15] Migration
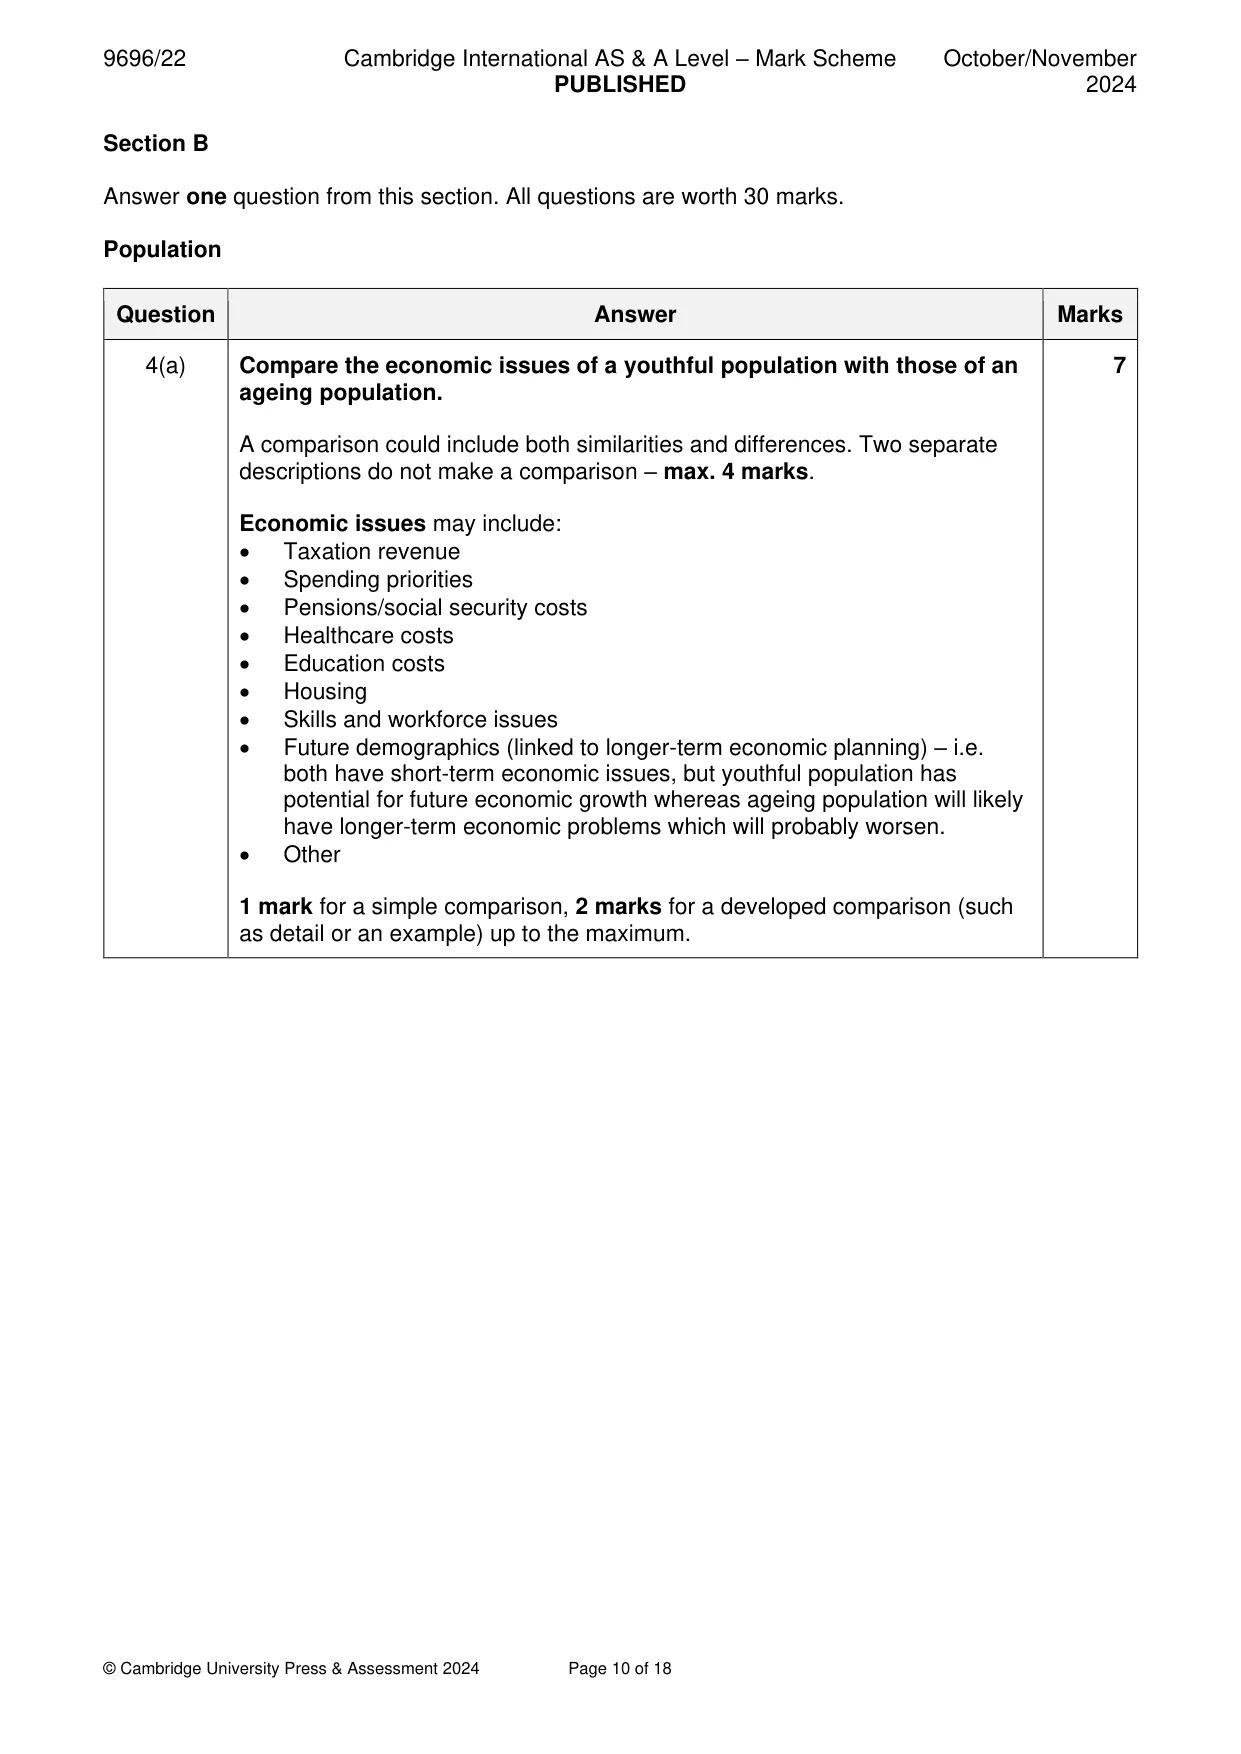
Mark scheme: 4(a) Compare the economic issues of a youthful population with those of an 7 ageing population. A comparison could include both similarities and differences. Two separate descriptions do not make a comparison – max. 4 marks. Economic issues may include: • Taxation revenue • Spending priorities • Pensions/social security costs • Healthcare costs • Education costs • Housing • Skills and workforce issues • Future demographics (linked to longer-term economic planning) – i.e. both have short-term economic issues, but youthful population has potential for future economic growth whereas ageing population will likely have longer-term economic problems which will probably worsen. • Other 1 mark for a simple comparison, 2 marks for a developed comparison (such as detail or an example) up to the maximum. 4(b) With the aid of examples, explain how social factors may influence 8 levels of fertility in a country. Social factors may lead to high, low, rising, or declining levels of fertility. Social factors may include: • Status of women • Societal attitudes to family size and use of contraception • Age of marriage and first birth • Level of better health/diet • Education opportunities for girls and women • Access to voluntary family planning • Role of culture/religion/tradition • Other Award marks based on the quality of explanation and breadth of the response using the marking levels below. Level 3 (6–8) Response clearly explains how social factors may influence levels of fertility in a country. Response is well founded in detailed knowledge and strong conceptual understanding of the topic. Examples used are appropriate and integrated effectively into the response. Level 2 (3–5) Response explains how social factors may influence levels of fertility in a country. Response develops on a largely secure base of knowledge and understanding. Examples may lack detail or development. Max 4 if no examples. Level 1 (1–2) Response is largely descriptive about how social factors may influence levels of fertility in a country. Knowledge is basic and understanding may be inaccurate. Examples are in name only or lacking entirely. Level 0 (0) No creditable response. 4(c) For your case study of one country’s population policy, assess the 15 extent to which it has been able to change the rate of natural increase. Candidates should show knowledge of the population policy, which could be expressed quite broadly or via a range of examples for specific elements. A better response will consider natural increase and not simply either birth rate or death rate. Assessment of the extent could therefore consider how changes for one element of natural increase are balanced by changes in the other element and how this may vary over time/location. There may be a dynamic element as a candidate considers the success of various attempts over a period of time. Award marks based on the quality of the response using the marking levels below. Level 4 (12–15) Response thoroughly assesses the extent to which one country’s population policy has been able to change the rate of natural increase. Examples used are appropriate and integrated effectively into the response. Response is well founded in detailed knowledge and strong conceptual understanding of the topic. Level 3 (8–11) Response assesses the extent to which one country’s population policy has been able to change the rate of natural increase. Examples may lack detail or development. Response develops on a largely secure base of knowledge and understanding. Level 2 (4–7) Response shows general knowledge and understanding of one country’s population policy but has limited discussion of the extent to which it has been able to change the rate of natural increase. Response is mainly descriptive or explanatory with limited use of examples and understanding of the topic may be partial or inaccurate. Some concluding remarks. General responses without the use of example(s) will not get above the middle of Level 2 (6 marks). Level 1 (1–3) Response may broadly discuss one country’s population policy but does not address the question and does not come to a convincing conclusion. Response is descriptive, knowledge is basic and understanding is poor. Level 0 (0) No creditable response. Migration
Q5 · Define the term forced (involuntary) migration
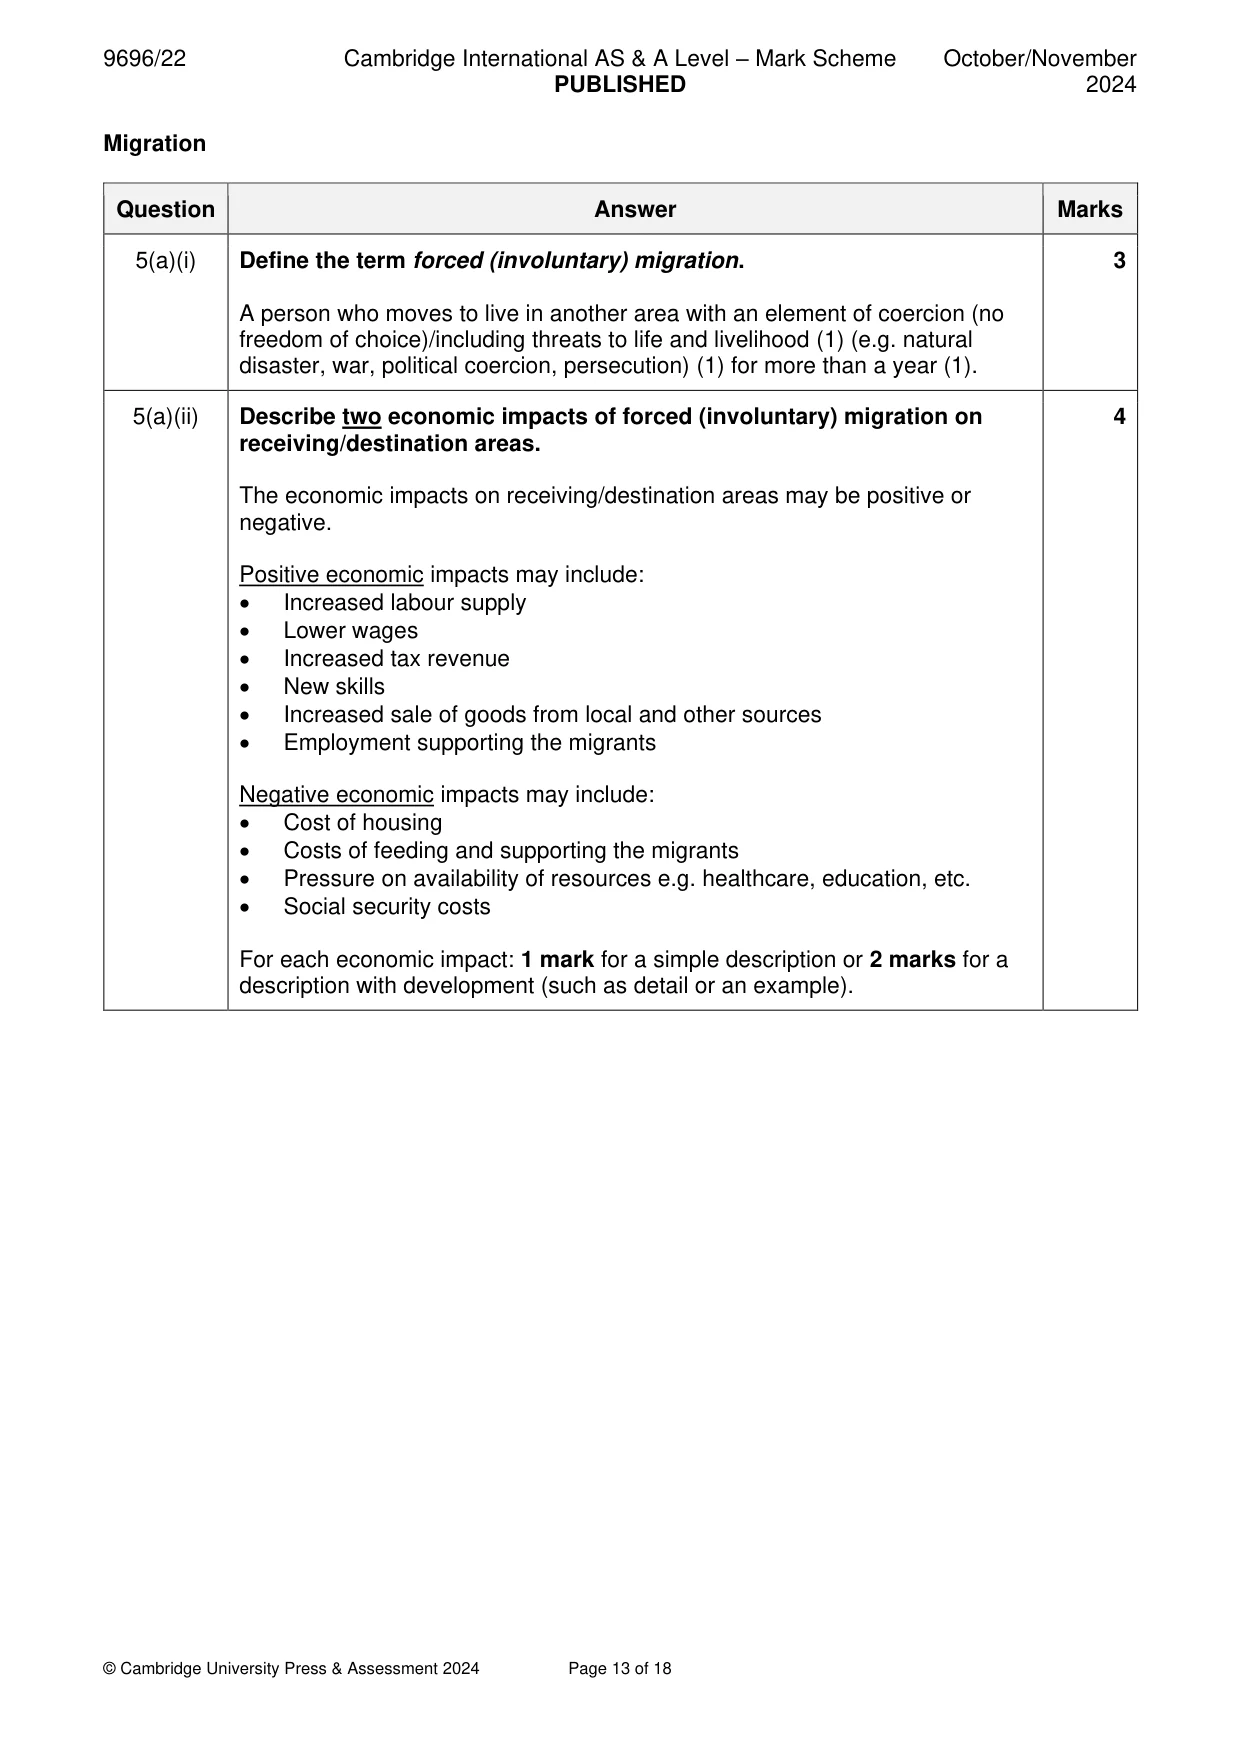
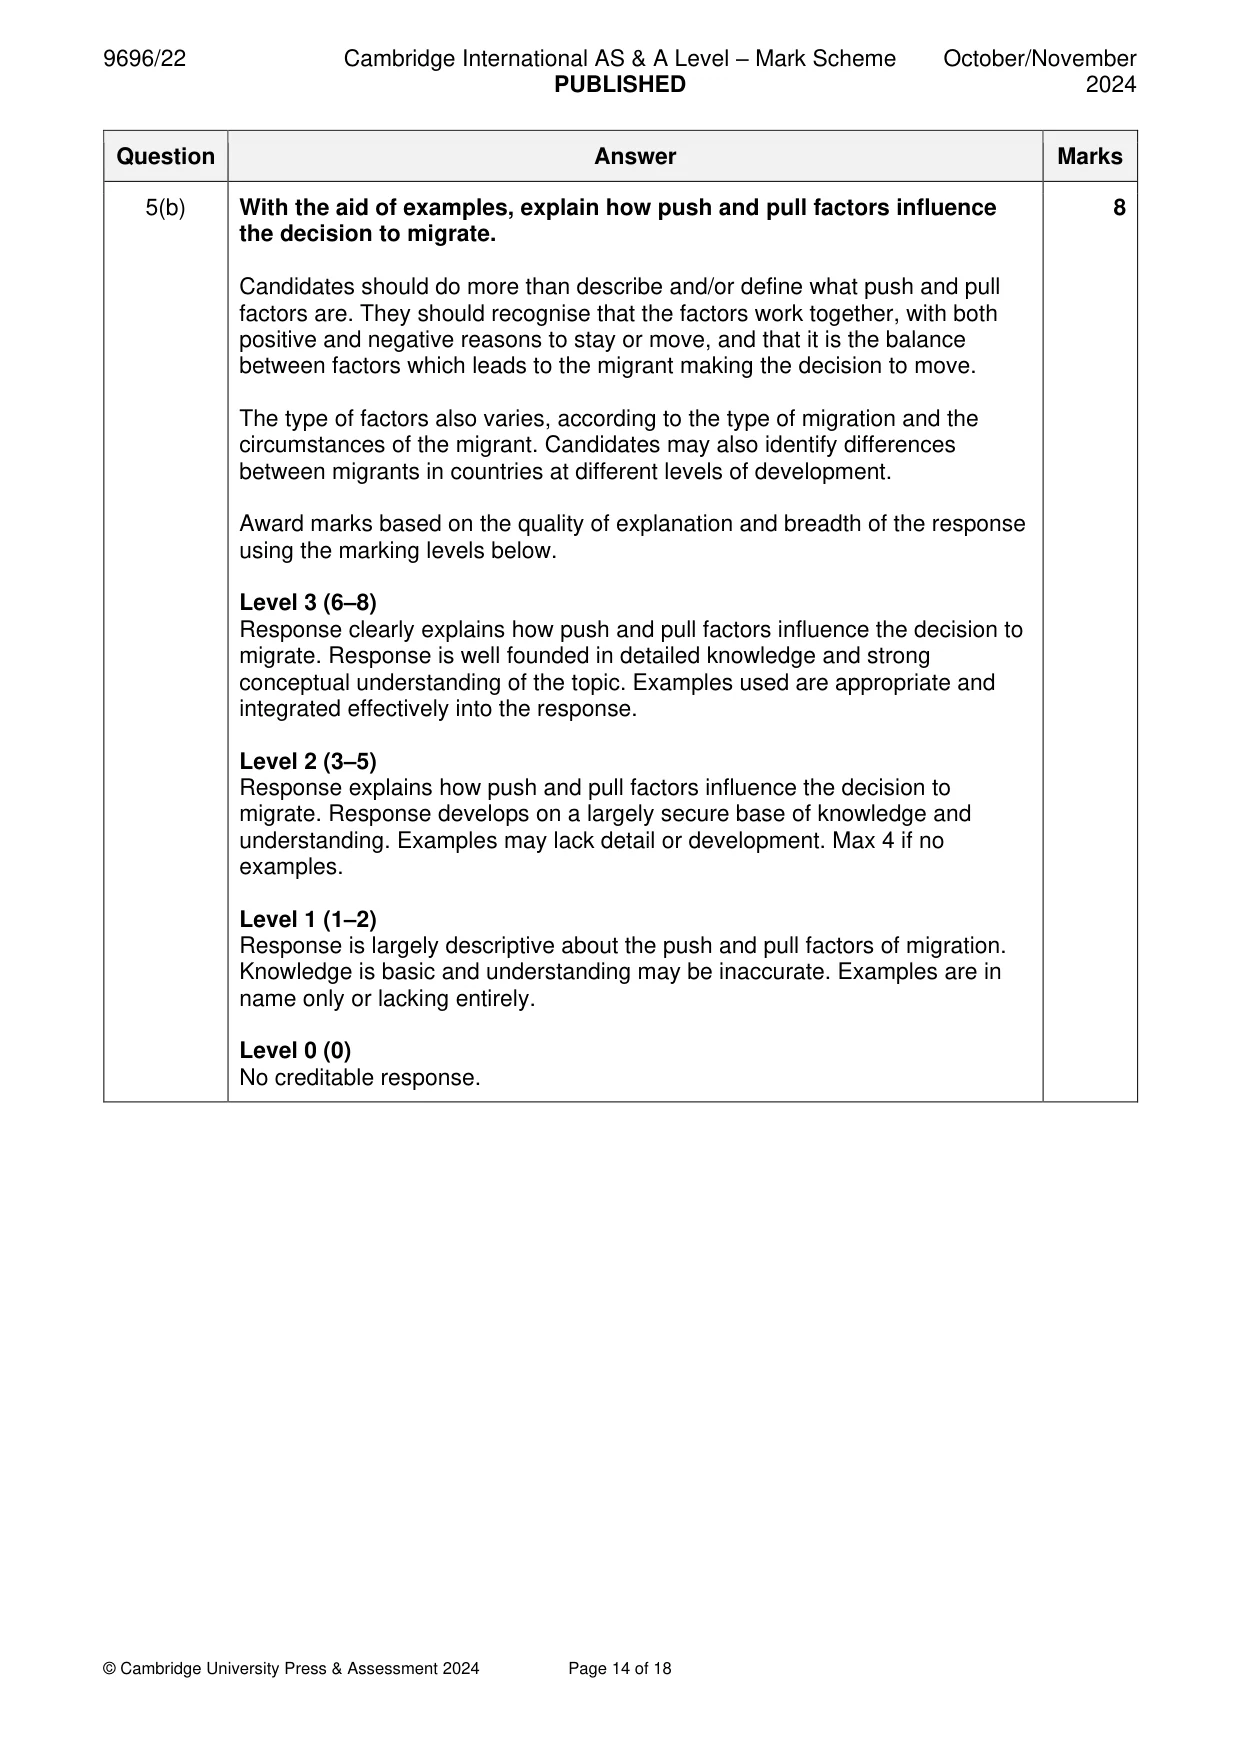
5 (a) (i) Define the term forced (involuntary) migration. [3] (ii) Describe two economic impacts of forced (involuntary) migration on receiving/destination areas. [4] (b) With the aid of examples, explain how push and pull factors influence the decision to migrate. [8] (c) With the aid of examples, assess the importance of distance as a factor in distinguishing between different types of migration. [15] Settlement dynamics
Mark scheme: 5(a)(i) Define the term forced (involuntary) migration. 3 A person who moves to live in another area with an element of coercion (no freedom of choice)/including threats to life and livelihood (1) (e.g. natural disaster, war, political coercion, persecution) (1) for more than a year (1). 5(a)(ii) Describe two economic impacts of forced (involuntary) migration on 4 receiving/destination areas. The economic impacts on receiving/destination areas may be positive or negative. Positive economic impacts may include: • Increased labour supply • Lower wages • Increased tax revenue • New skills • Increased sale of goods from local and other sources • Employment supporting the migrants Negative economic impacts may include: • Cost of housing • Costs of feeding and supporting the migrants • Pressure on availability of resources e.g. healthcare, education, etc. • Social security costs For each economic impact: 1 mark for a simple description or 2 marks for a description with development (such as detail or an example). 5(b) With the aid of examples, explain how push and pull factors influence 8 the decision to migrate. Candidates should do more than describe and/or define what push and pull factors are. They should recognise that the factors work together, with both positive and negative reasons to stay or move, and that it is the balance between factors which leads to the migrant making the decision to move. The type of factors also varies, according to the type of migration and the circumstances of the migrant. Candidates may also identify differences between migrants in countries at different levels of development. Award marks based on the quality of explanation and breadth of the response using the marking levels below. Level 3 (6–8) Response clearly explains how push and pull factors influence the decision to migrate. Response is well founded in detailed knowledge and strong conceptual understanding of the topic. Examples used are appropriate and integrated effectively into the response. Level 2 (3–5) Response explains how push and pull factors influence the decision to migrate. Response develops on a largely secure base of knowledge and understanding. Examples may lack detail or development. Max 4 if no examples. Level 1 (1–2) Response is largely descriptive about the push and pull factors of migration. Knowledge is basic and understanding may be inaccurate. Examples are in name only or lacking entirely. Level 0 (0) No creditable response. 5(c) With the aid of examples, assess the importance of distance as a factor 15 in distinguishing between different types of migration. Candidates might consider a range of types of migration both internal and international, voluntary and involuntary, and might use their case study of one international migration stream and/or a variety of examples. The evaluation should consider examples of where distance is or is not a factor in the types of migration discussed. They may approach the question from either end – developing a theme about distance or different types of migration. Distance could be viewed as a factor in all types of migration, whilst the discussion should consider what makes distance important as a constraint and/or how migrants in different types of migration may choose or be able to overcome distance. Candidates may suggest other factors are more important such as cost, availability of transport, political barriers/constraints etc. Award marks based on the quality of the response using the marking levels below. Level 4 (12–15) Response thoroughly assesses the importance of distance as a factor in distinguishing between different types of migration. Examples used are appropriate and integrated effectively into the response. Response is well founded in detailed knowledge and strong conceptual understanding of the topic. Level 3 (8–11) Response assesses the importance of distance as a factor in distinguishing between different types of migration. Examples may lack detail or development. Response develops on a largely secure base of knowledge and understanding. Level 2 (4–7) Response shows general knowledge and understanding of the importance of distance as a factor in distinguishing between different types of migration. Response is mainly descriptive or explanatory with limited use of examples and understanding of the topic may be partial or inaccurate. Some concluding remarks. General responses without the use of example(s) will not get above the middle of Level 2 (6 marks). Level 1 (1–3) Response may broadly discuss distance as a factor in distinguishing between different types of migration but does not address the question and does not come to a convincing conclusion. Response is descriptive, knowledge is basic and understanding is poor. Level 0 (0) No creditable response. Settlement dynamics
Q6 · With the aid of examples, describe how the locations of manufacturing areas are changing…
6 (a) With the aid of examples, describe how the locations of manufacturing areas are changing in urban settlements. [7] (b) For your chosen case study of a rural settlement or a rural area, explain the issues of its development and growth (or decline). [8] (c) For your case study in (b), evaluate the success of responses to the issues. [15]
Mark scheme: 6(a) With the aid of examples, describe how the locations of manufacturing 7 areas are changing in urban settlements. The locations of manufacturing areas in urban settlements will vary according to examples used (both in HICs and MICs/LICs) but may include: • Closure of certain locations such as inner-city areas, docklands no longer in use • Opening of new locations such as industrial estates on the edge of urban areas or on converted brownfield sites • Expansion of existing sites of established companies or through new arrivals • Informal sector enterprises in areas of shanty towns or squatter developments • Creation of freeports/economic zones • Other 1 mark for a simple description, 2 marks for a developed description (such as detail or an example) up to the maximum. Max. 4 marks if no examples. 6(b) For your chosen case study of a rural settlement or a rural area, explain 8 the issues of its development and growth (or decline). Any issue can be considered and might be for the potential providers or possible users. Issues could be social, economic, environmental or political. Issues could include: • Cost/funding/spending priorities • Distance/accessibility/remoteness • Poor or lack of roads and other communication links or their construction • Size of market • Dis-economies of scale • Employment and income e.g. recruitment or retention of professional staff • Depopulation/demographic changes, associated social/cultural changes • Housing availability • Environmental changes e.g. global warming, drought • Political factors e.g. insecurity • Changing technology e.g. working from home • Other Award marks based on the quality of explanation and breadth of the response using the marking levels below. Level 3 (6–8) Response clearly explains the issues of a rural settlement or a rural areas development and growth (or decline). Response is well founded in detailed knowledge and strong conceptual understanding of the topic. Examples used are appropriate and integrated effectively into the response. Level 2 (3–5) Response explains the issues of a rural settlement or a rural areas development and growth (or decline). Response develops on a largely secure base of knowledge and understanding. Examples may lack detail or development. Max 4 if no examples. Level 1 (1–2) Response is largely descriptive about the issues of a rural settlement or a rural areas development and growth (or decline). Knowledge is basic and understanding may be inaccurate. Examples are in name only or lacking entirely. Level 0 (0) No creditable response. 6(c) For your case study in (b), evaluate the success of responses to the 15 issues. Candidates should consider the success or not of at least two responses to the issues explained in (b). Responses could be those of a national or local government, or NGOs/local organisations. Assessment of the success should consider how far each response has achieved its aim and/or the groups/areas affected. The assessment may also consider the challenges which remain. There may be a dynamic element as a candidate considers the success of various responses over a period of time and location/group of stakeholders. Award marks based on the quality of the response using the marking levels below. Level 4 (12–15) Response thoroughly assesses the success of responses to the issues explained in (b). Examples used are appropriate and integrated effectively into the response. Response is well founded in detailed knowledge and strong conceptual understanding of the topic. Level 3 (8–11) Response assesses the success of responses to the issues explained in (b). Examples may lack detail or development. Response develops on a largely secure base of knowledge and understanding. Level 2 (4–7) Response shows general knowledge and understanding of responses to the issues explained in (b) with limited evaluation of success. Response is mainly descriptive or explanatory with limited use of examples and understanding of the topic may be partial or inaccurate. Some concluding remarks. General responses without the use of example(s) will not get above the middle of Level 2 (6 marks). Level 1 (1–3) Response may broadly discuss some responses to the issues explained in (b) but does not address the question and does not come to a convincing conclusion. Response is descriptive, knowledge is basic and understanding is poor. Level 0 (0) No creditable response.
What was in this paper
The subtopics covered by these 6 questions, and how many questions each got. Open one in a new tab to see every Cambridge question on it.
What you needed in this session
Cambridge’s own grade thresholds for 2024 Oct/Nov, Paper 2 · Variant 2. A higher threshold means an easier paper — the bar moves with how the cohort did.