Cambridge A Level Geography 9696 — 2023 Oct/Nov Paper 2 · Variant 2
9696/22/O/N/23 · 6 questions · 60 marks · ≈68 min
The question paper and its mark scheme, free to read here and free to download. This is Cambridge’s own paper, exactly as it was sat.
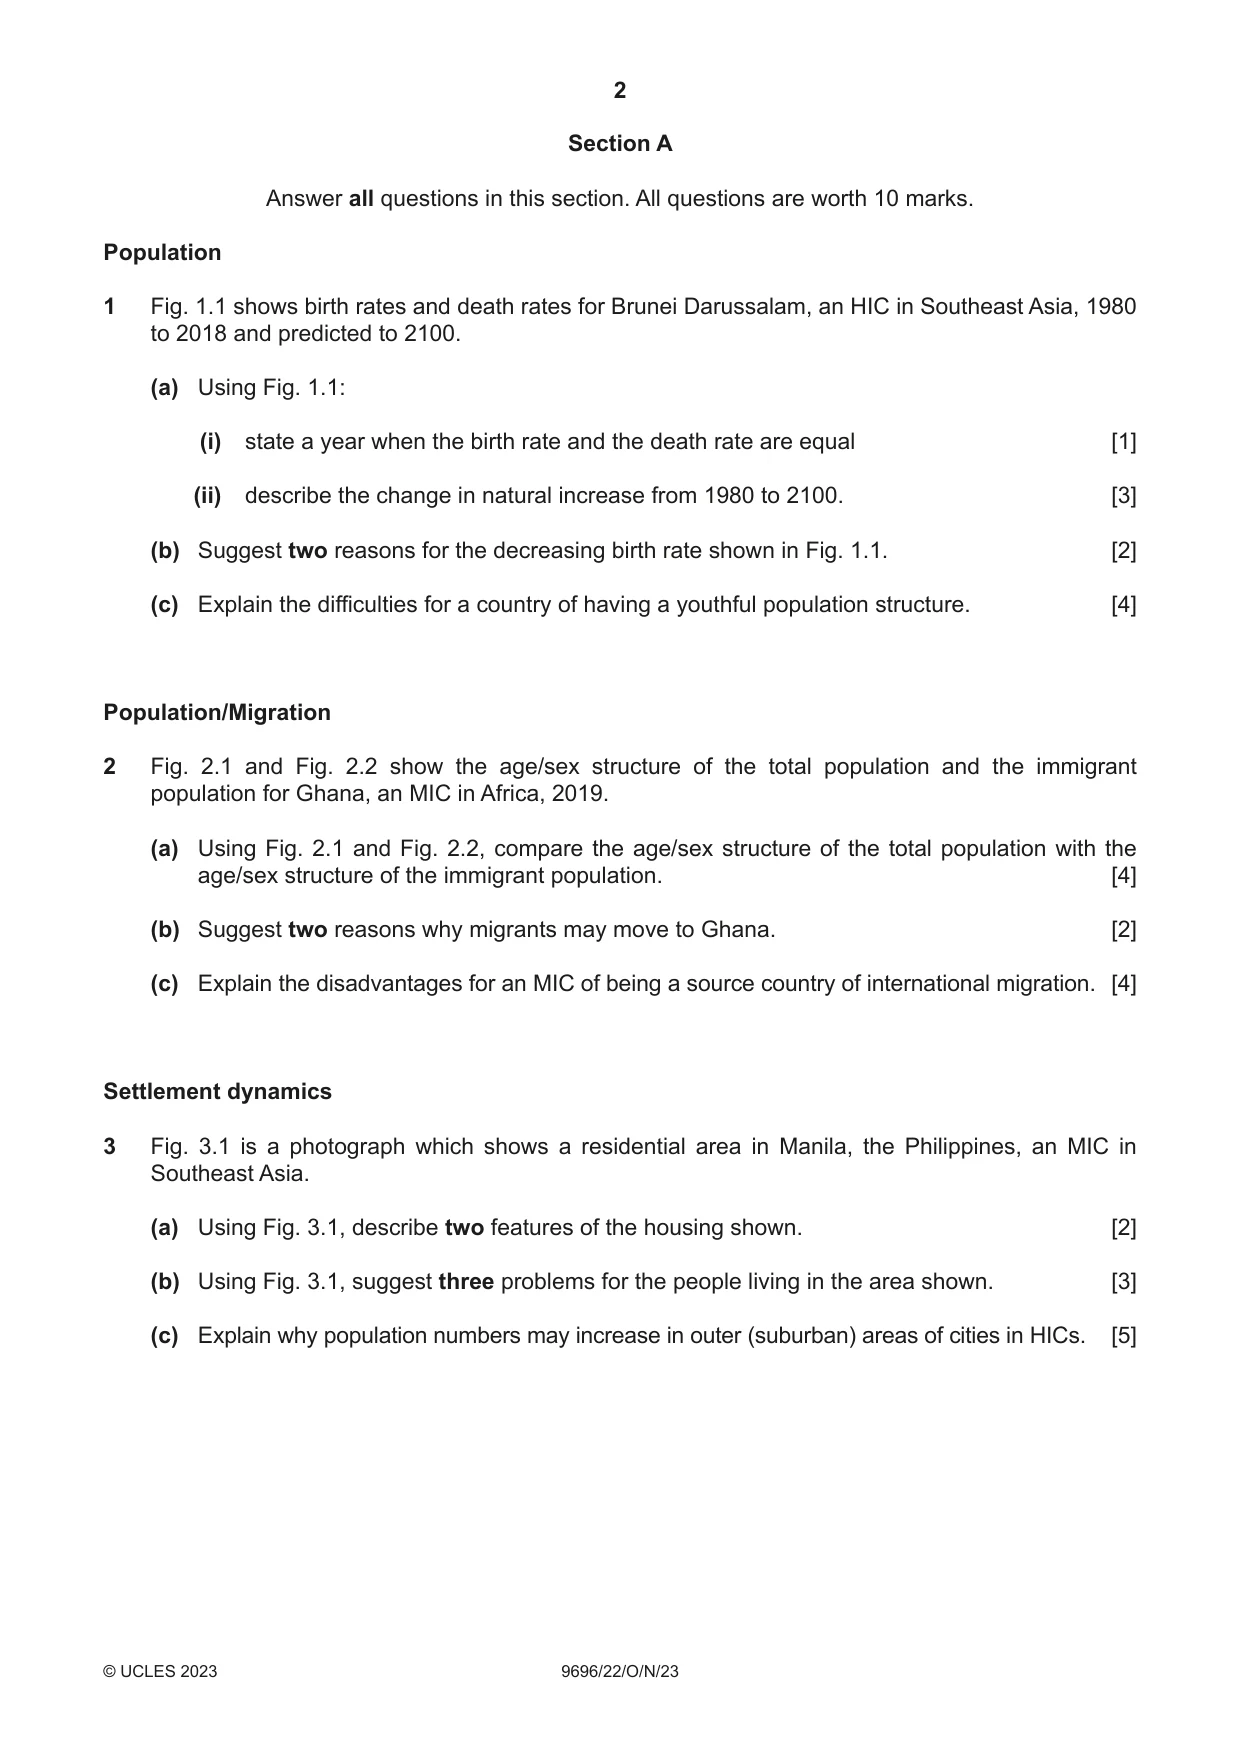
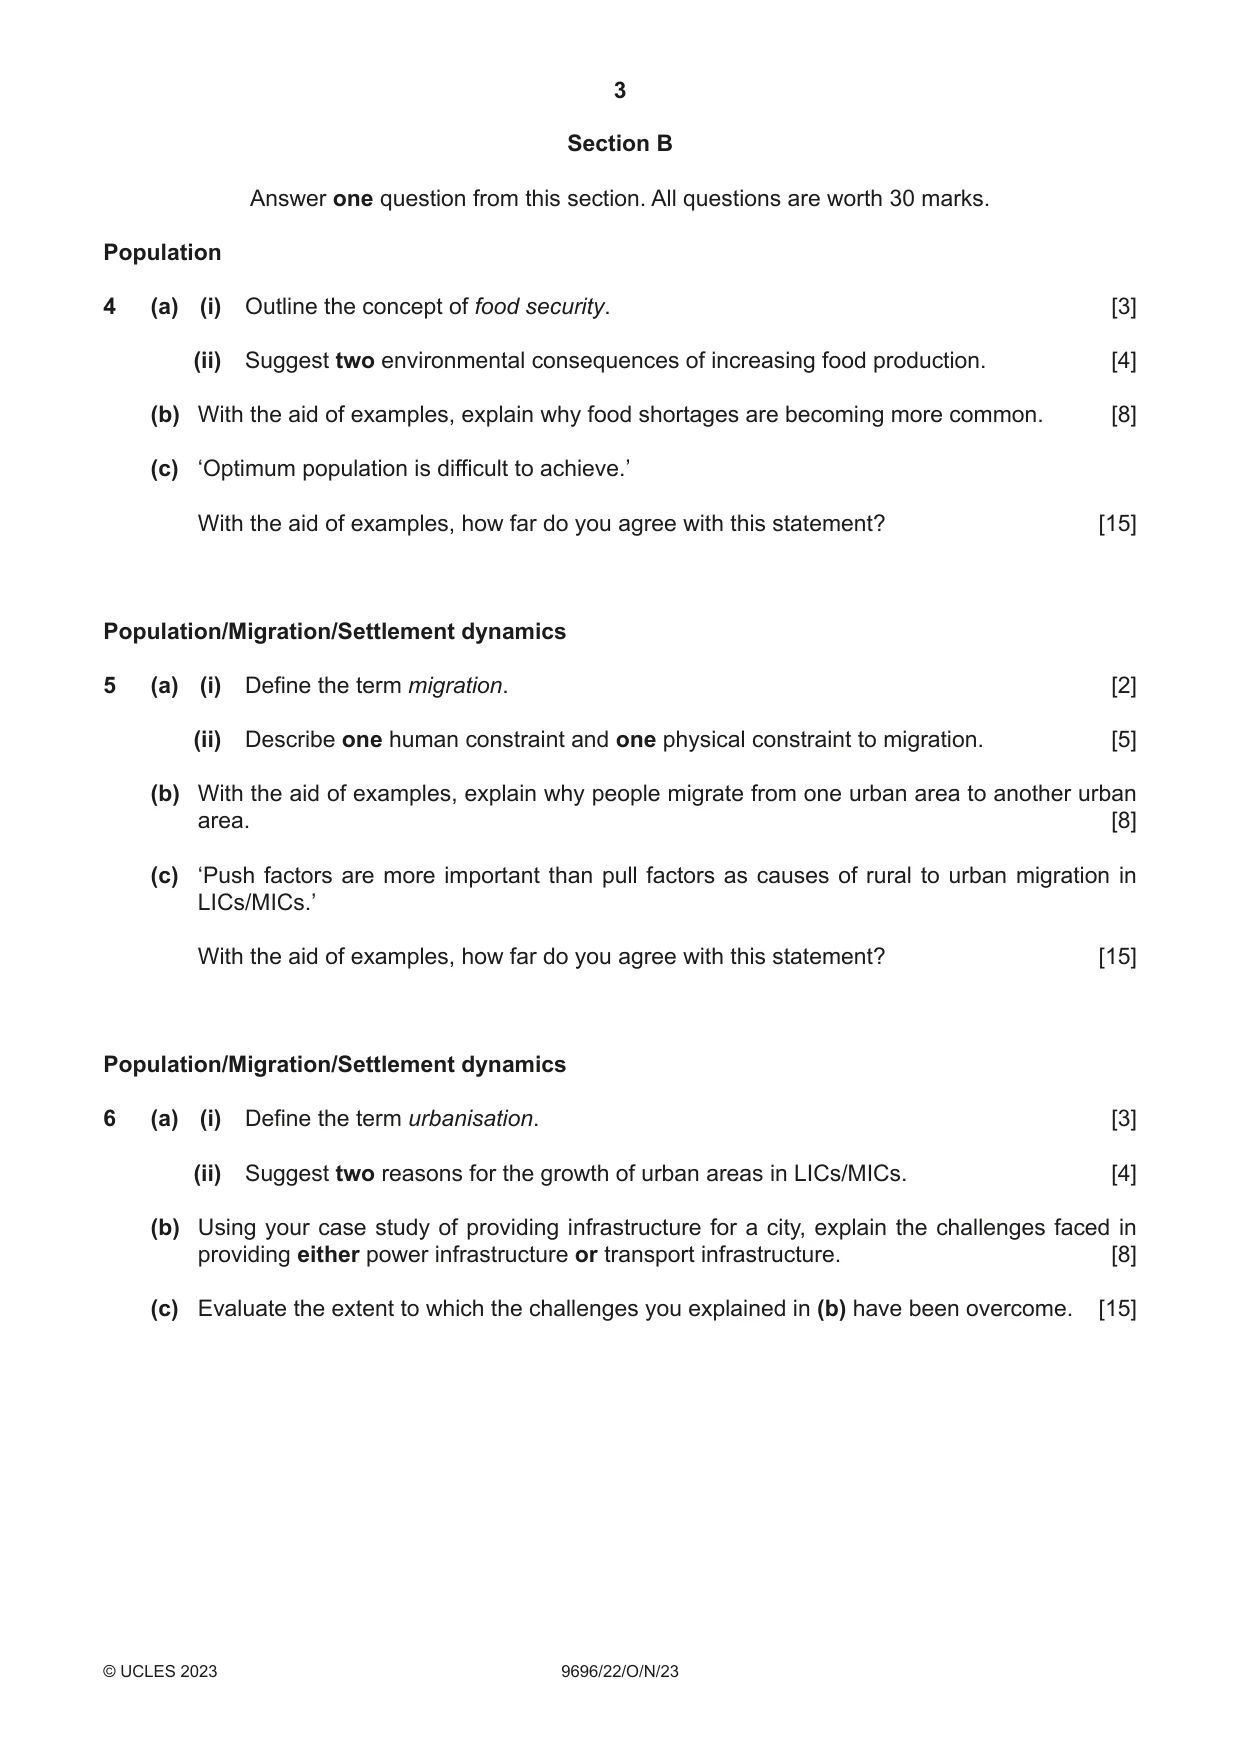
Question paper4 pages

Mark scheme18 pages
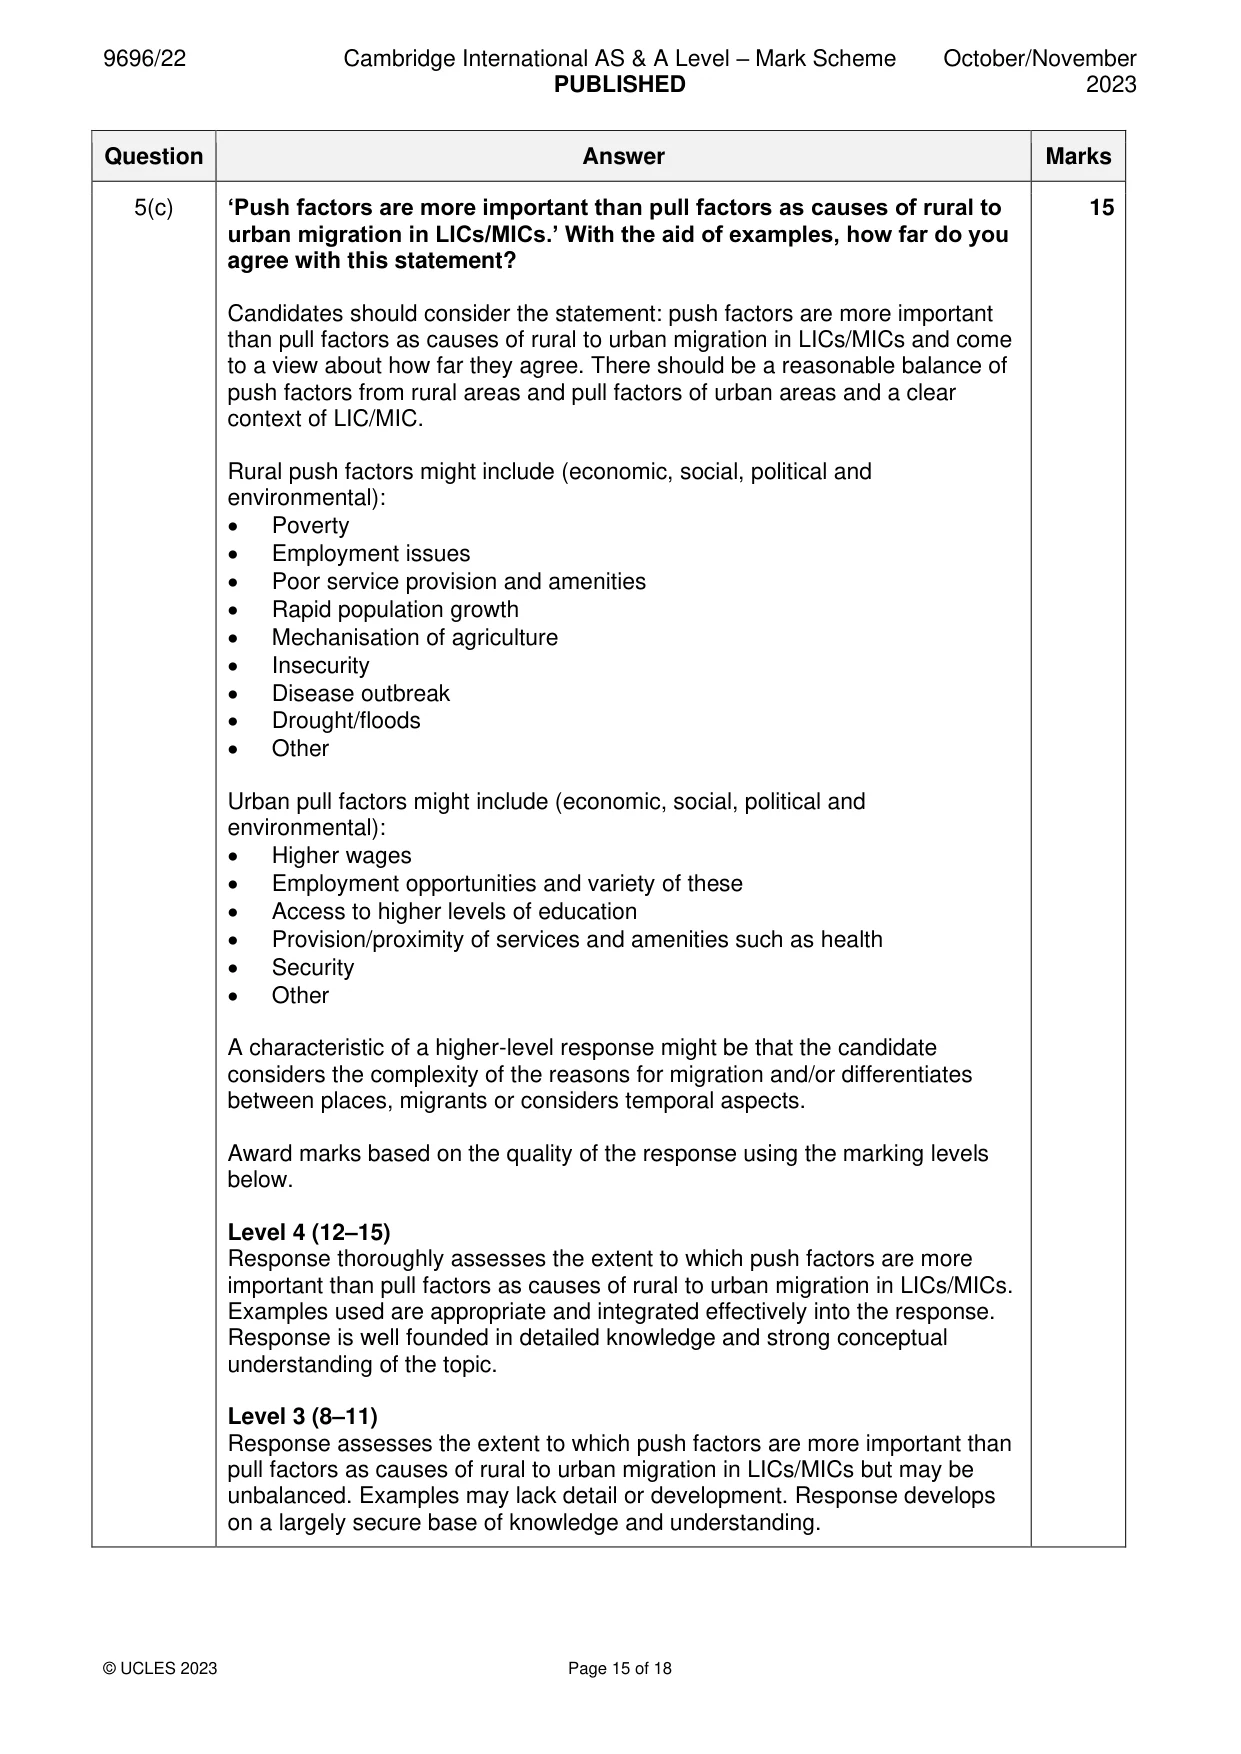
Answers below. Sit the paper first if you are practising.

Questions as text
Q1 · Birth rates and death rates for Brunei Darussalam, an HIC in Southeast Asia, 1980 to 2018…
1 Fig. 1.1 shows birth rates and death rates for Brunei Darussalam, an HIC in Southeast Asia, 1980 to 2018 and predicted to 2100. (a) Using Fig. 1.1: (i) state a year when the birth rate and the death rate are equal [1] (ii) describe the change in natural increase from 1980 to 2100. [3] (b) Suggest two reasons for the decreasing birth rate shown in Fig. 1.1. [2] (c) Explain the difficulties for a country of having a youthful population structure. [4] Population/Migration
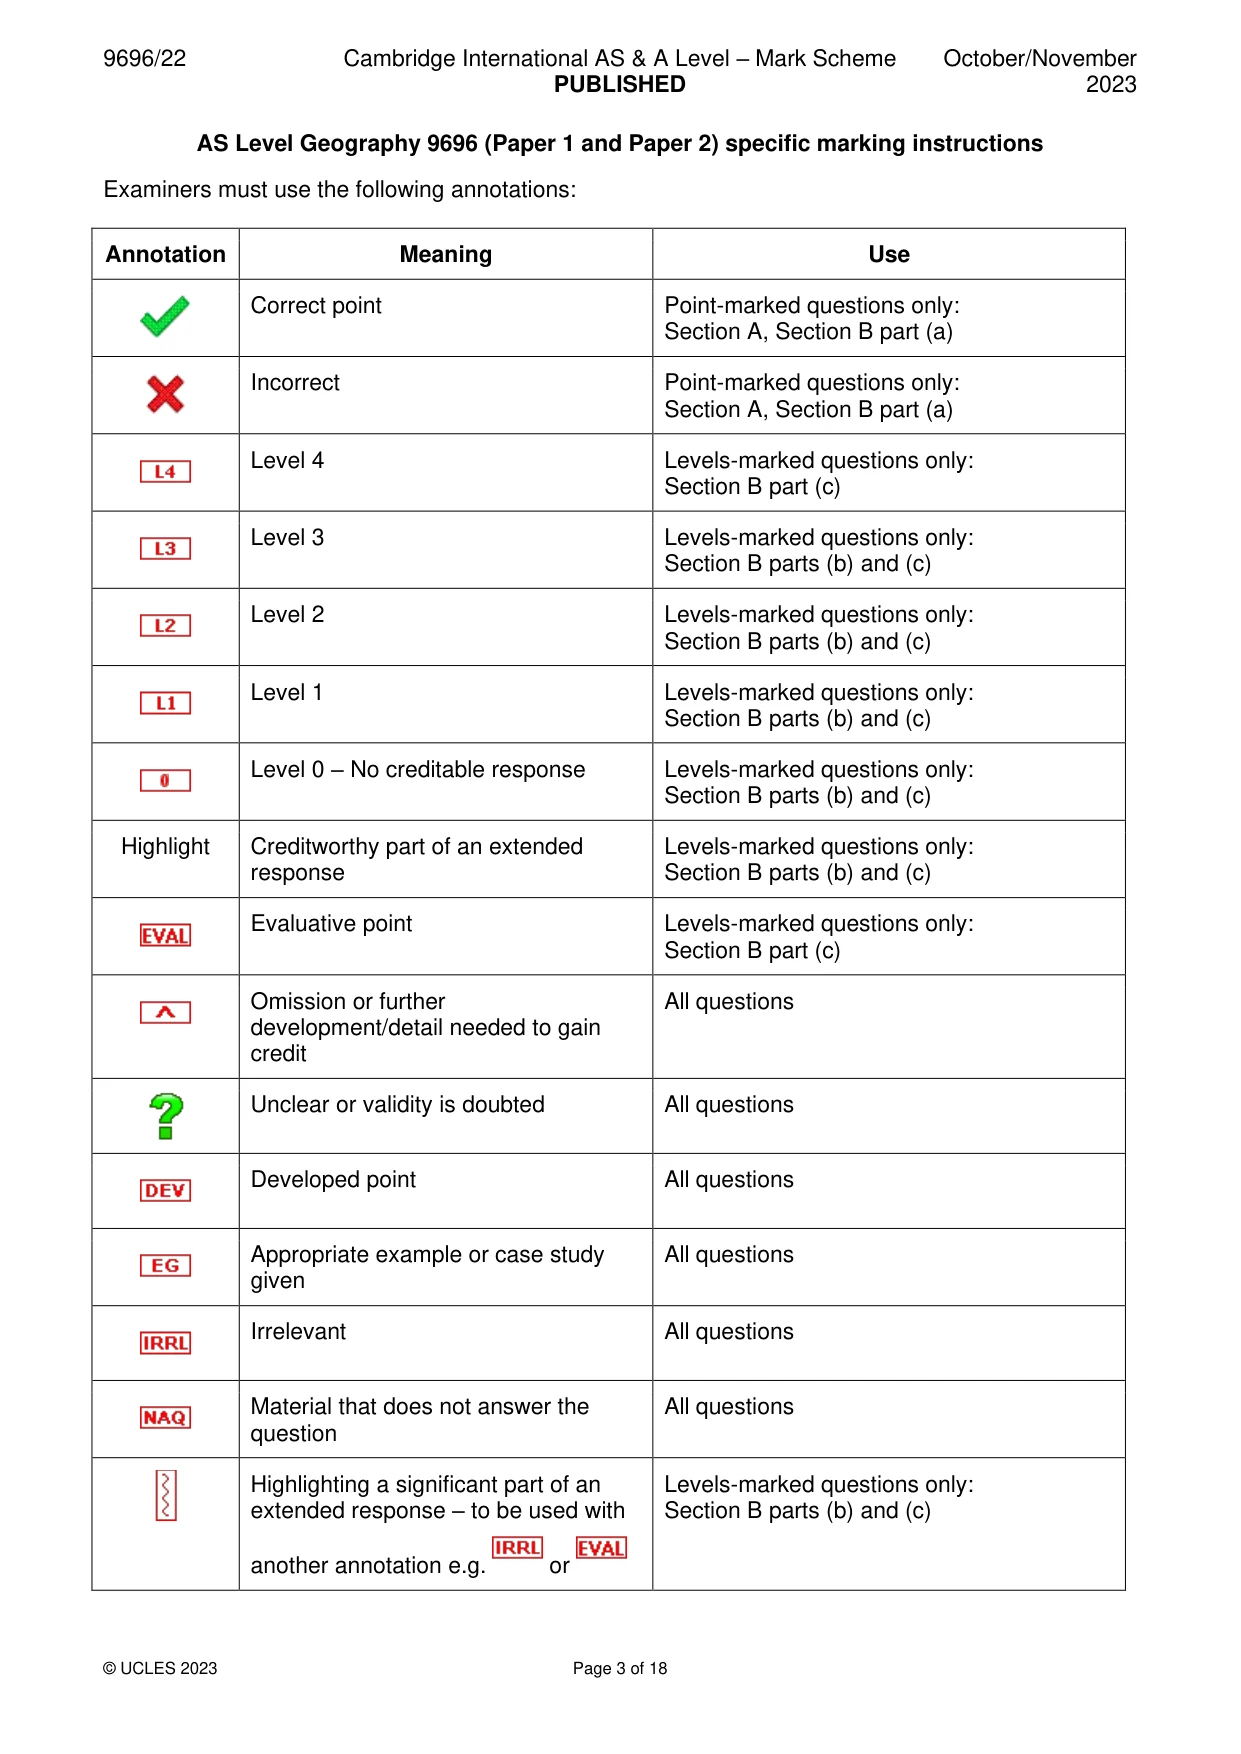
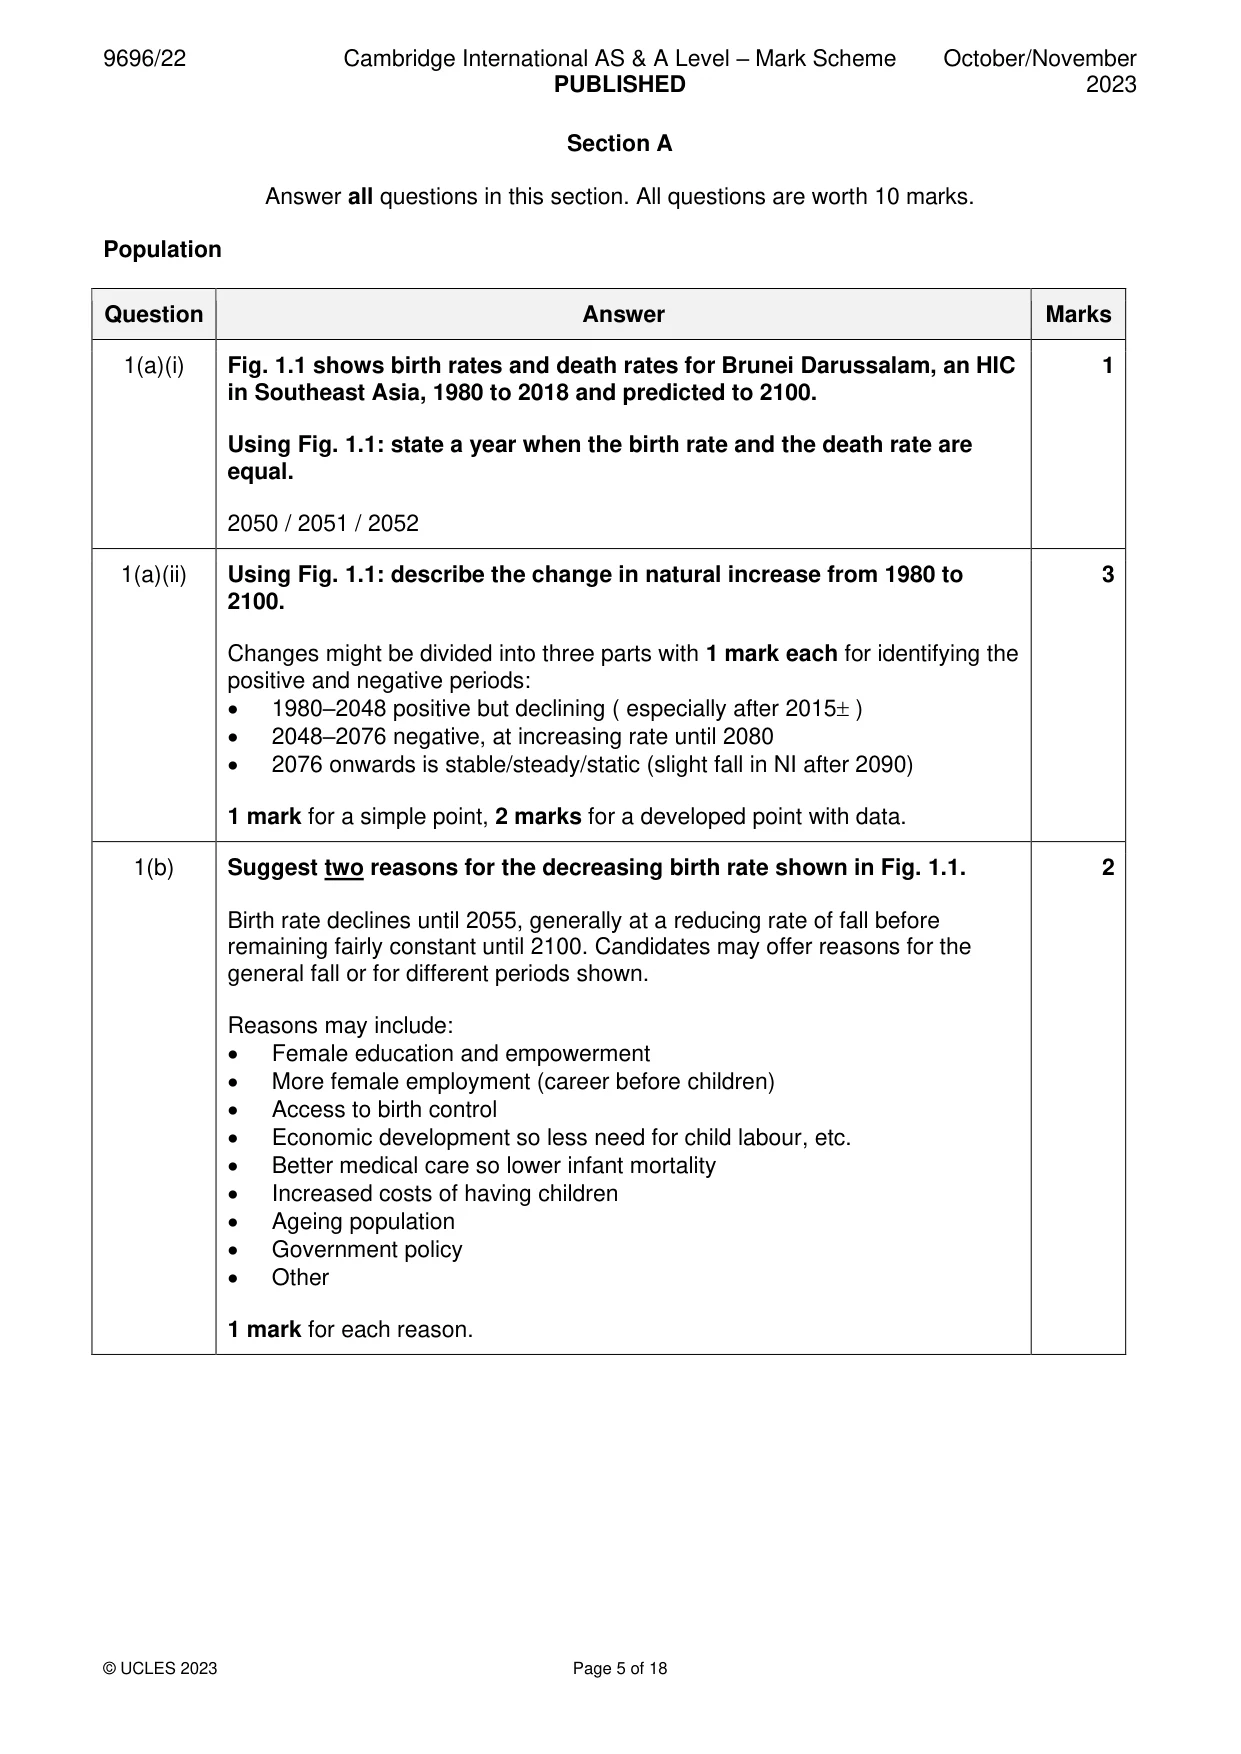
Mark scheme: Question Answer Marks 1(a)(i) Fig. 1.1 shows birth rates and death rates for Brunei Darussalam, an HIC 1 in Southeast Asia, 1980 to 2018 and predicted to 2100. Using Fig. 1.1: state a year when the birth rate and the death rate are equal. 2050 / 2051 / 2052 1(a)(ii) Using Fig. 1.1: describe the change in natural increase from 1980 to 3 2100. Changes might be divided into three parts with 1 mark each for identifying the positive and negative periods: • 1980–2048 positive but declining ( especially after 2015 ) • 2048–2076 negative, at increasing rate until 2080 • 2076 onwards is stable/steady/static (slight fall in NI after 2090) 1 mark for a simple point, 2 marks for a developed point with data. 1(b) Suggest two reasons for the decreasing birth rate shown in Fig. 1.1. 2 Birth rate declines until 2055, generally at a reducing rate of fall before remaining fairly constant until 2100. Candidates may offer reasons for the general fall or for different periods shown. Reasons may include: • Female education and empowerment • More female employment (career before children) • Access to birth control • Economic development so less need for child labour, etc. • Better medical care so lower infant mortality • Increased costs of having children • Ageing population • Government policy • Other 1 mark for each reason. 1(c) Explain the difficulties for a country of having a youthful population 4 structure. Difficulties might arise from (economic, social, political and environmental) issues caused by a youthful population structure such as: • Population will continue to grow because children may be viewed as economic assets / population momentum • Employment opportunities may not keep up with growth of working population • Convincing people to have smaller families • Generation of capital to pay for health, education and other services • Resource prioritisation • Unrest/discontent • Other Candidates should explain at least two difficulties. For each difficulty: 1 mark for a simple explanation, 2 marks for a developed explanation (with detail or an example). Population/Migration
Question 2
2 Fig. 2.1 and Fig. 2.2 show the age/sex structure of the total population and the immigrant population for Ghana, an MIC in Africa, 2019. (a) Using Fig. 2.1 and Fig. 2.2, compare the age/sex structure of the total population with the age/sex structure of the immigrant population. [4] (b) Suggest two reasons why migrants may move to Ghana. [2] (c) Explain the disadvantages for an MIC of being a source country of international migration. [4] Settlement dynamics
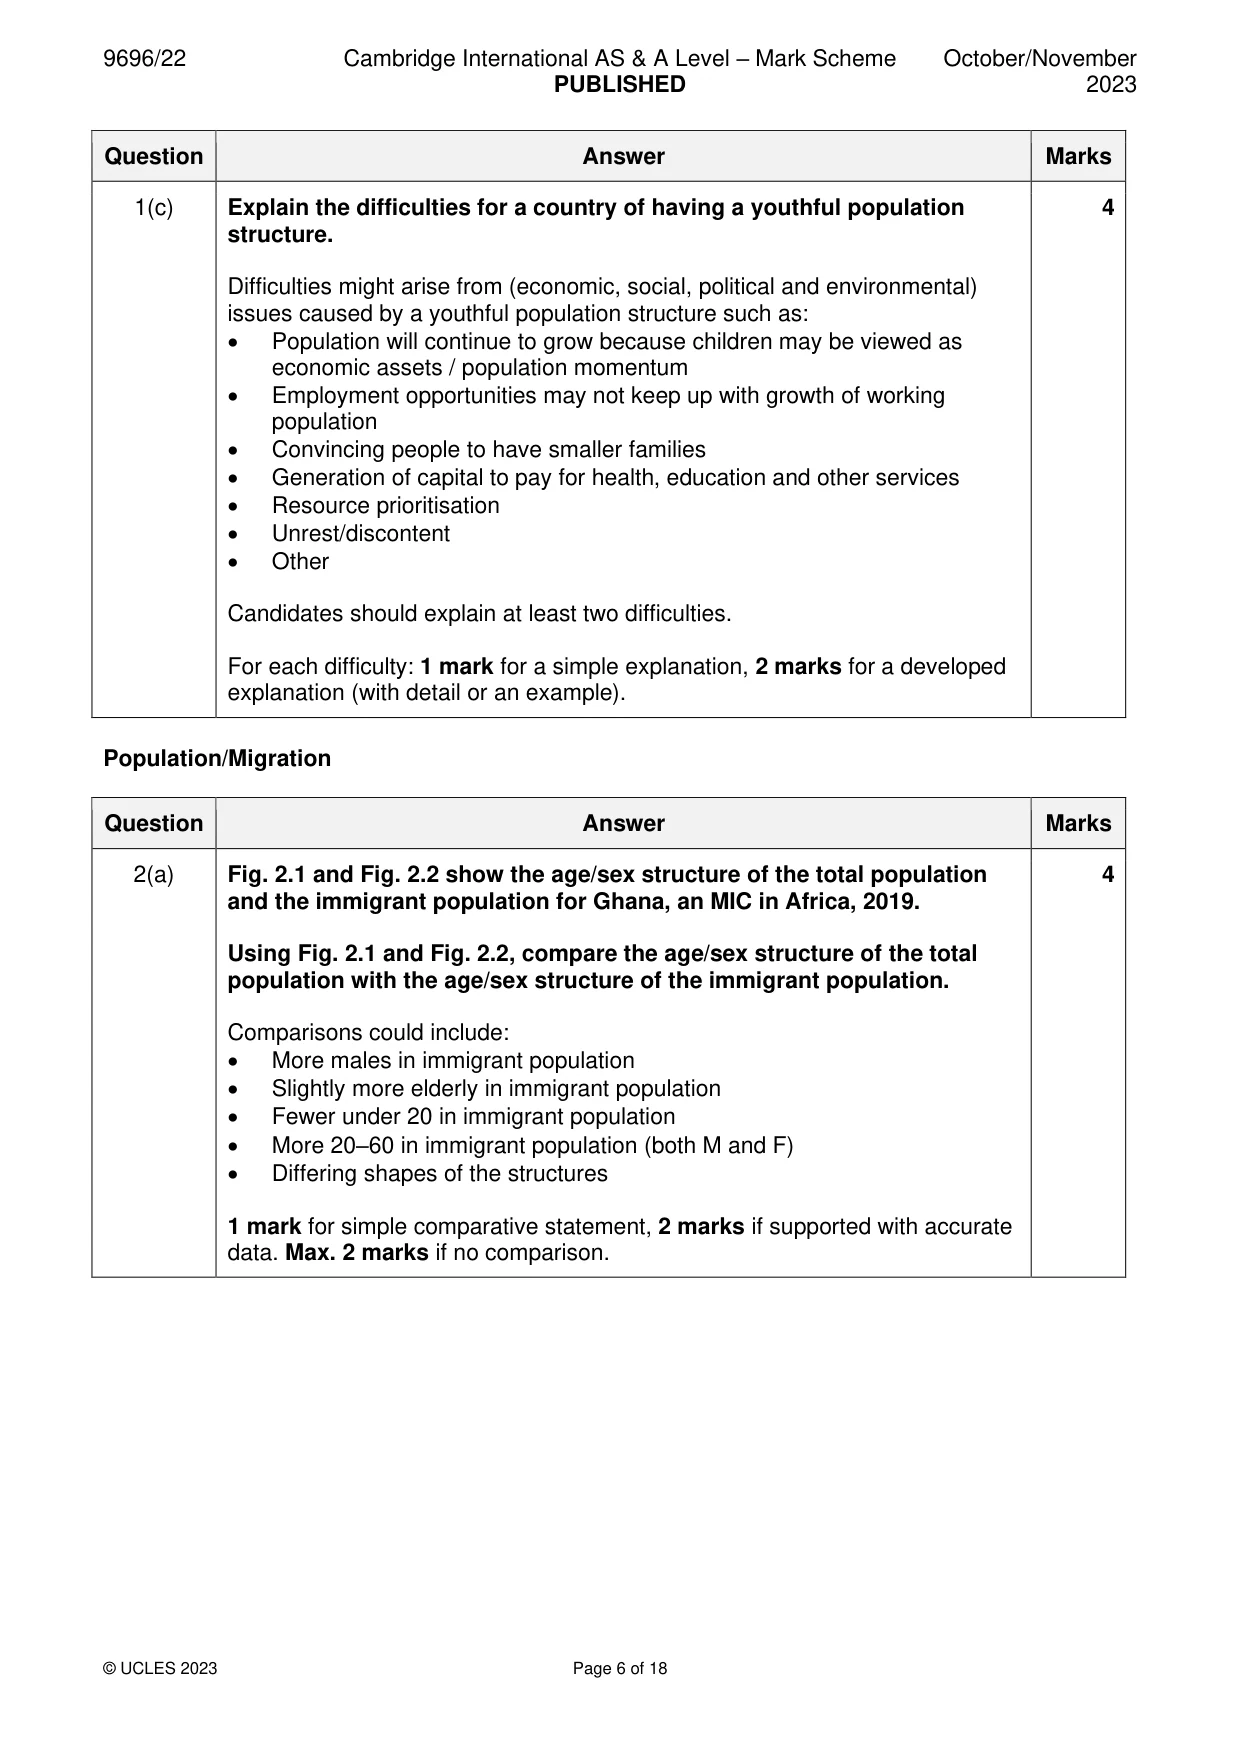
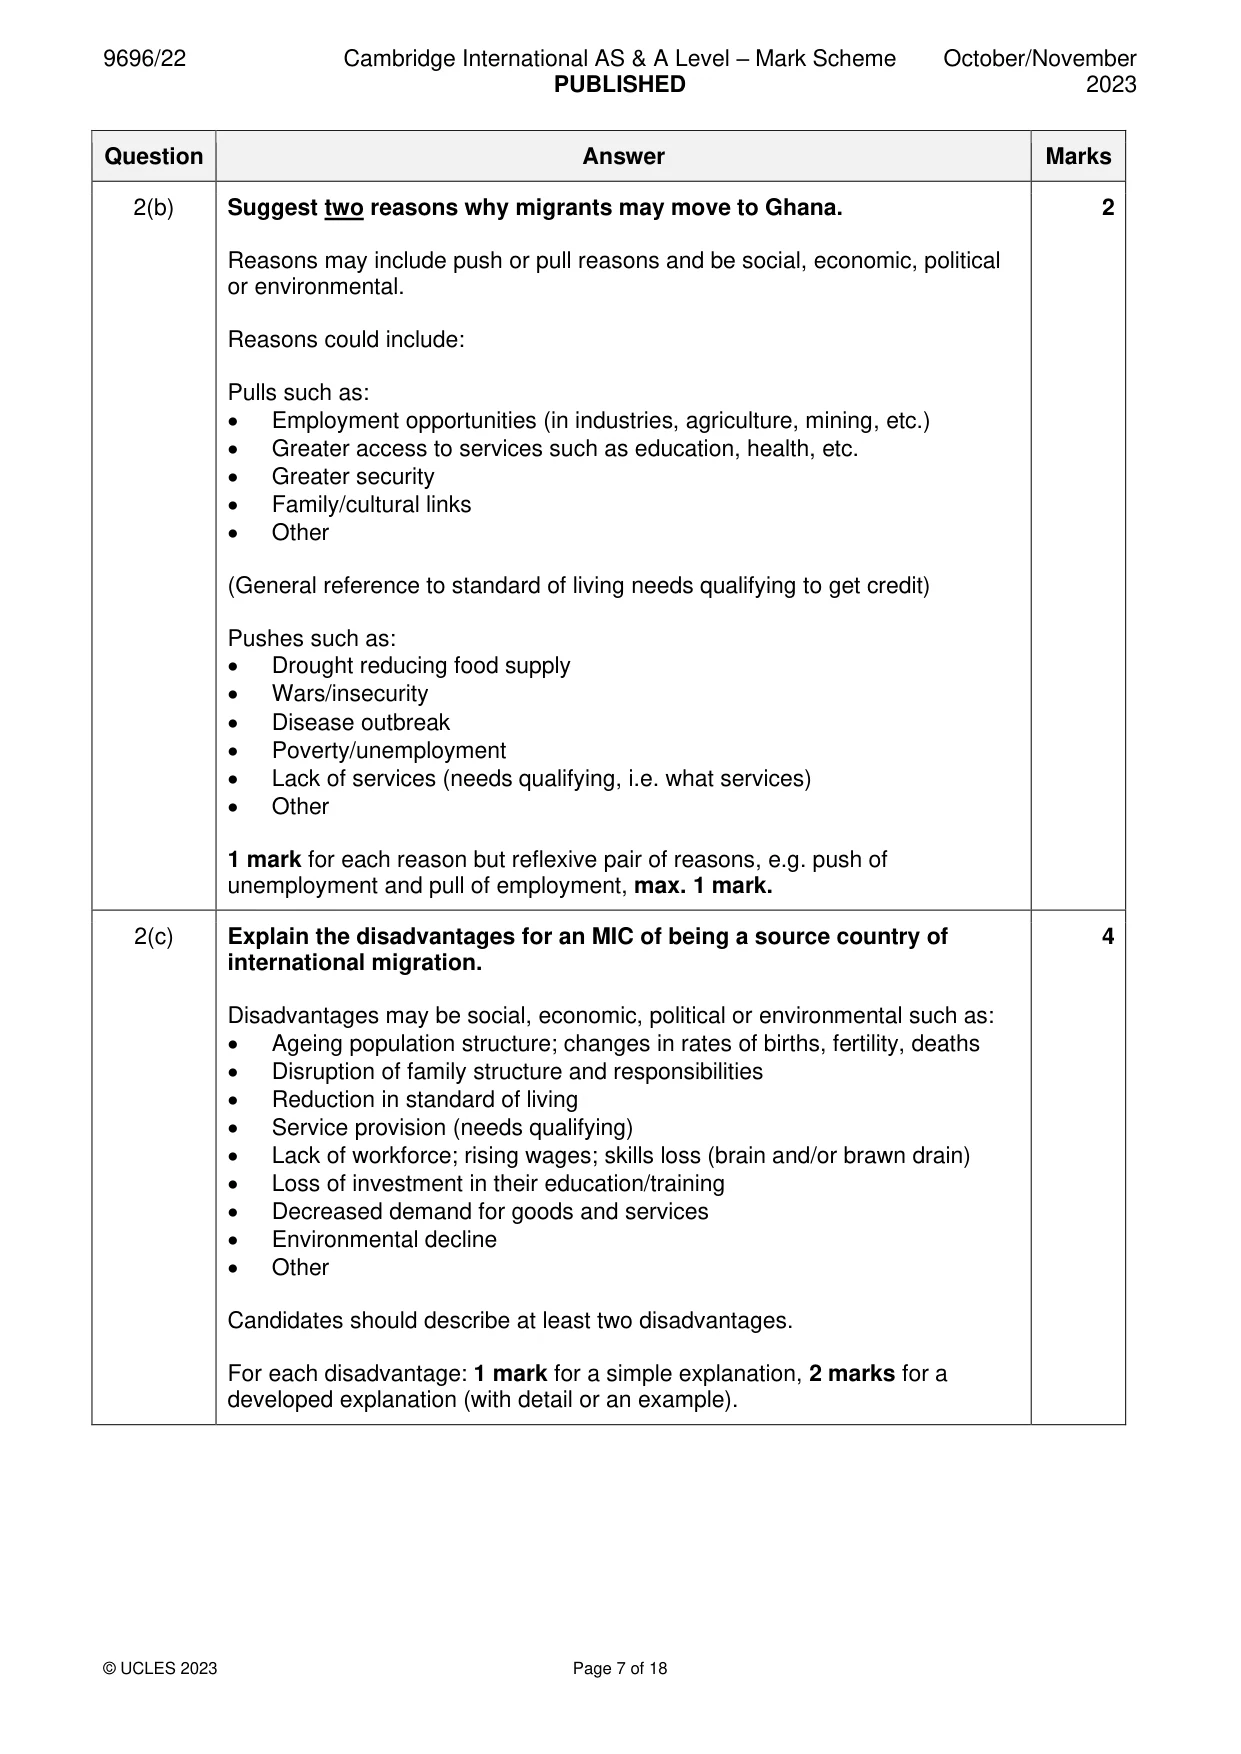
Mark scheme: 2(a) Fig. 2.1 and Fig. 2.2 show the age/sex structure of the total population 4 and the immigrant population for Ghana, an MIC in Africa, 2019. Using Fig. 2.1 and Fig. 2.2, compare the age/sex structure of the total population with the age/sex structure of the immigrant population. Comparisons could include: • More males in immigrant population • Slightly more elderly in immigrant population • Fewer under 20 in immigrant population • More 20–60 in immigrant population (both M and F) • Differing shapes of the structures 1 mark for simple comparative statement, 2 marks if supported with accurate data. Max. 2 marks if no comparison. 2(b) Suggest two reasons why migrants may move to Ghana. 2 Reasons may include push or pull reasons and be social, economic, political or environmental. Reasons could include: Pulls such as: • Employment opportunities (in industries, agriculture, mining, etc.) • Greater access to services such as education, health, etc. • Greater security • Family/cultural links • Other (General reference to standard of living needs qualifying to get credit) Pushes such as: • Drought reducing food supply • Wars/insecurity • Disease outbreak • Poverty/unemployment • Lack of services (needs qualifying, i.e. what services) • Other 1 mark for each reason but reflexive pair of reasons, e.g. push of unemployment and pull of employment, max. 1 mark. 2(c) Explain the disadvantages for an MIC of being a source country of 4 international migration. Disadvantages may be social, economic, political or environmental such as: • Ageing population structure; changes in rates of births, fertility, deaths • Disruption of family structure and responsibilities • Reduction in standard of living • Service provision (needs qualifying) • Lack of workforce; rising wages; skills loss (brain and/or brawn drain) • Loss of investment in their education/training • Decreased demand for goods and services • Environmental decline • Other Candidates should describe at least two disadvantages. For each disadvantage: 1 mark for a simple explanation, 2 marks for a developed explanation (with detail or an example). Settlement dynamics
Q3 · A photograph which shows a residential area in Manila, the Philippines, an MIC in…
3 Fig. 3.1 is a photograph which shows a residential area in Manila, the Philippines, an MIC in Southeast Asia. (a) Using Fig. 3.1, describe two features of the housing shown. [2] (b) Using Fig. 3.1, suggest three problems for the people living in the area shown. [3] (c) Explain why population numbers may increase in outer (suburban) areas of cities in HICs. [5]
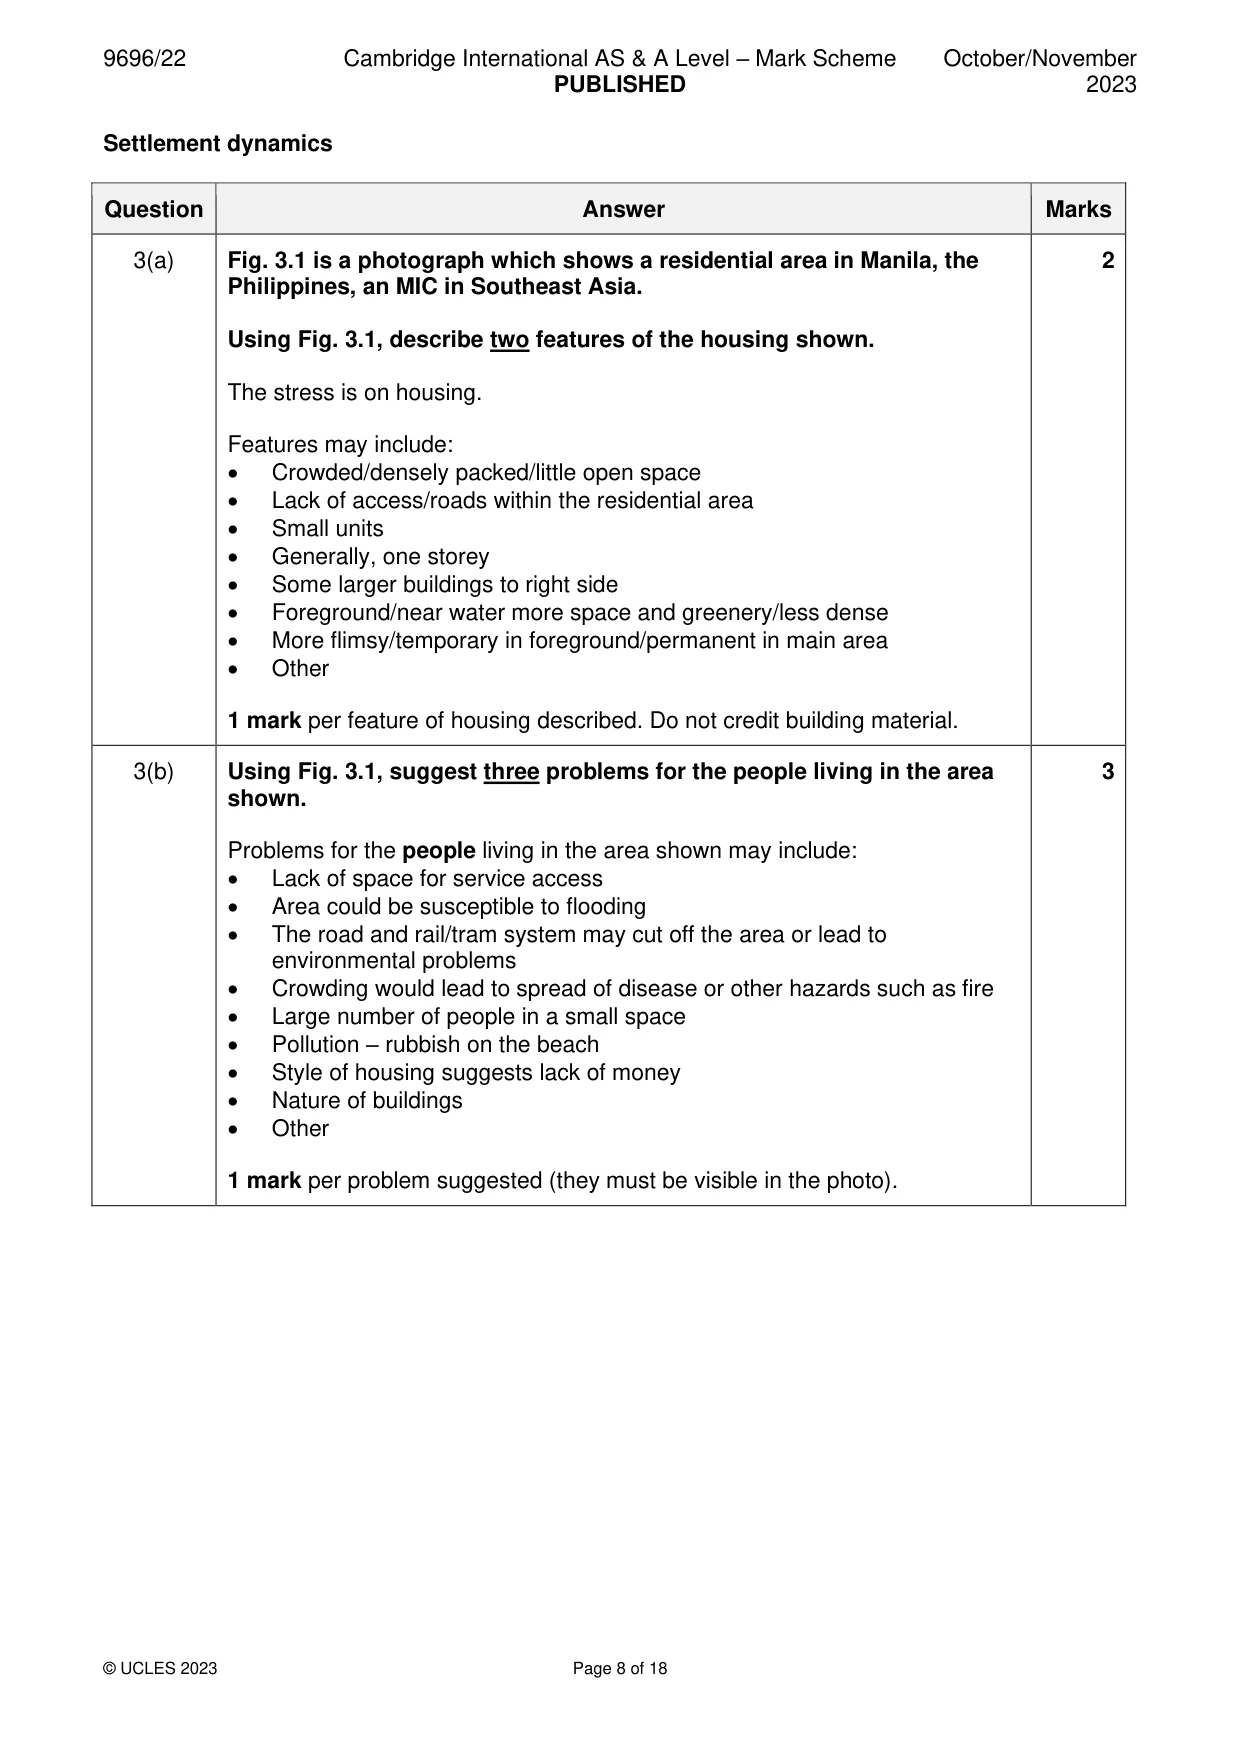
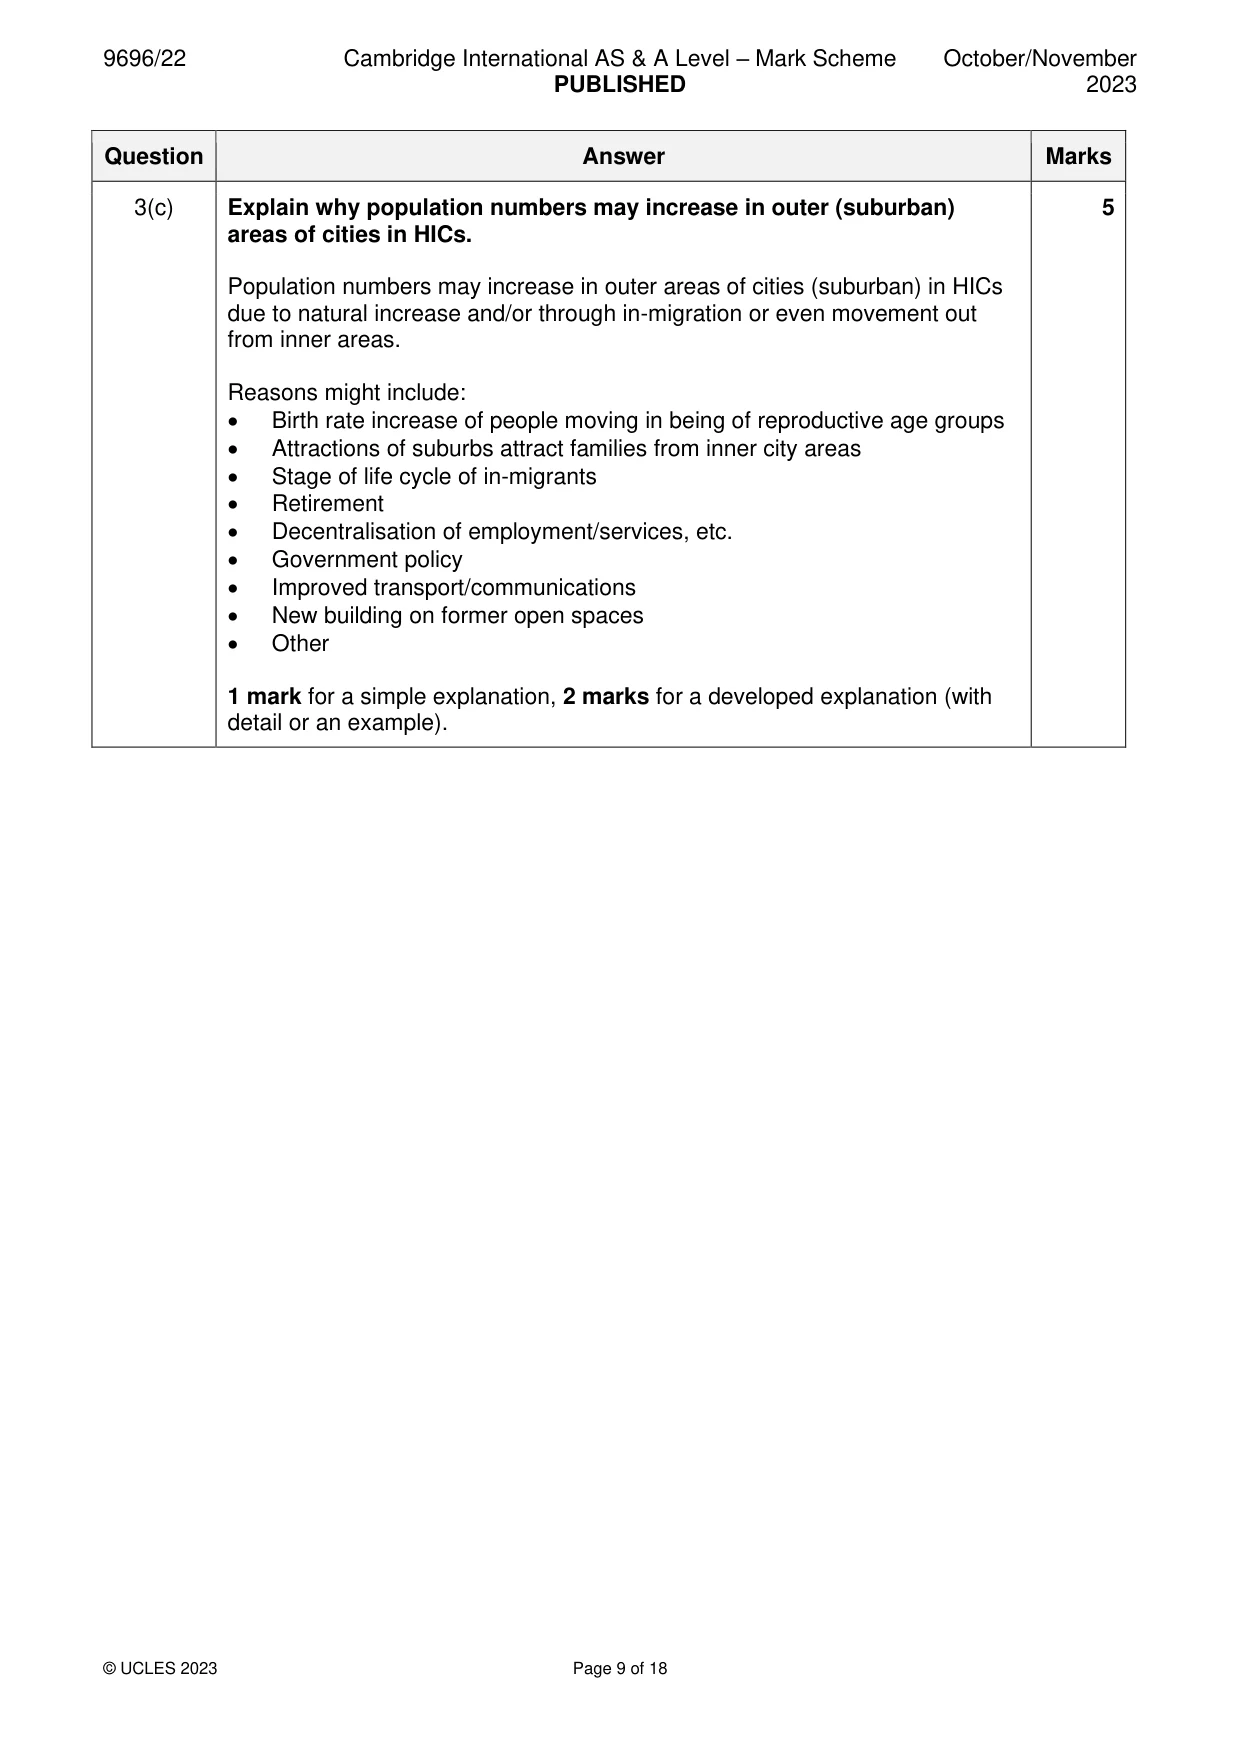
Mark scheme: 3(a) Fig. 3.1 is a photograph which shows a residential area in Manila, the 2 Philippines, an MIC in Southeast Asia. Using Fig. 3.1, describe two features of the housing shown. The stress is on housing. Features may include: • Crowded/densely packed/little open space • Lack of access/roads within the residential area • Small units • Generally, one storey • Some larger buildings to right side • Foreground/near water more space and greenery/less dense • More flimsy/temporary in foreground/permanent in main area • Other 1 mark per feature of housing described. Do not credit building material. 3(b) Using Fig. 3.1, suggest three problems for the people living in the area 3 shown. Problems for the people living in the area shown may include: • Lack of space for service access • Area could be susceptible to flooding • The road and rail/tram system may cut off the area or lead to environmental problems • Crowding would lead to spread of disease or other hazards such as fire • Large number of people in a small space • Pollution – rubbish on the beach • Style of housing suggests lack of money • Nature of buildings • Other 1 mark per problem suggested (they must be visible in the photo). 3(c) Explain why population numbers may increase in outer (suburban) 5 areas of cities in HICs. Population numbers may increase in outer areas of cities (suburban) in HICs due to natural increase and/or through in-migration or even movement out from inner areas. Reasons might include: • Birth rate increase of people moving in being of reproductive age groups • Attractions of suburbs attract families from inner city areas • Stage of life cycle of in-migrants • Retirement • Decentralisation of employment/services, etc. • Government policy • Improved transport/communications • New building on former open spaces • Other 1 mark for a simple explanation, 2 marks for a developed explanation (with detail or an example). Section B Answer one question from this section. All questions are worth 30 marks. Population
Q4 · Outline the concept of food security
4 (a) (i) Outline the concept of food security. [3] (ii) Suggest two environmental consequences of increasing food production. [4] (b) With the aid of examples, explain why food shortages are becoming more common. [8] (c) ‘Optimum population is difficult to achieve.’ With the aid of examples, how far do you agree with this statement? [15] Population/Migration/Settlement dynamics
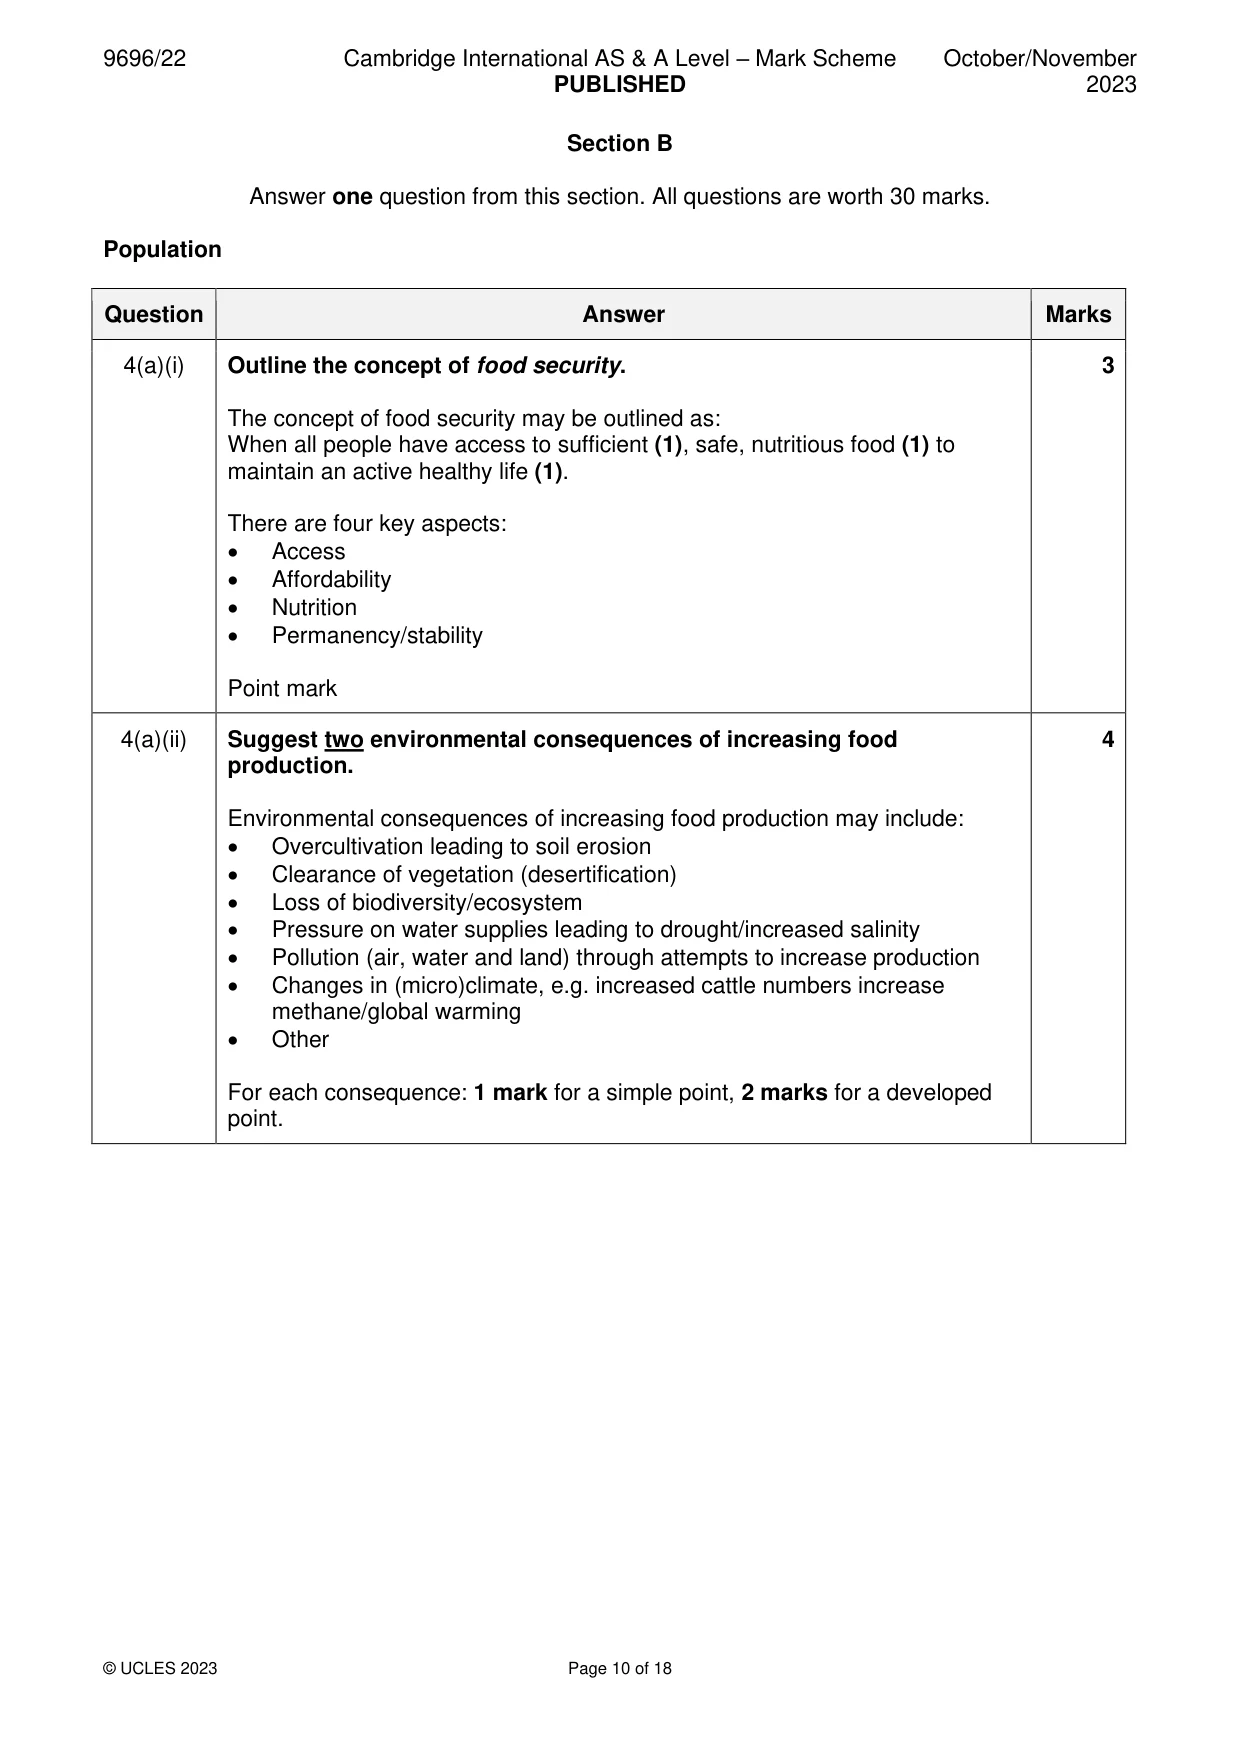
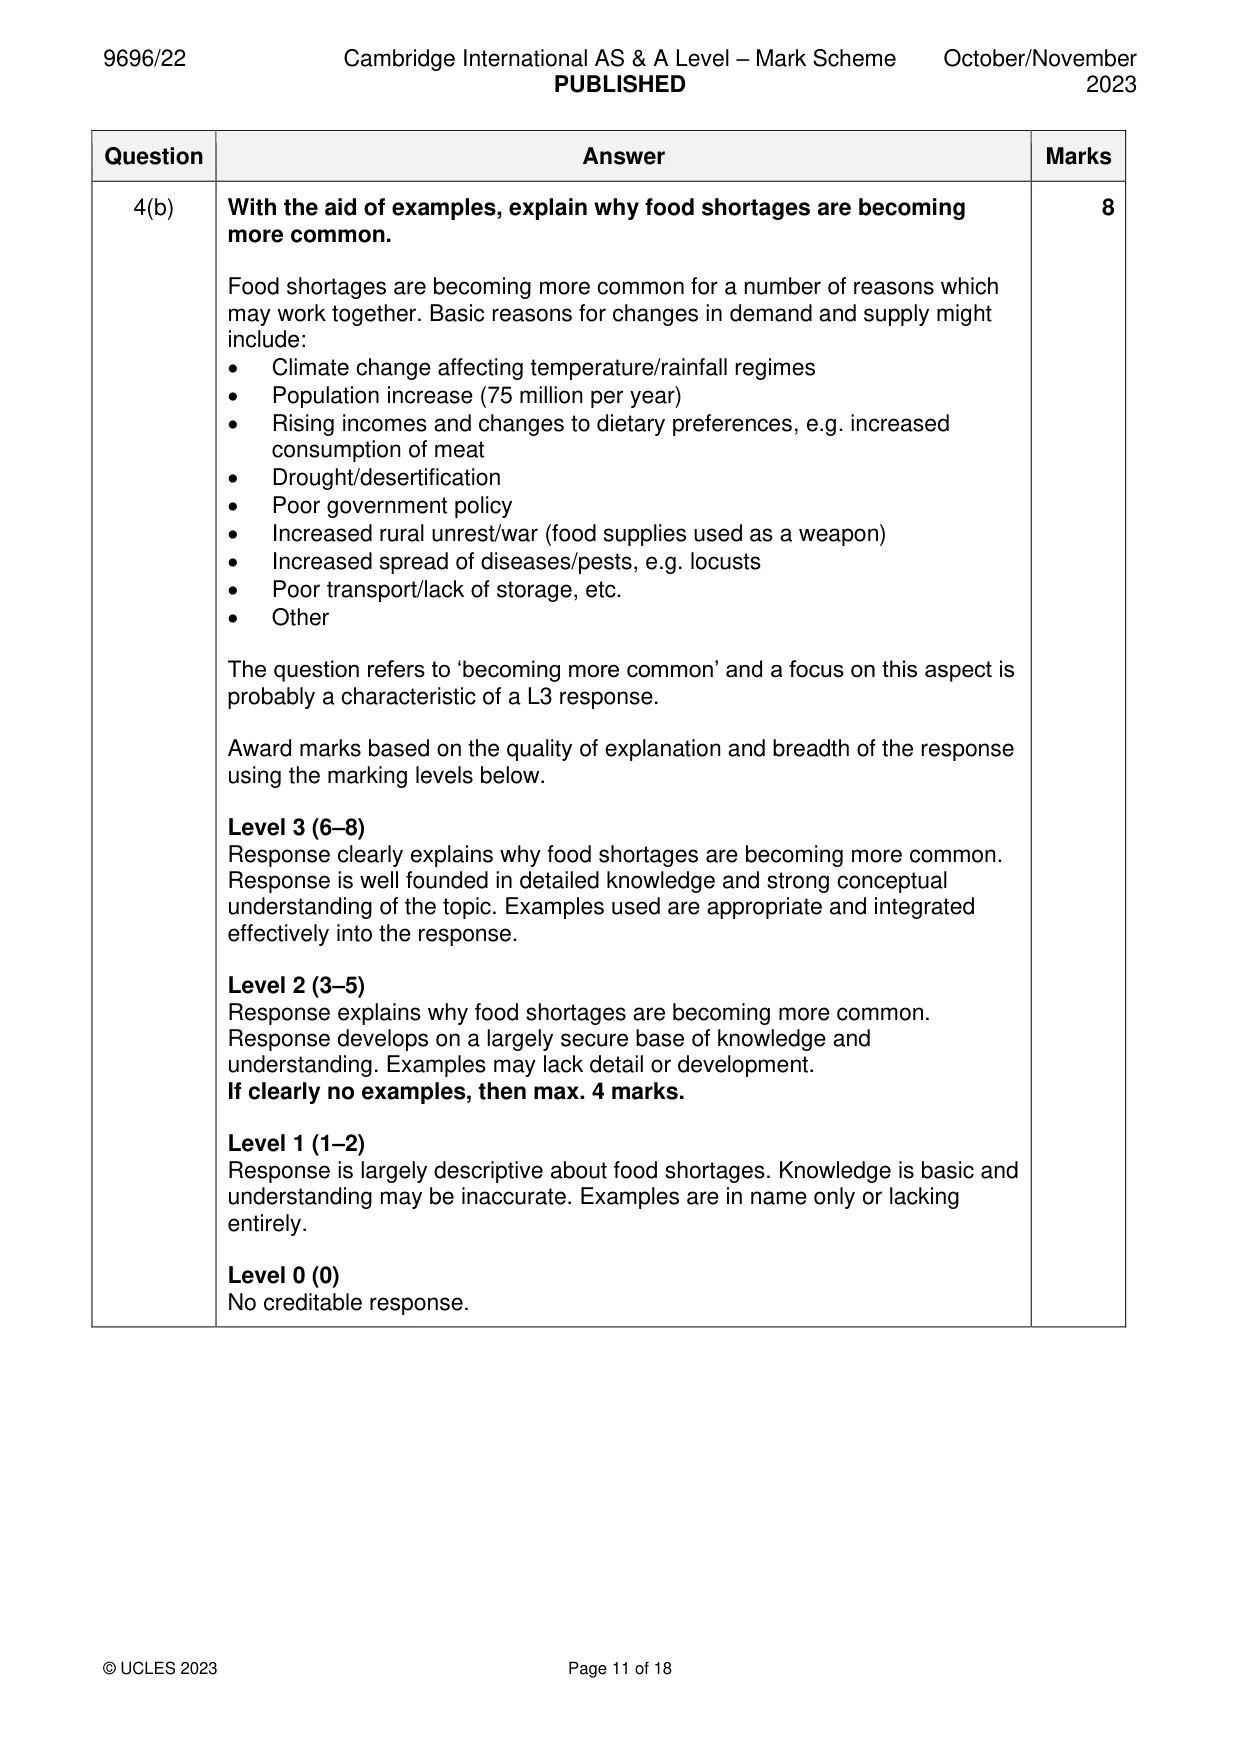
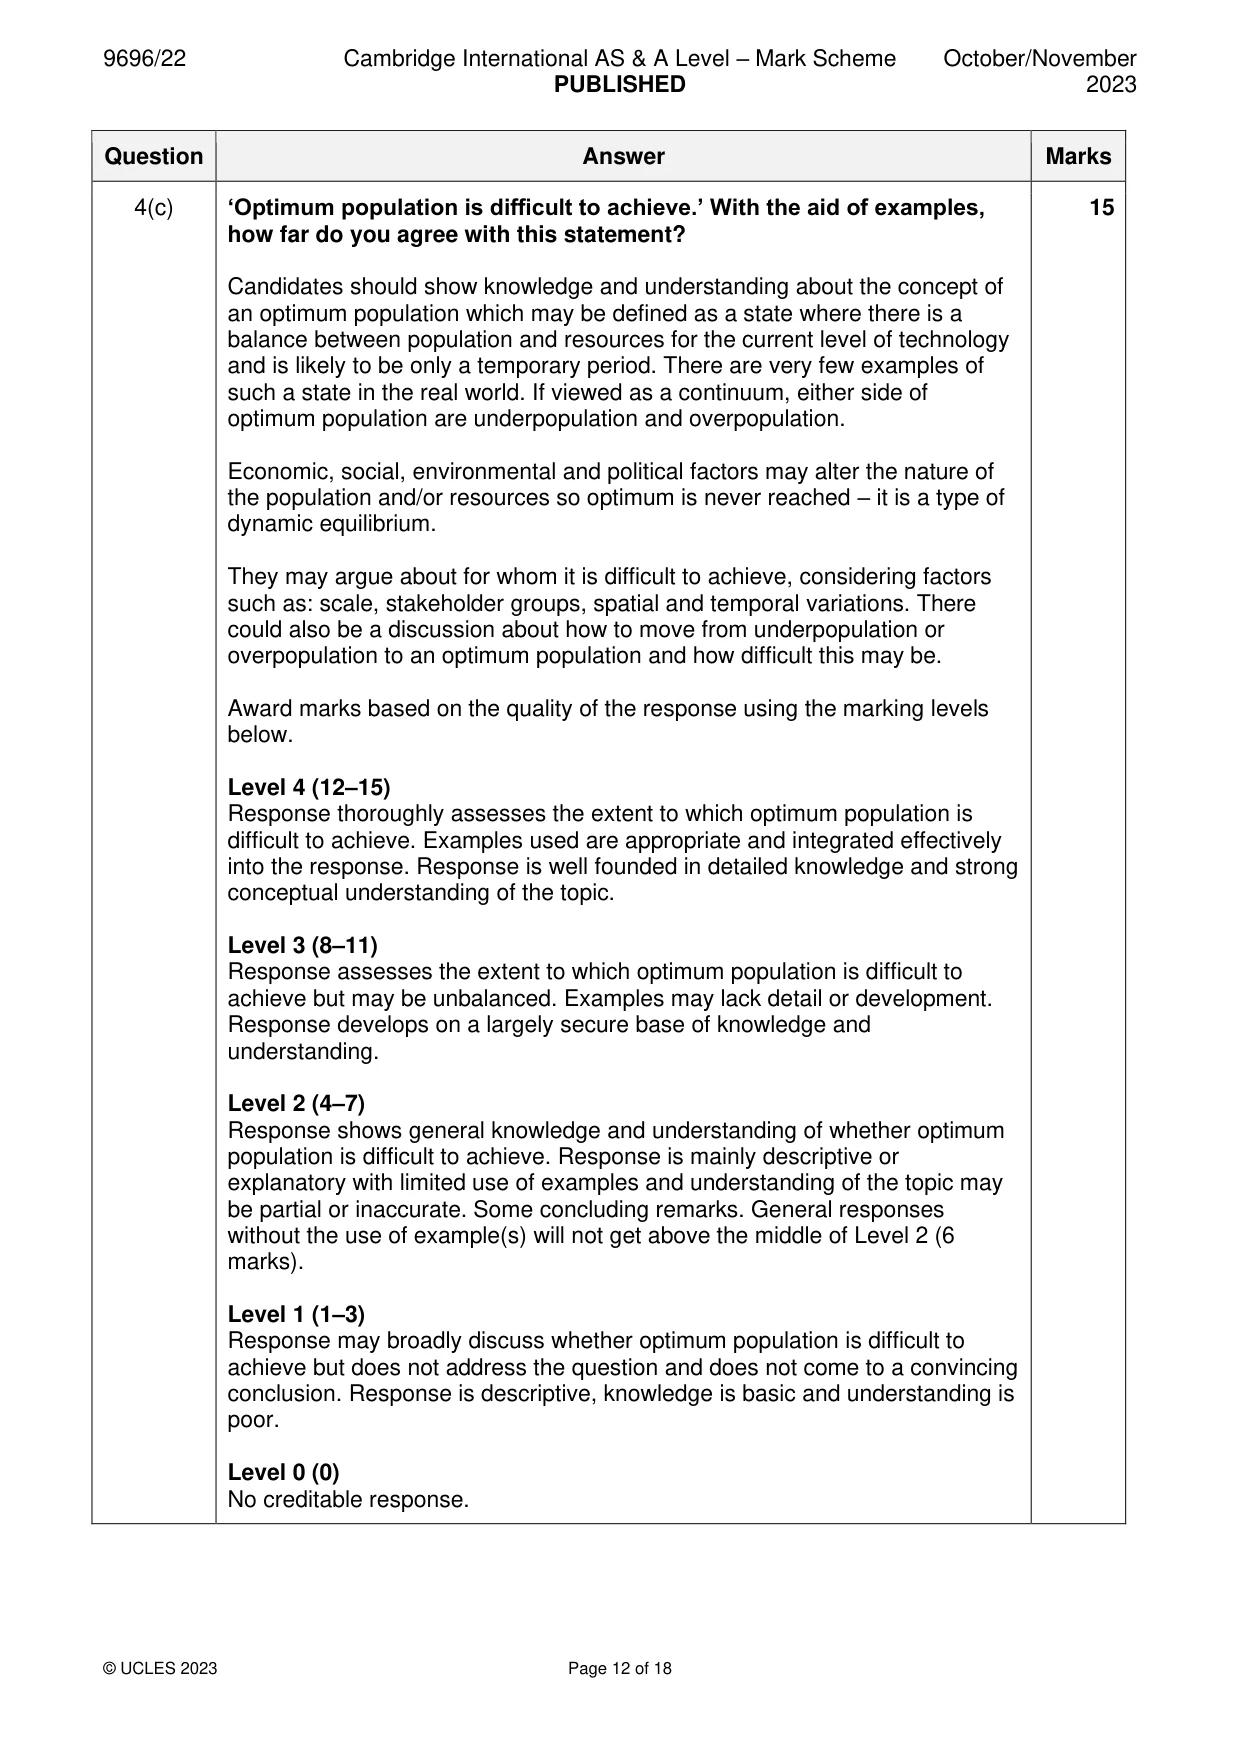
Mark scheme: 4(a)(i) Outline the concept of food security. 3 The concept of food security may be outlined as: When all people have access to sufficient (1), safe, nutritious food (1) to maintain an active healthy life (1). There are four key aspects: • Access • Affordability • Nutrition • Permanency/stability Point mark 4(a)(ii) Suggest two environmental consequences of increasing food 4 production. Environmental consequences of increasing food production may include: • Overcultivation leading to soil erosion • Clearance of vegetation (desertification) • Loss of biodiversity/ecosystem • Pressure on water supplies leading to drought/increased salinity • Pollution (air, water and land) through attempts to increase production • Changes in (micro)climate, e.g. increased cattle numbers increase methane/global warming • Other For each consequence: 1 mark for a simple point, 2 marks for a developed point. 4(b) With the aid of examples, explain why food shortages are becoming 8 more common. Food shortages are becoming more common for a number of reasons which may work together. Basic reasons for changes in demand and supply might include: • Climate change affecting temperature/rainfall regimes • Population increase (75 million per year) • Rising incomes and changes to dietary preferences, e.g. increased consumption of meat • Drought/desertification • Poor government policy • Increased rural unrest/war (food supplies used as a weapon) • Increased spread of diseases/pests, e.g. locusts • Poor transport/lack of storage, etc. • Other The question refers to ‘becoming more common’ and a focus on this aspect is probably a characteristic of a L3 response. Award marks based on the quality of explanation and breadth of the response using the marking levels below. Level 3 (6–8) Response clearly explains why food shortages are becoming more common. Response is well founded in detailed knowledge and strong conceptual understanding of the topic. Examples used are appropriate and integrated effectively into the response. Level 2 (3–5) Response explains why food shortages are becoming more common. Response develops on a largely secure base of knowledge and understanding. Examples may lack detail or development. If clearly no examples, then max. 4 marks. Level 1 (1–2) Response is largely descriptive about food shortages. Knowledge is basic and understanding may be inaccurate. Examples are in name only or lacking entirely. Level 0 (0) No creditable response. 4(c) ‘Optimum population is difficult to achieve.’ With the aid of examples, 15 how far do you agree with this statement? Candidates should show knowledge and understanding about the concept of an optimum population which may be defined as a state where there is a balance between population and resources for the current level of technology and is likely to be only a temporary period. There are very few examples of such a state in the real world. If viewed as a continuum, either side of optimum population are underpopulation and overpopulation. Economic, social, environmental and political factors may alter the nature of the population and/or resources so optimum is never reached – it is a type of dynamic equilibrium. They may argue about for whom it is difficult to achieve, considering factors such as: scale, stakeholder groups, spatial and temporal variations. There could also be a discussion about how to move from underpopulation or overpopulation to an optimum population and how difficult this may be. Award marks based on the quality of the response using the marking levels below. Level 4 (12–15) Response thoroughly assesses the extent to which optimum population is difficult to achieve. Examples used are appropriate and integrated effectively into the response. Response is well founded in detailed knowledge and strong conceptual understanding of the topic. Level 3 (8–11) Response assesses the extent to which optimum population is difficult to achieve but may be unbalanced. Examples may lack detail or development. Response develops on a largely secure base of knowledge and understanding. Level 2 (4–7) Response shows general knowledge and understanding of whether optimum population is difficult to achieve. Response is mainly descriptive or explanatory with limited use of examples and understanding of the topic may be partial or inaccurate. Some concluding remarks. General responses without the use of example(s) will not get above the middle of Level 2 (6 marks). Level 1 (1–3) Response may broadly discuss whether optimum population is difficult to achieve but does not address the question and does not come to a convincing conclusion. Response is descriptive, knowledge is basic and understanding is poor. Level 0 (0) No creditable response. Population/Migration/Settlement dynamics
Q5 · Define the term migration
5 (a) (i) Define the term migration. [2] (ii) Describe one human constraint and one physical constraint to migration. [5] (b) With the aid of examples, explain why people migrate from one urban area to another urban area. [8] (c) ‘Push factors are more important than pull factors as causes of rural to urban migration in LICs/MICs.’ With the aid of examples, how far do you agree with this statement? [15] Population/Migration/Settlement dynamics
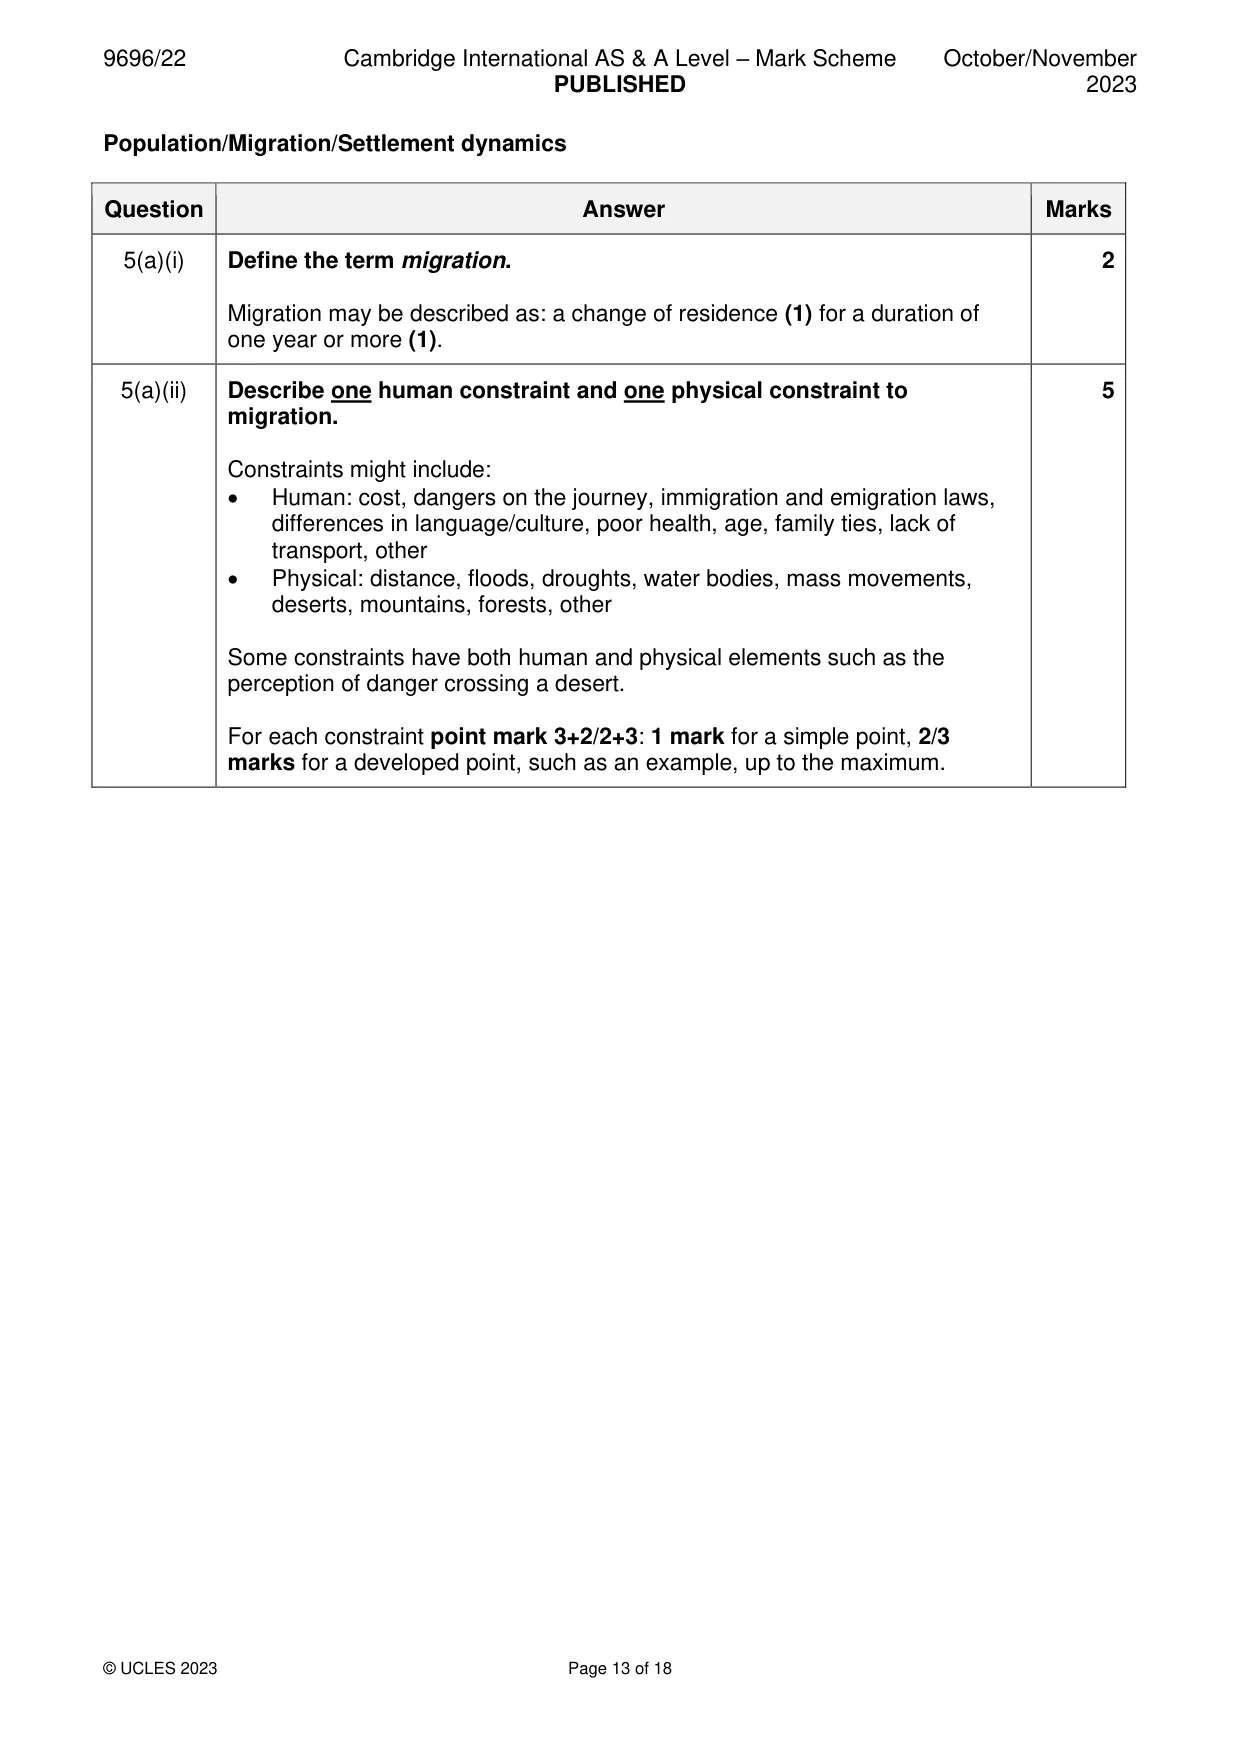
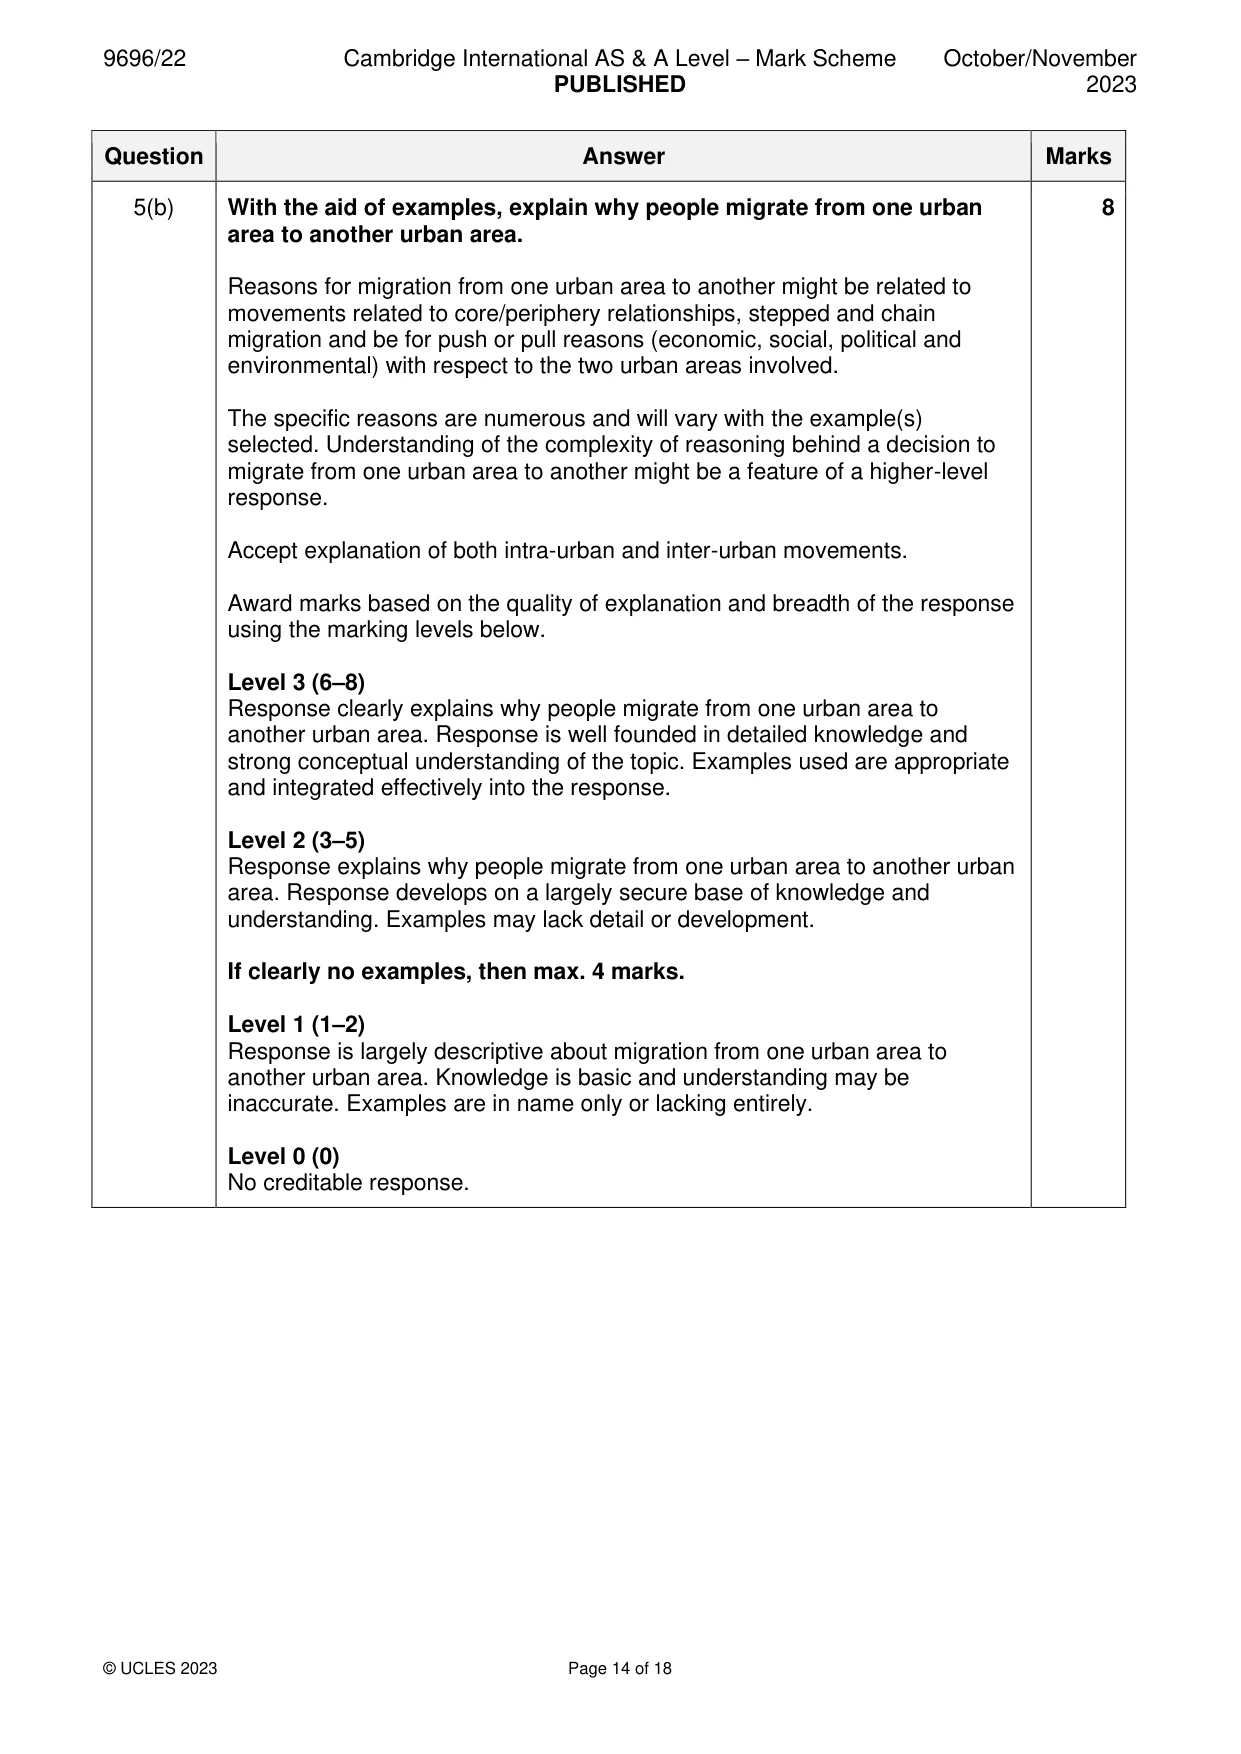
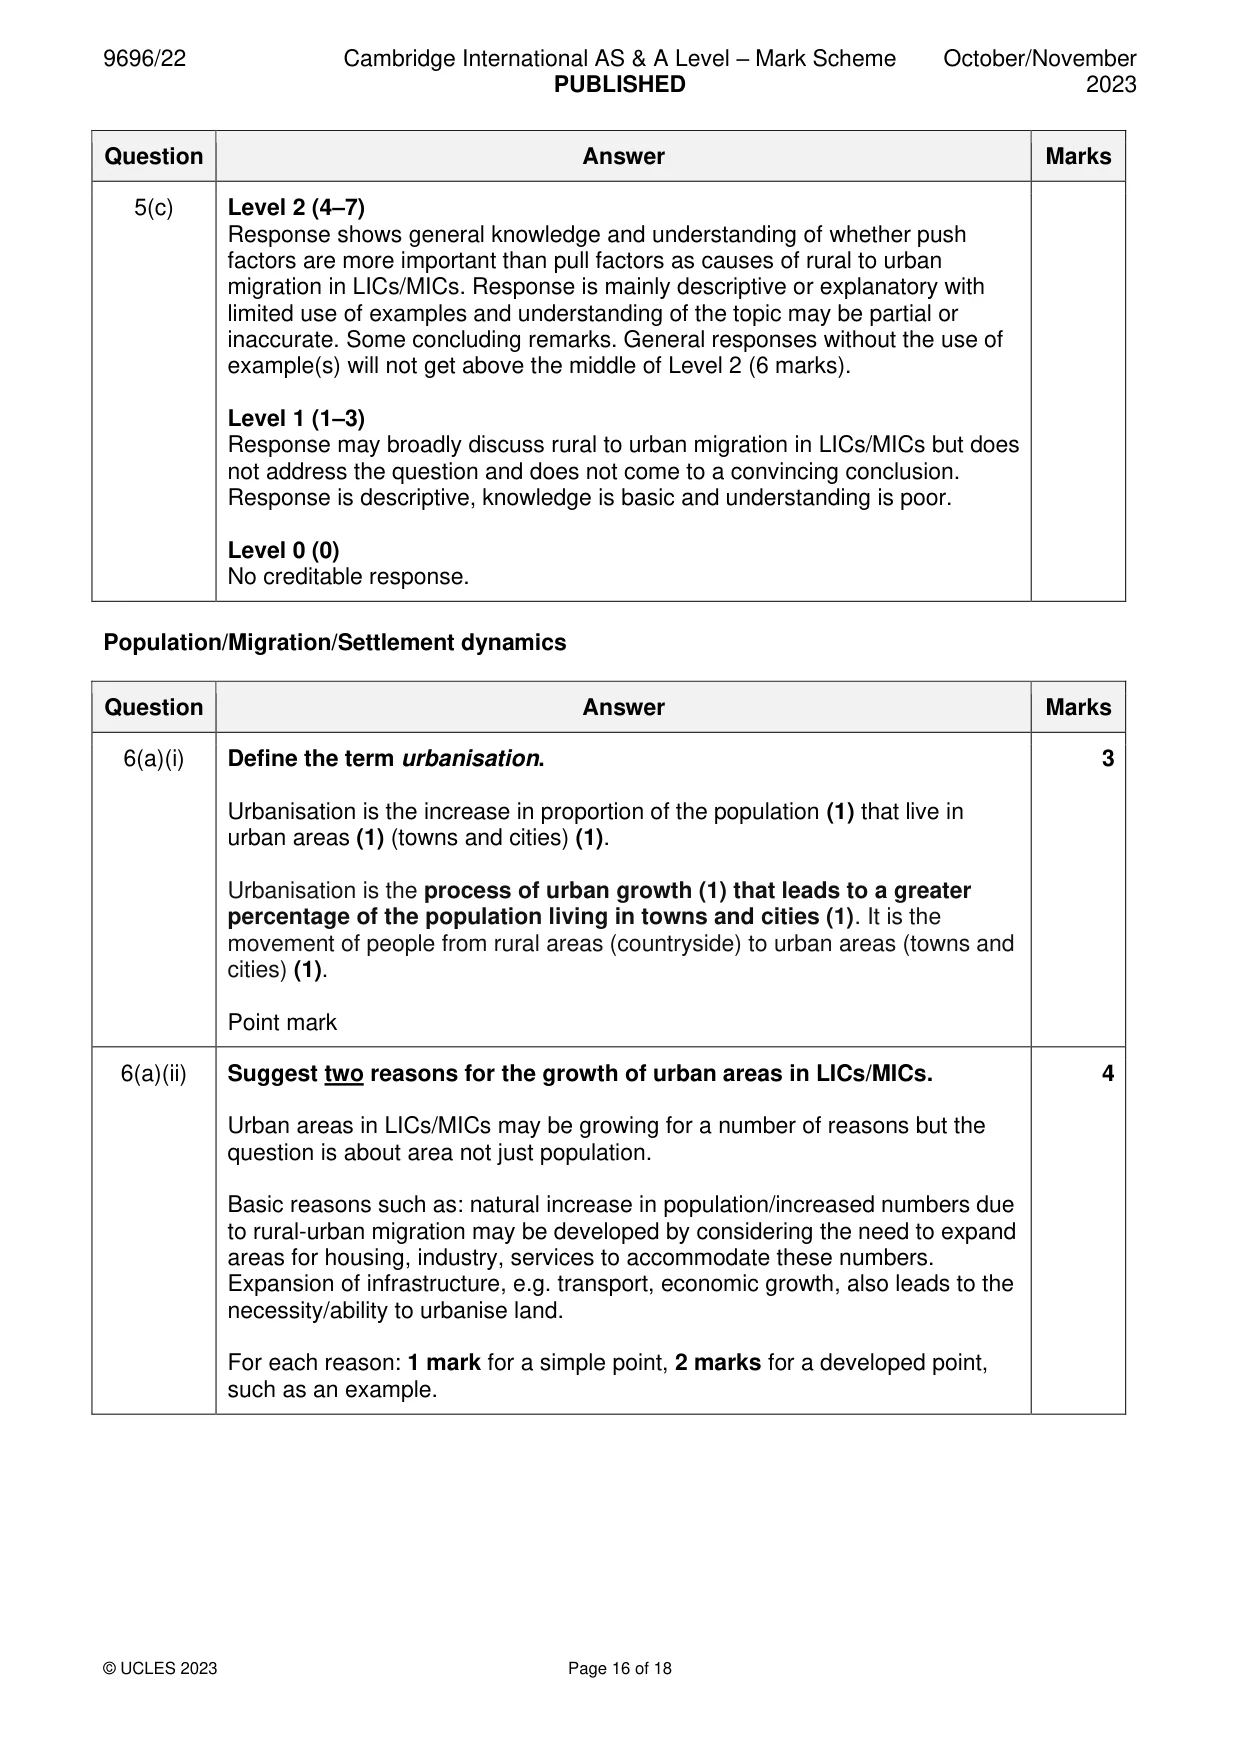
Mark scheme: 5(a)(i) Define the term migration. 2 Migration may be described as: a change of residence (1) for a duration of one year or more (1). 5(a)(ii) Describe one human constraint and one physical constraint to 5 migration. Constraints might include: • Human: cost, dangers on the journey, immigration and emigration laws, differences in language/culture, poor health, age, family ties, lack of transport, other • Physical: distance, floods, droughts, water bodies, mass movements, deserts, mountains, forests, other Some constraints have both human and physical elements such as the perception of danger crossing a desert. For each constraint point mark 3+2/2+3: 1 mark for a simple point, 2/3 marks for a developed point, such as an example, up to the maximum. 5(b) With the aid of examples, explain why people migrate from one urban 8 area to another urban area. Reasons for migration from one urban area to another might be related to movements related to core/periphery relationships, stepped and chain migration and be for push or pull reasons (economic, social, political and environmental) with respect to the two urban areas involved. The specific reasons are numerous and will vary with the example(s) selected. Understanding of the complexity of reasoning behind a decision to migrate from one urban area to another might be a feature of a higher-level response. Accept explanation of both intra-urban and inter-urban movements. Award marks based on the quality of explanation and breadth of the response using the marking levels below. Level 3 (6–8) Response clearly explains why people migrate from one urban area to another urban area. Response is well founded in detailed knowledge and strong conceptual understanding of the topic. Examples used are appropriate and integrated effectively into the response. Level 2 (3–5) Response explains why people migrate from one urban area to another urban area. Response develops on a largely secure base of knowledge and understanding. Examples may lack detail or development. If clearly no examples, then max. 4 marks. Level 1 (1–2) Response is largely descriptive about migration from one urban area to another urban area. Knowledge is basic and understanding may be inaccurate. Examples are in name only or lacking entirely. Level 0 (0) No creditable response. 5(c) ‘Push factors are more important than pull factors as causes of rural to 15 urban migration in LICs/MICs.’ With the aid of examples, how far do you agree with this statement? Candidates should consider the statement: push factors are more important than pull factors as causes of rural to urban migration in LICs/MICs and come to a view about how far they agree. There should be a reasonable balance of push factors from rural areas and pull factors of urban areas and a clear context of LIC/MIC. Rural push factors might include (economic, social, political and environmental): • Poverty • Employment issues • Poor service provision and amenities • Rapid population growth • Mechanisation of agriculture • Insecurity • Disease outbreak • Drought/floods • Other Urban pull factors might include (economic, social, political and environmental): • Higher wages • Employment opportunities and variety of these • Access to higher levels of education • Provision/proximity of services and amenities such as health • Security • Other A characteristic of a higher-level response might be that the candidate considers the complexity of the reasons for migration and/or differentiates between places, migrants or considers temporal aspects. Award marks based on the quality of the response using the marking levels below. Level 4 (12–15) Response thoroughly assesses the extent to which push factors are more important than pull factors as causes of rural to urban migration in LICs/MICs. Examples used are appropriate and integrated effectively into the response. Response is well founded in detailed knowledge and strong conceptual understanding of the topic. Level 3 (8–11) Response assesses the extent to which push factors are more important than pull factors as causes of rural to urban migration in LICs/MICs but may be unbalanced. Examples may lack detail or development. Response develops on a largely secure base of knowledge and understanding. 5(c) Level 2 (4–7) Response shows general knowledge and understanding of whether push factors are more important than pull factors as causes of rural to urban migration in LICs/MICs. Response is mainly descriptive or explanatory with limited use of examples and understanding of the topic may be partial or inaccurate. Some concluding remarks. General responses without the use of example(s) will not get above the middle of Level 2 (6 marks). Level 1 (1–3) Response may broadly discuss rural to urban migration in LICs/MICs but does not address the question and does not come to a convincing conclusion. Response is descriptive, knowledge is basic and understanding is poor. Level 0 (0) No creditable response. Population/Migration/Settlement dynamics
Q6 · Define the term urbanisation
6 (a) (i) Define the term urbanisation. [3] (ii) Suggest two reasons for the growth of urban areas in LICs/MICs. [4] (b) Using your case study of providing infrastructure for a city, explain the challenges faced in providing either power infrastructure or transport infrastructure. [8] (c) Evaluate the extent to which the challenges you explained in (b) have been overcome. [15]
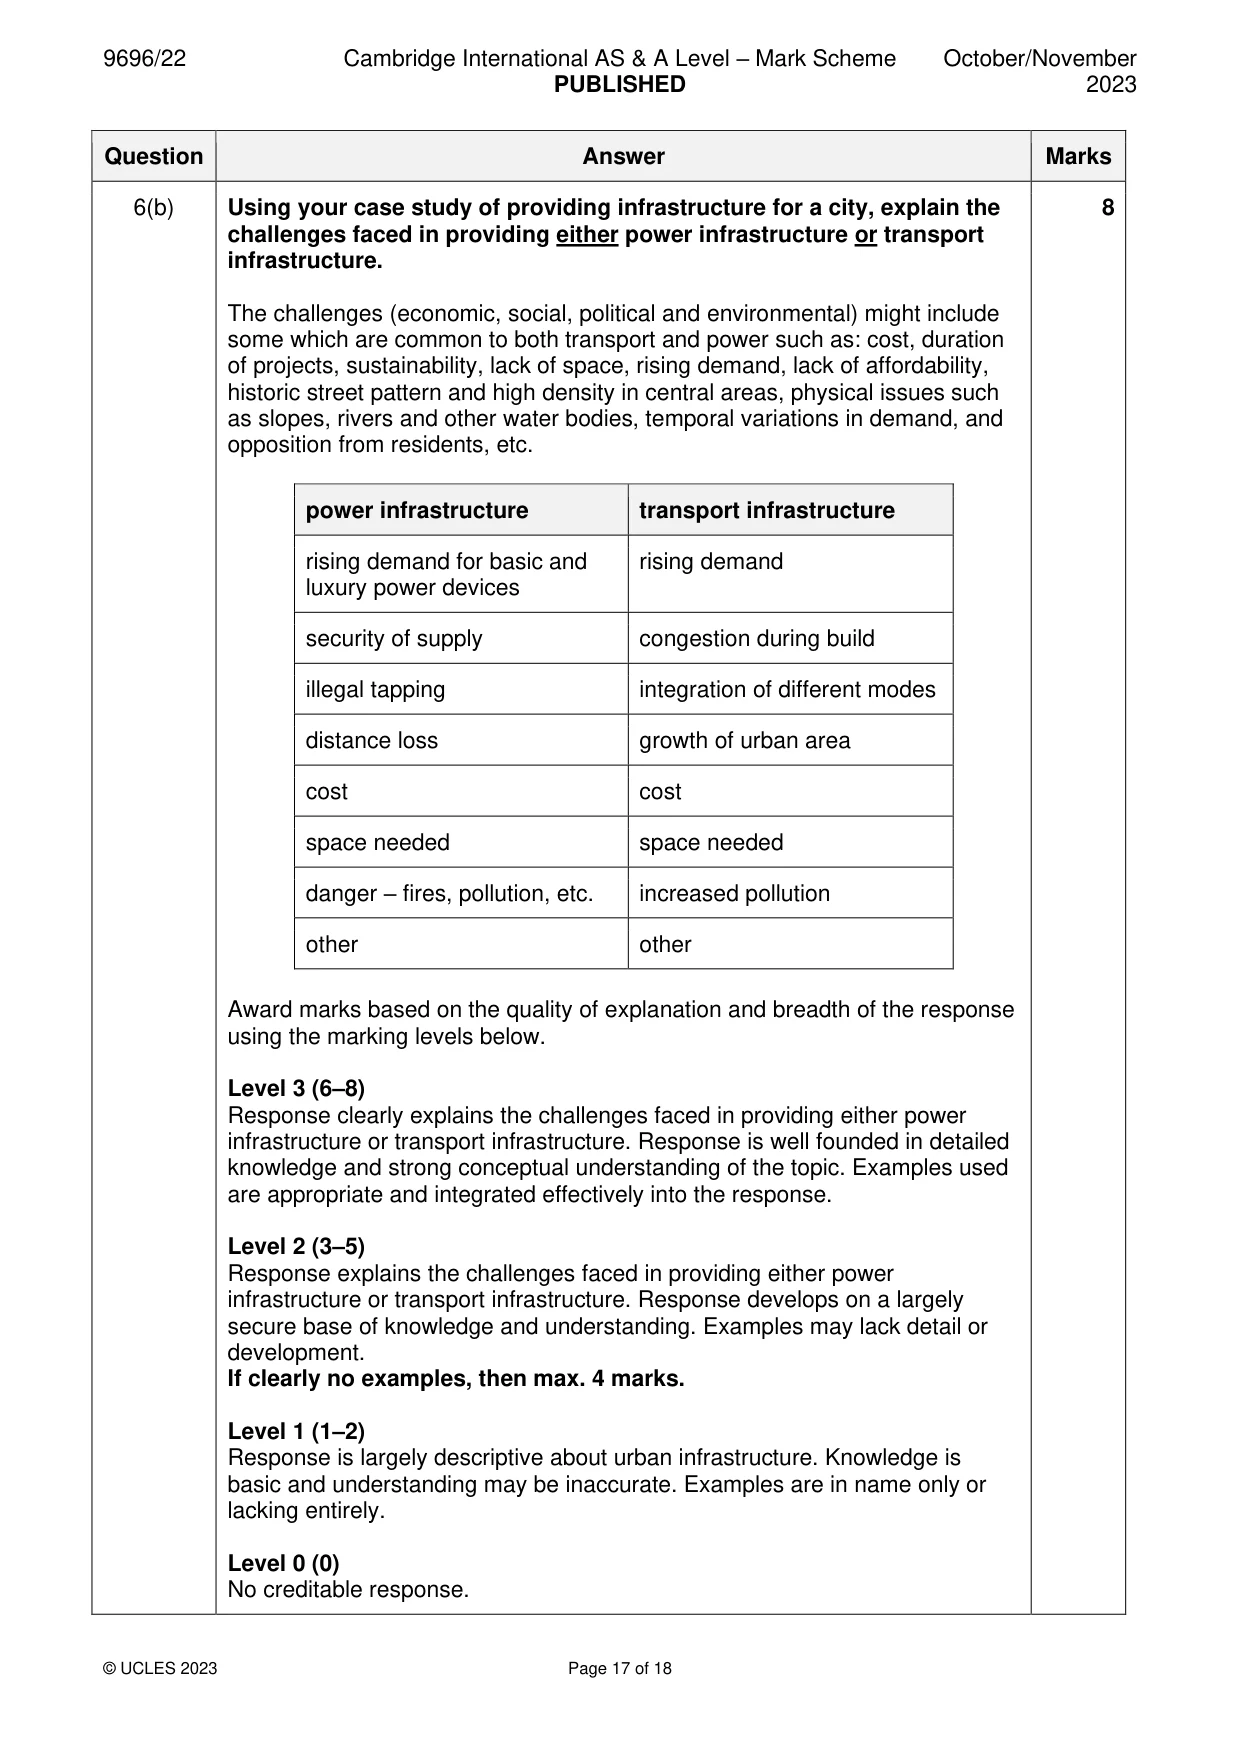
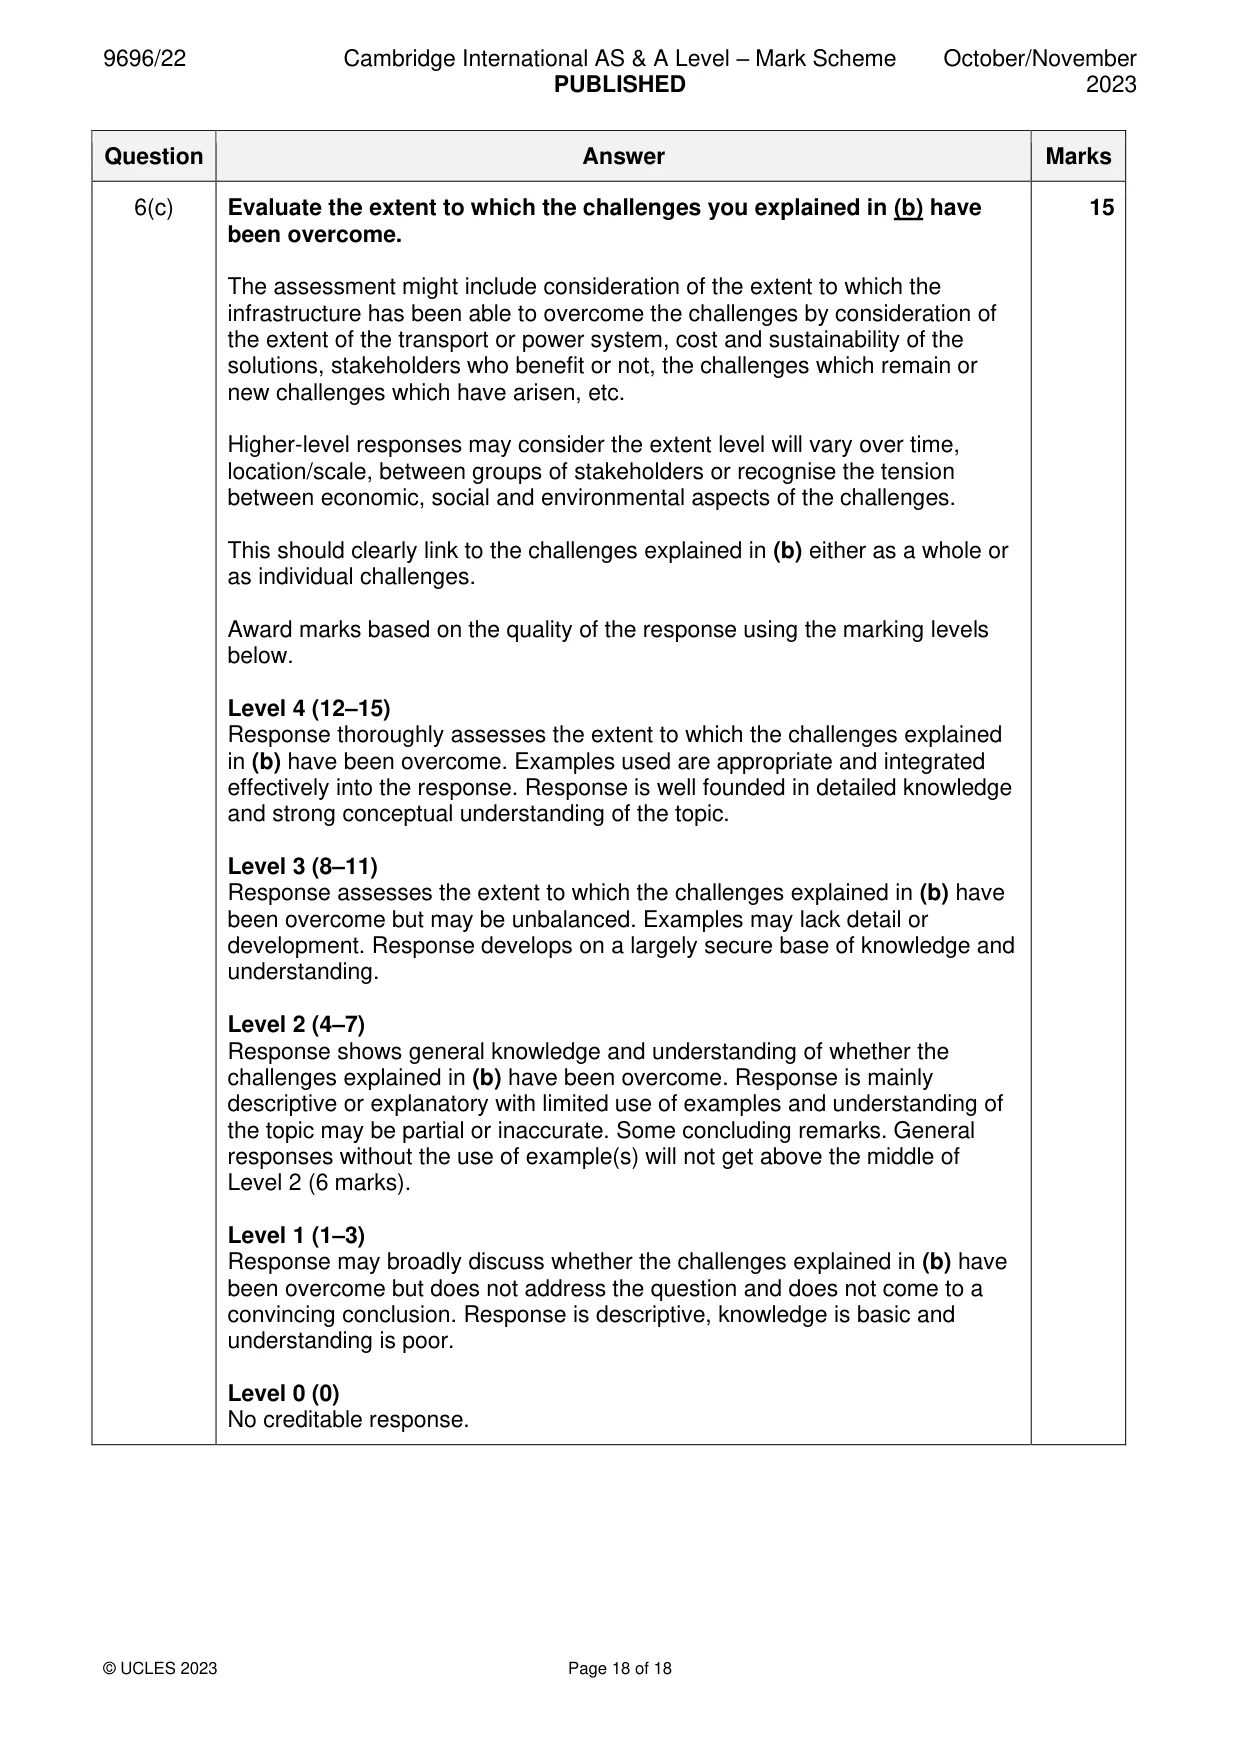
Mark scheme: 6(a)(i) Define the term urbanisation. 3 Urbanisation is the increase in proportion of the population (1) that live in urban areas (1) (towns and cities) (1). Urbanisation is the process of urban growth (1) that leads to a greater percentage of the population living in towns and cities (1). It is the movement of people from rural areas (countryside) to urban areas (towns and cities) (1). Point mark 6(a)(ii) Suggest two reasons for the growth of urban areas in LICs/MICs. 4 Urban areas in LICs/MICs may be growing for a number of reasons but the question is about area not just population. Basic reasons such as: natural increase in population/increased numbers due to rural-urban migration may be developed by considering the need to expand areas for housing, industry, services to accommodate these numbers. Expansion of infrastructure, e.g. transport, economic growth, also leads to the necessity/ability to urbanise land. For each reason: 1 mark for a simple point, 2 marks for a developed point, such as an example. 6(b) Using your case study of providing infrastructure for a city, explain the 8 challenges faced in providing either power infrastructure or transport infrastructure. The challenges (economic, social, political and environmental) might include some which are common to both transport and power such as: cost, duration of projects, sustainability, lack of space, rising demand, lack of affordability, historic street pattern and high density in central areas, physical issues such as slopes, rivers and other water bodies, temporal variations in demand, and opposition from residents, etc. power infrastructure transport infrastructure rising demand for basic and rising demand luxury power devices security of supply congestion during build illegal tapping integration of different modes distance loss growth of urban area cost cost space needed space needed danger – fires, pollution, etc. increased pollution other other Award marks based on the quality of explanation and breadth of the response using the marking levels below. Level 3 (6–8) Response clearly explains the challenges faced in providing either power infrastructure or transport infrastructure. Response is well founded in detailed knowledge and strong conceptual understanding of the topic. Examples used are appropriate and integrated effectively into the response. Level 2 (3–5) Response explains the challenges faced in providing either power infrastructure or transport infrastructure. Response develops on a largely secure base of knowledge and understanding. Examples may lack detail or development. If clearly no examples, then max. 4 marks. Level 1 (1–2) Response is largely descriptive about urban infrastructure. Knowledge is basic and understanding may be inaccurate. Examples are in name only or lacking entirely. Level 0 (0) No creditable response. 6(c) Evaluate the extent to which the challenges you explained in (b) have 15 been overcome. The assessment might include consideration of the extent to which the infrastructure has been able to overcome the challenges by consideration of the extent of the transport or power system, cost and sustainability of the solutions, stakeholders who benefit or not, the challenges which remain or new challenges which have arisen, etc. Higher-level responses may consider the extent level will vary over time, location/scale, between groups of stakeholders or recognise the tension between economic, social and environmental aspects of the challenges. This should clearly link to the challenges explained in (b) either as a whole or as individual challenges. Award marks based on the quality of the response using the marking levels below. Level 4 (12–15) Response thoroughly assesses the extent to which the challenges explained in (b) have been overcome. Examples used are appropriate and integrated effectively into the response. Response is well founded in detailed knowledge and strong conceptual understanding of the topic. Level 3 (8–11) Response assesses the extent to which the challenges explained in (b) have been overcome but may be unbalanced. Examples may lack detail or development. Response develops on a largely secure base of knowledge and understanding. Level 2 (4–7) Response shows general knowledge and understanding of whether the challenges explained in (b) have been overcome. Response is mainly descriptive or explanatory with limited use of examples and understanding of the topic may be partial or inaccurate. Some concluding remarks. General responses without the use of example(s) will not get above the middle of Level 2 (6 marks). Level 1 (1–3) Response may broadly discuss whether the challenges explained in (b) have been overcome but does not address the question and does not come to a convincing conclusion. Response is descriptive, knowledge is basic and understanding is poor. Level 0 (0) No creditable response.
What was in this paper
The subtopics covered by these 6 questions, and how many questions each got. Open one in a new tab to see every Cambridge question on it.
What you needed in this session
Cambridge’s own grade thresholds for 2023 Oct/Nov, Paper 2 · Variant 2. A higher threshold means an easier paper — the bar moves with how the cohort did.