Cambridge A Level Geography 9696 — 2024 May/June Paper 2 · Variant 2
9696/22/M/J/24 · 60 marks · ≈68 min
The question paper and its mark scheme, free to read here and free to download. This is Cambridge’s own paper, exactly as it was sat.
Question paper4 pages

Mark scheme19 pages
Answers below. Sit the paper first if you are practising.

Paper as text
Question paper, page 1
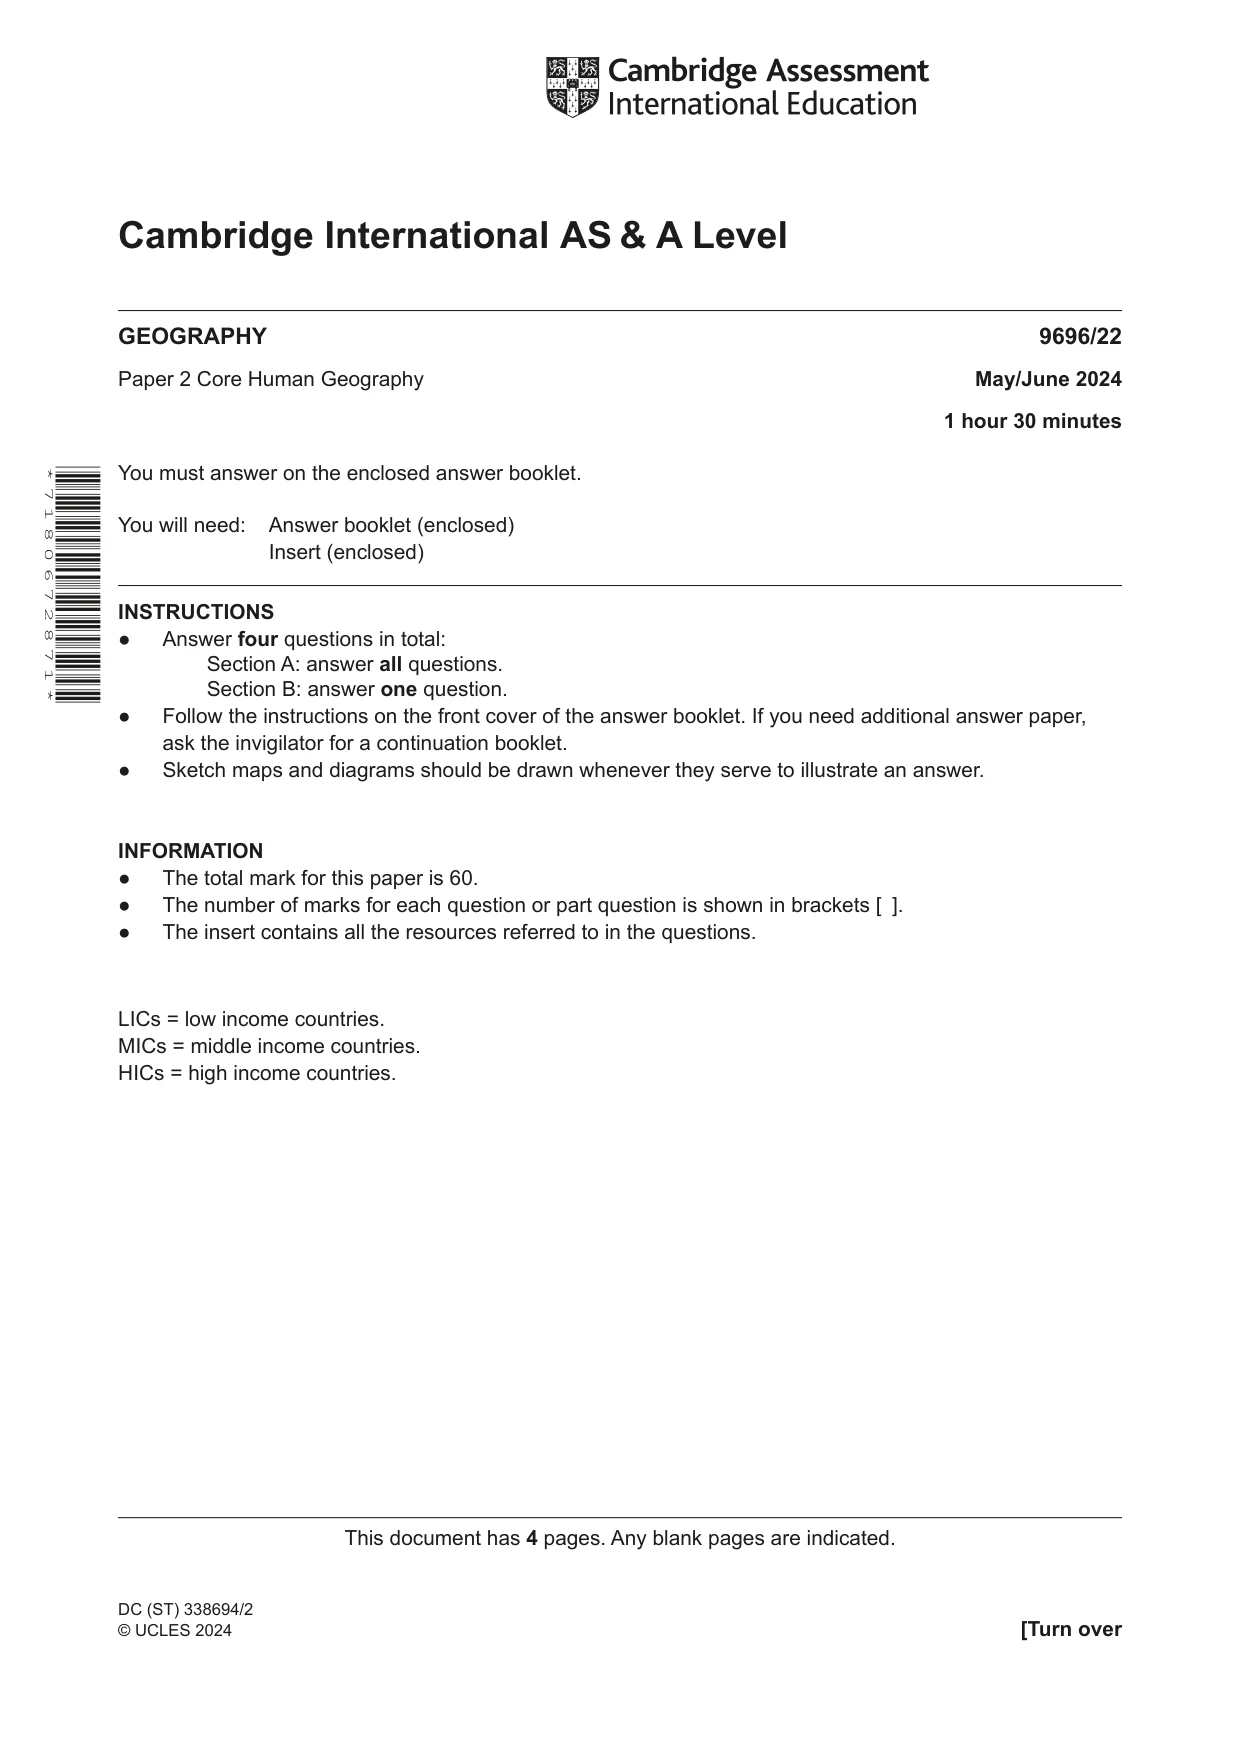
This document has 4 pages. Any blank pages are indicated. [Turn over Cambridge International AS & A Level GEOGRAPHY 9696/22 Paper 2 Core Human Geography May/June 2024 1 hour 30 minutes You must answer on the enclosed answer booklet. You will need: Answer booklet (enclosed) Insert (enclosed) INSTRUCTIONS ● Answer four questions in total: Section A: answer all questions. Section B: answer one question. ● Follow the instructions on the front cover of the answer booklet. If you need additional answer paper, ask the invigilator for a continuation booklet. ● Sketch maps and diagrams should be drawn whenever they serve to illustrate an answer. INFORMATION ● The total mark for this paper is 60. ● The number of marks for each question or part question is shown in brackets [ ]. ● The insert contains all the resources referred to in the questions. LICs = low income countries. MICs = middle income countries. HICs = high income countries. * 7 1 8 0 6 7 2 8 7 1 * DC (ST) 338694/2 © UCLES 2024
Question paper, page 2
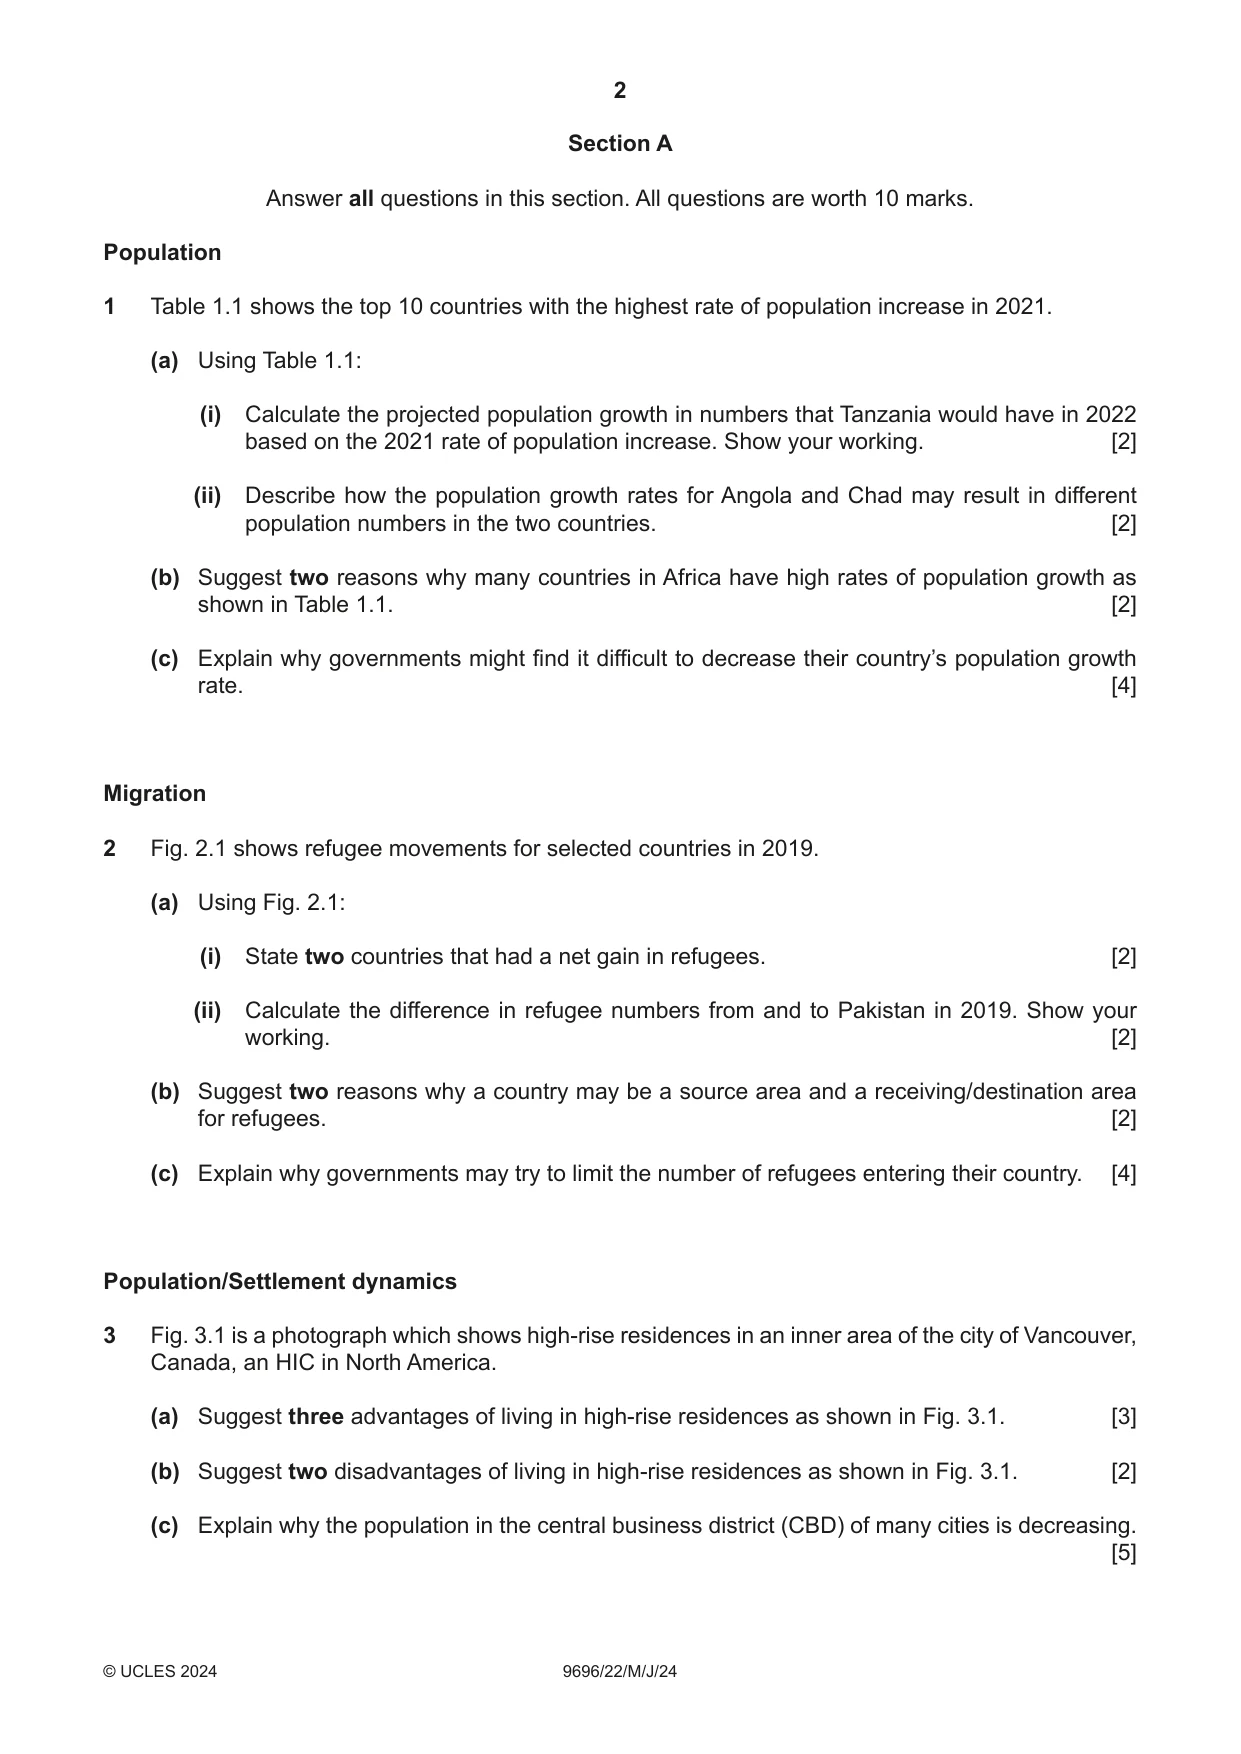
2 9696/22/M/J/24 © UCLES 2024 Section A Answer all questions in this section. All questions are worth 10 marks. Population 1 Table 1.1 shows the top 10 countries with the highest rate of population increase in 2021. (a) Using Table 1.1: (i) Calculate the projected population growth in numbers that Tanzania would have in 2022 based on the 2021 rate of population increase. Show your working. [2] (ii) Describe how the population growth rates for Angola and Chad may result in different population numbers in the two countries. [2] (b) Suggest two reasons why many countries in Africa have high rates of population growth as shown in Table 1.1. [2] (c) Explain why governments might find it difficult to decrease their country’s population growth rate. [4] Migration 2 Fig. 2.1 shows refugee movements for selected countries in 2019. (a) Using Fig. 2.1: (i) State two countries that had a net gain in refugees. [2] (ii) Calculate the difference in refugee numbers from and to Pakistan in 2019. Show your working. [2] (b) Suggest two reasons why a country may be a source area and a receiving/destination area for refugees. [2] (c) Explain why governments may try to limit the number of refugees entering their country. [4] Population/Settlement dynamics 3 Fig. 3.1 is a photograph which shows high‑rise residences in an inner area of the city of Vancouver, Canada, an HIC in North America. (a) Suggest three advantages of living in high‑rise residences as shown in Fig. 3.1. [3] (b) Suggest two disadvantages of living in high‑rise residences as shown in Fig. 3.1. [2] (c) Explain why the population in the central business district (CBD) of many cities is decreasing. [5]
Question paper, page 3
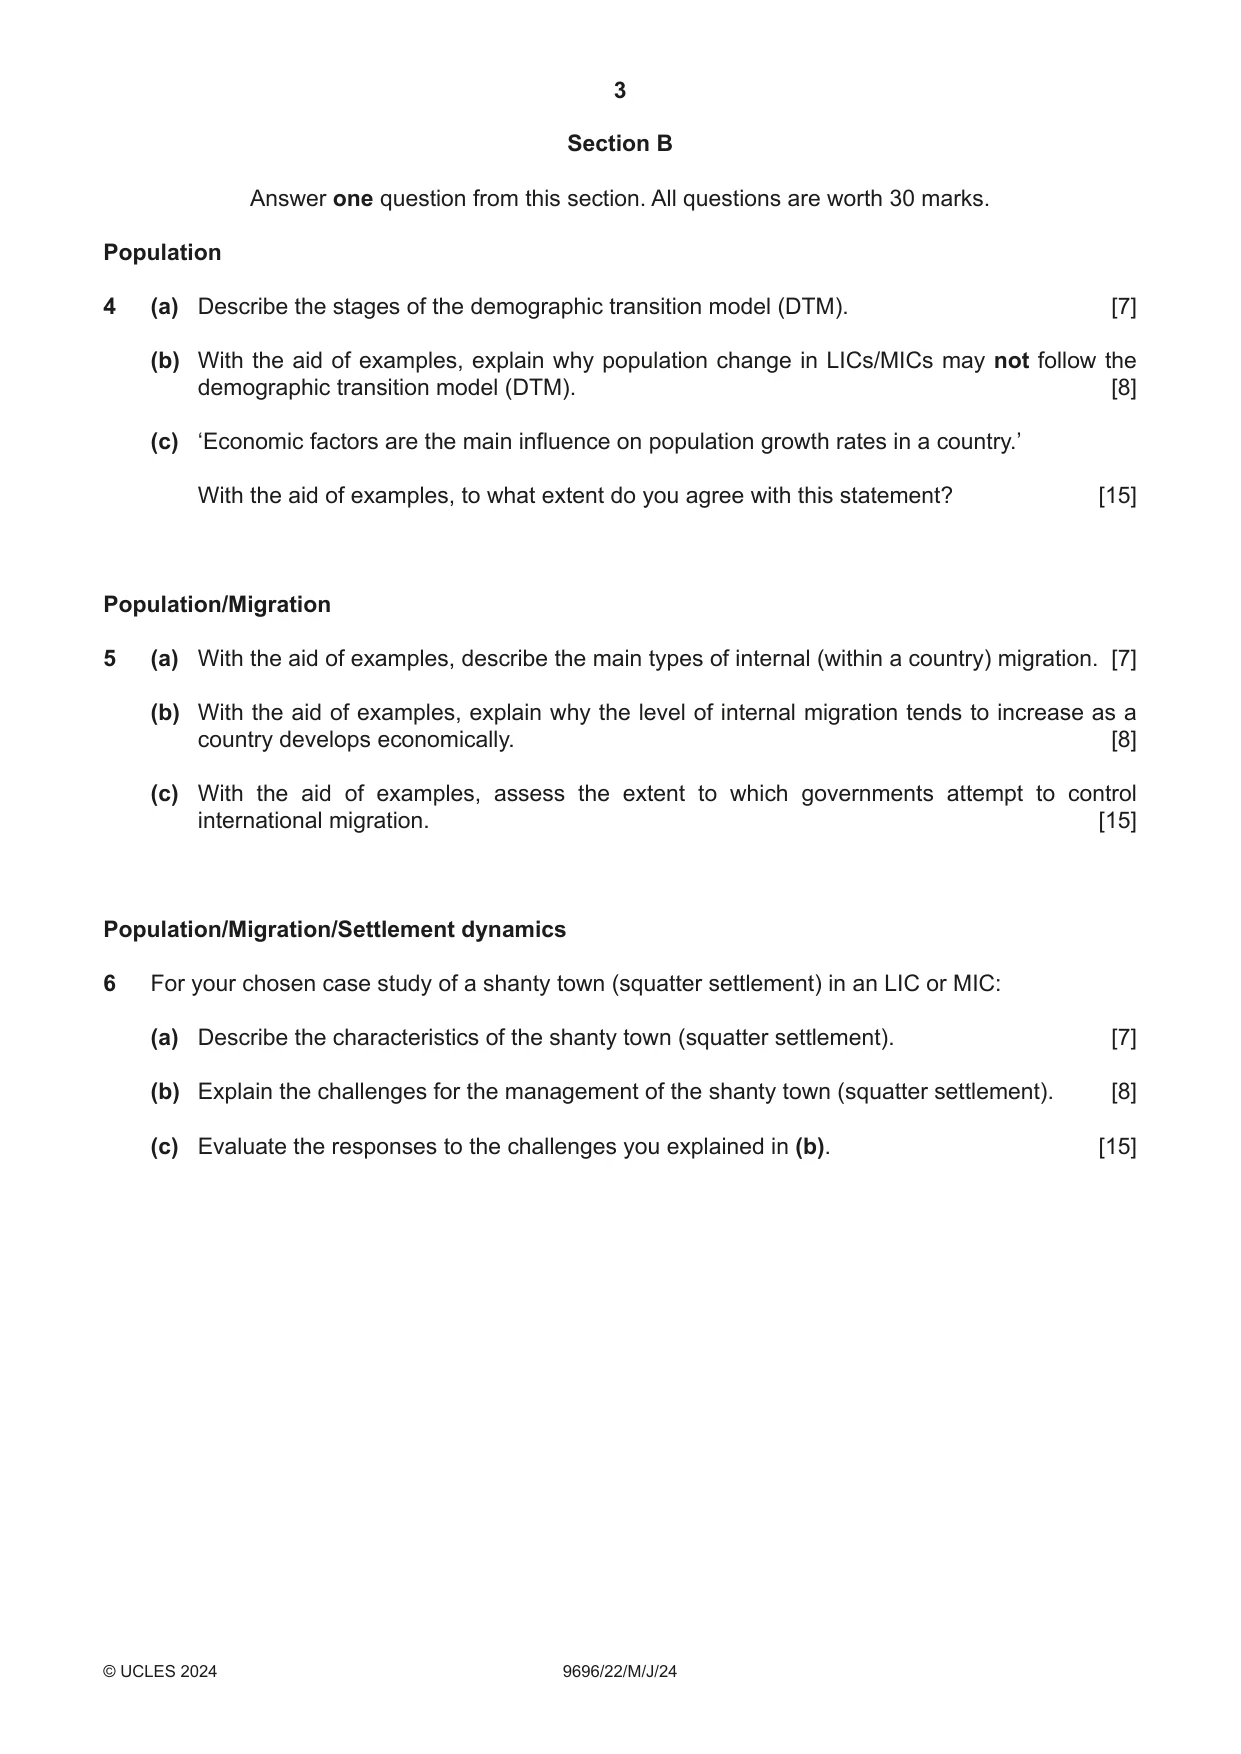
3 9696/22/M/J/24 © UCLES 2024 Section B Answer one question from this section. All questions are worth 30 marks. Population 4 (a) Describe the stages of the demographic transition model (DTM). [7] (b) With the aid of examples, explain why population change in LICs/MICs may not follow the demographic transition model (DTM). [8] (c) ‘Economic factors are the main influence on population growth rates in a country.’ With the aid of examples, to what extent do you agree with this statement? [15] Population/Migration 5 (a) With the aid of examples, describe the main types of internal (within a country) migration. [7] (b) With the aid of examples, explain why the level of internal migration tends to increase as a country develops economically. [8] (c) With the aid of examples, assess the extent to which governments attempt to control international migration. [15] Population/Migration/Settlement dynamics 6 For your chosen case study of a shanty town (squatter settlement) in an LIC or MIC: (a) Describe the characteristics of the shanty town (squatter settlement). [7] (b) Explain the challenges for the management of the shanty town (squatter settlement). [8] (c) Evaluate the responses to the challenges you explained in (b). [15]
Question paper, page 4
4 9696/22/M/J/24 © UCLES 2024 The boundaries and names shown, the designations used and the presentation of material on any maps contained in this question paper/insert do not imply official endorsement or acceptance by Cambridge Assessment International Education concerning the legal status of any country, territory, or area or any of its authorities, or of the delimitation of its frontiers or boundaries. Permission to reproduce items where third‑party owned material protected by copyright is included has been sought and cleared where possible. Every reasonable effort has been made by the publisher (UCLES) to trace copyright holders, but if any items requiring clearance have unwittingly been included, the publisher will be pleased to make amends at the earliest possible opportunity. To avoid the issue of disclosure of answer‑related information to candidates, all copyright acknowledgements are reproduced online in the Cambridge Assessment International Education Copyright Acknowledgements Booklet. This is produced for each series of examinations and is freely available to download at www.cambridgeinternational.org after the live examination series. Cambridge Assessment International Education is part of Cambridge Assessment. Cambridge Assessment is the brand name of the University of Cambridge Local Examinations Syndicate (UCLES), which is a department of the University of Cambridge. BLANK PAGE
Mark scheme, page 1
This document consists of 19 printed pages. © Cambridge University Press & Assessment 2024 [Turn over Cambridge International AS & A Level GEOGRAPHY 9696/22 Paper 2 Core Human Geography May/June 2024 MARK SCHEME Maximum Mark: 60 Published This mark scheme is published as an aid to teachers and candidates, to indicate the requirements of the examination. It shows the basis on which Examiners were instructed to award marks. It does not indicate the details of the discussions that took place at an Examiners’ meeting before marking began, which would have considered the acceptability of alternative answers. Mark schemes should be read in conjunction with the question paper and the Principal Examiner Report for Teachers. Cambridge International will not enter into discussions about these mark schemes. Cambridge International is publishing the mark schemes for the May/June 2024 series for most Cambridge IGCSE, Cambridge International A and AS Level and Cambridge Pre-U components, and some Cambridge O Level components.
Mark scheme, page 2
9696/22 Cambridge International AS & A Level – Mark Scheme PUBLISHED May/June 2024 © Cambridge University Press & Assessment 2024 Page 2 of 19 Generic Marking Principles These general marking principles must be applied by all examiners when marking candidate answers. They should be applied alongside the specific content of the mark scheme or generic level descriptions for a question. Each question paper and mark scheme will also comply with these marking principles. GENERIC MARKING PRINCIPLE 1: Marks must be awarded in line with: the specific content of the mark scheme or the generic level descriptors for the question the specific skills defined in the mark scheme or in the generic level descriptors for the question the standard of response required by a candidate as exemplified by the standardisation scripts. GENERIC MARKING PRINCIPLE 2: Marks awarded are always whole marks (not half marks, or other fractions). GENERIC MARKING PRINCIPLE 3: Marks must be awarded positively: marks are awarded for correct/valid answers, as defined in the mark scheme. However, credit is given for valid answers which go beyond the scope of the syllabus and mark scheme, referring to your Team Leader as appropriate marks are awarded when candidates clearly demonstrate what they know and can do marks are not deducted for errors marks are not deducted for omissions answers should only be judged on the quality of spelling, punctuation and grammar when these features are specifically assessed by the question as indicated by the mark scheme. The meaning, however, should be unambiguous. GENERIC MARKING PRINCIPLE 4: Rules must be applied consistently, e.g. in situations where candidates have not followed instructions or in the application of generic level descriptors. GENERIC MARKING PRINCIPLE 5: Marks should be awarded using the full range of marks defined in the mark scheme for the question (however; the use of the full mark range may be limited according to the quality of the candidate responses seen). GENERIC MARKING PRINCIPLE 6: Marks awarded are based solely on the requirements as defined in the mark scheme. Marks should not be awarded with grade thresholds or grade descriptors in mind.
Mark scheme, page 3
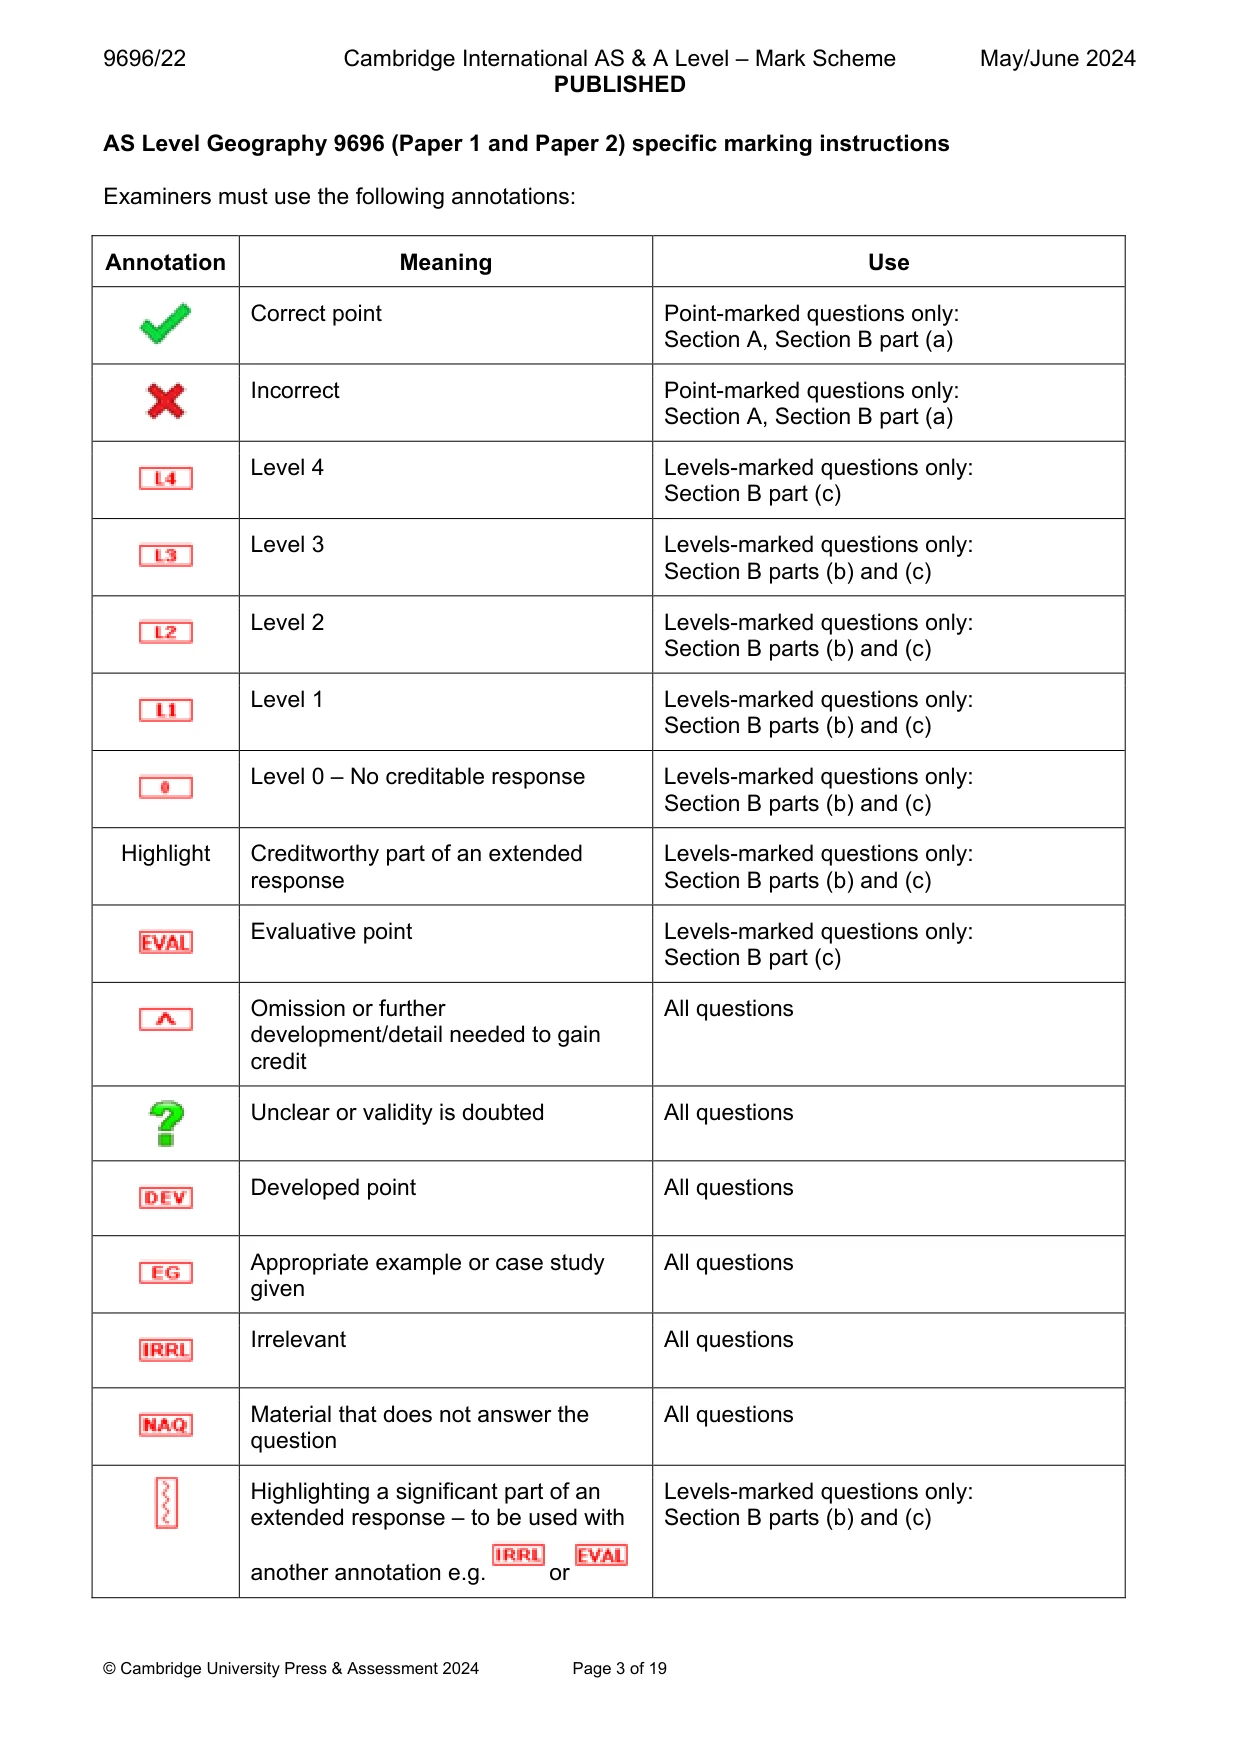
9696/22 Cambridge International AS & A Level – Mark Scheme PUBLISHED May/June 2024 © Cambridge University Press & Assessment 2024 Page 3 of 19 AS Level Geography 9696 (Paper 1 and Paper 2) specific marking instructions Examiners must use the following annotations: Annotation Meaning Use Correct point Point-marked questions only: Section A, Section B part (a) Incorrect Point-marked questions only: Section A, Section B part (a) Level 4 Levels-marked questions only: Section B part (c) Level 3 Levels-marked questions only: Section B parts (b) and (c) Level 2 Levels-marked questions only: Section B parts (b) and (c) Level 1 Levels-marked questions only: Section B parts (b) and (c) Level 0 – No creditable response Levels-marked questions only: Section B parts (b) and (c) Highlight Creditworthy part of an extended response Levels-marked questions only: Section B parts (b) and (c) Evaluative point Levels-marked questions only: Section B part (c) Omission or further development/detail needed to gain credit All questions Unclear or validity is doubted All questions Developed point All questions Appropriate example or case study given All questions Irrelevant All questions Material that does not answer the question All questions Highlighting a significant part of an extended response – to be used with another annotation e.g. or Levels-marked questions only: Section B parts (b) and (c)
Mark scheme, page 4
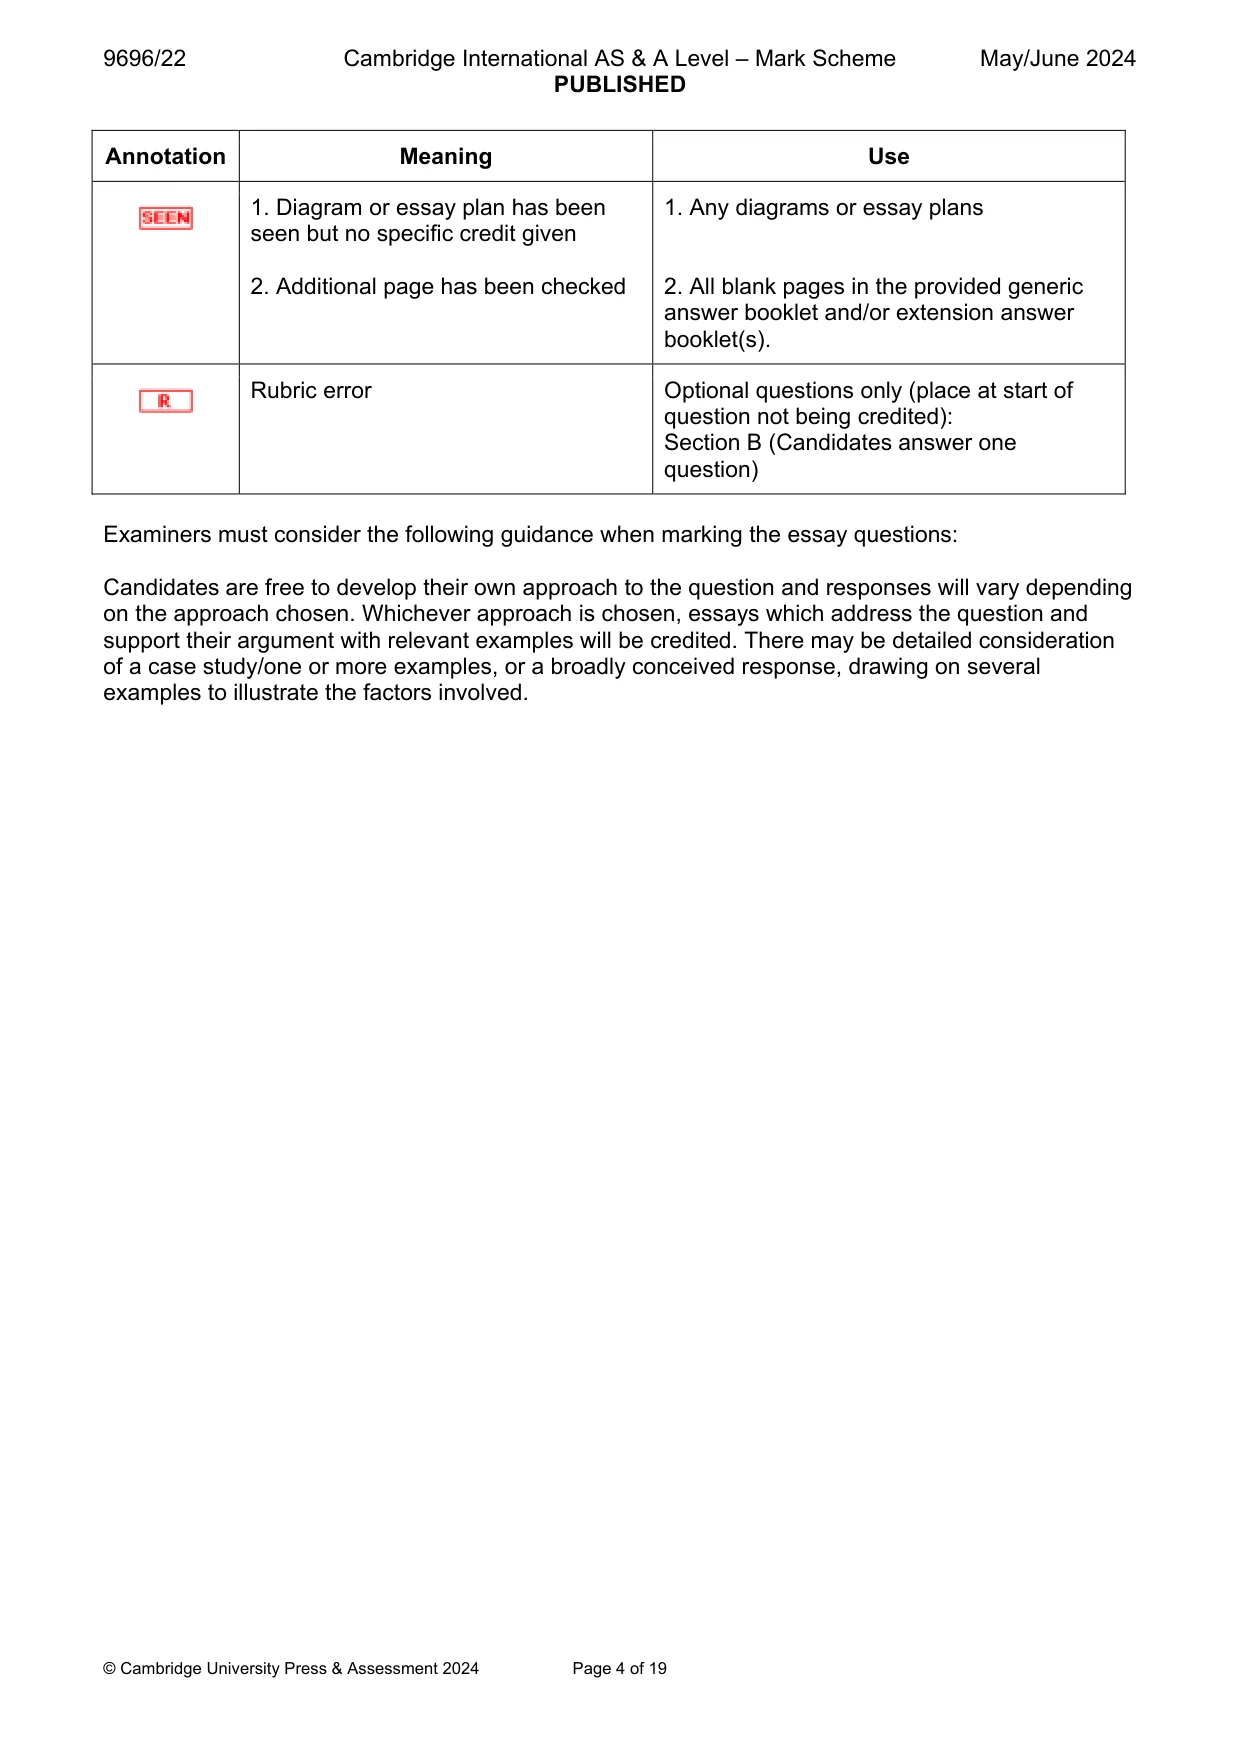
9696/22 Cambridge International AS & A Level – Mark Scheme PUBLISHED May/June 2024 © Cambridge University Press & Assessment 2024 Page 4 of 19 Annotation Meaning Use 1. Diagram or essay plan has been seen but no specific credit given 2. Additional page has been checked 1. Any diagrams or essay plans 2. All blank pages in the provided generic answer booklet and/or extension answer booklet(s). Rubric error Optional questions only (place at start of question not being credited): Section B (Candidates answer one question) Examiners must consider the following guidance when marking the essay questions: Candidates are free to develop their own approach to the question and responses will vary depending on the approach chosen. Whichever approach is chosen, essays which address the question and support their argument with relevant examples will be credited. There may be detailed consideration of a case study/one or more examples, or a broadly conceived response, drawing on several examples to illustrate the factors involved.
Mark scheme, page 5
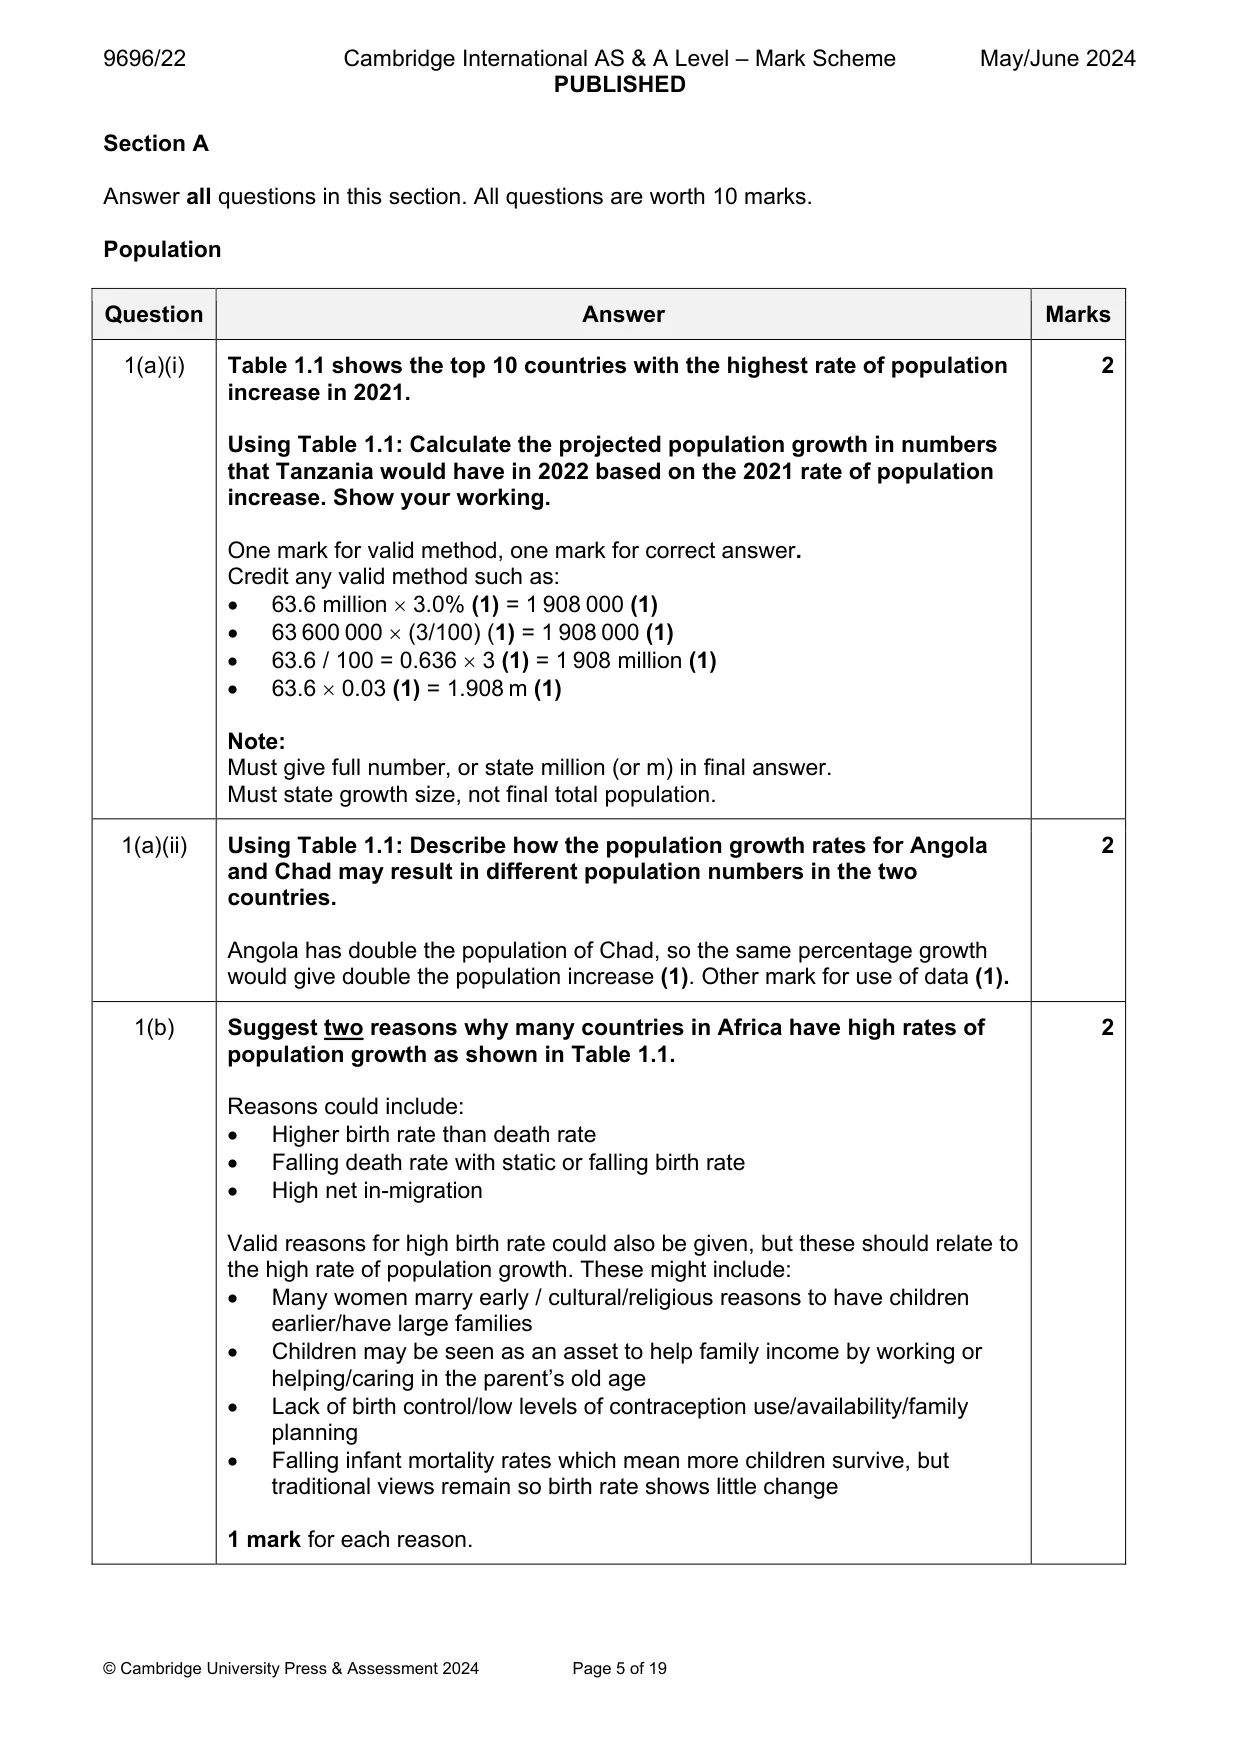
9696/22 Cambridge International AS & A Level – Mark Scheme PUBLISHED May/June 2024 © Cambridge University Press & Assessment 2024 Page 5 of 19 Section A Answer all questions in this section. All questions are worth 10 marks. Population Question Answer Marks 1(a)(i) Table 1.1 shows the top 10 countries with the highest rate of population increase in 2021. Using Table 1.1: Calculate the projected population growth in numbers that Tanzania would have in 2022 based on the 2021 rate of population increase. Show your working. One mark for valid method, one mark for correct answer. Credit any valid method such as: 63.6 million 3.0% (1) = 1 908 000 (1) 63 600 000 (3/100) (1) = 1 908 000 (1) 63.6 / 100 = 0.636 3 (1) = 1 908 million (1) 63.6 0.03 (1) = 1.908 m (1) Note: Must give full number, or state million (or m) in final answer. Must state growth size, not final total population. 2 1(a)(ii) Using Table 1.1: Describe how the population growth rates for Angola and Chad may result in different population numbers in the two countries. Angola has double the population of Chad, so the same percentage growth would give double the population increase (1). Other mark for use of data (1). 2 1(b) Suggest two reasons why many countries in Africa have high rates of population growth as shown in Table 1.1. Reasons could include: Higher birth rate than death rate Falling death rate with static or falling birth rate High net in-migration Valid reasons for high birth rate could also be given, but these should relate to the high rate of population growth. These might include: Many women marry early / cultural/religious reasons to have children earlier/have large families Children may be seen as an asset to help family income by working or helping/caring in the parent’s old age Lack of birth control/low levels of contraception use/availability/family planning Falling infant mortality rates which mean more children survive, but traditional views remain so birth rate shows little change 1 mark for each reason. 2
Mark scheme, page 6
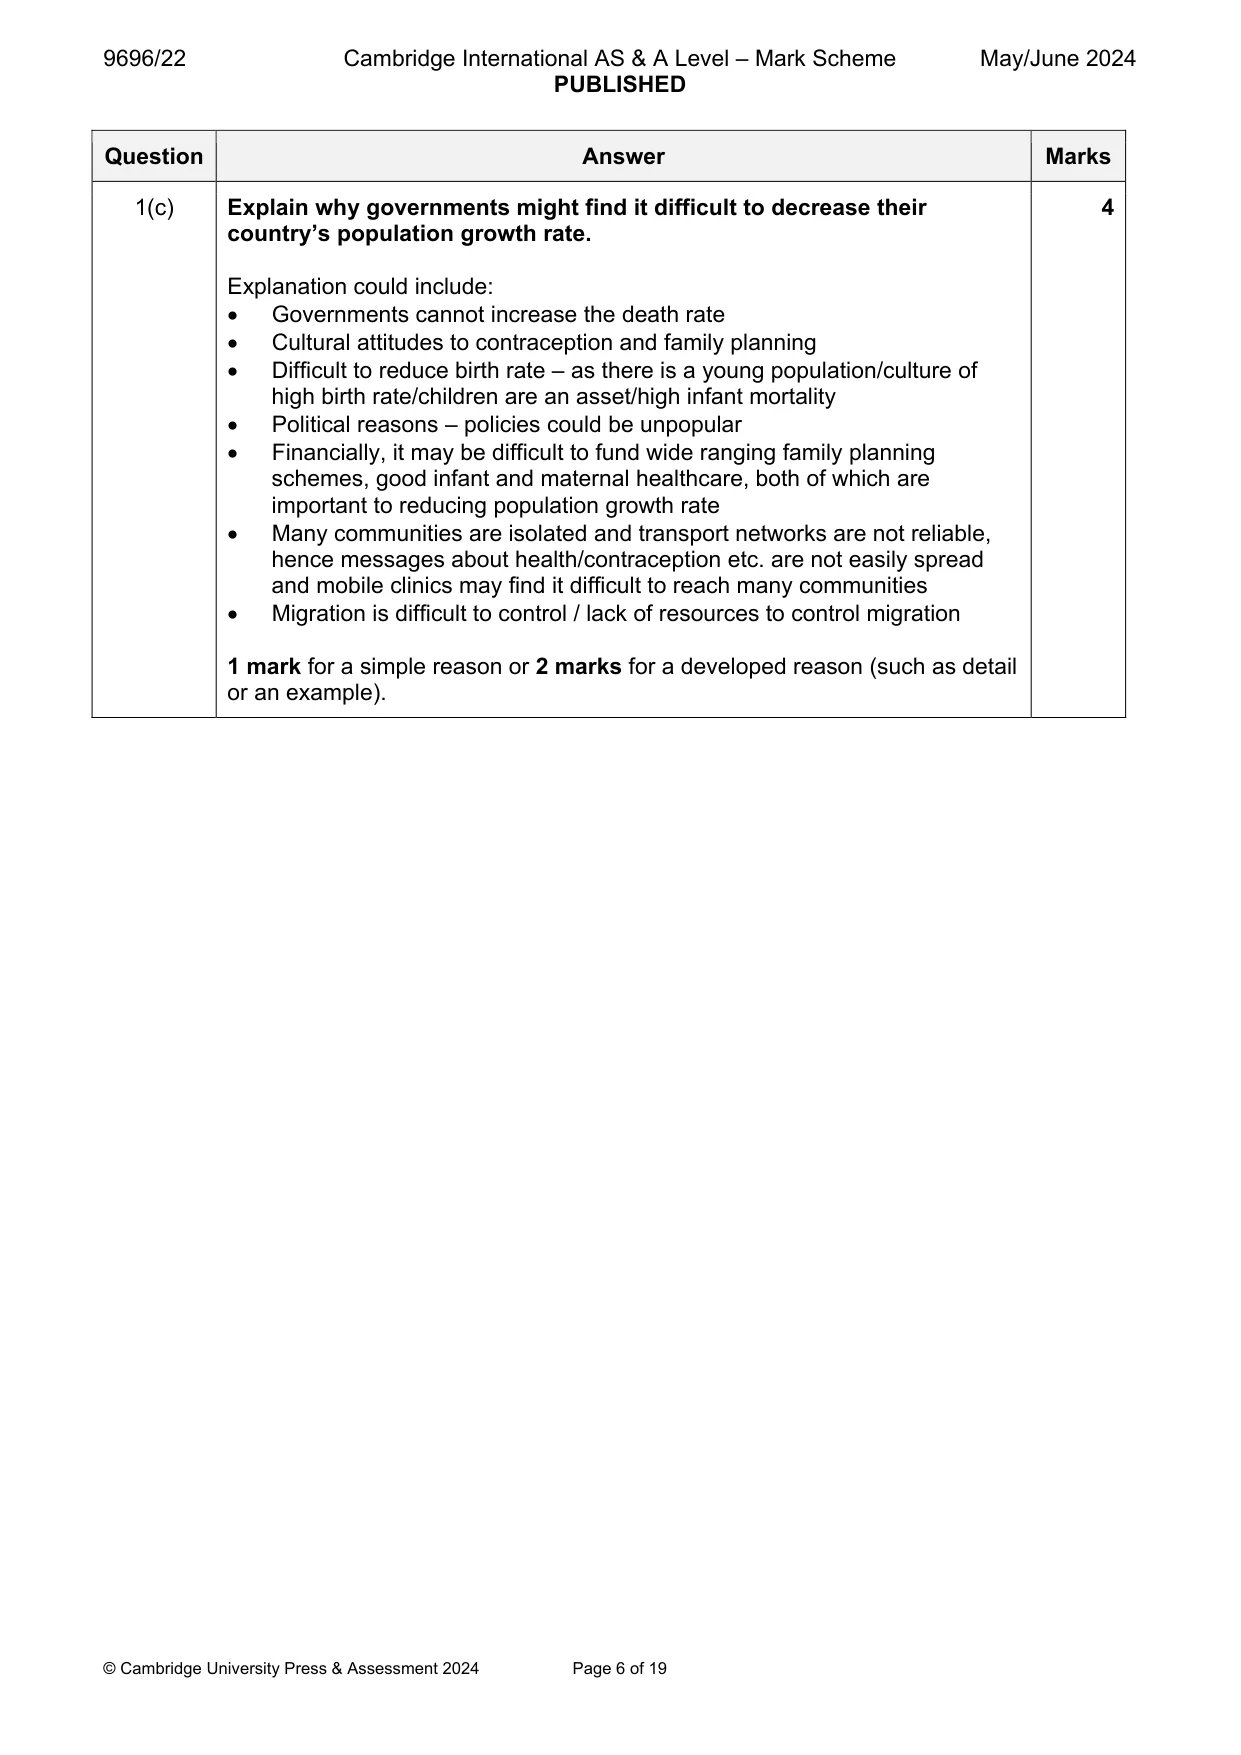
9696/22 Cambridge International AS & A Level – Mark Scheme PUBLISHED May/June 2024 © Cambridge University Press & Assessment 2024 Page 6 of 19 Question Answer Marks 1(c) Explain why governments might find it difficult to decrease their country’s population growth rate. Explanation could include: Governments cannot increase the death rate Cultural attitudes to contraception and family planning Difficult to reduce birth rate – as there is a young population/culture of high birth rate/children are an asset/high infant mortality Political reasons – policies could be unpopular Financially, it may be difficult to fund wide ranging family planning schemes, good infant and maternal healthcare, both of which are important to reducing population growth rate Many communities are isolated and transport networks are not reliable, hence messages about health/contraception etc. are not easily spread and mobile clinics may find it difficult to reach many communities Migration is difficult to control / lack of resources to control migration 1 mark for a simple reason or 2 marks for a developed reason (such as detail or an example). 4
Mark scheme, page 7
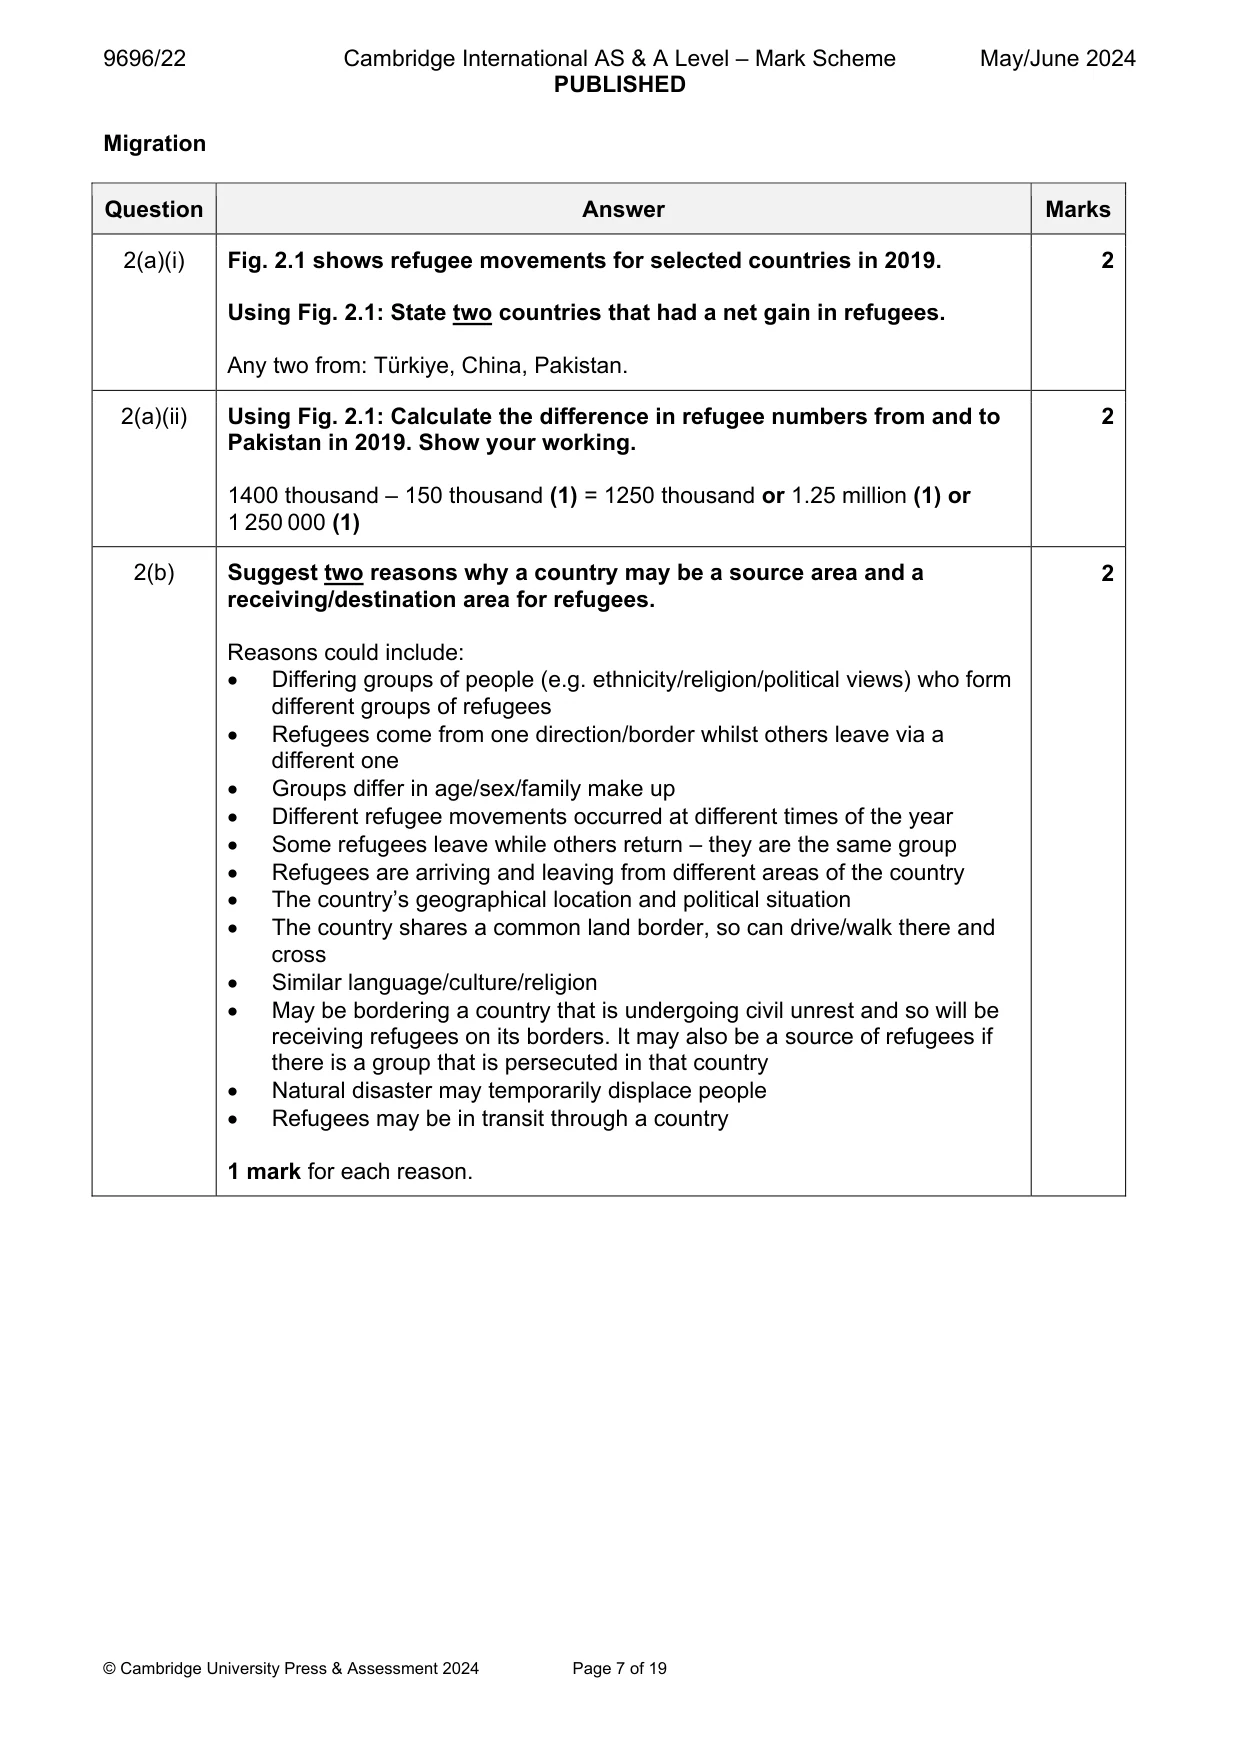
9696/22 Cambridge International AS & A Level – Mark Scheme PUBLISHED May/June 2024 © Cambridge University Press & Assessment 2024 Page 7 of 19 Migration Question Answer Marks 2(a)(i) Fig. 2.1 shows refugee movements for selected countries in 2019. Using Fig. 2.1: State two countries that had a net gain in refugees. Any two from: Türkiye, China, Pakistan. 2 2(a)(ii) Using Fig. 2.1: Calculate the difference in refugee numbers from and to Pakistan in 2019. Show your working. 1400 thousand – 150 thousand (1) = 1250 thousand or 1.25 million (1) or 1 250 000 (1) 2 2(b) Suggest two reasons why a country may be a source area and a receiving/destination area for refugees. Reasons could include: Differing groups of people (e.g. ethnicity/religion/political views) who form different groups of refugees Refugees come from one direction/border whilst others leave via a different one Groups differ in age/sex/family make up Different refugee movements occurred at different times of the year Some refugees leave while others return – they are the same group Refugees are arriving and leaving from different areas of the country The country’s geographical location and political situation The country shares a common land border, so can drive/walk there and cross Similar language/culture/religion May be bordering a country that is undergoing civil unrest and so will be receiving refugees on its borders. It may also be a source of refugees if there is a group that is persecuted in that country Natural disaster may temporarily displace people Refugees may be in transit through a country 1 mark for each reason. 2
Mark scheme, page 8
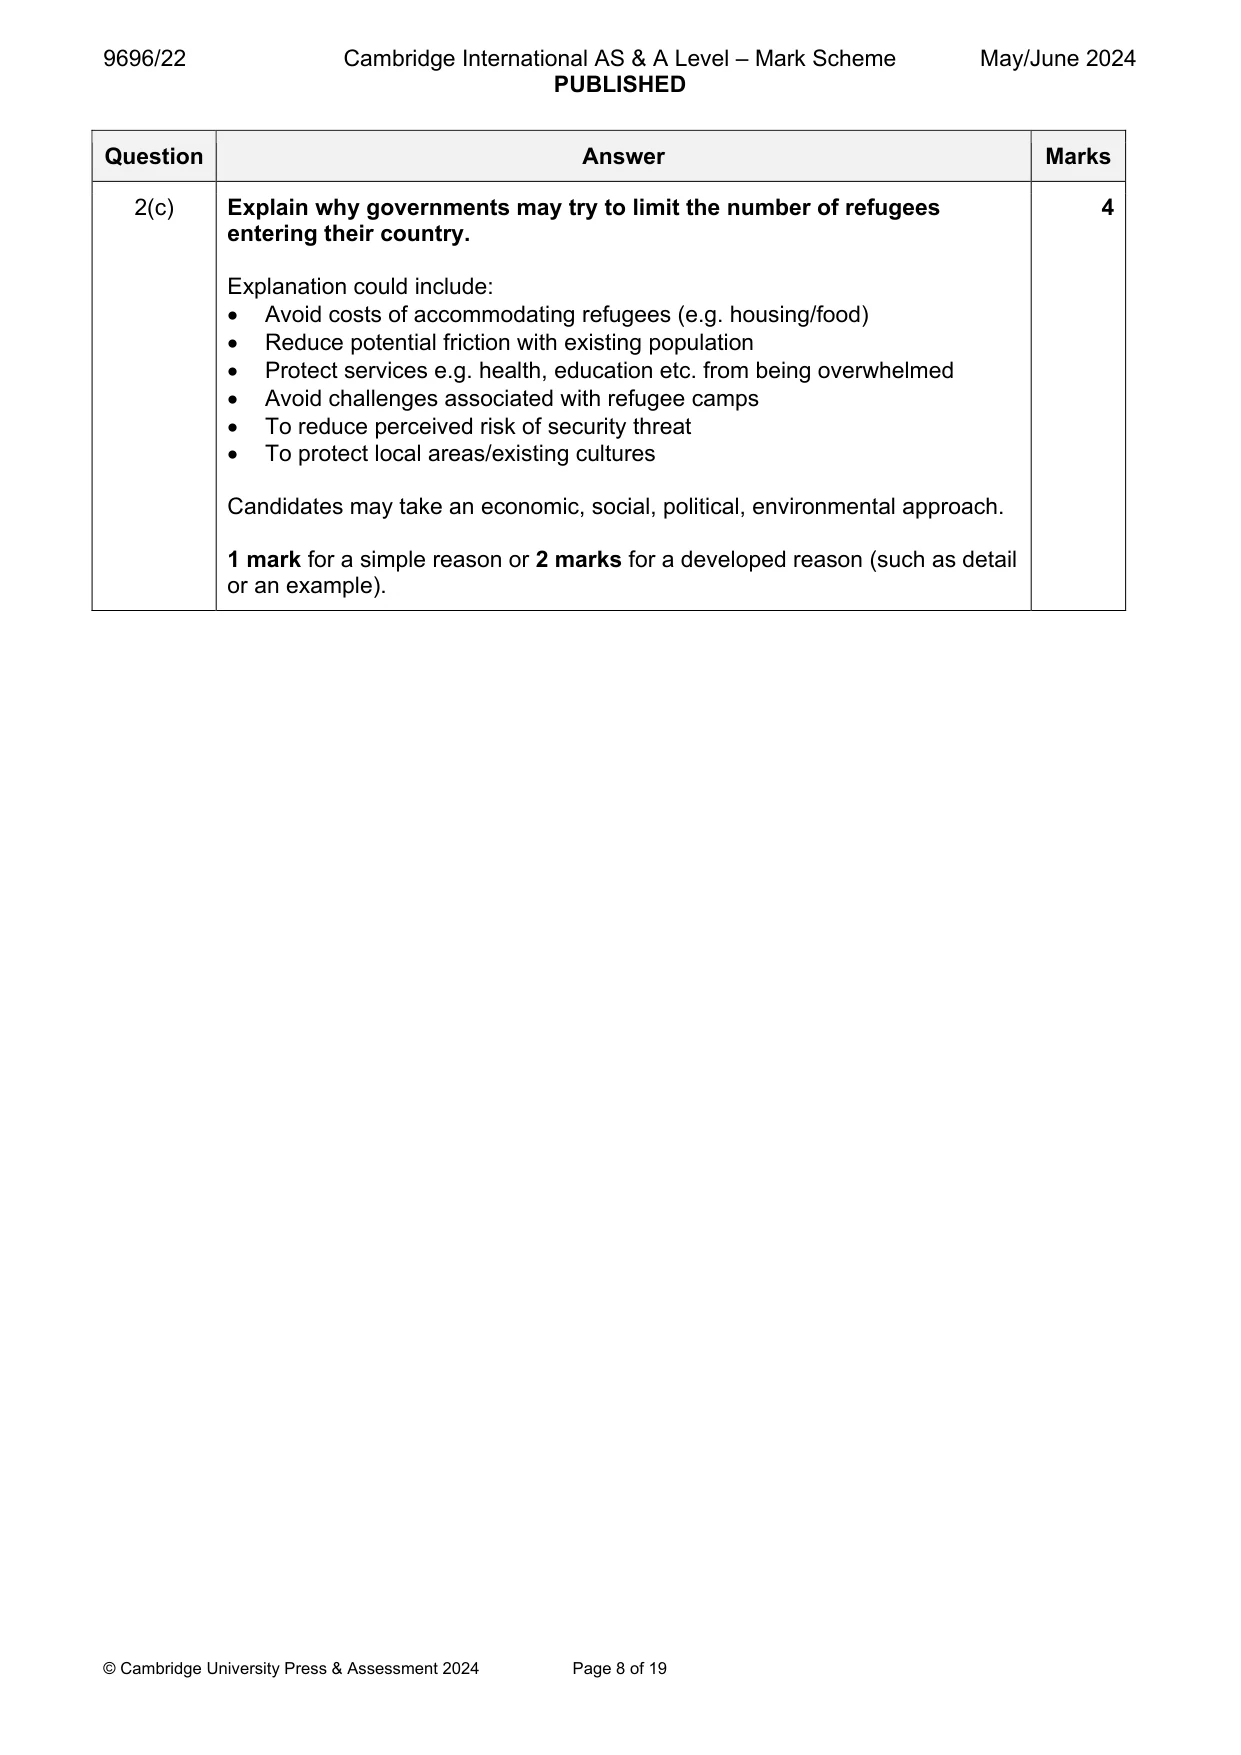
9696/22 Cambridge International AS & A Level – Mark Scheme PUBLISHED May/June 2024 © Cambridge University Press & Assessment 2024 Page 8 of 19 Question Answer Marks 2(c) Explain why governments may try to limit the number of refugees entering their country. Explanation could include: Avoid costs of accommodating refugees (e.g. housing/food) Reduce potential friction with existing population Protect services e.g. health, education etc. from being overwhelmed Avoid challenges associated with refugee camps To reduce perceived risk of security threat To protect local areas/existing cultures Candidates may take an economic, social, political, environmental approach. 1 mark for a simple reason or 2 marks for a developed reason (such as detail or an example). 4
Mark scheme, page 9
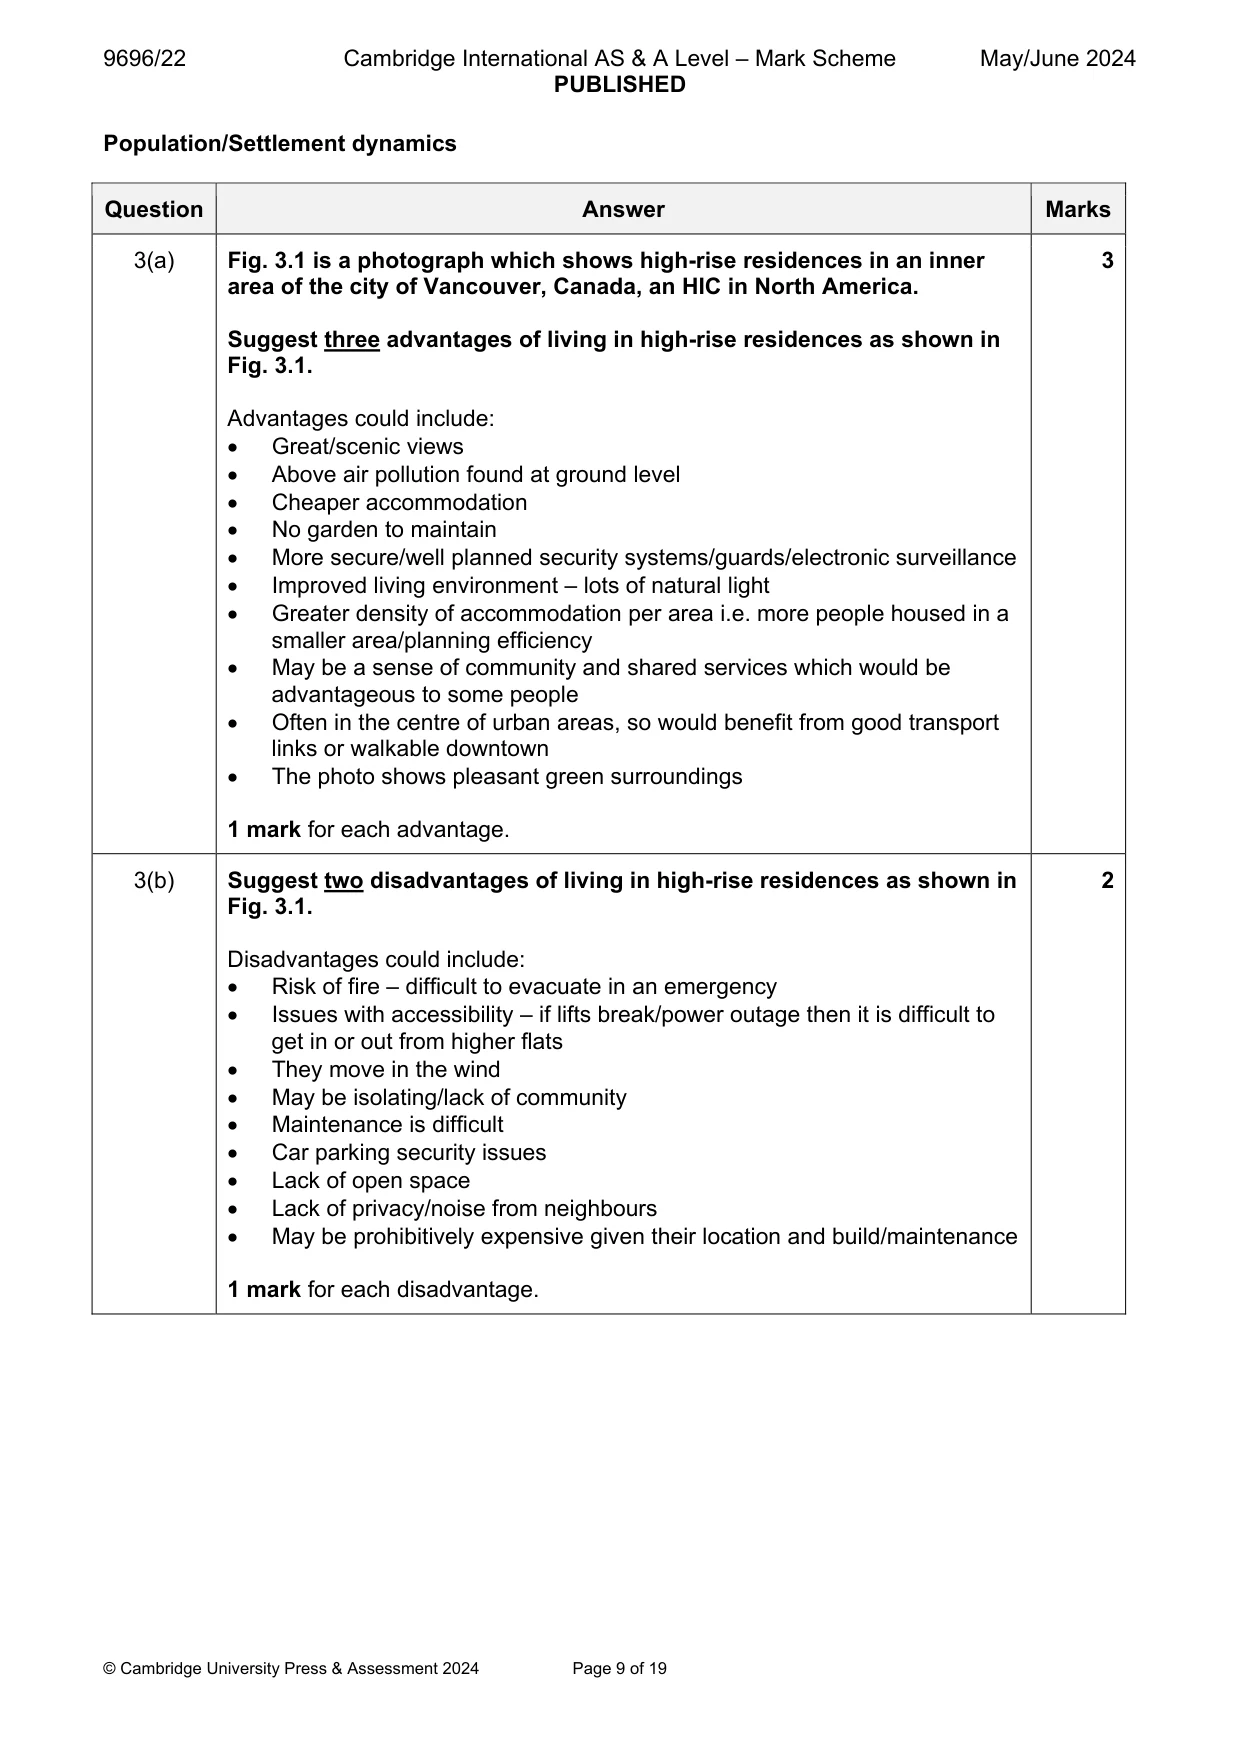
9696/22 Cambridge International AS & A Level – Mark Scheme PUBLISHED May/June 2024 © Cambridge University Press & Assessment 2024 Page 9 of 19 Population/Settlement dynamics Question Answer Marks 3(a) Fig. 3.1 is a photograph which shows high-rise residences in an inner area of the city of Vancouver, Canada, an HIC in North America. Suggest three advantages of living in high-rise residences as shown in Fig. 3.1. Advantages could include: Great/scenic views Above air pollution found at ground level Cheaper accommodation No garden to maintain More secure/well planned security systems/guards/electronic surveillance Improved living environment – lots of natural light Greater density of accommodation per area i.e. more people housed in a smaller area/planning efficiency May be a sense of community and shared services which would be advantageous to some people Often in the centre of urban areas, so would benefit from good transport links or walkable downtown The photo shows pleasant green surroundings 1 mark for each advantage. 3 3(b) Suggest two disadvantages of living in high-rise residences as shown in Fig. 3.1. Disadvantages could include: Risk of fire – difficult to evacuate in an emergency Issues with accessibility – if lifts break/power outage then it is difficult to get in or out from higher flats They move in the wind May be isolating/lack of community Maintenance is difficult Car parking security issues Lack of open space Lack of privacy/noise from neighbours May be prohibitively expensive given their location and build/maintenance 1 mark for each disadvantage. 2
Mark scheme, page 10
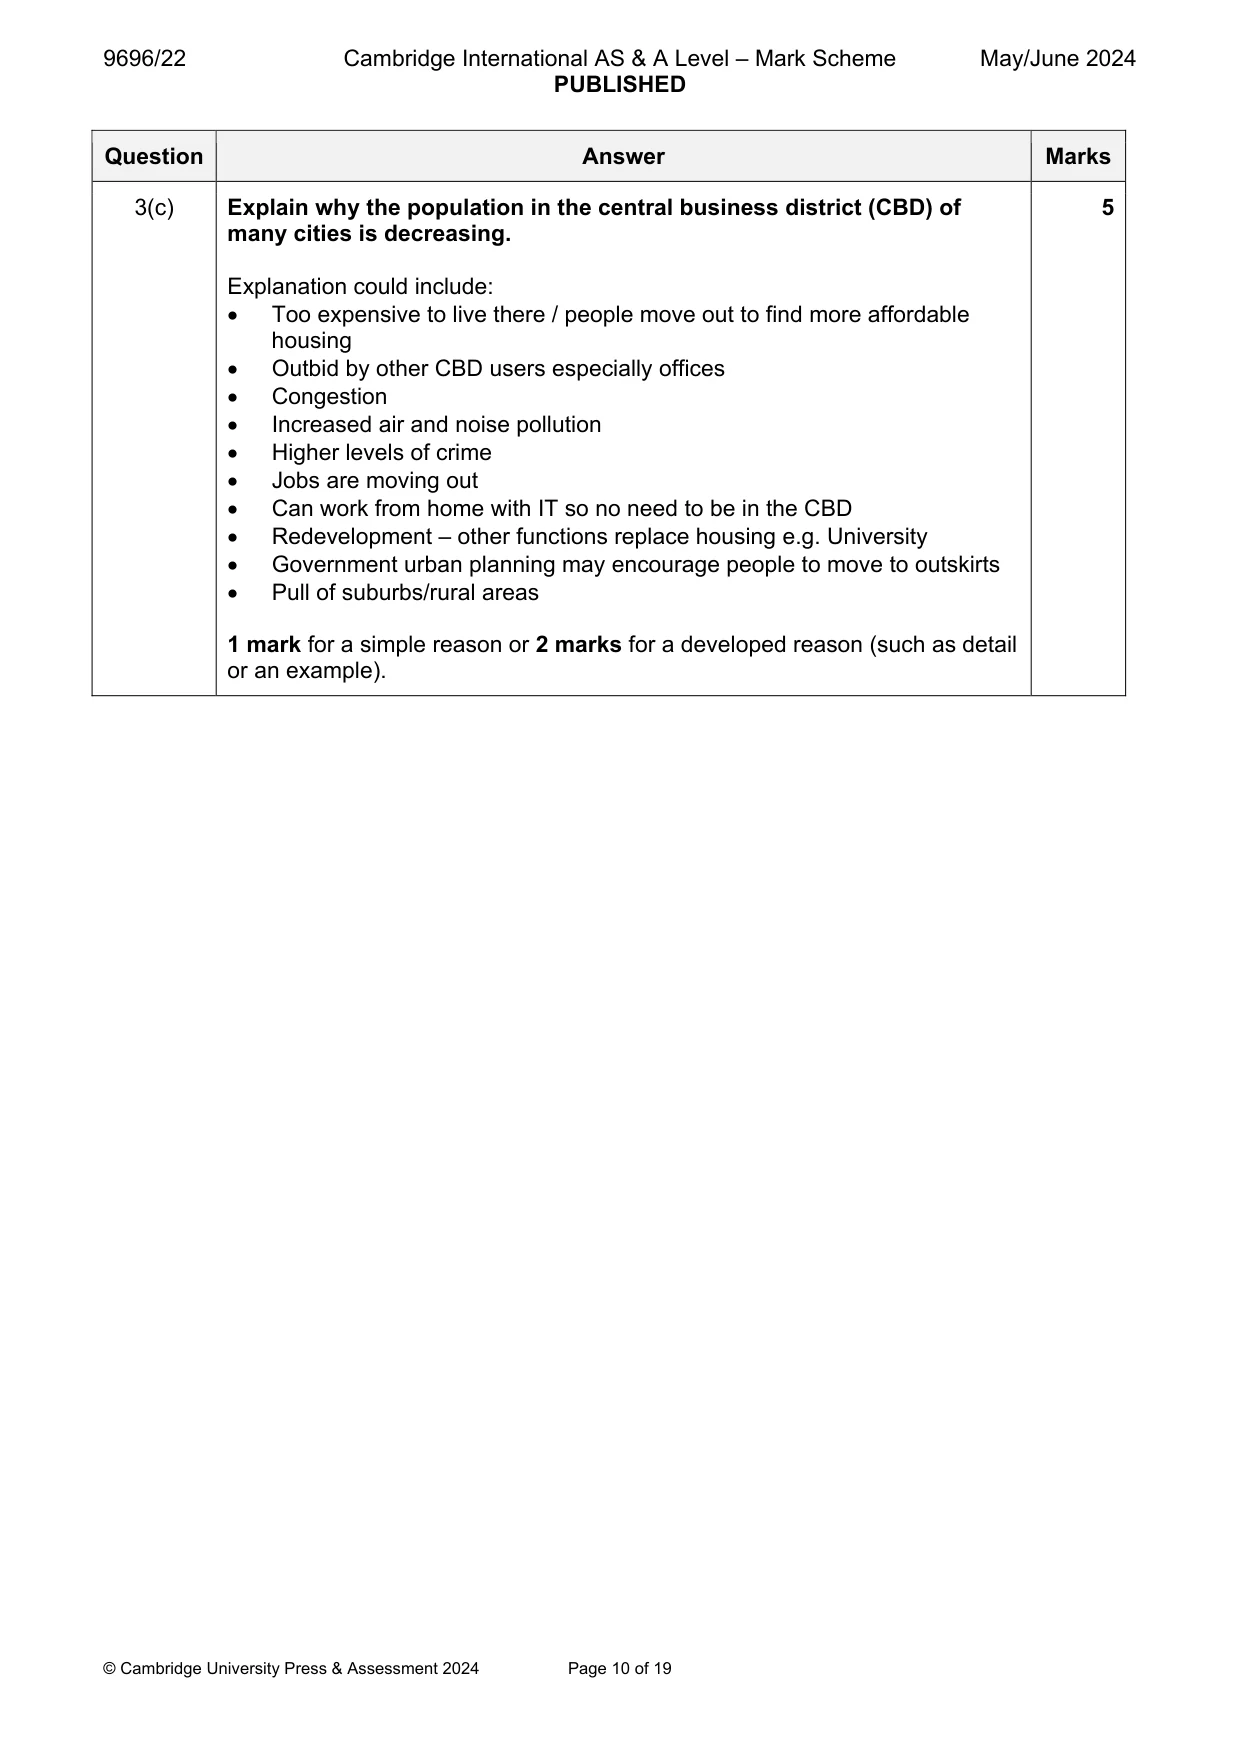
9696/22 Cambridge International AS & A Level – Mark Scheme PUBLISHED May/June 2024 © Cambridge University Press & Assessment 2024 Page 10 of 19 Question Answer Marks 3(c) Explain why the population in the central business district (CBD) of many cities is decreasing. Explanation could include: Too expensive to live there / people move out to find more affordable housing Outbid by other CBD users especially offices Congestion Increased air and noise pollution Higher levels of crime Jobs are moving out Can work from home with IT so no need to be in the CBD Redevelopment – other functions replace housing e.g. University Government urban planning may encourage people to move to outskirts Pull of suburbs/rural areas 1 mark for a simple reason or 2 marks for a developed reason (such as detail or an example). 5
Mark scheme, page 11
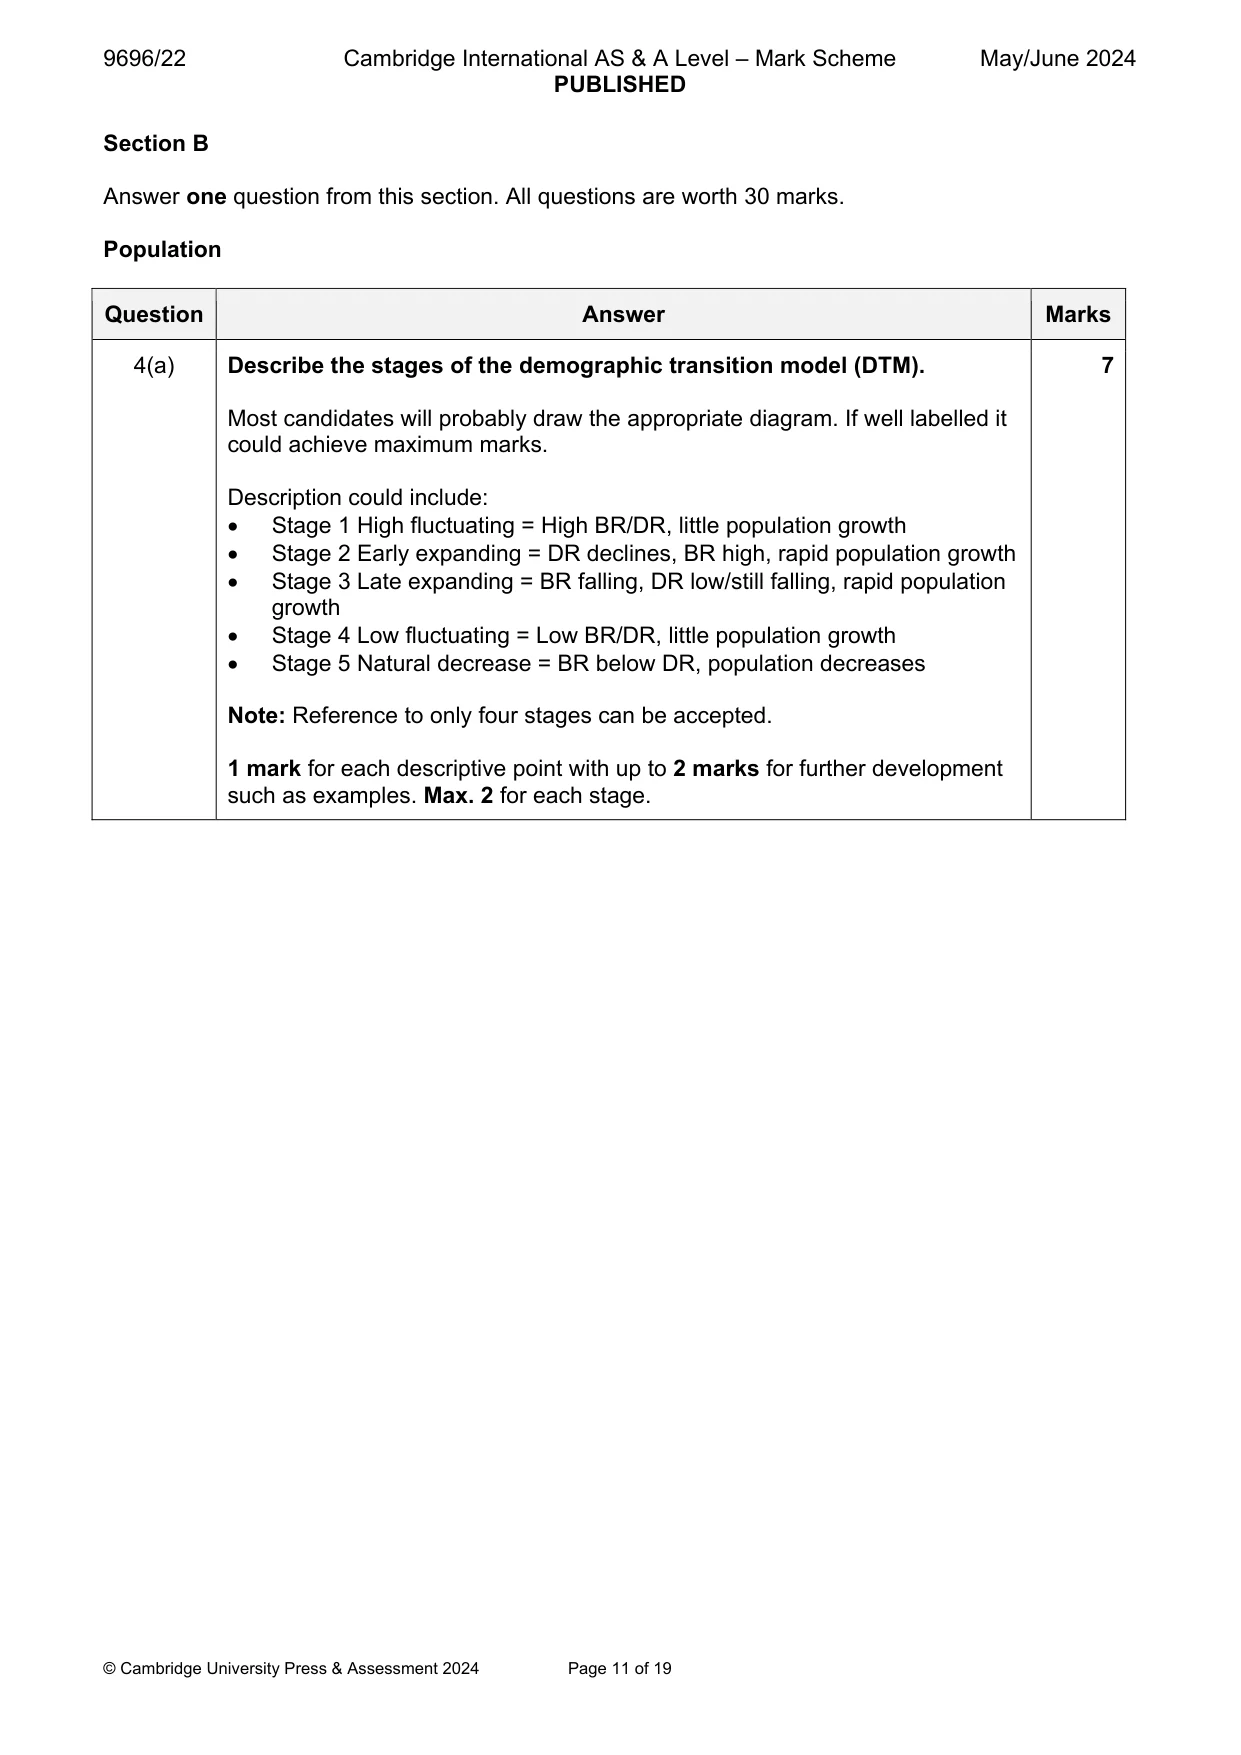
9696/22 Cambridge International AS & A Level – Mark Scheme PUBLISHED May/June 2024 © Cambridge University Press & Assessment 2024 Page 11 of 19 Section B Answer one question from this section. All questions are worth 30 marks. Population Question Answer Marks 4(a) Describe the stages of the demographic transition model (DTM). Most candidates will probably draw the appropriate diagram. If well labelled it could achieve maximum marks. Description could include: Stage 1 High fluctuating = High BR/DR, little population growth Stage 2 Early expanding = DR declines, BR high, rapid population growth Stage 3 Late expanding = BR falling, DR low/still falling, rapid population growth Stage 4 Low fluctuating = Low BR/DR, little population growth Stage 5 Natural decrease = BR below DR, population decreases Note: Reference to only four stages can be accepted. 1 mark for each descriptive point with up to 2 marks for further development such as examples. Max. 2 for each stage. 7
Mark scheme, page 12
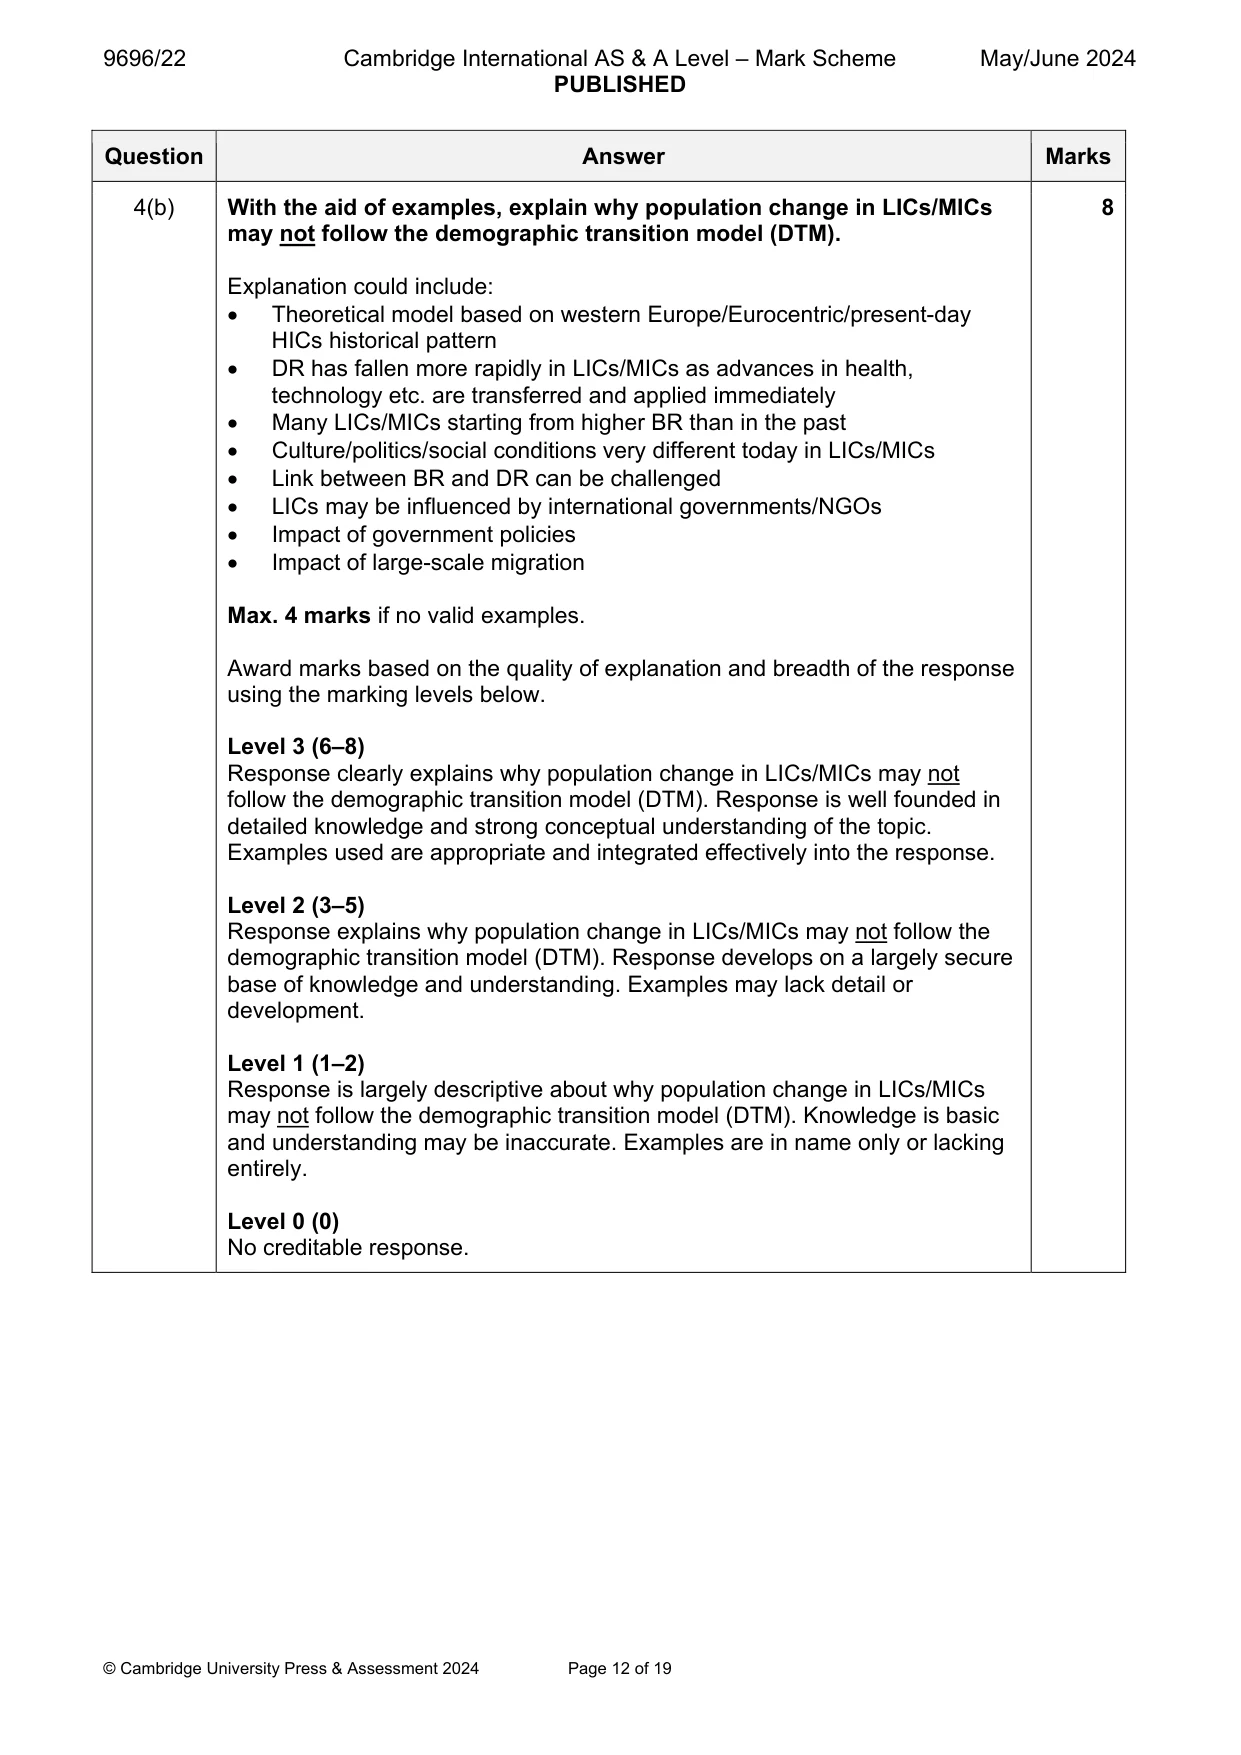
9696/22 Cambridge International AS & A Level – Mark Scheme PUBLISHED May/June 2024 © Cambridge University Press & Assessment 2024 Page 12 of 19 Question Answer Marks 4(b) With the aid of examples, explain why population change in LICs/MICs may not follow the demographic transition model (DTM). Explanation could include: Theoretical model based on western Europe/Eurocentric/present-day HICs historical pattern DR has fallen more rapidly in LICs/MICs as advances in health, technology etc. are transferred and applied immediately Many LICs/MICs starting from higher BR than in the past Culture/politics/social conditions very different today in LICs/MICs Link between BR and DR can be challenged LICs may be influenced by international governments/NGOs Impact of government policies Impact of large-scale migration Max. 4 marks if no valid examples. Award marks based on the quality of explanation and breadth of the response using the marking levels below. Level 3 (6–8) Response clearly explains why population change in LICs/MICs may not follow the demographic transition model (DTM). Response is well founded in detailed knowledge and strong conceptual understanding of the topic. Examples used are appropriate and integrated effectively into the response. Level 2 (3–5) Response explains why population change in LICs/MICs may not follow the demographic transition model (DTM). Response develops on a largely secure base of knowledge and understanding. Examples may lack detail or development. Level 1 (1–2) Response is largely descriptive about why population change in LICs/MICs may not follow the demographic transition model (DTM). Knowledge is basic and understanding may be inaccurate. Examples are in name only or lacking entirely. Level 0 (0) No creditable response. 8
Mark scheme, page 13
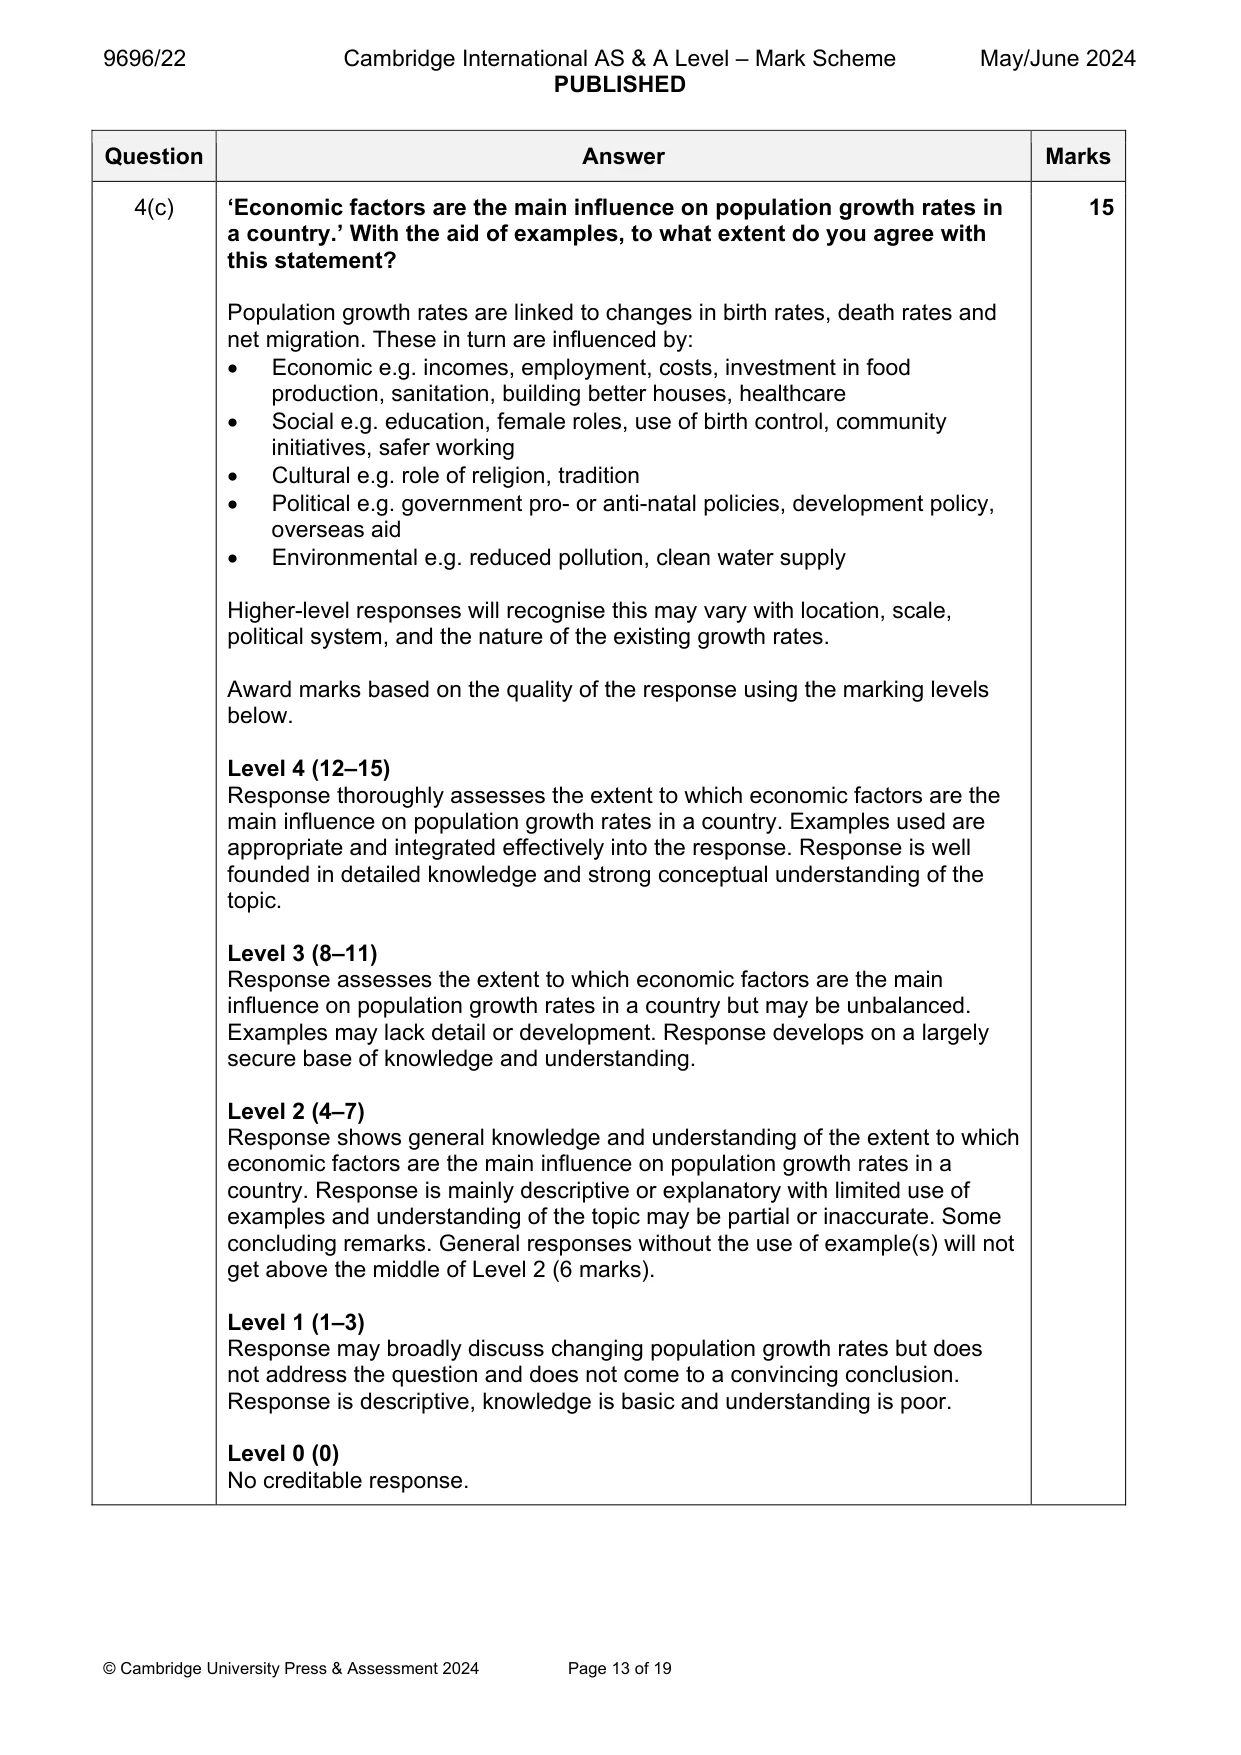
9696/22 Cambridge International AS & A Level – Mark Scheme PUBLISHED May/June 2024 © Cambridge University Press & Assessment 2024 Page 13 of 19 Question Answer Marks 4(c) ‘Economic factors are the main influence on population growth rates in a country.’ With the aid of examples, to what extent do you agree with this statement? Population growth rates are linked to changes in birth rates, death rates and net migration. These in turn are influenced by: Economic e.g. incomes, employment, costs, investment in food production, sanitation, building better houses, healthcare Social e.g. education, female roles, use of birth control, community initiatives, safer working Cultural e.g. role of religion, tradition Political e.g. government pro- or anti-natal policies, development policy, overseas aid Environmental e.g. reduced pollution, clean water supply Higher-level responses will recognise this may vary with location, scale, political system, and the nature of the existing growth rates. Award marks based on the quality of the response using the marking levels below. Level 4 (12–15) Response thoroughly assesses the extent to which economic factors are the main influence on population growth rates in a country. Examples used are appropriate and integrated effectively into the response. Response is well founded in detailed knowledge and strong conceptual understanding of the topic. Level 3 (8–11) Response assesses the extent to which economic factors are the main influence on population growth rates in a country but may be unbalanced. Examples may lack detail or development. Response develops on a largely secure base of knowledge and understanding. Level 2 (4–7) Response shows general knowledge and understanding of the extent to which economic factors are the main influence on population growth rates in a country. Response is mainly descriptive or explanatory with limited use of examples and understanding of the topic may be partial or inaccurate. Some concluding remarks. General responses without the use of example(s) will not get above the middle of Level 2 (6 marks). Level 1 (1–3) Response may broadly discuss changing population growth rates but does not address the question and does not come to a convincing conclusion. Response is descriptive, knowledge is basic and understanding is poor. Level 0 (0) No creditable response. 15
Mark scheme, page 14
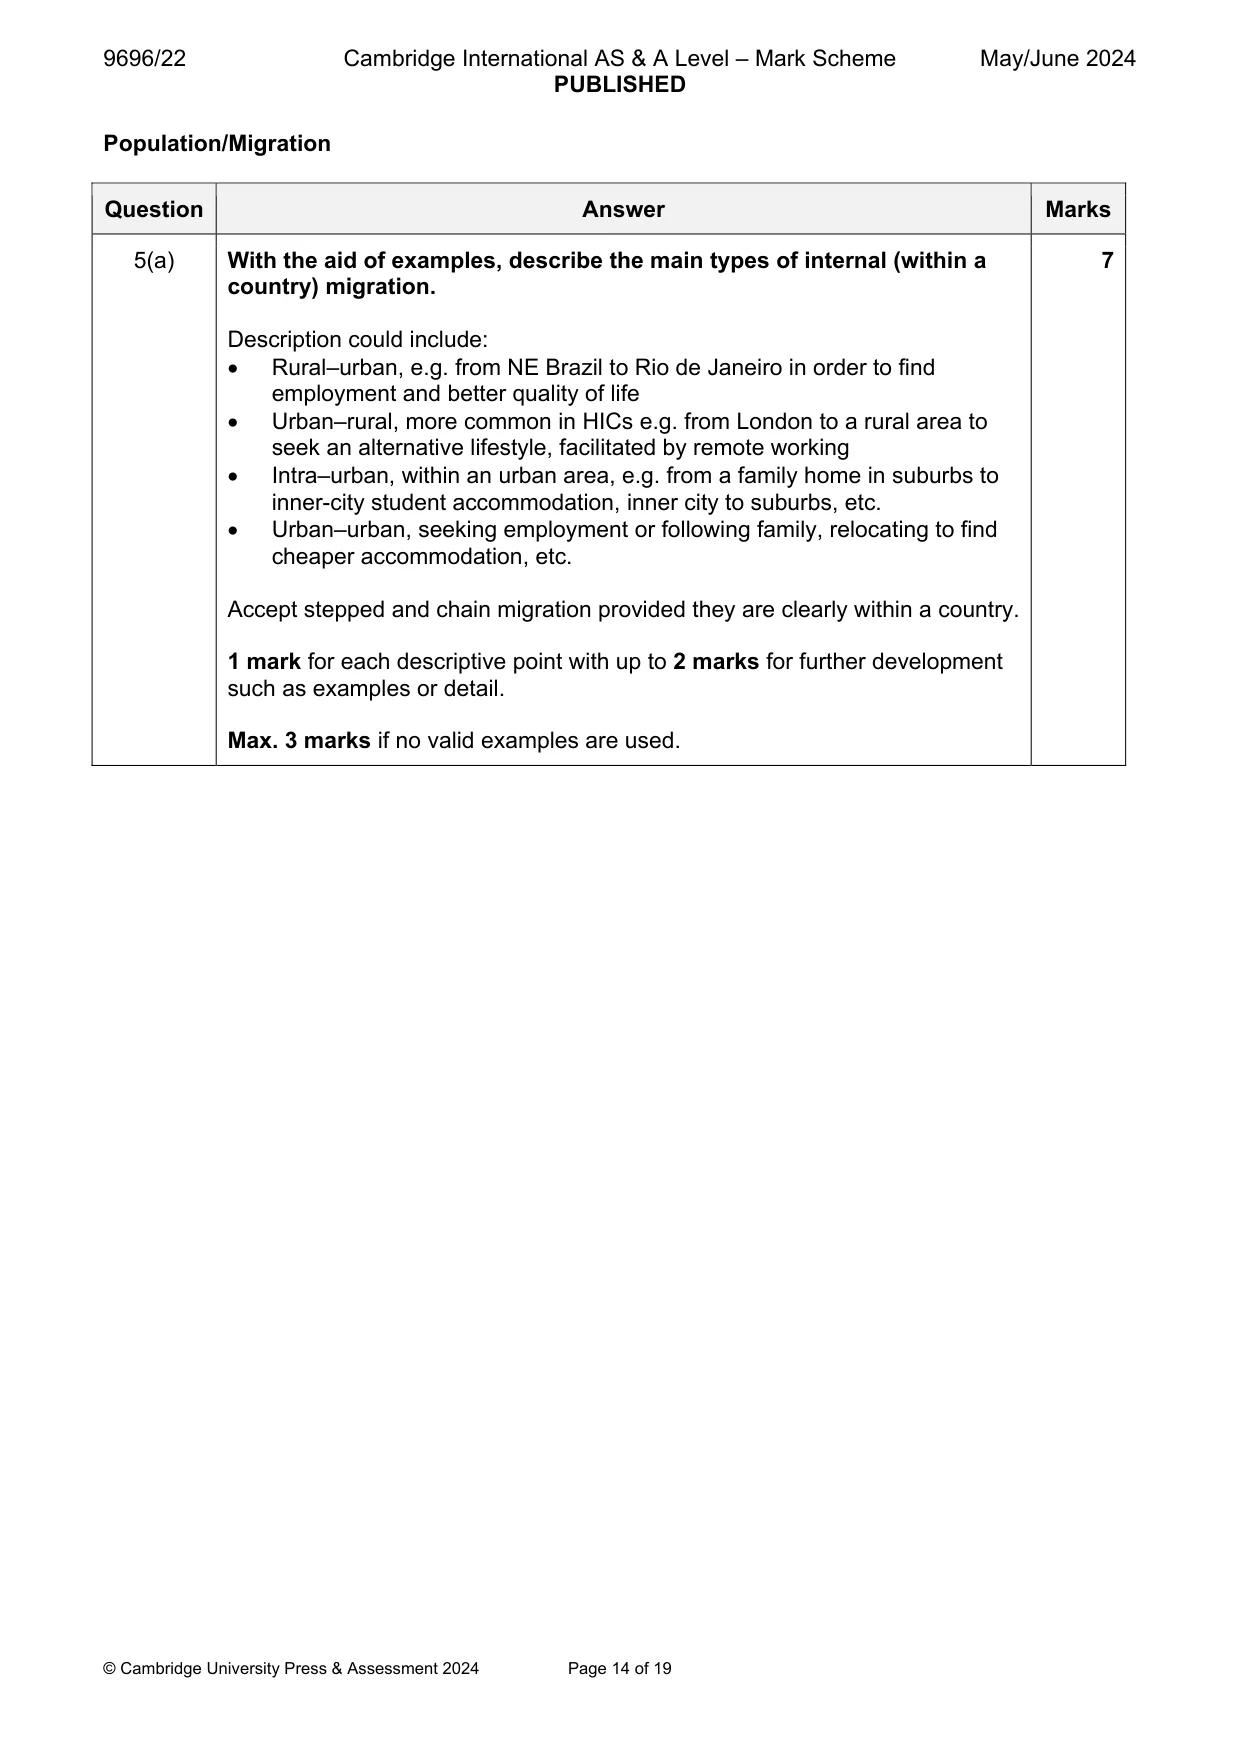
9696/22 Cambridge International AS & A Level – Mark Scheme PUBLISHED May/June 2024 © Cambridge University Press & Assessment 2024 Page 14 of 19 Population/Migration Question Answer Marks 5(a) With the aid of examples, describe the main types of internal (within a country) migration. Description could include: Rural–urban, e.g. from NE Brazil to Rio de Janeiro in order to find employment and better quality of life Urban–rural, more common in HICs e.g. from London to a rural area to seek an alternative lifestyle, facilitated by remote working Intra–urban, within an urban area, e.g. from a family home in suburbs to inner-city student accommodation, inner city to suburbs, etc. Urban–urban, seeking employment or following family, relocating to find cheaper accommodation, etc. Accept stepped and chain migration provided they are clearly within a country. 1 mark for each descriptive point with up to 2 marks for further development such as examples or detail. Max. 3 marks if no valid examples are used. 7
Mark scheme, page 15
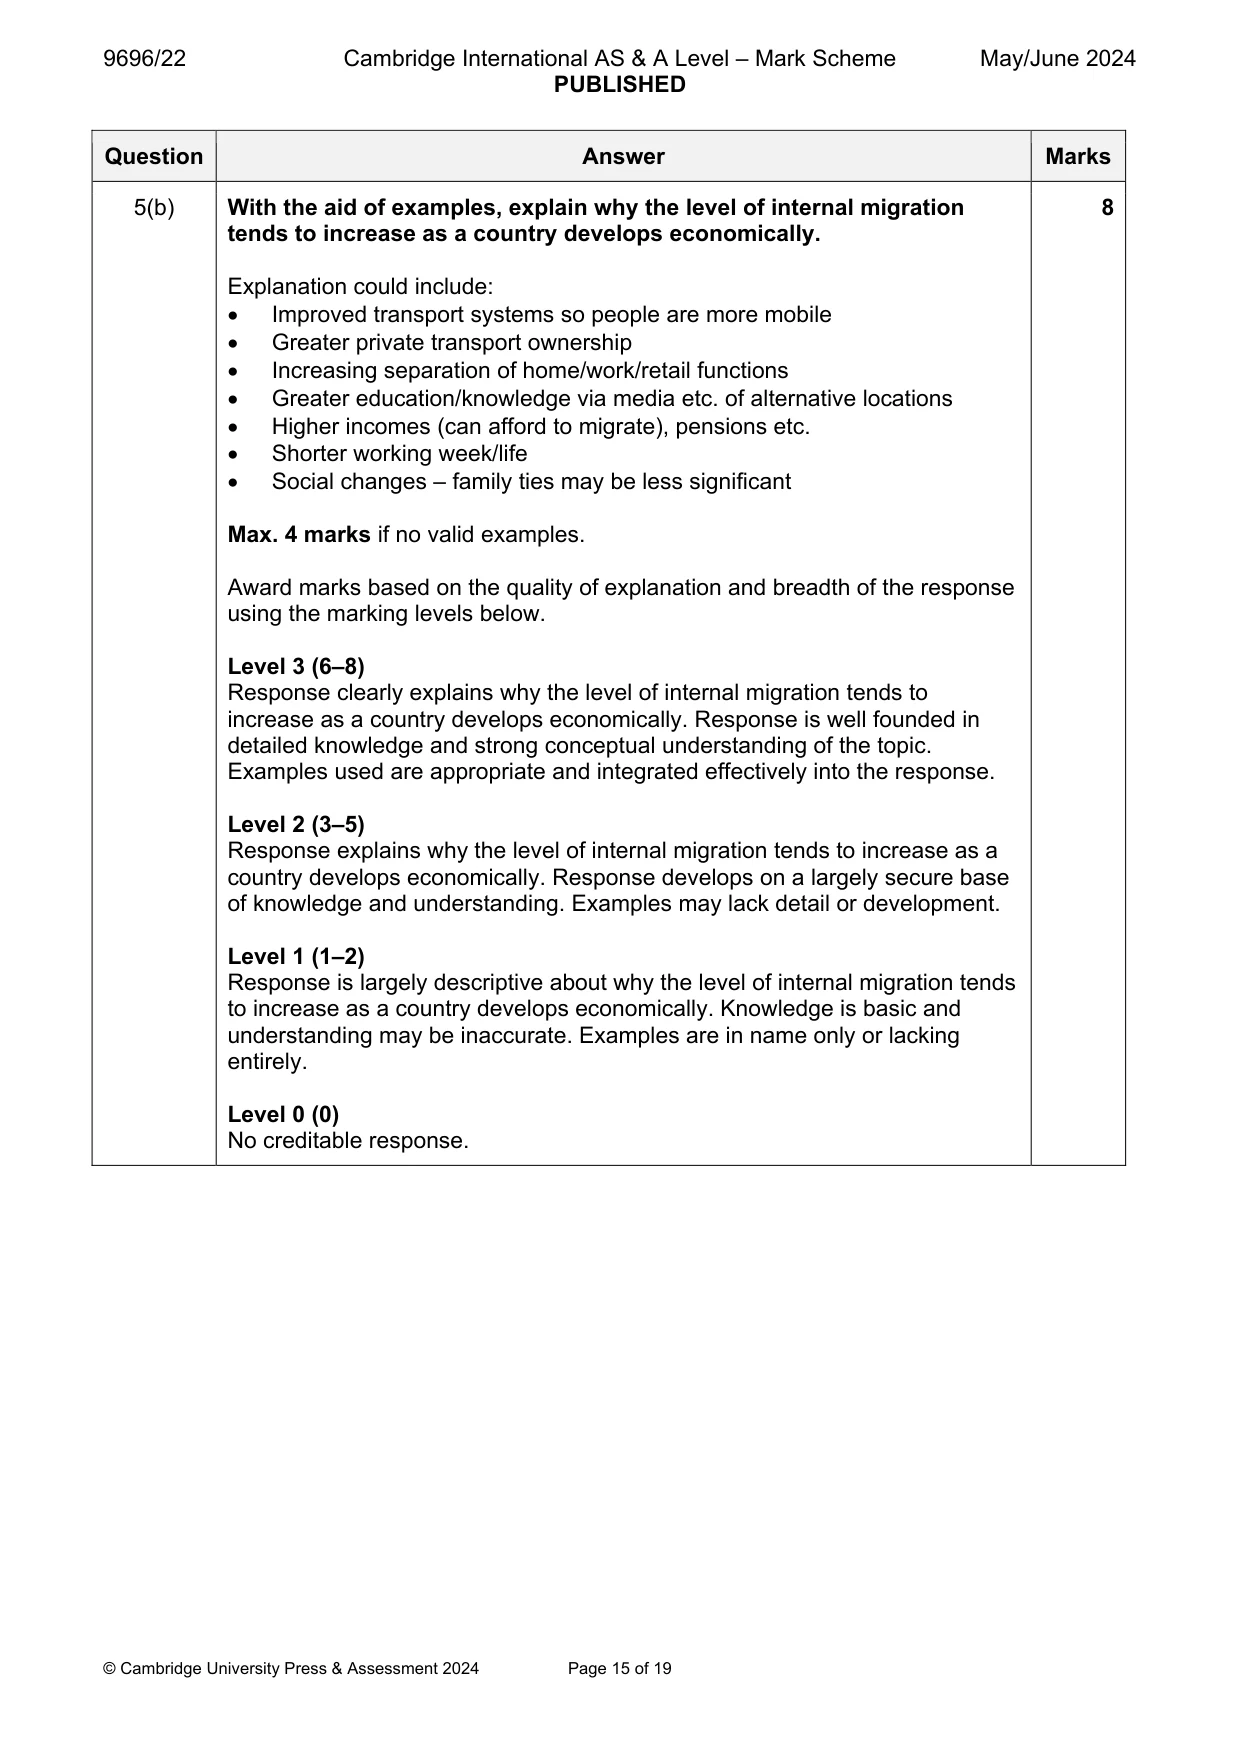
9696/22 Cambridge International AS & A Level – Mark Scheme PUBLISHED May/June 2024 © Cambridge University Press & Assessment 2024 Page 15 of 19 Question Answer Marks 5(b) With the aid of examples, explain why the level of internal migration tends to increase as a country develops economically. Explanation could include: Improved transport systems so people are more mobile Greater private transport ownership Increasing separation of home/work/retail functions Greater education/knowledge via media etc. of alternative locations Higher incomes (can afford to migrate), pensions etc. Shorter working week/life Social changes – family ties may be less significant Max. 4 marks if no valid examples. Award marks based on the quality of explanation and breadth of the response using the marking levels below. Level 3 (6–8) Response clearly explains why the level of internal migration tends to increase as a country develops economically. Response is well founded in detailed knowledge and strong conceptual understanding of the topic. Examples used are appropriate and integrated effectively into the response. Level 2 (3–5) Response explains why the level of internal migration tends to increase as a country develops economically. Response develops on a largely secure base of knowledge and understanding. Examples may lack detail or development. Level 1 (1–2) Response is largely descriptive about why the level of internal migration tends to increase as a country develops economically. Knowledge is basic and understanding may be inaccurate. Examples are in name only or lacking entirely. Level 0 (0) No creditable response. 8
Mark scheme, page 16
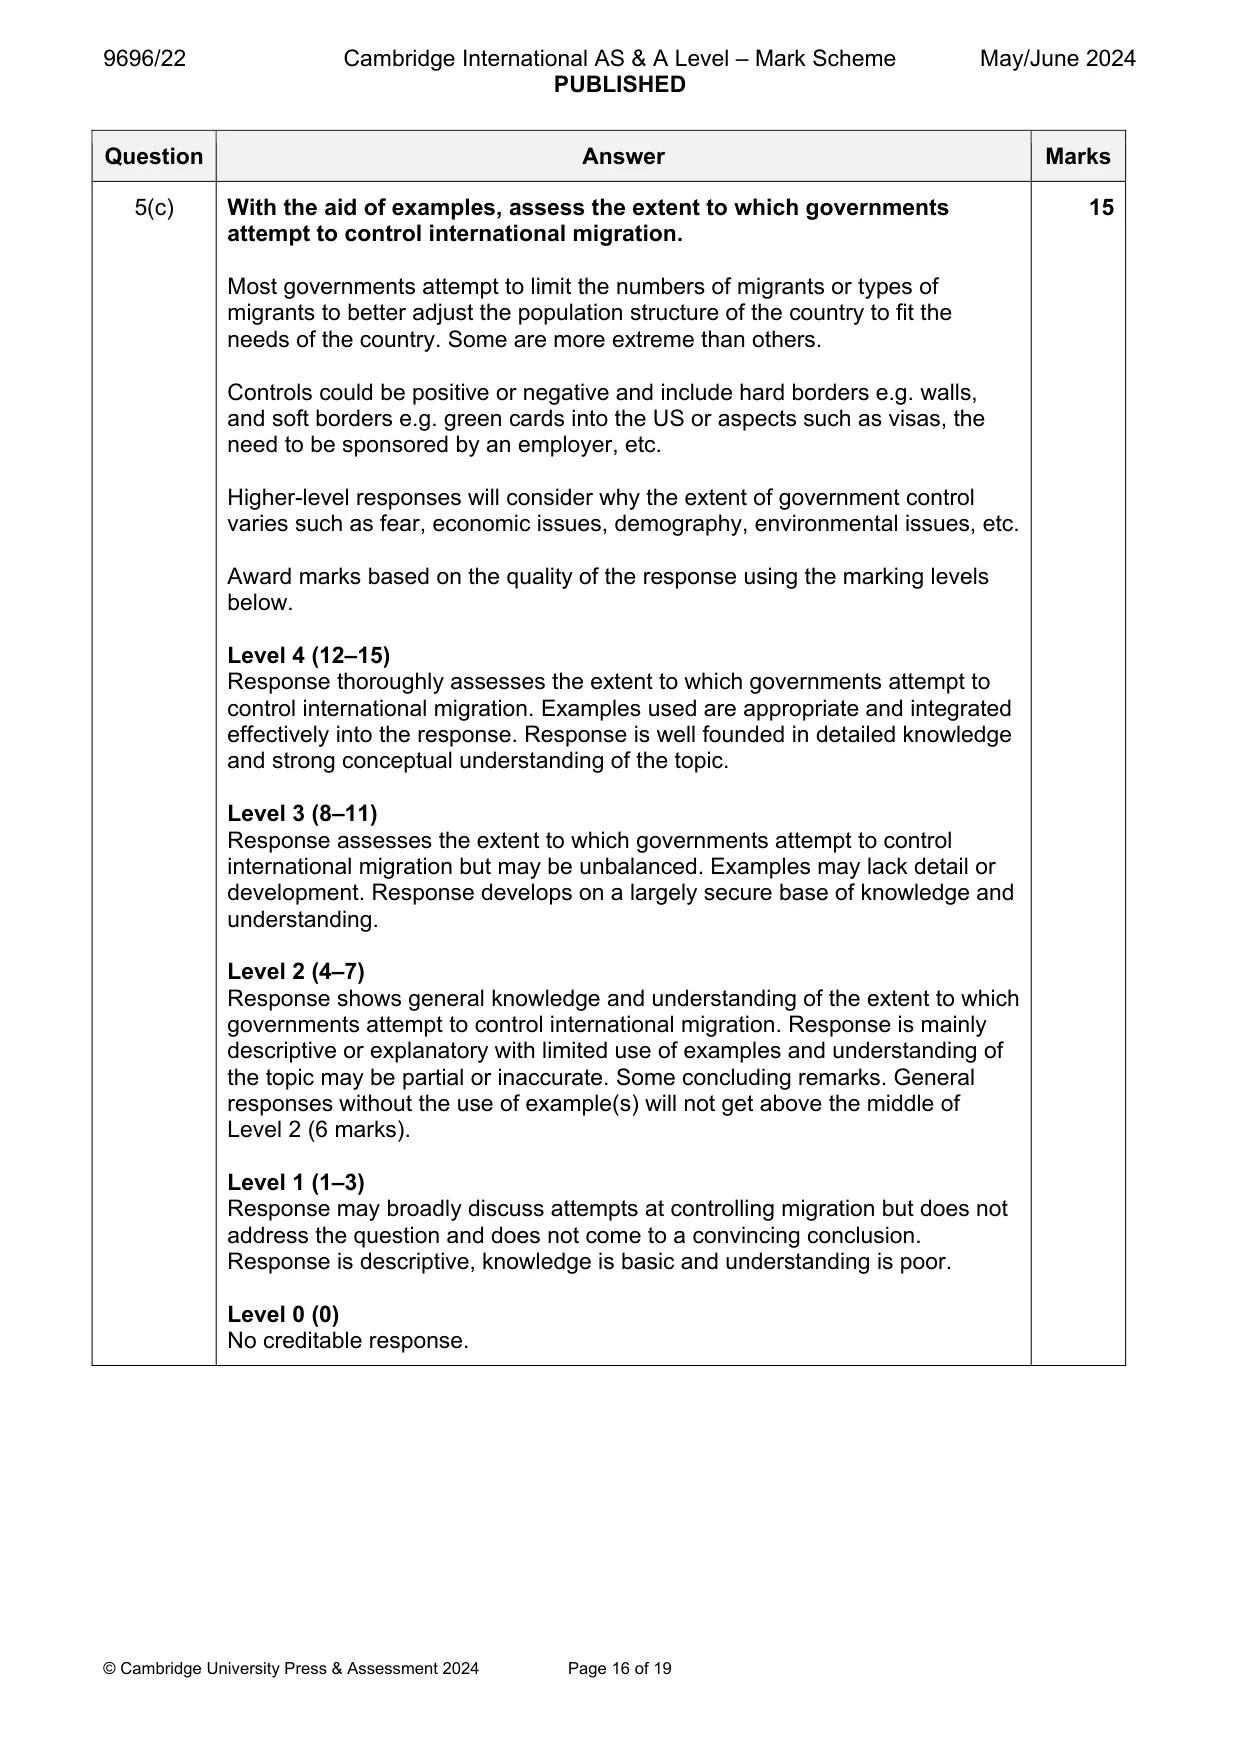
9696/22 Cambridge International AS & A Level – Mark Scheme PUBLISHED May/June 2024 © Cambridge University Press & Assessment 2024 Page 16 of 19 Question Answer Marks 5(c) With the aid of examples, assess the extent to which governments attempt to control international migration. Most governments attempt to limit the numbers of migrants or types of migrants to better adjust the population structure of the country to fit the needs of the country. Some are more extreme than others. Controls could be positive or negative and include hard borders e.g. walls, and soft borders e.g. green cards into the US or aspects such as visas, the need to be sponsored by an employer, etc. Higher-level responses will consider why the extent of government control varies such as fear, economic issues, demography, environmental issues, etc. Award marks based on the quality of the response using the marking levels below. Level 4 (12–15) Response thoroughly assesses the extent to which governments attempt to control international migration. Examples used are appropriate and integrated effectively into the response. Response is well founded in detailed knowledge and strong conceptual understanding of the topic. Level 3 (8–11) Response assesses the extent to which governments attempt to control international migration but may be unbalanced. Examples may lack detail or development. Response develops on a largely secure base of knowledge and understanding. Level 2 (4–7) Response shows general knowledge and understanding of the extent to which governments attempt to control international migration. Response is mainly descriptive or explanatory with limited use of examples and understanding of the topic may be partial or inaccurate. Some concluding remarks. General responses without the use of example(s) will not get above the middle of Level 2 (6 marks). Level 1 (1–3) Response may broadly discuss attempts at controlling migration but does not address the question and does not come to a convincing conclusion. Response is descriptive, knowledge is basic and understanding is poor. Level 0 (0) No creditable response. 15
Mark scheme, page 17
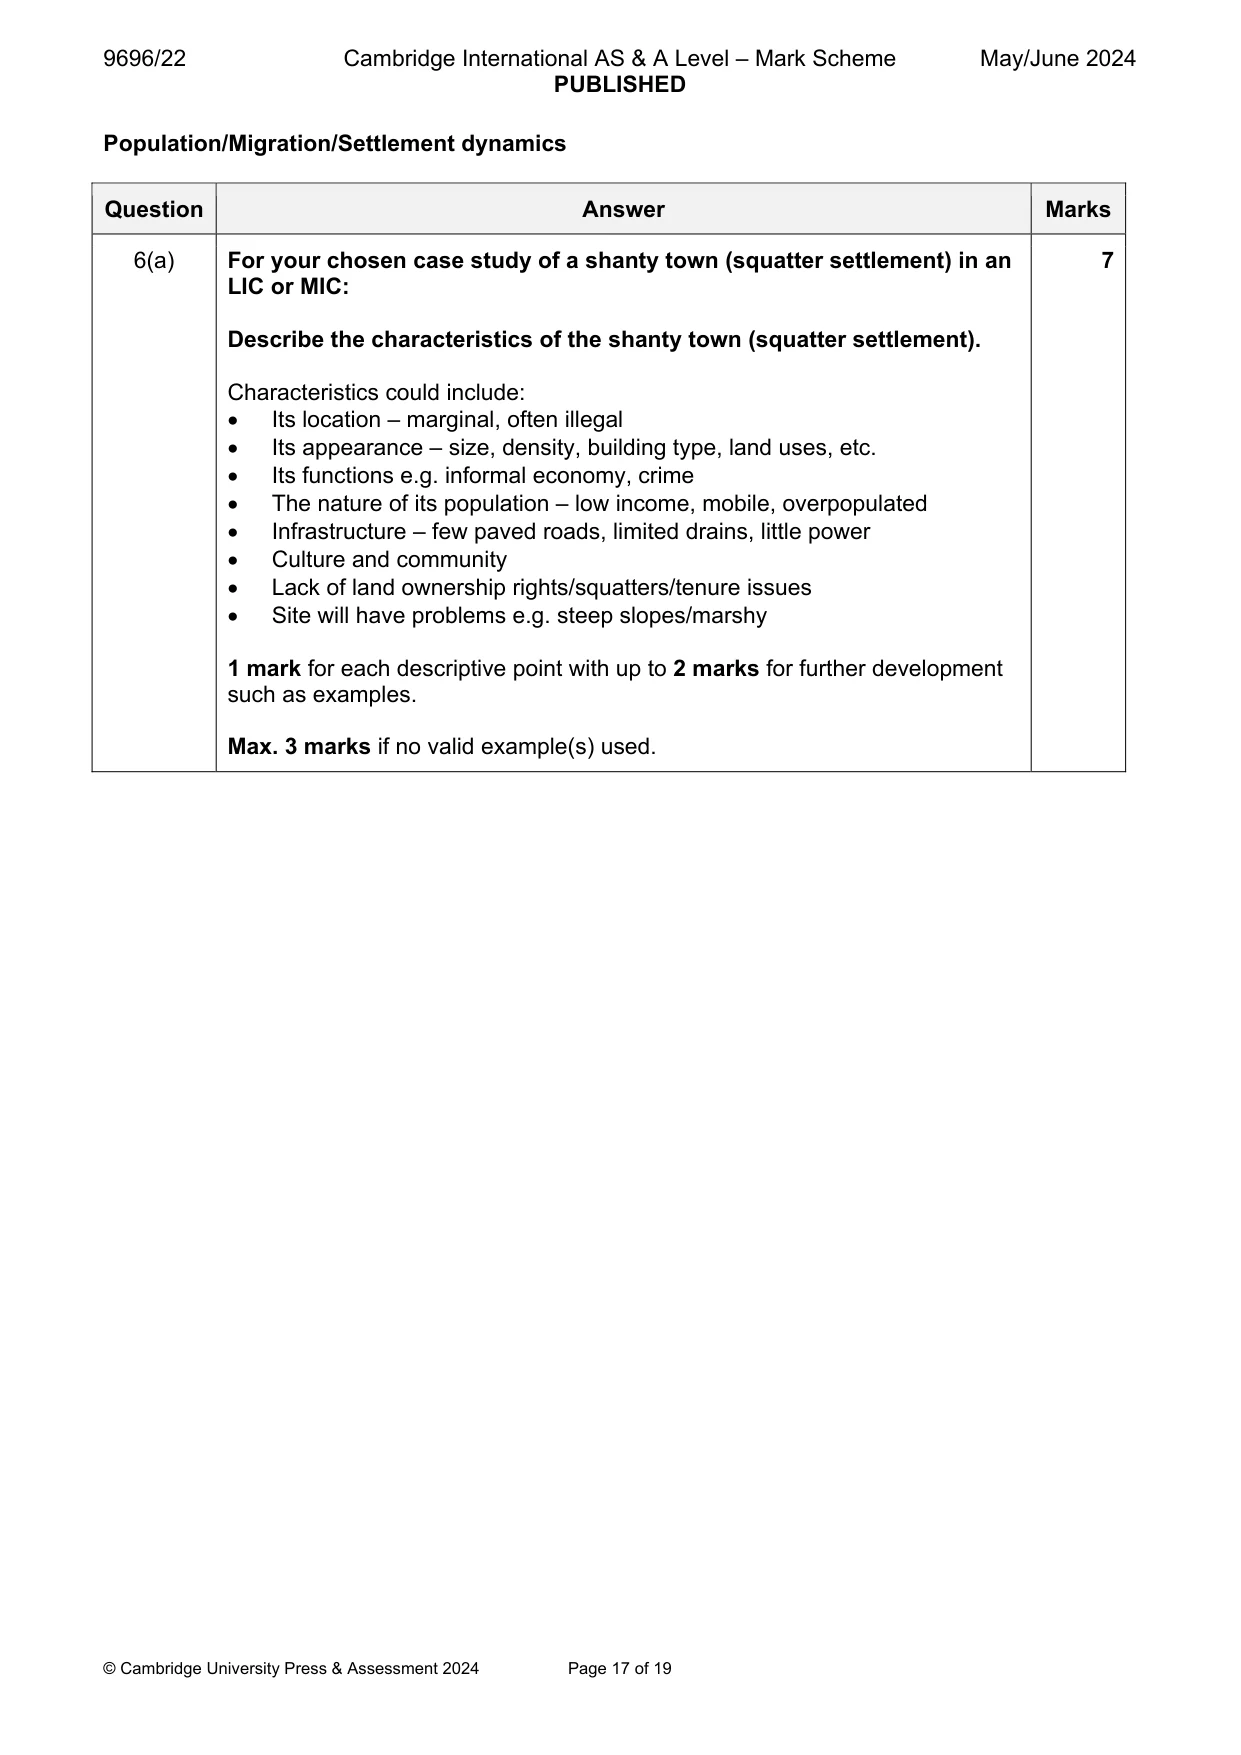
9696/22 Cambridge International AS & A Level – Mark Scheme PUBLISHED May/June 2024 © Cambridge University Press & Assessment 2024 Page 17 of 19 Population/Migration/Settlement dynamics Question Answer Marks 6(a) For your chosen case study of a shanty town (squatter settlement) in an LIC or MIC: Describe the characteristics of the shanty town (squatter settlement). Characteristics could include: Its location – marginal, often illegal Its appearance – size, density, building type, land uses, etc. Its functions e.g. informal economy, crime The nature of its population – low income, mobile, overpopulated Infrastructure – few paved roads, limited drains, little power Culture and community Lack of land ownership rights/squatters/tenure issues Site will have problems e.g. steep slopes/marshy 1 mark for each descriptive point with up to 2 marks for further development such as examples. Max. 3 marks if no valid example(s) used. 7
Mark scheme, page 18
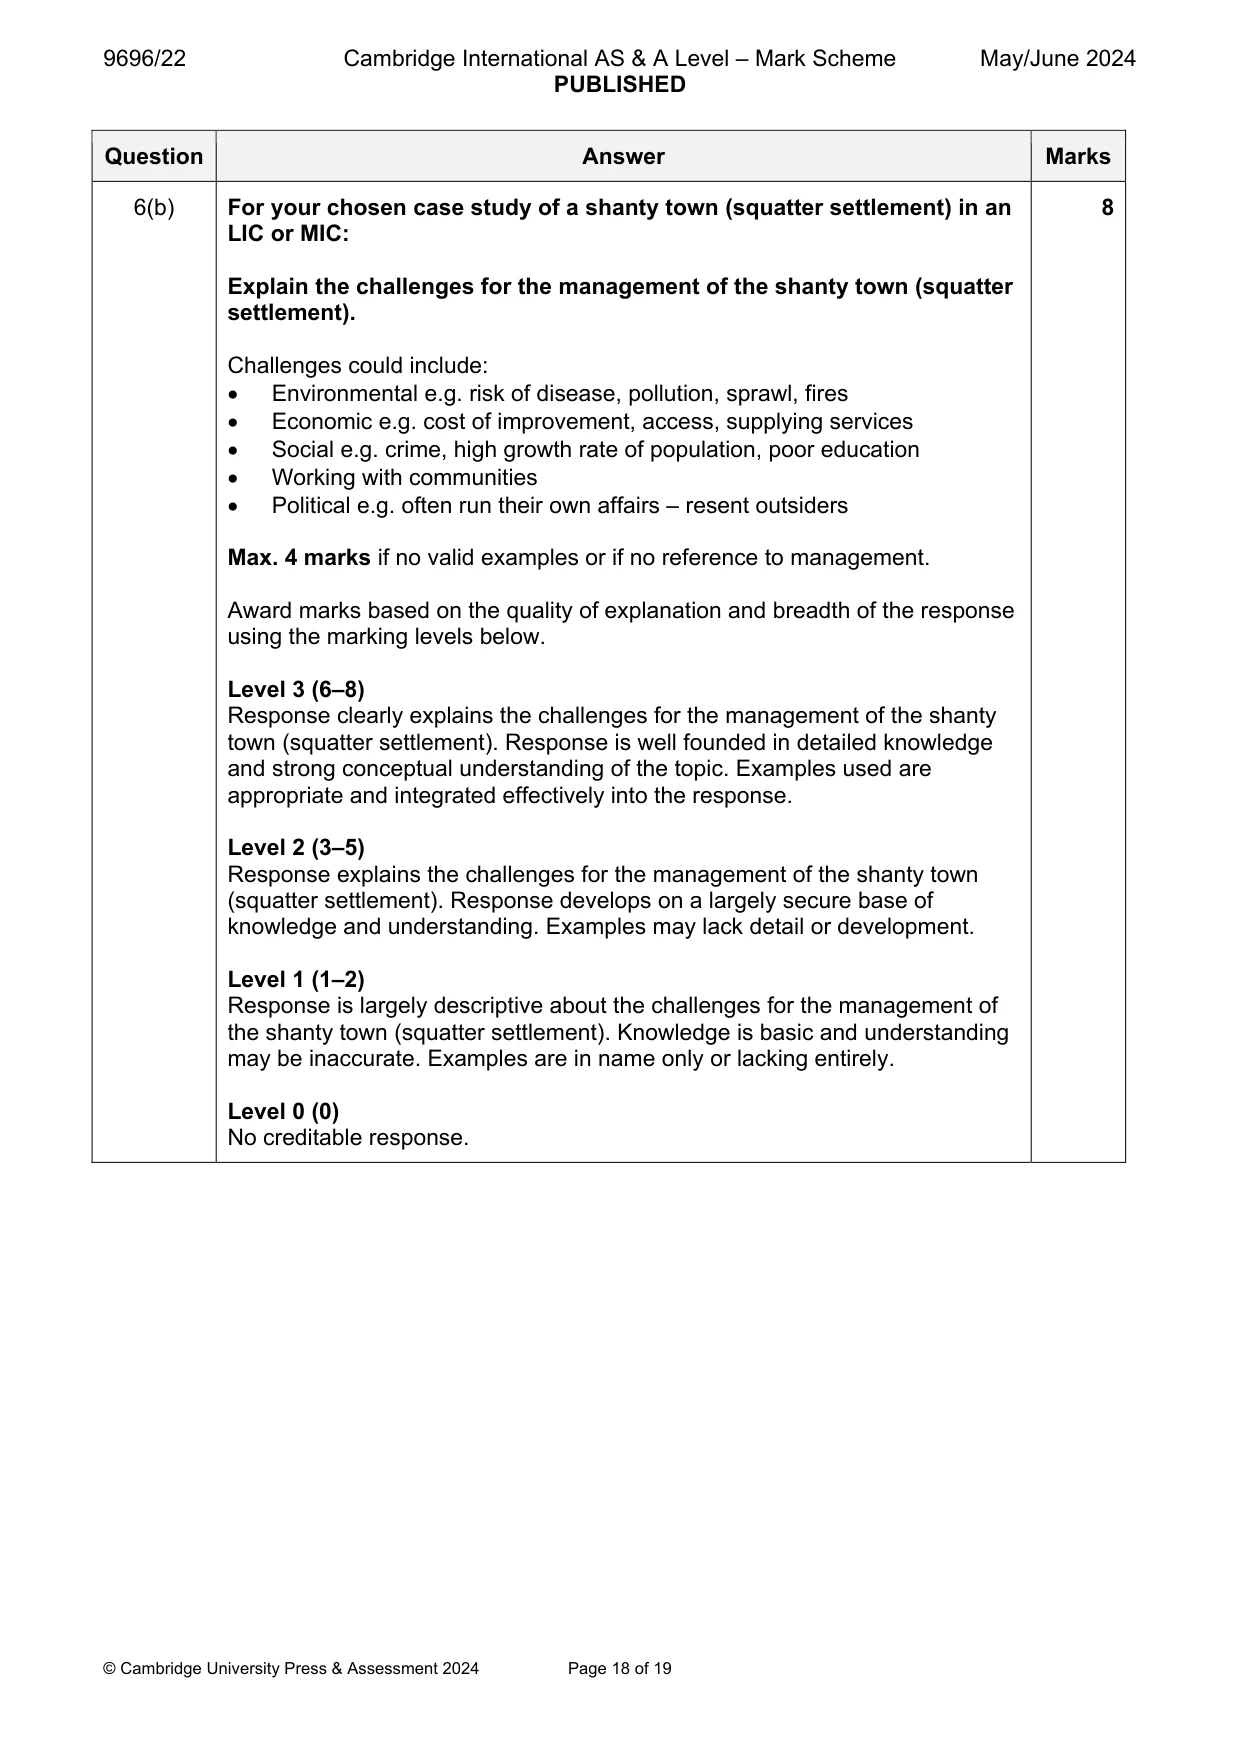
9696/22 Cambridge International AS & A Level – Mark Scheme PUBLISHED May/June 2024 © Cambridge University Press & Assessment 2024 Page 18 of 19 Question Answer Marks 6(b) For your chosen case study of a shanty town (squatter settlement) in an LIC or MIC: Explain the challenges for the management of the shanty town (squatter settlement). Challenges could include: Environmental e.g. risk of disease, pollution, sprawl, fires Economic e.g. cost of improvement, access, supplying services Social e.g. crime, high growth rate of population, poor education Working with communities Political e.g. often run their own affairs – resent outsiders Max. 4 marks if no valid examples or if no reference to management. Award marks based on the quality of explanation and breadth of the response using the marking levels below. Level 3 (6–8) Response clearly explains the challenges for the management of the shanty town (squatter settlement). Response is well founded in detailed knowledge and strong conceptual understanding of the topic. Examples used are appropriate and integrated effectively into the response. Level 2 (3–5) Response explains the challenges for the management of the shanty town (squatter settlement). Response develops on a largely secure base of knowledge and understanding. Examples may lack detail or development. Level 1 (1–2) Response is largely descriptive about the challenges for the management of the shanty town (squatter settlement). Knowledge is basic and understanding may be inaccurate. Examples are in name only or lacking entirely. Level 0 (0) No creditable response. 8
Mark scheme, page 19
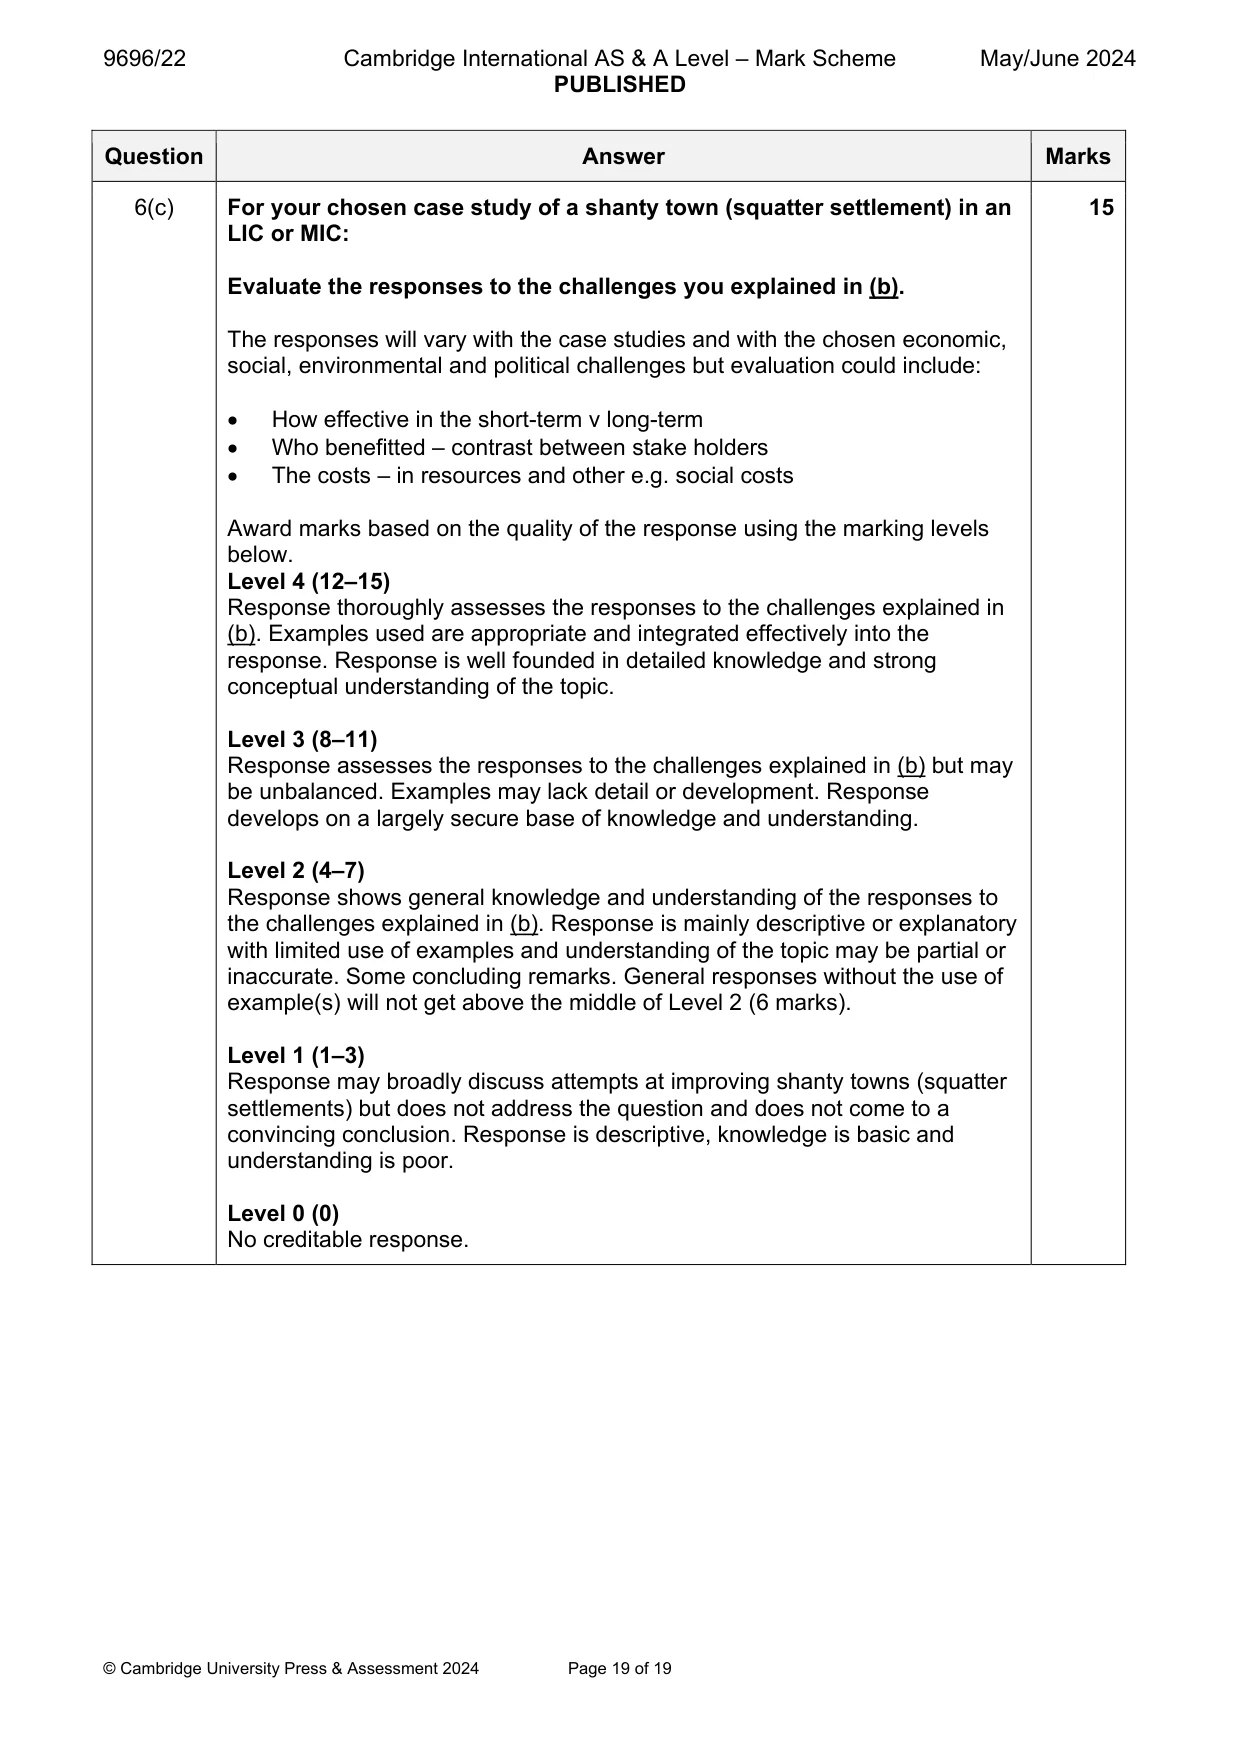
9696/22 Cambridge International AS & A Level – Mark Scheme PUBLISHED May/June 2024 © Cambridge University Press & Assessment 2024 Page 19 of 19 Question Answer Marks 6(c) For your chosen case study of a shanty town (squatter settlement) in an LIC or MIC: Evaluate the responses to the challenges you explained in (b). The responses will vary with the case studies and with the chosen economic, social, environmental and political challenges but evaluation could include: How effective in the short-term v long-term Who benefitted – contrast between stake holders The costs – in resources and other e.g. social costs Award marks based on the quality of the response using the marking levels below. Level 4 (12–15) Response thoroughly assesses the responses to the challenges explained in (b). Examples used are appropriate and integrated effectively into the response. Response is well founded in detailed knowledge and strong conceptual understanding of the topic. Level 3 (8–11) Response assesses the responses to the challenges explained in (b) but may be unbalanced. Examples may lack detail or development. Response develops on a largely secure base of knowledge and understanding. Level 2 (4–7) Response shows general knowledge and understanding of the responses to the challenges explained in (b). Response is mainly descriptive or explanatory with limited use of examples and understanding of the topic may be partial or inaccurate. Some concluding remarks. General responses without the use of example(s) will not get above the middle of Level 2 (6 marks). Level 1 (1–3) Response may broadly discuss attempts at improving shanty towns (squatter settlements) but does not address the question and does not come to a convincing conclusion. Response is descriptive, knowledge is basic and understanding is poor. Level 0 (0) No creditable response. 15
What you needed in this session
Cambridge’s own grade thresholds for 2024 May/June, Paper 2 · Variant 2. A higher threshold means an easier paper — the bar moves with how the cohort did.