Cambridge A Level Geography 9696 — 2021 May/June Paper 4 · Variant 2
9696/42/M/J/21 · 12 questions · 60 marks · ≈68 min
The question paper and its mark scheme, free to read here and free to download. This is Cambridge’s own paper, exactly as it was sat.
Question paper4 pages


Mark scheme26 pages
Answers below. Sit the paper first if you are practising.








Questions as text
Q1 · Percentage of farms and percentage of agricultural land, by farm size, in the EU in 2016
1 Fig. 1.1 shows percentage of farms and percentage of agricultural land, by farm size, in the EU in 2016. (a) Describe the main characteristics of farms in the EU shown in Fig. 1.1. [4] (b) Explain how agricultural practices on small farms can lead to high production. [6]
Mark scheme: Question Answer Marks 1(a) Fig. 1.1 shows percentage of farms and percentage of agricultural 4 land, by farm size, in the EU in 2016. Describe the main characteristics of farms in the EU shown in Fig. 1.1. Fig. 1.1 shows that most of the farms in the EU are small (1), about two thirds being less than 5 hectares (1), but that most of the overall agricultural area is taken by large farms (1), more than half the area is taken by 3% of the farms (1). The overall trend changes at 19.9 hectares (1); even/similar distribution between 5 and 19.9 (1); other valid comment. These main characteristics may be phrased differently, and the support given in the examples may be offered to support any point which is a main characteristic. There should be support using data on at least two occasions for max. 4. 1(b) Explain how agricultural practices on small farms can lead to high 6 production. Candidates should explain how agricultural practices on small farms can lead to high production. High production may be in terms of amount or could be expressed as productivity per person and/or per hectare. A comprehensive answer is not required for full marks. Expect content on intensive agriculture and intensification of agriculture, which may come about because some of the following practices are used: • High inputs such as: capital, labour, fertilisers – natural or manufactured, herbicides or pesticides, water, specialised machinery, etc. • Artificial environments such as: greenhouses/polytunnels, indoor rearing of animals • Technology • High yielding varieties/GM seeds • skills, training (i.e. not just high labour input but quality) • knowledge of specific techniques on small farms, such as intercropping (multiple-cropping) or catch cropping, e.g. radishes which can be grown quickly between main crops • other A characteristic of a Level 3 response may be that the candidate clearly links the ‘how’ to the ‘high production’, e.g. ‘high inputs of family labour (unpaid) may remove competing weeds so the crop has more resources from the soil and produces more’. Award marks based on the quality of explanation and breadth of the response using the marking levels below. Level 3 (5–6) Response clearly explains using two or more reasons how agricultural practices on small farms can lead to high production. Response is well founded in detailed knowledge and strong conceptual understanding of the topic. Any examples used are appropriate and integrated effectively into the response. Level 2 (3–4) Response explains with some development how agricultural practices on small farms can lead to high production or focuses on only one reason. Response develops on a largely secure base of knowledge and understanding. Examples may lack detail or development. Level 1 (1–2) Response comprises one or more descriptive points about small farms but with little explanation of how agricultural practices on small farms can lead to high production. Knowledge is basic and understanding may be inaccurate. Examples are in name only or lacking entirely. Level 0 (0) No creditable response.
Q2 · ‘Problems created by the extension of cultivation are greater than the benefits gained.’…
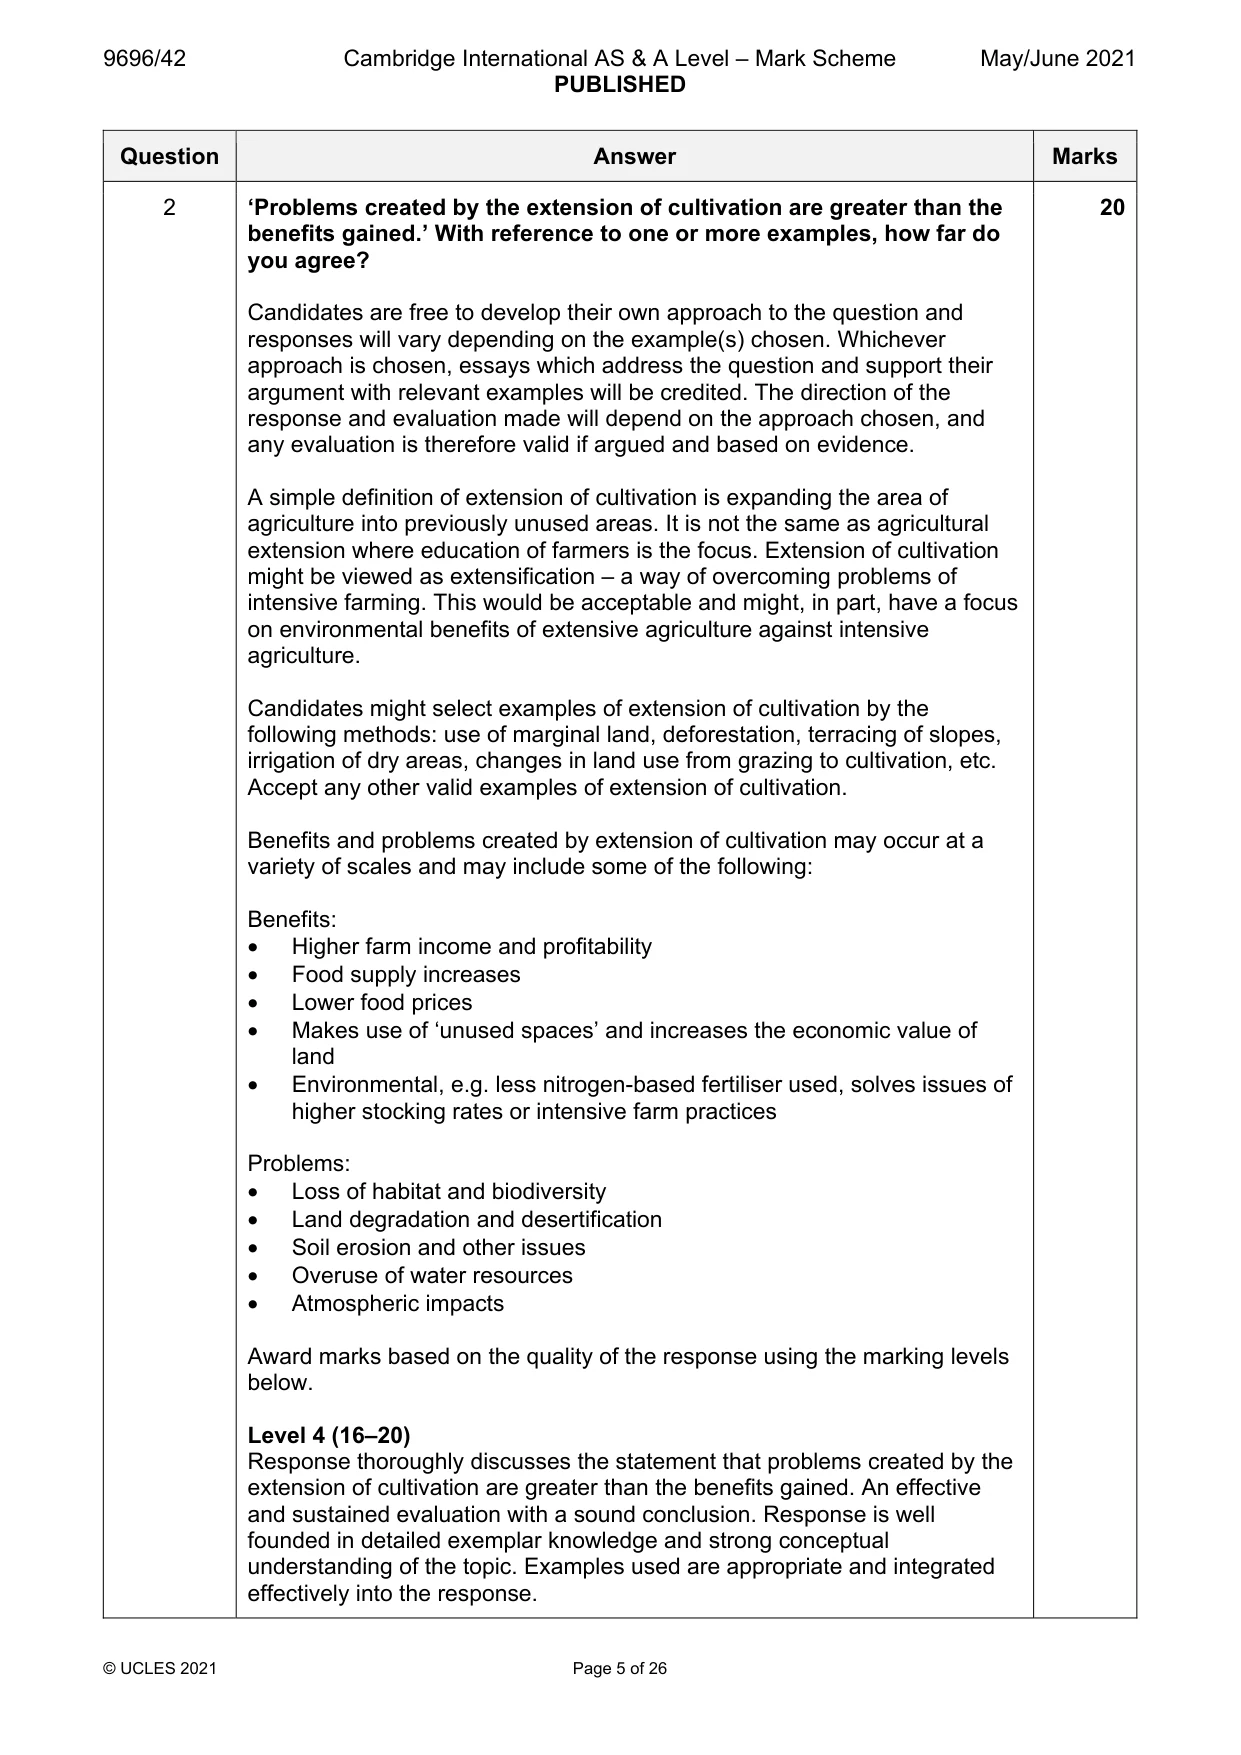
2 ‘Problems created by the extension of cultivation are greater than the benefits gained.’ With reference to one or more examples, how far do you agree? [20]
Mark scheme: 2 ‘Problems created by the extension of cultivation are greater than the 20 benefits gained.’ With reference to one or more examples, how far do you agree? Candidates are free to develop their own approach to the question and responses will vary depending on the example(s) chosen. Whichever approach is chosen, essays which address the question and support their argument with relevant examples will be credited. The direction of the response and evaluation made will depend on the approach chosen, and any evaluation is therefore valid if argued and based on evidence. A simple definition of extension of cultivation is expanding the area of agriculture into previously unused areas. It is not the same as agricultural extension where education of farmers is the focus. Extension of cultivation might be viewed as extensification – a way of overcoming problems of intensive farming. This would be acceptable and might, in part, have a focus on environmental benefits of extensive agriculture against intensive agriculture. Candidates might select examples of extension of cultivation by the following methods: use of marginal land, deforestation, terracing of slopes, irrigation of dry areas, changes in land use from grazing to cultivation, etc. Accept any other valid examples of extension of cultivation. Benefits and problems created by extension of cultivation may occur at a variety of scales and may include some of the following: Benefits: • Higher farm income and profitability • Food supply increases • Lower food prices • Makes use of ‘unused spaces’ and increases the economic value of land • Environmental, e.g. less nitrogen-based fertiliser used, solves issues of higher stocking rates or intensive farm practices Problems: • Loss of habitat and biodiversity • Land degradation and desertification • Soil erosion and other issues • Overuse of water resources • Atmospheric impacts Award marks based on the quality of the response using the marking levels below. Level 4 (16–20) Response thoroughly discusses the statement that problems created by the extension of cultivation are greater than the benefits gained. An effective and sustained evaluation with a sound conclusion. Response is well founded in detailed exemplar knowledge and strong conceptual understanding of the topic. Examples used are appropriate and integrated effectively into the response. 2 Level 3 (11–15) Response discusses the statement that problems created by the extension of cultivation are greater than the benefits gained. Response is broadly evaluative in character, comprising some explanatory or narrative content and a conclusion. Response develops on a largely secure base of knowledge and understanding with the use of example(s). Level 2 (6–10) Response demonstrates some knowledge and understanding of the problems and benefits created by the extension of cultivation. Response is mainly descriptive or explanatory in approach and contains a brief or thinly supported evaluation. Responses without the use of example(s) to support the response will not get above the middle of Level 2 (8 marks). Level 1 (1–5) Response makes a few general points about extension of cultivation. A descriptive response comprising a few simple points. Knowledge is basic and understanding may be poor and lack relevance to the question set. Level 0 (0) No creditable response.
Q3 · Evaluate the role of labour as a factor in the location of manufacturing and related…
3 Evaluate the role of labour as a factor in the location of manufacturing and related service industry. [20] Environmental management If answering this option, answer Question 4 and either Question 5 or Question 6.
Mark scheme: 3 Evaluate the role of labour as a factor in the location of manufacturing 20 and related service industry. Candidates are free to develop their own approach to the question and responses will vary depending on the example(s) chosen. Whichever approach is chosen, essays which address the question and support their argument with relevant examples will be credited. The direction of the response and evaluation made will depend on the approach chosen, and any evaluation is therefore valid if argued and based on evidence. There must be a clear attempt to evaluate the role of labour as a factor in the location of manufacturing and related service industry. One approach may be evaluative comment on the role distinguishing between various aspects of labour which are more or less important for locational decision making. A dynamic approach considering factors such as: historical change, the sectoral spatial division of labour, the role of labour in different types of industry, or the product life cycle, etc., would be valid. Location could be considered with respect to general locations, e.g. high skills areas, but there must be some specific areas or locations, though this could still be quite broadly expressed, e.g. low wage rates in Asia in comparison to Europe. The labour factor may be broken down to include: • Quantity • Quality and skills • Cost in terms of wage rates, non-wage expenses, unit costs and productivity • Reputation • Degree of unionisation/protection of workers’ rights • Level of automation • Other Another approach may be developed by evaluating the role of labour against other factors, but other factors should not dominate a response. Other factors could be land, capital, market, materials, economies and diseconomies of scale, inertia, transport and government policies. Award marks based on the quality of the response using the marking levels below. Level 4 (16–20) Response thoroughly discusses the role of labour as a factor in the location of manufacturing and related service industry. An effective and sustained evaluation with a sound conclusion. Response is well founded in detailed exemplar knowledge and strong conceptual understanding of the topic. Examples used are appropriate and integrated effectively into the response. 3 Level 3 (11–15) Response discusses the role of labour as a factor in the location of manufacturing and related service industry. Response is broadly evaluative in character, comprising some explanatory or narrative content and a conclusion. Response develops on a largely secure base of knowledge and understanding with the use of example(s). Level 2 (6–10) Response demonstrates some knowledge and understanding of the role of labour and/or other factors in the location of manufacturing and related service industry. Response is mainly descriptive or explanatory in approach and contains a brief or thinly supported evaluation. Responses without the use of example(s) to support the response will not get above the middle of Level 2 (8 marks). Level 1 (1–5) Response makes a few general points about the location of industry and/or labour as a factor. A descriptive response comprising a few simple points. Knowledge is basic and understanding may be poor and lack relevance to the question set. Level 0 (0) No creditable response. Environmental management If answering this option, answer Question 4 and either Question 5 or Question 6.
Q4 · A photograph which shows wind turbines in Andalucía, Spain, an HIC in Europe
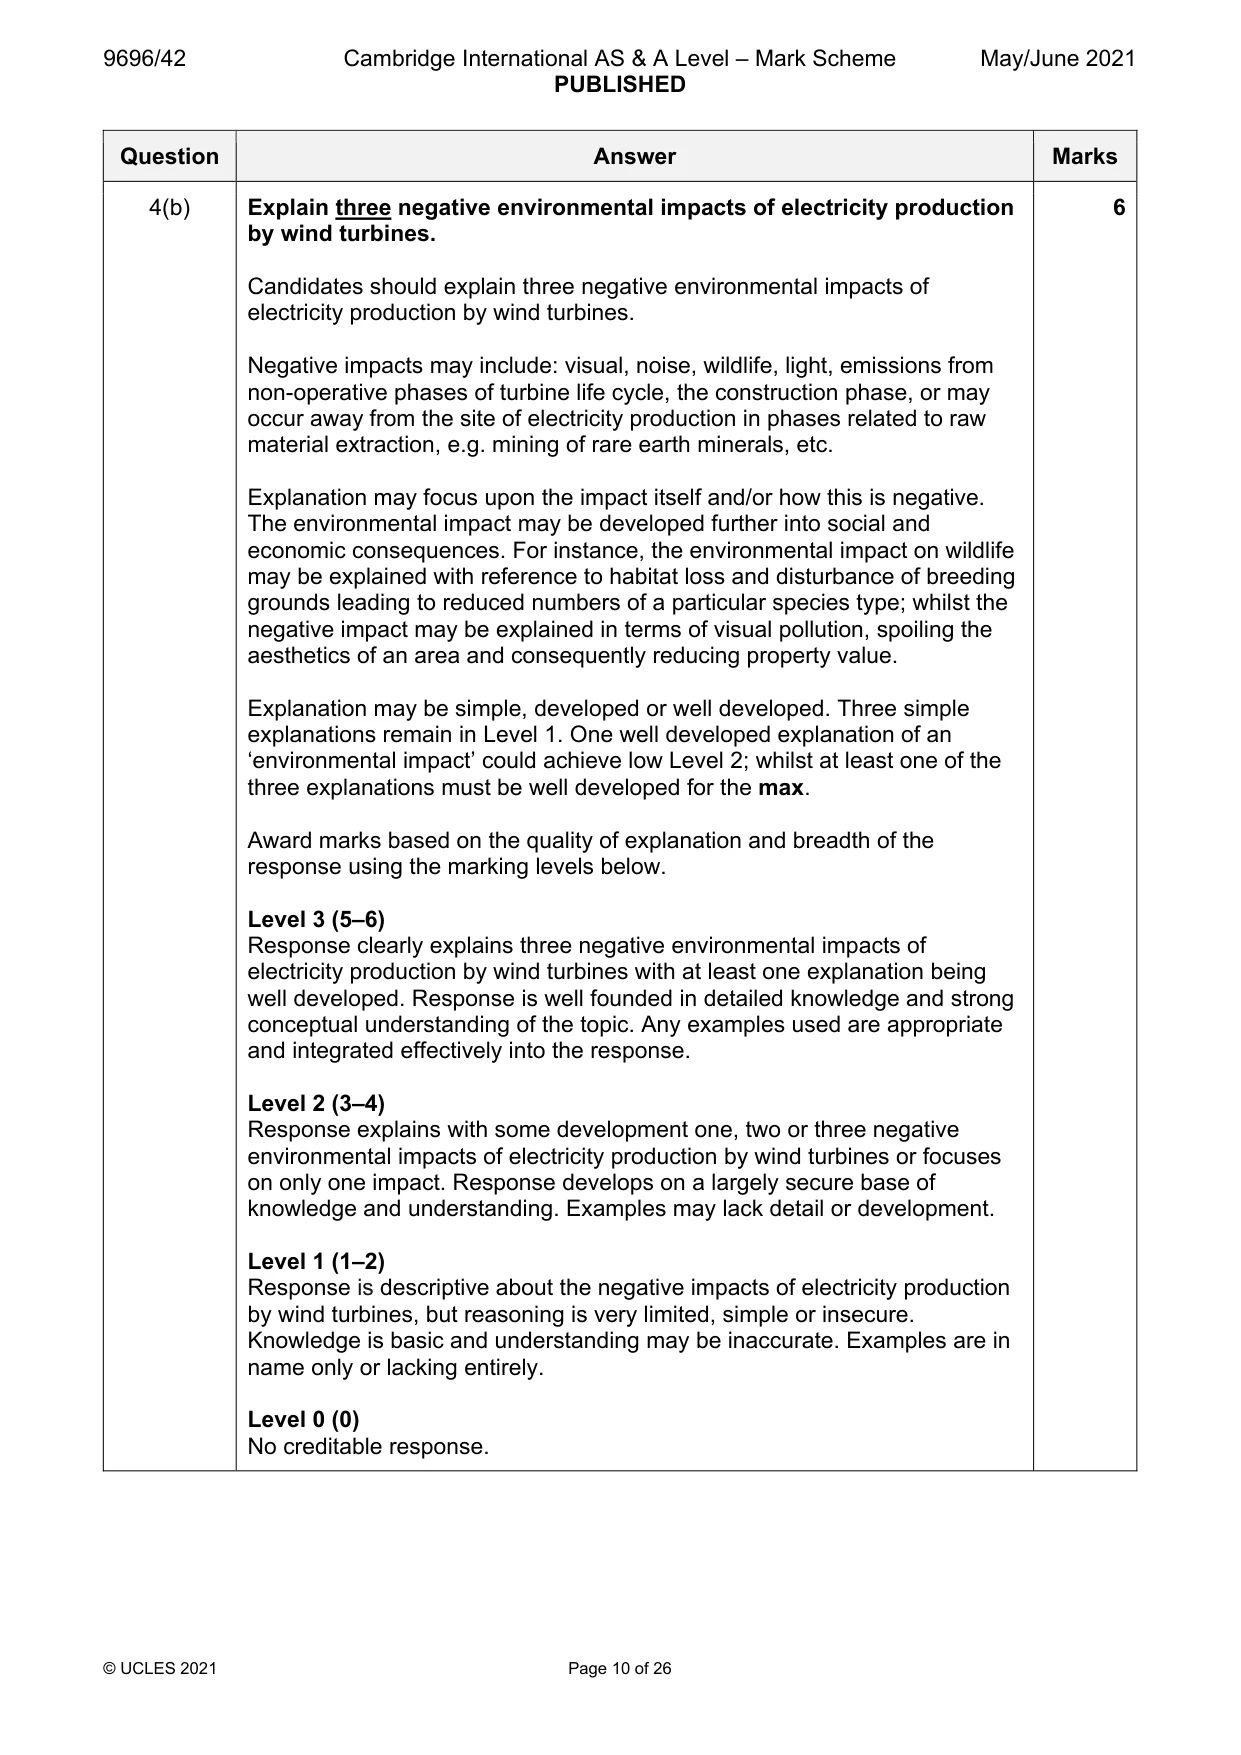
4 Fig. 4.1 is a photograph which shows wind turbines in Andalucía, Spain, an HIC in Europe. (a) Using evidence from Fig. 4.1, suggest reasons why this location was chosen for the wind turbines. [4] (b) Explain three negative environmental impacts of electricity production by wind turbines. [6]
Mark scheme: 4(a) Fig. 4.1 is a photograph which shows wind turbines in Andalucía, 4 Spain, an HIC in Europe. Using evidence from Fig. 4.1, suggest reasons why this location was chosen for the wind turbines. Candidates should suggest reasons why this location was chosen for the wind turbines. This involves skills in photographic interpretation and application of knowledge and understanding of locating wind turbines. Evidence and reasons may include: • Mountain/hilly landscape suggestive of high wind speeds • Exposed/no buildings or obstacles • No signs of settlement – avoids upsetting people with noise or visual pollution • Ridge with a flat top – ideal for construction of turbines • Steep slopes suggestive of low value land/lack of alternative land uses – reduces initial cost/provides alternative source of income • Avoided removing trees, available land – see commercial forest on higher slopes behind • Other For a valid reason with evidence from the photograph 1 mark. 4(b) Explain three negative environmental impacts of electricity production 6 by wind turbines. Candidates should explain three negative environmental impacts of electricity production by wind turbines. Negative impacts may include: visual, noise, wildlife, light, emissions from non-operative phases of turbine life cycle, the construction phase, or may occur away from the site of electricity production in phases related to raw material extraction, e.g. mining of rare earth minerals, etc. Explanation may focus upon the impact itself and/or how this is negative. The environmental impact may be developed further into social and economic consequences. For instance, the environmental impact on wildlife may be explained with reference to habitat loss and disturbance of breeding grounds leading to reduced numbers of a particular species type; whilst the negative impact may be explained in terms of visual pollution, spoiling the aesthetics of an area and consequently reducing property value. Explanation may be simple, developed or well developed. Three simple explanations remain in Level 1. One well developed explanation of an ‘environmental impact’ could achieve low Level 2; whilst at least one of the three explanations must be well developed for the max. Award marks based on the quality of explanation and breadth of the response using the marking levels below. Level 3 (5–6) Response clearly explains three negative environmental impacts of electricity production by wind turbines with at least one explanation being well developed. Response is well founded in detailed knowledge and strong conceptual understanding of the topic. Any examples used are appropriate and integrated effectively into the response. Level 2 (3–4) Response explains with some development one, two or three negative environmental impacts of electricity production by wind turbines or focuses on only one impact. Response develops on a largely secure base of knowledge and understanding. Examples may lack detail or development. Level 1 (1–2) Response is descriptive about the negative impacts of electricity production by wind turbines, but reasoning is very limited, simple or insecure. Knowledge is basic and understanding may be inaccurate. Examples are in name only or lacking entirely. Level 0 (0) No creditable response.
Q5 · ‘The best way to achieve energy security for LICs/MICs is to use renewable energy…
5 ‘The best way to achieve energy security for LICs/MICs is to use renewable energy resources.’ With reference to one or more examples, how far do you agree? [20]
Mark scheme: 5 ‘The best way to achieve energy security for LICs/MICs is to use 20 renewable energy resources.’ With reference to one or more examples, how far do you agree? Candidates are free to develop their own approach to the question and responses will vary depending on the example(s) chosen. Whichever approach is chosen, essays which address the question and support their argument with relevant examples will be credited. The direction of the response and evaluation made will depend on the approach chosen, and any evaluation is therefore valid if argued and based on evidence. Energy security may be seen as: the ability of a country to provide an uninterrupted supply, at an affordable price, for both the long-term and short-term, though this is not the only way of expressing energy security. There must be an assessment of how far the candidate agrees with the statement. A judgement about ‘the best way to achieve energy security’ may have a dynamic nature and could refer to plans for the future as well as specific current or recent details. Energy security may be achieved through international cooperation. The scale should vary from supply for individuals as well as for the economy in general. There is a clear opportunity to consider spatial differences both within and between countries. There is not a requirement to consider both LICs and MICs. Candidates should explore how renewable energy sources may or may not be the best way to achieve energy security and candidates might consider the role of non-renewable sources, but the response should not be dominated by consideration of non-renewable sources. Overall, the direction of the response is more than just the pros and cons of renewable and non- renewable energy sources. Award marks based on the quality of the response using the marking levels below. Level 4 (16–20) Response thoroughly discusses how far they agree that the best way to achieve energy security for LICs/MICs is to use renewable energy resources. An effective and sustained evaluation with a sound conclusion. Response is well founded in detailed exemplar knowledge and strong conceptual understanding of the topic. Examples used are appropriate and integrated effectively into the response. Level 3 (11–15) Response discusses how far they agree that the best way to achieve energy security for LICs/MICs is to use renewable energy resources. Response is broadly evaluative in character, comprising some explanatory or narrative content and a conclusion. Response develops on a largely secure base of knowledge and understanding with the use of example(s). 5 Level 2 (6–10) Response demonstrates some knowledge and understanding of ways to achieve energy security for LICs/MICs and the use of renewable energy resources. Response is mainly descriptive or explanatory in approach and contains a brief or thinly supported evaluation. Responses without the use of example(s) to support the response will not get above the middle of Level 2 (8 marks). Level 1 (1–5) Response makes a few general points about energy security and/or the use of renewables and may lack focus on the context of LICs/MICs. A descriptive response comprising a few simple points. Knowledge is basic and understanding may be poor and lack relevance to the question set. Level 0 (0) No creditable response.
Q6 · Evaluate the view that a high level of economic development does not always result in…
6 Evaluate the view that a high level of economic development does not always result in good air quality. [20] Global interdependence If answering this option, answer Question 7 and either Question 8 or Question 9.
Mark scheme: 6 Evaluate the view that a high level of economic development does not 20 always result in good air quality. Candidates are free to develop their own approach to the question and responses will vary depending on the example(s) chosen. Whichever approach is chosen, essays which address the question and support their argument with relevant examples will be credited. The direction of the response and evaluation made will depend on the approach chosen, and any evaluation is therefore valid if argued and based on evidence. There must be an evaluation of the view that a high level of economic development does not always result in good air quality. The evaluation should consider how a high level of economic development may or may not result in healthy air quality, with some discussion of the idea of ‘always’. The context may be HICs; however, where the examples are from countries with a high level of economic growth, this is a valid approach. The syllabus refers to nature, causes and solutions of pollution which allows candidates to consider the effectiveness of solutions and how this is related to the context of a high level of economic development. It also refers to environmental degradation of rural and urban environments, so reference to causal factors such as overpopulation, poor agricultural practices, deforestation, urbanisation, industrial development or inadequate waste management or any other causes are valid. Reference to GHGs needs to be clearly linked to air quality. Award marks based on the quality of the response using the marking levels below. Level 4 (16–20) Response thoroughly discusses the extent of agreement that a high level of economic development does not always result in good air quality. An effective and sustained evaluation with a sound conclusion. Response is well founded in detailed exemplar knowledge and strong conceptual understanding of the topic. Examples used are appropriate and integrated effectively into the response. Level 3 (11–15) Response discusses the extent of agreement that a high level of economic development does not always result in good air quality. Response is broadly evaluative in character, comprising some explanatory or narrative content and a conclusion. Response develops on a largely secure base of knowledge and understanding with the use of example(s). Level 2 (6–10) Response demonstrates some knowledge and understanding of the causes of air pollution and considers how a high level of economic development and air quality are related. Response is mainly descriptive or explanatory in approach and contains a brief or thinly supported evaluation. Responses without the use of example(s) to support the response will not get above the middle of Level 2 (8 marks). 6 Level 1 (1–5) Response makes a few general points about air quality. A descriptive response comprising a few simple points. Knowledge is basic and understanding may be poor and lack relevance to the question set. Level 0 (0) No creditable response. Global interdependence If answering this option, answer Question 7 and either Question 8 or Question 9.
Q7 · Net overseas development aid (US$) received per person in South America in 2015
7 Fig. 7.1 shows net overseas development aid (US$) received per person in South America in 2015. Fig. 7.2 shows the countries of South America. (a) Describe the pattern of net overseas development aid shown in Fig. 7.1. [4] (b) Explain the benefits for donor countries of giving aid. [6]
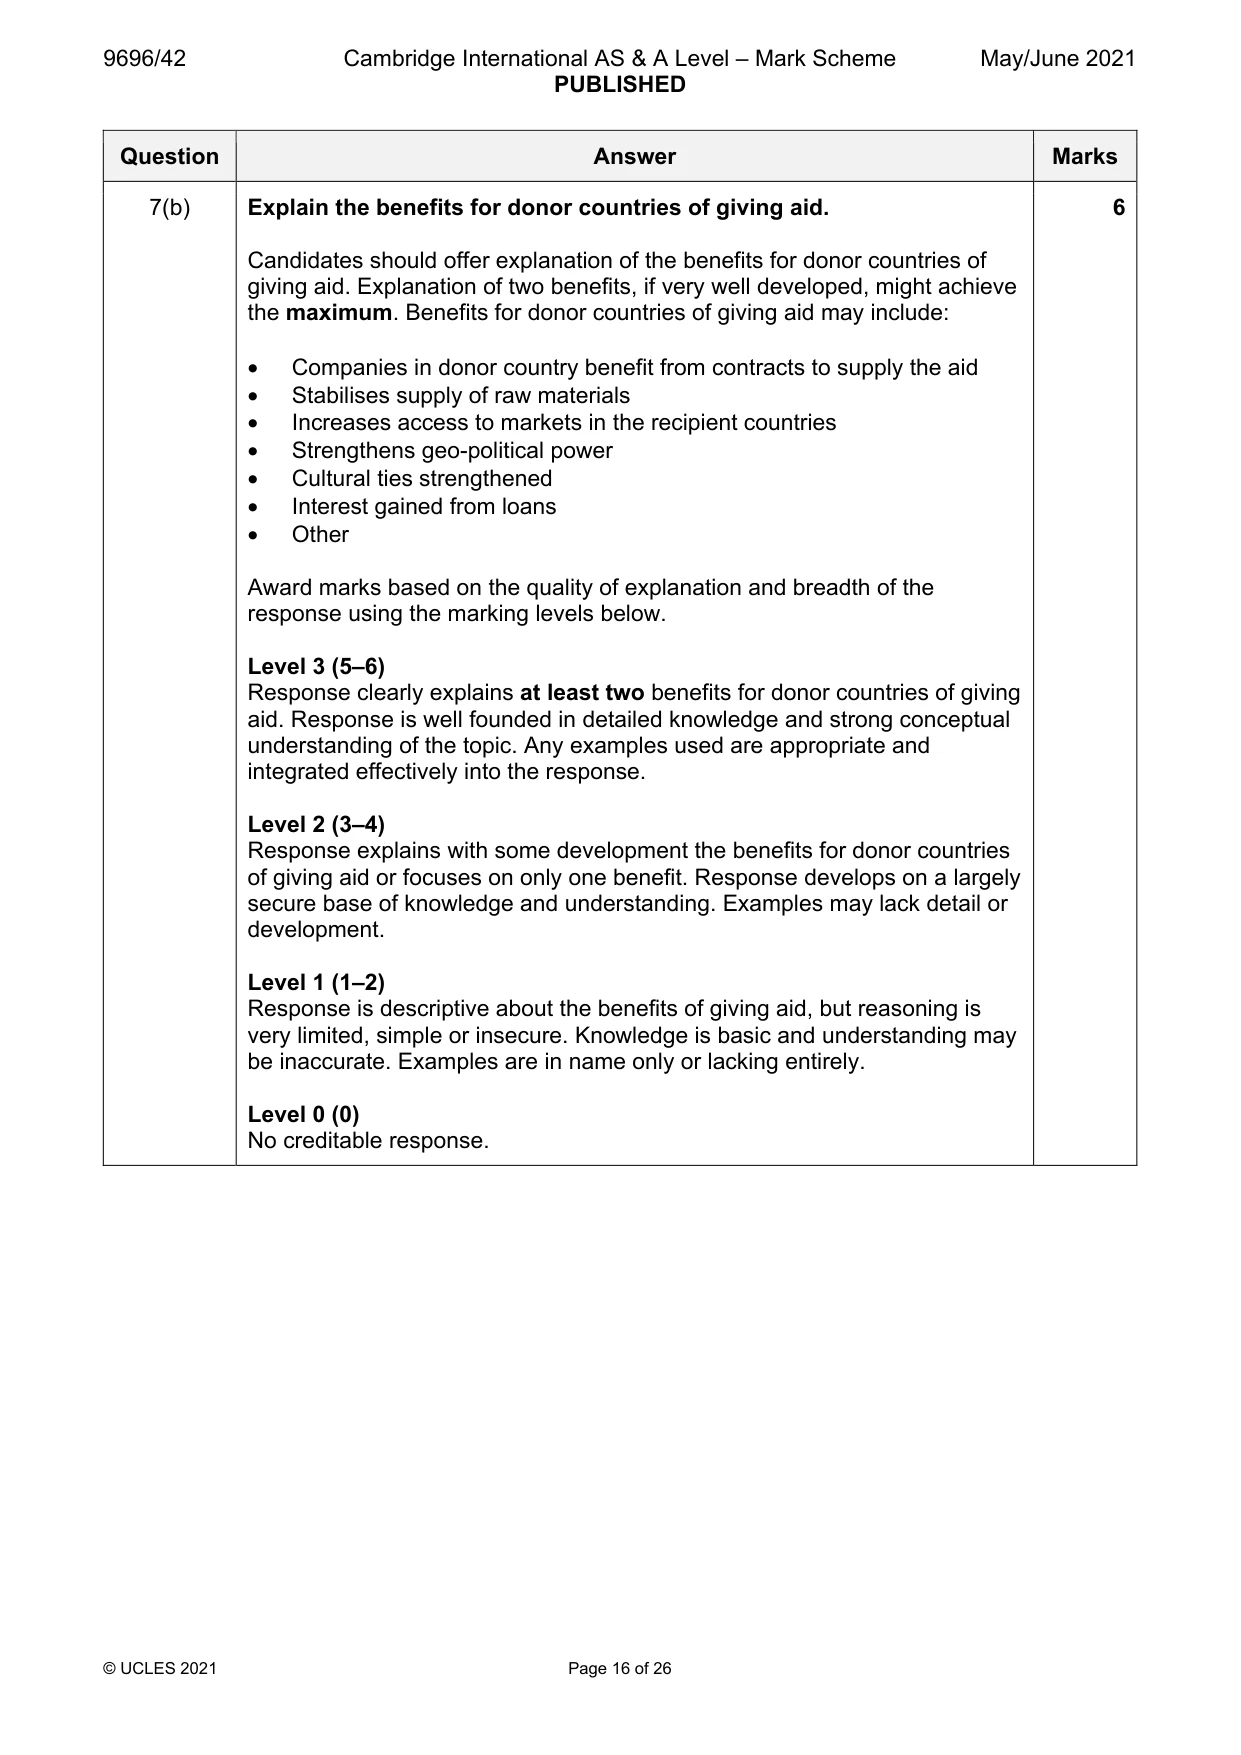
Mark scheme: 7(a) Fig. 7.1 shows net overseas development aid (US$) received per 4 person in South America in 2015. Fig. 7.2 shows the countries of South America. Describe the pattern of net overseas development aid shown in Fig. 7.1. Candidates should describe the pattern of net ODA shown in Fig. 7.1, using names of countries from Fig. 7.2. • There is no clear pattern. • Bolivia and Venezuela are anomalies within their region. • The north-west is generally higher than the south-east, for example, three western countries, Columbia, Ecuador and Peru, are all 10.0– 29.9. • There is a weak north/south and east to west pattern. • Bolivia in the centre is highest and/or Argentina in the south is the lowest. • Argentina is below 0.0; all other countries receive development aid. • Most are between 0 and 29.9. 1 mark for each valid description of the pattern. 7(b) Explain the benefits for donor countries of giving aid. 6 Candidates should offer explanation of the benefits for donor countries of giving aid. Explanation of two benefits, if very well developed, might achieve the maximum. Benefits for donor countries of giving aid may include: • Companies in donor country benefit from contracts to supply the aid • Stabilises supply of raw materials • Increases access to markets in the recipient countries • Strengthens geo-political power • Cultural ties strengthened • Interest gained from loans • Other Award marks based on the quality of explanation and breadth of the response using the marking levels below. Level 3 (5–6) Response clearly explains at least two benefits for donor countries of giving aid. Response is well founded in detailed knowledge and strong conceptual understanding of the topic. Any examples used are appropriate and integrated effectively into the response. Level 2 (3–4) Response explains with some development the benefits for donor countries of giving aid or focuses on only one benefit. Response develops on a largely secure base of knowledge and understanding. Examples may lack detail or development. Level 1 (1–2) Response is descriptive about the benefits of giving aid, but reasoning is very limited, simple or insecure. Knowledge is basic and understanding may be inaccurate. Examples are in name only or lacking entirely. Level 0 (0) No creditable response.
Q8 · Evaluate the view that it is the lenders who are responsible for the international debt…
8 Evaluate the view that it is the lenders who are responsible for the international debt crisis. [20]
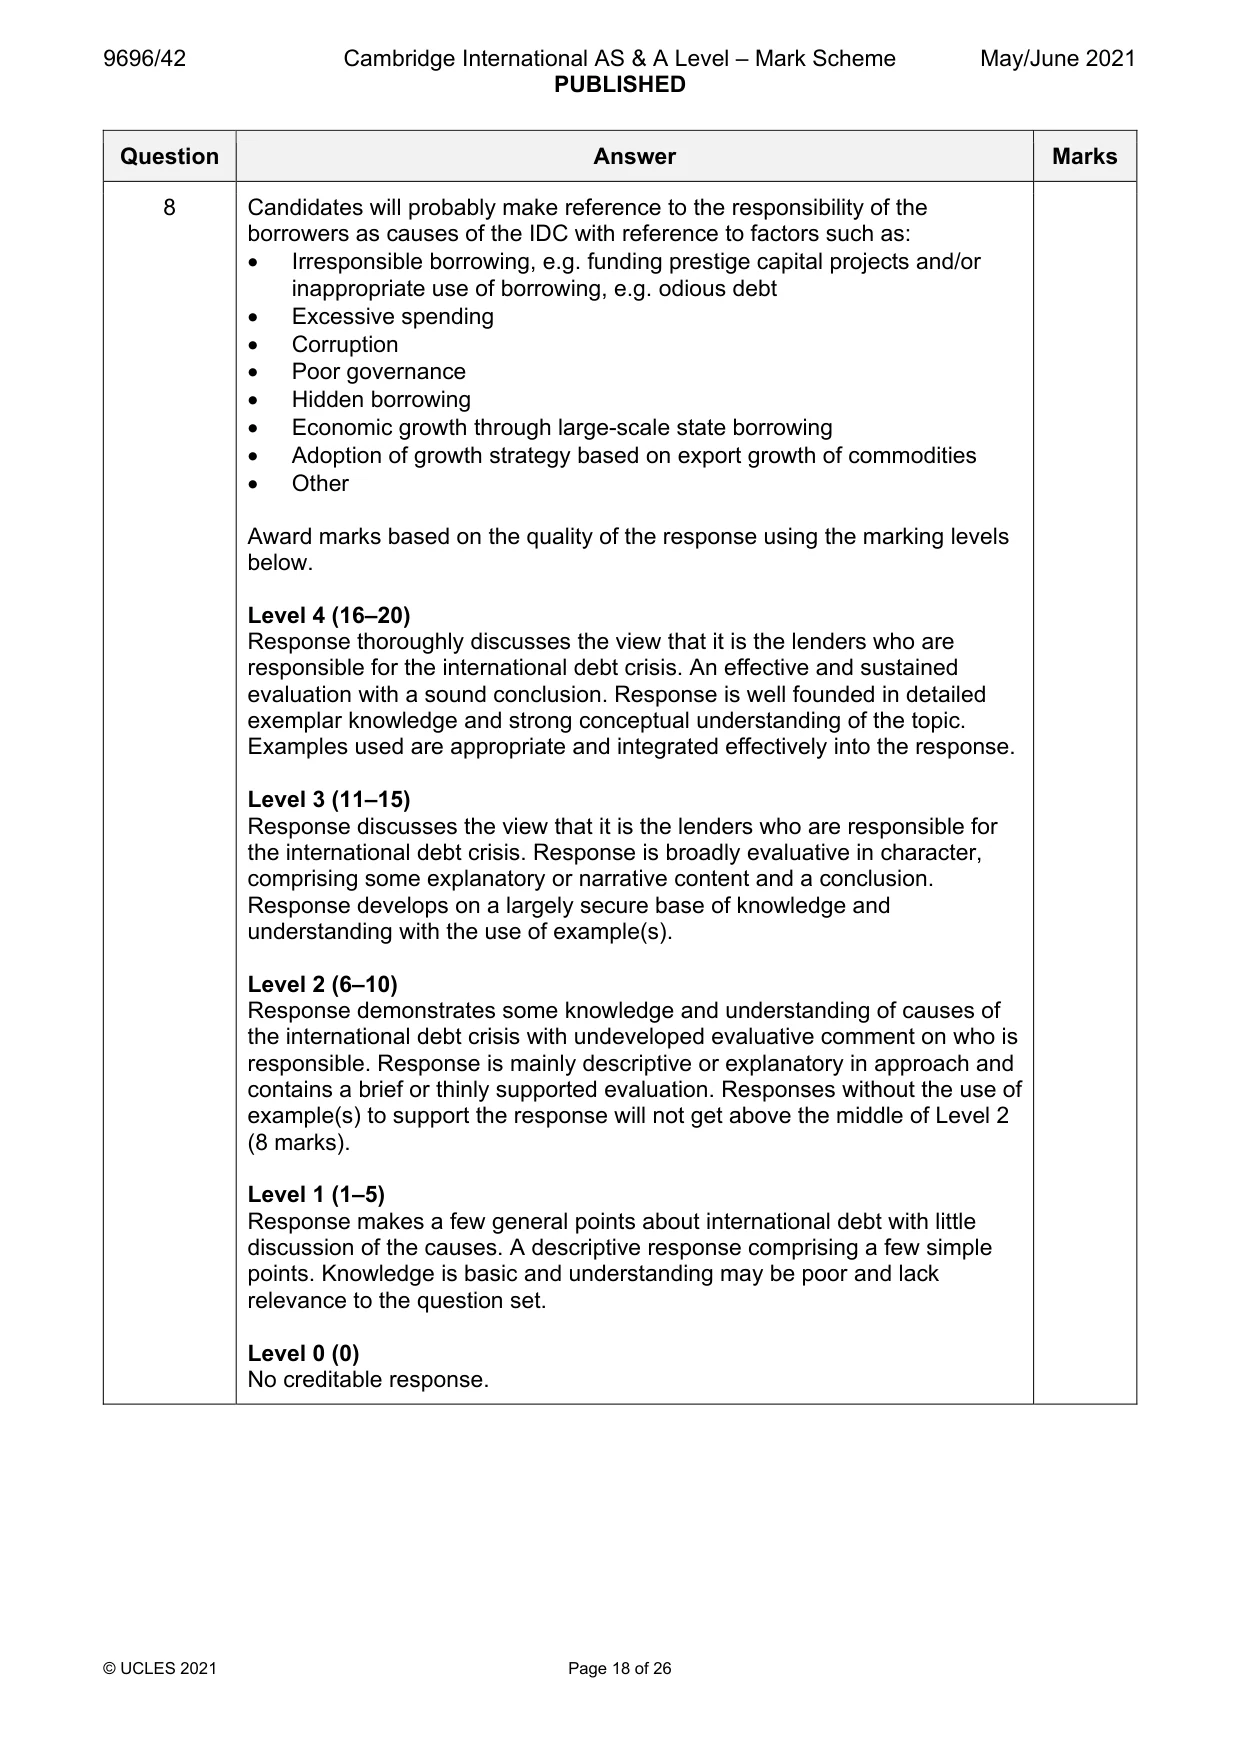
Mark scheme: 8 Evaluate the view that it is the lenders who are responsible for the 20 international debt crisis. Candidates are free to develop their own approach to the question and responses will vary depending on the example(s) chosen. Whichever approach is chosen, essays which address the question and support their argument with relevant examples will be credited. The direction of the response and evaluation made will depend on the approach chosen, and any evaluation is therefore valid if argued and based on evidence. In general, the lenders lent money to make a profit from interest payments for themselves and for the sources of capital invested in their organisations. International debt for a country becomes a crisis when there is a large financial imbalance between it and the rest of the world and a large government external debt repayment. The debt may be government or private sector debt and can be for any country, irrespective of its level of development. Candidates may refer to the current international debt crisis (IDC) and/or to those of the 1980s onwards. Some of the causal factors may pre-date this time period. The ‘lenders’ are not just banks but may be governments or multilateral organisations such as the World Bank or IMF. An argument that the view is simplistic and that there are a host of other factors leading to the IDC such as: global recession, inflation, interest rate rises, commodity price fluctuation, currency devaluation, natural disasters, etc., and that ‘who’ is responsible for these may be arguable could form part of a higher level response. The lenders may be seen to cause the IDC because of: • Influx of capital, e.g. petrodollars from OPEC or new lenders such as China • Lending hastily, without sufficient evaluation and monitoring • Aid increasingly given as loans rather than grants • Variable interest rates starting low but rising due to a variety of factors • Search for high interest locations in LICs/MICs as rates are low in HICs • Rescheduling of loans to avoid default • Granting loans to pay interest on existing loans • Forcing austerity measures on debtors leading to less economic activity • Structural Adjustment Programs which attempt to solve the IDC can be critically evaluated • Other 8 Candidates will probably make reference to the responsibility of the borrowers as causes of the IDC with reference to factors such as: • Irresponsible borrowing, e.g. funding prestige capital projects and/or inappropriate use of borrowing, e.g. odious debt • Excessive spending • Corruption • Poor governance • Hidden borrowing • Economic growth through large-scale state borrowing • Adoption of growth strategy based on export growth of commodities • Other Award marks based on the quality of the response using the marking levels below. Level 4 (16–20) Response thoroughly discusses the view that it is the lenders who are responsible for the international debt crisis. An effective and sustained evaluation with a sound conclusion. Response is well founded in detailed exemplar knowledge and strong conceptual understanding of the topic. Examples used are appropriate and integrated effectively into the response. Level 3 (11–15) Response discusses the view that it is the lenders who are responsible for the international debt crisis. Response is broadly evaluative in character, comprising some explanatory or narrative content and a conclusion. Response develops on a largely secure base of knowledge and understanding with the use of example(s). Level 2 (6–10) Response demonstrates some knowledge and understanding of causes of the international debt crisis with undeveloped evaluative comment on who is responsible. Response is mainly descriptive or explanatory in approach and contains a brief or thinly supported evaluation. Responses without the use of example(s) to support the response will not get above the middle of Level 2 (8 marks). Level 1 (1–5) Response makes a few general points about international debt with little discussion of the causes. A descriptive response comprising a few simple points. Knowledge is basic and understanding may be poor and lack relevance to the question set. Level 0 (0) No creditable response.
Q9 · To what extent are economic factors the most important in the growth of international…
9 To what extent are economic factors the most important in the growth of international tourism? [20] Economic transition If answering this option, answer Question 10 and either Question 11 or Question 12.
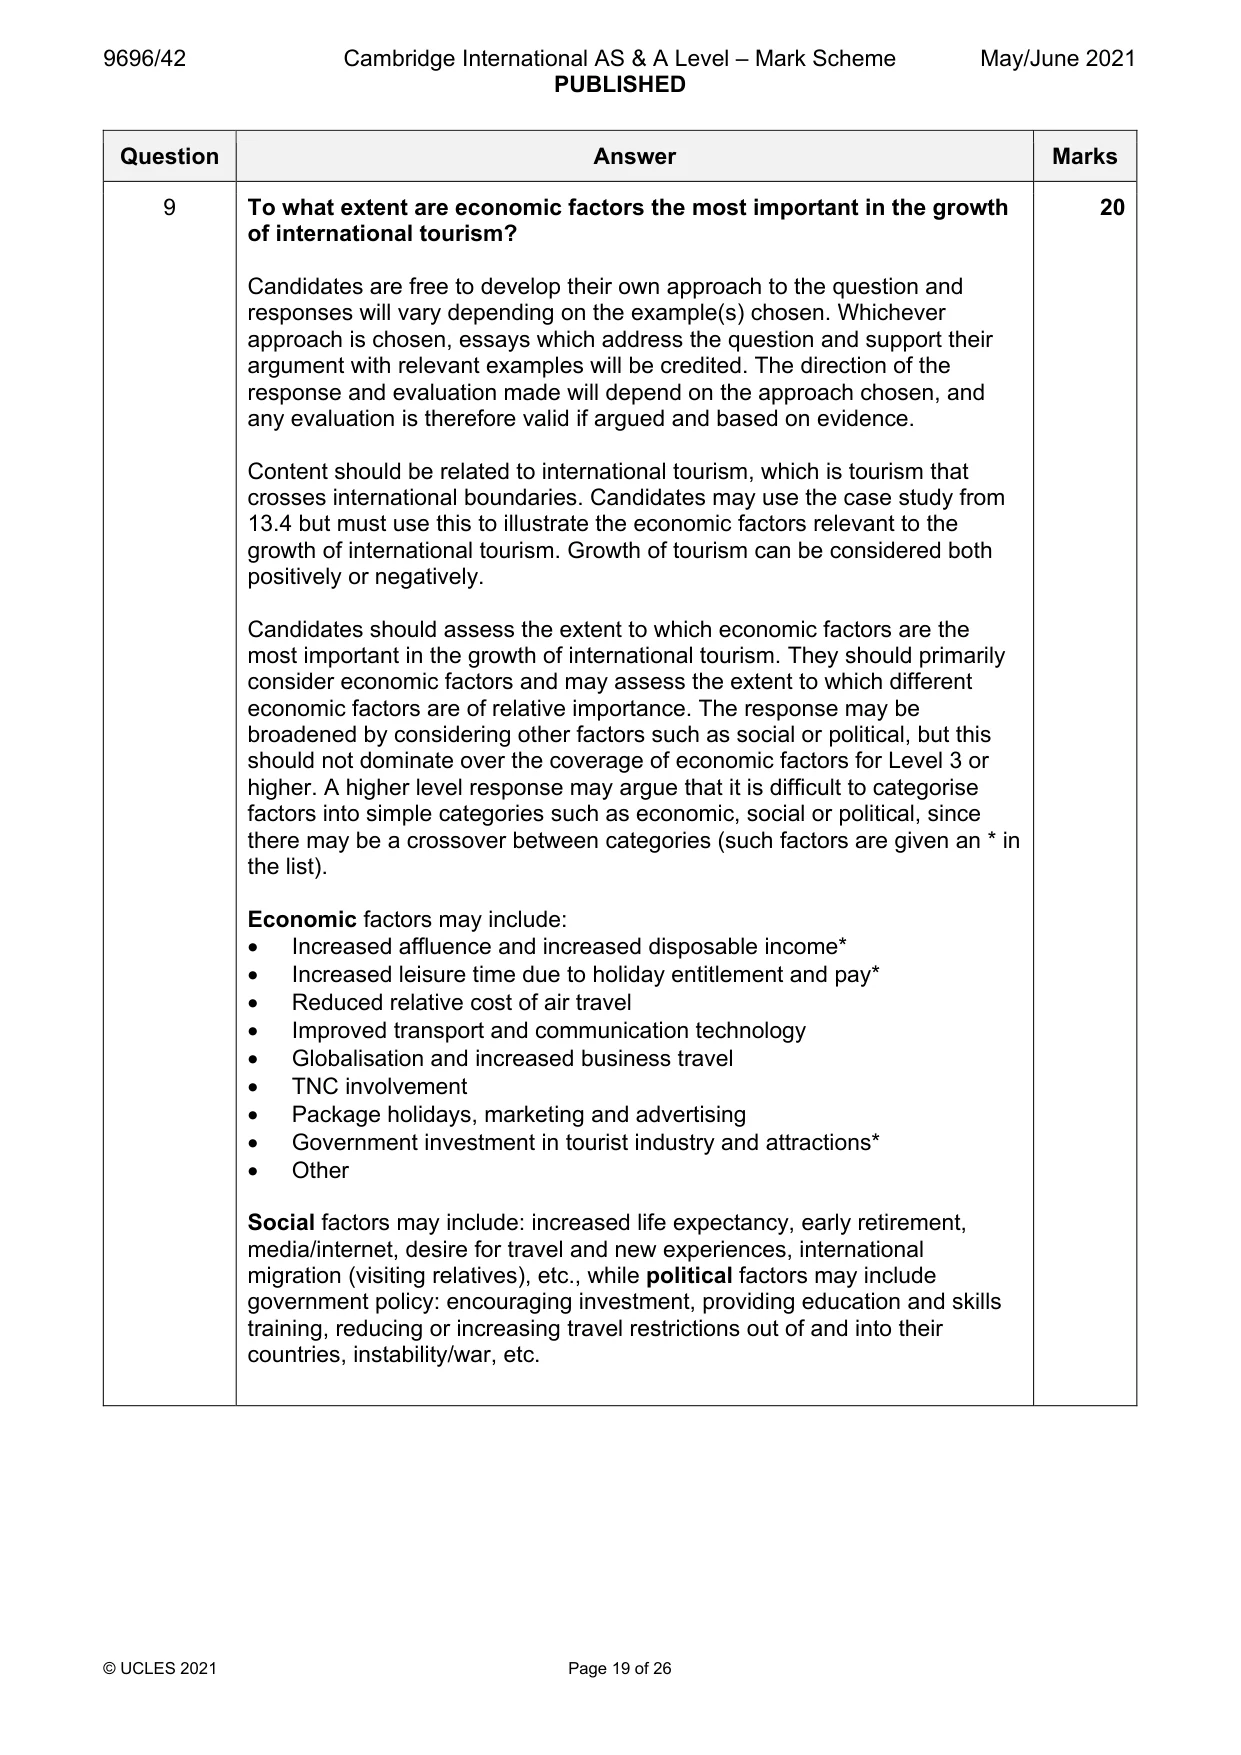
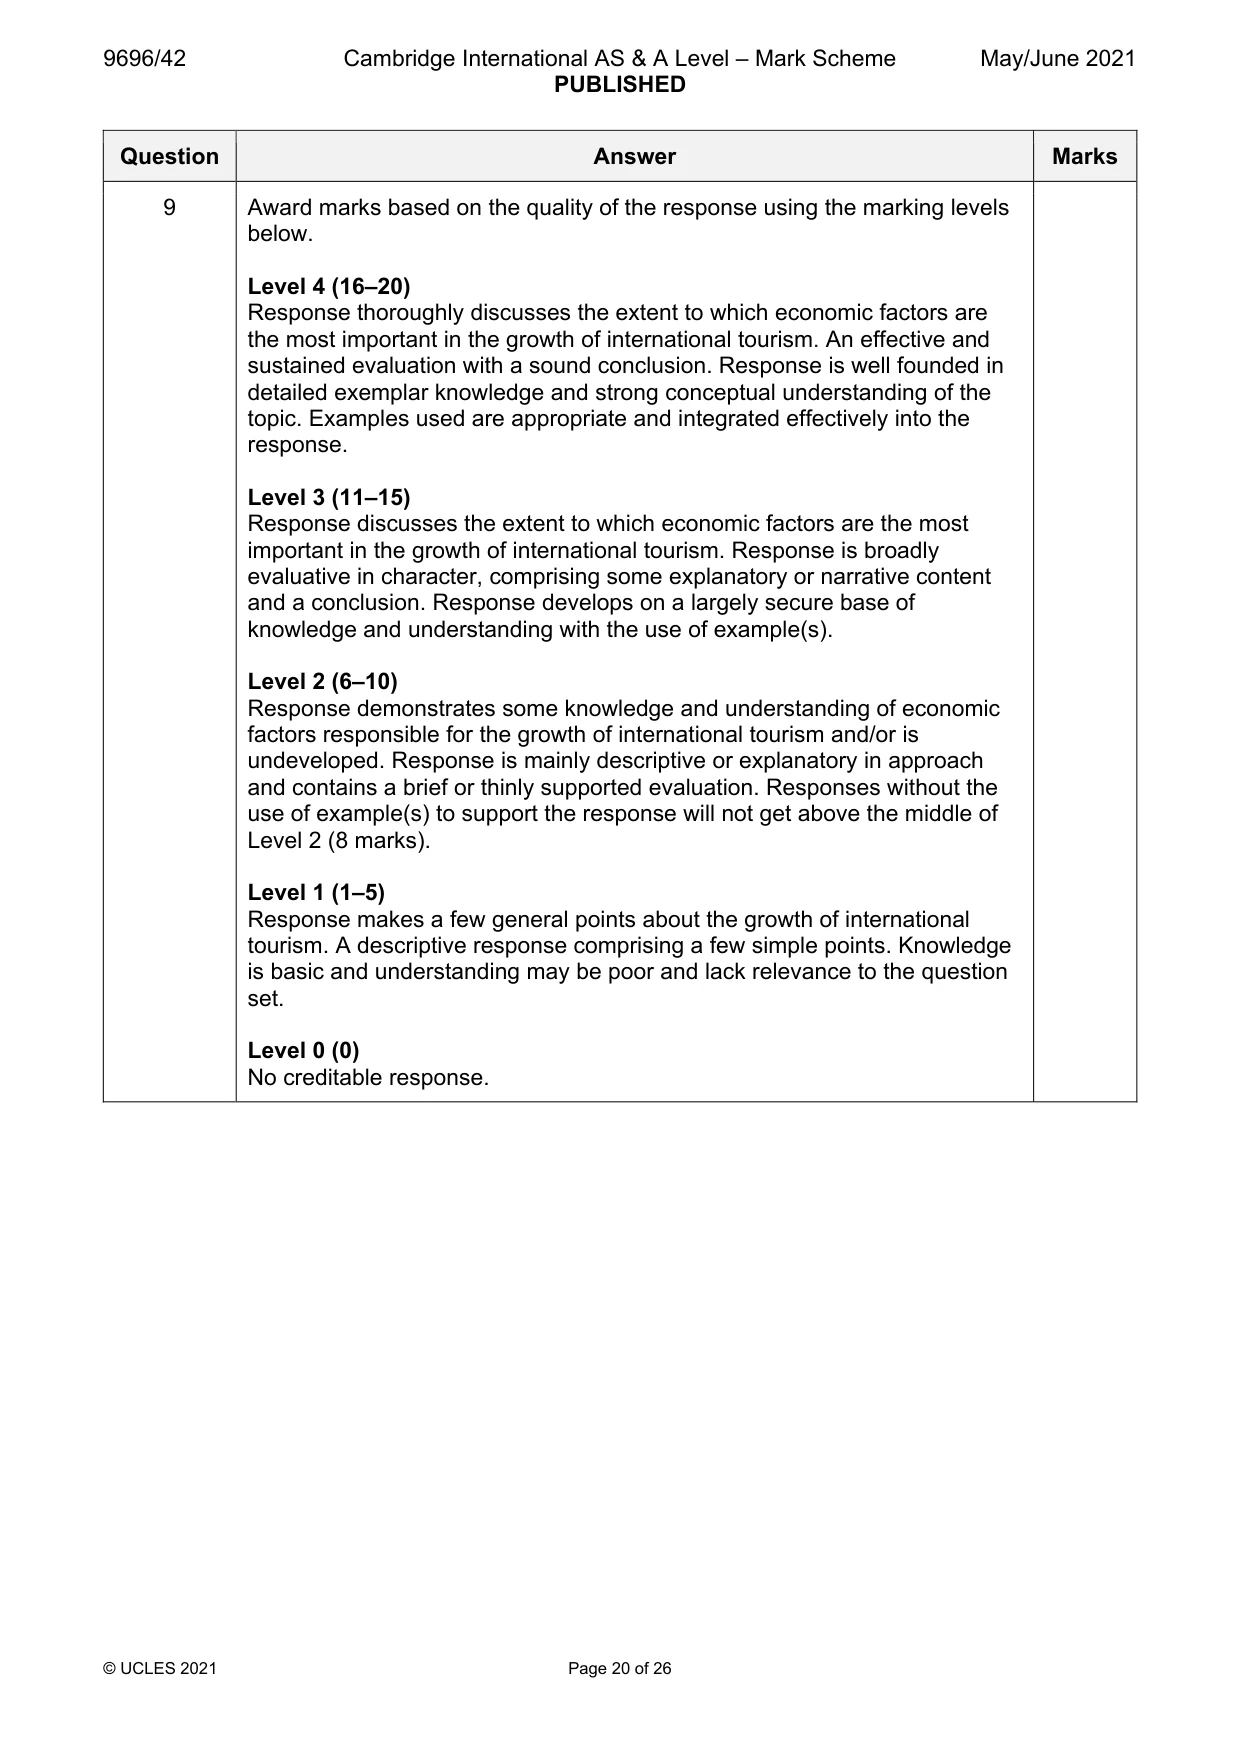
Mark scheme: 9 To what extent are economic factors the most important in the growth 20 of international tourism? Candidates are free to develop their own approach to the question and responses will vary depending on the example(s) chosen. Whichever approach is chosen, essays which address the question and support their argument with relevant examples will be credited. The direction of the response and evaluation made will depend on the approach chosen, and any evaluation is therefore valid if argued and based on evidence. Content should be related to international tourism, which is tourism that crosses international boundaries. Candidates may use the case study from 13.4 but must use this to illustrate the economic factors relevant to the growth of international tourism. Growth of tourism can be considered both positively or negatively. Candidates should assess the extent to which economic factors are the most important in the growth of international tourism. They should primarily consider economic factors and may assess the extent to which different economic factors are of relative importance. The response may be broadened by considering other factors such as social or political, but this should not dominate over the coverage of economic factors for Level 3 or higher. A higher level response may argue that it is difficult to categorise factors into simple categories such as economic, social or political, since there may be a crossover between categories (such factors are given an * in the list). Economic factors may include: • Increased affluence and increased disposable income* • Increased leisure time due to holiday entitlement and pay* • Reduced relative cost of air travel • Improved transport and communication technology • Globalisation and increased business travel • TNC involvement • Package holidays, marketing and advertising • Government investment in tourist industry and attractions* • Other Social factors may include: increased life expectancy, early retirement, media/internet, desire for travel and new experiences, international migration (visiting relatives), etc., while political factors may include government policy: encouraging investment, providing education and skills training, reducing or increasing travel restrictions out of and into their countries, instability/war, etc. 9 Award marks based on the quality of the response using the marking levels below. Level 4 (16–20) Response thoroughly discusses the extent to which economic factors are the most important in the growth of international tourism. An effective and sustained evaluation with a sound conclusion. Response is well founded in detailed exemplar knowledge and strong conceptual understanding of the topic. Examples used are appropriate and integrated effectively into the response. Level 3 (11–15) Response discusses the extent to which economic factors are the most important in the growth of international tourism. Response is broadly evaluative in character, comprising some explanatory or narrative content and a conclusion. Response develops on a largely secure base of knowledge and understanding with the use of example(s). Level 2 (6–10) Response demonstrates some knowledge and understanding of economic factors responsible for the growth of international tourism and/or is undeveloped. Response is mainly descriptive or explanatory in approach and contains a brief or thinly supported evaluation. Responses without the use of example(s) to support the response will not get above the middle of Level 2 (8 marks). Level 1 (1–5) Response makes a few general points about the growth of international tourism. A descriptive response comprising a few simple points. Knowledge is basic and understanding may be poor and lack relevance to the question set. Level 0 (0) No creditable response. Economic transition If answering this option, answer Question 10 and either Question 11 or Question 12.
Q10 · Income distribution for selected countries in Africa in 2018
10 Table 10.1 shows income distribution for selected countries in Africa in 2018. (a) Using evidence from Table 10.1, compare the income distribution of the countries. [4] (b) Explain the advantages of using social indicators to measure inequality between countries. [6]
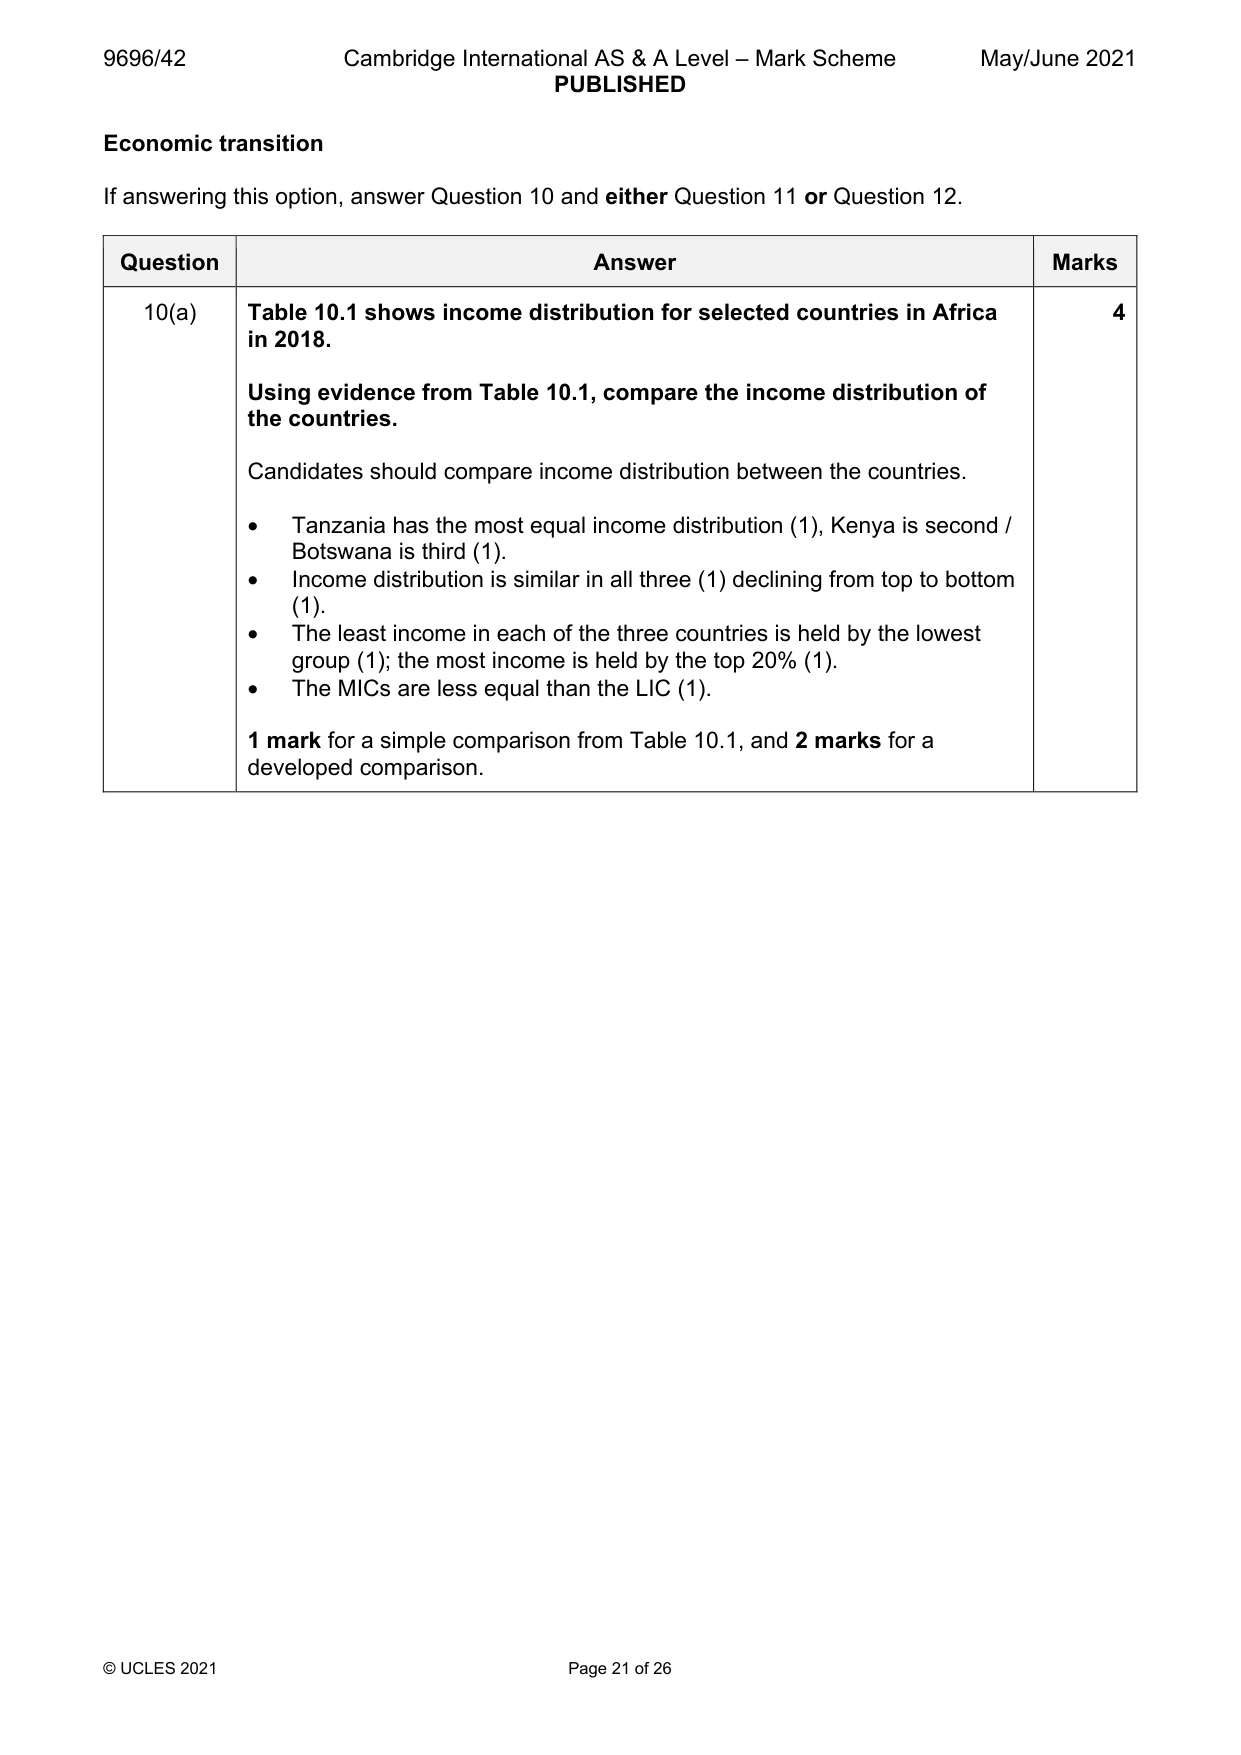
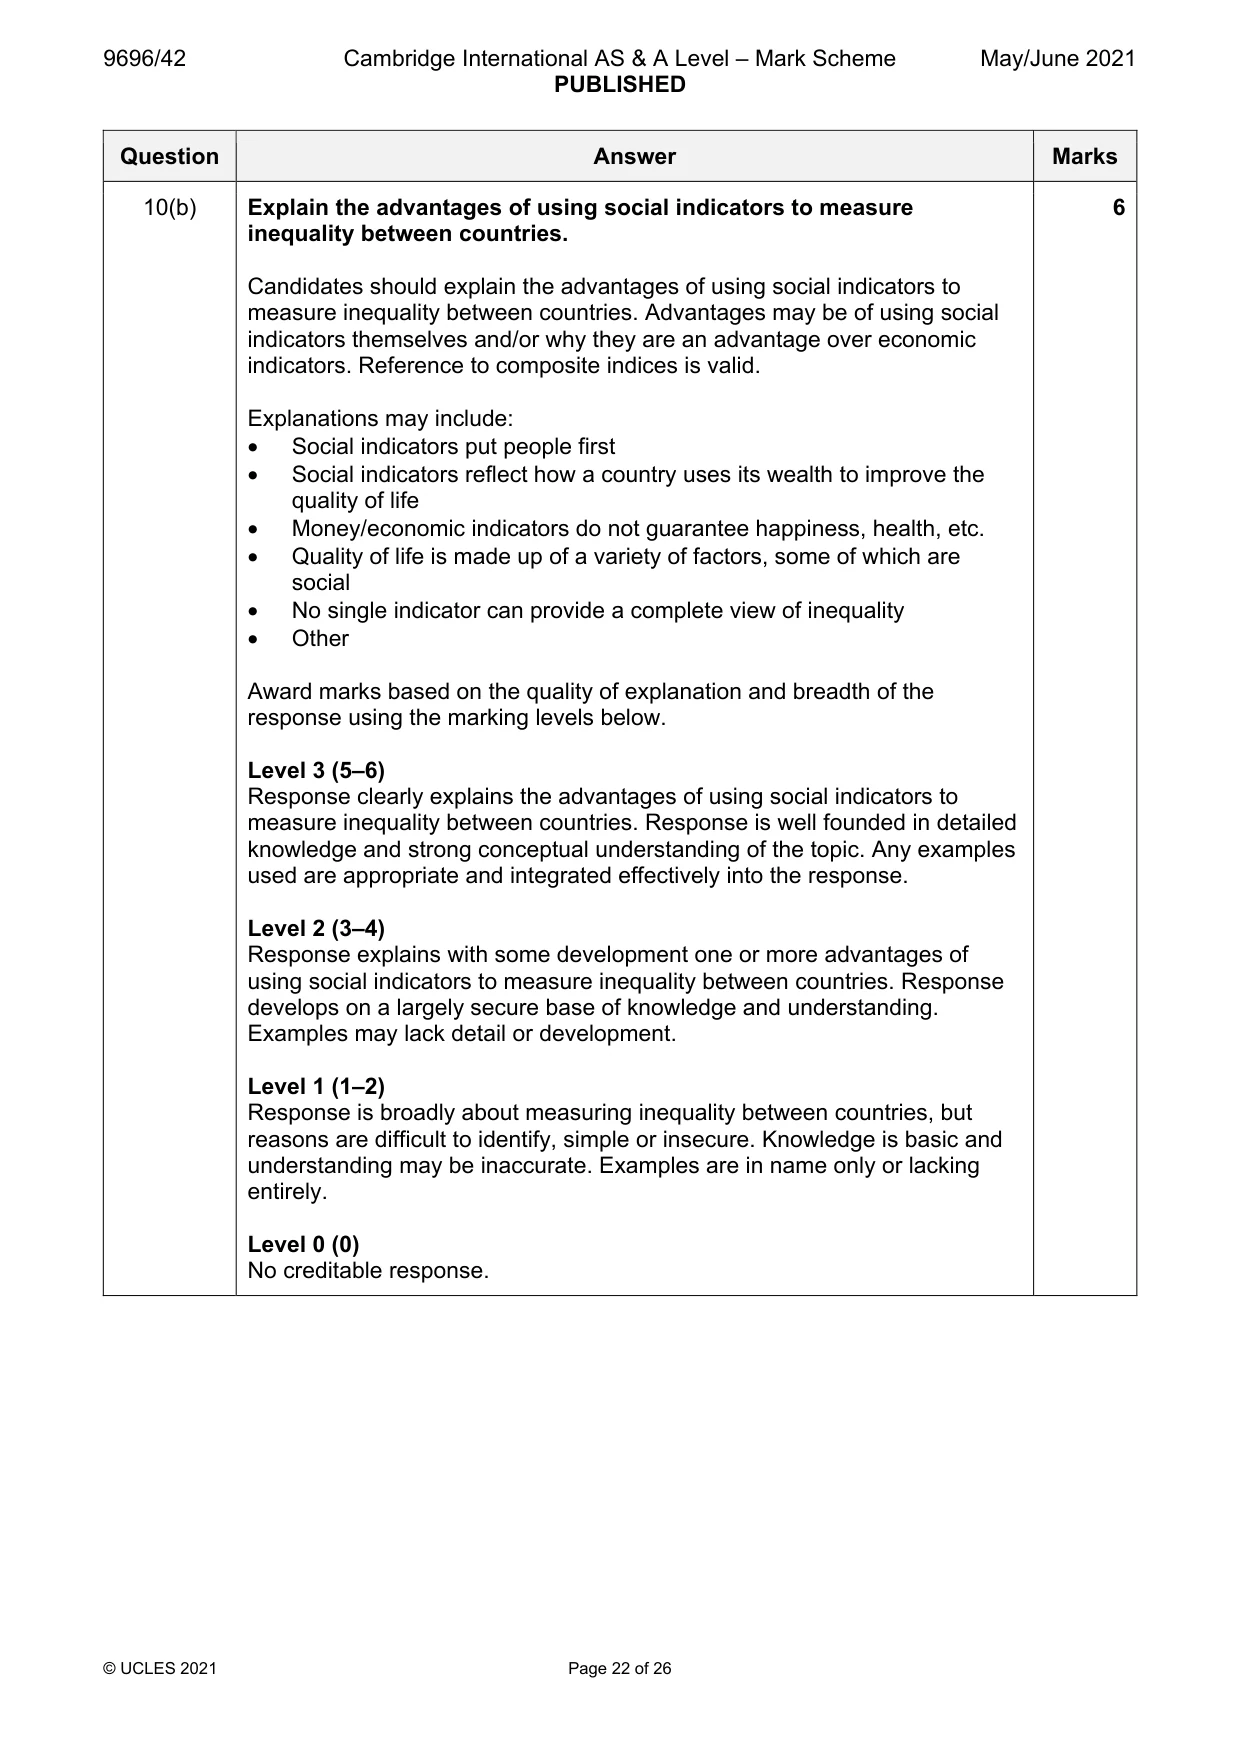
Mark scheme: 10(a) Table 10.1 shows income distribution for selected countries in Africa 4 in 2018. Using evidence from Table 10.1, compare the income distribution of the countries. Candidates should compare income distribution between the countries. • Tanzania has the most equal income distribution (1), Kenya is second / Botswana is third (1). • Income distribution is similar in all three (1) declining from top to bottom (1). • The least income in each of the three countries is held by the lowest group (1); the most income is held by the top 20% (1). • The MICs are less equal than the LIC (1). 1 mark for a simple comparison from Table 10.1, and 2 marks for a developed comparison. 10(b) Explain the advantages of using social indicators to measure 6 inequality between countries. Candidates should explain the advantages of using social indicators to measure inequality between countries. Advantages may be of using social indicators themselves and/or why they are an advantage over economic indicators. Reference to composite indices is valid. Explanations may include: • Social indicators put people first • Social indicators reflect how a country uses its wealth to improve the quality of life • Money/economic indicators do not guarantee happiness, health, etc. • Quality of life is made up of a variety of factors, some of which are social • No single indicator can provide a complete view of inequality • Other Award marks based on the quality of explanation and breadth of the response using the marking levels below. Level 3 (5–6) Response clearly explains the advantages of using social indicators to measure inequality between countries. Response is well founded in detailed knowledge and strong conceptual understanding of the topic. Any examples used are appropriate and integrated effectively into the response. Level 2 (3–4) Response explains with some development one or more advantages of using social indicators to measure inequality between countries. Response develops on a largely secure base of knowledge and understanding. Examples may lack detail or development. Level 1 (1–2) Response is broadly about measuring inequality between countries, but reasons are difficult to identify, simple or insecure. Knowledge is basic and understanding may be inaccurate. Examples are in name only or lacking entirely. Level 0 (0) No creditable response.
Q11 · ‘Profitability is the most important factor for transnational corporations (TNCs) in…
11 ‘Profitability is the most important factor for transnational corporations (TNCs) in making decisions about where to locate foreign direct investment (FDI).’ With reference to one or more examples, how far do you agree? [20]
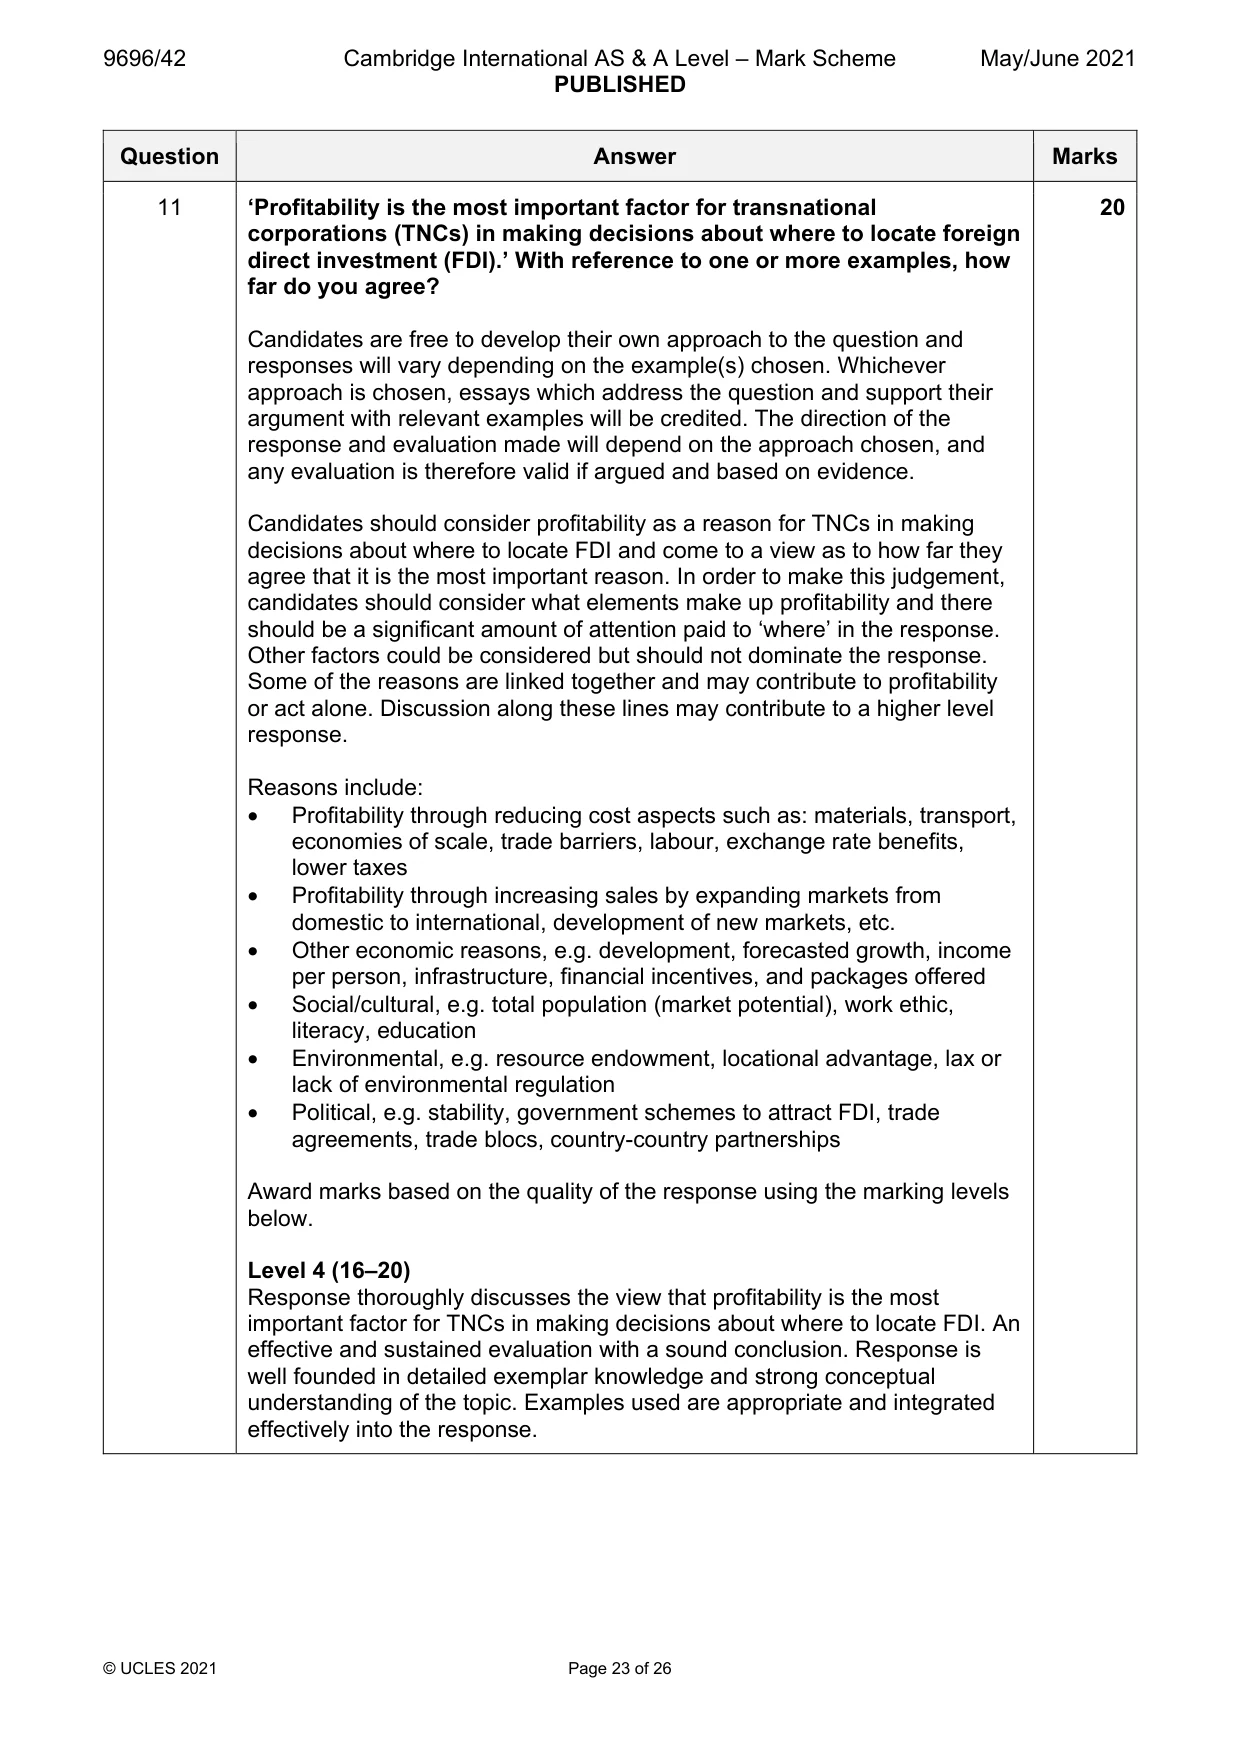
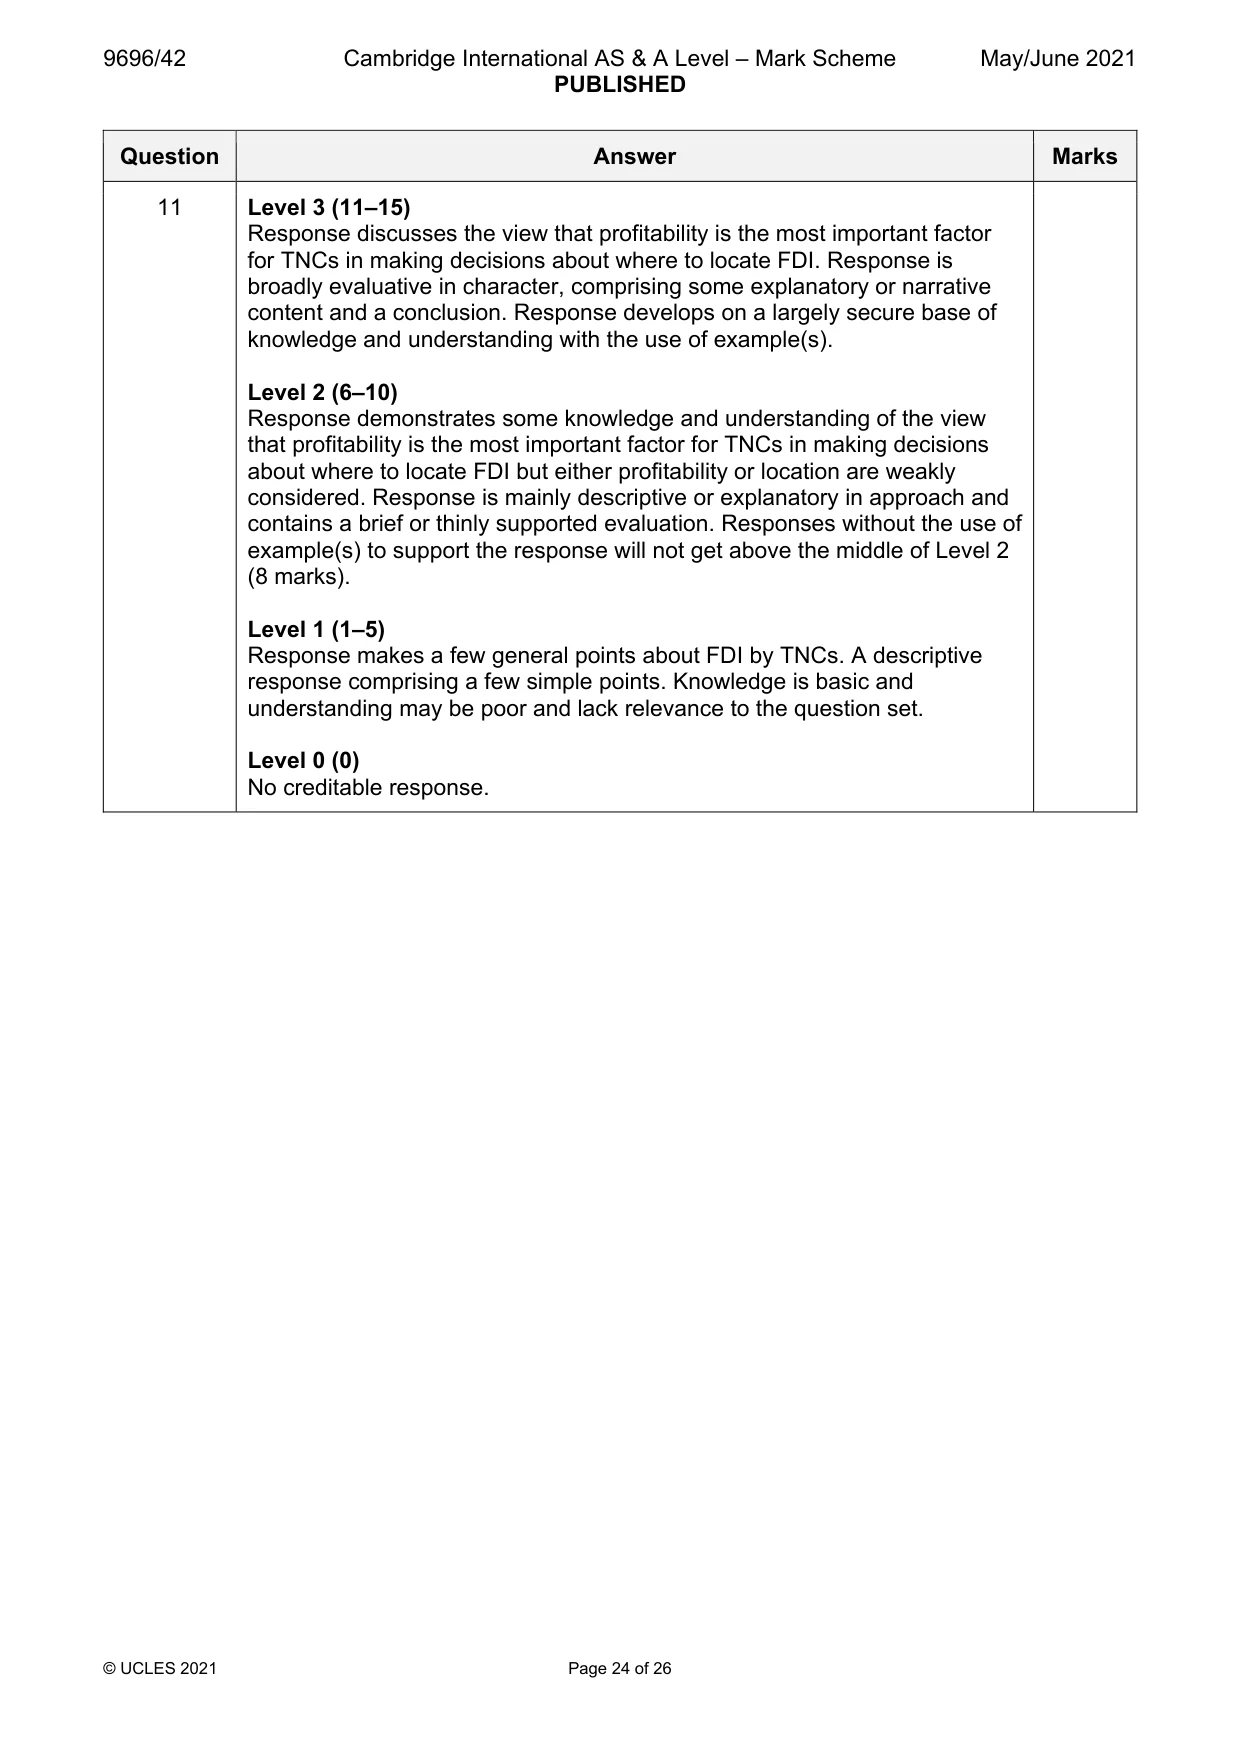
Mark scheme: 11 ‘Profitability is the most important factor for transnational 20 corporations (TNCs) in making decisions about where to locate foreign direct investment (FDI).’ With reference to one or more examples, how far do you agree? Candidates are free to develop their own approach to the question and responses will vary depending on the example(s) chosen. Whichever approach is chosen, essays which address the question and support their argument with relevant examples will be credited. The direction of the response and evaluation made will depend on the approach chosen, and any evaluation is therefore valid if argued and based on evidence. Candidates should consider profitability as a reason for TNCs in making decisions about where to locate FDI and come to a view as to how far they agree that it is the most important reason. In order to make this judgement, candidates should consider what elements make up profitability and there should be a significant amount of attention paid to ‘where’ in the response. Other factors could be considered but should not dominate the response. Some of the reasons are linked together and may contribute to profitability or act alone. Discussion along these lines may contribute to a higher level response. Reasons include: • Profitability through reducing cost aspects such as: materials, transport, economies of scale, trade barriers, labour, exchange rate benefits, lower taxes • Profitability through increasing sales by expanding markets from domestic to international, development of new markets, etc. • Other economic reasons, e.g. development, forecasted growth, income per person, infrastructure, financial incentives, and packages offered • Social/cultural, e.g. total population (market potential), work ethic, literacy, education • Environmental, e.g. resource endowment, locational advantage, lax or lack of environmental regulation • Political, e.g. stability, government schemes to attract FDI, trade agreements, trade blocs, country-country partnerships Award marks based on the quality of the response using the marking levels below. Level 4 (16–20) Response thoroughly discusses the view that profitability is the most important factor for TNCs in making decisions about where to locate FDI. An effective and sustained evaluation with a sound conclusion. Response is well founded in detailed exemplar knowledge and strong conceptual understanding of the topic. Examples used are appropriate and integrated effectively into the response. 11 Level 3 (11–15) Response discusses the view that profitability is the most important factor for TNCs in making decisions about where to locate FDI. Response is broadly evaluative in character, comprising some explanatory or narrative content and a conclusion. Response develops on a largely secure base of knowledge and understanding with the use of example(s). Level 2 (6–10) Response demonstrates some knowledge and understanding of the view that profitability is the most important factor for TNCs in making decisions about where to locate FDI but either profitability or location are weakly considered. Response is mainly descriptive or explanatory in approach and contains a brief or thinly supported evaluation. Responses without the use of example(s) to support the response will not get above the middle of Level 2 (8 marks). Level 1 (1–5) Response makes a few general points about FDI by TNCs. A descriptive response comprising a few simple points. Knowledge is basic and understanding may be poor and lack relevance to the question set. Level 0 (0) No creditable response.
Q12 · With reference to one or more examples, evaluate the causes of regional disparities…
12 With reference to one or more examples, evaluate the causes of regional disparities within countries. [20]
Mark scheme: 12 With reference to one or more examples, evaluate the causes of 20 regional disparities within countries. Candidates are free to develop their own approach to the question and responses will vary depending on the example(s) chosen. Whichever approach is chosen, essays which address the question and support their argument with relevant examples will be credited. The direction of the response and evaluation made will depend on the approach chosen, and any evaluation is therefore valid if argued and based on evidence. Examples may be of causes and/or regional disparities within countries, though some balance may be a feature of a higher level response in Level 3 or Level 4. Disparities may come from one country or from more than one country. Regional disparities may include: • Single core and periphery regions • Upward transition, resource frontier, downward transition regions • Regional variation expressed in other ways, e.g. north/south divide Causes may be expressed using theories, e.g. the concept of core– periphery and processes such as cumulative causation, spread and backwash effects along with more broad causes such as environmental, economic, social/cultural, political and historical and causes for the specific example(s) chosen. There must be evaluative comment on the causes presented to make some form of judgement based on evidence. Award marks based on the quality of the response using the marking levels below. Level 4 (16–20) Response thoroughly discusses the causes of regional disparities within countries. An effective and sustained evaluation with a sound conclusion. Response is well founded in detailed exemplar knowledge and strong conceptual understanding of the topic. Examples used are appropriate and integrated effectively into the response. Level 3 (11–15) Response discusses the causes of regional disparities within countries. Response is broadly evaluative in character, comprising some explanatory or narrative content and a conclusion. Response develops on a largely secure base of knowledge and understanding with the use of example(s). Level 2 (6–10) Response demonstrates some knowledge and understanding of the causes of regional disparities within countries with either the causes or the regional disparities not identified clearly or developed. Response is mainly descriptive or explanatory in approach and contains a brief or thinly supported evaluation. Responses without the use of example(s) to support the response will not get above the middle of Level 2 (8 marks). 12 Level 1 (1–5) Response makes a few general points about regional disparities within countries without the necessary focus on the causes. A descriptive response comprising a few simple points. Knowledge is basic and understanding may be poor and lack relevance to the question set. Level 0 (0) No creditable response.
What was in this paper
The subtopics covered by these 12 questions, and how many questions each got. Open one in a new tab to see every Cambridge question on it.
2Environmental degradation2International debt and international aid2Manufacturing and related service industry1National development1Regional development within countries1The development of international tourism1The globalisation of economic activity1The management of energy supply1What you needed in this session
Cambridge’s own grade thresholds for 2021 May/June, Paper 4 · Variant 2. A higher threshold means an easier paper — the bar moves with how the cohort did.