Cambridge A Level Geography 9696 — 2024 Oct/Nov Paper 4 · Variant 2
9696/42/O/N/24 · 12 questions · 60 marks · ≈68 min
The question paper and its mark scheme, free to read here and free to download. This is Cambridge’s own paper, exactly as it was sat.
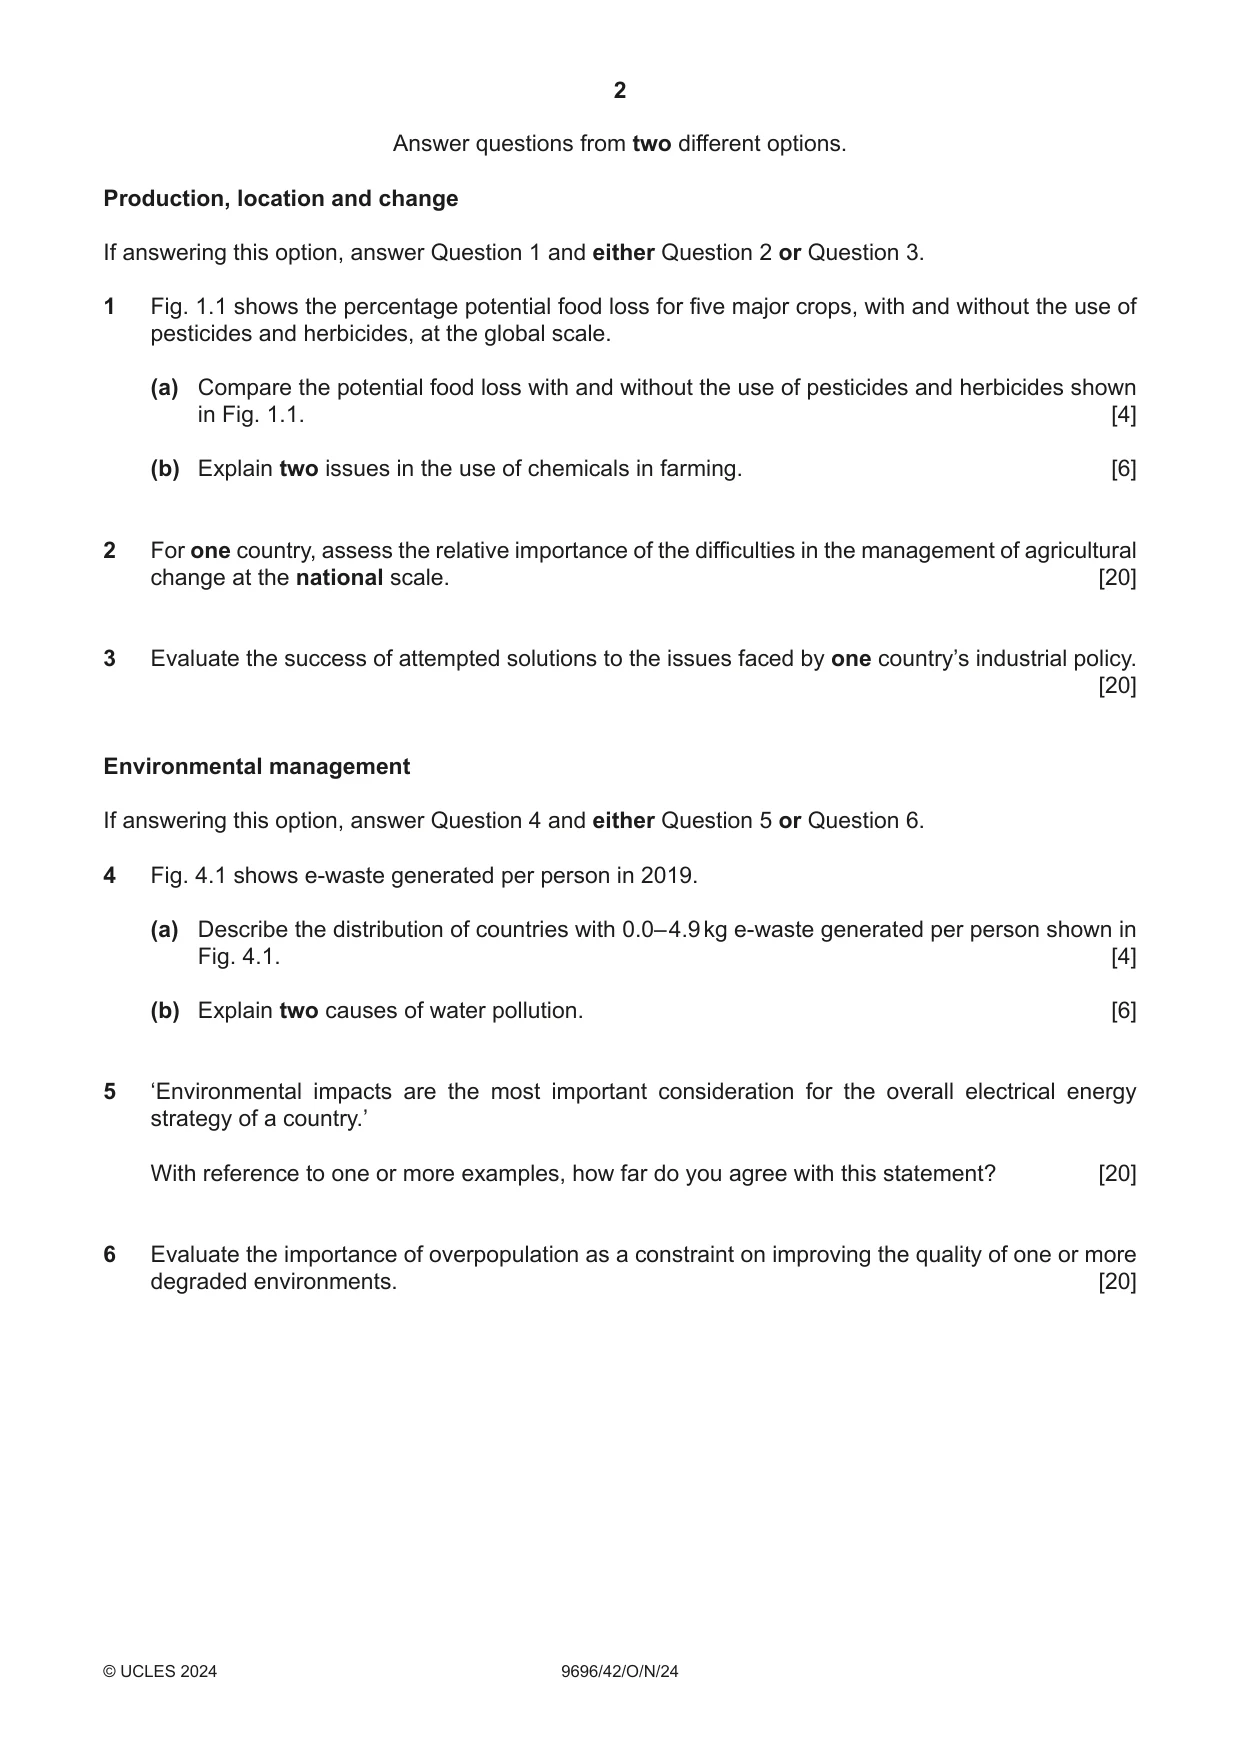
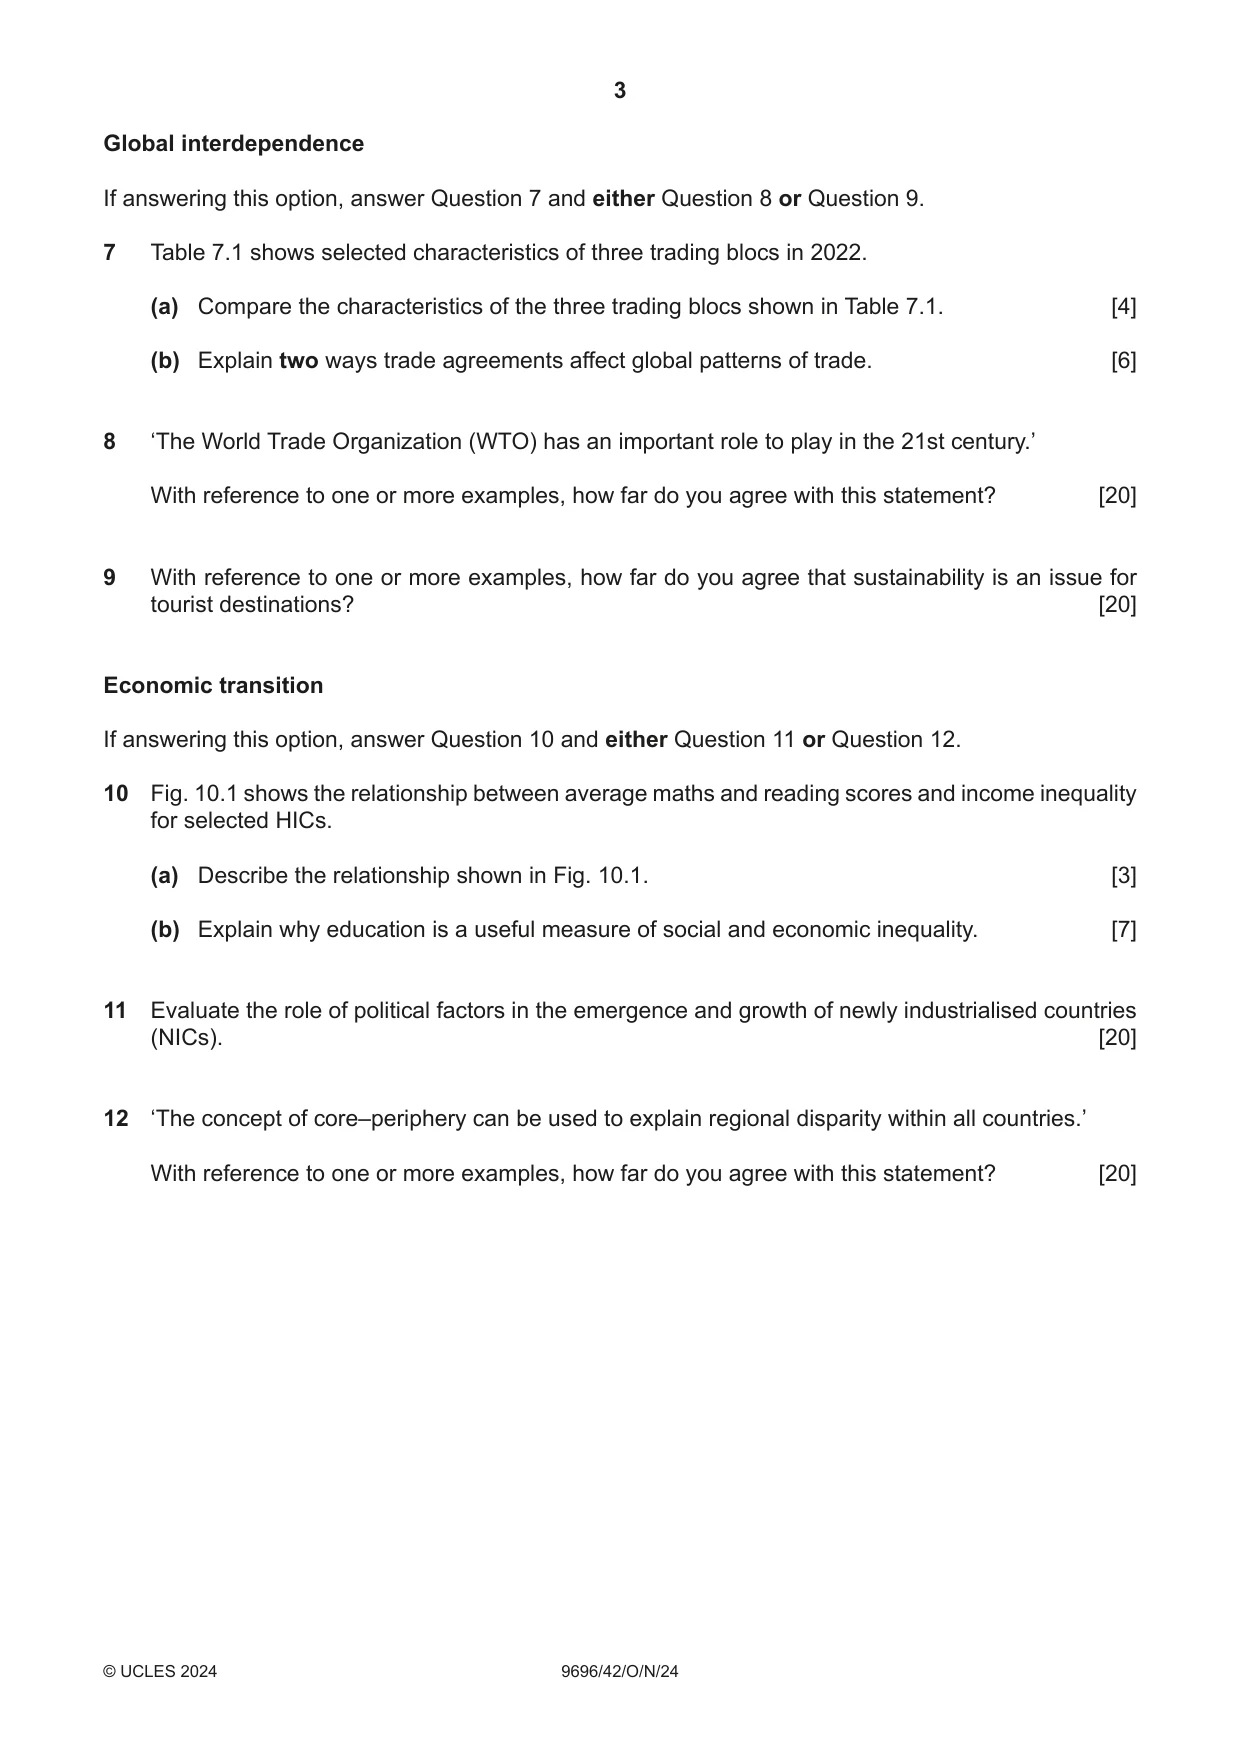
Question paper4 pages

Mark scheme27 pages
Answers below. Sit the paper first if you are practising.








Questions as text
Q1 · The percentage potential food loss for five major crops, with and without the use of…
1 Fig. 1.1 shows the percentage potential food loss for five major crops, with and without the use of pesticides and herbicides, at the global scale. (a) Compare the potential food loss with and without the use of pesticides and herbicides shown in Fig. 1.1. [4] (b) Explain two issues in the use of chemicals in farming. [6]
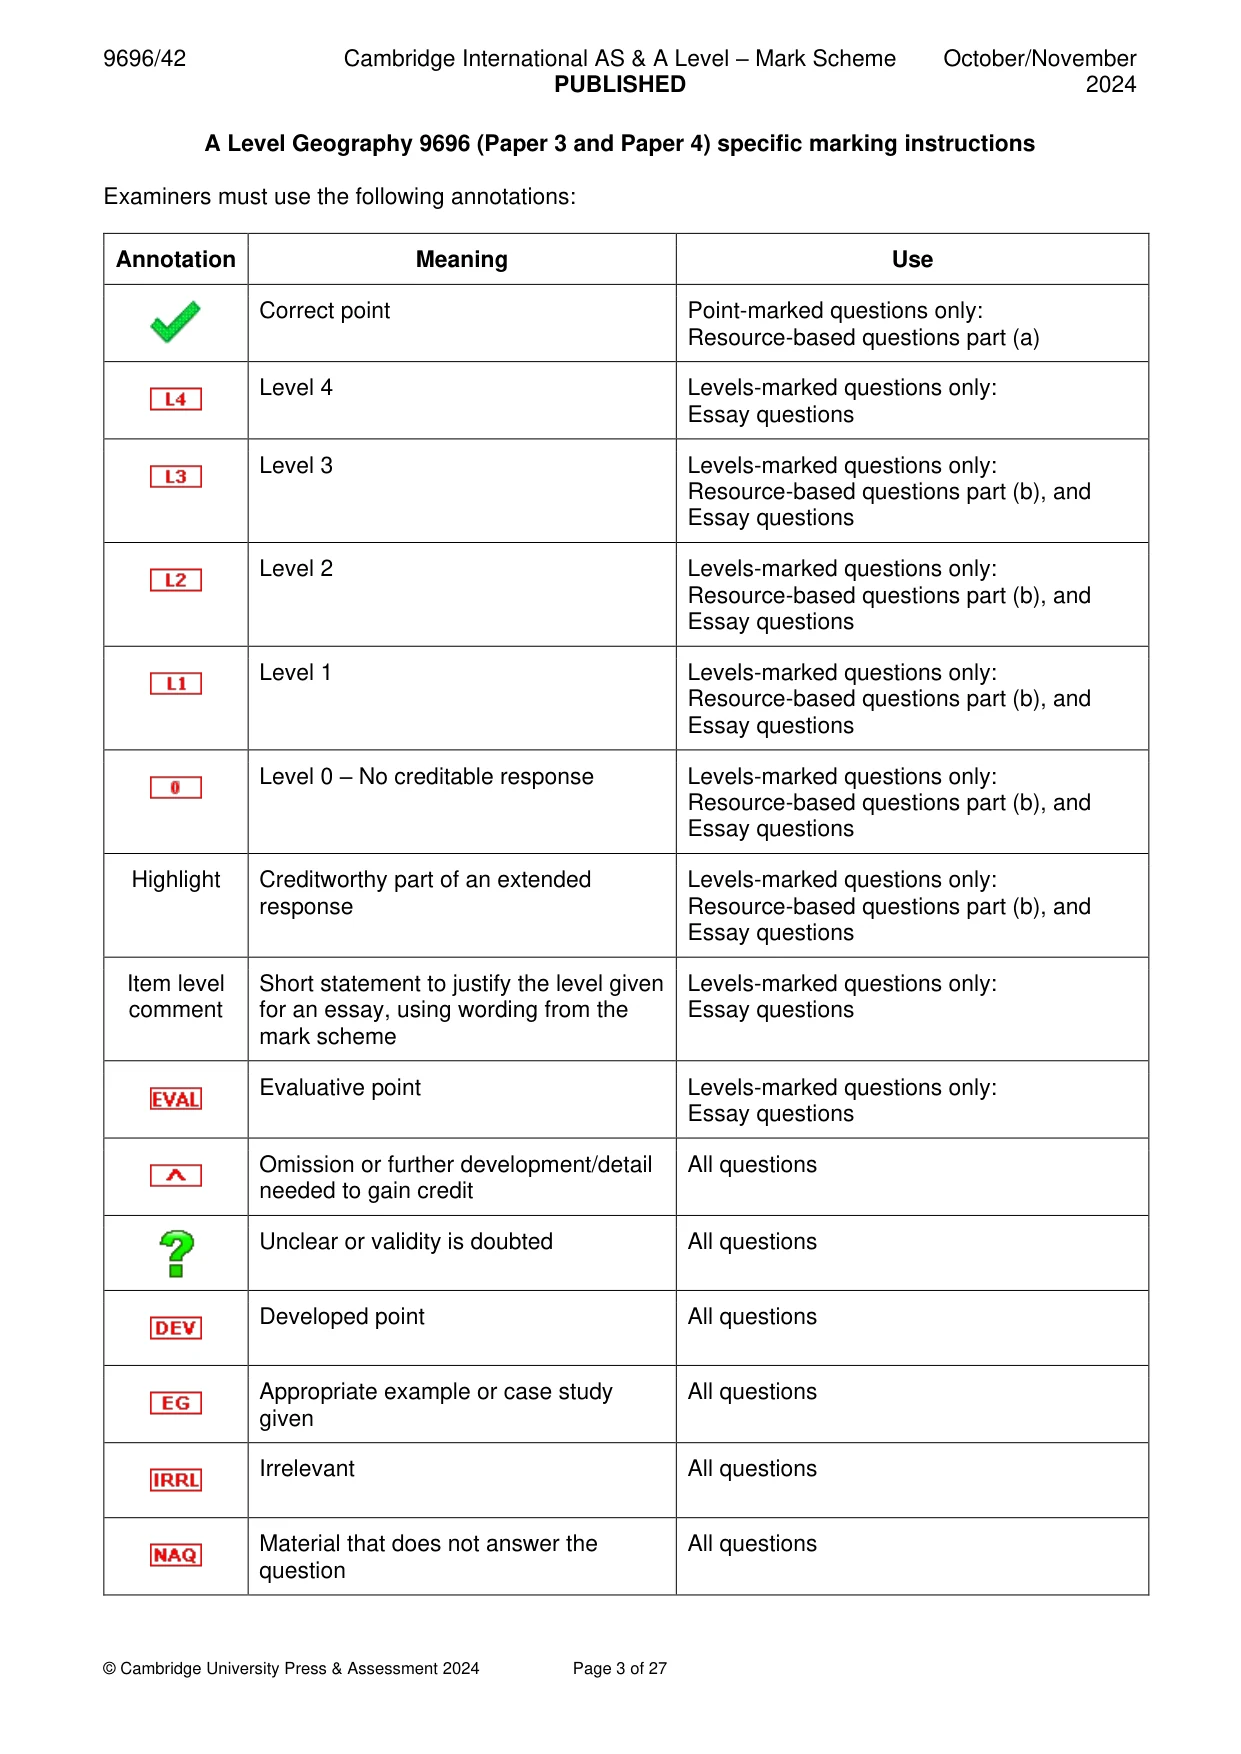
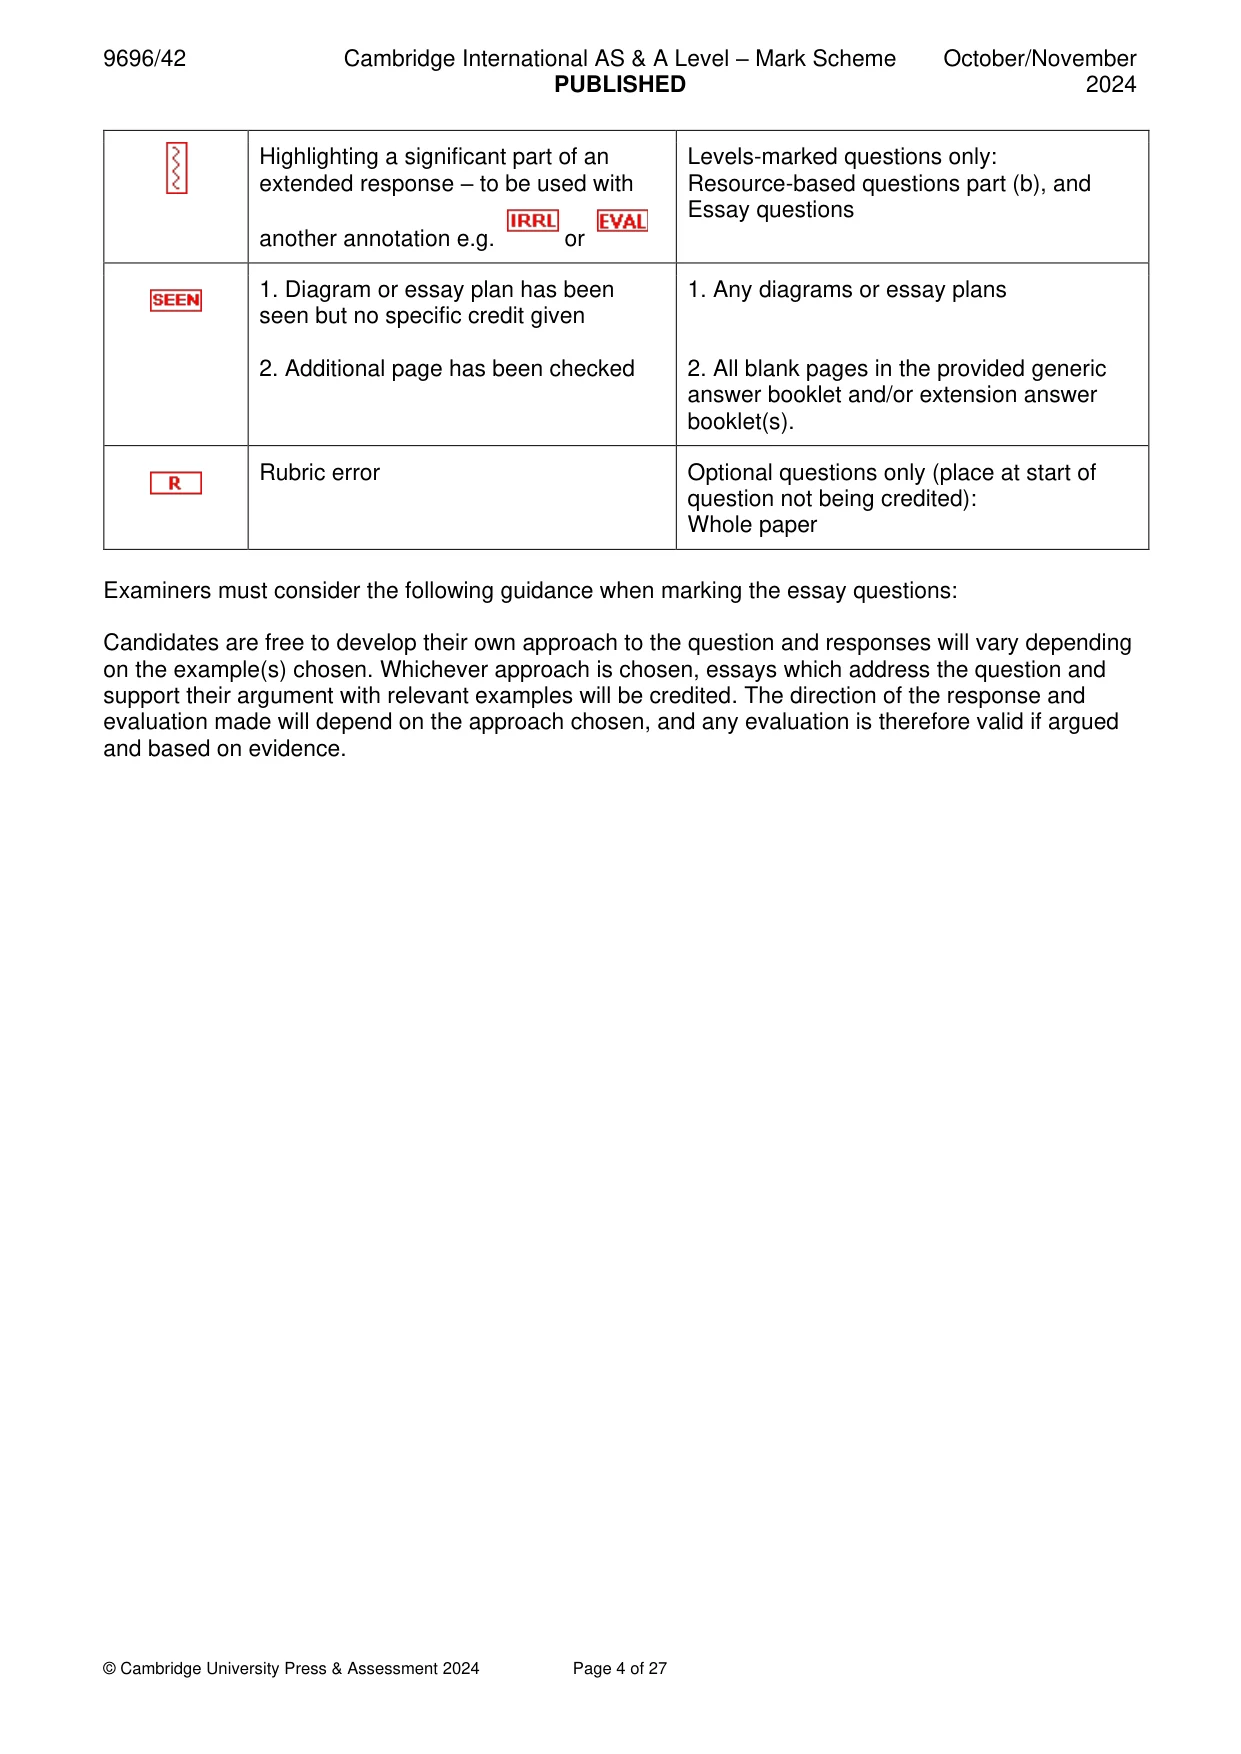
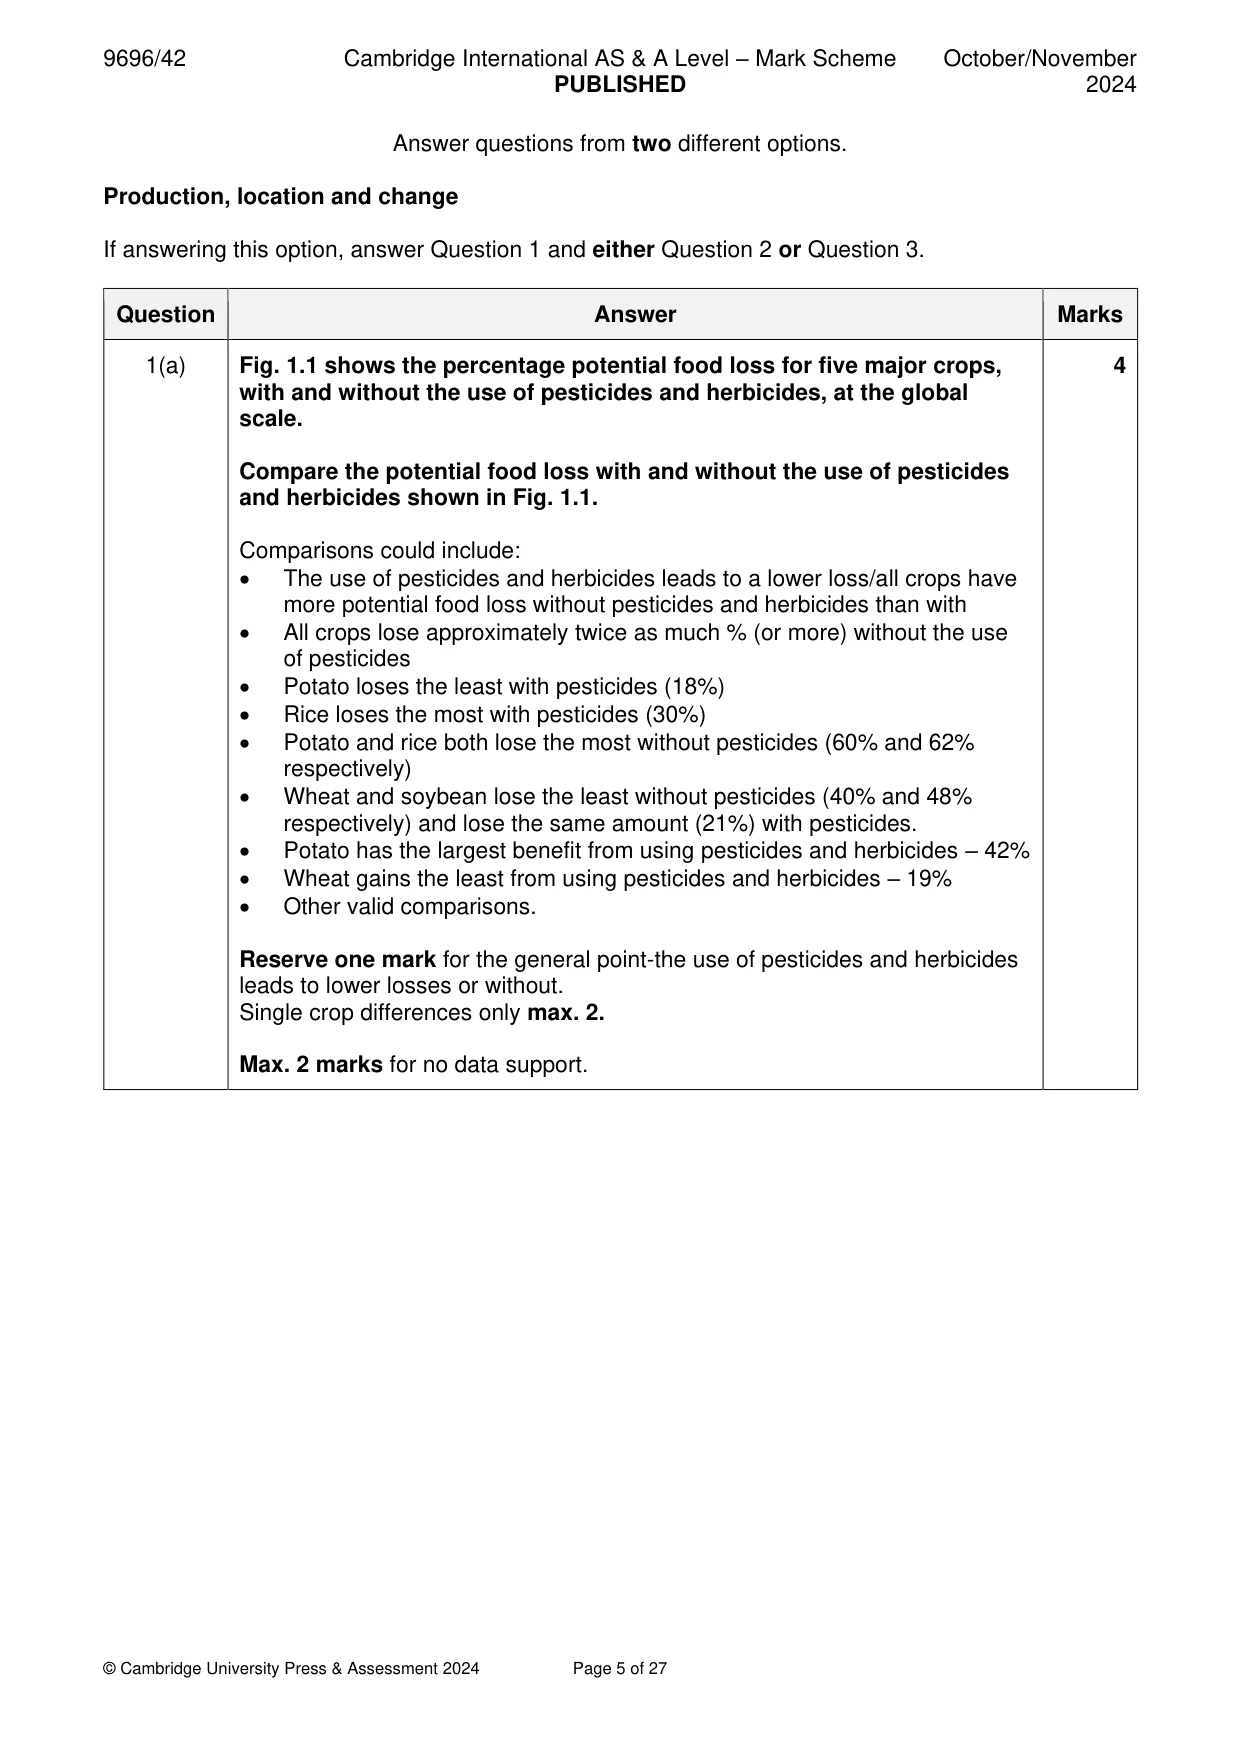
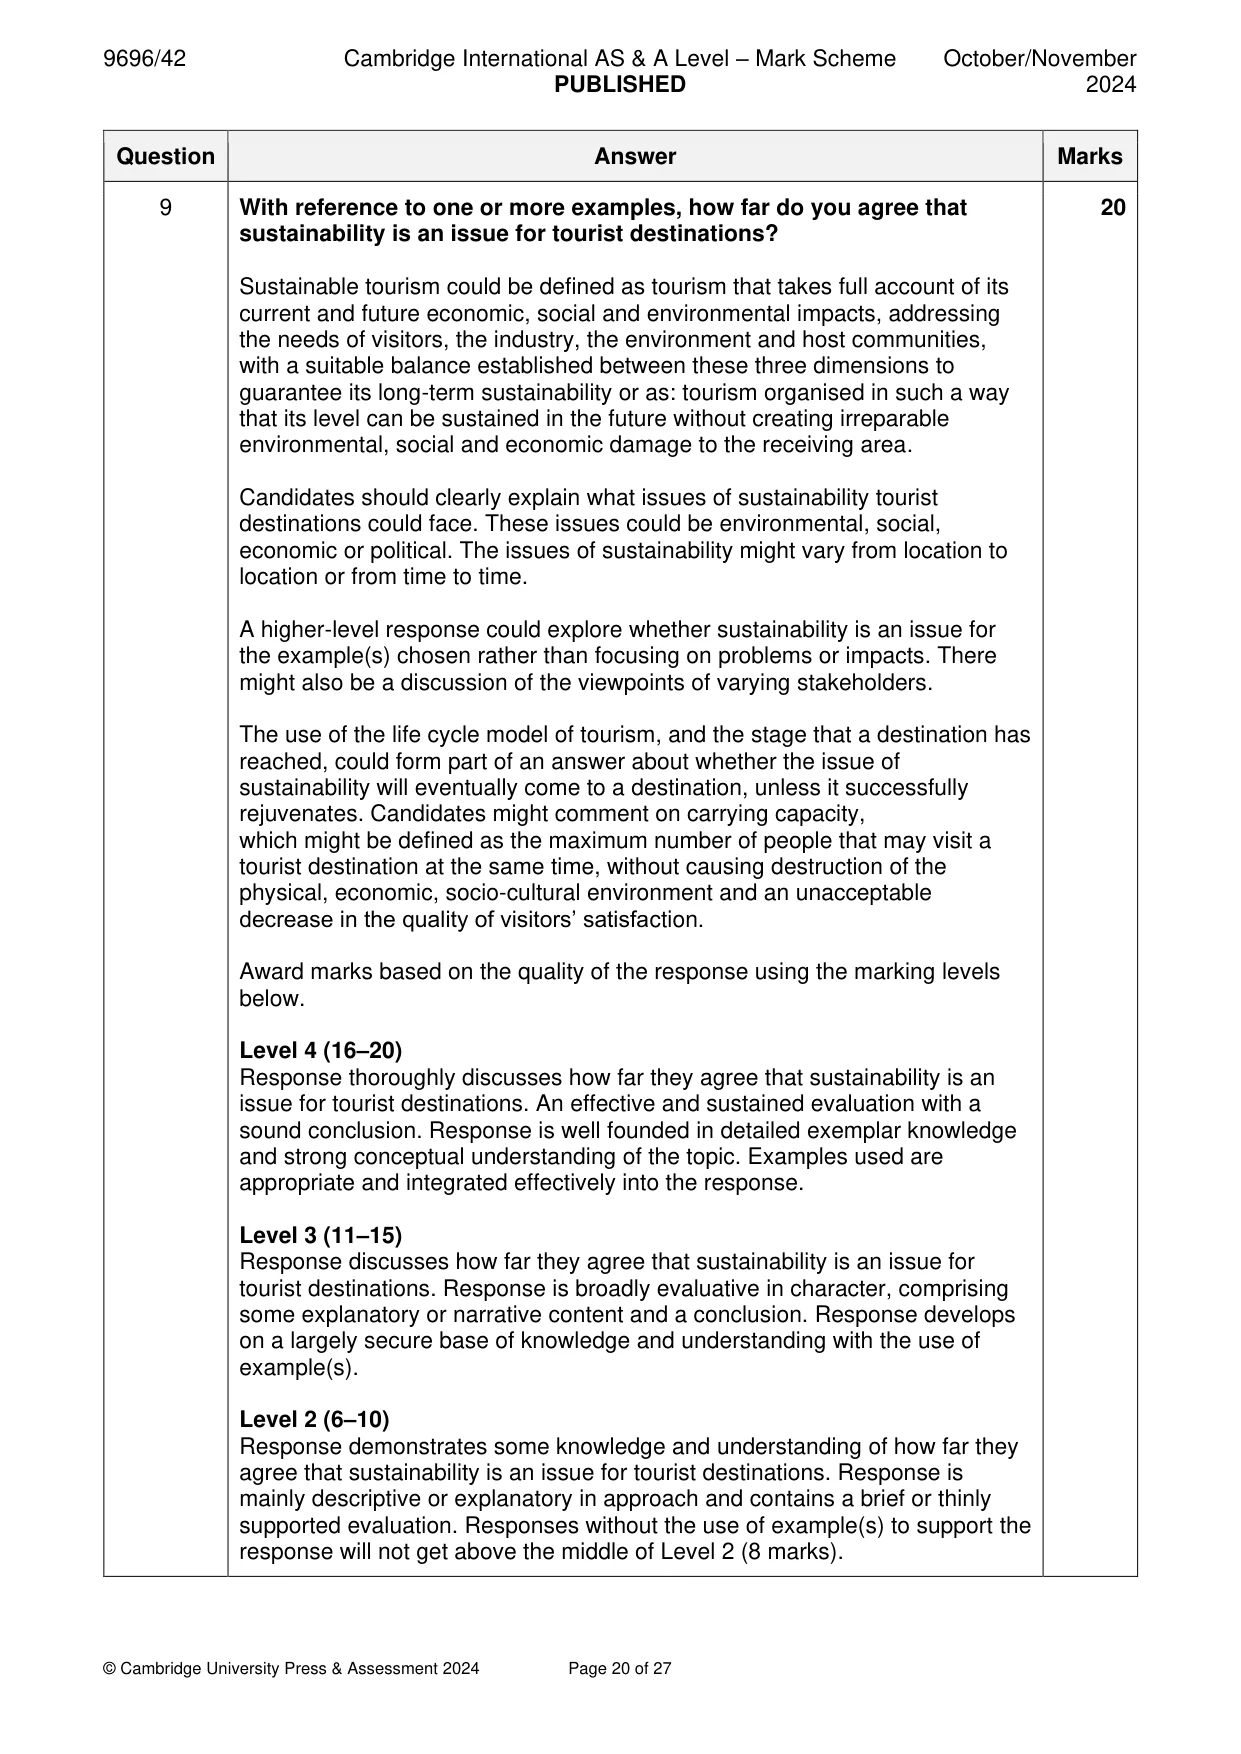
Mark scheme: Question Answer Marks 1(a) Fig. 1.1 shows the percentage potential food loss for five major crops, 4 with and without the use of pesticides and herbicides, at the global scale. Compare the potential food loss with and without the use of pesticides and herbicides shown in Fig. 1.1. Comparisons could include: • The use of pesticides and herbicides leads to a lower loss/all crops have more potential food loss without pesticides and herbicides than with • All crops lose approximately twice as much % (or more) without the use of pesticides • Potato loses the least with pesticides (18%) • Rice loses the most with pesticides (30%) • Potato and rice both lose the most without pesticides (60% and 62% respectively) • Wheat and soybean lose the least without pesticides (40% and 48% respectively) and lose the same amount (21%) with pesticides. • Potato has the largest benefit from using pesticides and herbicides – 42% • Wheat gains the least from using pesticides and herbicides – 19% • Other valid comparisons. Reserve one mark for the general point-the use of pesticides and herbicides leads to lower losses or without. Single crop differences only max. 2. Max. 2 marks for no data support. 1(b) Explain two issues in the use of chemicals in farming. 6 The chemical used could be fertilizers, fungicides, herbicides, insecticides, seed treatments, veterinary medicines, animal growth hormones, etc. The issues could be environmental, e.g. eutrophication, reduction in biodiversity, damage to soil, pest resistance or social e.g. health impacts for farmers/worker/ consumers or economic e.g. animal welfare, financial cost to farmers/affordability. An issue could consider the balance between the advantages of using chemicals against the disadvantages but this might raise the quality of the explanation. A better response would explain what the chemicals are used for: the benefits, the problems of using the chemicals and why the chemicals cause an issue. For example, a simple response might mention ‘damage soils’, cause erosion’, or ‘leaching’ whilst a better response would elaborate in some way by developing relevant ideas such as increase acidification/lower PH levels, create soil crusts, lower organic matter content, soil nutrients and minerals (reduce friability and structure), increase soil pests, reduce beneficial bacteria and soil organisms. Max. 4 for one issue. Award marks based on the quality of explanation and breadth of the response using the marking levels below. Level 3 (5–6) Response clearly explains two issues in the use of chemicals in farming. Response is well founded in detailed knowledge and strong conceptual understanding of the topic. Examples used are appropriate and integrated effectively into the response. Level 2 (3–4) Response explains one or two issues in the use of chemicals in farming. Response develops on a largely secure base of knowledge and understanding. Examples may lack detail or development. Level 1 (1–2) Response describes one or more issues in the use of chemicals in farming. Knowledge is basic and understanding may be inaccurate. Examples are in name only or lacking entirely. Level 0 (0) No creditable response.
Q2 · For one country, assess the relative importance of the difficulties in the management of…
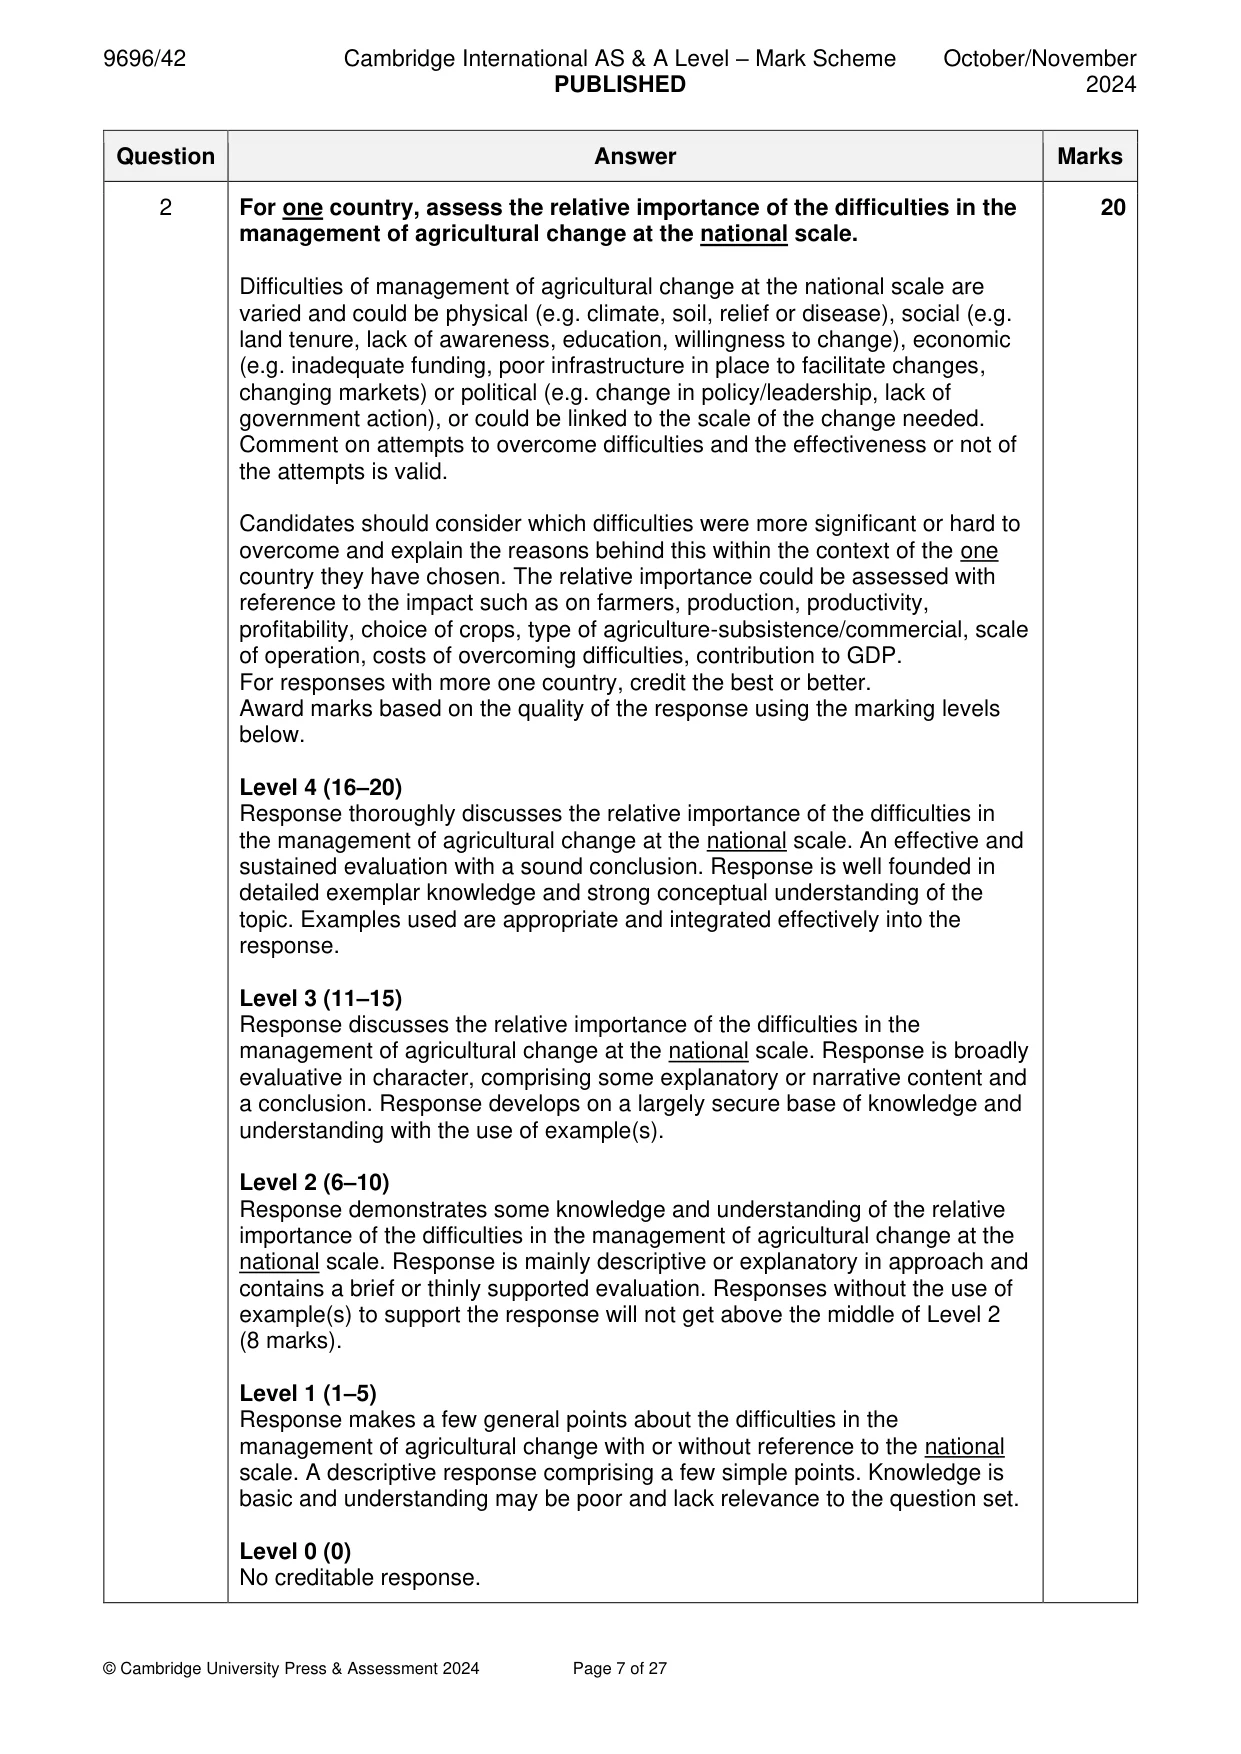
2 For one country, assess the relative importance of the difficulties in the management of agricultural change at the national scale. [20]
Mark scheme: 2 For one country, assess the relative importance of the difficulties in the 20 management of agricultural change at the national scale. Difficulties of management of agricultural change at the national scale are varied and could be physical (e.g. climate, soil, relief or disease), social (e.g. land tenure, lack of awareness, education, willingness to change), economic (e.g. inadequate funding, poor infrastructure in place to facilitate changes, changing markets) or political (e.g. change in policy/leadership, lack of government action), or could be linked to the scale of the change needed. Comment on attempts to overcome difficulties and the effectiveness or not of the attempts is valid. Candidates should consider which difficulties were more significant or hard to overcome and explain the reasons behind this within the context of the one country they have chosen. The relative importance could be assessed with reference to the impact such as on farmers, production, productivity, profitability, choice of crops, type of agriculture-subsistence/commercial, scale of operation, costs of overcoming difficulties, contribution to GDP. For responses with more one country, credit the best or better. Award marks based on the quality of the response using the marking levels below. Level 4 (16–20) Response thoroughly discusses the relative importance of the difficulties in the management of agricultural change at the national scale. An effective and sustained evaluation with a sound conclusion. Response is well founded in detailed exemplar knowledge and strong conceptual understanding of the topic. Examples used are appropriate and integrated effectively into the response. Level 3 (11–15) Response discusses the relative importance of the difficulties in the management of agricultural change at the national scale. Response is broadly evaluative in character, comprising some explanatory or narrative content and a conclusion. Response develops on a largely secure base of knowledge and understanding with the use of example(s). Level 2 (6–10) Response demonstrates some knowledge and understanding of the relative importance of the difficulties in the management of agricultural change at the national scale. Response is mainly descriptive or explanatory in approach and contains a brief or thinly supported evaluation. Responses without the use of example(s) to support the response will not get above the middle of Level 2 (8 marks). Level 1 (1–5) Response makes a few general points about the difficulties in the management of agricultural change with or without reference to the national scale. A descriptive response comprising a few simple points. Knowledge is basic and understanding may be poor and lack relevance to the question set. Level 0 (0) No creditable response.
Q3 · Evaluate the success of attempted solutions to the issues faced by one country’s…
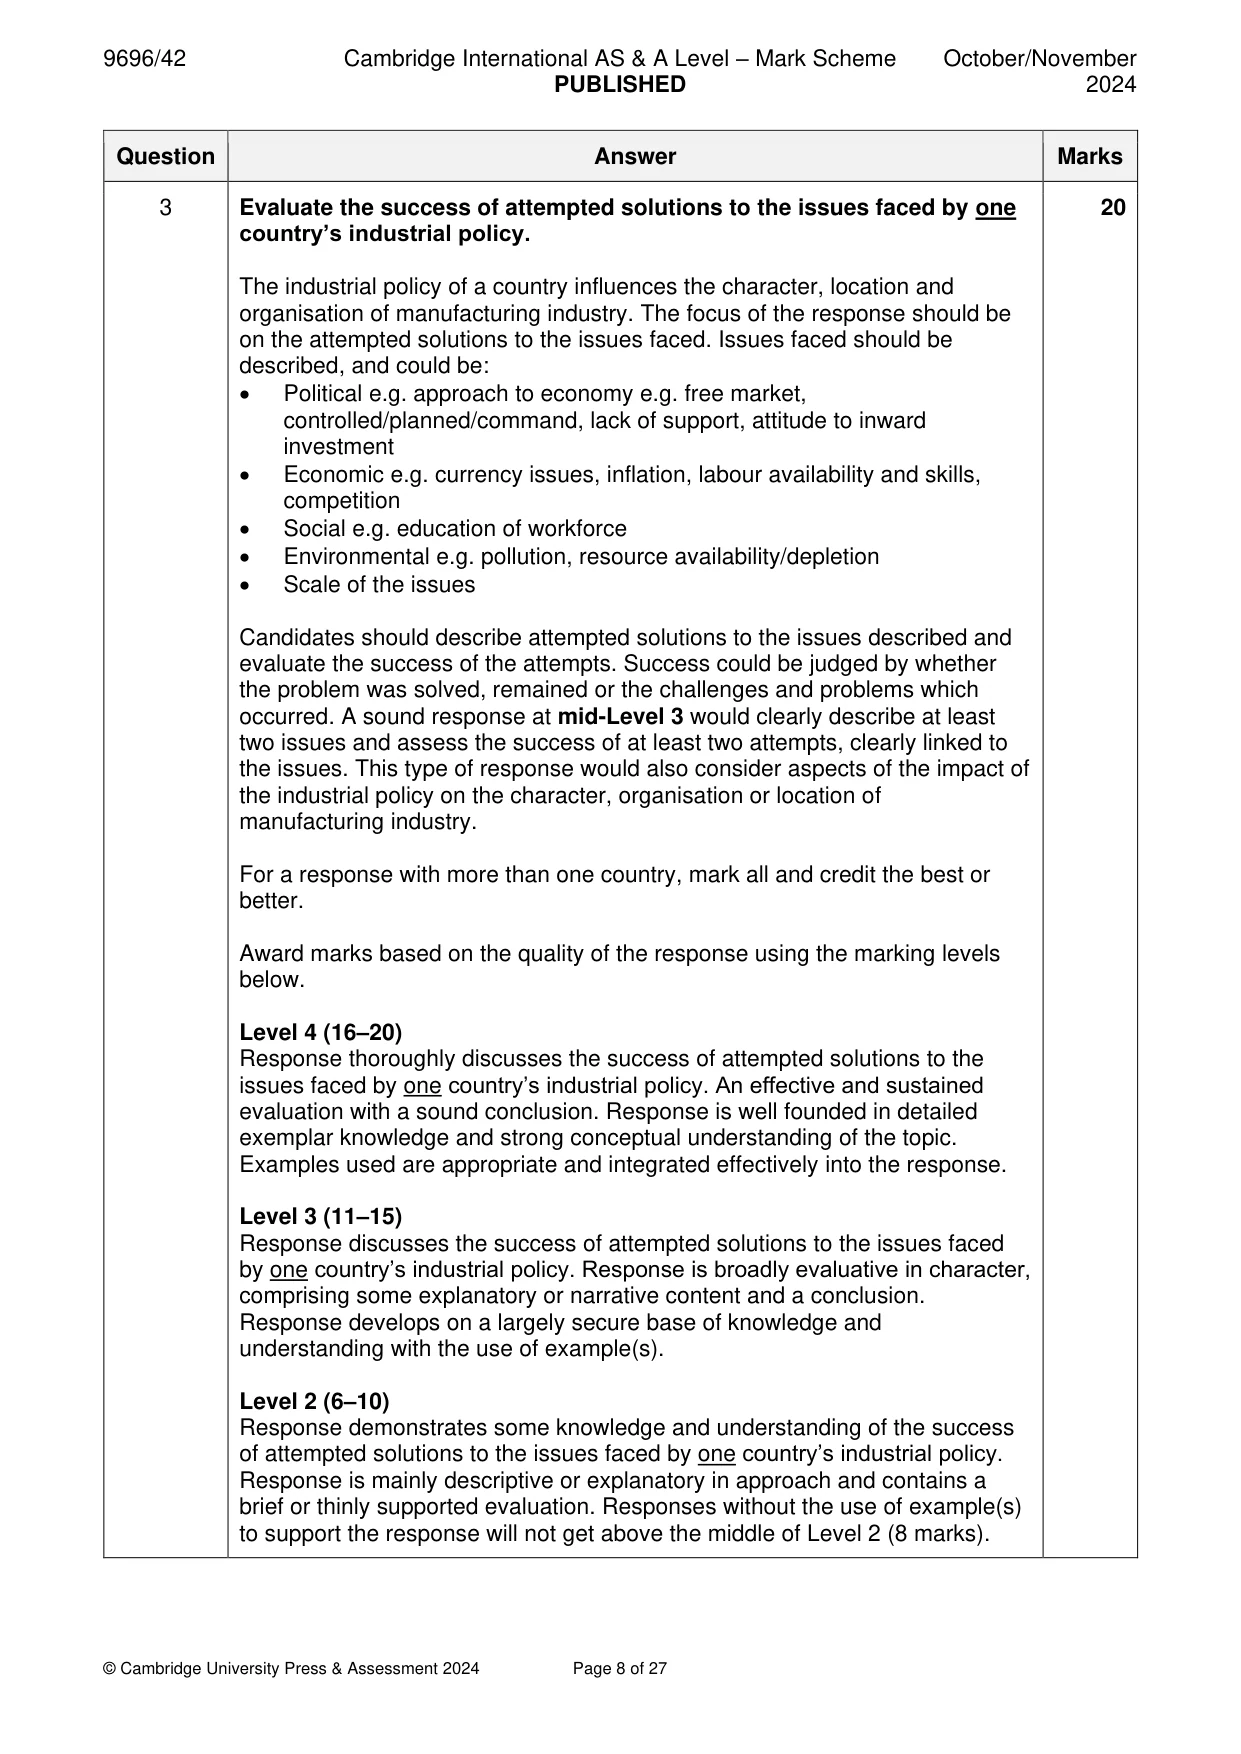
3 Evaluate the success of attempted solutions to the issues faced by one country’s industrial policy. [20] Environmental management If answering this option, answer Question 4 and either Question 5 or Question 6.
Mark scheme: 3 Evaluate the success of attempted solutions to the issues faced by one 20 country’s industrial policy. The industrial policy of a country influences the character, location and organisation of manufacturing industry. The focus of the response should be on the attempted solutions to the issues faced. Issues faced should be described, and could be: • Political e.g. approach to economy e.g. free market, controlled/planned/command, lack of support, attitude to inward investment • Economic e.g. currency issues, inflation, labour availability and skills, competition • Social e.g. education of workforce • Environmental e.g. pollution, resource availability/depletion • Scale of the issues Candidates should describe attempted solutions to the issues described and evaluate the success of the attempts. Success could be judged by whether the problem was solved, remained or the challenges and problems which occurred. A sound response at mid-Level 3 would clearly describe at least two issues and assess the success of at least two attempts, clearly linked to the issues. This type of response would also consider aspects of the impact of the industrial policy on the character, organisation or location of manufacturing industry. For a response with more than one country, mark all and credit the best or better. Award marks based on the quality of the response using the marking levels below. Level 4 (16–20) Response thoroughly discusses the success of attempted solutions to the issues faced by one country’s industrial policy. An effective and sustained evaluation with a sound conclusion. Response is well founded in detailed exemplar knowledge and strong conceptual understanding of the topic. Examples used are appropriate and integrated effectively into the response. Level 3 (11–15) Response discusses the success of attempted solutions to the issues faced by one country’s industrial policy. Response is broadly evaluative in character, comprising some explanatory or narrative content and a conclusion. Response develops on a largely secure base of knowledge and understanding with the use of example(s). Level 2 (6–10) Response demonstrates some knowledge and understanding of the success of attempted solutions to the issues faced by one country’s industrial policy. Response is mainly descriptive or explanatory in approach and contains a brief or thinly supported evaluation. Responses without the use of example(s) to support the response will not get above the middle of Level 2 (8 marks). 3 Level 1 (1–5) Response makes a few general points about attempted solutions to the issues faced by one country’s industrial policy. A descriptive response comprising a few simple points. Knowledge is basic and understanding may be poor and lack relevance to the question set. Level 0 (0) No creditable response. Environmental management If answering this option, answer Question 4 and either Question 5 or Question 6.
Q4 · E-waste generated per person in 2019
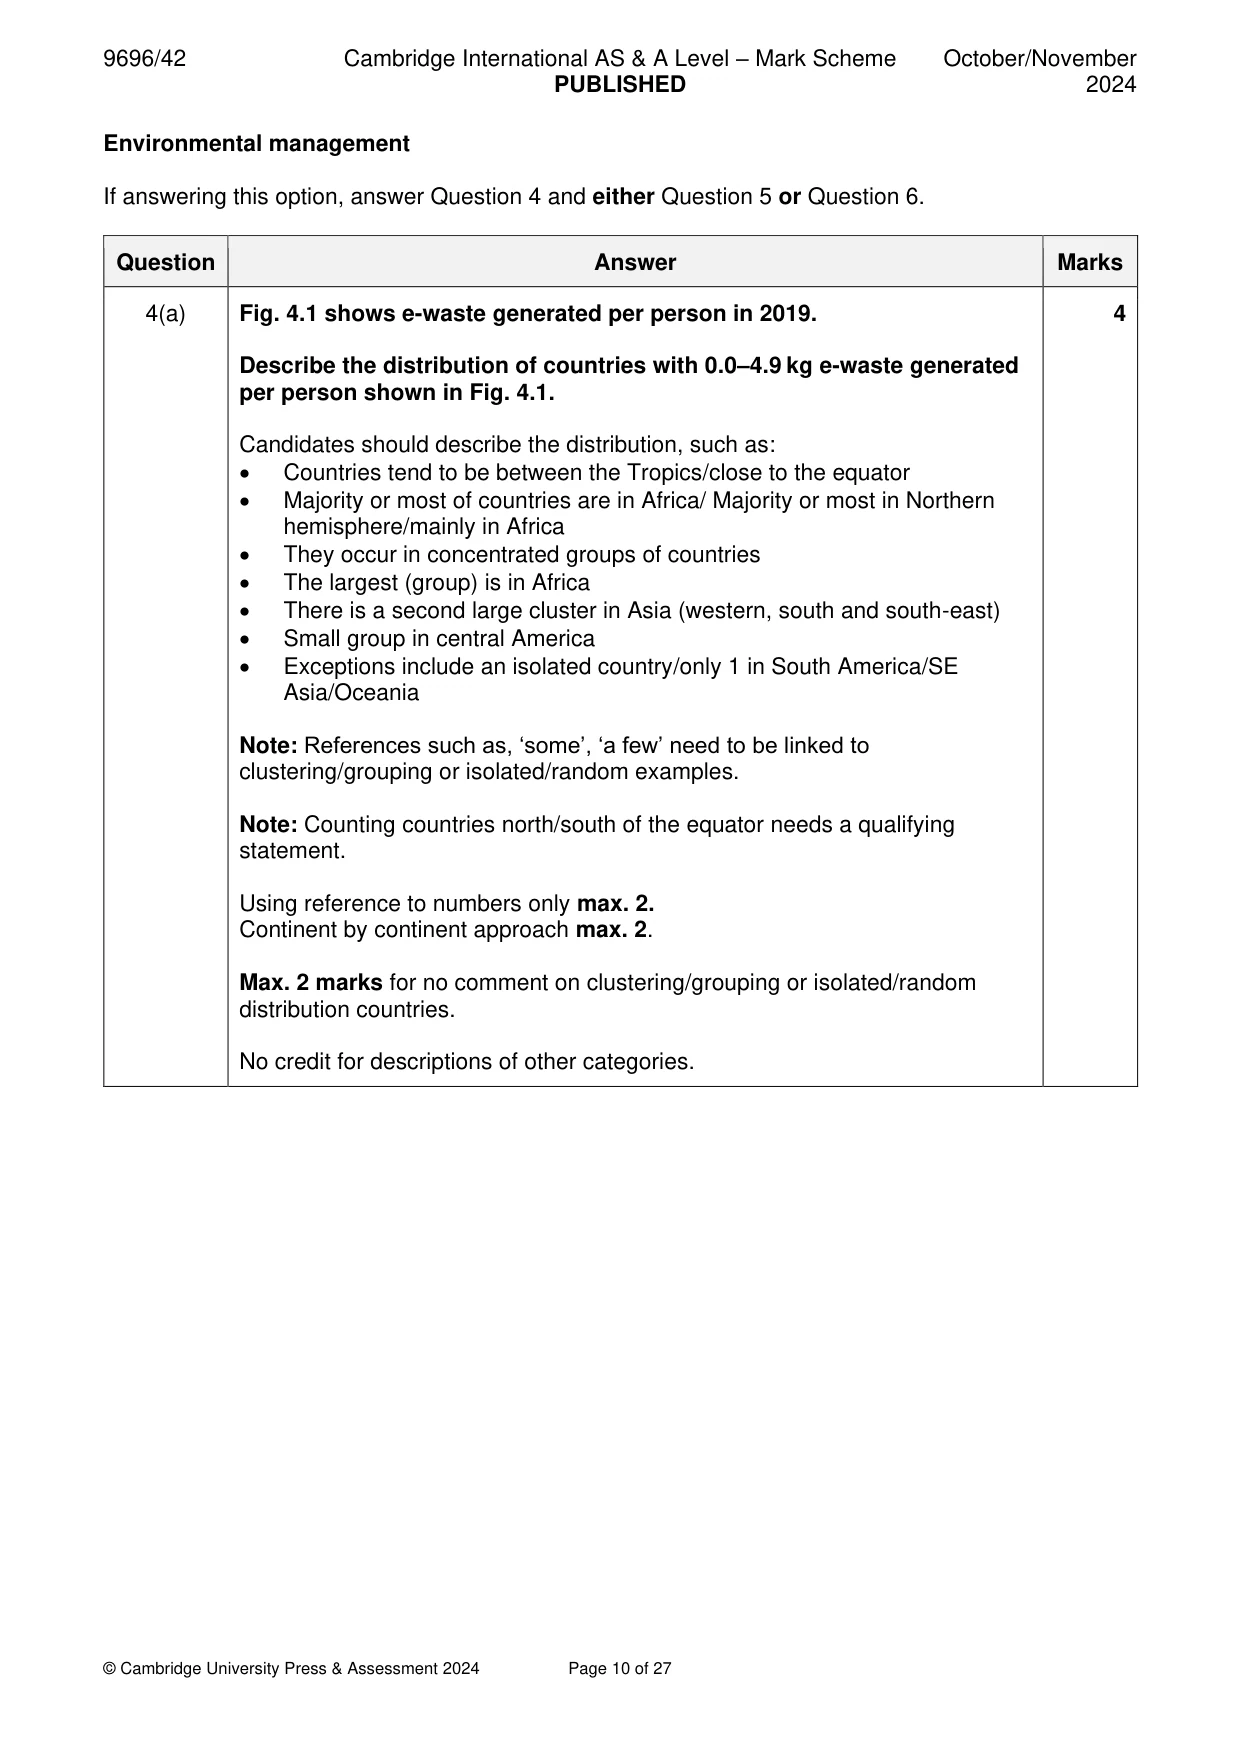
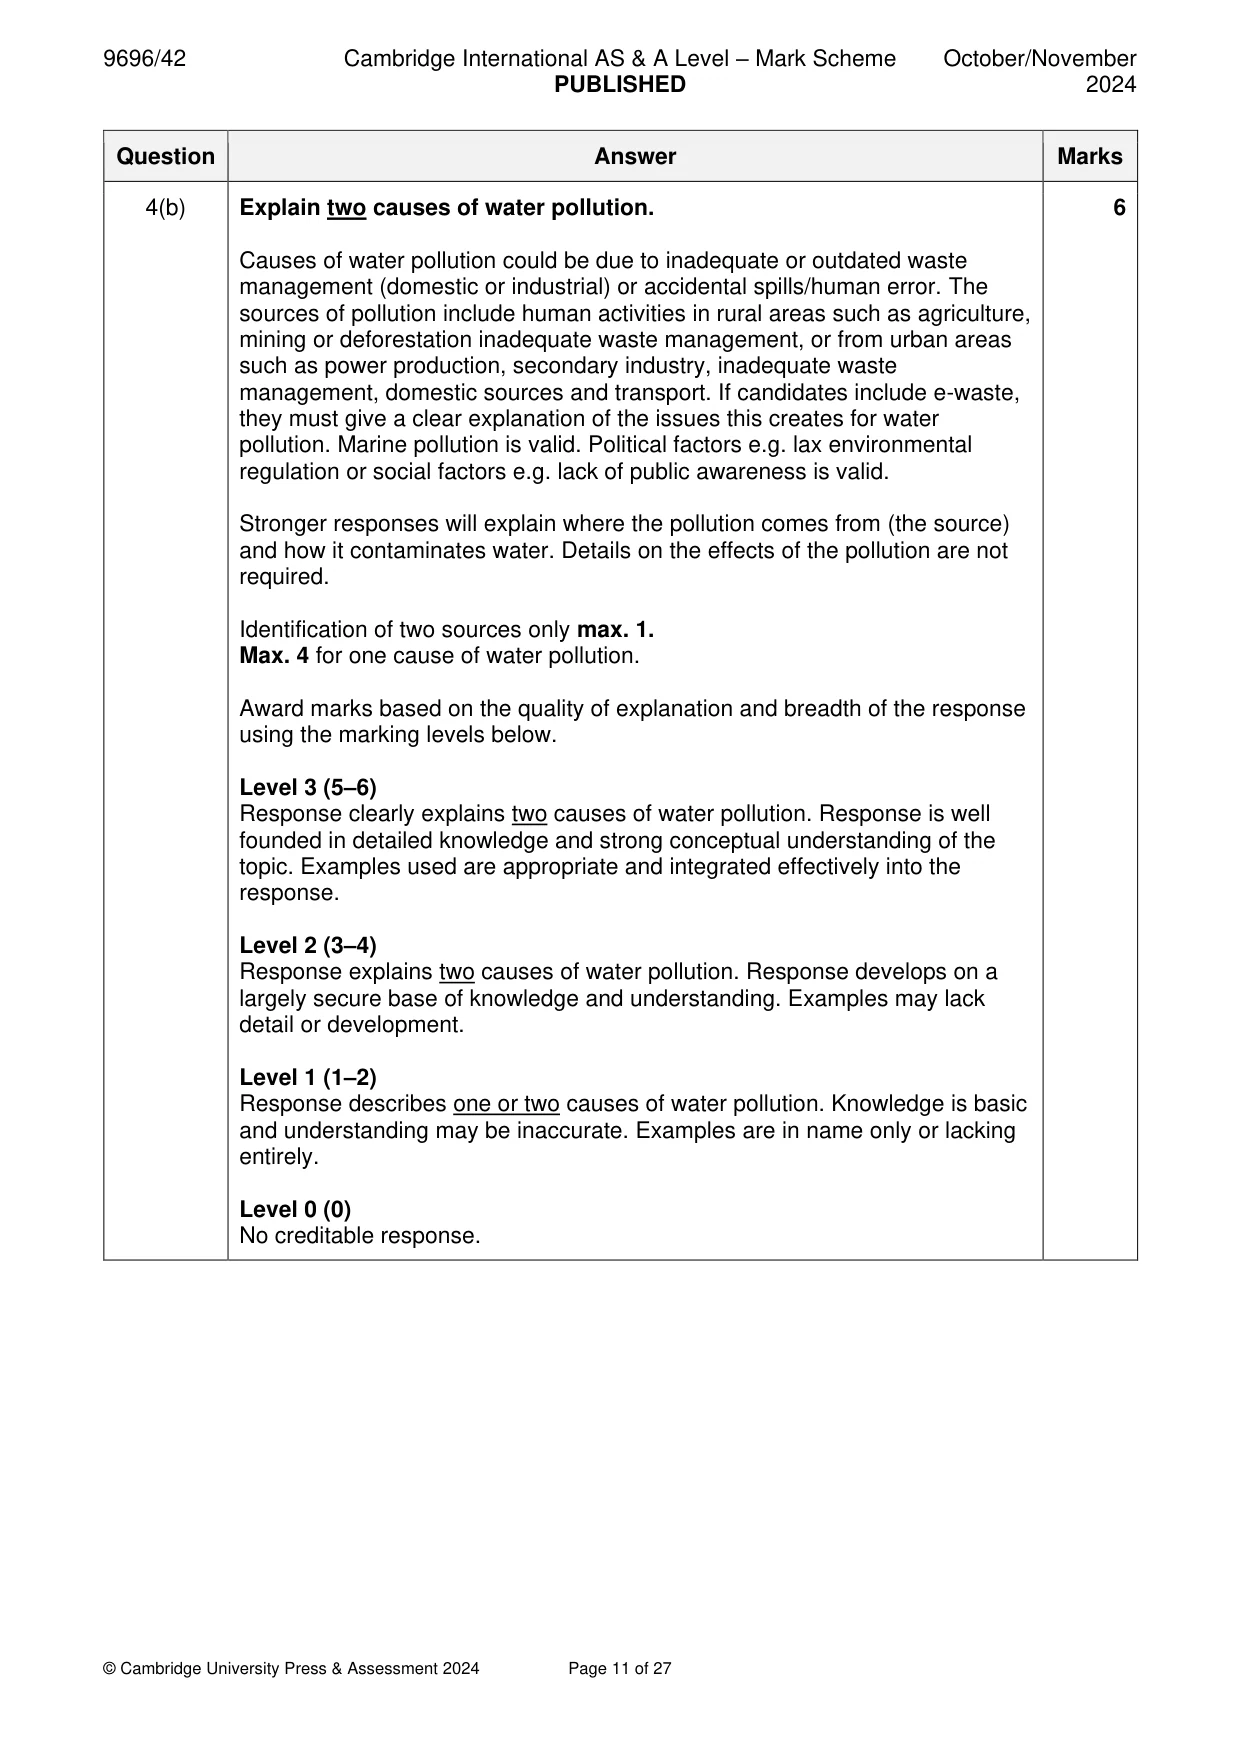
4 Fig. 4.1 shows e-waste generated per person in 2019. (a) Describe the distribution of countries with 0.0– 4.9 kg e-waste generated per person shown in Fig. 4.1. [4] (b) Explain two causes of water pollution. [6]
Mark scheme: 4(a) Fig. 4.1 shows e-waste generated per person in 2019. 4 Describe the distribution of countries with 0.0–4.9 kg e-waste generated per person shown in Fig. 4.1. Candidates should describe the distribution, such as: • Countries tend to be between the Tropics/close to the equator • Majority or most of countries are in Africa/ Majority or most in Northern hemisphere/mainly in Africa • They occur in concentrated groups of countries • The largest (group) is in Africa • There is a second large cluster in Asia (western, south and south-east) • Small group in central America • Exceptions include an isolated country/only 1 in South America/SE Asia/Oceania Note: References such as, ‘some’, ‘a few’ need to be linked to clustering/grouping or isolated/random examples. Note: Counting countries north/south of the equator needs a qualifying statement. Using reference to numbers only max. 2. Continent by continent approach max. 2. Max. 2 marks for no comment on clustering/grouping or isolated/random distribution countries. No credit for descriptions of other categories. 4(b) Explain two causes of water pollution. 6 Causes of water pollution could be due to inadequate or outdated waste management (domestic or industrial) or accidental spills/human error. The sources of pollution include human activities in rural areas such as agriculture, mining or deforestation inadequate waste management, or from urban areas such as power production, secondary industry, inadequate waste management, domestic sources and transport. If candidates include e-waste, they must give a clear explanation of the issues this creates for water pollution. Marine pollution is valid. Political factors e.g. lax environmental regulation or social factors e.g. lack of public awareness is valid. Stronger responses will explain where the pollution comes from (the source) and how it contaminates water. Details on the effects of the pollution are not required. Identification of two sources only max. 1. Max. 4 for one cause of water pollution. Award marks based on the quality of explanation and breadth of the response using the marking levels below. Level 3 (5–6) Response clearly explains two causes of water pollution. Response is well founded in detailed knowledge and strong conceptual understanding of the topic. Examples used are appropriate and integrated effectively into the response. Level 2 (3–4) Response explains two causes of water pollution. Response develops on a largely secure base of knowledge and understanding. Examples may lack detail or development. Level 1 (1–2) Response describes one or two causes of water pollution. Knowledge is basic and understanding may be inaccurate. Examples are in name only or lacking entirely. Level 0 (0) No creditable response.
Q5 · ‘Environmental impacts are the most important consideration for the overall electrical…
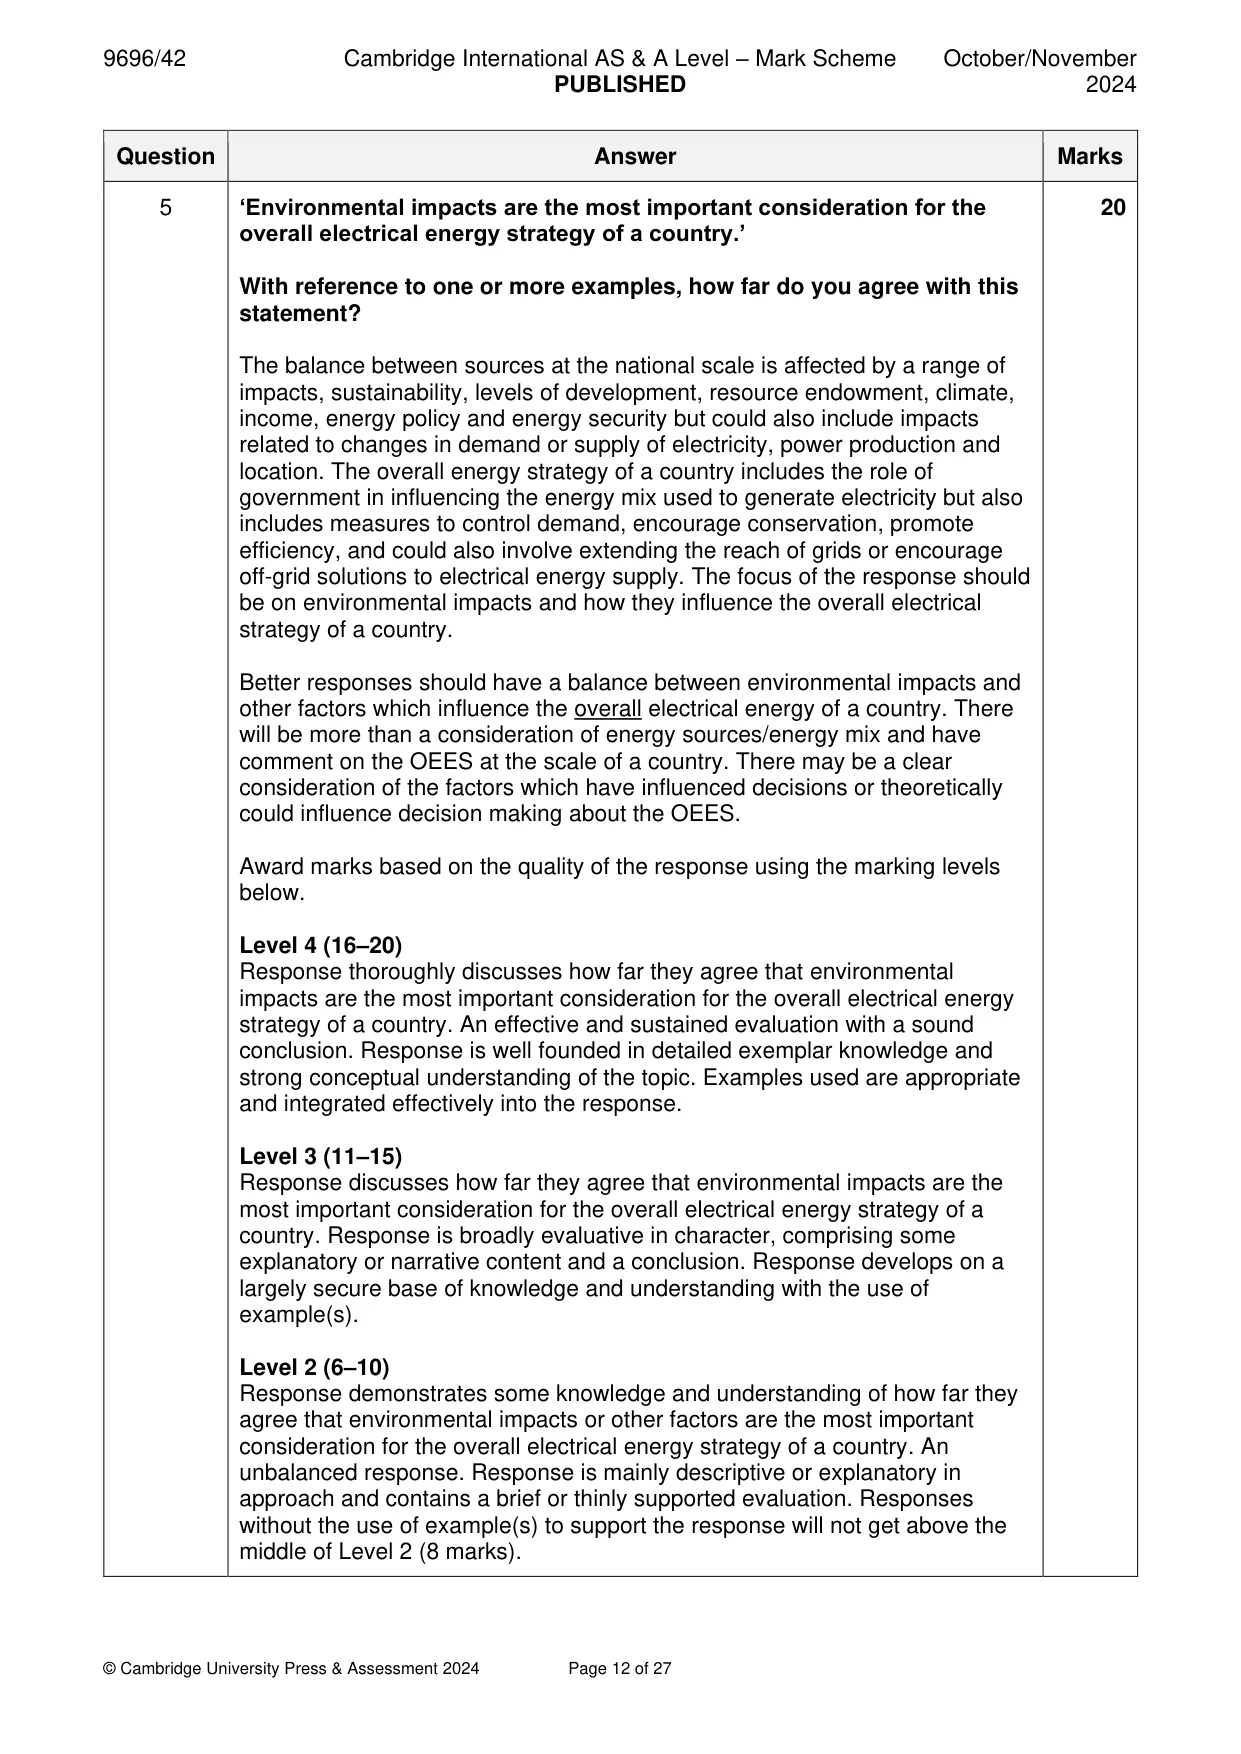
5 ‘Environmental impacts are the most important consideration for the overall electrical energy strategy of a country.’ With reference to one or more examples, how far do you agree with this statement? [20]
Mark scheme: 5 ‘Environmental impacts are the most important consideration for the 20 overall electrical energy strategy of a country.’ With reference to one or more examples, how far do you agree with this statement? The balance between sources at the national scale is affected by a range of impacts, sustainability, levels of development, resource endowment, climate, income, energy policy and energy security but could also include impacts related to changes in demand or supply of electricity, power production and location. The overall energy strategy of a country includes the role of government in influencing the energy mix used to generate electricity but also includes measures to control demand, encourage conservation, promote efficiency, and could also involve extending the reach of grids or encourage off-grid solutions to electrical energy supply. The focus of the response should be on environmental impacts and how they influence the overall electrical strategy of a country. Better responses should have a balance between environmental impacts and other factors which influence the overall electrical energy of a country. There will be more than a consideration of energy sources/energy mix and have comment on the OEES at the scale of a country. There may be a clear consideration of the factors which have influenced decisions or theoretically could influence decision making about the OEES. Award marks based on the quality of the response using the marking levels below. Level 4 (16–20) Response thoroughly discusses how far they agree that environmental impacts are the most important consideration for the overall electrical energy strategy of a country. An effective and sustained evaluation with a sound conclusion. Response is well founded in detailed exemplar knowledge and strong conceptual understanding of the topic. Examples used are appropriate and integrated effectively into the response. Level 3 (11–15) Response discusses how far they agree that environmental impacts are the most important consideration for the overall electrical energy strategy of a country. Response is broadly evaluative in character, comprising some explanatory or narrative content and a conclusion. Response develops on a largely secure base of knowledge and understanding with the use of example(s). Level 2 (6–10) Response demonstrates some knowledge and understanding of how far they agree that environmental impacts or other factors are the most important consideration for the overall electrical energy strategy of a country. An unbalanced response. Response is mainly descriptive or explanatory in approach and contains a brief or thinly supported evaluation. Responses without the use of example(s) to support the response will not get above the middle of Level 2 (8 marks). 5 Level 1 (1–5) Response makes a few general points about environmental impacts and/or the electrical energy strategy of a country. A descriptive response comprising a few simple points. Knowledge is basic and understanding may be poor and lack relevance to the question set. Level 0 (0) No creditable response.
Q6 · Global interdependence If answering this option, answer Question 7 and either Question 8…
Global interdependence If answering this option, answer Question 7 and either Question 8 or Question 9.
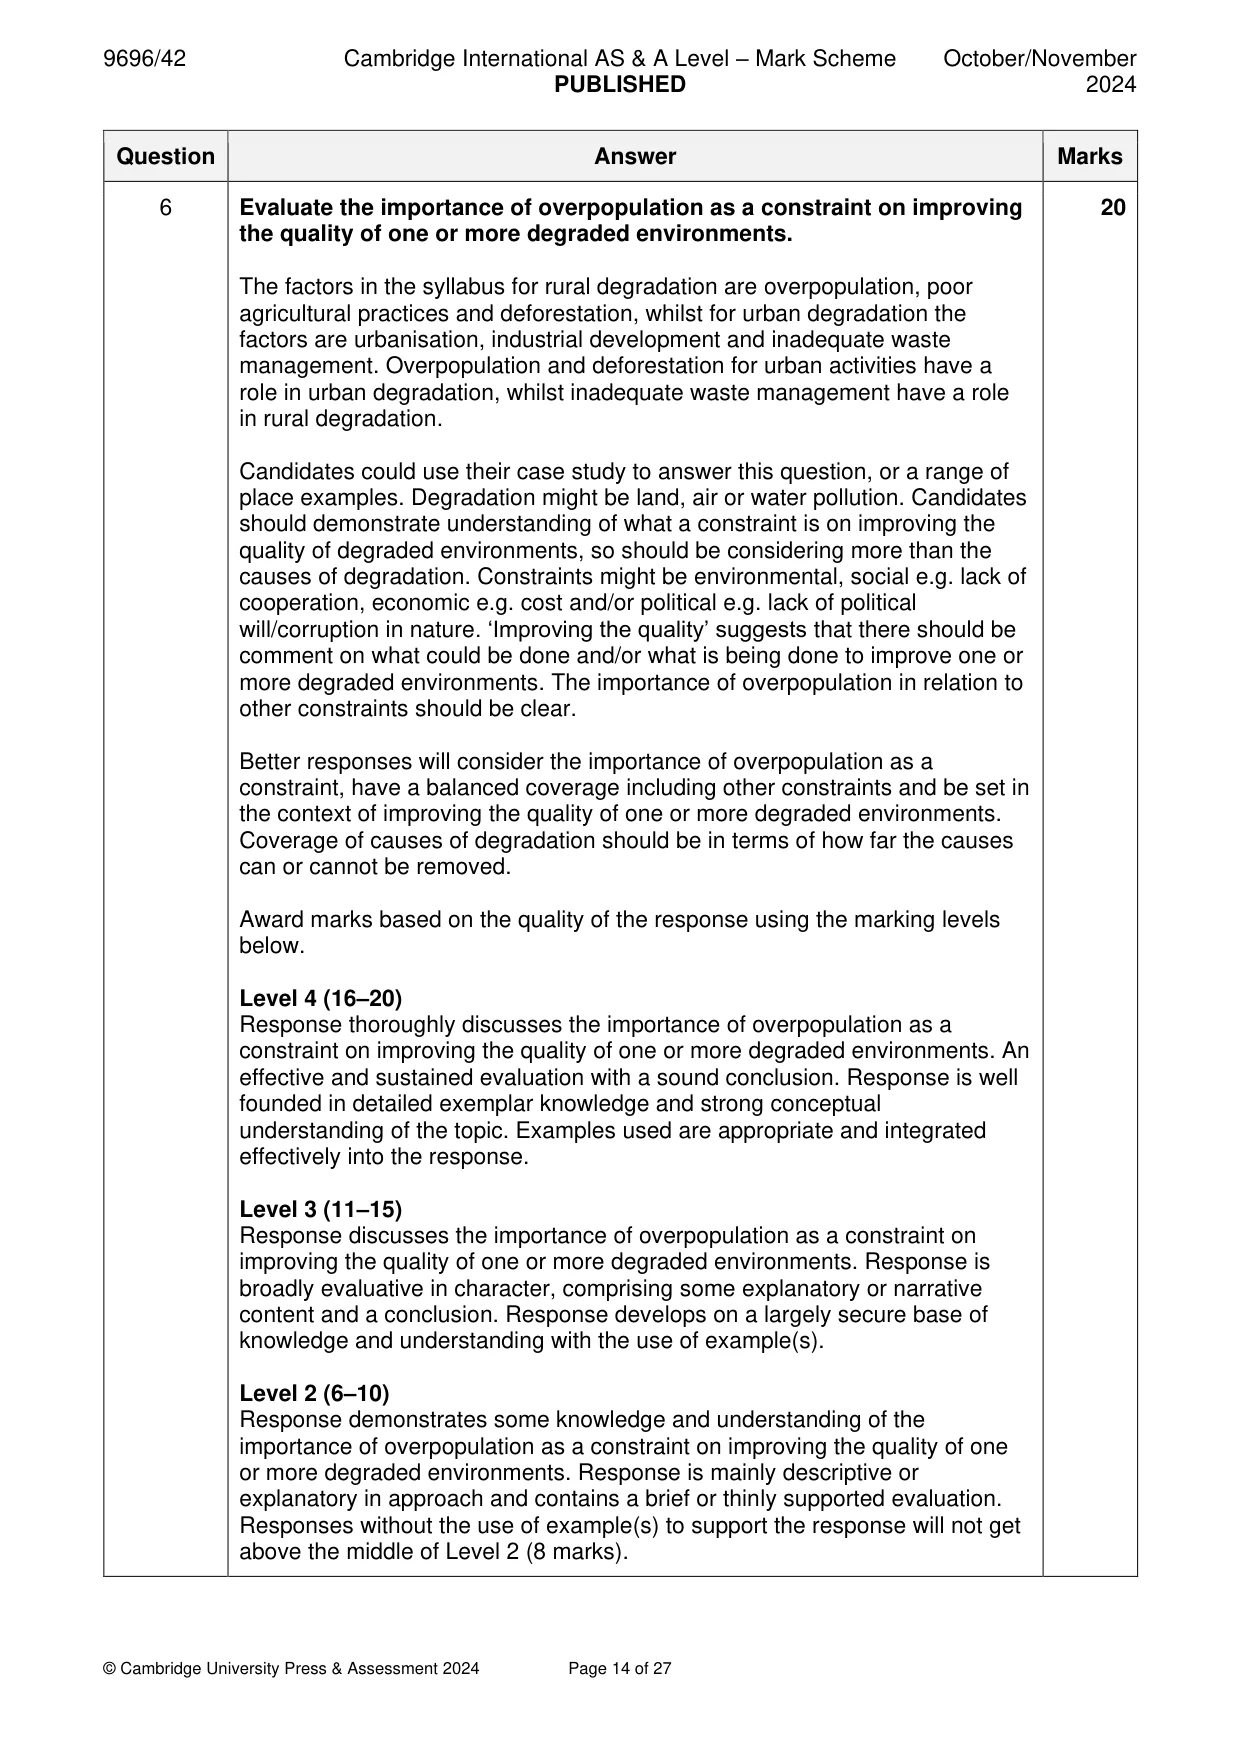
Mark scheme: 6 Evaluate the importance of overpopulation as a constraint on improving 20 the quality of one or more degraded environments. The factors in the syllabus for rural degradation are overpopulation, poor agricultural practices and deforestation, whilst for urban degradation the factors are urbanisation, industrial development and inadequate waste management. Overpopulation and deforestation for urban activities have a role in urban degradation, whilst inadequate waste management have a role in rural degradation. Candidates could use their case study to answer this question, or a range of place examples. Degradation might be land, air or water pollution. Candidates should demonstrate understanding of what a constraint is on improving the quality of degraded environments, so should be considering more than the causes of degradation. Constraints might be environmental, social e.g. lack of cooperation, economic e.g. cost and/or political e.g. lack of political will/corruption in nature. ‘Improving the quality’ suggests that there should be comment on what could be done and/or what is being done to improve one or more degraded environments. The importance of overpopulation in relation to other constraints should be clear. Better responses will consider the importance of overpopulation as a constraint, have a balanced coverage including other constraints and be set in the context of improving the quality of one or more degraded environments. Coverage of causes of degradation should be in terms of how far the causes can or cannot be removed. Award marks based on the quality of the response using the marking levels below. Level 4 (16–20) Response thoroughly discusses the importance of overpopulation as a constraint on improving the quality of one or more degraded environments. An effective and sustained evaluation with a sound conclusion. Response is well founded in detailed exemplar knowledge and strong conceptual understanding of the topic. Examples used are appropriate and integrated effectively into the response. Level 3 (11–15) Response discusses the importance of overpopulation as a constraint on improving the quality of one or more degraded environments. Response is broadly evaluative in character, comprising some explanatory or narrative content and a conclusion. Response develops on a largely secure base of knowledge and understanding with the use of example(s). Level 2 (6–10) Response demonstrates some knowledge and understanding of the importance of overpopulation as a constraint on improving the quality of one or more degraded environments. Response is mainly descriptive or explanatory in approach and contains a brief or thinly supported evaluation. Responses without the use of example(s) to support the response will not get above the middle of Level 2 (8 marks). 6 Level 1 (1–5) Response makes a few general points about overpopulation as a constraint on improving the quality of one or more degraded environments or is focused on causes of degradation only. A descriptive response comprising a few simple points. Knowledge is basic and understanding may be poor and lack relevance to the question set. Level 0 (0) No creditable response. Global interdependence If answering this option, answer Question 7 and either Question 8 or Question 9.
Q7 · Selected characteristics of three trading blocs in 2022
7 Table 7.1 shows selected characteristics of three trading blocs in 2022. (a) Compare the characteristics of the three trading blocs shown in Table 7.1. [4] (b) Explain two ways trade agreements affect global patterns of trade. [6]
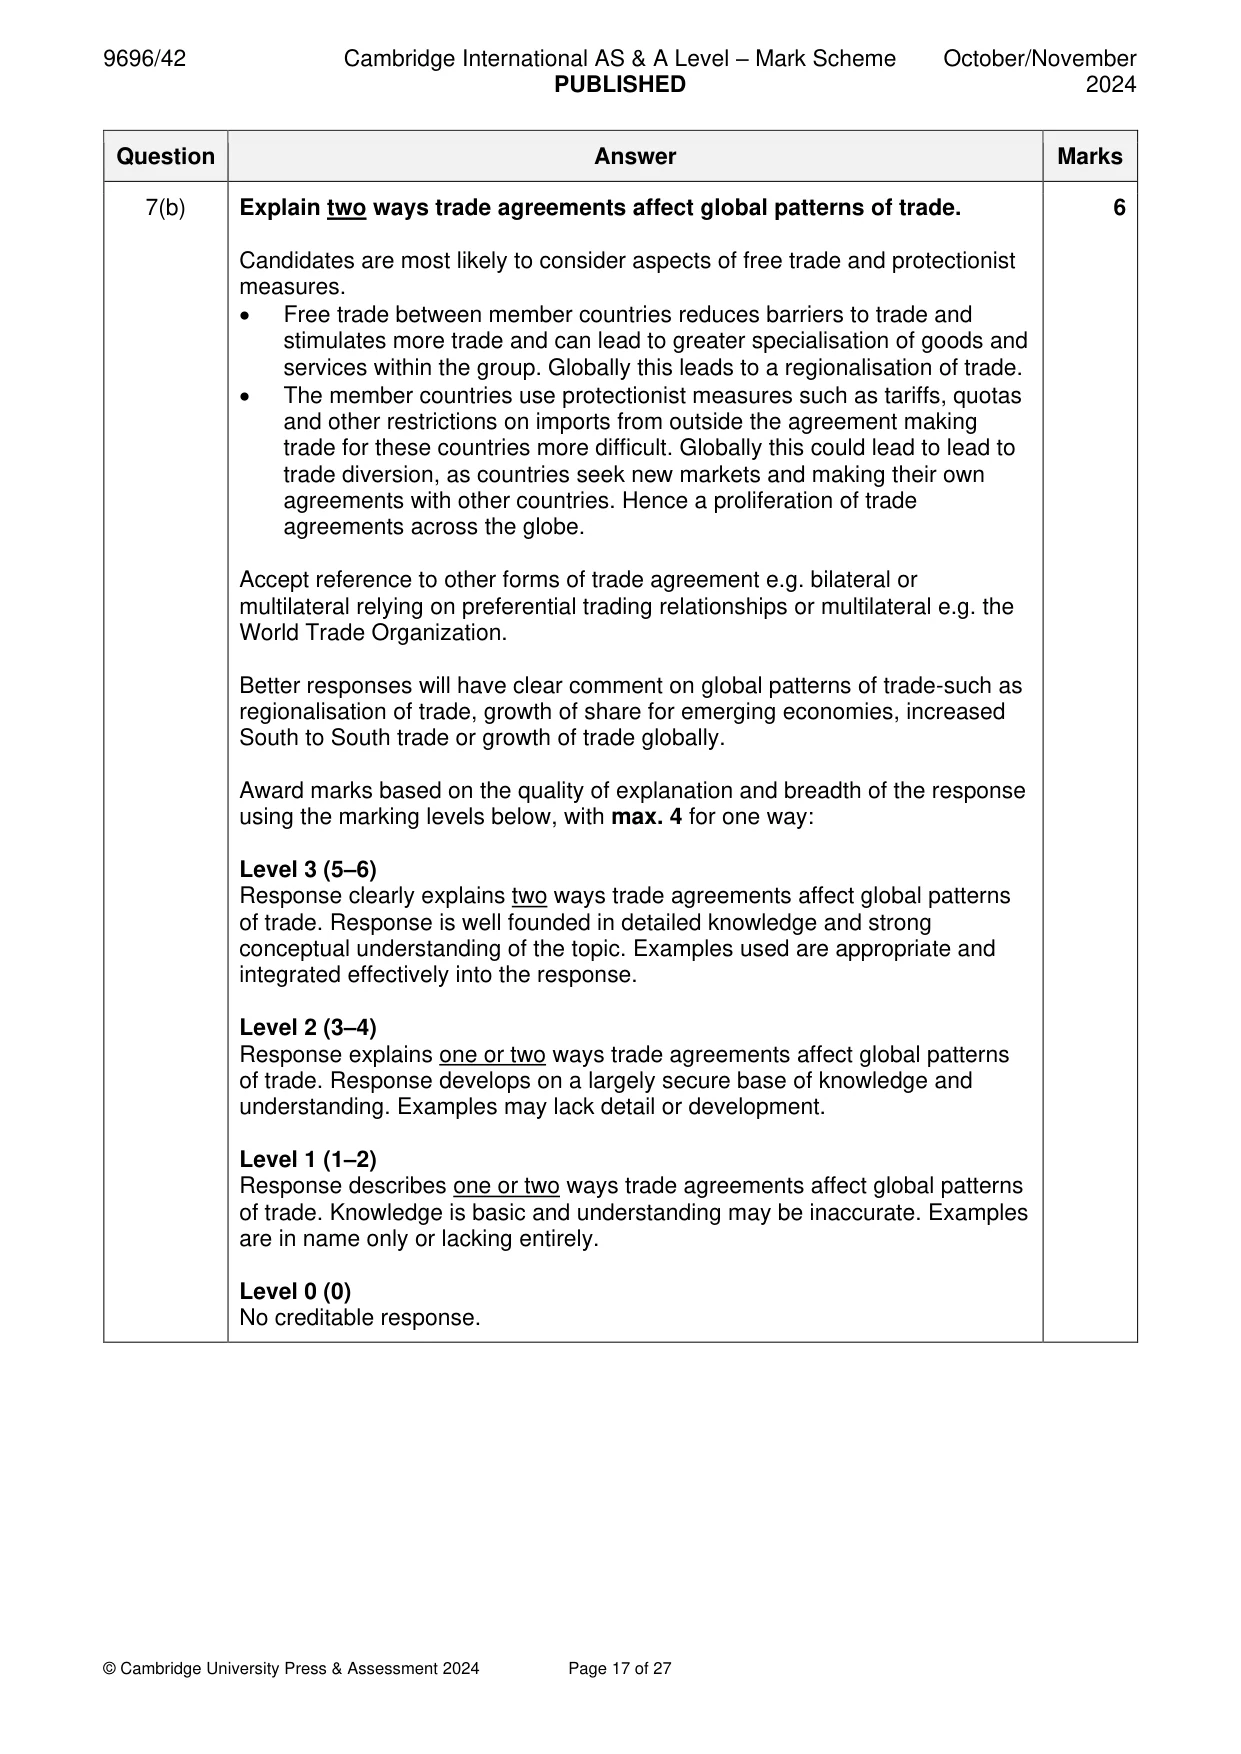
Mark scheme: 7(a) Table 7.1 shows selected characteristics of three trading blocs in 2022. 4 Compare the characteristics of the three trading blocs shown in Table 7.1. Candidates should compare the information, such as: • USMCA and EU have similar population sizes, whereas RCEP has a larger population (1) by a significant amount / 5 larger (1) • USMCA and EU have similar growth rates, whereas RCEP has a greater growth rate (1) by a significant amount / triple that of USMCA and EU (1) • USMCA and RCEP have a similar GDP, whereas EU GDP is smaller (1) • All 3 trading blocs have different average annual income (1), with USMCA the highest and RCEP the lowest (1) • Each characteristic has one standout trading bloc (1) Note: The description column is not a ‘selected characteristic’. Note: Each comparison should refer to all 3 trading blocs as above. For simple ranking and/or identification of highest/lowest max. 2. Credit development of one point. Max. 2 marks for no data support. 7(b) Explain two ways trade agreements affect global patterns of trade. 6 Candidates are most likely to consider aspects of free trade and protectionist measures. • Free trade between member countries reduces barriers to trade and stimulates more trade and can lead to greater specialisation of goods and services within the group. Globally this leads to a regionalisation of trade. • The member countries use protectionist measures such as tariffs, quotas and other restrictions on imports from outside the agreement making trade for these countries more difficult. Globally this could lead to lead to trade diversion, as countries seek new markets and making their own agreements with other countries. Hence a proliferation of trade agreements across the globe. Accept reference to other forms of trade agreement e.g. bilateral or multilateral relying on preferential trading relationships or multilateral e.g. the World Trade Organization. Better responses will have clear comment on global patterns of trade-such as regionalisation of trade, growth of share for emerging economies, increased South to South trade or growth of trade globally. Award marks based on the quality of explanation and breadth of the response using the marking levels below, with max. 4 for one way: Level 3 (5–6) Response clearly explains two ways trade agreements affect global patterns of trade. Response is well founded in detailed knowledge and strong conceptual understanding of the topic. Examples used are appropriate and integrated effectively into the response. Level 2 (3–4) Response explains one or two ways trade agreements affect global patterns of trade. Response develops on a largely secure base of knowledge and understanding. Examples may lack detail or development. Level 1 (1–2) Response describes one or two ways trade agreements affect global patterns of trade. Knowledge is basic and understanding may be inaccurate. Examples are in name only or lacking entirely. Level 0 (0) No creditable response.
Q8 · ‘The World Trade Organization (WTO) has an important role to play in the 21st century.’…
8 ‘The World Trade Organization (WTO) has an important role to play in the 21st century.’ With reference to one or more examples, how far do you agree with this statement? [20]
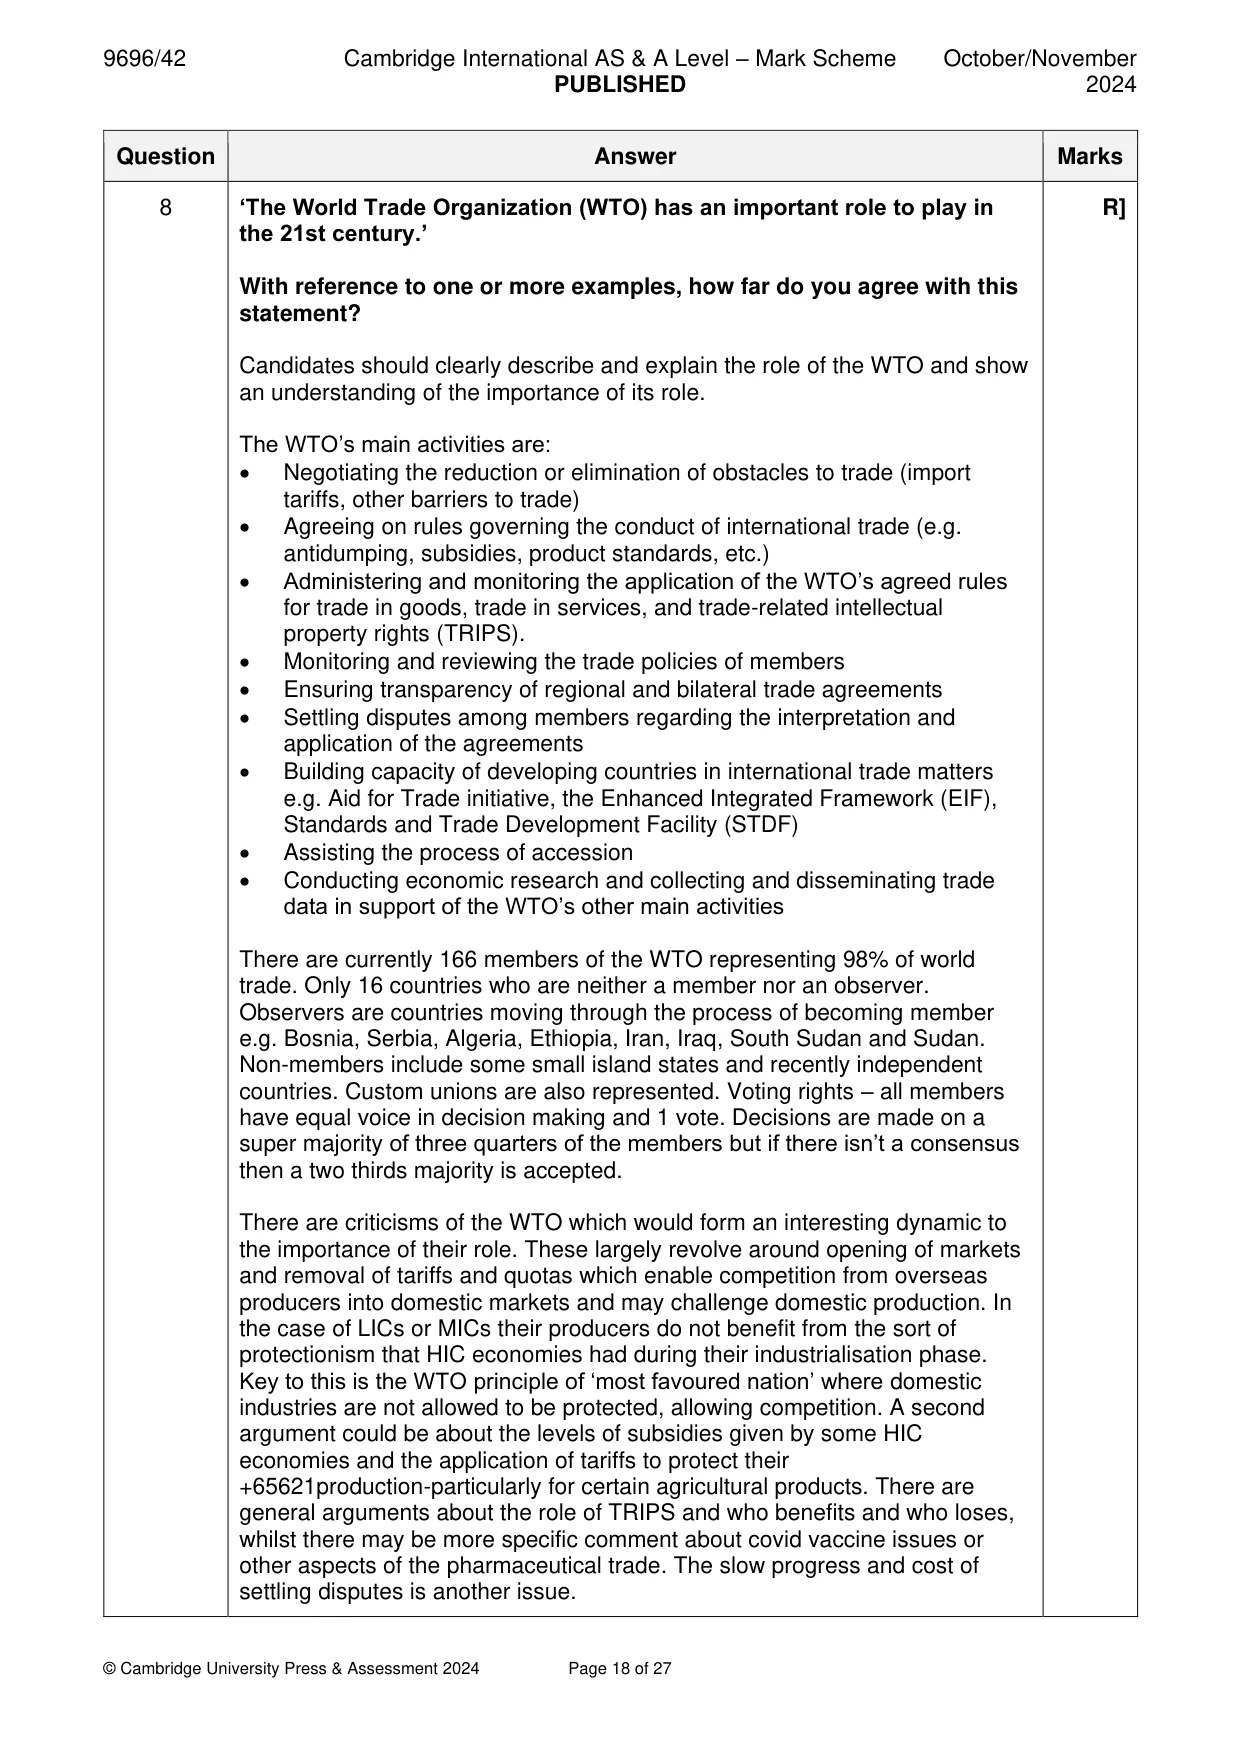
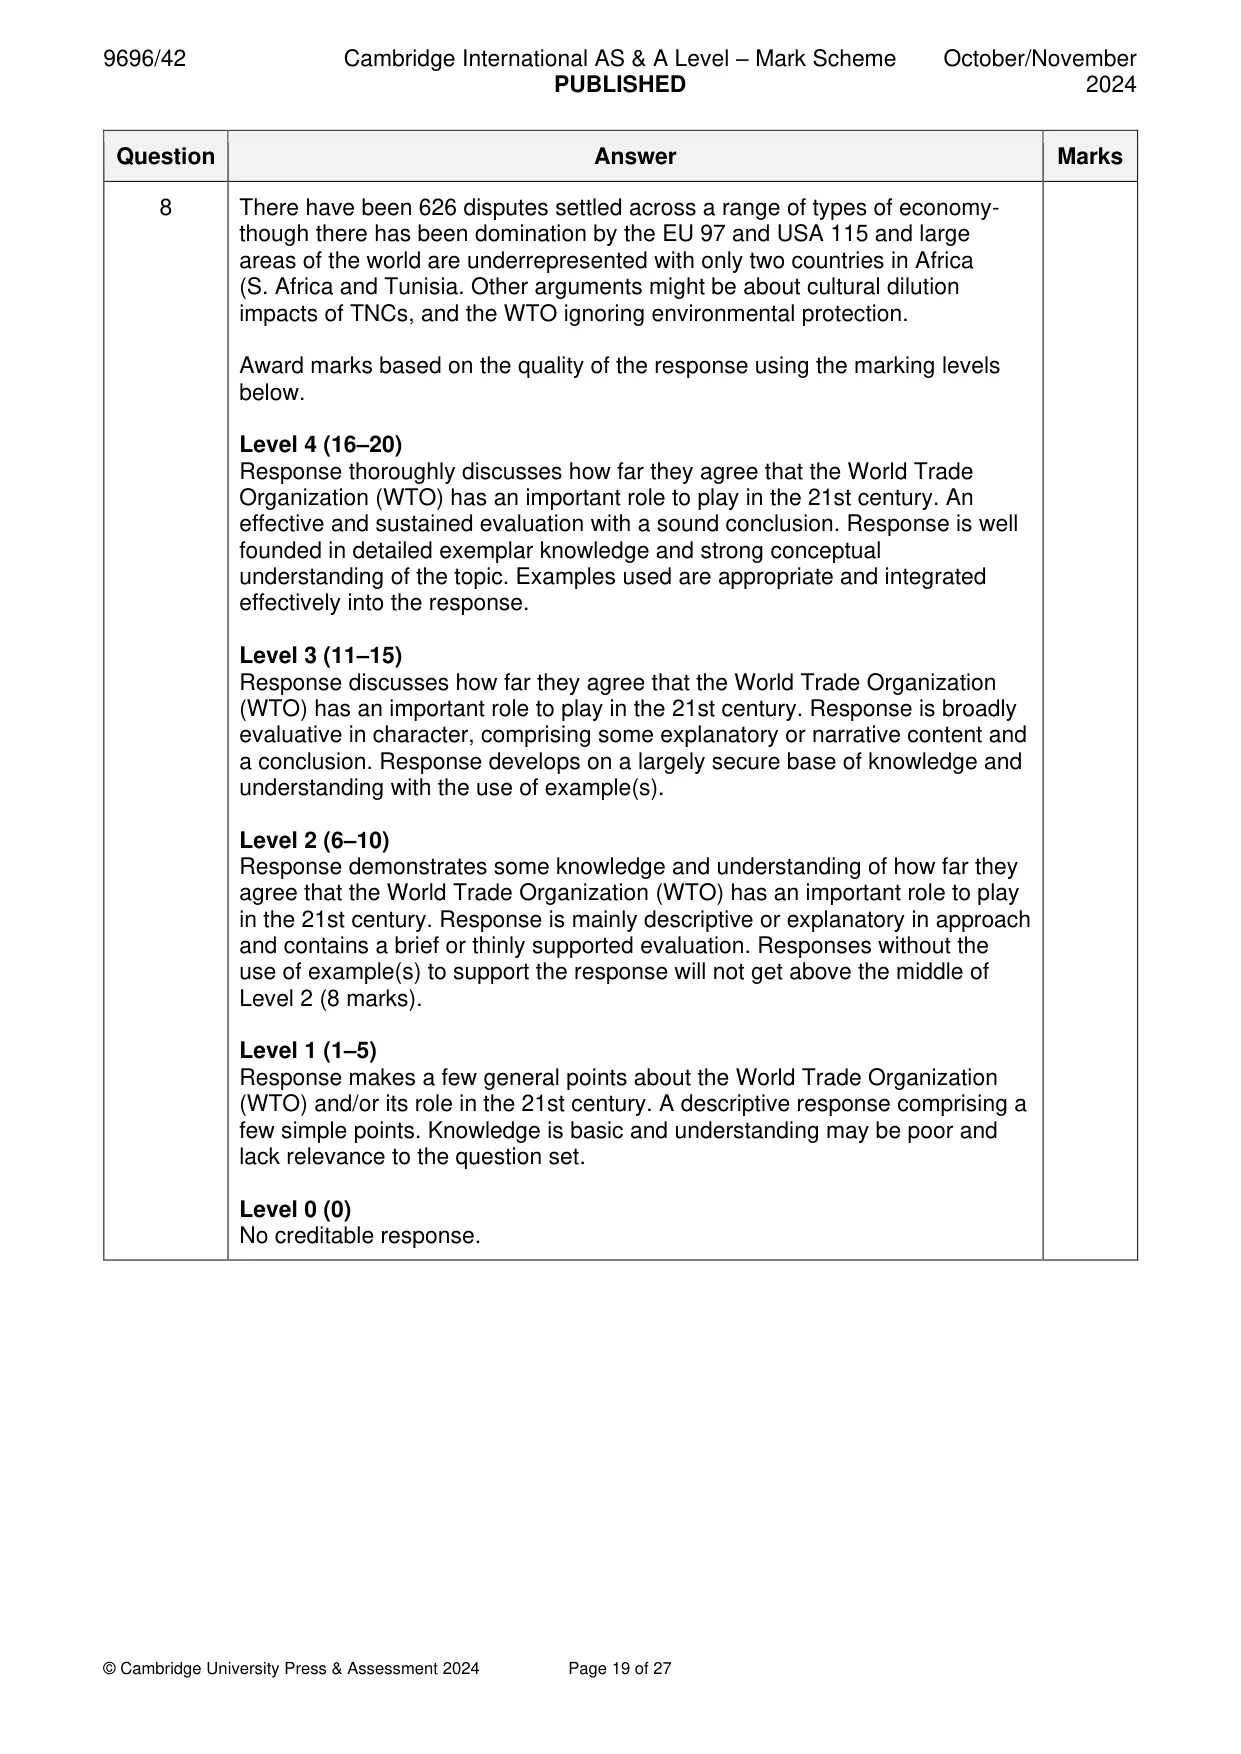
Mark scheme: 8 ‘The World Trade Organization (WTO) has an important role to play in R] the 21st century.’ With reference to one or more examples, how far do you agree with this statement? Candidates should clearly describe and explain the role of the WTO and show an understanding of the importance of its role. The WTO’s main activities are: • Negotiating the reduction or elimination of obstacles to trade (import tariffs, other barriers to trade) • Agreeing on rules governing the conduct of international trade (e.g. antidumping, subsidies, product standards, etc.) • Administering and monitoring the application of the WTO’s agreed rules for trade in goods, trade in services, and trade-related intellectual property rights (TRIPS). • Monitoring and reviewing the trade policies of members • Ensuring transparency of regional and bilateral trade agreements • Settling disputes among members regarding the interpretation and application of the agreements • Building capacity of developing countries in international trade matters e.g. Aid for Trade initiative, the Enhanced Integrated Framework (EIF), Standards and Trade Development Facility (STDF) • Assisting the process of accession • Conducting economic research and collecting and disseminating trade data in support of the WTO’s other main activities There are currently 166 members of the WTO representing 98% of world trade. Only 16 countries who are neither a member nor an observer. Observers are countries moving through the process of becoming member e.g. Bosnia, Serbia, Algeria, Ethiopia, Iran, Iraq, South Sudan and Sudan. Non-members include some small island states and recently independent countries. Custom unions are also represented. Voting rights – all members have equal voice in decision making and 1 vote. Decisions are made on a super majority of three quarters of the members but if there isn’t a consensus then a two thirds majority is accepted. There are criticisms of the WTO which would form an interesting dynamic to the importance of their role. These largely revolve around opening of markets and removal of tariffs and quotas which enable competition from overseas producers into domestic markets and may challenge domestic production. In the case of LICs or MICs their producers do not benefit from the sort of protectionism that HIC economies had during their industrialisation phase. Key to this is the WTO principle of ‘most favoured nation’ where domestic industries are not allowed to be protected, allowing competition. A second argument could be about the levels of subsidies given by some HIC economies and the application of tariffs to protect their +65621production-particularly for certain agricultural products. There are general arguments about the role of TRIPS and who benefits and who loses, whilst there may be more specific comment about covid vaccine issues or other aspects of the pharmaceutical trade. The slow progress and cost of settling disputes is another issue. 8 There have been 626 disputes settled across a range of types of economy- though there has been domination by the EU 97 and USA 115 and large areas of the world are underrepresented with only two countries in Africa (S. Africa and Tunisia. Other arguments might be about cultural dilution impacts of TNCs, and the WTO ignoring environmental protection. Award marks based on the quality of the response using the marking levels below. Level 4 (16–20) Response thoroughly discusses how far they agree that the World Trade Organization (WTO) has an important role to play in the 21st century. An effective and sustained evaluation with a sound conclusion. Response is well founded in detailed exemplar knowledge and strong conceptual understanding of the topic. Examples used are appropriate and integrated effectively into the response. Level 3 (11–15) Response discusses how far they agree that the World Trade Organization (WTO) has an important role to play in the 21st century. Response is broadly evaluative in character, comprising some explanatory or narrative content and a conclusion. Response develops on a largely secure base of knowledge and understanding with the use of example(s). Level 2 (6–10) Response demonstrates some knowledge and understanding of how far they agree that the World Trade Organization (WTO) has an important role to play in the 21st century. Response is mainly descriptive or explanatory in approach and contains a brief or thinly supported evaluation. Responses without the use of example(s) to support the response will not get above the middle of Level 2 (8 marks). Level 1 (1–5) Response makes a few general points about the World Trade Organization (WTO) and/or its role in the 21st century. A descriptive response comprising a few simple points. Knowledge is basic and understanding may be poor and lack relevance to the question set. Level 0 (0) No creditable response.
Q9 · With reference to one or more examples, how far do you agree that sustainability is an…
9 With reference to one or more examples, how far do you agree that sustainability is an issue for tourist destinations? [20] Economic transition If answering this option, answer Question 10 and either Question 11 or Question 12.
Mark scheme: 9 With reference to one or more examples, how far do you agree that 20 sustainability is an issue for tourist destinations? Sustainable tourism could be defined as tourism that takes full account of its current and future economic, social and environmental impacts, addressing the needs of visitors, the industry, the environment and host communities, with a suitable balance established between these three dimensions to guarantee its long-term sustainability or as: tourism organised in such a way that its level can be sustained in the future without creating irreparable environmental, social and economic damage to the receiving area. Candidates should clearly explain what issues of sustainability tourist destinations could face. These issues could be environmental, social, economic or political. The issues of sustainability might vary from location to location or from time to time. A higher-level response could explore whether sustainability is an issue for the example(s) chosen rather than focusing on problems or impacts. There might also be a discussion of the viewpoints of varying stakeholders. The use of the life cycle model of tourism, and the stage that a destination has reached, could form part of an answer about whether the issue of sustainability will eventually come to a destination, unless it successfully rejuvenates. Candidates might comment on carrying capacity, which might be defined as the maximum number of people that may visit a tourist destination at the same time, without causing destruction of the physical, economic, socio-cultural environment and an unacceptable decrease in the quality of visitors’ satisfaction. Award marks based on the quality of the response using the marking levels below. Level 4 (16–20) Response thoroughly discusses how far they agree that sustainability is an issue for tourist destinations. An effective and sustained evaluation with a sound conclusion. Response is well founded in detailed exemplar knowledge and strong conceptual understanding of the topic. Examples used are appropriate and integrated effectively into the response. Level 3 (11–15) Response discusses how far they agree that sustainability is an issue for tourist destinations. Response is broadly evaluative in character, comprising some explanatory or narrative content and a conclusion. Response develops on a largely secure base of knowledge and understanding with the use of example(s). Level 2 (6–10) Response demonstrates some knowledge and understanding of how far they agree that sustainability is an issue for tourist destinations. Response is mainly descriptive or explanatory in approach and contains a brief or thinly supported evaluation. Responses without the use of example(s) to support the response will not get above the middle of Level 2 (8 marks). 9 Level 1 (1–5) Response makes a few general points about tourist destinations and/or issues of sustainability. A descriptive response comprising a few simple points. Knowledge is basic and understanding may be poor and lack relevance to the question set. Level 0 (0) No creditable response. Economic transition If answering this option, answer Question 10 and either Question 11 or Question 12.
Q10 · The relationship between average maths and reading scores and income inequality for…
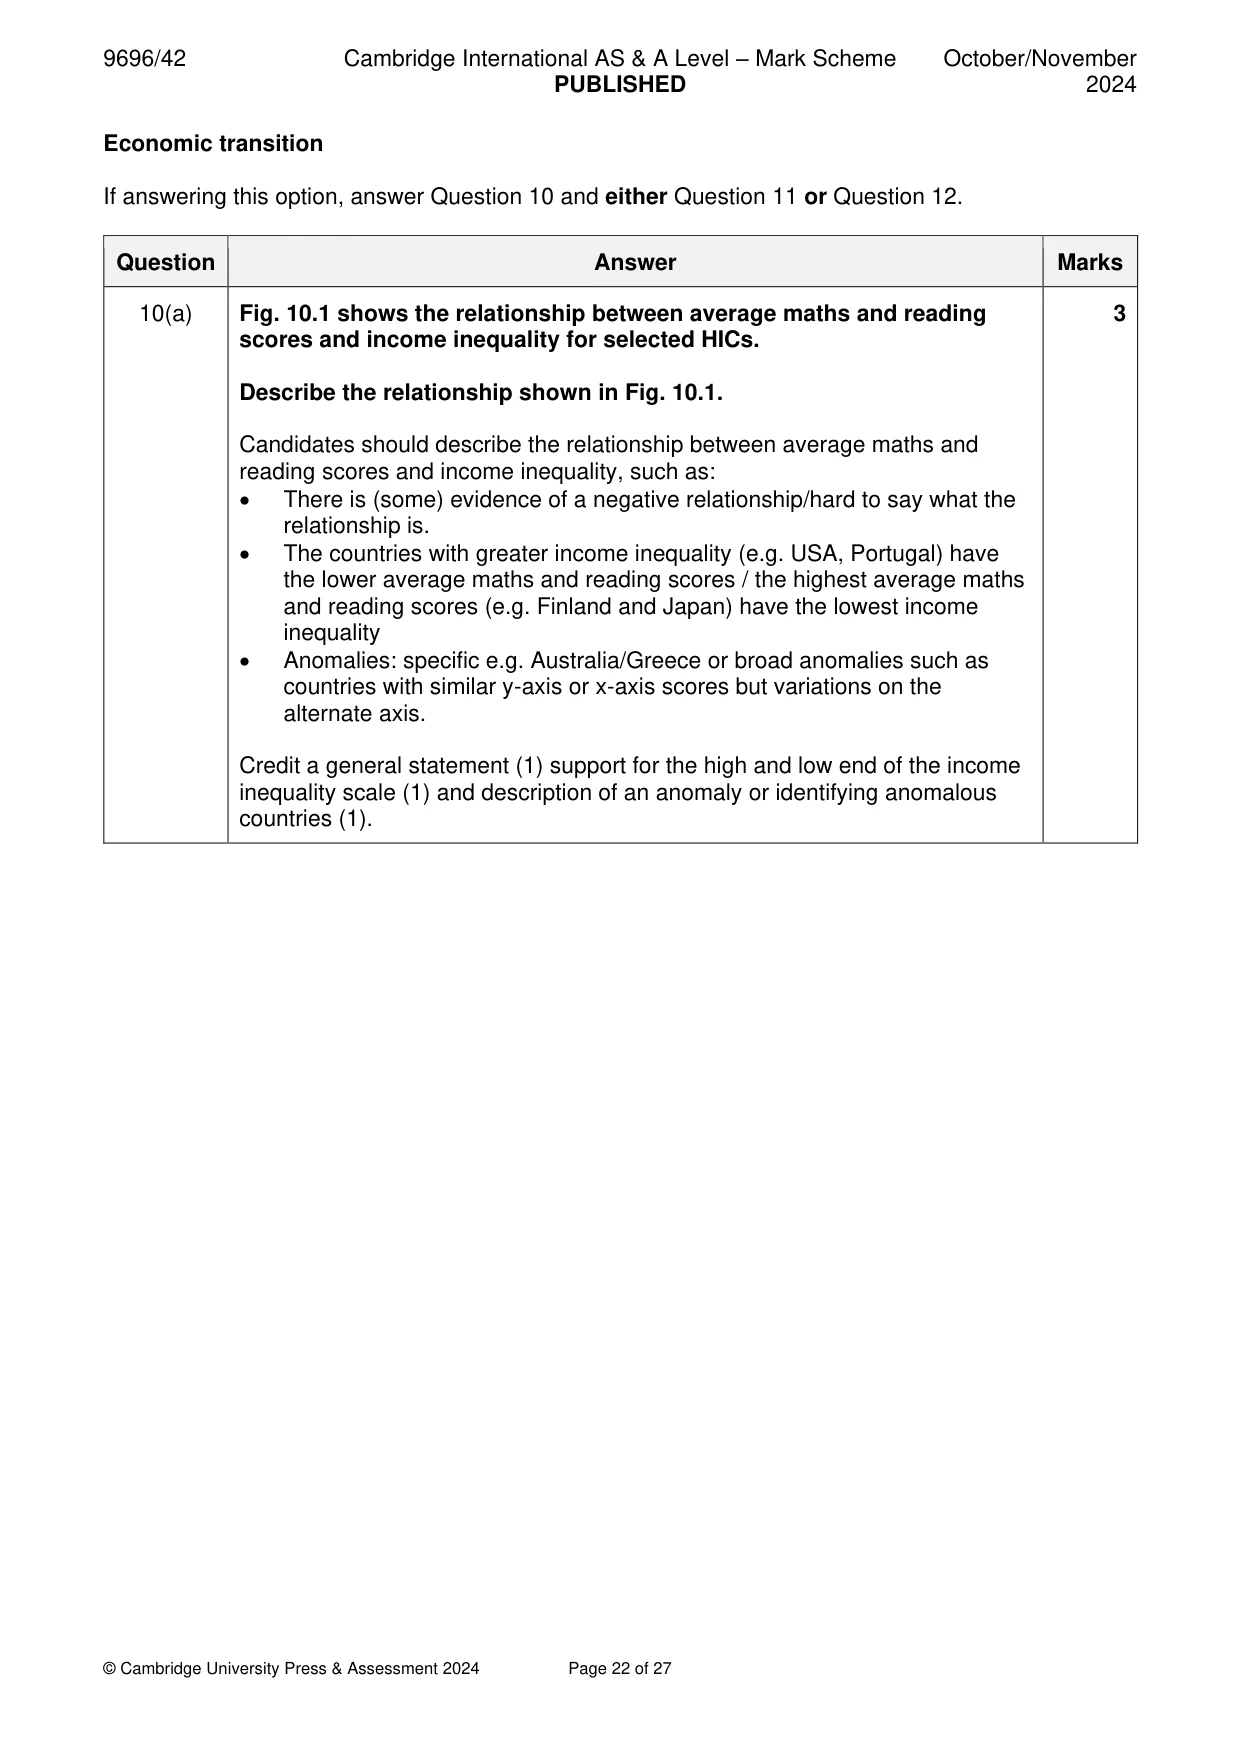
10 Fig. 10.1 shows the relationship between average maths and reading scores and income inequality for selected HICs. (a) Describe the relationship shown in Fig. 10.1. [3] (b) Explain why education is a useful measure of social and economic inequality. [7]
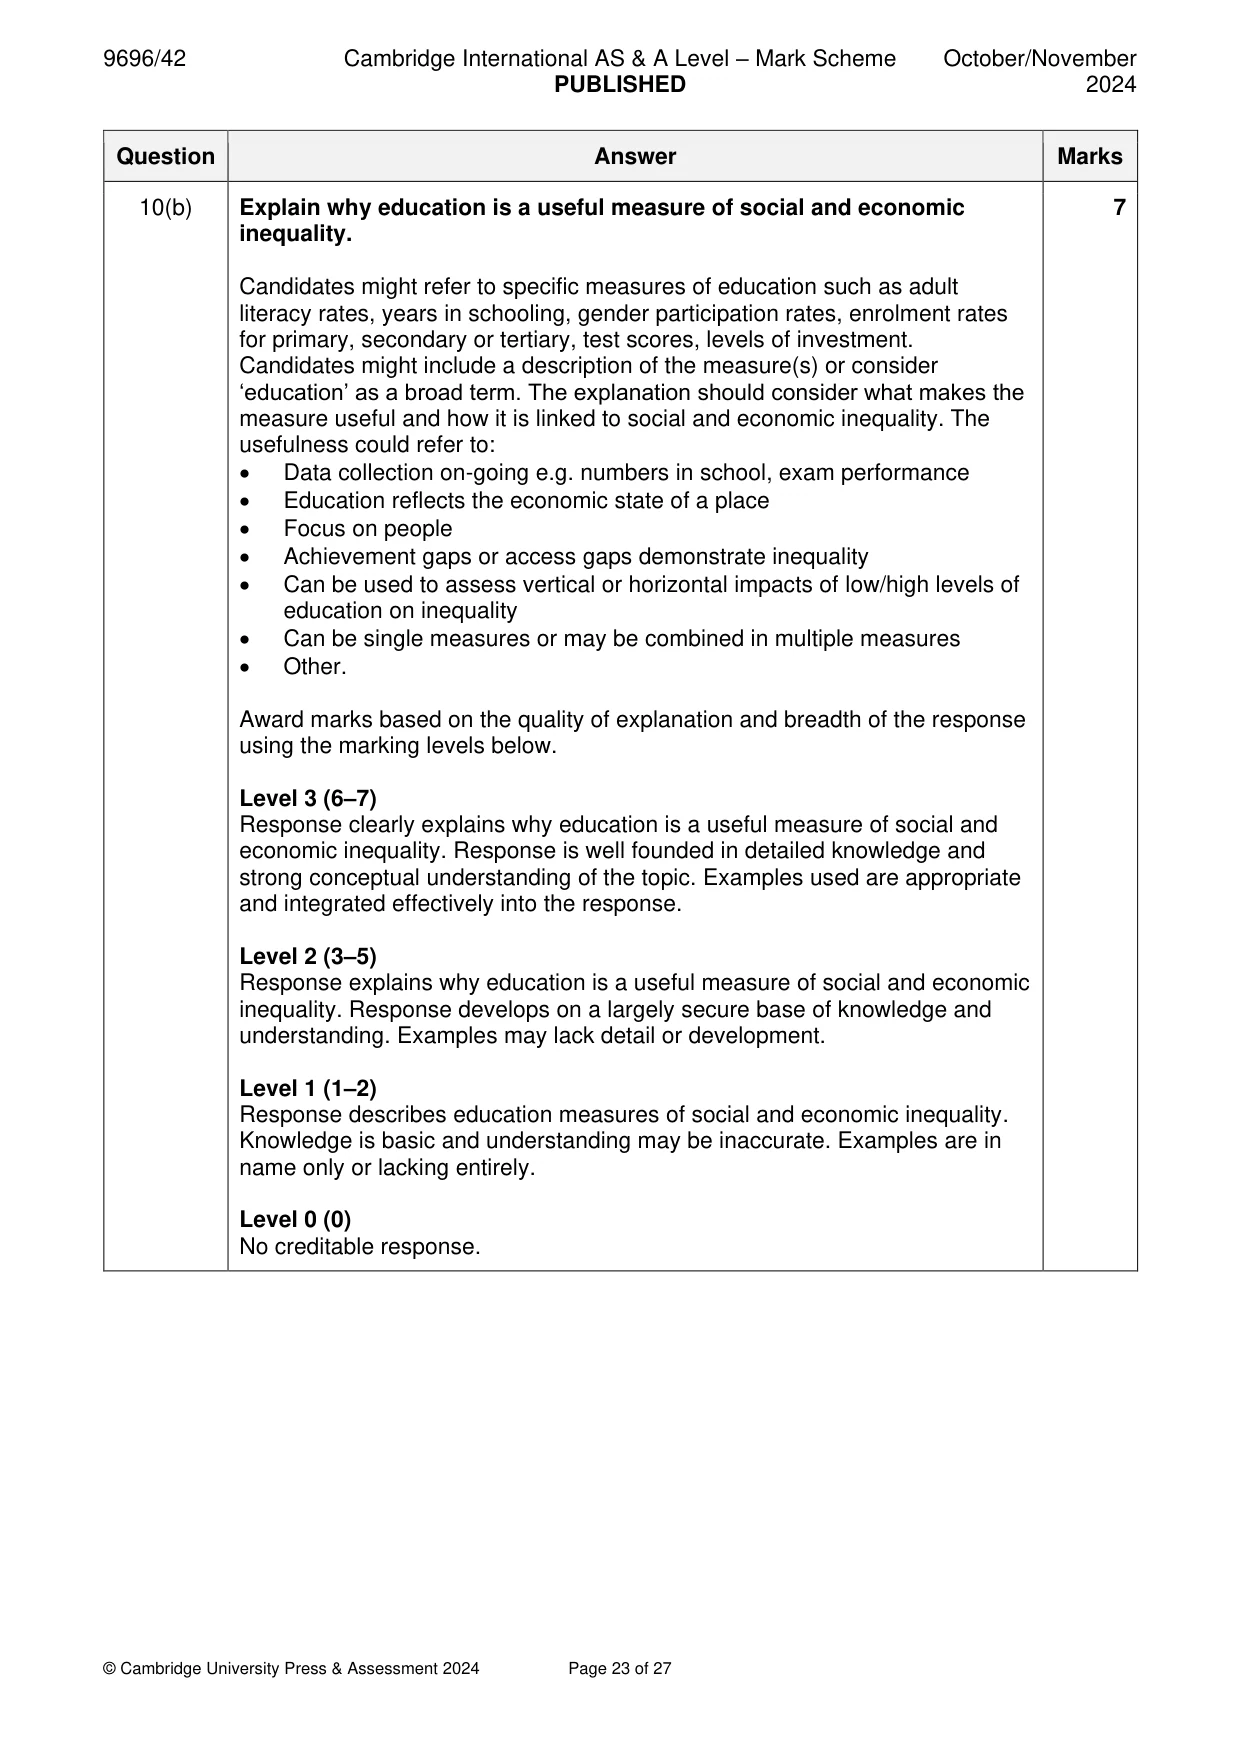
Mark scheme: 10(a) Fig. 10.1 shows the relationship between average maths and reading 3 scores and income inequality for selected HICs. Describe the relationship shown in Fig. 10.1. Candidates should describe the relationship between average maths and reading scores and income inequality, such as: • There is (some) evidence of a negative relationship/hard to say what the relationship is. • The countries with greater income inequality (e.g. USA, Portugal) have the lower average maths and reading scores / the highest average maths and reading scores (e.g. Finland and Japan) have the lowest income inequality • Anomalies: specific e.g. Australia/Greece or broad anomalies such as countries with similar y-axis or x-axis scores but variations on the alternate axis. Credit a general statement (1) support for the high and low end of the income inequality scale (1) and description of an anomaly or identifying anomalous countries (1). 10(b) Explain why education is a useful measure of social and economic 7 inequality. Candidates might refer to specific measures of education such as adult literacy rates, years in schooling, gender participation rates, enrolment rates for primary, secondary or tertiary, test scores, levels of investment. Candidates might include a description of the measure(s) or consider ‘education’ as a broad term. The explanation should consider what makes the measure useful and how it is linked to social and economic inequality. The usefulness could refer to: • Data collection on-going e.g. numbers in school, exam performance • Education reflects the economic state of a place • Focus on people • Achievement gaps or access gaps demonstrate inequality • Can be used to assess vertical or horizontal impacts of low/high levels of education on inequality • Can be single measures or may be combined in multiple measures • Other. Award marks based on the quality of explanation and breadth of the response using the marking levels below. Level 3 (6–7) Response clearly explains why education is a useful measure of social and economic inequality. Response is well founded in detailed knowledge and strong conceptual understanding of the topic. Examples used are appropriate and integrated effectively into the response. Level 2 (3–5) Response explains why education is a useful measure of social and economic inequality. Response develops on a largely secure base of knowledge and understanding. Examples may lack detail or development. Level 1 (1–2) Response describes education measures of social and economic inequality. Knowledge is basic and understanding may be inaccurate. Examples are in name only or lacking entirely. Level 0 (0) No creditable response.
Q11 · Evaluate the role of political factors in the emergence and growth of newly…
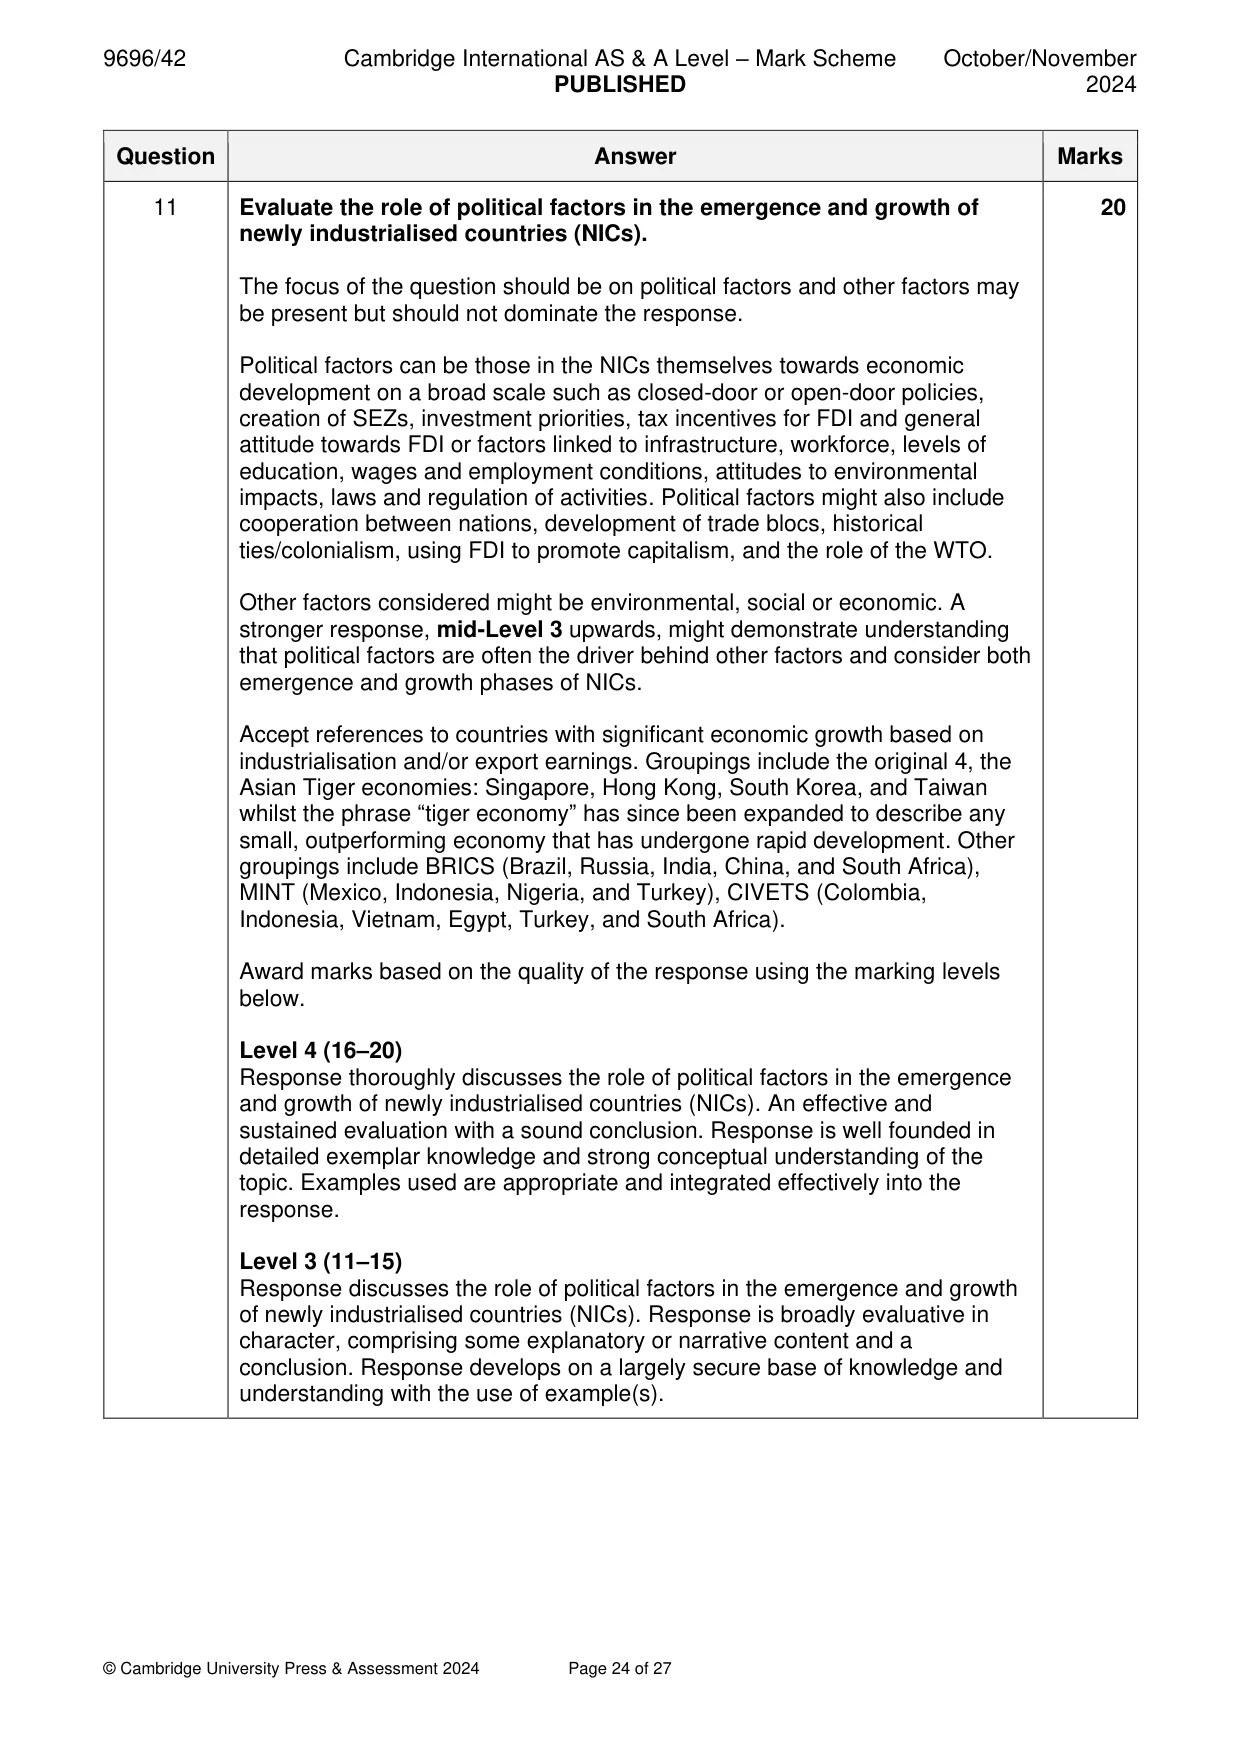
11 Evaluate the role of political factors in the emergence and growth of newly industrialised countries (NICs). [20]
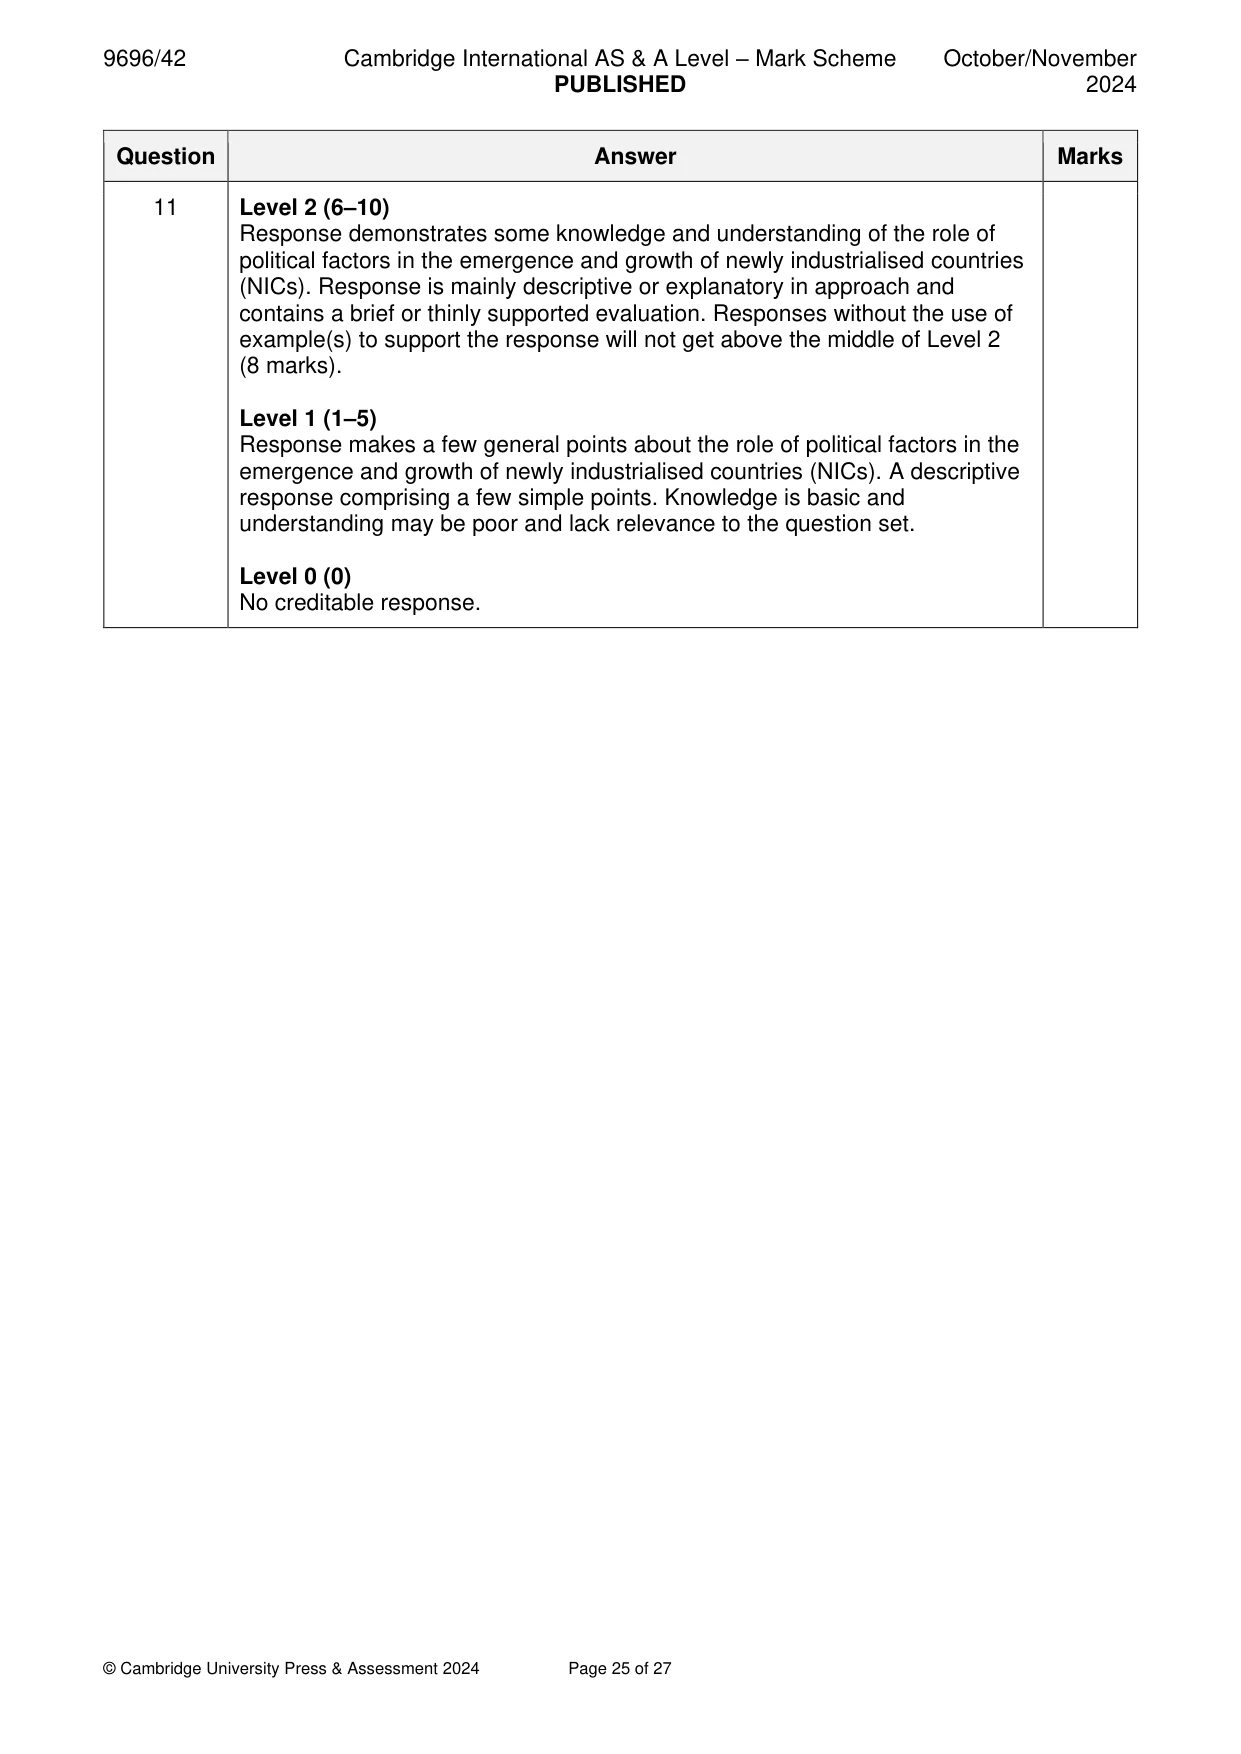
Mark scheme: 11 Evaluate the role of political factors in the emergence and growth of 20 newly industrialised countries (NICs). The focus of the question should be on political factors and other factors may be present but should not dominate the response. Political factors can be those in the NICs themselves towards economic development on a broad scale such as closed-door or open-door policies, creation of SEZs, investment priorities, tax incentives for FDI and general attitude towards FDI or factors linked to infrastructure, workforce, levels of education, wages and employment conditions, attitudes to environmental impacts, laws and regulation of activities. Political factors might also include cooperation between nations, development of trade blocs, historical ties/colonialism, using FDI to promote capitalism, and the role of the WTO. Other factors considered might be environmental, social or economic. A stronger response, mid-Level 3 upwards, might demonstrate understanding that political factors are often the driver behind other factors and consider both emergence and growth phases of NICs. Accept references to countries with significant economic growth based on industrialisation and/or export earnings. Groupings include the original 4, the Asian Tiger economies: Singapore, Hong Kong, South Korea, and Taiwan whilst the phrase “tiger economy” has since been expanded to describe any small, outperforming economy that has undergone rapid development. Other groupings include BRICS (Brazil, Russia, India, China, and South Africa), MINT (Mexico, Indonesia, Nigeria, and Turkey), CIVETS (Colombia, Indonesia, Vietnam, Egypt, Turkey, and South Africa). Award marks based on the quality of the response using the marking levels below. Level 4 (16–20) Response thoroughly discusses the role of political factors in the emergence and growth of newly industrialised countries (NICs). An effective and sustained evaluation with a sound conclusion. Response is well founded in detailed exemplar knowledge and strong conceptual understanding of the topic. Examples used are appropriate and integrated effectively into the response. Level 3 (11–15) Response discusses the role of political factors in the emergence and growth of newly industrialised countries (NICs). Response is broadly evaluative in character, comprising some explanatory or narrative content and a conclusion. Response develops on a largely secure base of knowledge and understanding with the use of example(s). 11 Level 2 (6–10) Response demonstrates some knowledge and understanding of the role of political factors in the emergence and growth of newly industrialised countries (NICs). Response is mainly descriptive or explanatory in approach and contains a brief or thinly supported evaluation. Responses without the use of example(s) to support the response will not get above the middle of Level 2 (8 marks). Level 1 (1–5) Response makes a few general points about the role of political factors in the emergence and growth of newly industrialised countries (NICs). A descriptive response comprising a few simple points. Knowledge is basic and understanding may be poor and lack relevance to the question set. Level 0 (0) No creditable response.
Q12 · ‘The concept of core–periphery can be used to explain regional disparity within all…
12 ‘The concept of core–periphery can be used to explain regional disparity within all countries.’ With reference to one or more examples, how far do you agree with this statement? [20]
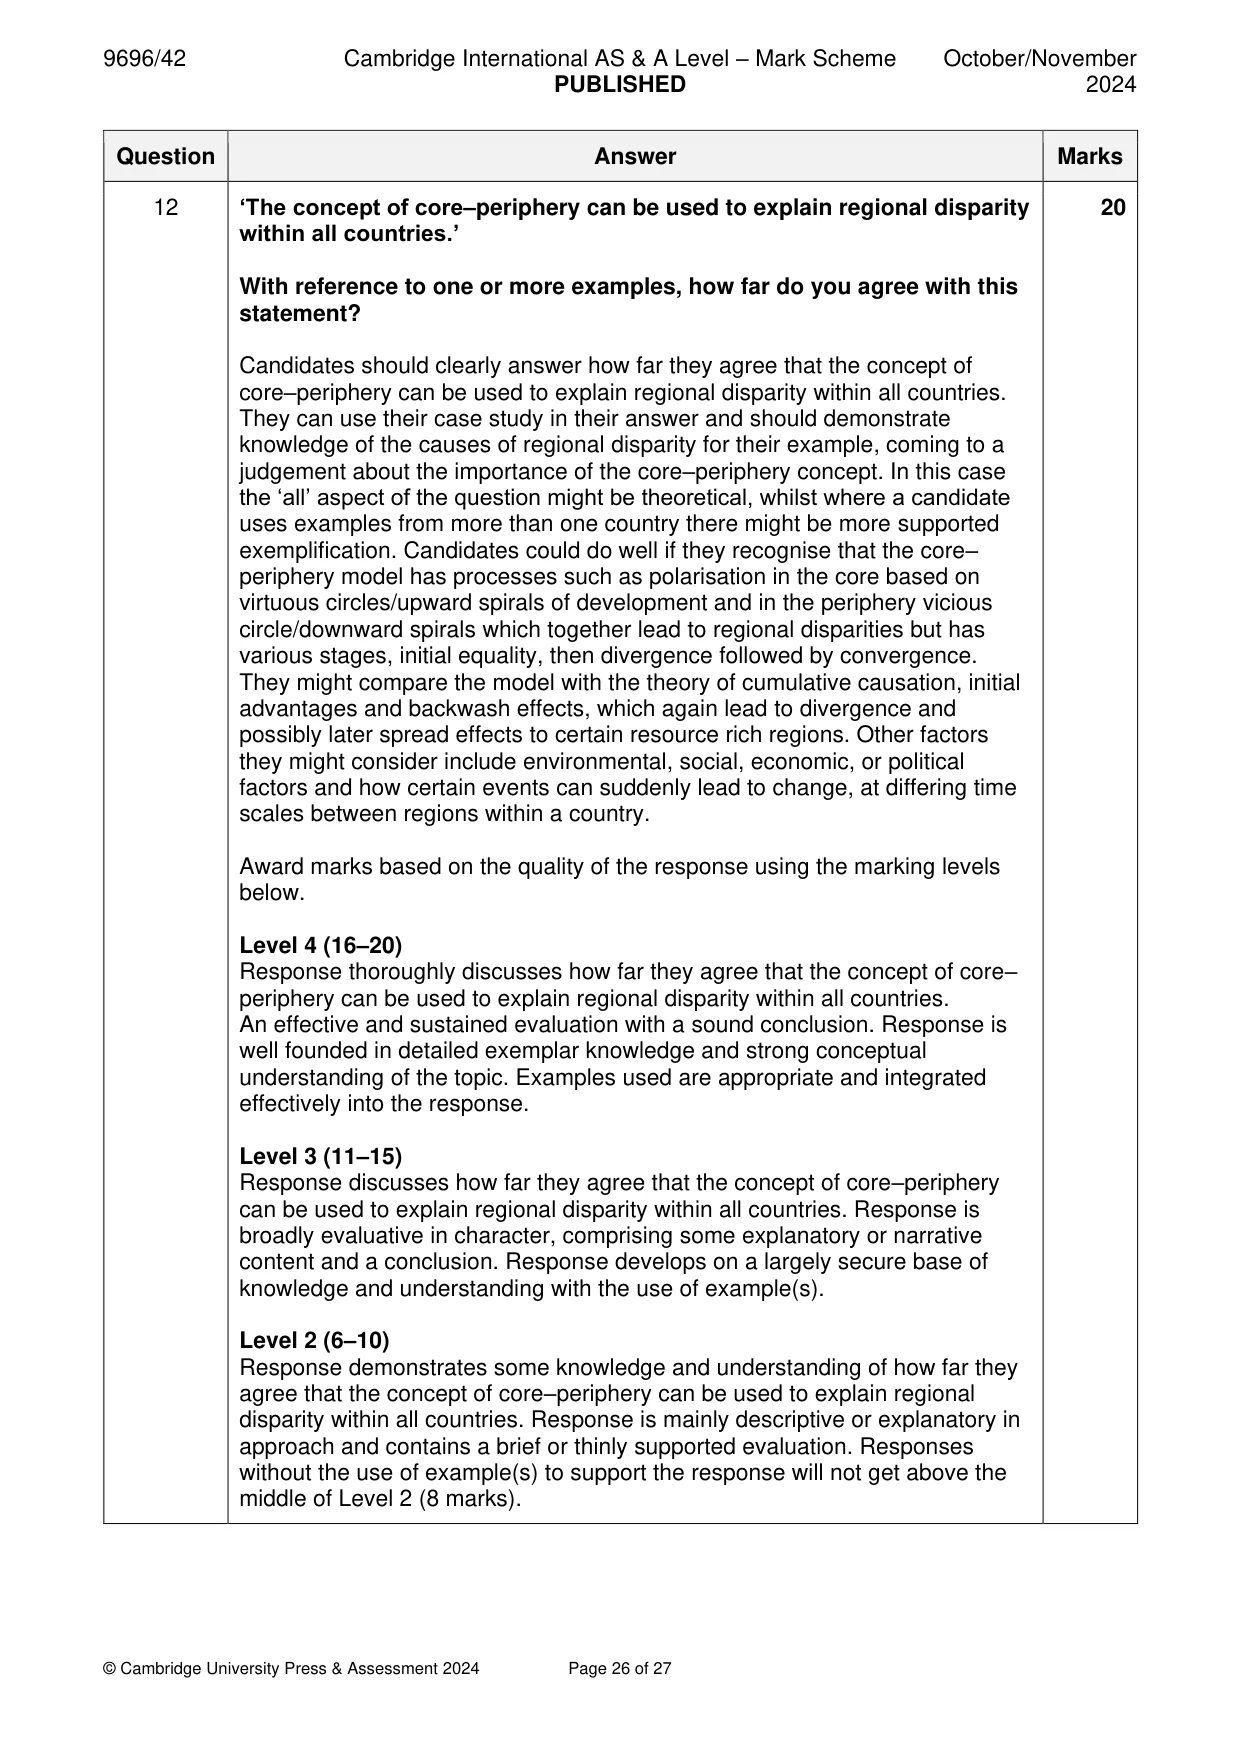
Mark scheme: 12 ‘The concept of core–periphery can be used to explain regional disparity 20 within all countries.’ With reference to one or more examples, how far do you agree with this statement? Candidates should clearly answer how far they agree that the concept of core–periphery can be used to explain regional disparity within all countries. They can use their case study in their answer and should demonstrate knowledge of the causes of regional disparity for their example, coming to a judgement about the importance of the core–periphery concept. In this case the ‘all’ aspect of the question might be theoretical, whilst where a candidate uses examples from more than one country there might be more supported exemplification. Candidates could do well if they recognise that the core– periphery model has processes such as polarisation in the core based on virtuous circles/upward spirals of development and in the periphery vicious circle/downward spirals which together lead to regional disparities but has various stages, initial equality, then divergence followed by convergence. They might compare the model with the theory of cumulative causation, initial advantages and backwash effects, which again lead to divergence and possibly later spread effects to certain resource rich regions. Other factors they might consider include environmental, social, economic, or political factors and how certain events can suddenly lead to change, at differing time scales between regions within a country. Award marks based on the quality of the response using the marking levels below. Level 4 (16–20) Response thoroughly discusses how far they agree that the concept of core– periphery can be used to explain regional disparity within all countries. An effective and sustained evaluation with a sound conclusion. Response is well founded in detailed exemplar knowledge and strong conceptual understanding of the topic. Examples used are appropriate and integrated effectively into the response. Level 3 (11–15) Response discusses how far they agree that the concept of core–periphery can be used to explain regional disparity within all countries. Response is broadly evaluative in character, comprising some explanatory or narrative content and a conclusion. Response develops on a largely secure base of knowledge and understanding with the use of example(s). Level 2 (6–10) Response demonstrates some knowledge and understanding of how far they agree that the concept of core–periphery can be used to explain regional disparity within all countries. Response is mainly descriptive or explanatory in approach and contains a brief or thinly supported evaluation. Responses without the use of example(s) to support the response will not get above the middle of Level 2 (8 marks). 12 Level 1 (1–5) Response makes a few general points about the concept of core–periphery and/or regional disparity within countries. A descriptive response comprising a few simple points. Knowledge is basic and understanding may be poor and lack relevance to the question set. Level 0 (0) No creditable response.
What was in this paper
The subtopics covered by these 12 questions, and how many questions each got. Open one in a new tab to see every Cambridge question on it.
3The management of agricultural change2Environmental degradation1Manufacturing and related service industry1National development1Regional development within countries1The management of a tourist destination1The management of change in manufacturing industry1The management of energy supply1What you needed in this session
Cambridge’s own grade thresholds for 2024 Oct/Nov, Paper 4 · Variant 2. A higher threshold means an easier paper — the bar moves with how the cohort did.