Cambridge A Level Geography 9696 — 2023 May/June Paper 4 · Variant 2
9696/42/M/J/23 · 12 questions · 60 marks · ≈68 min
The question paper and its mark scheme, free to read here and free to download. This is Cambridge’s own paper, exactly as it was sat.
Question paper4 pages

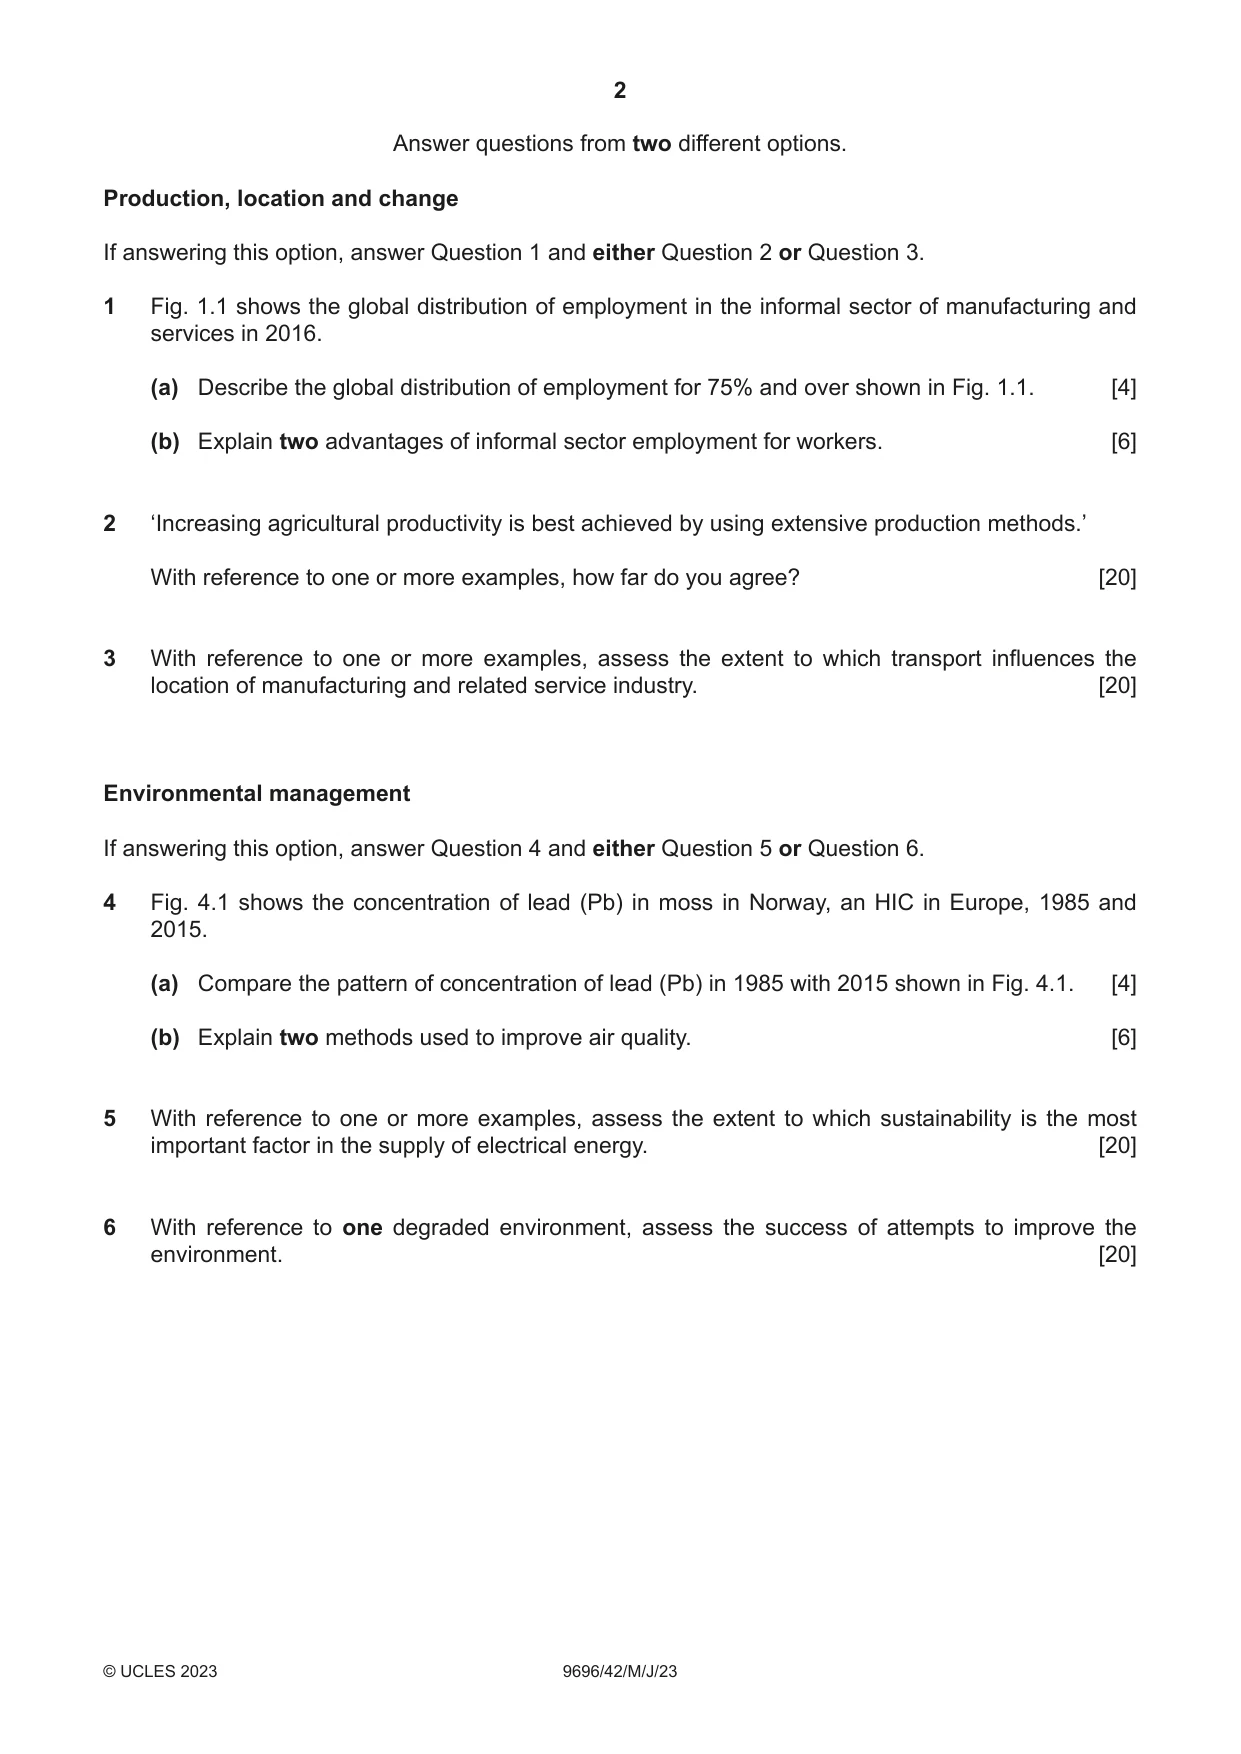
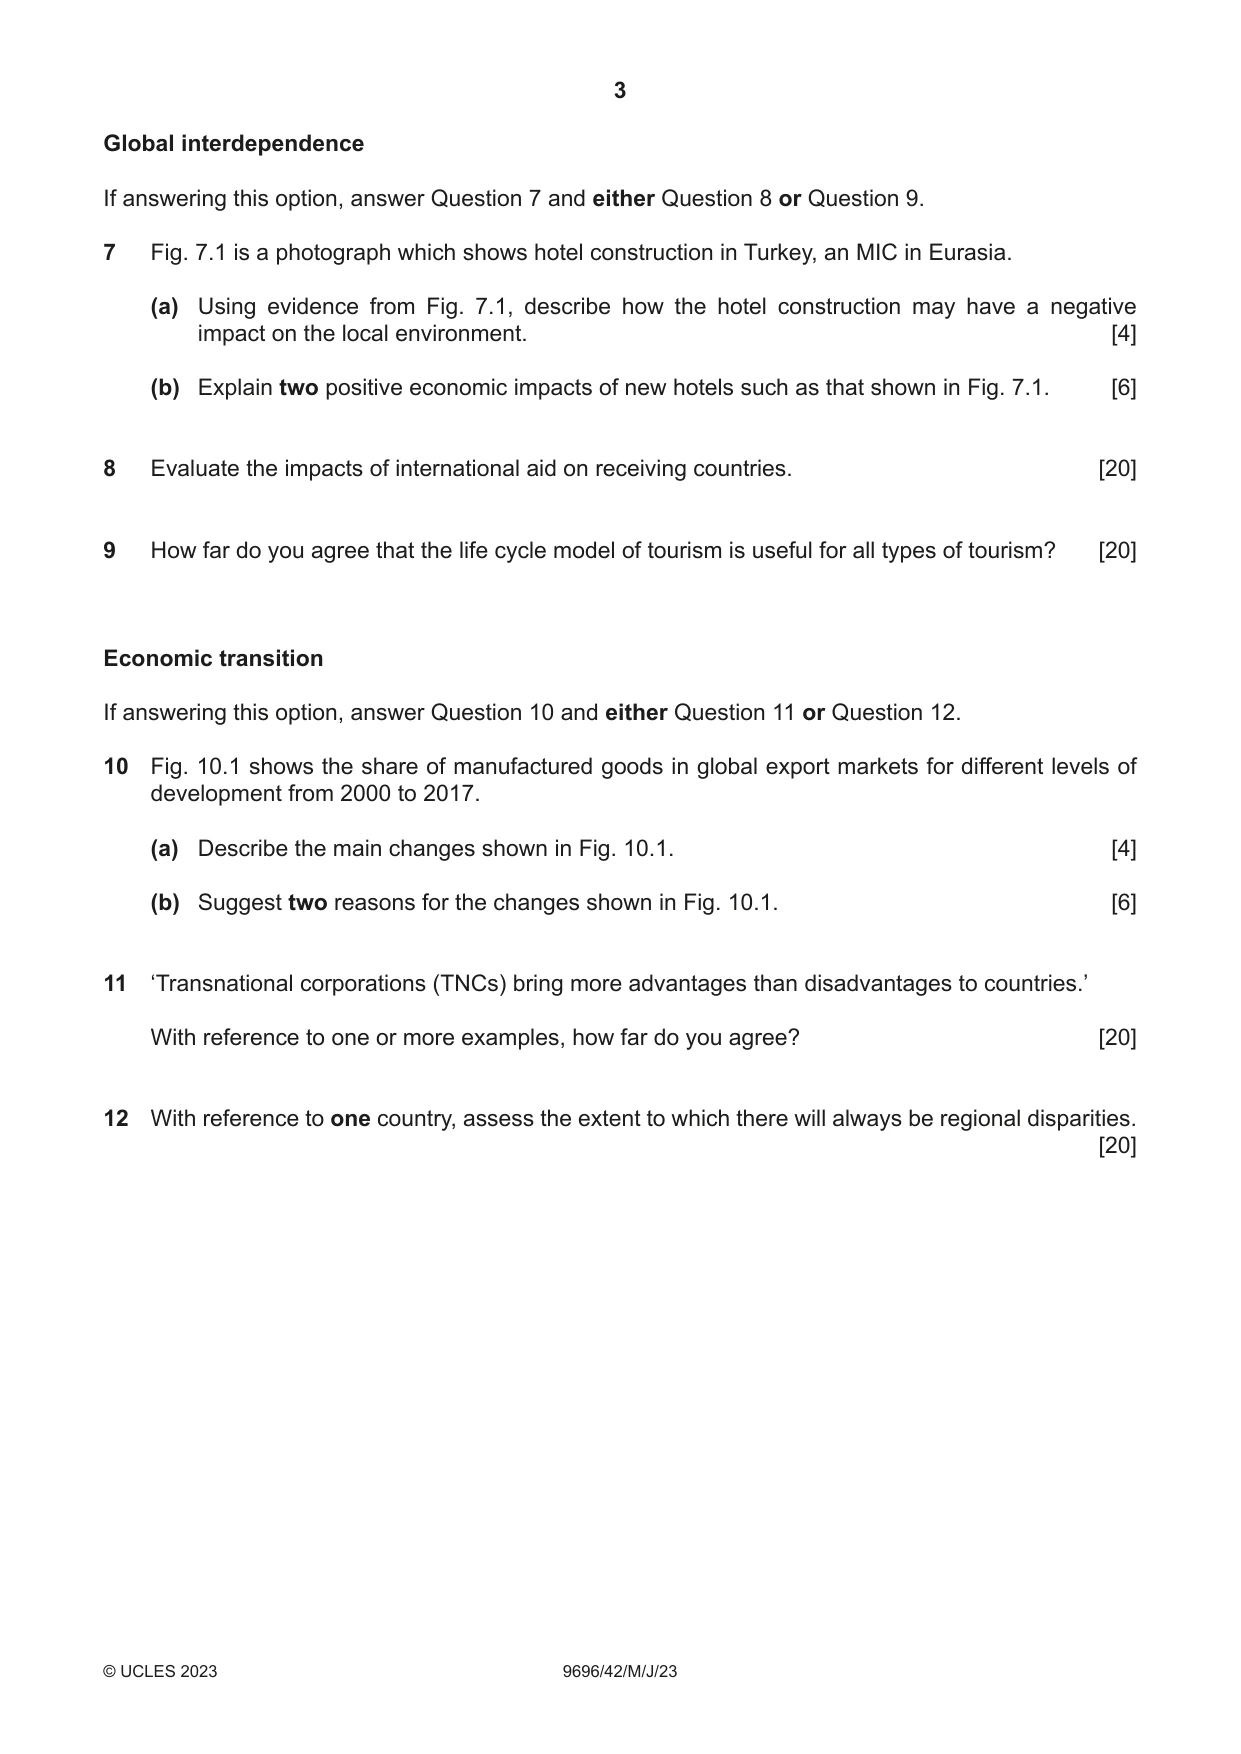

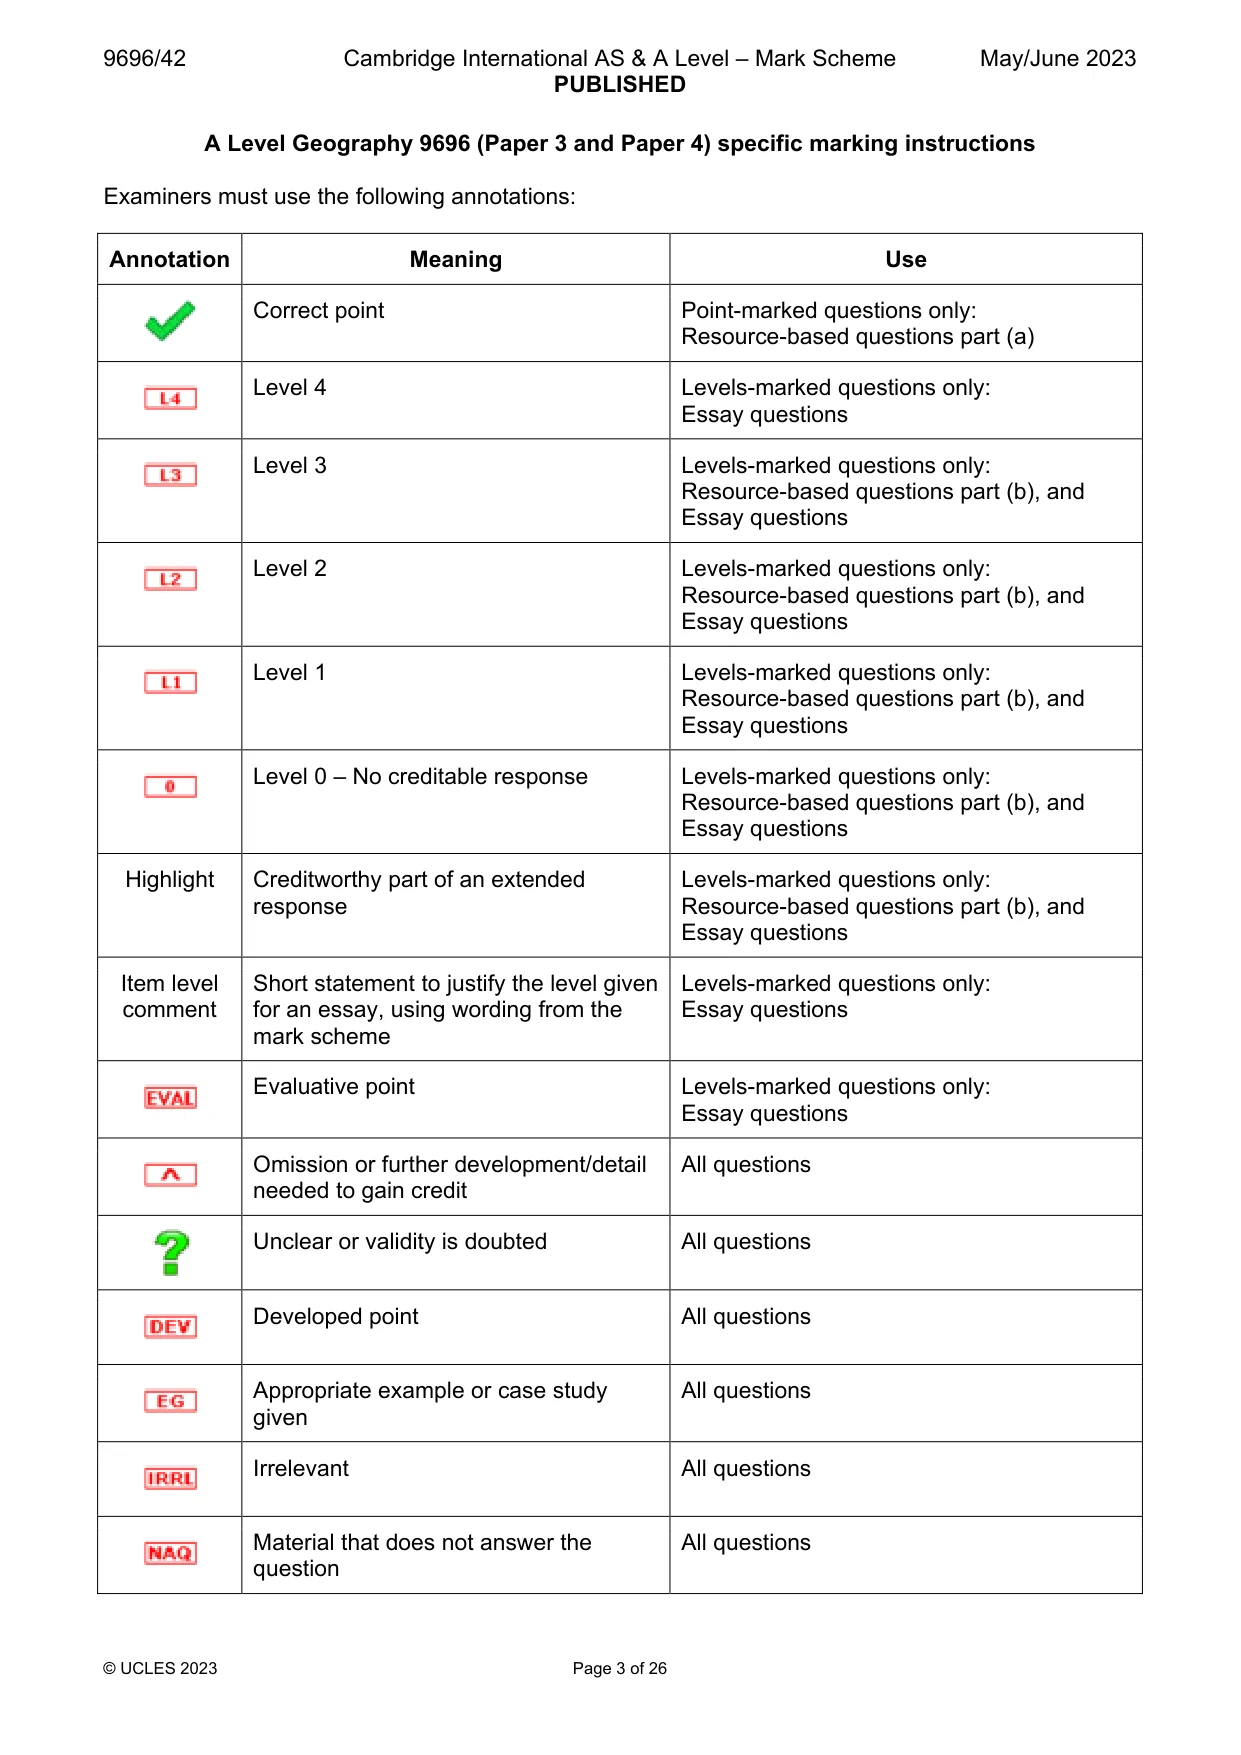
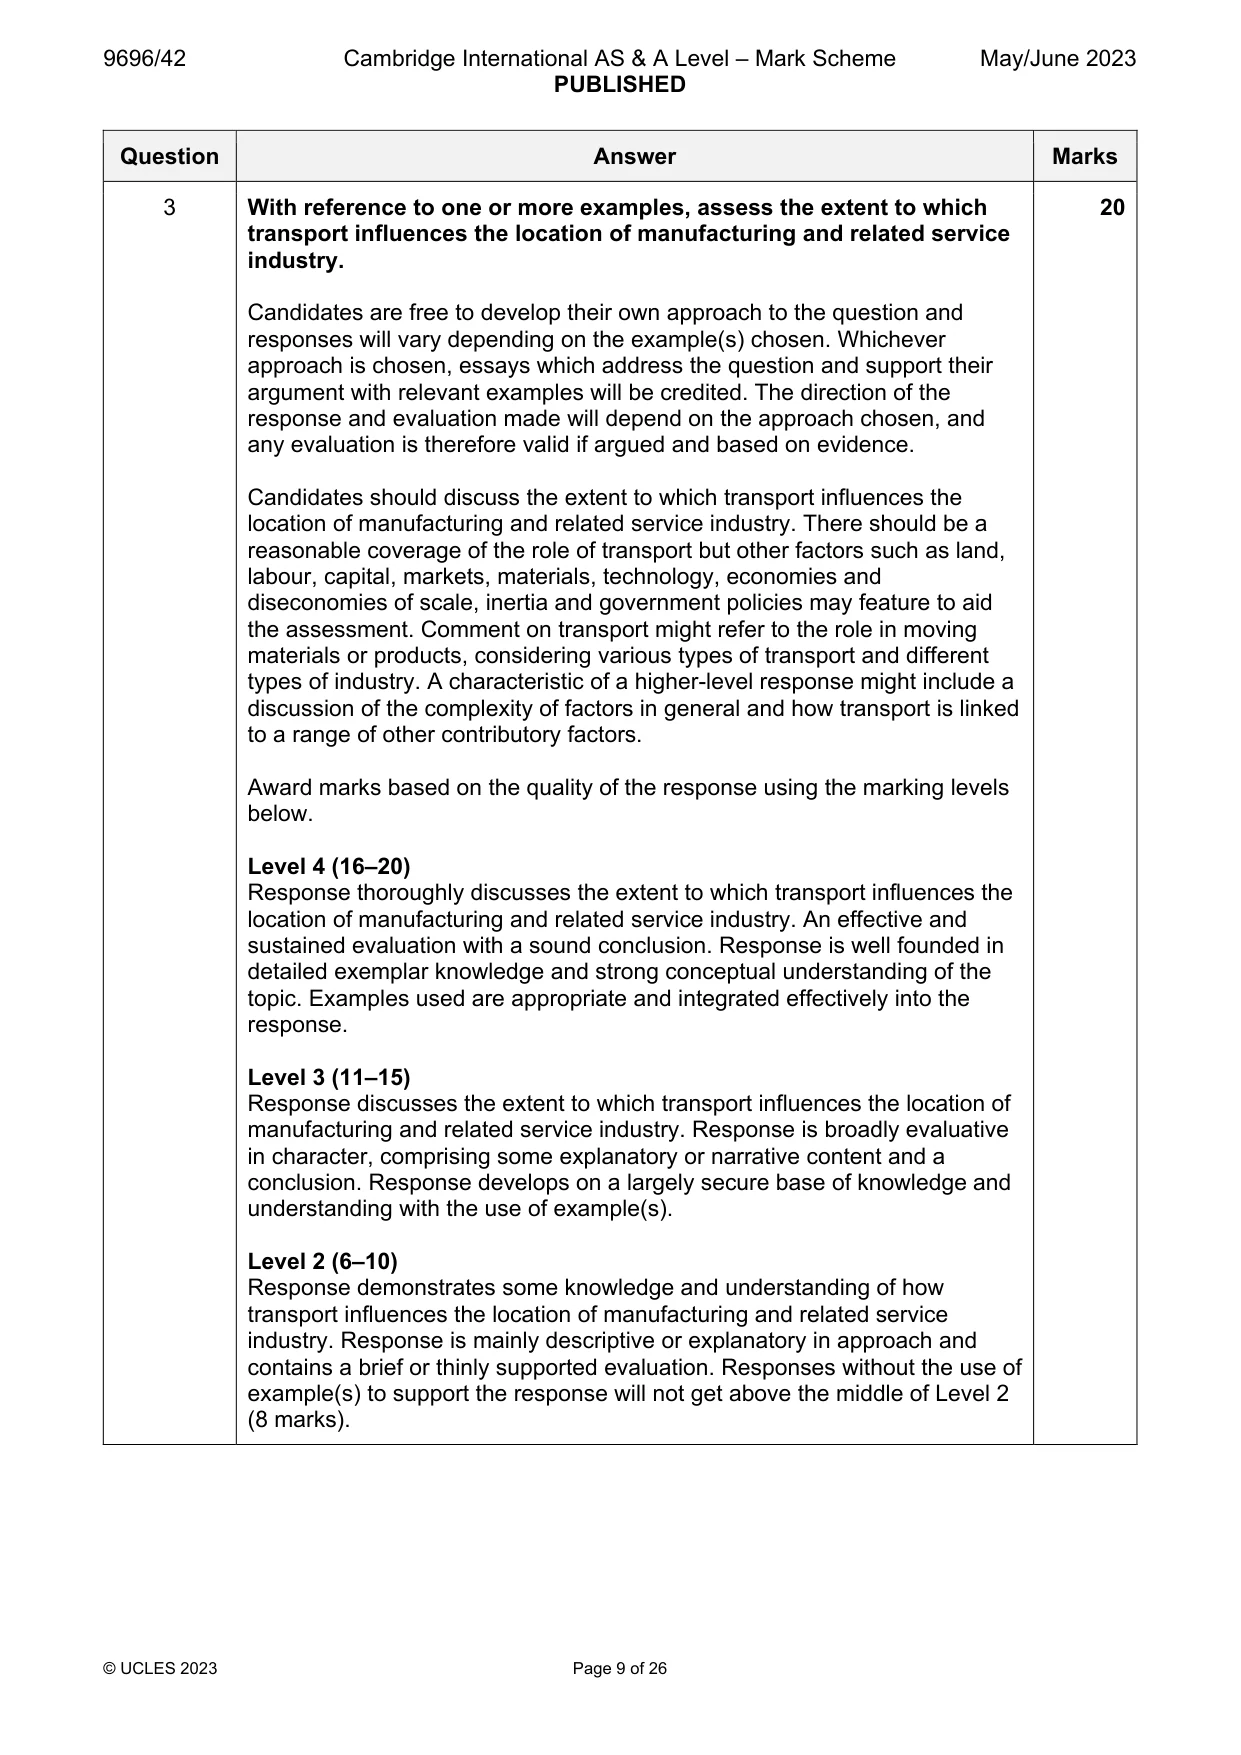
Mark scheme26 pages
Answers below. Sit the paper first if you are practising.













Questions as text
Q1 · The global distribution of employment in the informal sector of manufacturing and…
1 Fig. 1.1 shows the global distribution of employment in the informal sector of manufacturing and services in 2016. (a) Describe the global distribution of employment for 75% and over shown in Fig. 1.1. [4] (b) Explain two advantages of informal sector employment for workers. [6]
Mark scheme: Question Answer Marks 1(a) Fig. 1.1 shows the global distribution of employment in the informal 4 sector of manufacturing and services in 2016. Describe the global distribution of employment for 75% and over shown in Fig. 1.1. Candidates could describe the main distribution as: Only in 3 continents (1) Present in Africa, Asia and South America (1) Mostly within the tropics/close to the equator/mostly in northern hemisphere/between equator and tropic of cancer (1) Most/majority are found in Africa (1) Within Africa most is in western and central countries/closer to equator than N or S Africa/most African countries (1) Cover large number of countries of Southern Asia (and SE Asia) (1) Only 1 in South America (1) Other No credit for naming countries. 1(b) Explain two advantages of informal sector employment for workers. 6 Advantages might include: Open to people with or without qualifications Allows unskilled workers to learn skills Reduces poverty Close relationship with employer is possible Flexibility of hours/non-contractual/allows seasonal or multiple jobs/easy/quick employment Cash payments/not waiting for payments Avoidance of tax Free from government laws Other These advantages might be combined as a point is developed but there should be two distinct advantages. Award marks based on the quality of explanation and breadth of the response using the marking levels below. Level 3 (5–6) Response clearly explains two advantages of informal sector employment for workers. Response is well founded in detailed knowledge and strong conceptual understanding of the topic. Examples used are appropriate and integrated effectively into the response. Level 2 (3–4) Response explains two advantages of informal sector employment for workers. Response develops on a largely secure base of knowledge and understanding. Examples may lack detail or development. Level 1 (1–2) Response comprises one or two points about the informal sector. Knowledge is basic and understanding may be inaccurate. Examples are in name only or lacking entirely. Level 0 (0) No creditable response.
Q2 · ‘Increasing agricultural productivity is best achieved by using extensive production…
2 ‘Increasing agricultural productivity is best achieved by using extensive production methods.’ With reference to one or more examples, how far do you agree? [20]
Mark scheme: 2 ‘Increasing agricultural productivity is best achieved by using 20 extensive production methods.’ With reference to one or more examples, how far do you agree? Candidates are free to develop their own approach to the question and responses will vary depending on the example(s) chosen. Whichever approach is chosen, essays which address the question and support their argument with relevant examples will be credited. The direction of the response and evaluation made will depend on the approach chosen, and any evaluation is therefore valid if argued and based on evidence. Candidates should discuss how far they agree that increasing agricultural productivity is best achieved by using extensive production methods. They should display some knowledge and understanding of what agricultural productivity is and this understanding may underpin the quality of the response which follows. Agricultural productivity is more than ‘yield’. It is measured by comparing the ratio of outputs to a given quantity of inputs. Outputs may include crops, livestock and other products or ways of increasing farm income, whilst inputs include labour, land, capital and service costs. A reasonable approach might consider individual aspects of input e.g. extensive production methods are likely to have high productivity in terms of unit labour but lower for capital inputs. Candidates may describe the advantages of extensive production methods such as: economies of scale, increased production and/or yield, specialisation, employment creation, encourages technological innovation, lowers cost of production/cheaper food and other advantages. To develop the response, they may consider the disadvantages of extensive production methods and/or the advantages of intensive production methods, though the latter should not dominate a response. Award marks based on the quality of the response using the marking levels below. Level 4 (16–20) Response thoroughly discusses the extent to which increasing agricultural productivity is best achieved by using extensive production methods. An effective and sustained evaluation with a sound conclusion. Response is well founded in detailed exemplar knowledge and strong conceptual understanding of the topic. Examples used are appropriate and integrated effectively into the response. Level 3 (11–15) Response discusses the extent to which increasing agricultural productivity is best achieved by using extensive production methods. Response is broadly evaluative in character, comprising some explanatory or narrative content and a conclusion. Response develops on a largely secure base of knowledge and understanding with the use of example(s). 2 Level 2 (6–10) Response demonstrates some knowledge and understanding of increasing agricultural productivity and extensive production methods but is unbalanced in approach. Response is mainly descriptive or explanatory in approach and contains a brief or thinly supported evaluation. Responses without the use of example(s) to support the response will not get above the middle of Level 2 (8 marks). Level 1 (1–5) Response makes a few general points about either agricultural productivity or extensive production methods. A descriptive response comprising a few simple points. Knowledge is basic and understanding may be poor and lack relevance to the question set. Level 0 (0) No creditable response.
Q3 · With reference to one or more examples, assess the extent to which transport influences…
3 With reference to one or more examples, assess the extent to which transport influences the location of manufacturing and related service industry. [20] Environmental management If answering this option, answer Question 4 and either Question 5 or Question 6.
Mark scheme: 3 With reference to one or more examples, assess the extent to which 20 transport influences the location of manufacturing and related service industry. Candidates are free to develop their own approach to the question and responses will vary depending on the example(s) chosen. Whichever approach is chosen, essays which address the question and support their argument with relevant examples will be credited. The direction of the response and evaluation made will depend on the approach chosen, and any evaluation is therefore valid if argued and based on evidence. Candidates should discuss the extent to which transport influences the location of manufacturing and related service industry. There should be a reasonable coverage of the role of transport but other factors such as land, labour, capital, markets, materials, technology, economies and diseconomies of scale, inertia and government policies may feature to aid the assessment. Comment on transport might refer to the role in moving materials or products, considering various types of transport and different types of industry. A characteristic of a higher-level response might include a discussion of the complexity of factors in general and how transport is linked to a range of other contributory factors. Award marks based on the quality of the response using the marking levels below. Level 4 (16–20) Response thoroughly discusses the extent to which transport influences the location of manufacturing and related service industry. An effective and sustained evaluation with a sound conclusion. Response is well founded in detailed exemplar knowledge and strong conceptual understanding of the topic. Examples used are appropriate and integrated effectively into the response. Level 3 (11–15) Response discusses the extent to which transport influences the location of manufacturing and related service industry. Response is broadly evaluative in character, comprising some explanatory or narrative content and a conclusion. Response develops on a largely secure base of knowledge and understanding with the use of example(s). Level 2 (6–10) Response demonstrates some knowledge and understanding of how transport influences the location of manufacturing and related service industry. Response is mainly descriptive or explanatory in approach and contains a brief or thinly supported evaluation. Responses without the use of example(s) to support the response will not get above the middle of Level 2 (8 marks). 3 Level 1 (1–5) Response makes a few general points about the location of manufacturing and related service industry with little reference to transport as a factor. A descriptive response comprising a few simple points. Knowledge is basic and understanding may be poor and lack relevance to the question set. Level 0 (0) No creditable response Environmental management If answering this option, answer Question 4 and either Question 5 or Question 6.
Q4 · The concentration of lead (Pb) in moss in Norway, an HIC in Europe, 1985 and 2015
4 Fig. 4.1 shows the concentration of lead (Pb) in moss in Norway, an HIC in Europe, 1985 and 2015. (a) Compare the pattern of concentration of lead (Pb) in 1985 with 2015 shown in Fig. 4.1. [4] (b) Explain two methods used to improve air quality. [6]
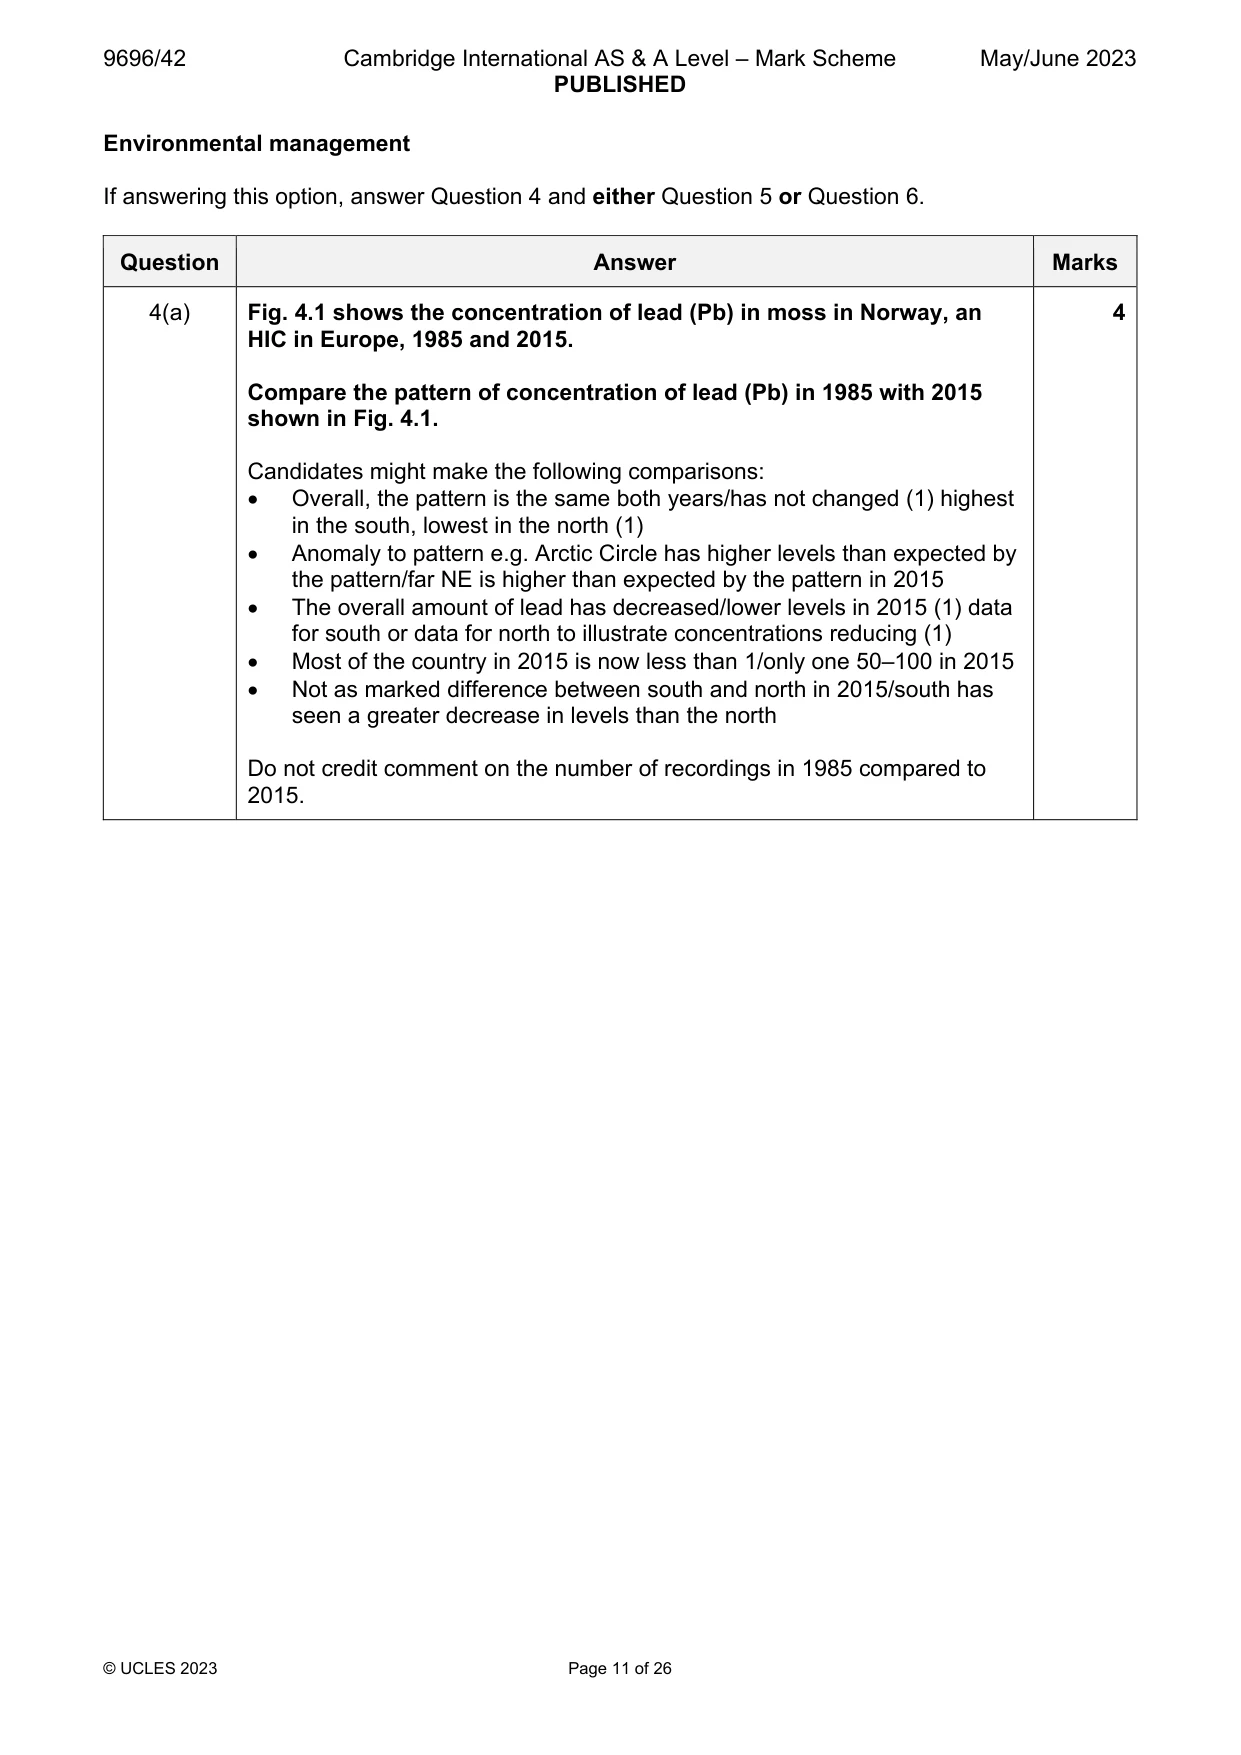
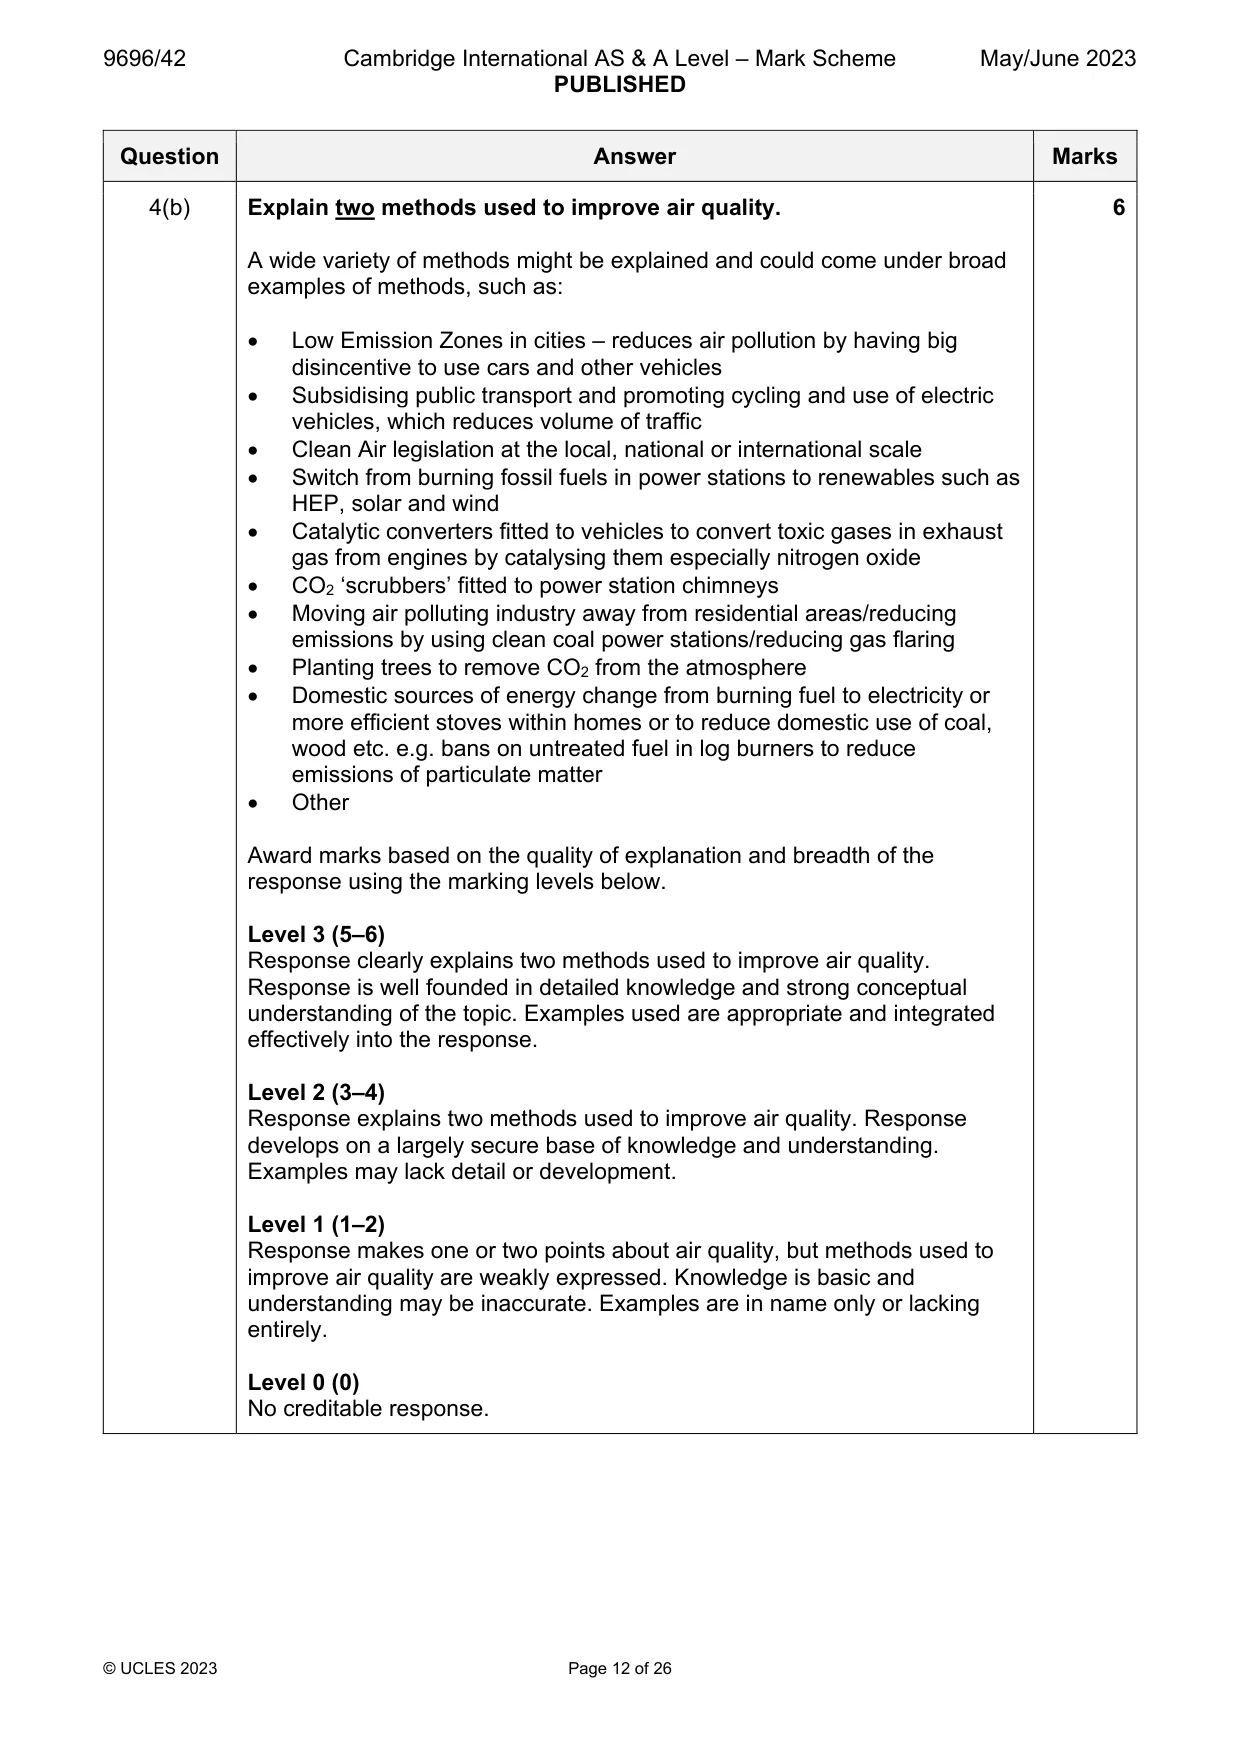
Mark scheme: 4(a) Fig. 4.1 shows the concentration of lead (Pb) in moss in Norway, an 4 HIC in Europe, 1985 and 2015. Compare the pattern of concentration of lead (Pb) in 1985 with 2015 shown in Fig. 4.1. Candidates might make the following comparisons: Overall, the pattern is the same both years/has not changed (1) highest in the south, lowest in the north (1) Anomaly to pattern e.g. Arctic Circle has higher levels than expected by the pattern/far NE is higher than expected by the pattern in 2015 The overall amount of lead has decreased/lower levels in 2015 (1) data for south or data for north to illustrate concentrations reducing (1) Most of the country in 2015 is now less than 1/only one 50–100 in 2015 Not as marked difference between south and north in 2015/south has seen a greater decrease in levels than the north Do not credit comment on the number of recordings in 1985 compared to 2015. 4(b) Explain two methods used to improve air quality. 6 A wide variety of methods might be explained and could come under broad examples of methods, such as: Low Emission Zones in cities – reduces air pollution by having big disincentive to use cars and other vehicles Subsidising public transport and promoting cycling and use of electric vehicles, which reduces volume of traffic Clean Air legislation at the local, national or international scale Switch from burning fossil fuels in power stations to renewables such as HEP, solar and wind Catalytic converters fitted to vehicles to convert toxic gases in exhaust gas from engines by catalysing them especially nitrogen oxide CO2 ‘scrubbers’ fitted to power station chimneys Moving air polluting industry away from residential areas/reducing emissions by using clean coal power stations/reducing gas flaring Planting trees to remove CO2 from the atmosphere Domestic sources of energy change from burning fuel to electricity or more efficient stoves within homes or to reduce domestic use of coal, wood etc. e.g. bans on untreated fuel in log burners to reduce emissions of particulate matter Other Award marks based on the quality of explanation and breadth of the response using the marking levels below. Level 3 (5–6) Response clearly explains two methods used to improve air quality. Response is well founded in detailed knowledge and strong conceptual understanding of the topic. Examples used are appropriate and integrated effectively into the response. Level 2 (3–4) Response explains two methods used to improve air quality. Response develops on a largely secure base of knowledge and understanding. Examples may lack detail or development. Level 1 (1–2) Response makes one or two points about air quality, but methods used to improve air quality are weakly expressed. Knowledge is basic and understanding may be inaccurate. Examples are in name only or lacking entirely. Level 0 (0) No creditable response.
Q5 · With reference to one or more examples, assess the extent to which sustainability is the…
5 With reference to one or more examples, assess the extent to which sustainability is the most important factor in the supply of electrical energy. [20]
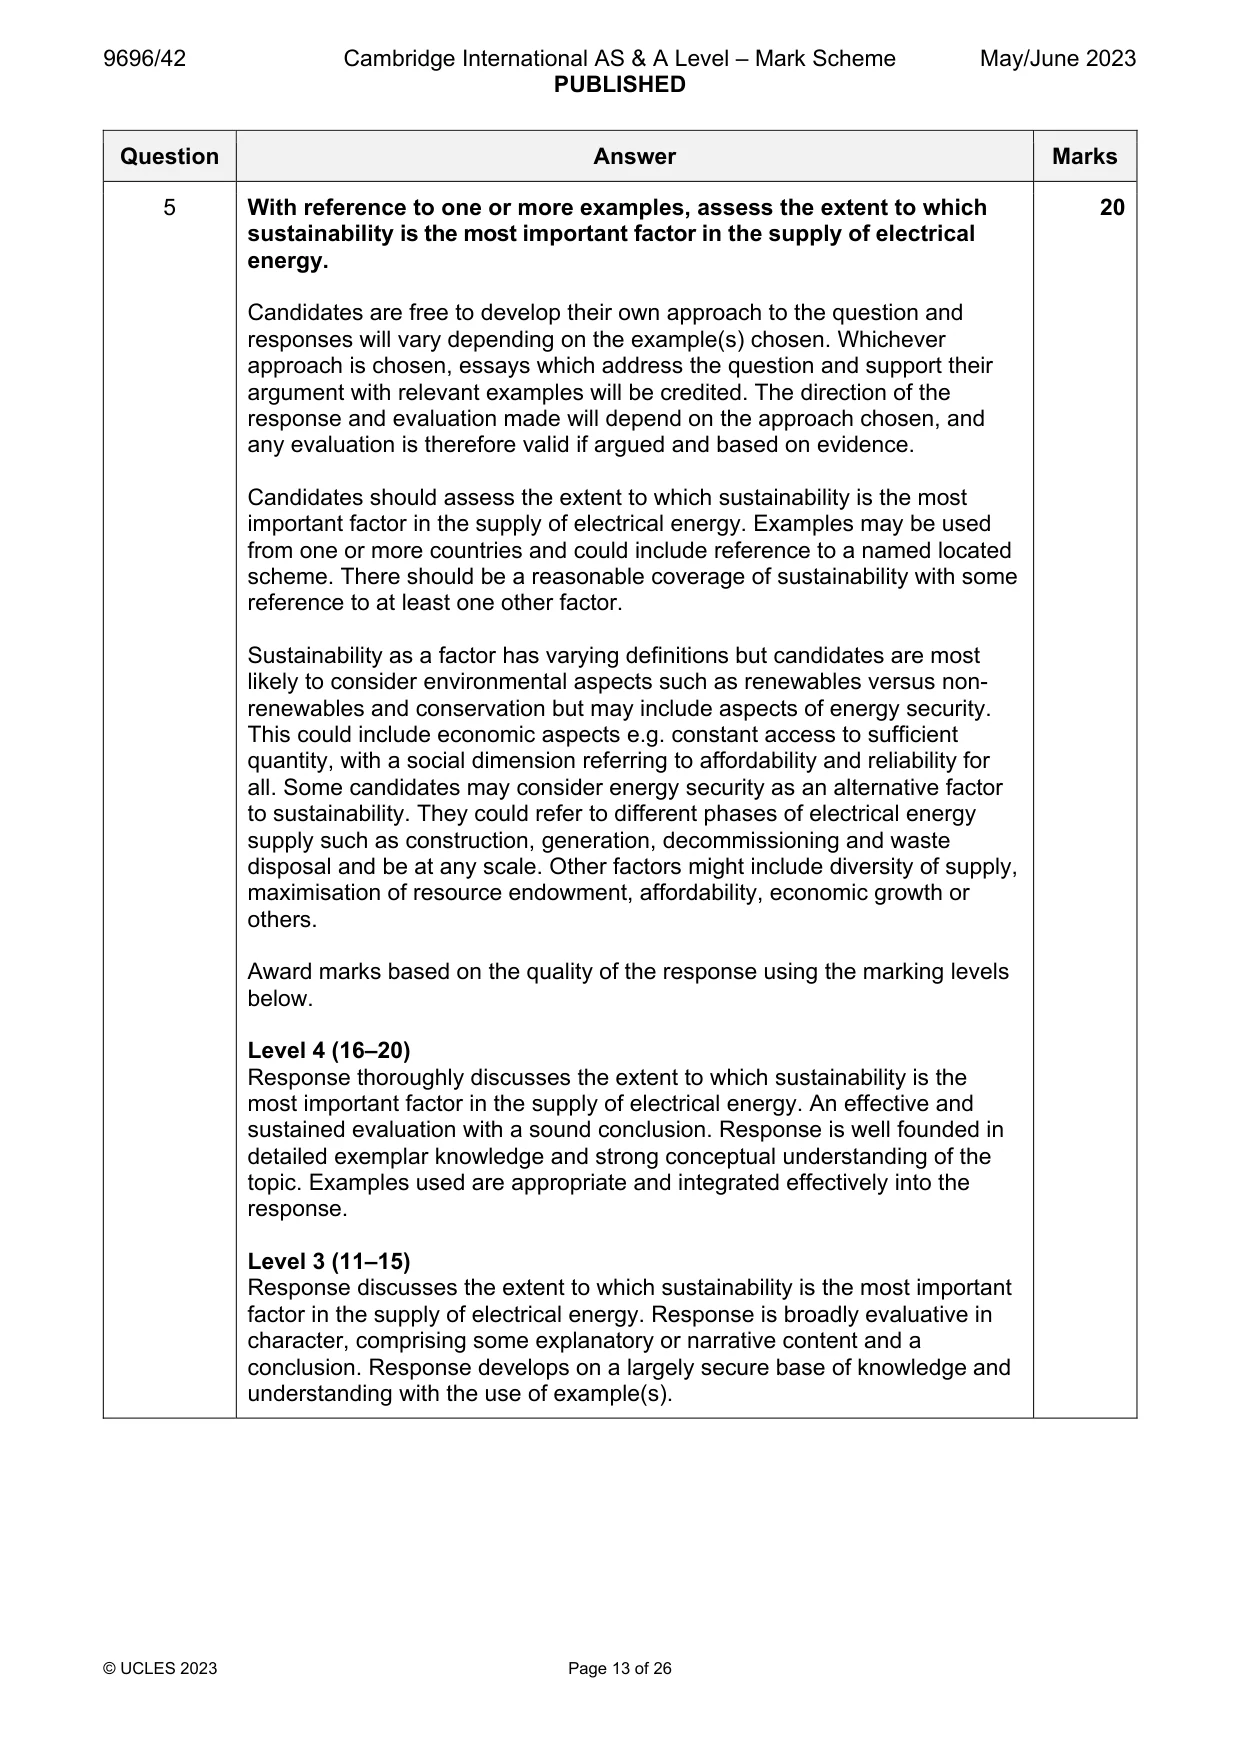
Mark scheme: 5 With reference to one or more examples, assess the extent to which 20 sustainability is the most important factor in the supply of electrical energy. Candidates are free to develop their own approach to the question and responses will vary depending on the example(s) chosen. Whichever approach is chosen, essays which address the question and support their argument with relevant examples will be credited. The direction of the response and evaluation made will depend on the approach chosen, and any evaluation is therefore valid if argued and based on evidence. Candidates should assess the extent to which sustainability is the most important factor in the supply of electrical energy. Examples may be used from one or more countries and could include reference to a named located scheme. There should be a reasonable coverage of sustainability with some reference to at least one other factor. Sustainability as a factor has varying definitions but candidates are most likely to consider environmental aspects such as renewables versus non- renewables and conservation but may include aspects of energy security. This could include economic aspects e.g. constant access to sufficient quantity, with a social dimension referring to affordability and reliability for all. Some candidates may consider energy security as an alternative factor to sustainability. They could refer to different phases of electrical energy supply such as construction, generation, decommissioning and waste disposal and be at any scale. Other factors might include diversity of supply, maximisation of resource endowment, affordability, economic growth or others. Award marks based on the quality of the response using the marking levels below. Level 4 (16–20) Response thoroughly discusses the extent to which sustainability is the most important factor in the supply of electrical energy. An effective and sustained evaluation with a sound conclusion. Response is well founded in detailed exemplar knowledge and strong conceptual understanding of the topic. Examples used are appropriate and integrated effectively into the response. Level 3 (11–15) Response discusses the extent to which sustainability is the most important factor in the supply of electrical energy. Response is broadly evaluative in character, comprising some explanatory or narrative content and a conclusion. Response develops on a largely secure base of knowledge and understanding with the use of example(s). 5 Level 2 (6–10) Response demonstrates some knowledge and understanding of sustainability as a factor in the supply of electrical energy. Response is mainly descriptive or explanatory in approach and contains a brief or thinly supported evaluation. Responses without the use of example(s) to support the response will not get above the middle of Level 2 (8 marks). Level 1 (1–5) Response makes a few general points about the supply of electricity with little reference to sustainability. A descriptive response comprising a few simple points. Knowledge is basic and understanding may be poor and lack relevance to the question set. Level 0 (0) No creditable response.
Q6 · With reference to one degraded environment, assess the success of attempts to improve the…
6 With reference to one degraded environment, assess the success of attempts to improve the environment. [20] Global interdependence If answering this option, answer Question 7 and either Question 8 or Question 9.
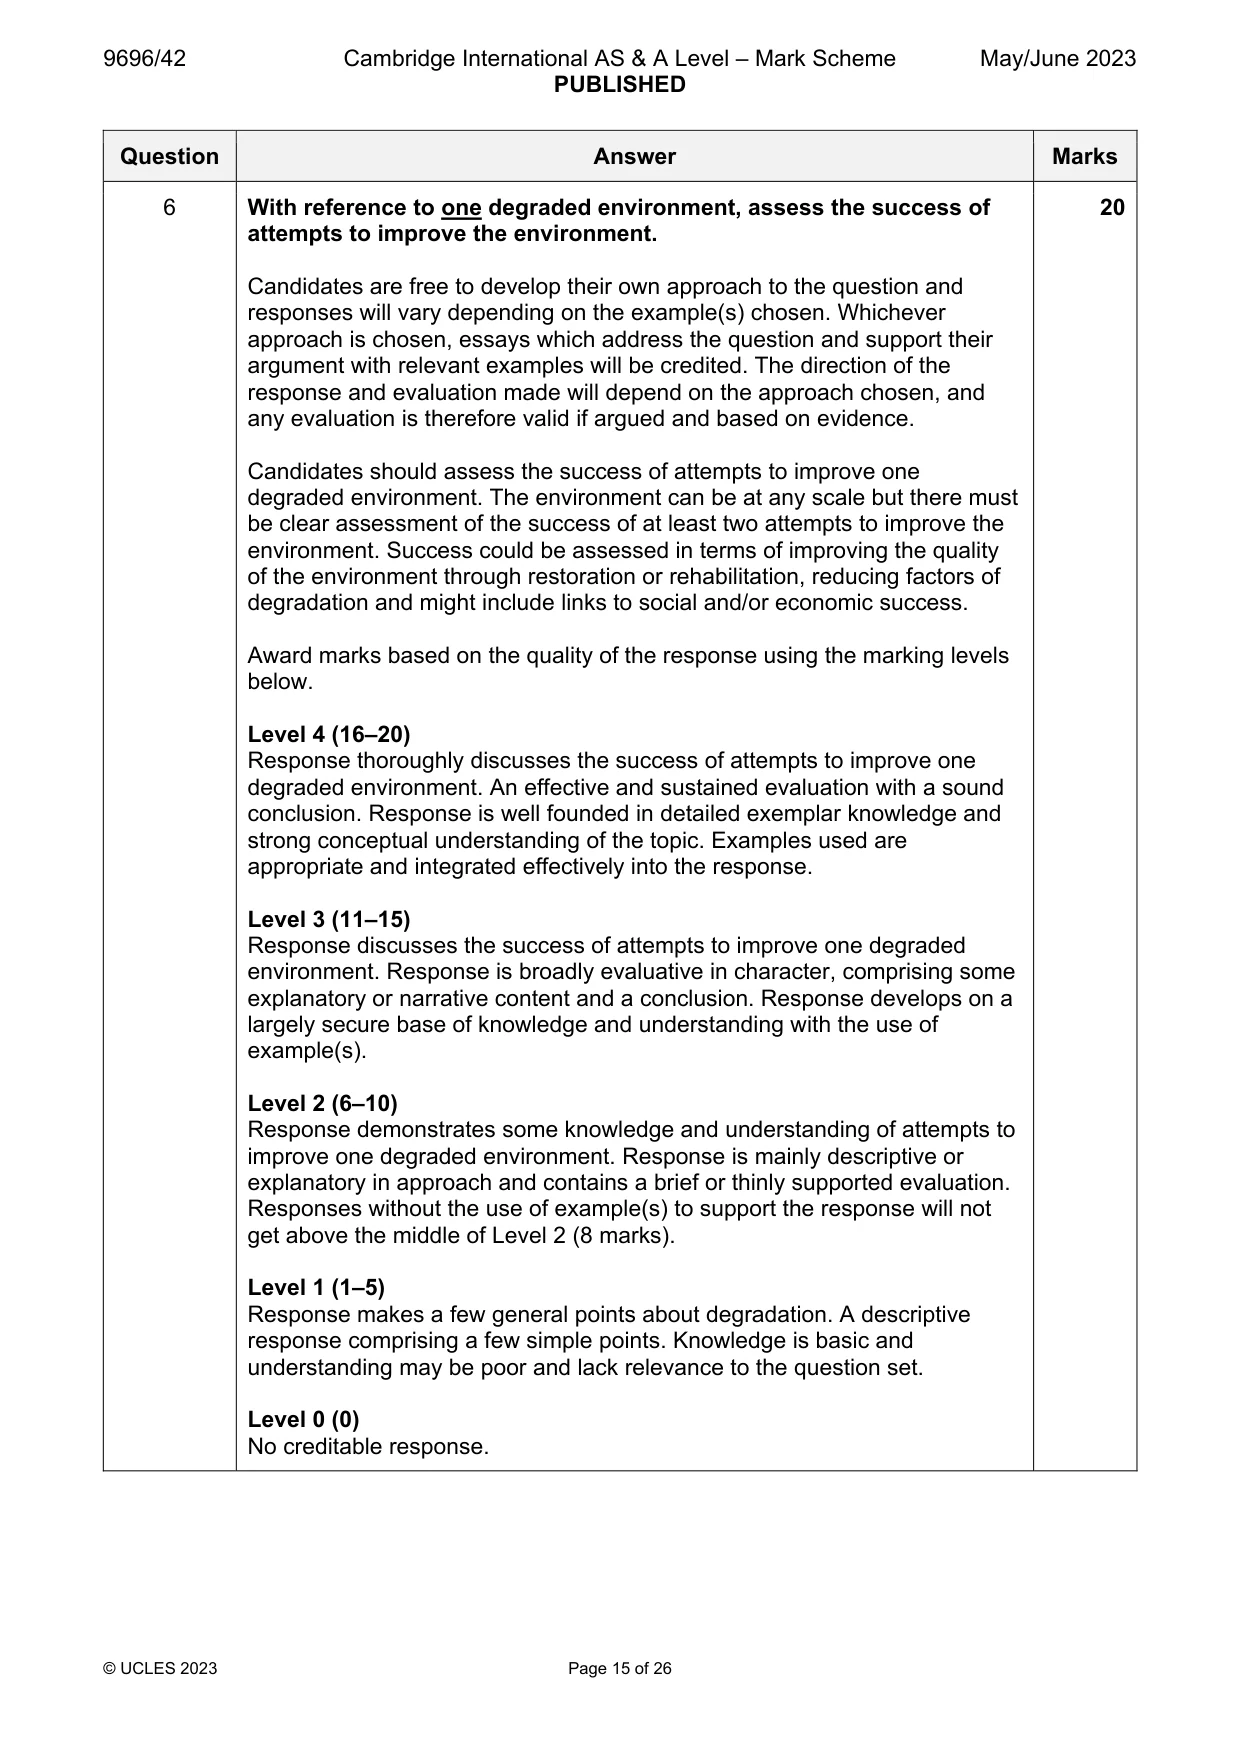
Mark scheme: 6 With reference to one degraded environment, assess the success of 20 attempts to improve the environment. Candidates are free to develop their own approach to the question and responses will vary depending on the example(s) chosen. Whichever approach is chosen, essays which address the question and support their argument with relevant examples will be credited. The direction of the response and evaluation made will depend on the approach chosen, and any evaluation is therefore valid if argued and based on evidence. Candidates should assess the success of attempts to improve one degraded environment. The environment can be at any scale but there must be clear assessment of the success of at least two attempts to improve the environment. Success could be assessed in terms of improving the quality of the environment through restoration or rehabilitation, reducing factors of degradation and might include links to social and/or economic success. Award marks based on the quality of the response using the marking levels below. Level 4 (16–20) Response thoroughly discusses the success of attempts to improve one degraded environment. An effective and sustained evaluation with a sound conclusion. Response is well founded in detailed exemplar knowledge and strong conceptual understanding of the topic. Examples used are appropriate and integrated effectively into the response. Level 3 (11–15) Response discusses the success of attempts to improve one degraded environment. Response is broadly evaluative in character, comprising some explanatory or narrative content and a conclusion. Response develops on a largely secure base of knowledge and understanding with the use of example(s). Level 2 (6–10) Response demonstrates some knowledge and understanding of attempts to improve one degraded environment. Response is mainly descriptive or explanatory in approach and contains a brief or thinly supported evaluation. Responses without the use of example(s) to support the response will not get above the middle of Level 2 (8 marks). Level 1 (1–5) Response makes a few general points about degradation. A descriptive response comprising a few simple points. Knowledge is basic and understanding may be poor and lack relevance to the question set. Level 0 (0) No creditable response. Global interdependence If answering this option, answer Question 7 and either Question 8 or Question 9.
Q7 · A photograph which shows hotel construction in Turkey, an MIC in Eurasia
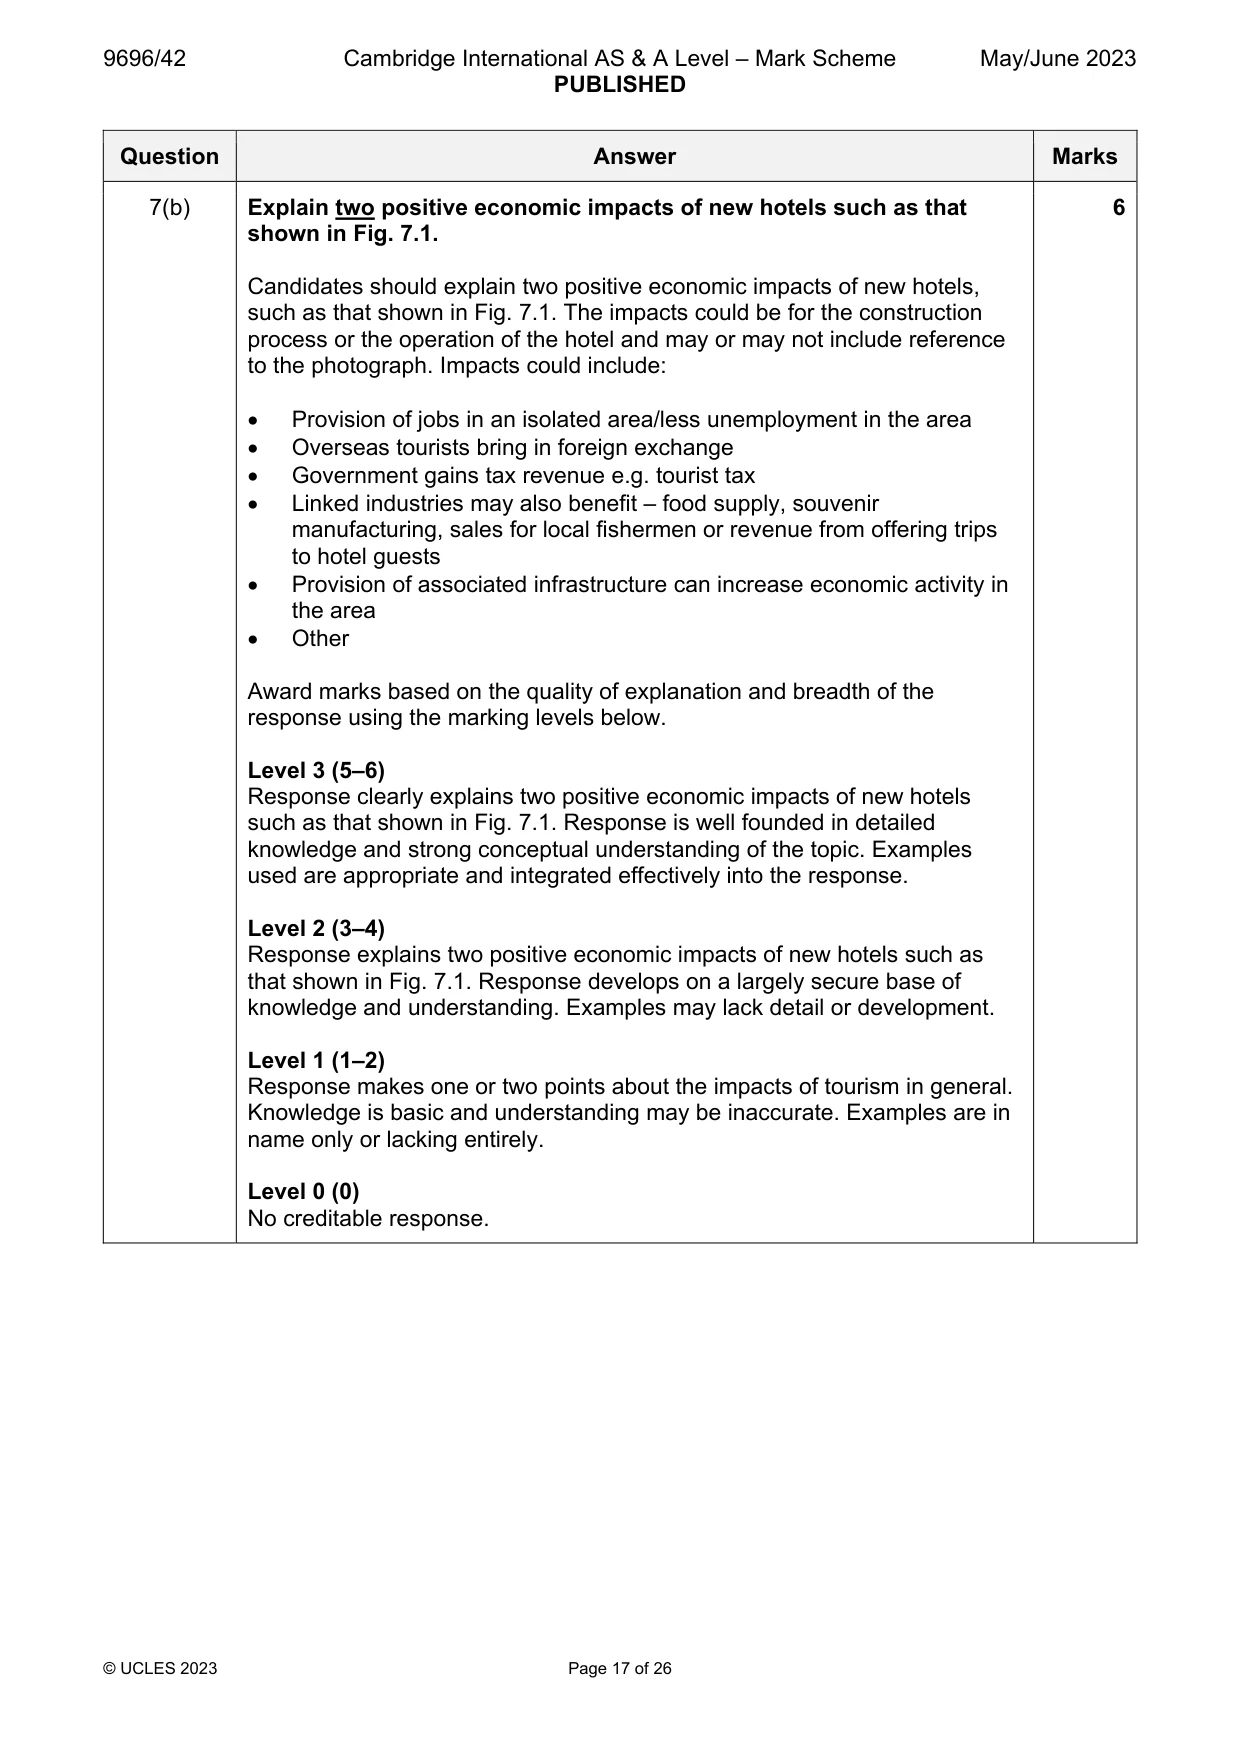
7 Fig. 7.1 is a photograph which shows hotel construction in Turkey, an MIC in Eurasia. (a) Using evidence from Fig. 7.1, describe how the hotel construction may have a negative impact on the local environment. [4] (b) Explain two positive economic impacts of new hotels such as that shown in Fig. 7.1. [6]
Mark scheme: 7(a) Fig. 7.1 is a photograph which shows hotel construction in Turkey, an 4 MIC in Eurasia. Using evidence from Fig. 7.1, describe how the hotel construction may have a negative impact on the local environment. Candidates should use evidence from the photograph to describe how the hotel construction may have a negative impact on the local environment. The impacts should be at the local scale and might be land, air or water pollution and could be during construction or once the hotel is in operation. Trees have been deforested (1) leading to loss of habitats for fauna and flora/reduction in biodiversity (1) Buildings are visually unsightly – the big building is not in keeping with the natural environment Natural habitats have been destroyed to make way for the building Roads have been built, which will increase traffic and associated problems – air pollution, noise etc. Water could be affected by waste generated by the hotel, which has to be disposed of – this could be litter or effluent Boats or construction using boats and/or subsequent tourist activities (swimming, watersports etc) can disrupt the natural habitats of aquatic animals Heavy vehicles/machinery cause erosion during construction/risk of mass movements, damage and air pollution Unpaved roads create dust which could affect nearby homes or vegetation Impermeable surfaces (road, buildings) can affect run off and drainage systems Other Max. 2 for descriptions not clearly related to specific evidence from the photograph. 7(b) Explain two positive economic impacts of new hotels such as that 6 shown in Fig. 7.1. Candidates should explain two positive economic impacts of new hotels, such as that shown in Fig. 7.1. The impacts could be for the construction process or the operation of the hotel and may or may not include reference to the photograph. Impacts could include: Provision of jobs in an isolated area/less unemployment in the area Overseas tourists bring in foreign exchange Government gains tax revenue e.g. tourist tax Linked industries may also benefit – food supply, souvenir manufacturing, sales for local fishermen or revenue from offering trips to hotel guests Provision of associated infrastructure can increase economic activity in the area Other Award marks based on the quality of explanation and breadth of the response using the marking levels below. Level 3 (5–6) Response clearly explains two positive economic impacts of new hotels such as that shown in Fig. 7.1. Response is well founded in detailed knowledge and strong conceptual understanding of the topic. Examples used are appropriate and integrated effectively into the response. Level 2 (3–4) Response explains two positive economic impacts of new hotels such as that shown in Fig. 7.1. Response develops on a largely secure base of knowledge and understanding. Examples may lack detail or development. Level 1 (1–2) Response makes one or two points about the impacts of tourism in general. Knowledge is basic and understanding may be inaccurate. Examples are in name only or lacking entirely. Level 0 (0) No creditable response.
Q8 · Evaluate the impacts of international aid on receiving countries
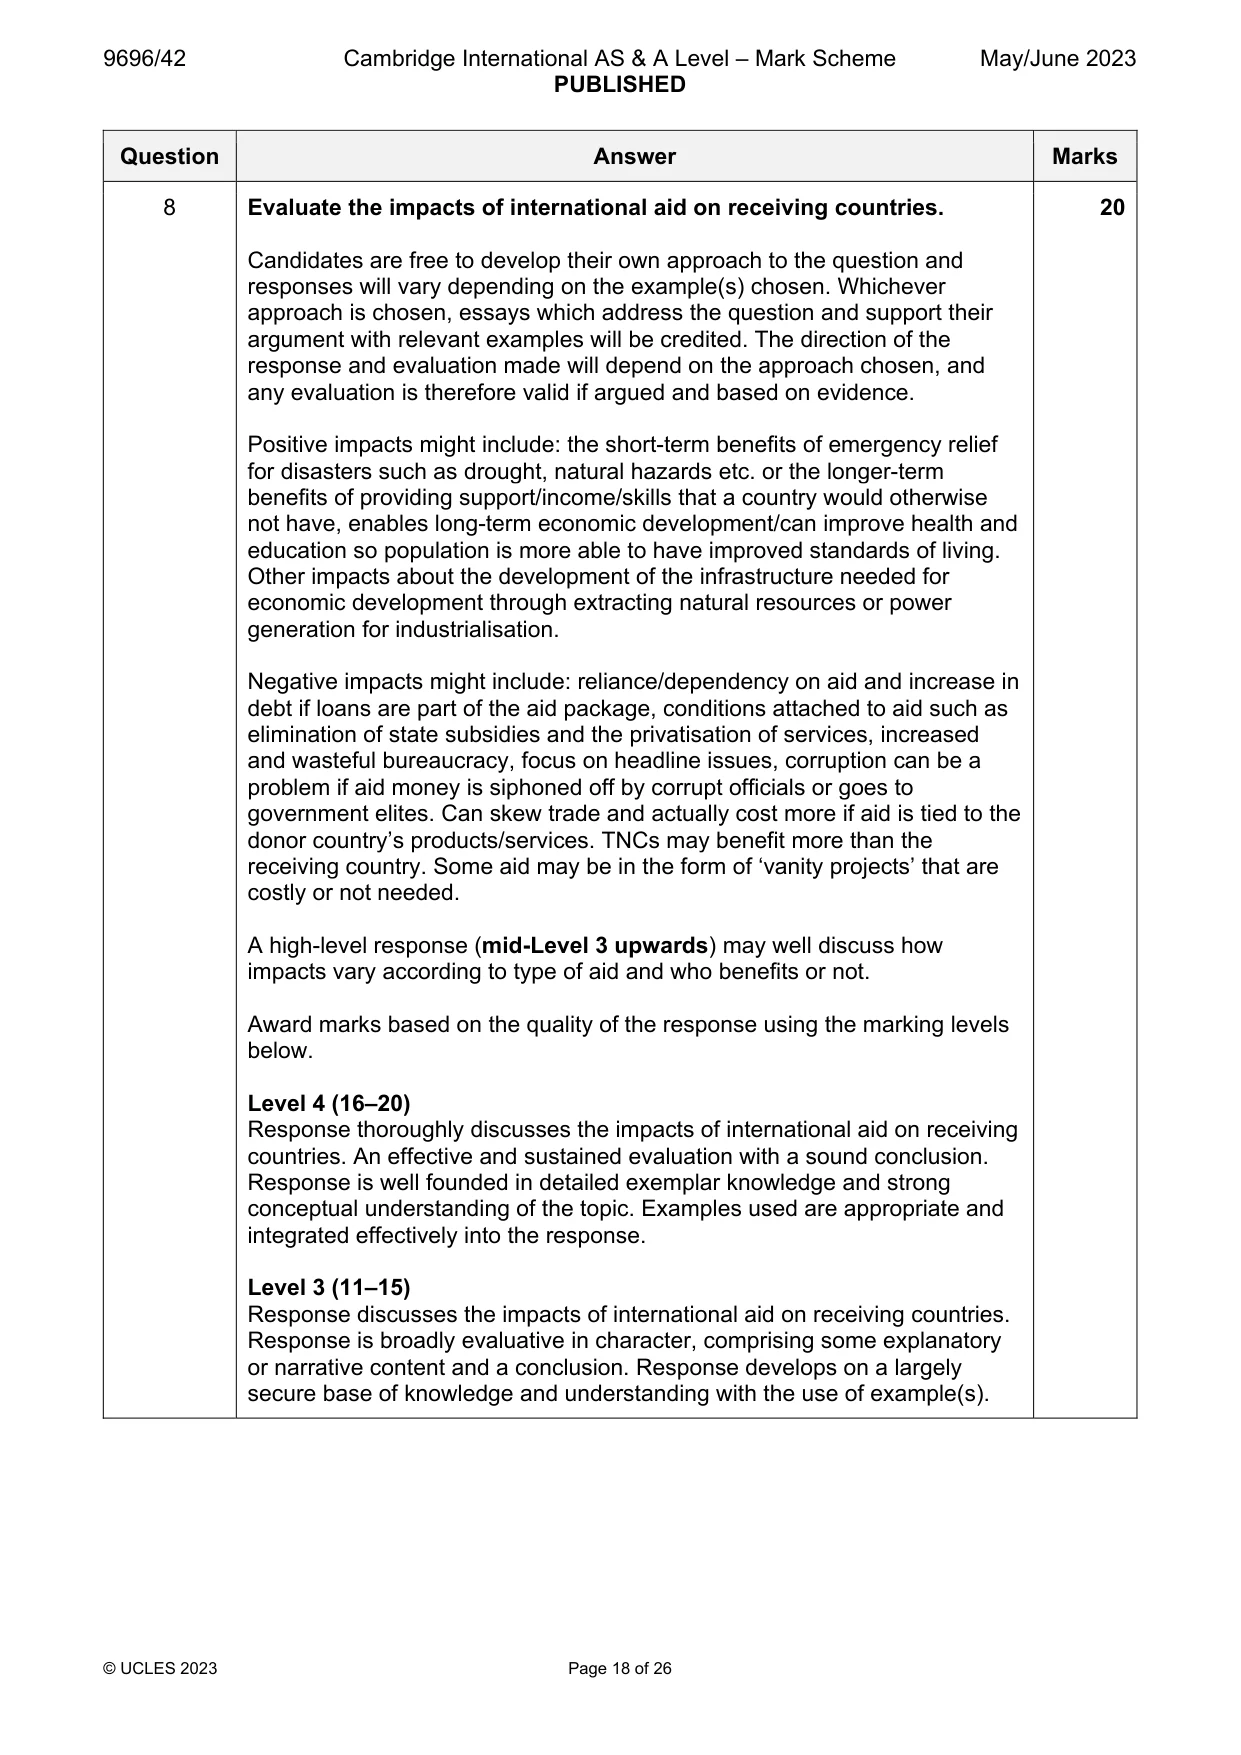
8 Evaluate the impacts of international aid on receiving countries. [20]
Mark scheme: 8 Evaluate the impacts of international aid on receiving countries. 20 Candidates are free to develop their own approach to the question and responses will vary depending on the example(s) chosen. Whichever approach is chosen, essays which address the question and support their argument with relevant examples will be credited. The direction of the response and evaluation made will depend on the approach chosen, and any evaluation is therefore valid if argued and based on evidence. Positive impacts might include: the short-term benefits of emergency relief for disasters such as drought, natural hazards etc. or the longer-term benefits of providing support/income/skills that a country would otherwise not have, enables long-term economic development/can improve health and education so population is more able to have improved standards of living. Other impacts about the development of the infrastructure needed for economic development through extracting natural resources or power generation for industrialisation. Negative impacts might include: reliance/dependency on aid and increase in debt if loans are part of the aid package, conditions attached to aid such as elimination of state subsidies and the privatisation of services, increased and wasteful bureaucracy, focus on headline issues, corruption can be a problem if aid money is siphoned off by corrupt officials or goes to government elites. Can skew trade and actually cost more if aid is tied to the donor country’s products/services. TNCs may benefit more than the receiving country. Some aid may be in the form of ‘vanity projects’ that are costly or not needed. A high-level response (mid-Level 3 upwards) may well discuss how impacts vary according to type of aid and who benefits or not. Award marks based on the quality of the response using the marking levels below. Level 4 (16–20) Response thoroughly discusses the impacts of international aid on receiving countries. An effective and sustained evaluation with a sound conclusion. Response is well founded in detailed exemplar knowledge and strong conceptual understanding of the topic. Examples used are appropriate and integrated effectively into the response. Level 3 (11–15) Response discusses the impacts of international aid on receiving countries. Response is broadly evaluative in character, comprising some explanatory or narrative content and a conclusion. Response develops on a largely secure base of knowledge and understanding with the use of example(s). 8 Level 2 (6–10) Response demonstrates some knowledge and understanding of the impacts of international aid on receiving countries. Response is mainly descriptive or explanatory in approach and contains a brief or thinly supported evaluation. Responses without the use of example(s) to support the response will not get above the middle of Level 2 (8 marks). Level 1 (1–5) Response makes a few general points about international aid. A descriptive response comprising a few simple points. Knowledge is basic and understanding may be poor and lack relevance to the question set. Level 0 (0) No creditable response.
Q9 · How far do you agree that the life cycle model of tourism is useful for all types of…
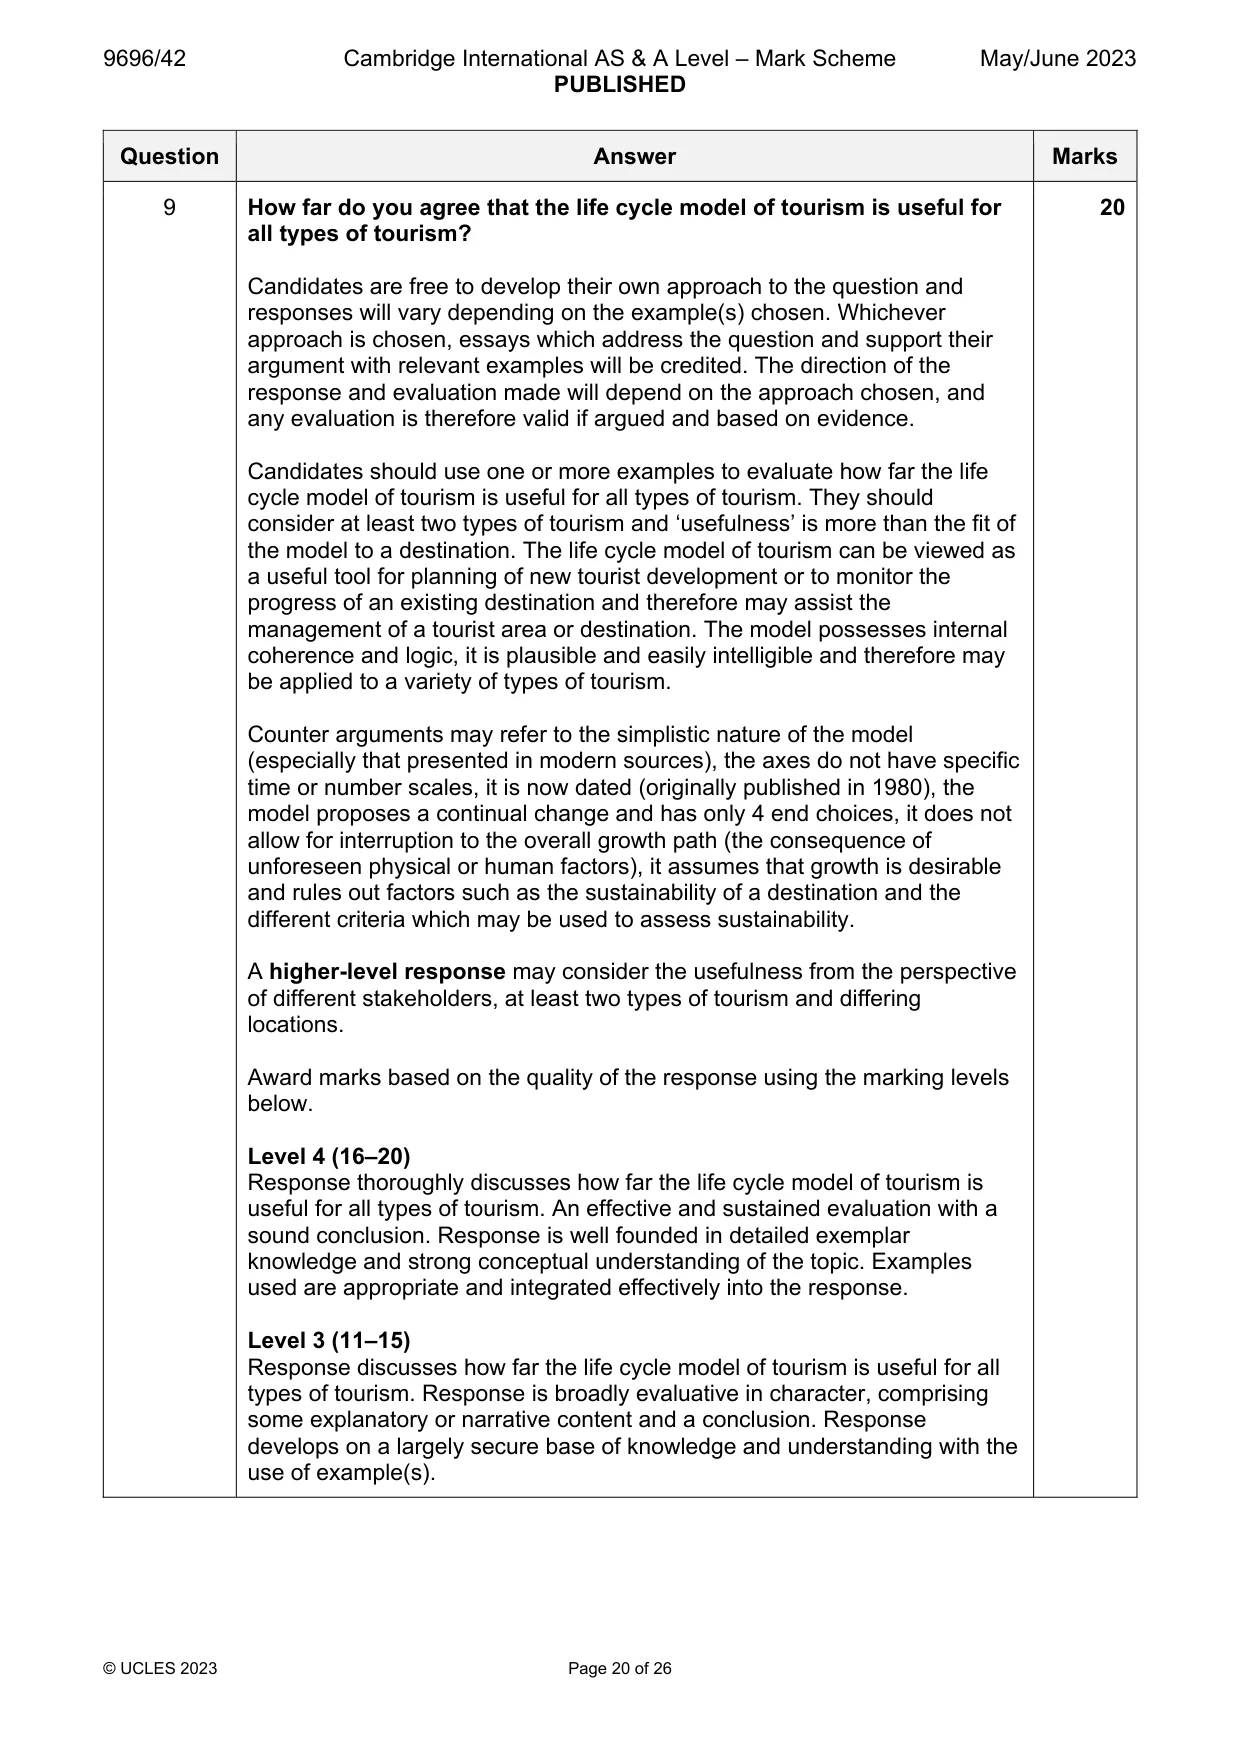
9 How far do you agree that the life cycle model of tourism is useful for all types of tourism? [20] Economic transition If answering this option, answer Question 10 and either Question 11 or Question 12.
Mark scheme: 9 How far do you agree that the life cycle model of tourism is useful for 20 all types of tourism? Candidates are free to develop their own approach to the question and responses will vary depending on the example(s) chosen. Whichever approach is chosen, essays which address the question and support their argument with relevant examples will be credited. The direction of the response and evaluation made will depend on the approach chosen, and any evaluation is therefore valid if argued and based on evidence. Candidates should use one or more examples to evaluate how far the life cycle model of tourism is useful for all types of tourism. They should consider at least two types of tourism and ‘usefulness’ is more than the fit of the model to a destination. The life cycle model of tourism can be viewed as a useful tool for planning of new tourist development or to monitor the progress of an existing destination and therefore may assist the management of a tourist area or destination. The model possesses internal coherence and logic, it is plausible and easily intelligible and therefore may be applied to a variety of types of tourism. Counter arguments may refer to the simplistic nature of the model (especially that presented in modern sources), the axes do not have specific time or number scales, it is now dated (originally published in 1980), the model proposes a continual change and has only 4 end choices, it does not allow for interruption to the overall growth path (the consequence of unforeseen physical or human factors), it assumes that growth is desirable and rules out factors such as the sustainability of a destination and the different criteria which may be used to assess sustainability. A higher-level response may consider the usefulness from the perspective of different stakeholders, at least two types of tourism and differing locations. Award marks based on the quality of the response using the marking levels below. Level 4 (16–20) Response thoroughly discusses how far the life cycle model of tourism is useful for all types of tourism. An effective and sustained evaluation with a sound conclusion. Response is well founded in detailed exemplar knowledge and strong conceptual understanding of the topic. Examples used are appropriate and integrated effectively into the response. Level 3 (11–15) Response discusses how far the life cycle model of tourism is useful for all types of tourism. Response is broadly evaluative in character, comprising some explanatory or narrative content and a conclusion. Response develops on a largely secure base of knowledge and understanding with the use of example(s). 9 Level 2 (6–10) Response demonstrates some knowledge and understanding of the usefulness of the life cycle model of tourism with limited comment on more than one type of tourism. Response is mainly descriptive or explanatory in approach and contains a brief or thinly supported evaluation. Responses without the use of example(s) to support the response will not get above the middle of Level 2 (8 marks). Level 1 (1–5) Response makes a few general points about the life cycle model of tourism. A descriptive response comprising a few simple points. Knowledge is basic and understanding may be poor and lack relevance to the question set. Level 0 (0) No creditable response. Economic transition If answering this option, answer Question 10 and either Question 11 or Question 12.
Q10 · The share of manufactured goods in global export markets for different levels of…
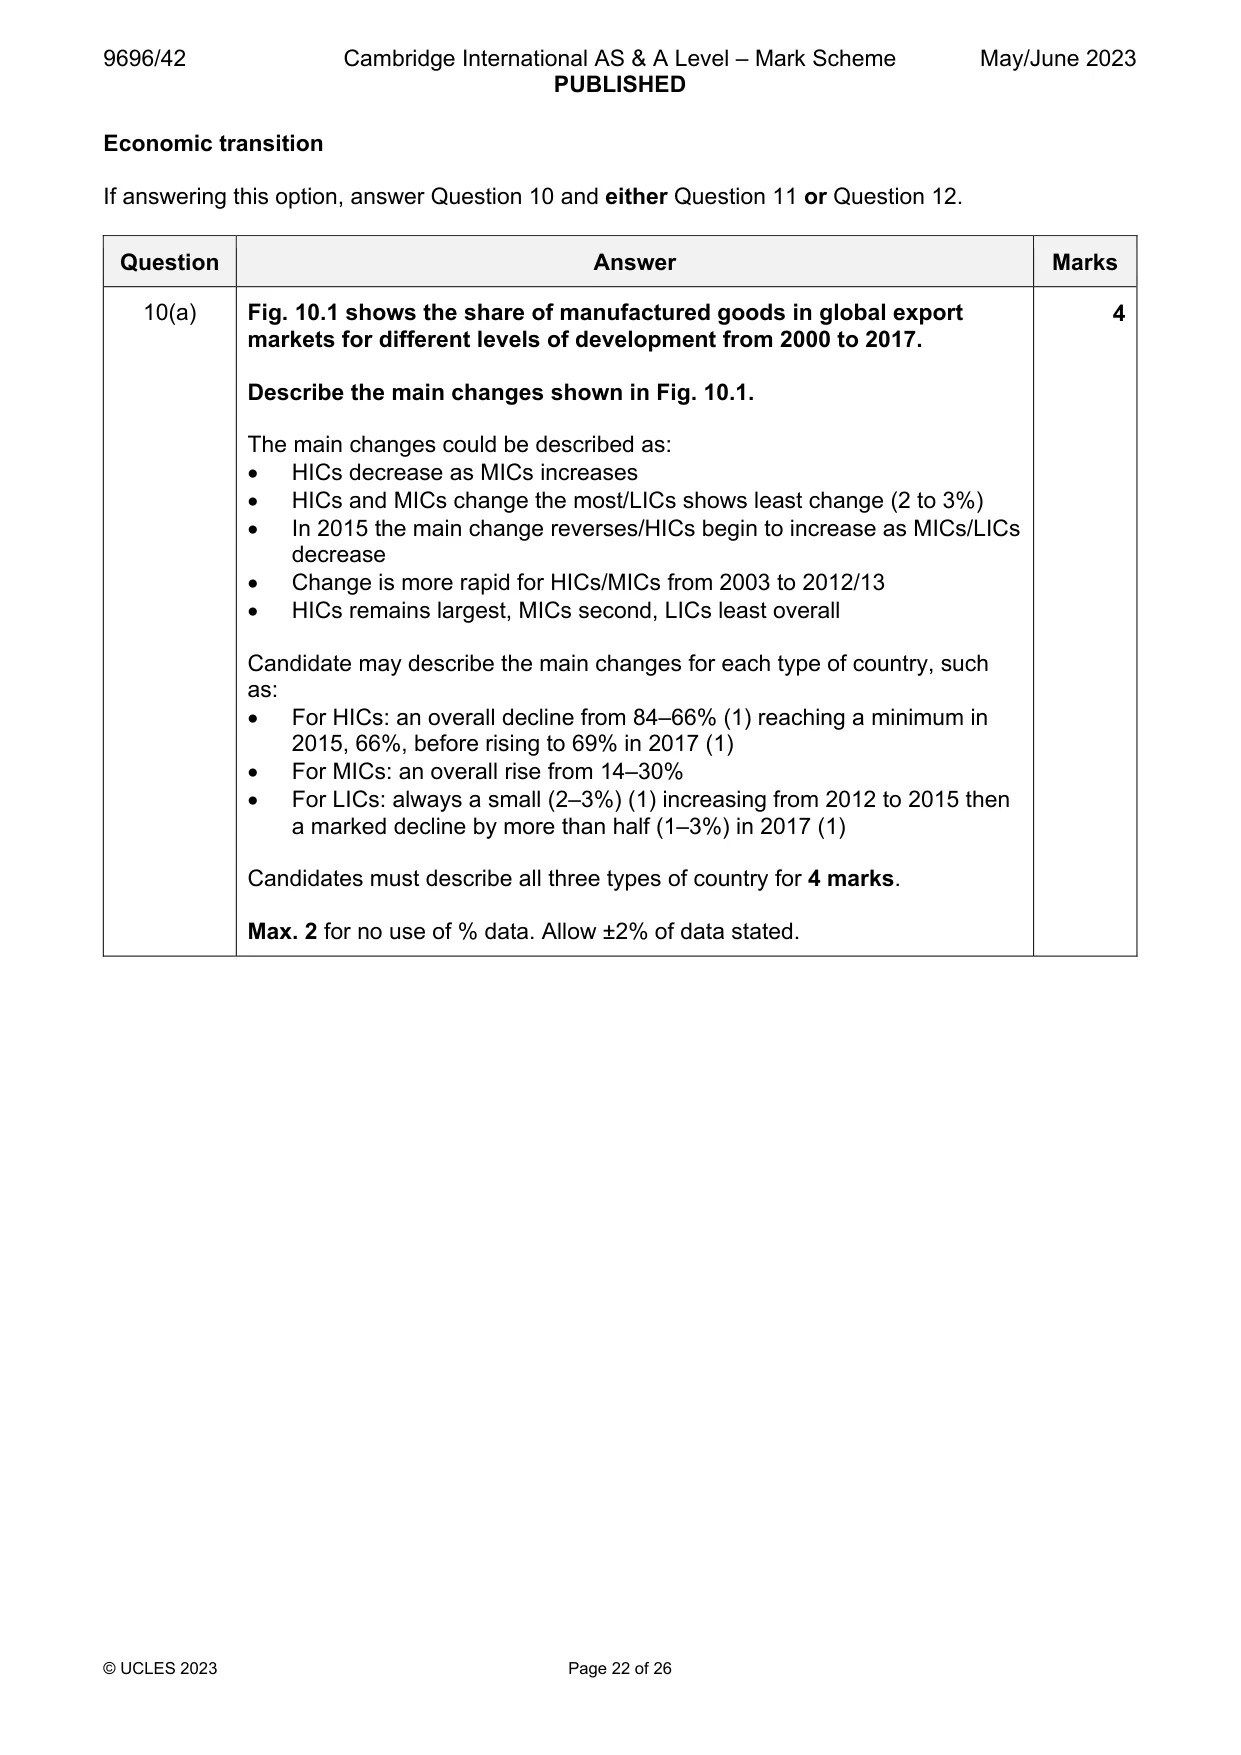
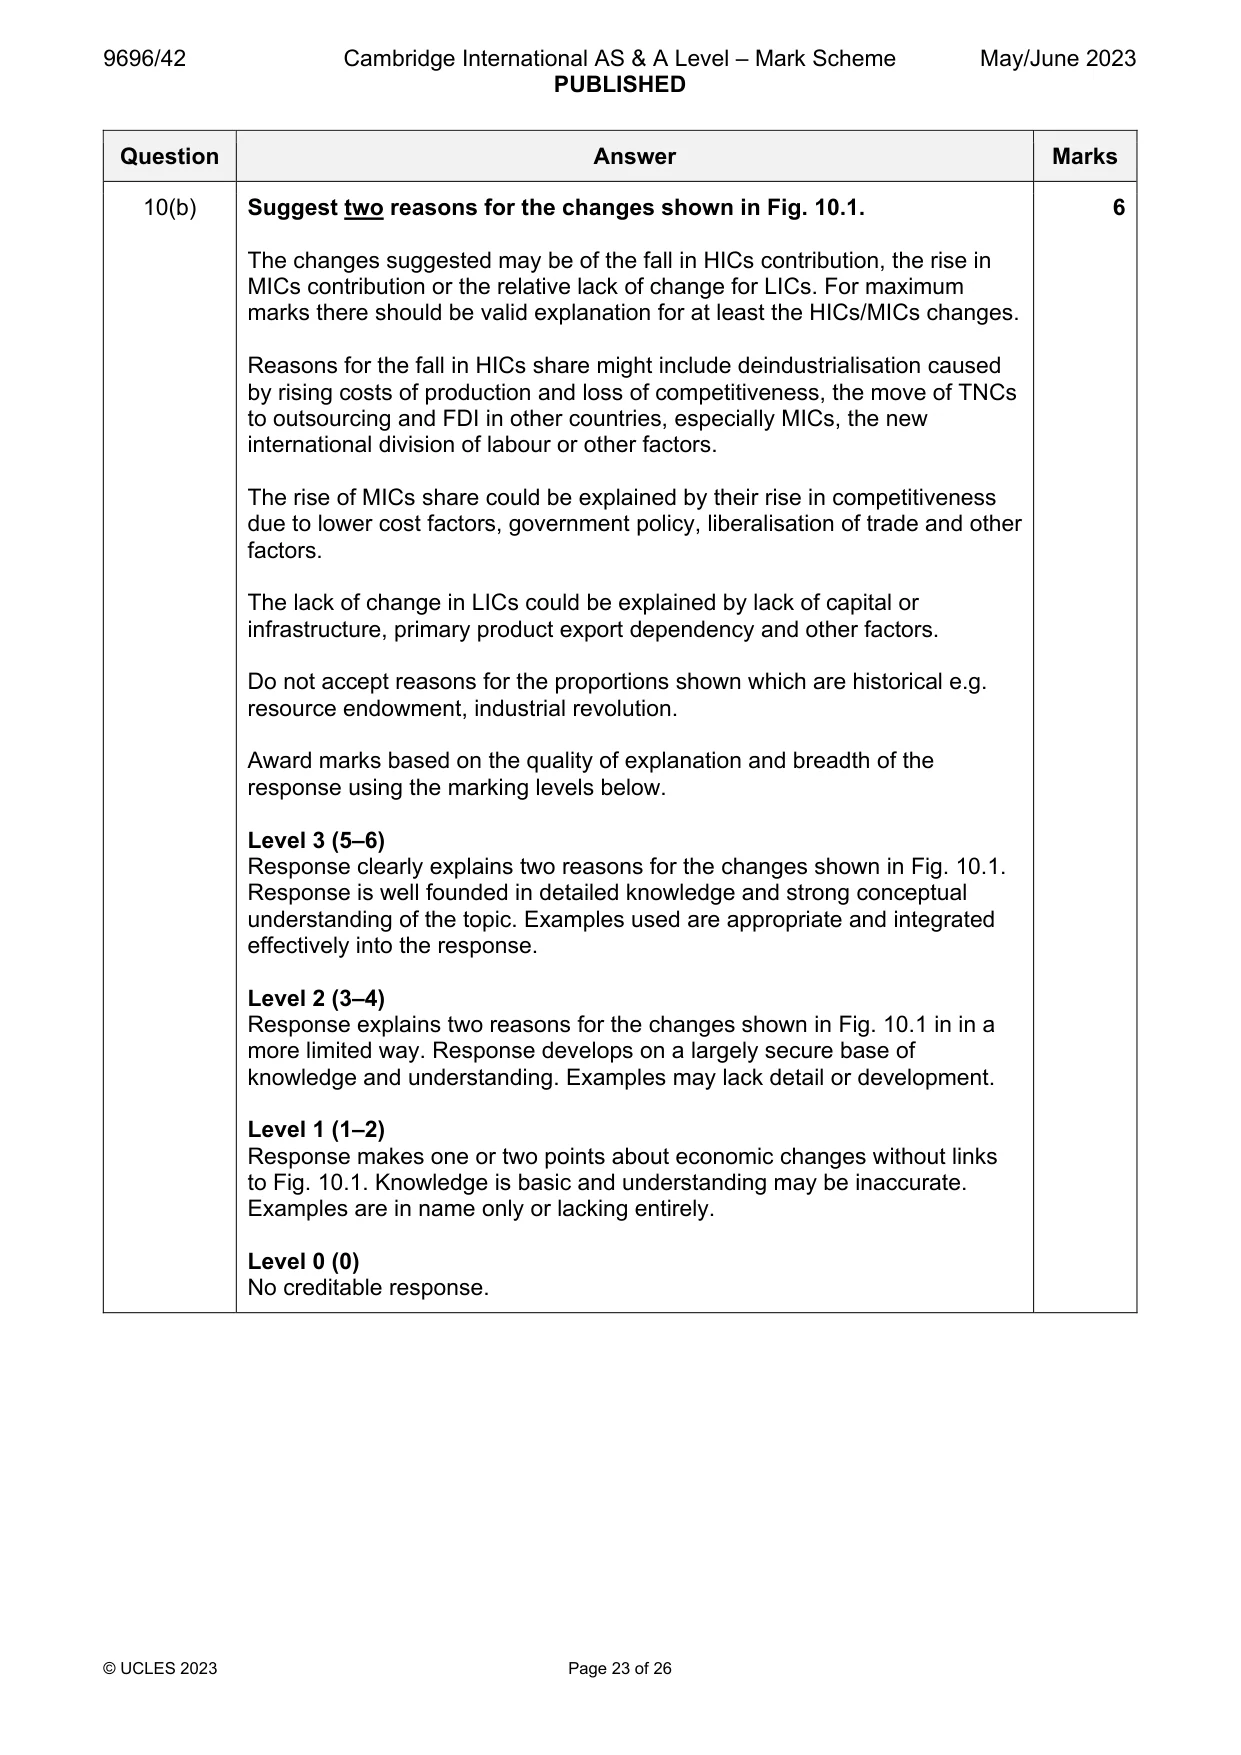
10 Fig. 10.1 shows the share of manufactured goods in global export markets for different levels of development from 2000 to 2017. (a) Describe the main changes shown in Fig. 10.1. [4] (b) Suggest two reasons for the changes shown in Fig. 10.1. [6]
Mark scheme: 10(a) Fig. 10.1 shows the share of manufactured goods in global export 4 markets for different levels of development from 2000 to 2017. Describe the main changes shown in Fig. 10.1. The main changes could be described as: HICs decrease as MICs increases HICs and MICs change the most/LICs shows least change (2 to 3%) In 2015 the main change reverses/HICs begin to increase as MICs/LICs decrease Change is more rapid for HICs/MICs from 2003 to 2012/13 HICs remains largest, MICs second, LICs least overall Candidate may describe the main changes for each type of country, such as: For HICs: an overall decline from 84–66% (1) reaching a minimum in 2015, 66%, before rising to 69% in 2017 (1) For MICs: an overall rise from 14–30% For LICs: always a small (2–3%) (1) increasing from 2012 to 2015 then a marked decline by more than half (1–3%) in 2017 (1) Candidates must describe all three types of country for 4 marks. Max. 2 for no use of % data. Allow ±2% of data stated. 10(b) Suggest two reasons for the changes shown in Fig. 10.1. 6 The changes suggested may be of the fall in HICs contribution, the rise in MICs contribution or the relative lack of change for LICs. For maximum marks there should be valid explanation for at least the HICs/MICs changes. Reasons for the fall in HICs share might include deindustrialisation caused by rising costs of production and loss of competitiveness, the move of TNCs to outsourcing and FDI in other countries, especially MICs, the new international division of labour or other factors. The rise of MICs share could be explained by their rise in competitiveness due to lower cost factors, government policy, liberalisation of trade and other factors. The lack of change in LICs could be explained by lack of capital or infrastructure, primary product export dependency and other factors. Do not accept reasons for the proportions shown which are historical e.g. resource endowment, industrial revolution. Award marks based on the quality of explanation and breadth of the response using the marking levels below. Level 3 (5–6) Response clearly explains two reasons for the changes shown in Fig. 10.1. Response is well founded in detailed knowledge and strong conceptual understanding of the topic. Examples used are appropriate and integrated effectively into the response. Level 2 (3–4) Response explains two reasons for the changes shown in Fig. 10.1 in in a more limited way. Response develops on a largely secure base of knowledge and understanding. Examples may lack detail or development. Level 1 (1–2) Response makes one or two points about economic changes without links to Fig. 10.1. Knowledge is basic and understanding may be inaccurate. Examples are in name only or lacking entirely. Level 0 (0) No creditable response.
Q11 · ‘Transnational corporations (TNCs) bring more advantages than disadvantages to…
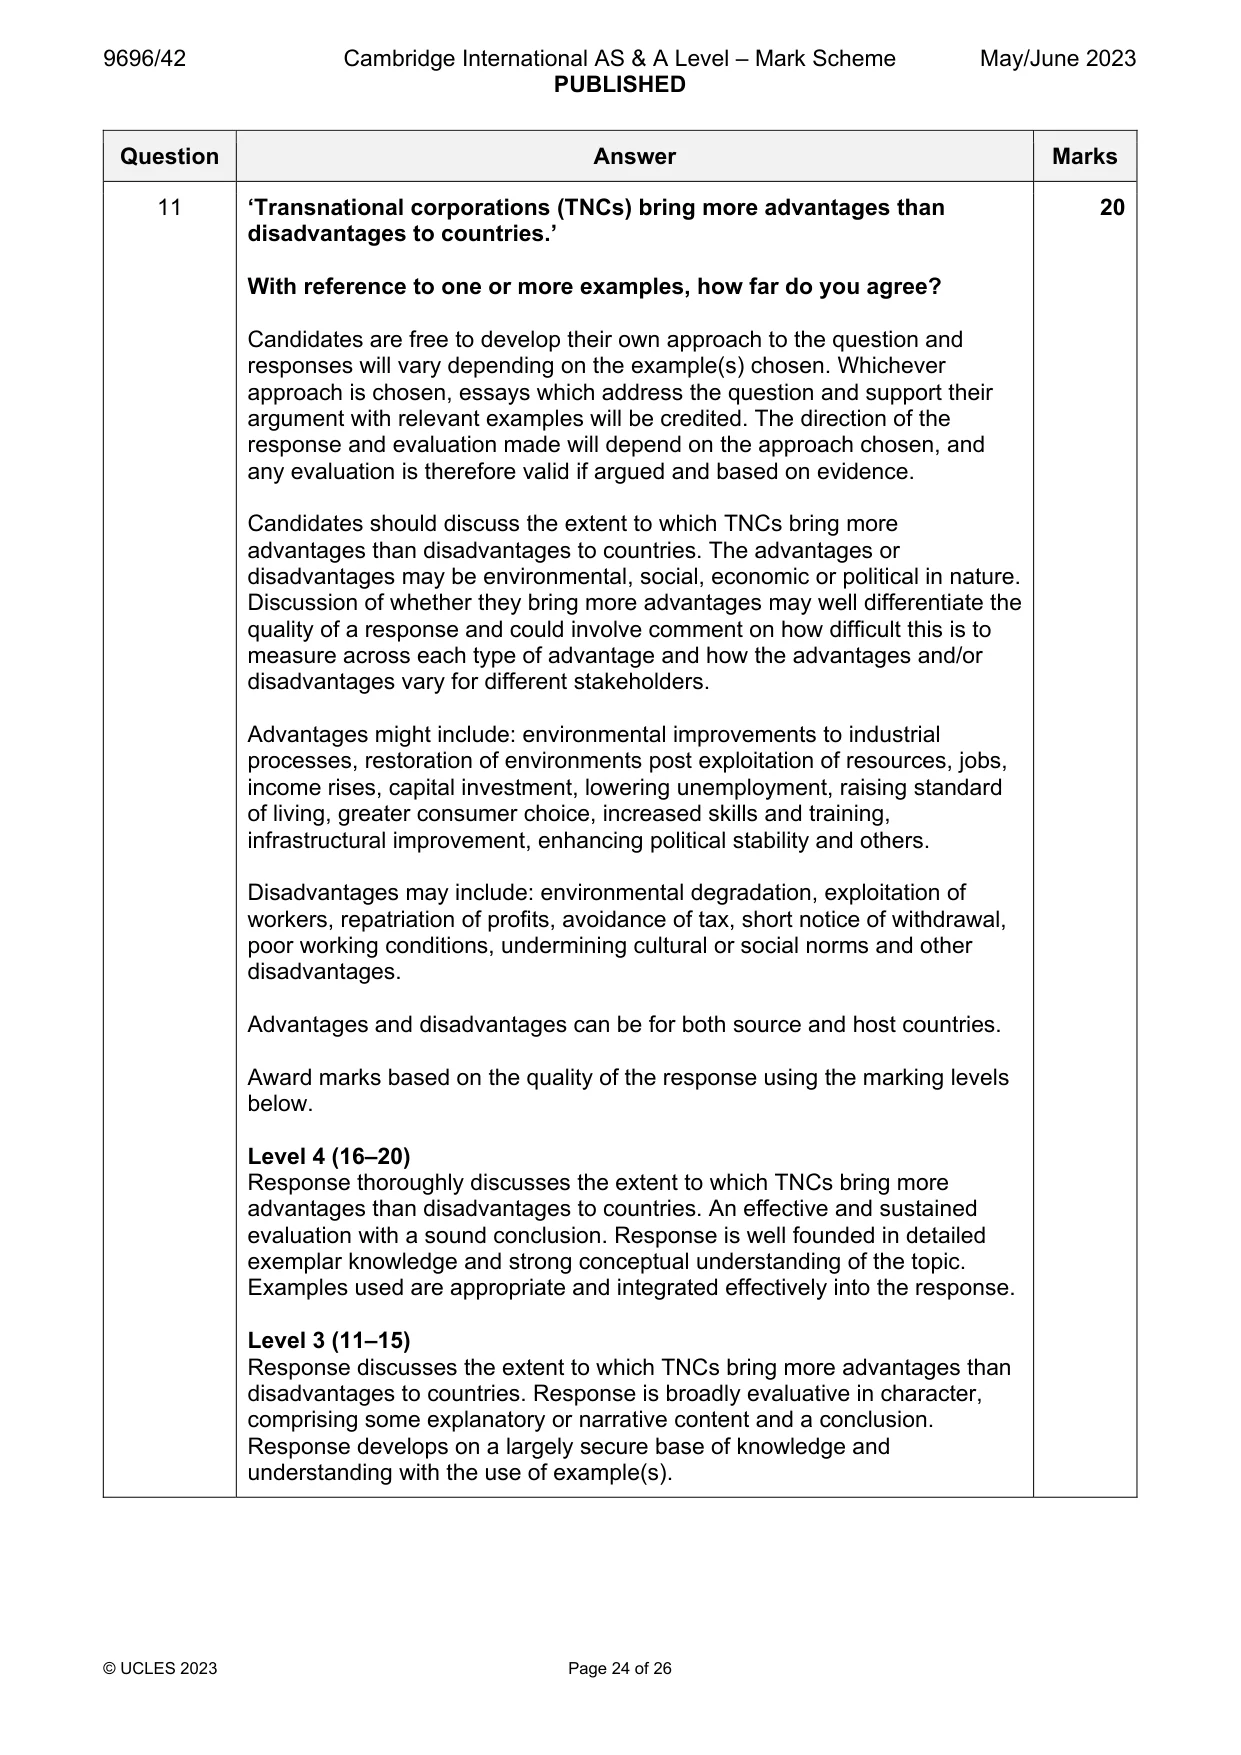
11 ‘Transnational corporations (TNCs) bring more advantages than disadvantages to countries.’ With reference to one or more examples, how far do you agree? [20]
Mark scheme: 11 ‘Transnational corporations (TNCs) bring more advantages than 20 disadvantages to countries.’ With reference to one or more examples, how far do you agree? Candidates are free to develop their own approach to the question and responses will vary depending on the example(s) chosen. Whichever approach is chosen, essays which address the question and support their argument with relevant examples will be credited. The direction of the response and evaluation made will depend on the approach chosen, and any evaluation is therefore valid if argued and based on evidence. Candidates should discuss the extent to which TNCs bring more advantages than disadvantages to countries. The advantages or disadvantages may be environmental, social, economic or political in nature. Discussion of whether they bring more advantages may well differentiate the quality of a response and could involve comment on how difficult this is to measure across each type of advantage and how the advantages and/or disadvantages vary for different stakeholders. Advantages might include: environmental improvements to industrial processes, restoration of environments post exploitation of resources, jobs, income rises, capital investment, lowering unemployment, raising standard of living, greater consumer choice, increased skills and training, infrastructural improvement, enhancing political stability and others. Disadvantages may include: environmental degradation, exploitation of workers, repatriation of profits, avoidance of tax, short notice of withdrawal, poor working conditions, undermining cultural or social norms and other disadvantages. Advantages and disadvantages can be for both source and host countries. Award marks based on the quality of the response using the marking levels below. Level 4 (16–20) Response thoroughly discusses the extent to which TNCs bring more advantages than disadvantages to countries. An effective and sustained evaluation with a sound conclusion. Response is well founded in detailed exemplar knowledge and strong conceptual understanding of the topic. Examples used are appropriate and integrated effectively into the response. Level 3 (11–15) Response discusses the extent to which TNCs bring more advantages than disadvantages to countries. Response is broadly evaluative in character, comprising some explanatory or narrative content and a conclusion. Response develops on a largely secure base of knowledge and understanding with the use of example(s). 11 Level 2 (6–10) Response demonstrates some knowledge and understanding of how TNCs bring advantages and disadvantages to countries but is unbalanced in approach. Response is mainly descriptive or explanatory in approach and contains a brief or thinly supported evaluation. Responses without the use of example(s) to support the response will not get above the middle of Level 2 (8 marks). Level 1 (1–5) Response makes a few general points about the impact of TNCs on countries. A descriptive response comprising a few simple points. Knowledge is basic and understanding may be poor and lack relevance to the question set. Level 0 (0) No creditable response.
Q12 · With reference to one country, assess the extent to which there will always be regional…
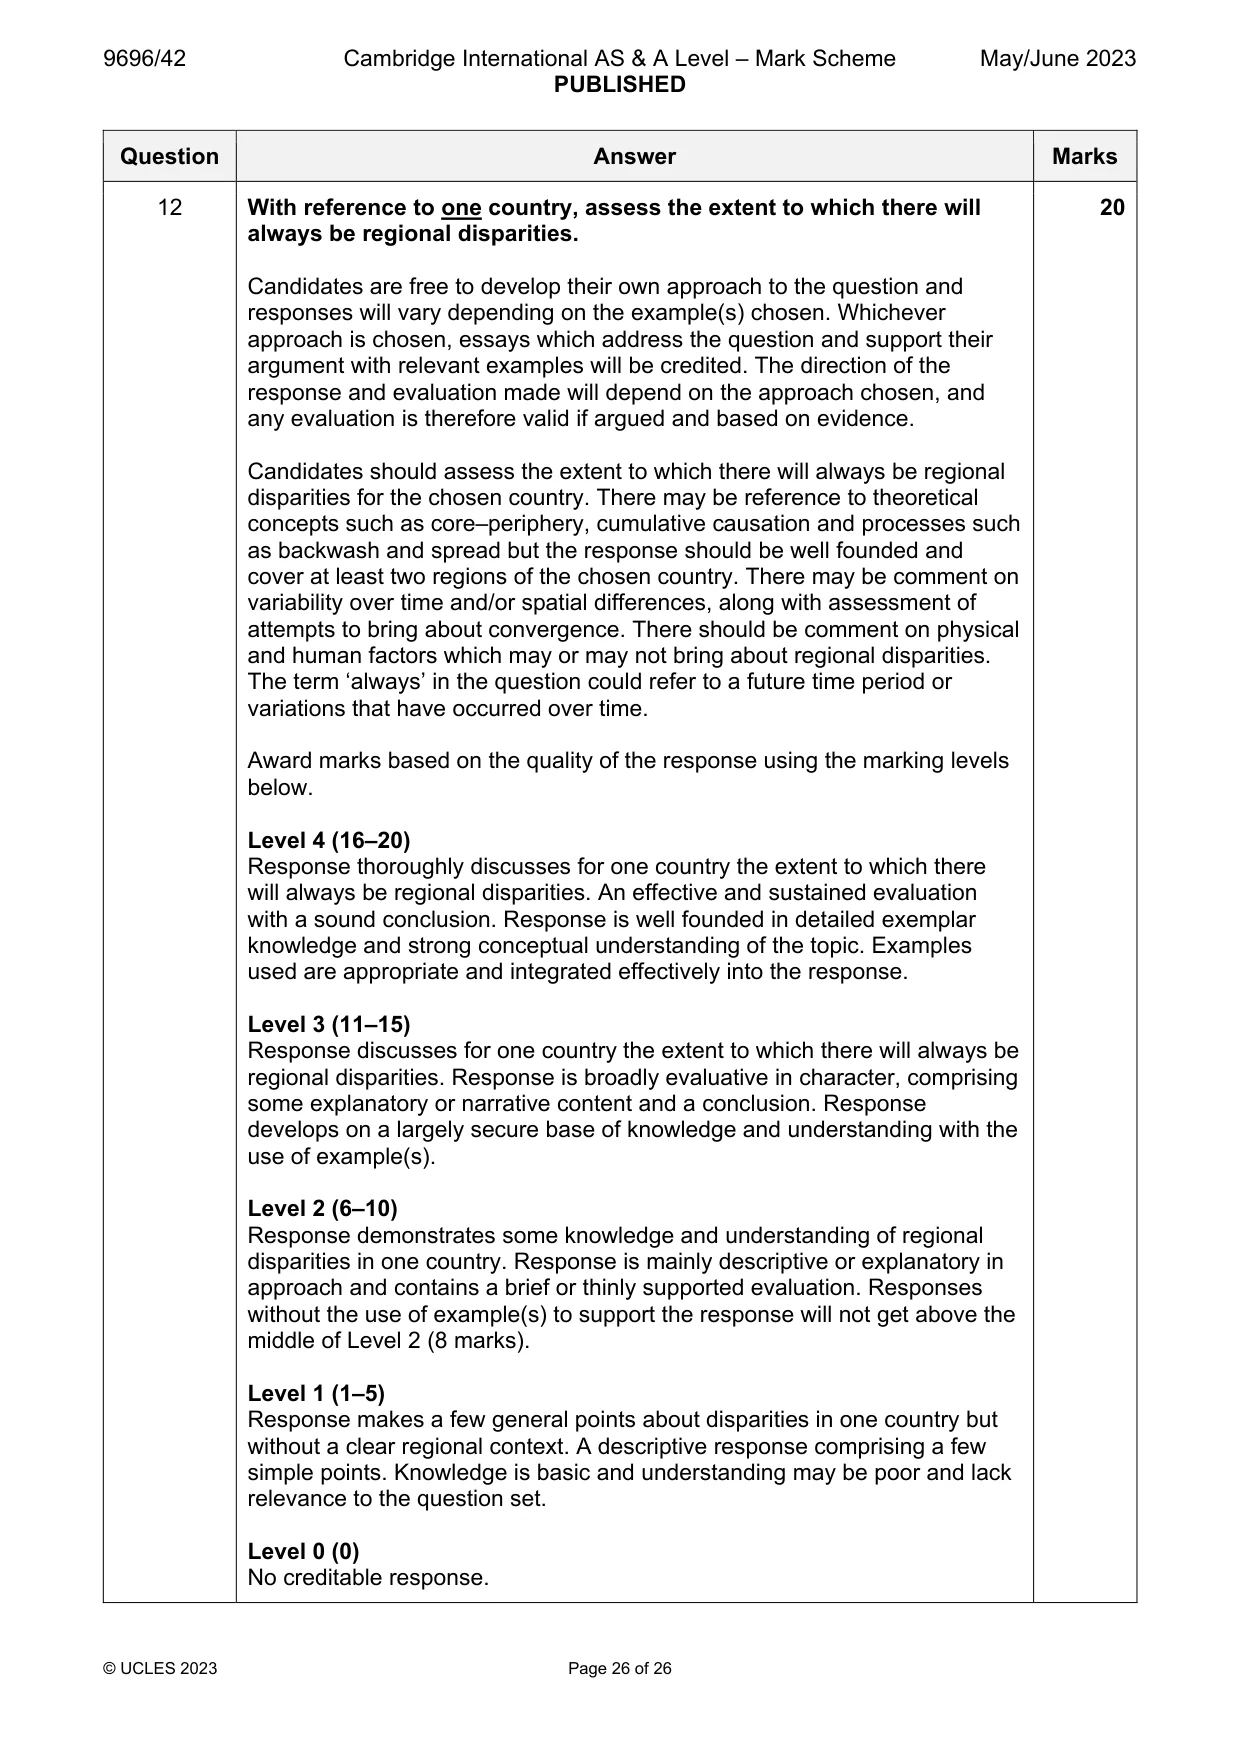
12 With reference to one country, assess the extent to which there will always be regional disparities. [20]
Mark scheme: 12 With reference to one country, assess the extent to which there will 20 always be regional disparities. Candidates are free to develop their own approach to the question and responses will vary depending on the example(s) chosen. Whichever approach is chosen, essays which address the question and support their argument with relevant examples will be credited. The direction of the response and evaluation made will depend on the approach chosen, and any evaluation is therefore valid if argued and based on evidence. Candidates should assess the extent to which there will always be regional disparities for the chosen country. There may be reference to theoretical concepts such as core–periphery, cumulative causation and processes such as backwash and spread but the response should be well founded and cover at least two regions of the chosen country. There may be comment on variability over time and/or spatial differences, along with assessment of attempts to bring about convergence. There should be comment on physical and human factors which may or may not bring about regional disparities. The term ‘always’ in the question could refer to a future time period or variations that have occurred over time. Award marks based on the quality of the response using the marking levels below. Level 4 (16–20) Response thoroughly discusses for one country the extent to which there will always be regional disparities. An effective and sustained evaluation with a sound conclusion. Response is well founded in detailed exemplar knowledge and strong conceptual understanding of the topic. Examples used are appropriate and integrated effectively into the response. Level 3 (11–15) Response discusses for one country the extent to which there will always be regional disparities. Response is broadly evaluative in character, comprising some explanatory or narrative content and a conclusion. Response develops on a largely secure base of knowledge and understanding with the use of example(s). Level 2 (6–10) Response demonstrates some knowledge and understanding of regional disparities in one country. Response is mainly descriptive or explanatory in approach and contains a brief or thinly supported evaluation. Responses without the use of example(s) to support the response will not get above the middle of Level 2 (8 marks). Level 1 (1–5) Response makes a few general points about disparities in one country but without a clear regional context. A descriptive response comprising a few simple points. Knowledge is basic and understanding may be poor and lack relevance to the question set. Level 0 (0) No creditable response.
What was in this paper
The subtopics covered by these 12 questions, and how many questions each got. Open one in a new tab to see every Cambridge question on it.
3The development of international tourism2The management of a degraded environment2Agricultural systems and food production1International debt and international aid1Regional development within countries1The globalisation of economic activity1The management of energy supply1What you needed in this session
Cambridge’s own grade thresholds for 2023 May/June, Paper 4 · Variant 2. A higher threshold means an easier paper — the bar moves with how the cohort did.