Cambridge A Level Geography 9696 — 2023 Oct/Nov Paper 4 · Variant 2
9696/42/O/N/23 · 12 questions · 60 marks · ≈68 min
The question paper and its mark scheme, free to read here and free to download. This is Cambridge’s own paper, exactly as it was sat.
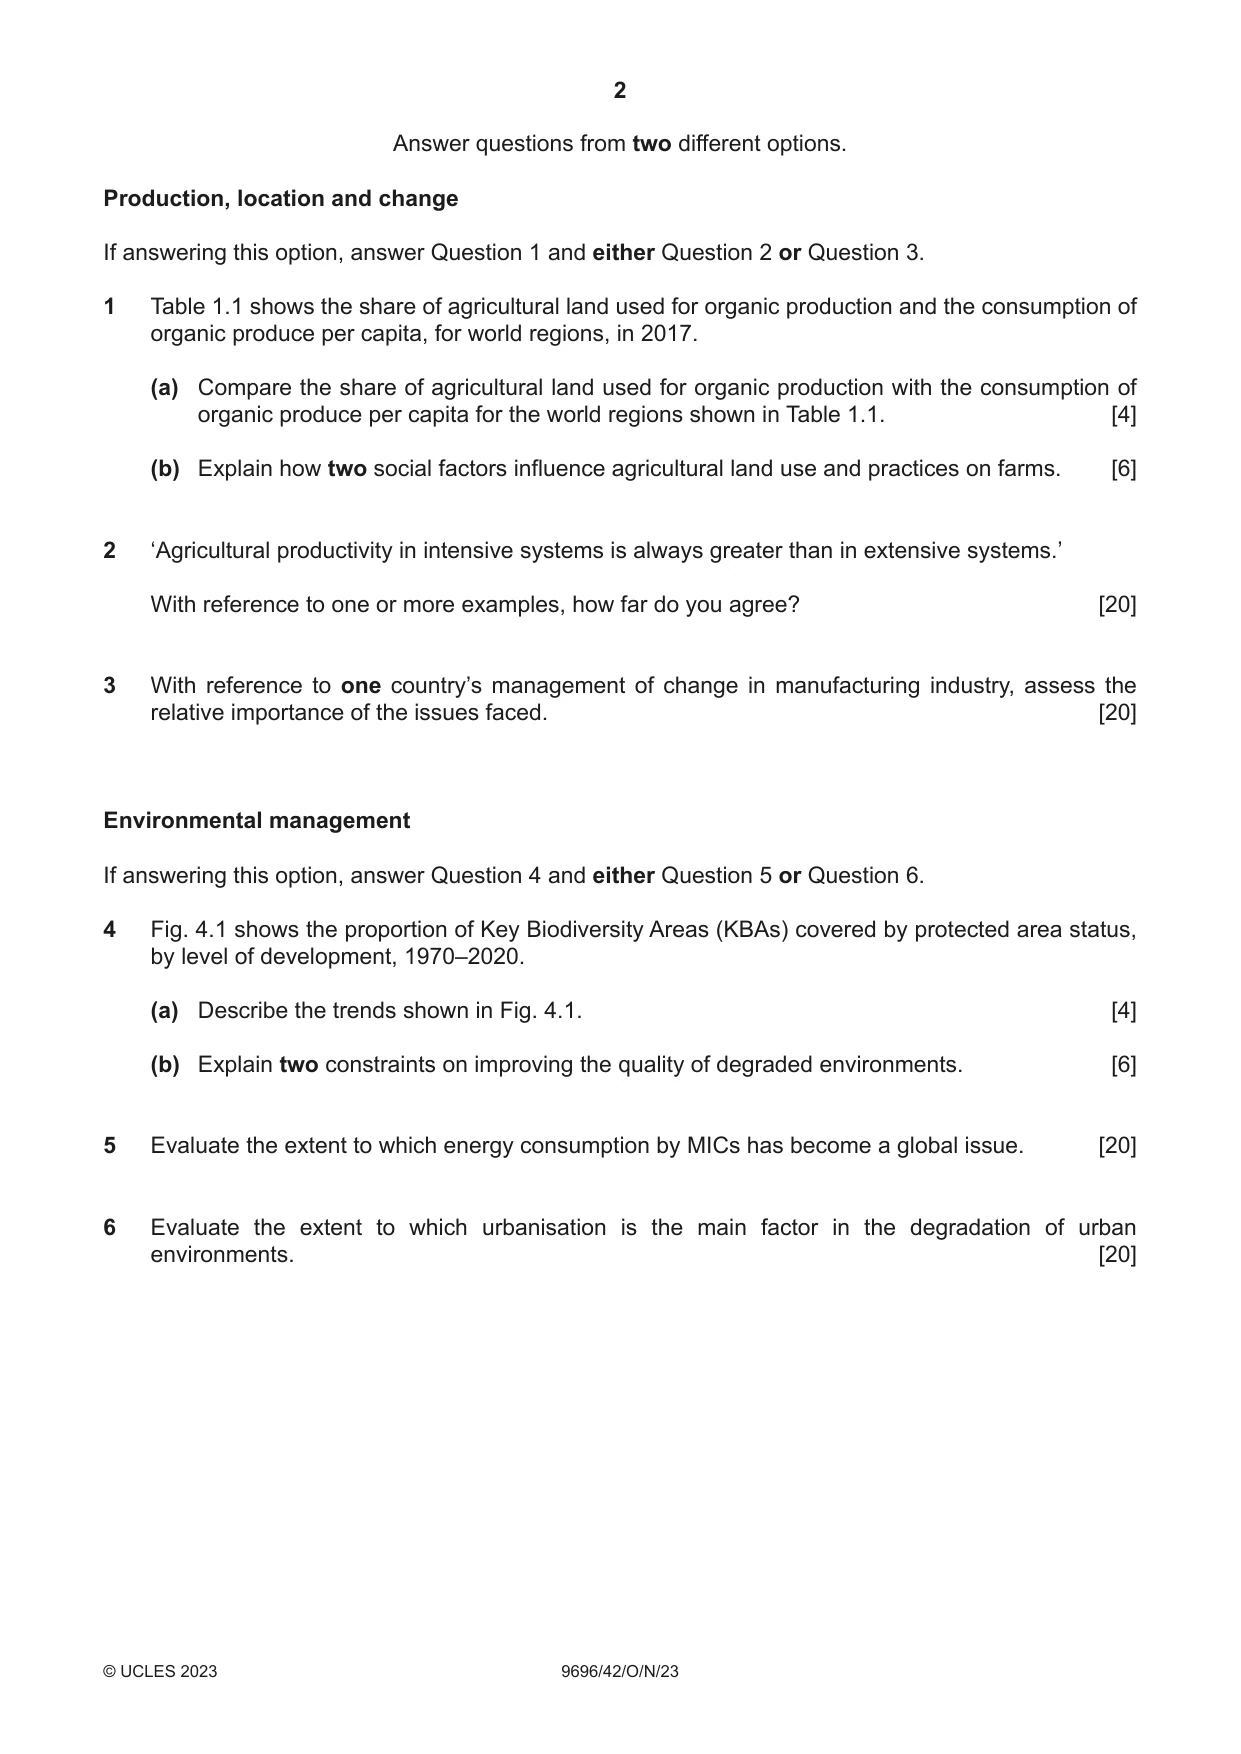
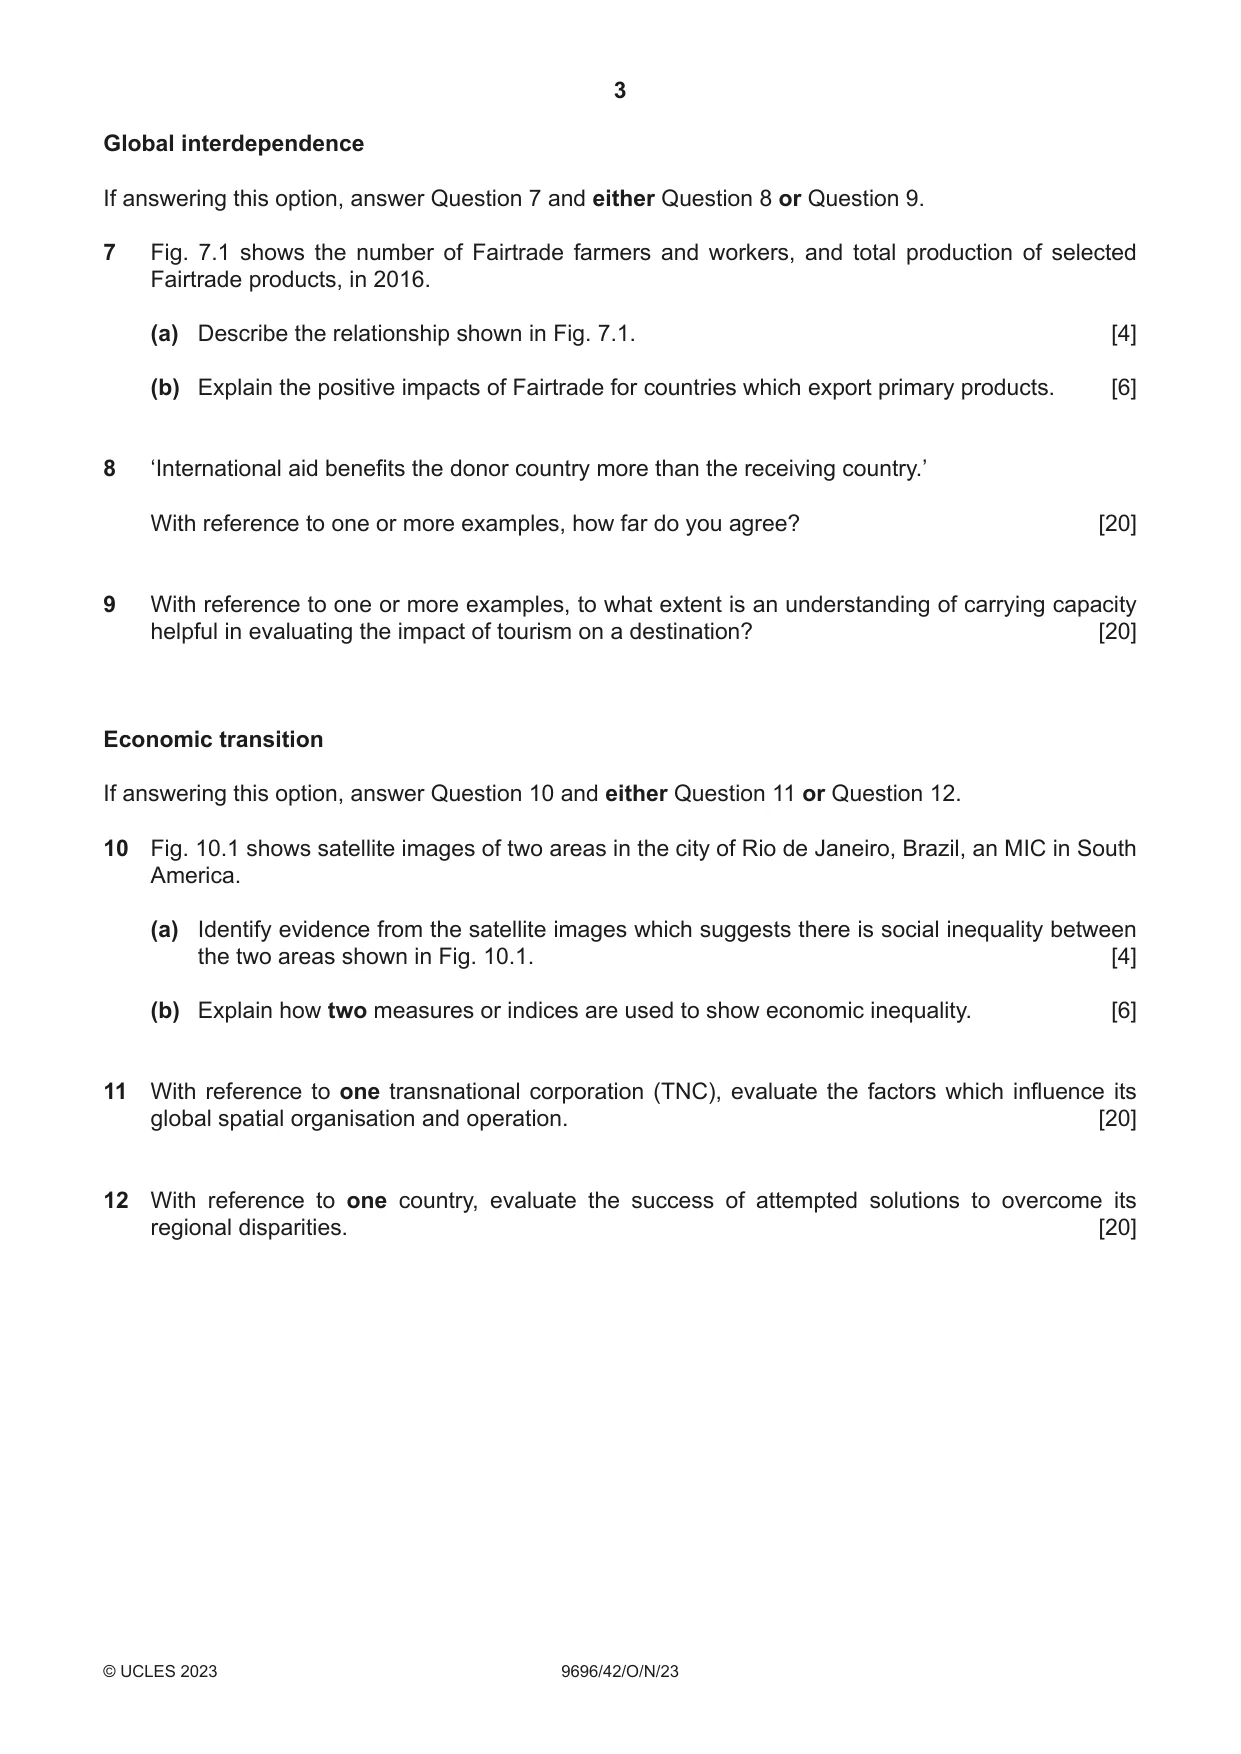
Question paper4 pages

Mark scheme27 pages
Answers below. Sit the paper first if you are practising.








Questions as text
Q1 · The share of agricultural land used for organic production and the consumption of organic…
1 Table 1.1 shows the share of agricultural land used for organic production and the consumption of organic produce per capita, for world regions, in 2017. (a) Compare the share of agricultural land used for organic production with the consumption of organic produce per capita for the world regions shown in Table 1.1. [4] (b) Explain how two social factors influence agricultural land use and practices on farms. [6]
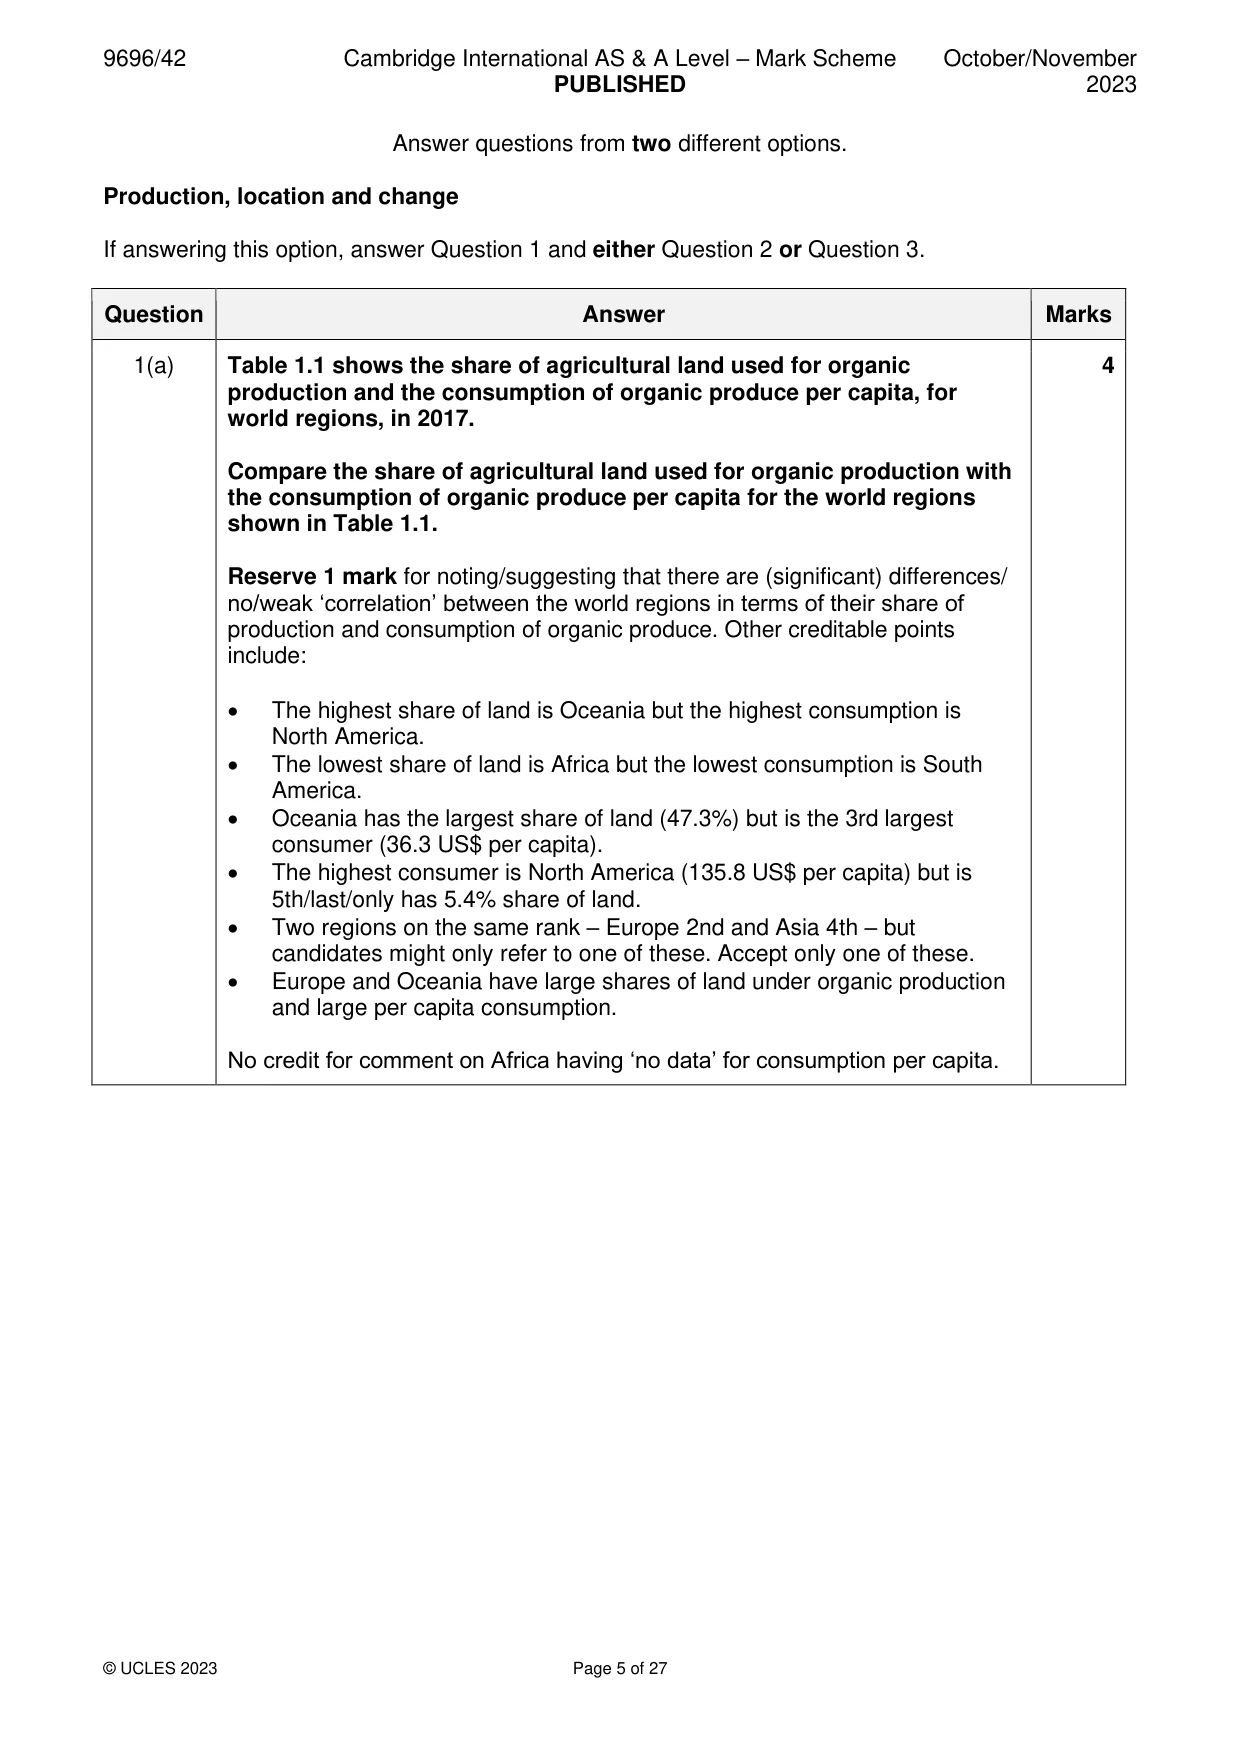
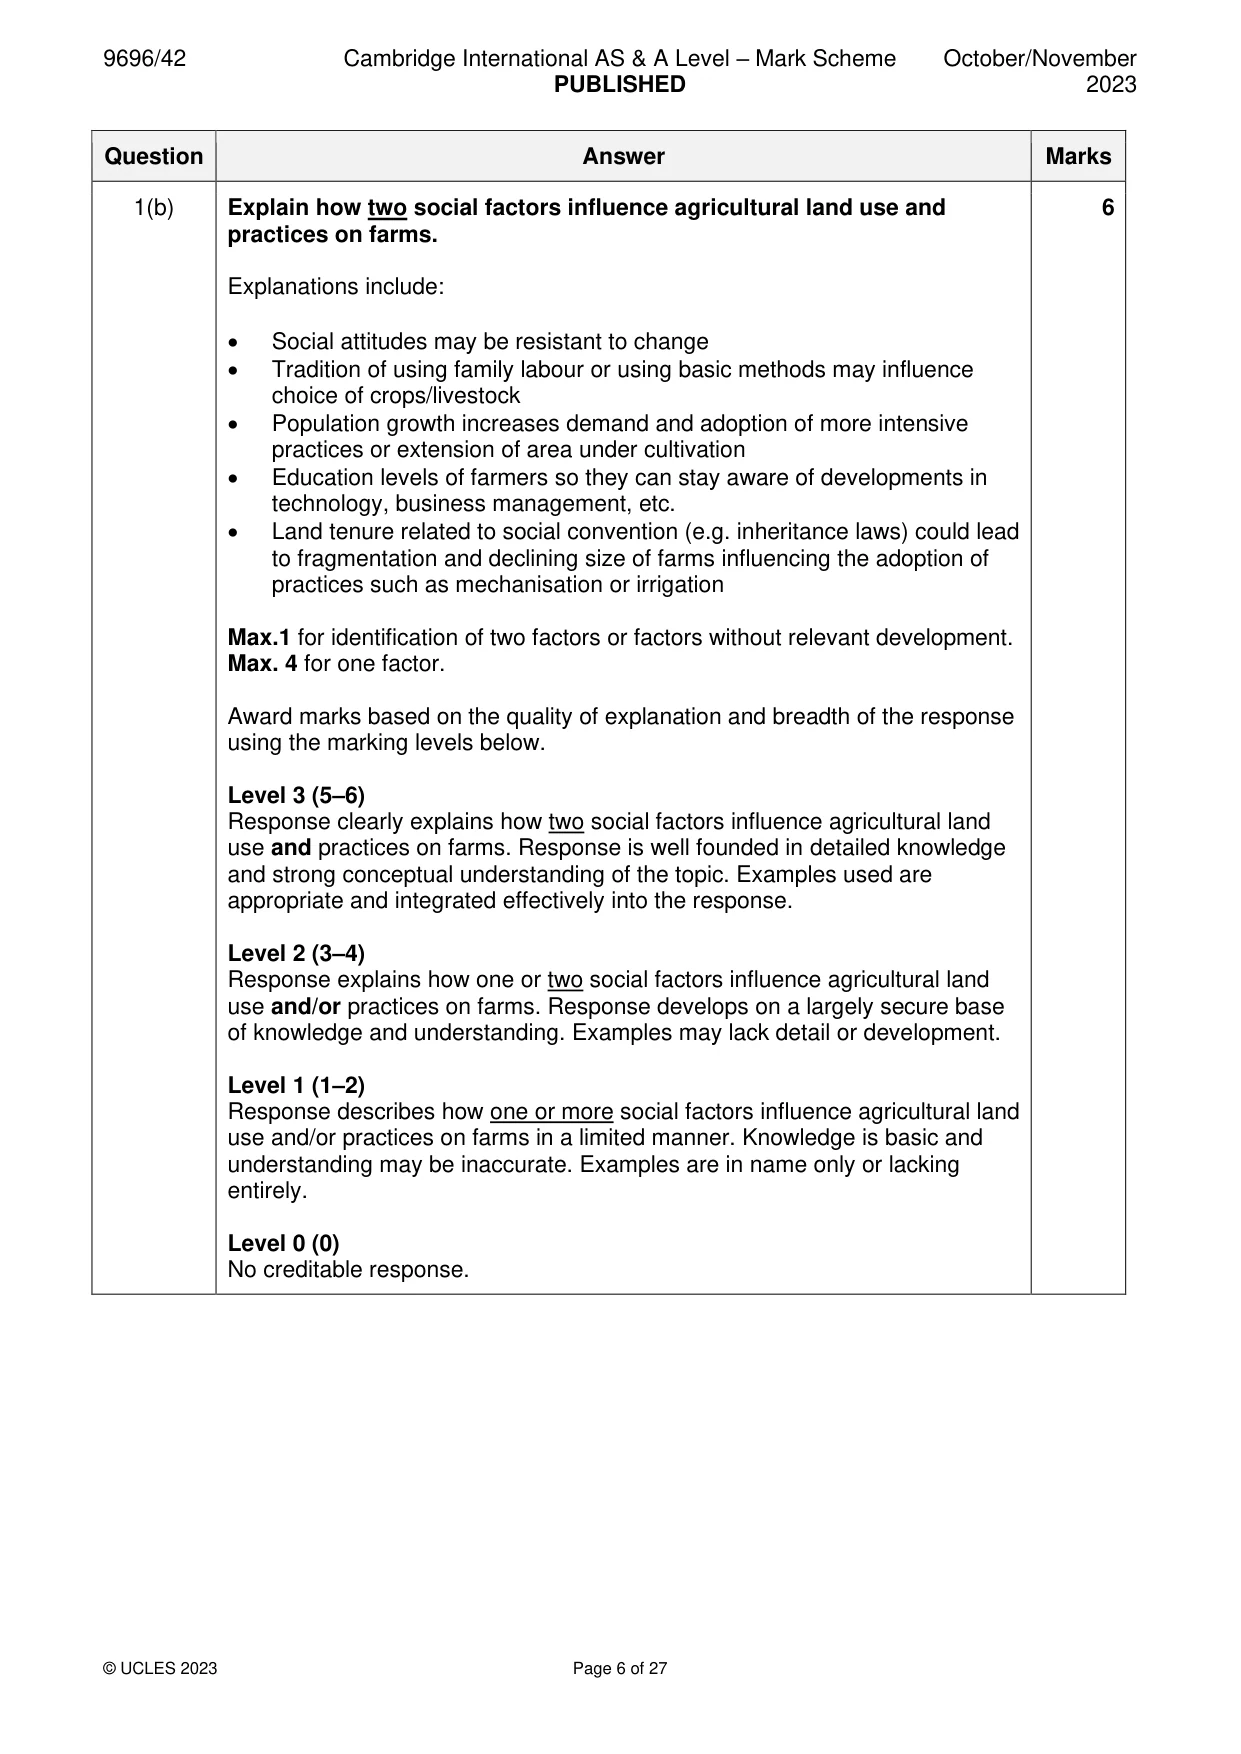
Mark scheme: Question Answer Marks 1(a) Table 1.1 shows the share of agricultural land used for organic 4 production and the consumption of organic produce per capita, for world regions, in 2017. Compare the share of agricultural land used for organic production with the consumption of organic produce per capita for the world regions shown in Table 1.1. Reserve 1 mark for noting/suggesting that there are (significant) differences/ no/weak ‘correlation’ between the world regions in terms of their share of production and consumption of organic produce. Other creditable points include: • The highest share of land is Oceania but the highest consumption is North America. • The lowest share of land is Africa but the lowest consumption is South America. • Oceania has the largest share of land (47.3%) but is the 3rd largest consumer (36.3 US$ per capita). • The highest consumer is North America (135.8 US$ per capita) but is 5th/last/only has 5.4% share of land. • Two regions on the same rank – Europe 2nd and Asia 4th – but candidates might only refer to one of these. Accept only one of these. • Europe and Oceania have large shares of land under organic production and large per capita consumption. No credit for comment on Africa having ‘no data’ for consumption per capita. 1(b) Explain how two social factors influence agricultural land use and 6 practices on farms. Explanations include: • Social attitudes may be resistant to change • Tradition of using family labour or using basic methods may influence choice of crops/livestock • Population growth increases demand and adoption of more intensive practices or extension of area under cultivation • Education levels of farmers so they can stay aware of developments in technology, business management, etc. • Land tenure related to social convention (e.g. inheritance laws) could lead to fragmentation and declining size of farms influencing the adoption of practices such as mechanisation or irrigation Max.1 for identification of two factors or factors without relevant development. Max. 4 for one factor. Award marks based on the quality of explanation and breadth of the response using the marking levels below. Level 3 (5–6) Response clearly explains how two social factors influence agricultural land use and practices on farms. Response is well founded in detailed knowledge and strong conceptual understanding of the topic. Examples used are appropriate and integrated effectively into the response. Level 2 (3–4) Response explains how one or two social factors influence agricultural land use and/or practices on farms. Response develops on a largely secure base of knowledge and understanding. Examples may lack detail or development. Level 1 (1–2) Response describes how one or more social factors influence agricultural land use and/or practices on farms in a limited manner. Knowledge is basic and understanding may be inaccurate. Examples are in name only or lacking entirely. Level 0 (0) No creditable response.
Q2 · ‘Agricultural productivity in intensive systems is always greater than in extensive…
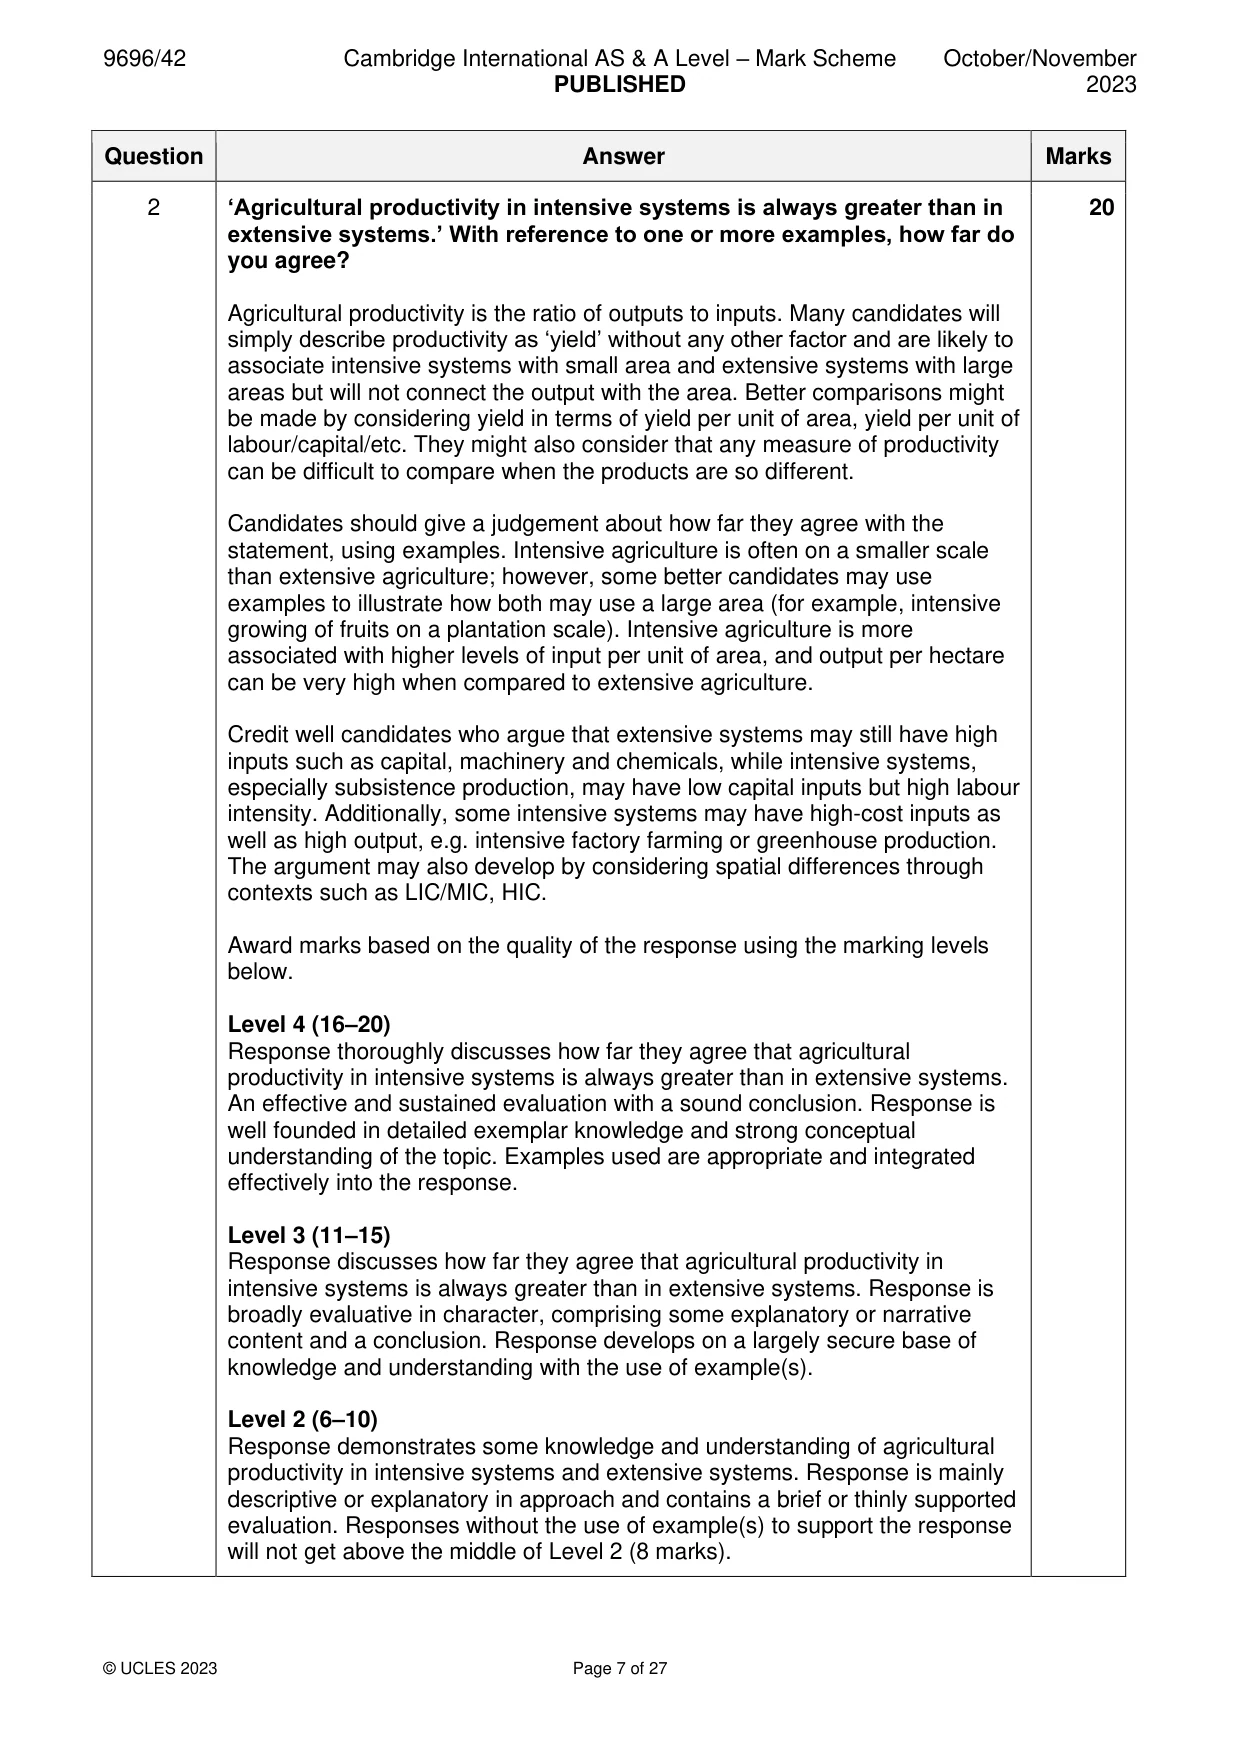
2 ‘Agricultural productivity in intensive systems is always greater than in extensive systems.’ With reference to one or more examples, how far do you agree? [20]
Mark scheme: 2 ‘Agricultural productivity in intensive systems is always greater than in 20 extensive systems.’ With reference to one or more examples, how far do you agree? Agricultural productivity is the ratio of outputs to inputs. Many candidates will simply describe productivity as ‘yield’ without any other factor and are likely to associate intensive systems with small area and extensive systems with large areas but will not connect the output with the area. Better comparisons might be made by considering yield in terms of yield per unit of area, yield per unit of labour/capital/etc. They might also consider that any measure of productivity can be difficult to compare when the products are so different. Candidates should give a judgement about how far they agree with the statement, using examples. Intensive agriculture is often on a smaller scale than extensive agriculture; however, some better candidates may use examples to illustrate how both may use a large area (for example, intensive growing of fruits on a plantation scale). Intensive agriculture is more associated with higher levels of input per unit of area, and output per hectare can be very high when compared to extensive agriculture. Credit well candidates who argue that extensive systems may still have high inputs such as capital, machinery and chemicals, while intensive systems, especially subsistence production, may have low capital inputs but high labour intensity. Additionally, some intensive systems may have high-cost inputs as well as high output, e.g. intensive factory farming or greenhouse production. The argument may also develop by considering spatial differences through contexts such as LIC/MIC, HIC. Award marks based on the quality of the response using the marking levels below. Level 4 (16–20) Response thoroughly discusses how far they agree that agricultural productivity in intensive systems is always greater than in extensive systems. An effective and sustained evaluation with a sound conclusion. Response is well founded in detailed exemplar knowledge and strong conceptual understanding of the topic. Examples used are appropriate and integrated effectively into the response. Level 3 (11–15) Response discusses how far they agree that agricultural productivity in intensive systems is always greater than in extensive systems. Response is broadly evaluative in character, comprising some explanatory or narrative content and a conclusion. Response develops on a largely secure base of knowledge and understanding with the use of example(s). Level 2 (6–10) Response demonstrates some knowledge and understanding of agricultural productivity in intensive systems and extensive systems. Response is mainly descriptive or explanatory in approach and contains a brief or thinly supported evaluation. Responses without the use of example(s) to support the response will not get above the middle of Level 2 (8 marks). 2 Level 1 (1–5) Response makes a few general points about intensive and/or extensive systems. A descriptive response comprising a few simple points. Knowledge is basic and understanding may be poor and lack relevance to the question set. Level 0 (0) No creditable response.
Q3 · With reference to one country’s management of change in manufacturing industry, assess…
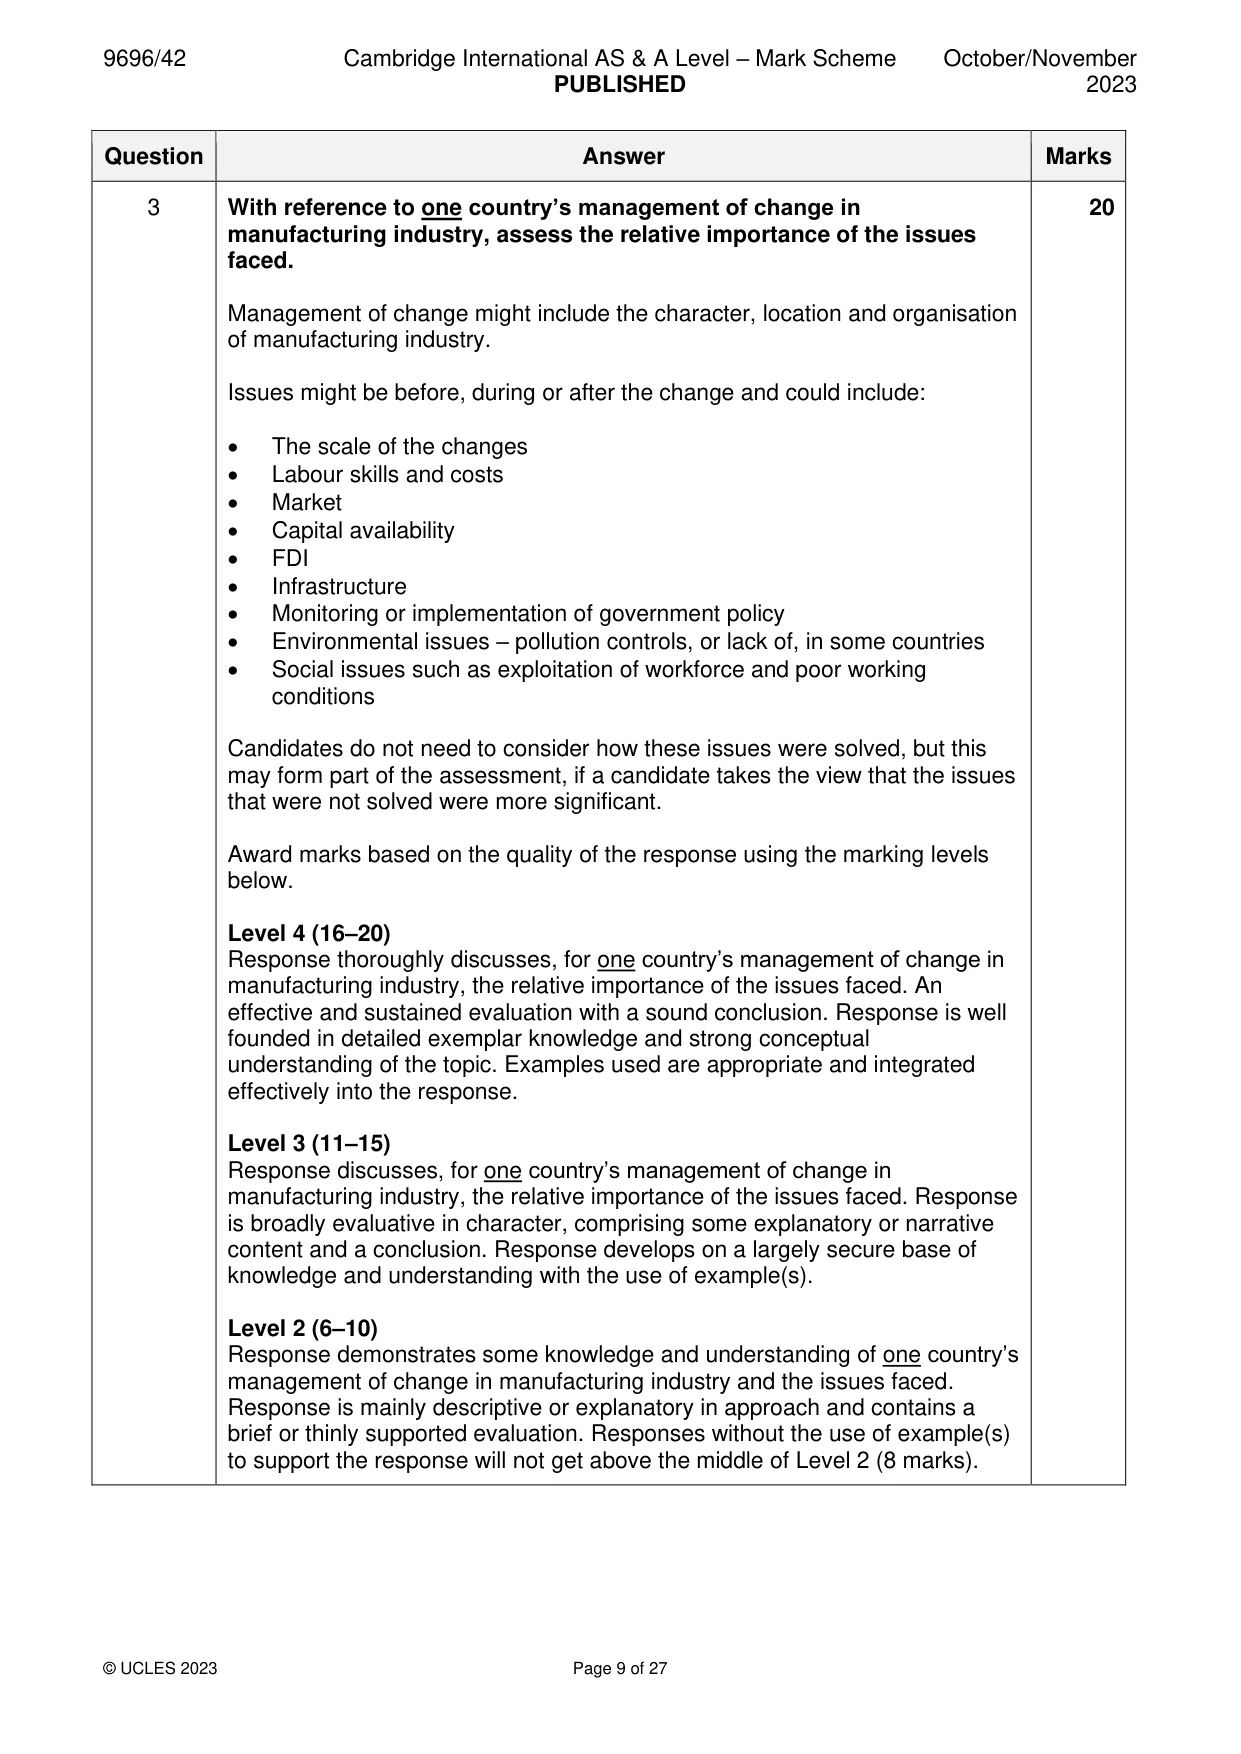
3 With reference to one country’s management of change in manufacturing industry, assess the relative importance of the issues faced. [20] Environmental management If answering this option, answer Question 4 and either Question 5 or Question 6.
Mark scheme: 3 With reference to one country’s management of change in 20 manufacturing industry, assess the relative importance of the issues faced. Management of change might include the character, location and organisation of manufacturing industry. Issues might be before, during or after the change and could include: • The scale of the changes • Labour skills and costs • Market • Capital availability • FDI • Infrastructure • Monitoring or implementation of government policy • Environmental issues – pollution controls, or lack of, in some countries • Social issues such as exploitation of workforce and poor working conditions Candidates do not need to consider how these issues were solved, but this may form part of the assessment, if a candidate takes the view that the issues that were not solved were more significant. Award marks based on the quality of the response using the marking levels below. Level 4 (16–20) Response thoroughly discusses, for one country’s management of change in manufacturing industry, the relative importance of the issues faced. An effective and sustained evaluation with a sound conclusion. Response is well founded in detailed exemplar knowledge and strong conceptual understanding of the topic. Examples used are appropriate and integrated effectively into the response. Level 3 (11–15) Response discusses, for one country’s management of change in manufacturing industry, the relative importance of the issues faced. Response is broadly evaluative in character, comprising some explanatory or narrative content and a conclusion. Response develops on a largely secure base of knowledge and understanding with the use of example(s). Level 2 (6–10) Response demonstrates some knowledge and understanding of one country’s management of change in manufacturing industry and the issues faced. Response is mainly descriptive or explanatory in approach and contains a brief or thinly supported evaluation. Responses without the use of example(s) to support the response will not get above the middle of Level 2 (8 marks). 3 Level 1 (1–5) Response makes a few general points about one country’s management of change in manufacturing industry and/or the issues faced. A descriptive response comprising a few simple points. Knowledge is basic and understanding may be poor and lack relevance to the question set. Level 0 (0) No creditable response. Environmental management If answering this option, answer Question 4 and either Question 5 or Question 6.
Q4 · The proportion of Key Biodiversity Areas (KBAs) covered by protected area status, by…
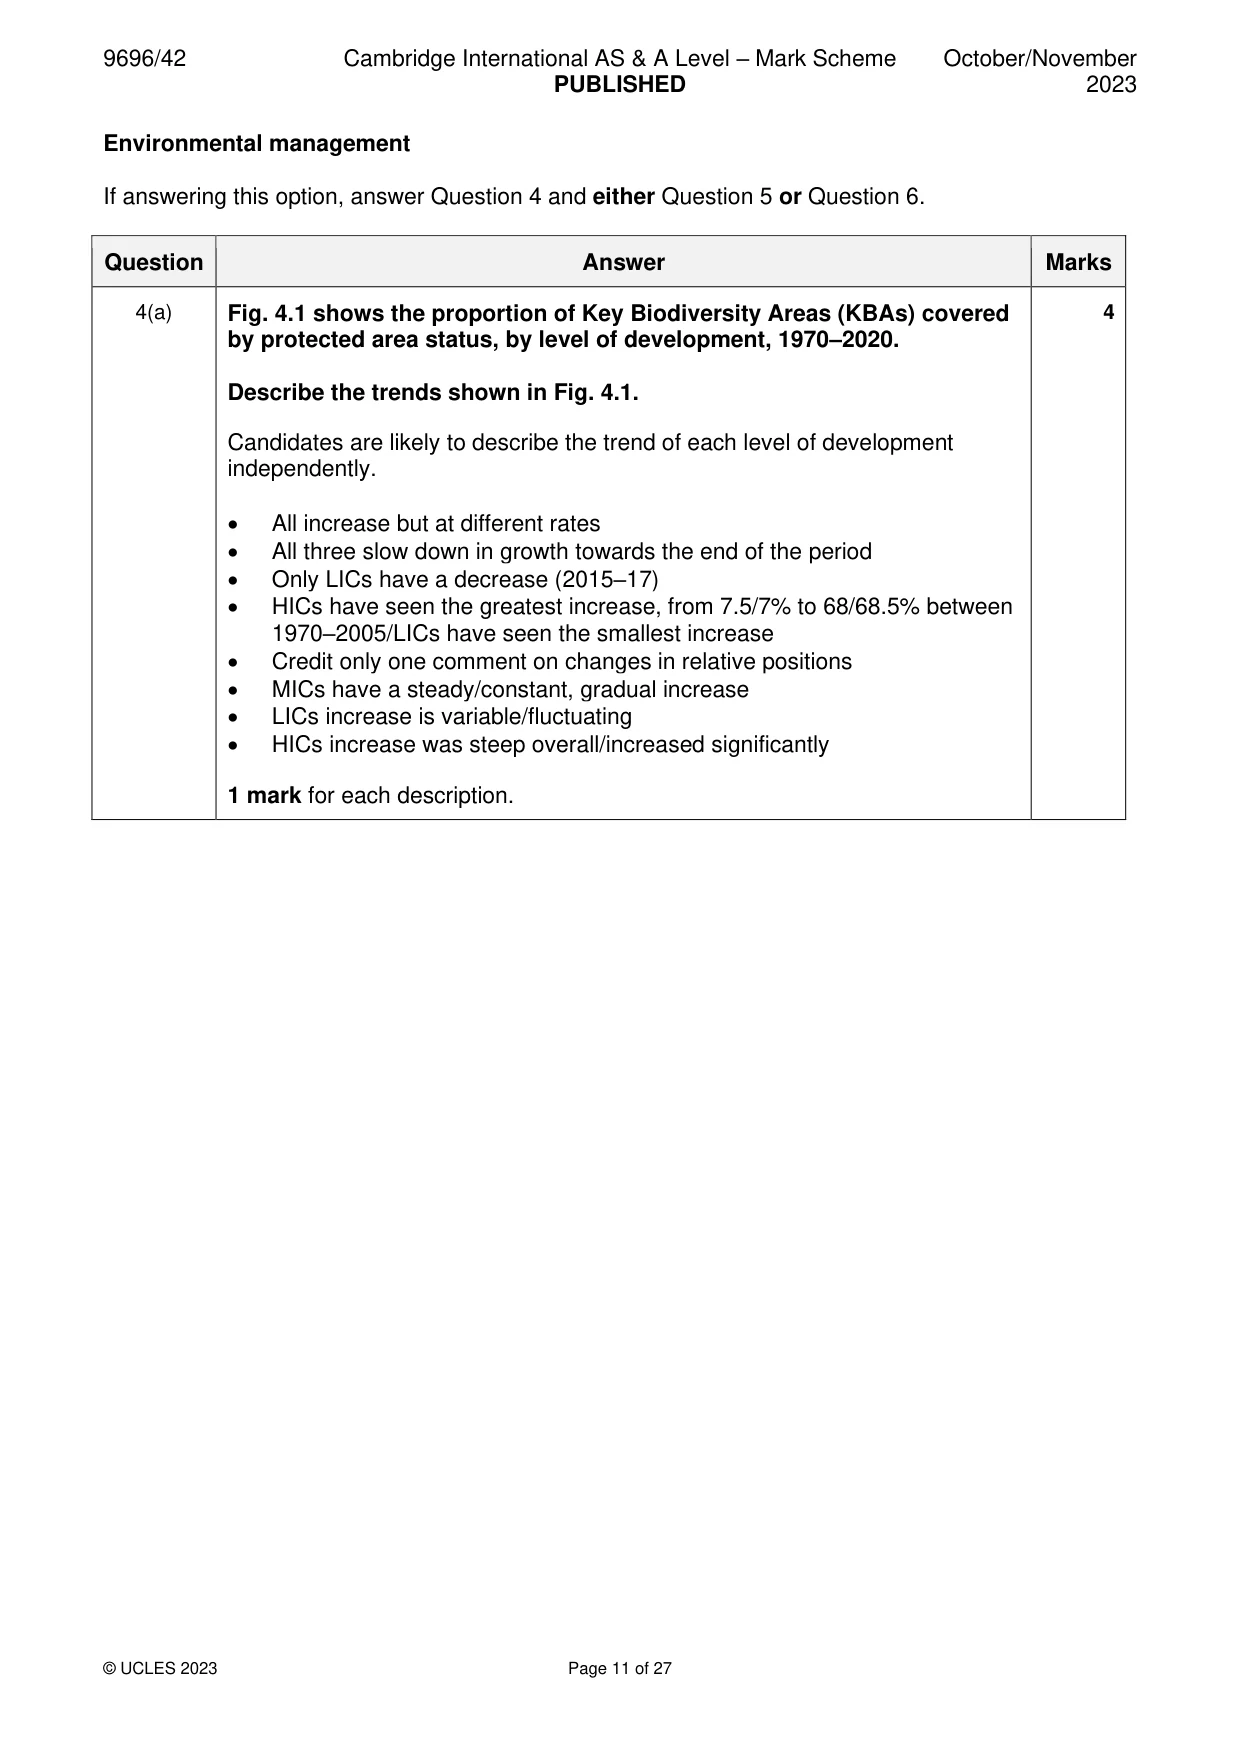
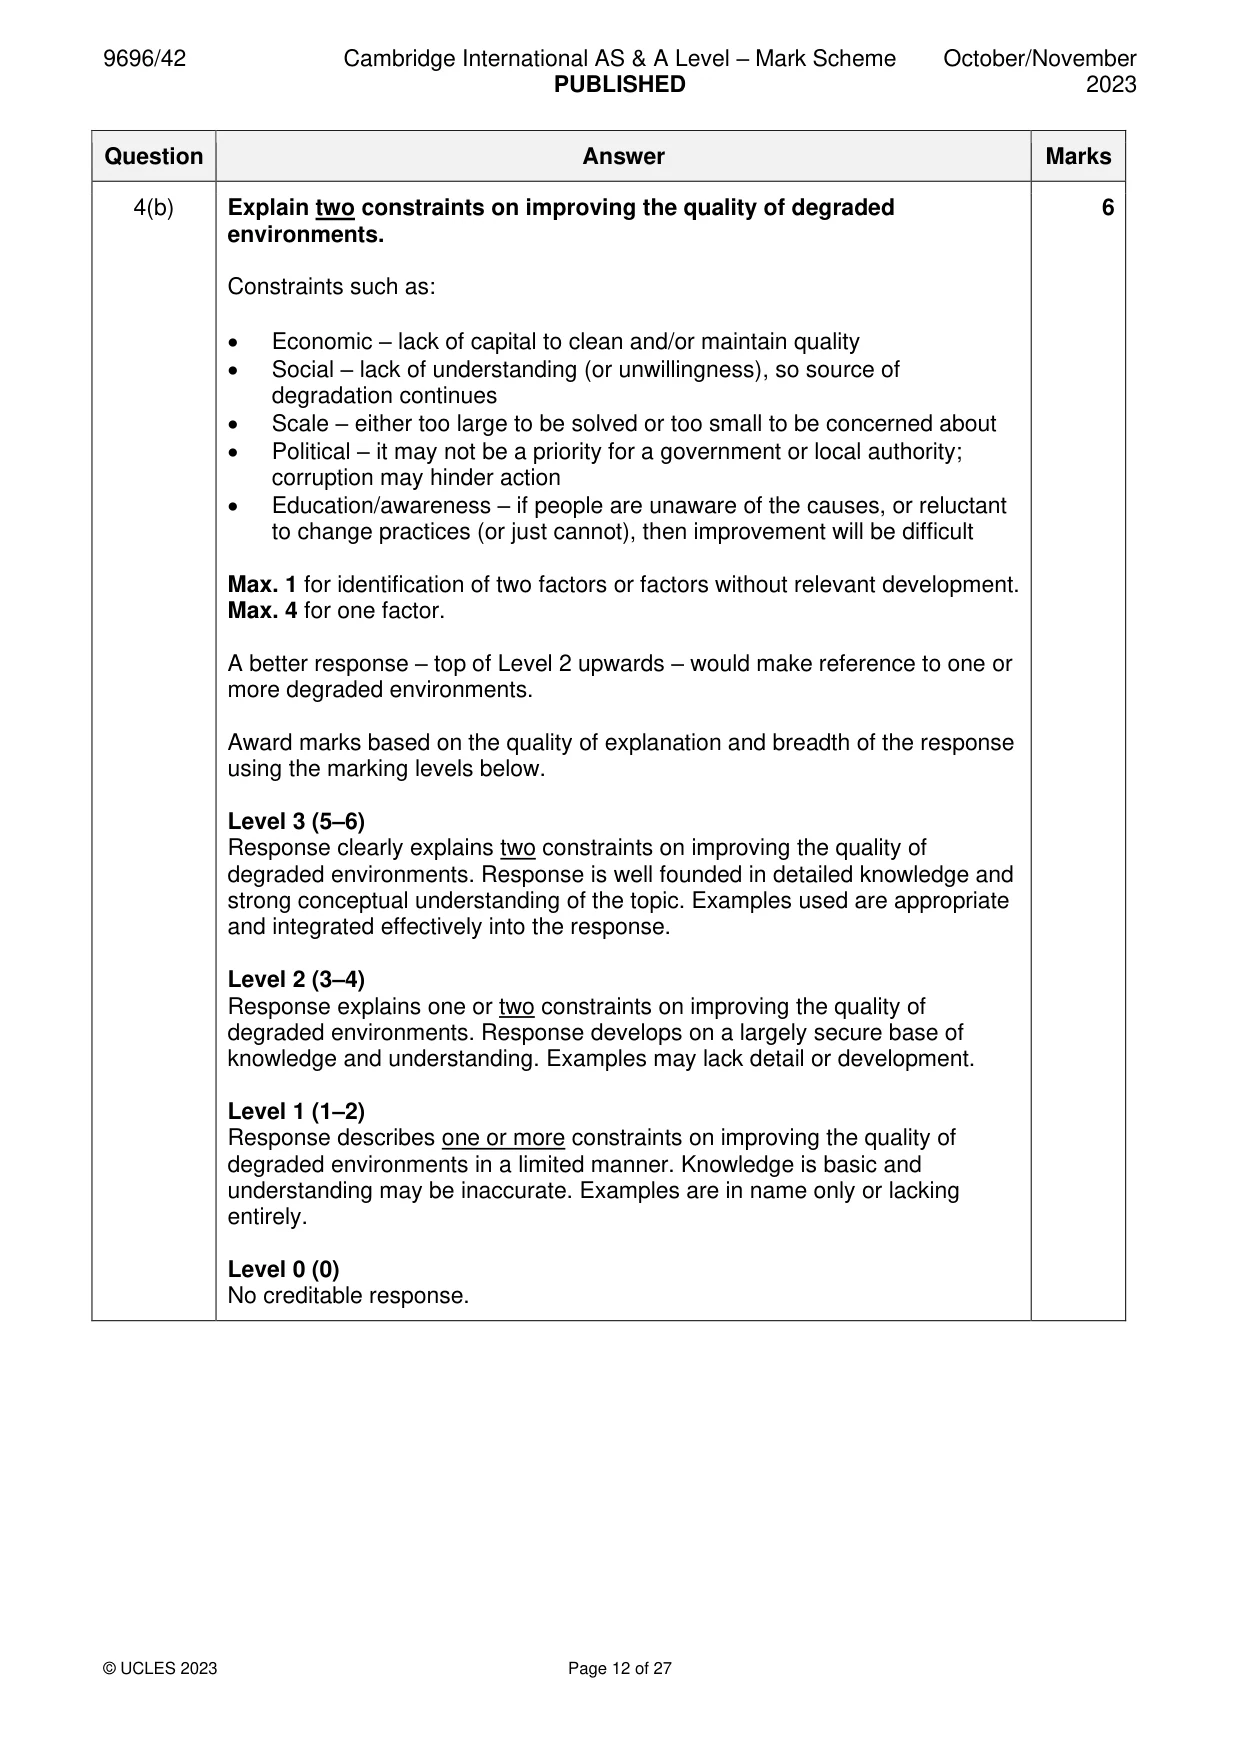
4 Fig. 4.1 shows the proportion of Key Biodiversity Areas (KBAs) covered by protected area status, by level of development, 1970–2020. (a) Describe the trends shown in Fig. 4.1. [4] (b) Explain two constraints on improving the quality of degraded environments. [6]
Mark scheme: 4(a) Fig. 4.1 shows the proportion of Key Biodiversity Areas (KBAs) covered 4 by protected area status, by level of development, 1970–2020. Describe the trends shown in Fig. 4.1. Candidates are likely to describe the trend of each level of development independently. • All increase but at different rates • All three slow down in growth towards the end of the period • Only LICs have a decrease (2015–17) • HICs have seen the greatest increase, from 7.5/7% to 68/68.5% between 1970–2005/LICs have seen the smallest increase • Credit only one comment on changes in relative positions • MICs have a steady/constant, gradual increase • LICs increase is variable/fluctuating • HICs increase was steep overall/increased significantly 1 mark for each description. 4(b) Explain two constraints on improving the quality of degraded 6 environments. Constraints such as: • Economic – lack of capital to clean and/or maintain quality • Social – lack of understanding (or unwillingness), so source of degradation continues • Scale – either too large to be solved or too small to be concerned about • Political – it may not be a priority for a government or local authority; corruption may hinder action • Education/awareness – if people are unaware of the causes, or reluctant to change practices (or just cannot), then improvement will be difficult Max. 1 for identification of two factors or factors without relevant development. Max. 4 for one factor. A better response – top of Level 2 upwards – would make reference to one or more degraded environments. Award marks based on the quality of explanation and breadth of the response using the marking levels below. Level 3 (5–6) Response clearly explains two constraints on improving the quality of degraded environments. Response is well founded in detailed knowledge and strong conceptual understanding of the topic. Examples used are appropriate and integrated effectively into the response. Level 2 (3–4) Response explains one or two constraints on improving the quality of degraded environments. Response develops on a largely secure base of knowledge and understanding. Examples may lack detail or development. Level 1 (1–2) Response describes one or more constraints on improving the quality of degraded environments in a limited manner. Knowledge is basic and understanding may be inaccurate. Examples are in name only or lacking entirely. Level 0 (0) No creditable response.
Q5 · Evaluate the extent to which energy consumption by MICs has become a global issue
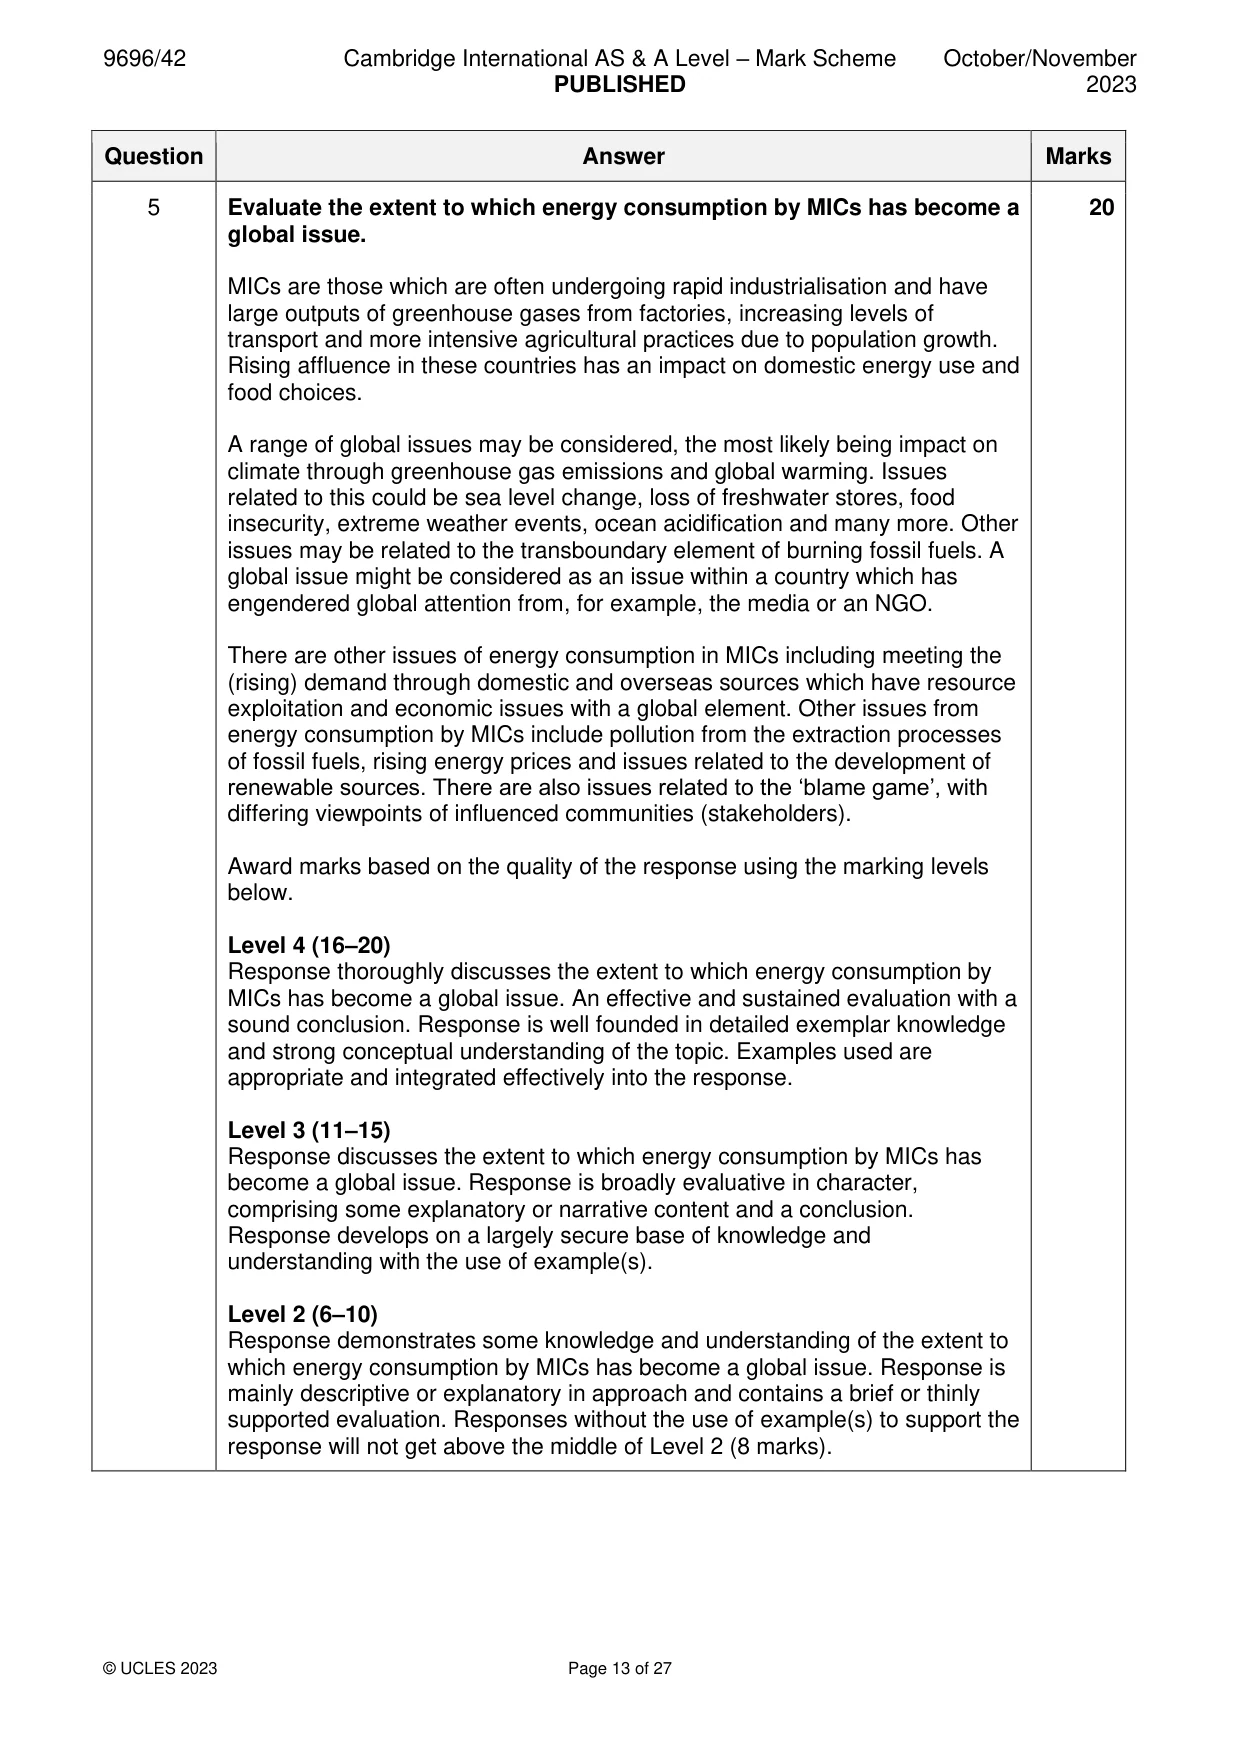
5 Evaluate the extent to which energy consumption by MICs has become a global issue. [20]
Mark scheme: 5 Evaluate the extent to which energy consumption by MICs has become a 20 global issue. MICs are those which are often undergoing rapid industrialisation and have large outputs of greenhouse gases from factories, increasing levels of transport and more intensive agricultural practices due to population growth. Rising affluence in these countries has an impact on domestic energy use and food choices. A range of global issues may be considered, the most likely being impact on climate through greenhouse gas emissions and global warming. Issues related to this could be sea level change, loss of freshwater stores, food insecurity, extreme weather events, ocean acidification and many more. Other issues may be related to the transboundary element of burning fossil fuels. A global issue might be considered as an issue within a country which has engendered global attention from, for example, the media or an NGO. There are other issues of energy consumption in MICs including meeting the (rising) demand through domestic and overseas sources which have resource exploitation and economic issues with a global element. Other issues from energy consumption by MICs include pollution from the extraction processes of fossil fuels, rising energy prices and issues related to the development of renewable sources. There are also issues related to the ‘blame game’, with differing viewpoints of influenced communities (stakeholders). Award marks based on the quality of the response using the marking levels below. Level 4 (16–20) Response thoroughly discusses the extent to which energy consumption by MICs has become a global issue. An effective and sustained evaluation with a sound conclusion. Response is well founded in detailed exemplar knowledge and strong conceptual understanding of the topic. Examples used are appropriate and integrated effectively into the response. Level 3 (11–15) Response discusses the extent to which energy consumption by MICs has become a global issue. Response is broadly evaluative in character, comprising some explanatory or narrative content and a conclusion. Response develops on a largely secure base of knowledge and understanding with the use of example(s). Level 2 (6–10) Response demonstrates some knowledge and understanding of the extent to which energy consumption by MICs has become a global issue. Response is mainly descriptive or explanatory in approach and contains a brief or thinly supported evaluation. Responses without the use of example(s) to support the response will not get above the middle of Level 2 (8 marks). 5 Level 1 (1–5) Response makes a few general points about energy consumption in MICs as a global issue. A descriptive response comprising a few simple points. Knowledge is basic and understanding may be poor and lack relevance to the question set. Level 0 (0) No creditable response.
Q6 · Evaluate the extent to which urbanisation is the main factor in the degradation of urban…
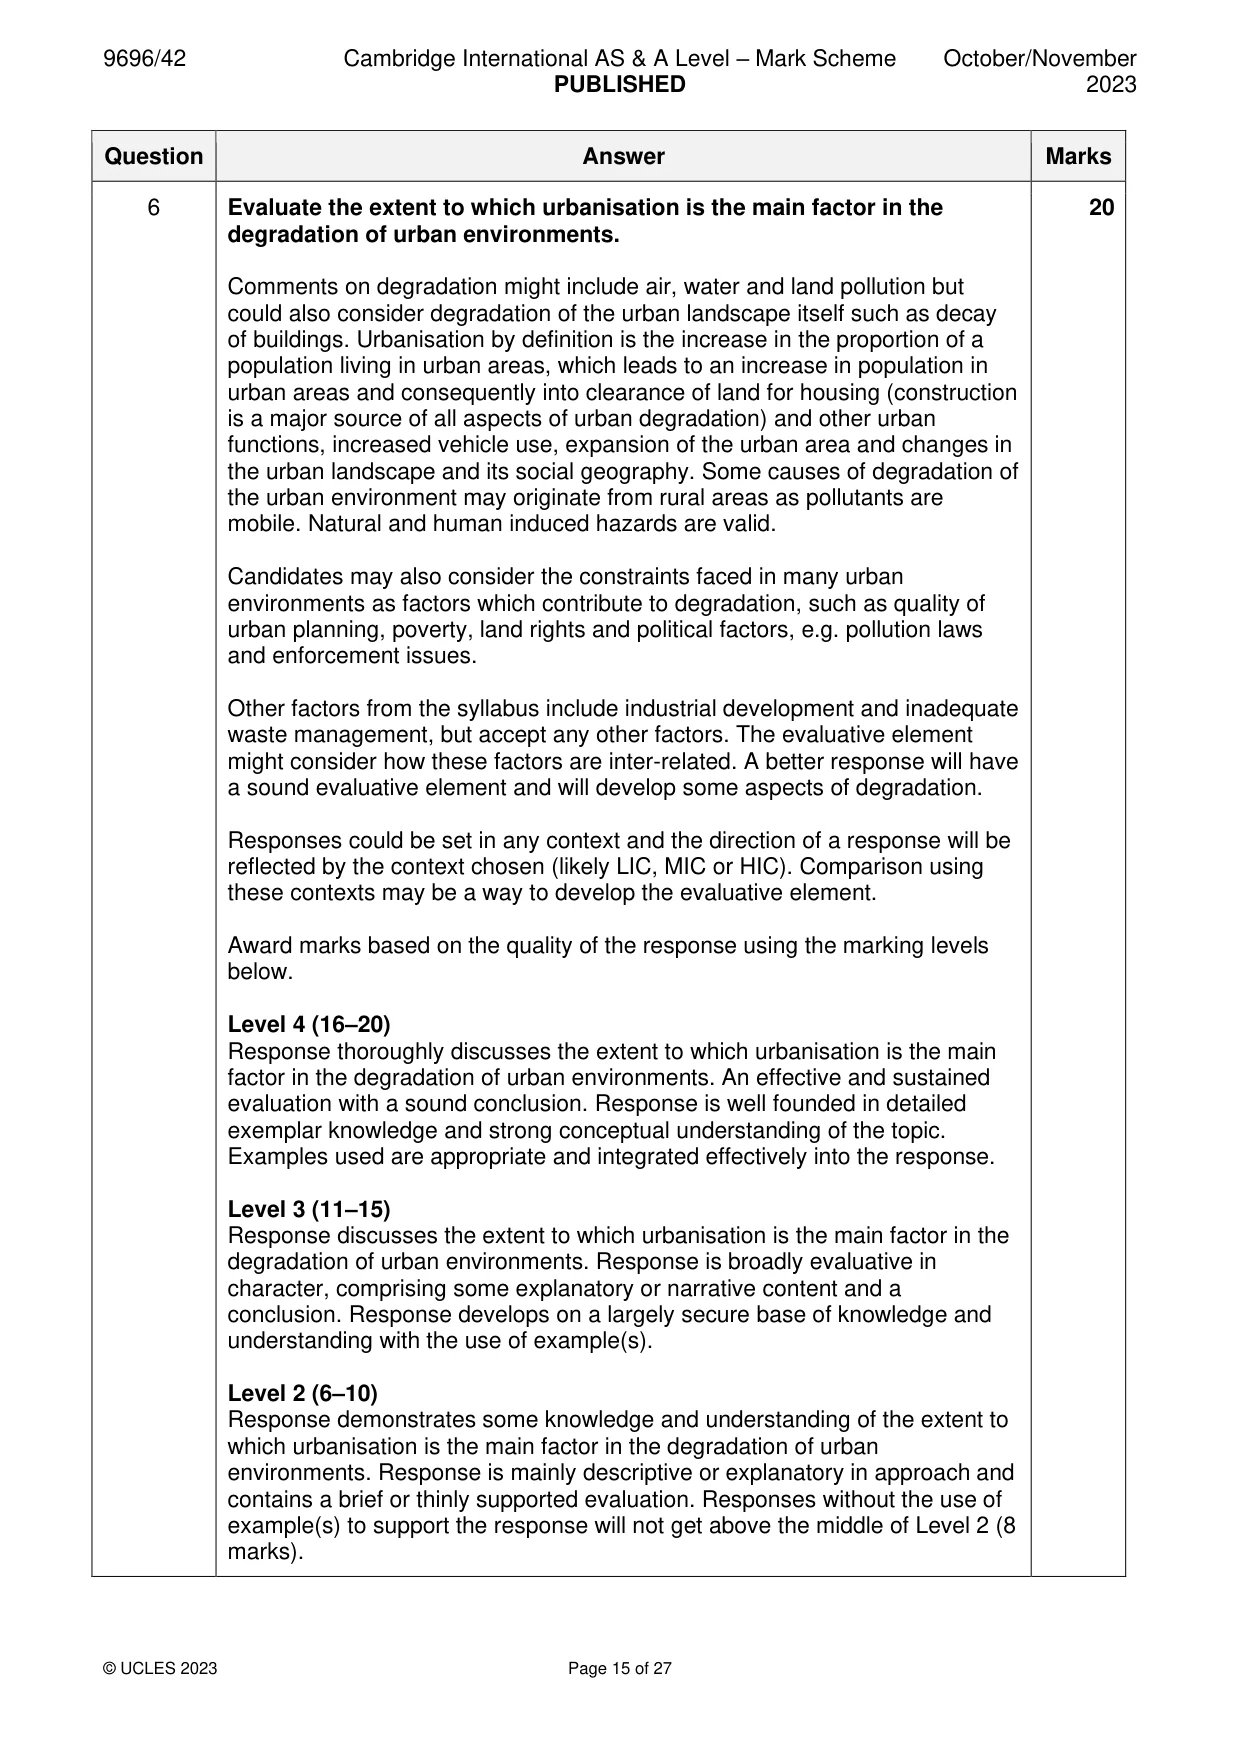
6 Evaluate the extent to which urbanisation is the main factor in the degradation of urban environments. [20] Global interdependence If answering this option, answer Question 7 and either Question 8 or Question 9.
Mark scheme: 6 Evaluate the extent to which urbanisation is the main factor in the 20 degradation of urban environments. Comments on degradation might include air, water and land pollution but could also consider degradation of the urban landscape itself such as decay of buildings. Urbanisation by definition is the increase in the proportion of a population living in urban areas, which leads to an increase in population in urban areas and consequently into clearance of land for housing (construction is a major source of all aspects of urban degradation) and other urban functions, increased vehicle use, expansion of the urban area and changes in the urban landscape and its social geography. Some causes of degradation of the urban environment may originate from rural areas as pollutants are mobile. Natural and human induced hazards are valid. Candidates may also consider the constraints faced in many urban environments as factors which contribute to degradation, such as quality of urban planning, poverty, land rights and political factors, e.g. pollution laws and enforcement issues. Other factors from the syllabus include industrial development and inadequate waste management, but accept any other factors. The evaluative element might consider how these factors are inter-related. A better response will have a sound evaluative element and will develop some aspects of degradation. Responses could be set in any context and the direction of a response will be reflected by the context chosen (likely LIC, MIC or HIC). Comparison using these contexts may be a way to develop the evaluative element. Award marks based on the quality of the response using the marking levels below. Level 4 (16–20) Response thoroughly discusses the extent to which urbanisation is the main factor in the degradation of urban environments. An effective and sustained evaluation with a sound conclusion. Response is well founded in detailed exemplar knowledge and strong conceptual understanding of the topic. Examples used are appropriate and integrated effectively into the response. Level 3 (11–15) Response discusses the extent to which urbanisation is the main factor in the degradation of urban environments. Response is broadly evaluative in character, comprising some explanatory or narrative content and a conclusion. Response develops on a largely secure base of knowledge and understanding with the use of example(s). Level 2 (6–10) Response demonstrates some knowledge and understanding of the extent to which urbanisation is the main factor in the degradation of urban environments. Response is mainly descriptive or explanatory in approach and contains a brief or thinly supported evaluation. Responses without the use of example(s) to support the response will not get above the middle of Level 2 (8 marks). 6 Level 1 (1–5) Response makes a few general points about urbanisation as a factor in the degradation of urban environments. A descriptive response comprising a few simple points. Knowledge is basic and understanding may be poor and lack relevance to the question set. Level 0 (0) No creditable response. Global interdependence If answering this option, answer Question 7 and either Question 8 or Question 9.
Q7 · The number of Fairtrade farmers and workers, and total production of selected Fairtrade…
7 Fig. 7.1 shows the number of Fairtrade farmers and workers, and total production of selected Fairtrade products, in 2016. (a) Describe the relationship shown in Fig. 7.1. [4] (b) Explain the positive impacts of Fairtrade for countries which export primary products. [6]
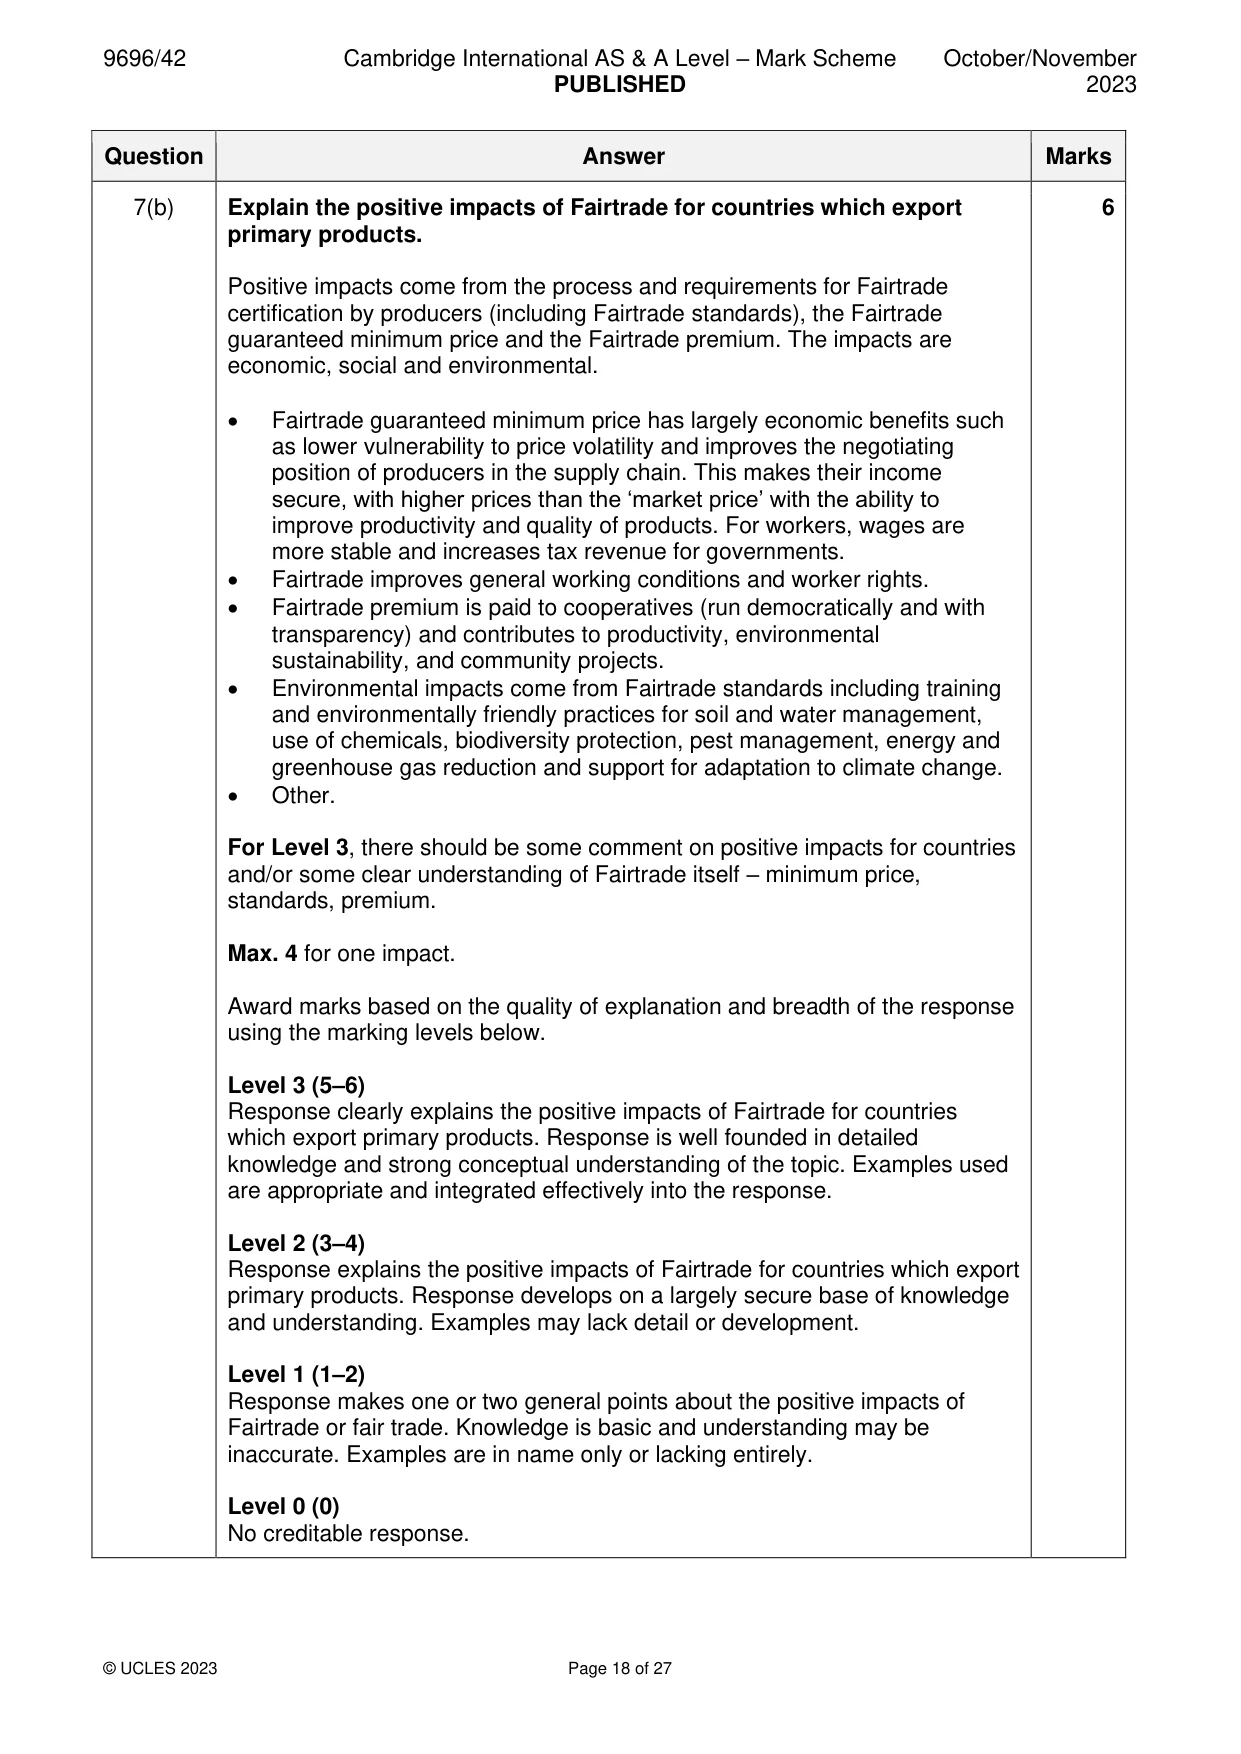
Mark scheme: 7(a) Fig. 7.1 shows the number of Fairtrade farmers and workers, and total 4 production of selected Fairtrade products, in 2016. Describe the relationship shown in Fig. 7.1. Reserve 1 mark for the idea that there is no clear relationship between number of workers and total production or there is some evidence of a positive relationship/and some evidence of a negative relationship. This relationship may be expressed with terms such as: less/more/higher/lower rather than positive/negative. Max. 1 mark for identifying a relationship for an individual product(s). 1 mark if a candidate argues that the number of pairs of data is too small to identify a relationship. Credit evidence for a stated relationship for 1 mark each, such as: • No relationship: bananas has smallest number of workers and highest production, but cotton has small numbers of both = no relationship • No relationship: coffee has a significantly higher number of workers (795 457) than any other product, but has a moderate total production (541 254) • No relationship: evidence of a positive relationship (cotton, coffee, cocoa and sugar) and a negative relationship (bananas, sugar, cocoa and tea) • There are insufficient pairs • Positive relationship: shown by cotton, tea and coffee (and arguably cocoa) • Negative relationship: between bananas, sugar and coffee or bananas, sugar, cocoa and tea • Anomalies: for either a positive or negative relationship 7(b) Explain the positive impacts of Fairtrade for countries which export 6 primary products. Positive impacts come from the process and requirements for Fairtrade certification by producers (including Fairtrade standards), the Fairtrade guaranteed minimum price and the Fairtrade premium. The impacts are economic, social and environmental. • Fairtrade guaranteed minimum price has largely economic benefits such as lower vulnerability to price volatility and improves the negotiating position of producers in the supply chain. This makes their income secure, with higher prices than the ‘market price’ with the ability to improve productivity and quality of products. For workers, wages are more stable and increases tax revenue for governments. • Fairtrade improves general working conditions and worker rights. • Fairtrade premium is paid to cooperatives (run democratically and with transparency) and contributes to productivity, environmental sustainability, and community projects. • Environmental impacts come from Fairtrade standards including training and environmentally friendly practices for soil and water management, use of chemicals, biodiversity protection, pest management, energy and greenhouse gas reduction and support for adaptation to climate change. • Other. For Level 3, there should be some comment on positive impacts for countries and/or some clear understanding of Fairtrade itself – minimum price, standards, premium. Max. 4 for one impact. Award marks based on the quality of explanation and breadth of the response using the marking levels below. Level 3 (5–6) Response clearly explains the positive impacts of Fairtrade for countries which export primary products. Response is well founded in detailed knowledge and strong conceptual understanding of the topic. Examples used are appropriate and integrated effectively into the response. Level 2 (3–4) Response explains the positive impacts of Fairtrade for countries which export primary products. Response develops on a largely secure base of knowledge and understanding. Examples may lack detail or development. Level 1 (1–2) Response makes one or two general points about the positive impacts of Fairtrade or fair trade. Knowledge is basic and understanding may be inaccurate. Examples are in name only or lacking entirely. Level 0 (0) No creditable response.
Q8 · ‘International aid benefits the donor country more than the receiving country.’ With…
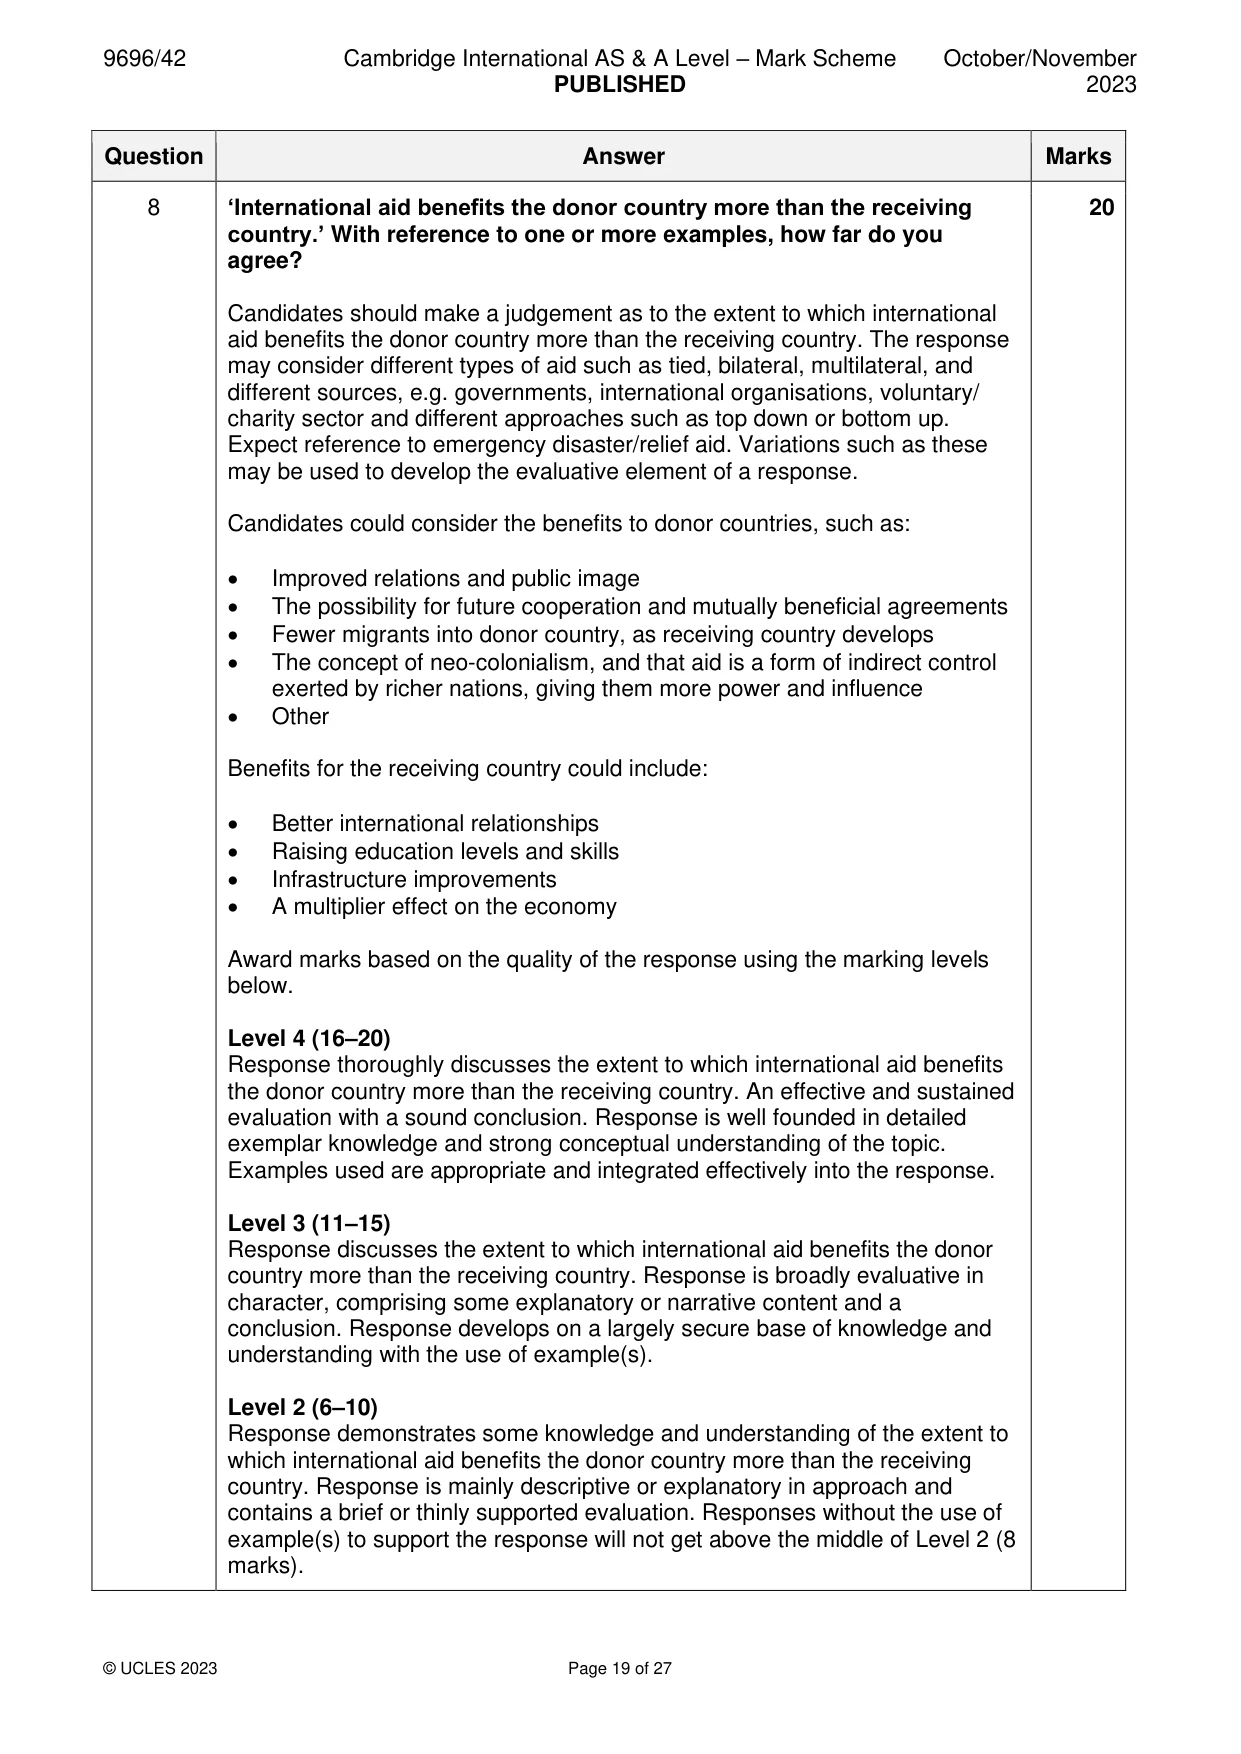
8 ‘International aid benefits the donor country more than the receiving country.’ With reference to one or more examples, how far do you agree? [20]
Mark scheme: 8 ‘International aid benefits the donor country more than the receiving 20 country.’ With reference to one or more examples, how far do you agree? Candidates should make a judgement as to the extent to which international aid benefits the donor country more than the receiving country. The response may consider different types of aid such as tied, bilateral, multilateral, and different sources, e.g. governments, international organisations, voluntary/ charity sector and different approaches such as top down or bottom up. Expect reference to emergency disaster/relief aid. Variations such as these may be used to develop the evaluative element of a response. Candidates could consider the benefits to donor countries, such as: • Improved relations and public image • The possibility for future cooperation and mutually beneficial agreements • Fewer migrants into donor country, as receiving country develops • The concept of neo-colonialism, and that aid is a form of indirect control exerted by richer nations, giving them more power and influence • Other Benefits for the receiving country could include: • Better international relationships • Raising education levels and skills • Infrastructure improvements • A multiplier effect on the economy Award marks based on the quality of the response using the marking levels below. Level 4 (16–20) Response thoroughly discusses the extent to which international aid benefits the donor country more than the receiving country. An effective and sustained evaluation with a sound conclusion. Response is well founded in detailed exemplar knowledge and strong conceptual understanding of the topic. Examples used are appropriate and integrated effectively into the response. Level 3 (11–15) Response discusses the extent to which international aid benefits the donor country more than the receiving country. Response is broadly evaluative in character, comprising some explanatory or narrative content and a conclusion. Response develops on a largely secure base of knowledge and understanding with the use of example(s). Level 2 (6–10) Response demonstrates some knowledge and understanding of the extent to which international aid benefits the donor country more than the receiving country. Response is mainly descriptive or explanatory in approach and contains a brief or thinly supported evaluation. Responses without the use of example(s) to support the response will not get above the middle of Level 2 (8 marks). 8 Level 1 (1–5) Response makes a few general points about international aid and whether it benefits the donor country and/or receiving country. A descriptive response comprising a few simple points. Knowledge is basic and understanding may be poor and lack relevance to the question set. Level 0 (0) No creditable response.
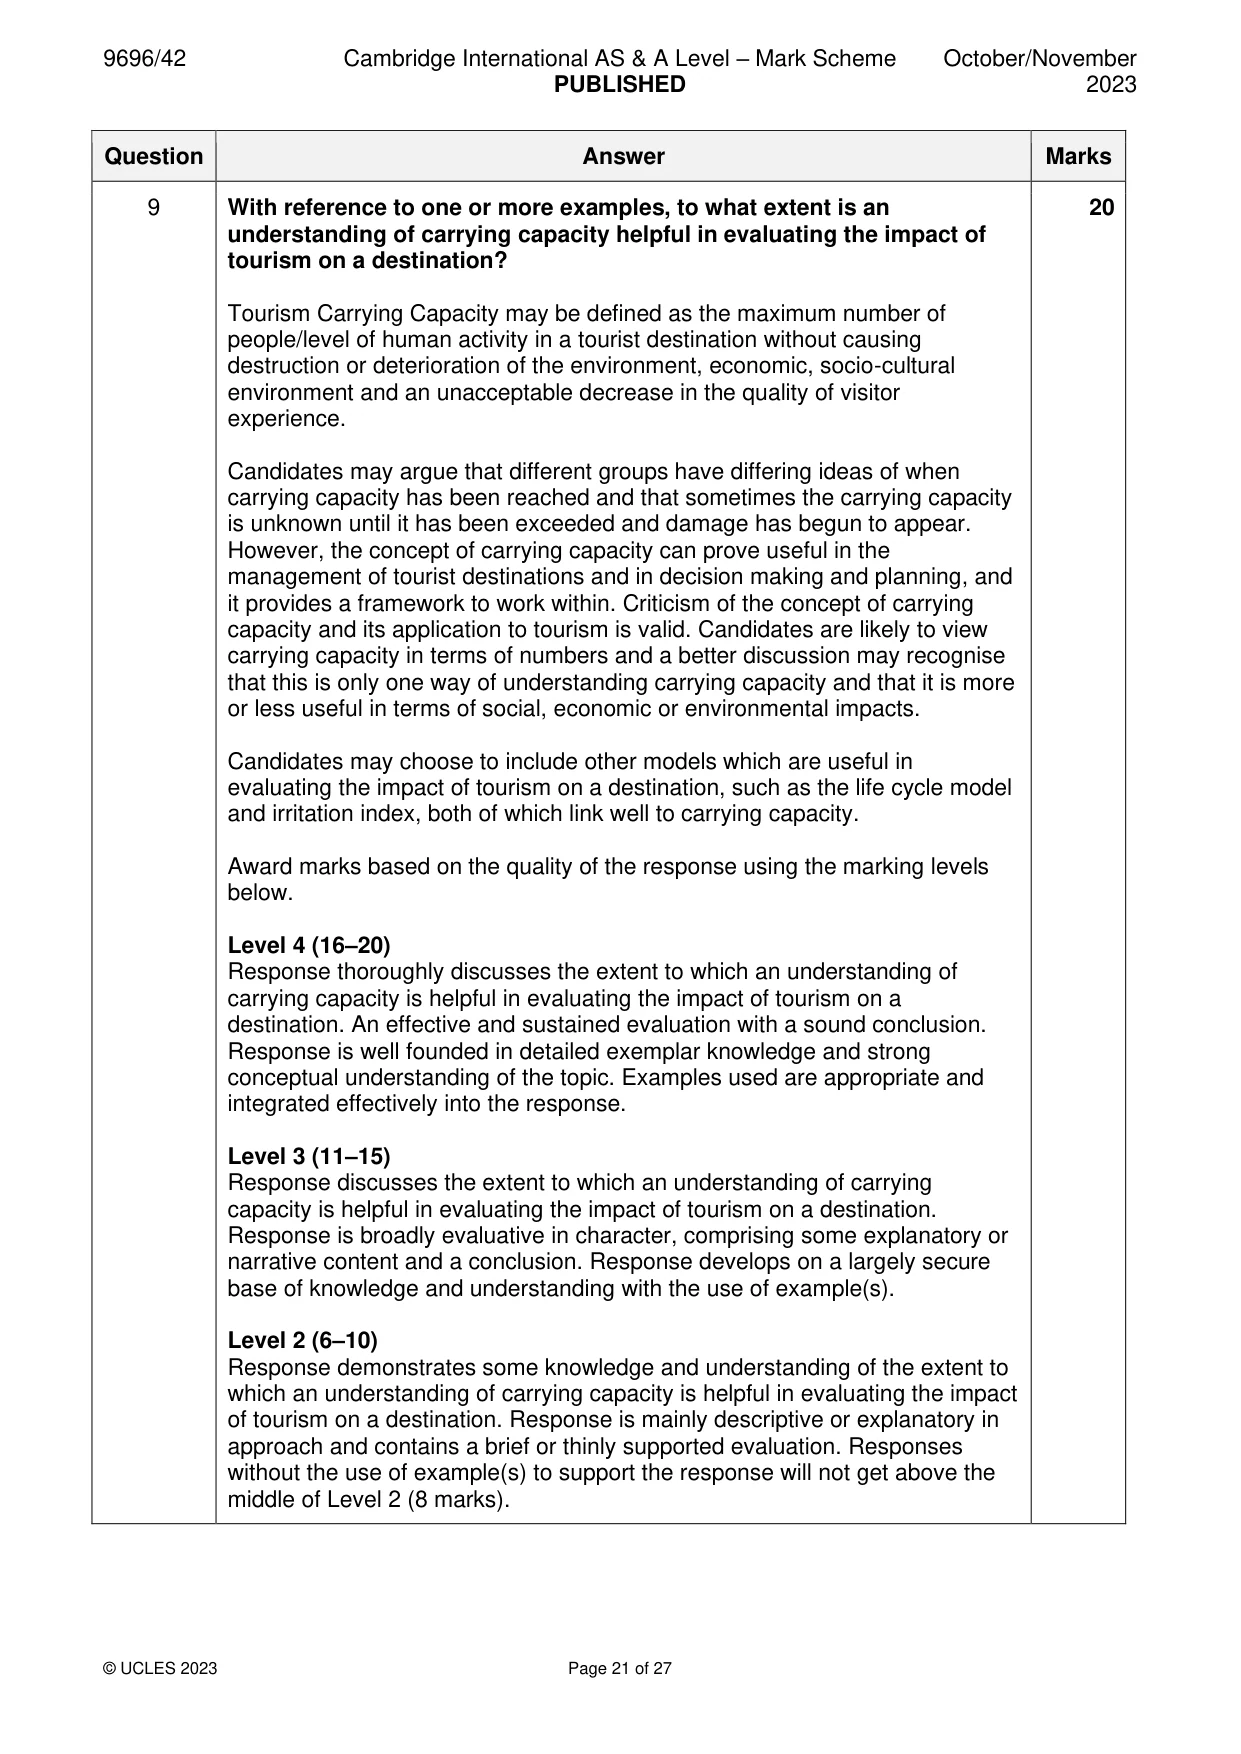
Q9 · With reference to one or more examples, to what extent is an understanding of carrying…
9 With reference to one or more examples, to what extent is an understanding of carrying capacity helpful in evaluating the impact of tourism on a destination? [20] Economic transition If answering this option, answer Question 10 and either Question 11 or Question 12.
Mark scheme: 9 With reference to one or more examples, to what extent is an 20 understanding of carrying capacity helpful in evaluating the impact of tourism on a destination? Tourism Carrying Capacity may be defined as the maximum number of people/level of human activity in a tourist destination without causing destruction or deterioration of the environment, economic, socio-cultural environment and an unacceptable decrease in the quality of visitor experience. Candidates may argue that different groups have differing ideas of when carrying capacity has been reached and that sometimes the carrying capacity is unknown until it has been exceeded and damage has begun to appear. However, the concept of carrying capacity can prove useful in the management of tourist destinations and in decision making and planning, and it provides a framework to work within. Criticism of the concept of carrying capacity and its application to tourism is valid. Candidates are likely to view carrying capacity in terms of numbers and a better discussion may recognise that this is only one way of understanding carrying capacity and that it is more or less useful in terms of social, economic or environmental impacts. Candidates may choose to include other models which are useful in evaluating the impact of tourism on a destination, such as the life cycle model and irritation index, both of which link well to carrying capacity. Award marks based on the quality of the response using the marking levels below. Level 4 (16–20) Response thoroughly discusses the extent to which an understanding of carrying capacity is helpful in evaluating the impact of tourism on a destination. An effective and sustained evaluation with a sound conclusion. Response is well founded in detailed exemplar knowledge and strong conceptual understanding of the topic. Examples used are appropriate and integrated effectively into the response. Level 3 (11–15) Response discusses the extent to which an understanding of carrying capacity is helpful in evaluating the impact of tourism on a destination. Response is broadly evaluative in character, comprising some explanatory or narrative content and a conclusion. Response develops on a largely secure base of knowledge and understanding with the use of example(s). Level 2 (6–10) Response demonstrates some knowledge and understanding of the extent to which an understanding of carrying capacity is helpful in evaluating the impact of tourism on a destination. Response is mainly descriptive or explanatory in approach and contains a brief or thinly supported evaluation. Responses without the use of example(s) to support the response will not get above the middle of Level 2 (8 marks). 9 Level 1 (1–5) Response makes a few general points about carrying capacity and/or the impact of tourism on a destination. A descriptive response comprising a few simple points. Knowledge is basic and understanding may be poor and lack relevance to the question set. Level 0 (0) No creditable response. Economic transition If answering this option, answer Question 10 and either Question 11 or Question 12.
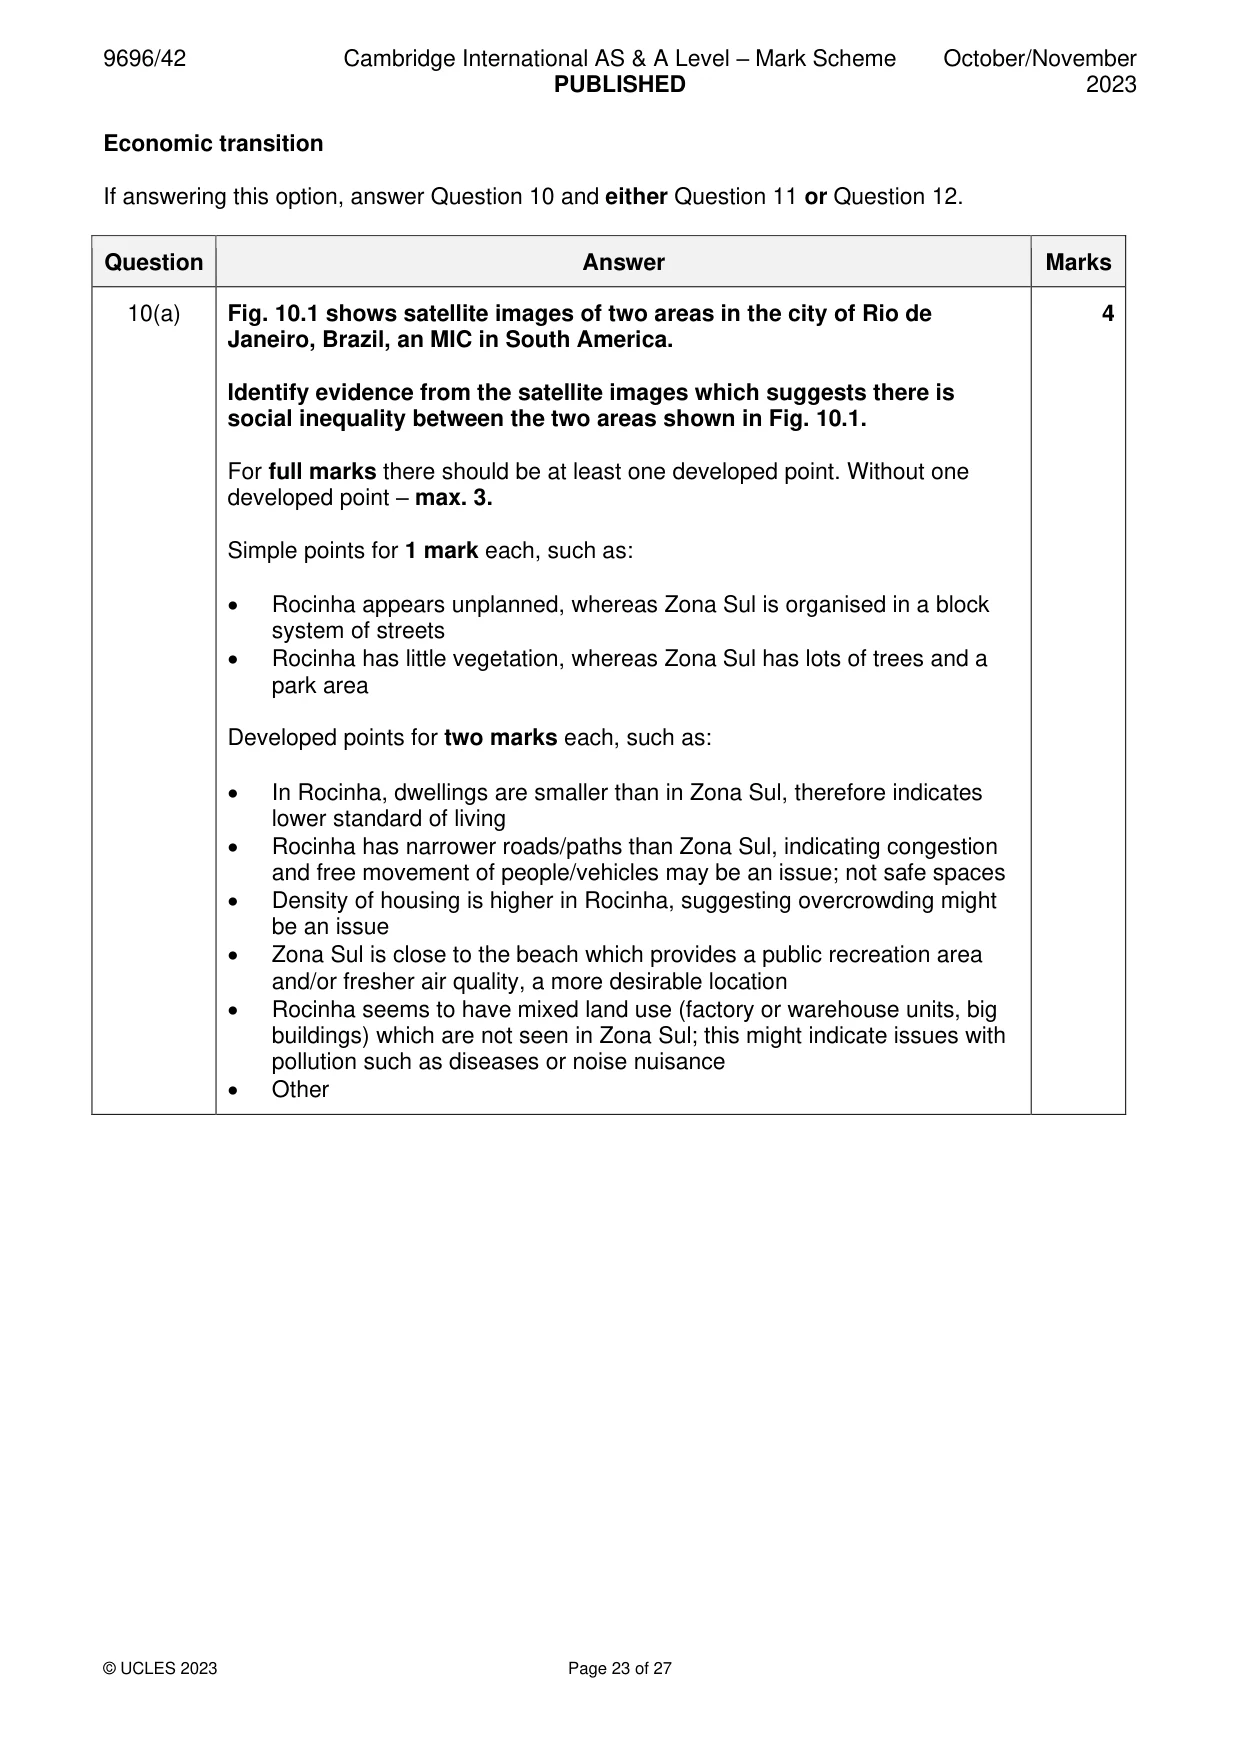
Q10 · Satellite images of two areas in the city of Rio de Janeiro, Brazil, an MIC in South…
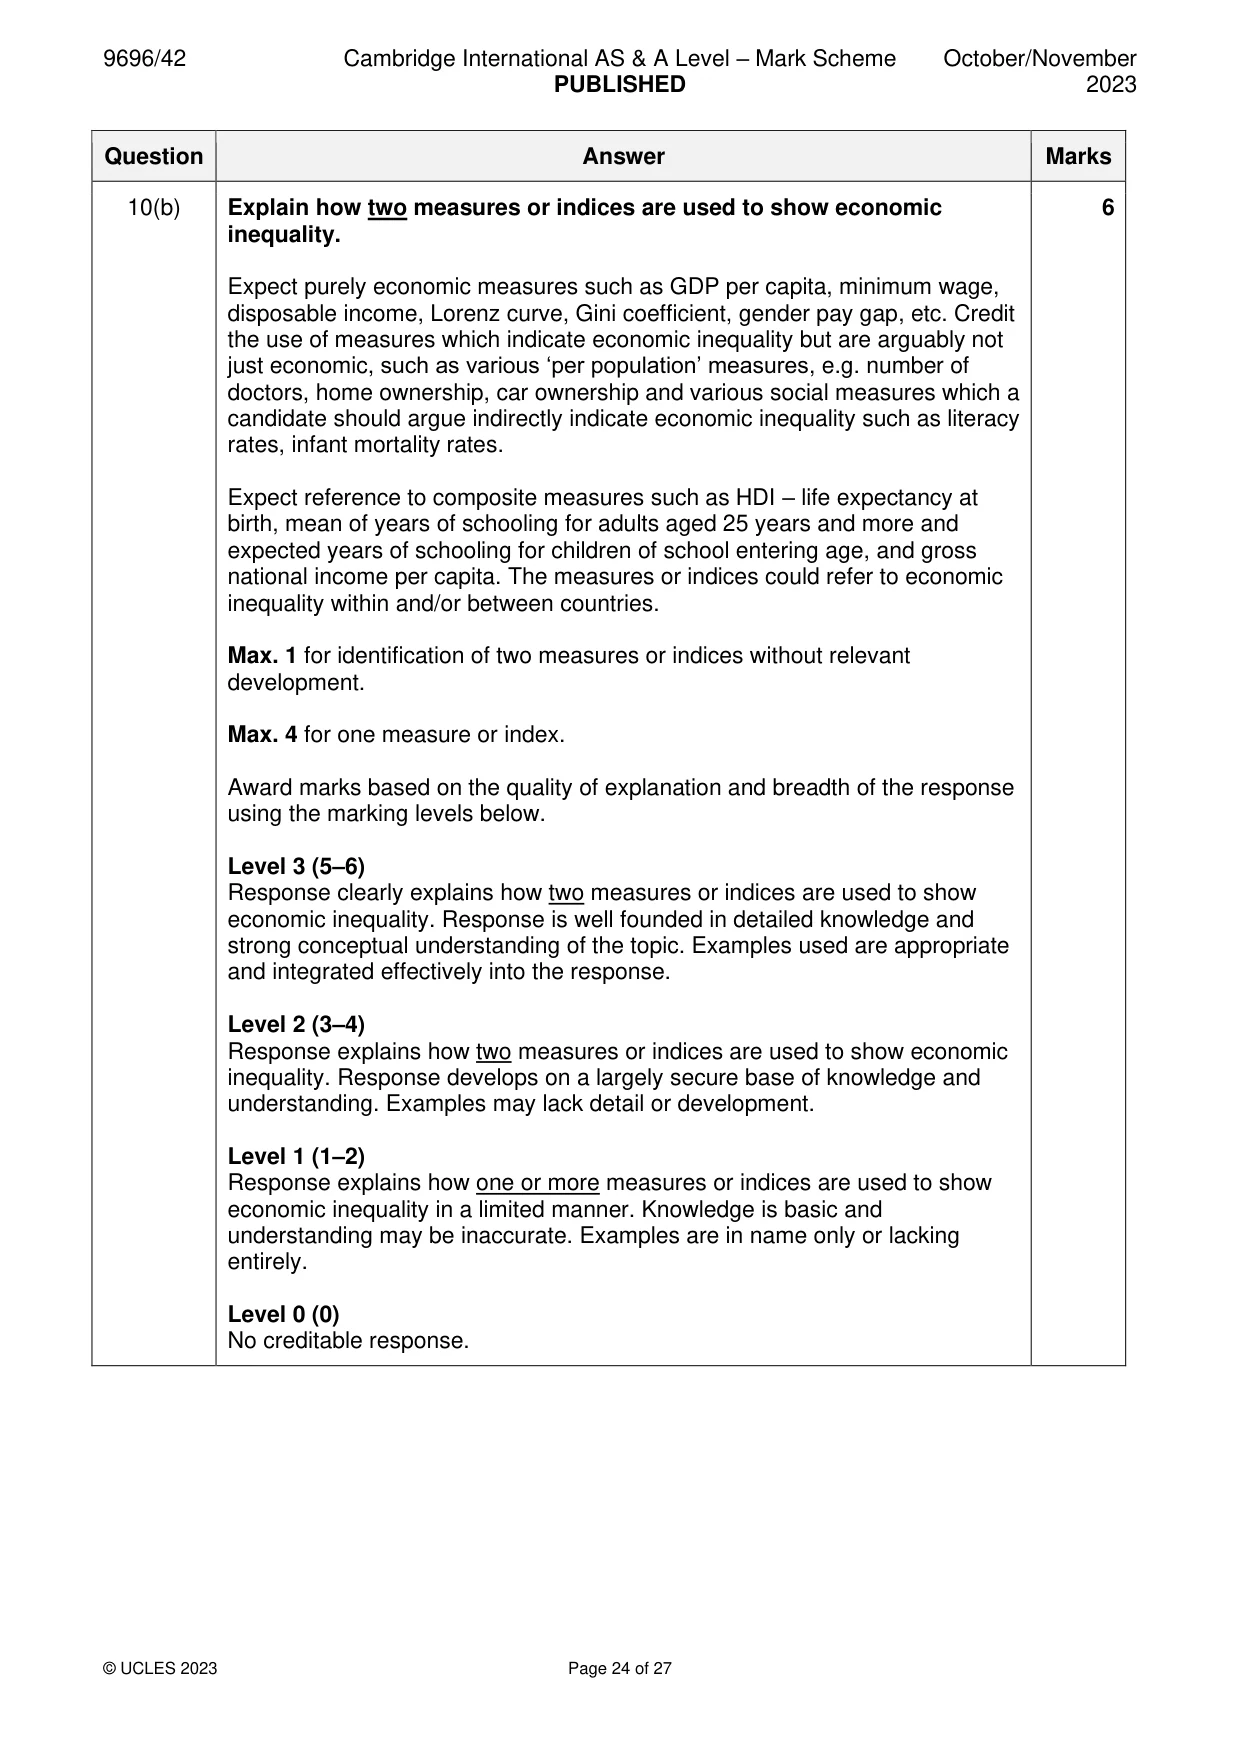
10 Fig. 10.1 shows satellite images of two areas in the city of Rio de Janeiro, Brazil, an MIC in South America. (a) Identify evidence from the satellite images which suggests there is social inequality between the two areas shown in Fig. 10.1. [4] (b) Explain how two measures or indices are used to show economic inequality. [6]
Mark scheme: 10(a) Fig. 10.1 shows satellite images of two areas in the city of Rio de 4 Janeiro, Brazil, an MIC in South America. Identify evidence from the satellite images which suggests there is social inequality between the two areas shown in Fig. 10.1. For full marks there should be at least one developed point. Without one developed point – max. 3. Simple points for 1 mark each, such as: • Rocinha appears unplanned, whereas Zona Sul is organised in a block system of streets • Rocinha has little vegetation, whereas Zona Sul has lots of trees and a park area Developed points for two marks each, such as: • In Rocinha, dwellings are smaller than in Zona Sul, therefore indicates lower standard of living • Rocinha has narrower roads/paths than Zona Sul, indicating congestion and free movement of people/vehicles may be an issue; not safe spaces • Density of housing is higher in Rocinha, suggesting overcrowding might be an issue • Zona Sul is close to the beach which provides a public recreation area and/or fresher air quality, a more desirable location • Rocinha seems to have mixed land use (factory or warehouse units, big buildings) which are not seen in Zona Sul; this might indicate issues with pollution such as diseases or noise nuisance • Other 10(b) Explain how two measures or indices are used to show economic 6 inequality. Expect purely economic measures such as GDP per capita, minimum wage, disposable income, Lorenz curve, Gini coefficient, gender pay gap, etc. Credit the use of measures which indicate economic inequality but are arguably not just economic, such as various ‘per population’ measures, e.g. number of doctors, home ownership, car ownership and various social measures which a candidate should argue indirectly indicate economic inequality such as literacy rates, infant mortality rates. Expect reference to composite measures such as HDI – life expectancy at birth, mean of years of schooling for adults aged 25 years and more and expected years of schooling for children of school entering age, and gross national income per capita. The measures or indices could refer to economic inequality within and/or between countries. Max. 1 for identification of two measures or indices without relevant development. Max. 4 for one measure or index. Award marks based on the quality of explanation and breadth of the response using the marking levels below. Level 3 (5–6) Response clearly explains how two measures or indices are used to show economic inequality. Response is well founded in detailed knowledge and strong conceptual understanding of the topic. Examples used are appropriate and integrated effectively into the response. Level 2 (3–4) Response explains how two measures or indices are used to show economic inequality. Response develops on a largely secure base of knowledge and understanding. Examples may lack detail or development. Level 1 (1–2) Response explains how one or more measures or indices are used to show economic inequality in a limited manner. Knowledge is basic and understanding may be inaccurate. Examples are in name only or lacking entirely. Level 0 (0) No creditable response.
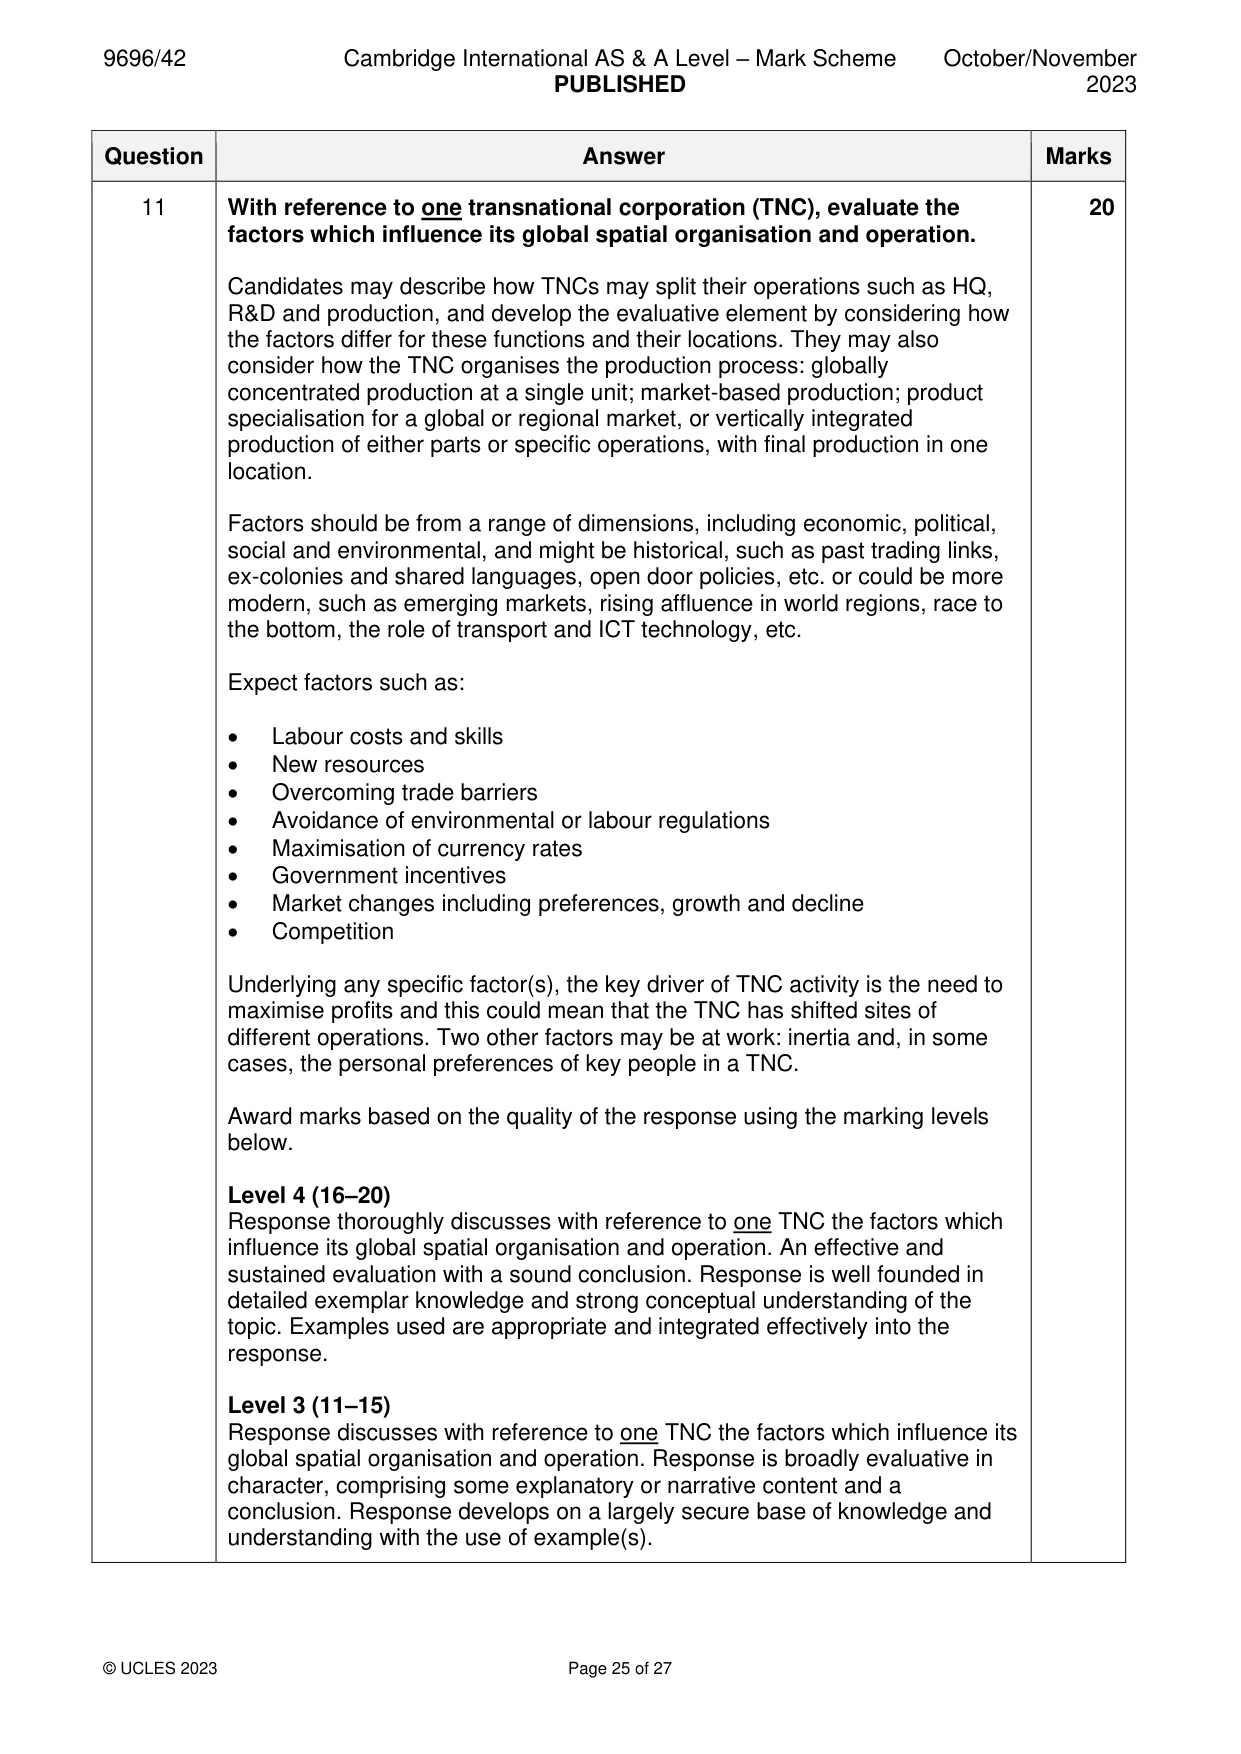
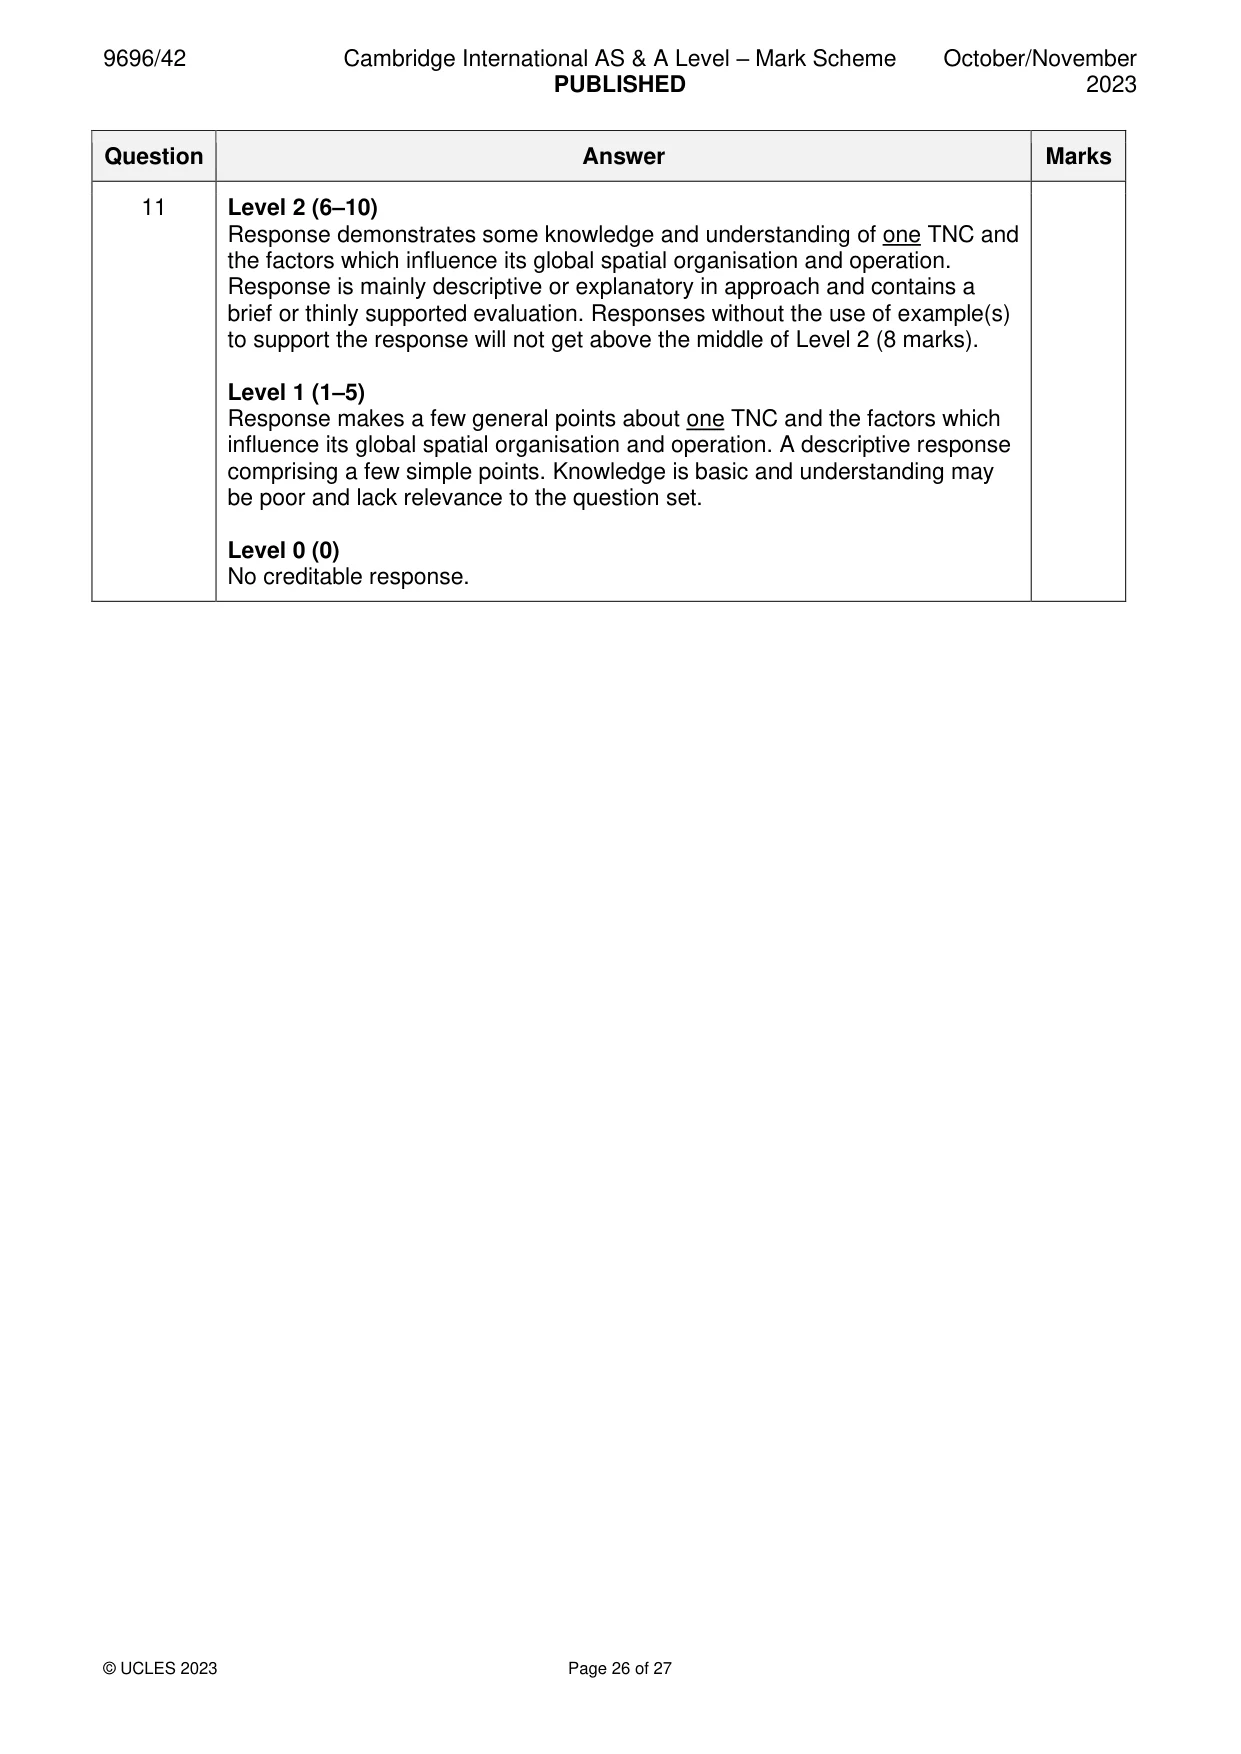
Q11 · With reference to one transnational corporation (TNC), evaluate the factors which…
11 With reference to one transnational corporation (TNC), evaluate the factors which influence its global spatial organisation and operation. [20]
Mark scheme: 11 With reference to one transnational corporation (TNC), evaluate the 20 factors which influence its global spatial organisation and operation. Candidates may describe how TNCs may split their operations such as HQ, R&D and production, and develop the evaluative element by considering how the factors differ for these functions and their locations. They may also consider how the TNC organises the production process: globally concentrated production at a single unit; market-based production; product specialisation for a global or regional market, or vertically integrated production of either parts or specific operations, with final production in one location. Factors should be from a range of dimensions, including economic, political, social and environmental, and might be historical, such as past trading links, ex-colonies and shared languages, open door policies, etc. or could be more modern, such as emerging markets, rising affluence in world regions, race to the bottom, the role of transport and ICT technology, etc. Expect factors such as: • Labour costs and skills • New resources • Overcoming trade barriers • Avoidance of environmental or labour regulations • Maximisation of currency rates • Government incentives • Market changes including preferences, growth and decline • Competition Underlying any specific factor(s), the key driver of TNC activity is the need to maximise profits and this could mean that the TNC has shifted sites of different operations. Two other factors may be at work: inertia and, in some cases, the personal preferences of key people in a TNC. Award marks based on the quality of the response using the marking levels below. Level 4 (16–20) Response thoroughly discusses with reference to one TNC the factors which influence its global spatial organisation and operation. An effective and sustained evaluation with a sound conclusion. Response is well founded in detailed exemplar knowledge and strong conceptual understanding of the topic. Examples used are appropriate and integrated effectively into the response. Level 3 (11–15) Response discusses with reference to one TNC the factors which influence its global spatial organisation and operation. Response is broadly evaluative in character, comprising some explanatory or narrative content and a conclusion. Response develops on a largely secure base of knowledge and understanding with the use of example(s). 11 Level 2 (6–10) Response demonstrates some knowledge and understanding of one TNC and the factors which influence its global spatial organisation and operation. Response is mainly descriptive or explanatory in approach and contains a brief or thinly supported evaluation. Responses without the use of example(s) to support the response will not get above the middle of Level 2 (8 marks). Level 1 (1–5) Response makes a few general points about one TNC and the factors which influence its global spatial organisation and operation. A descriptive response comprising a few simple points. Knowledge is basic and understanding may be poor and lack relevance to the question set. Level 0 (0) No creditable response.
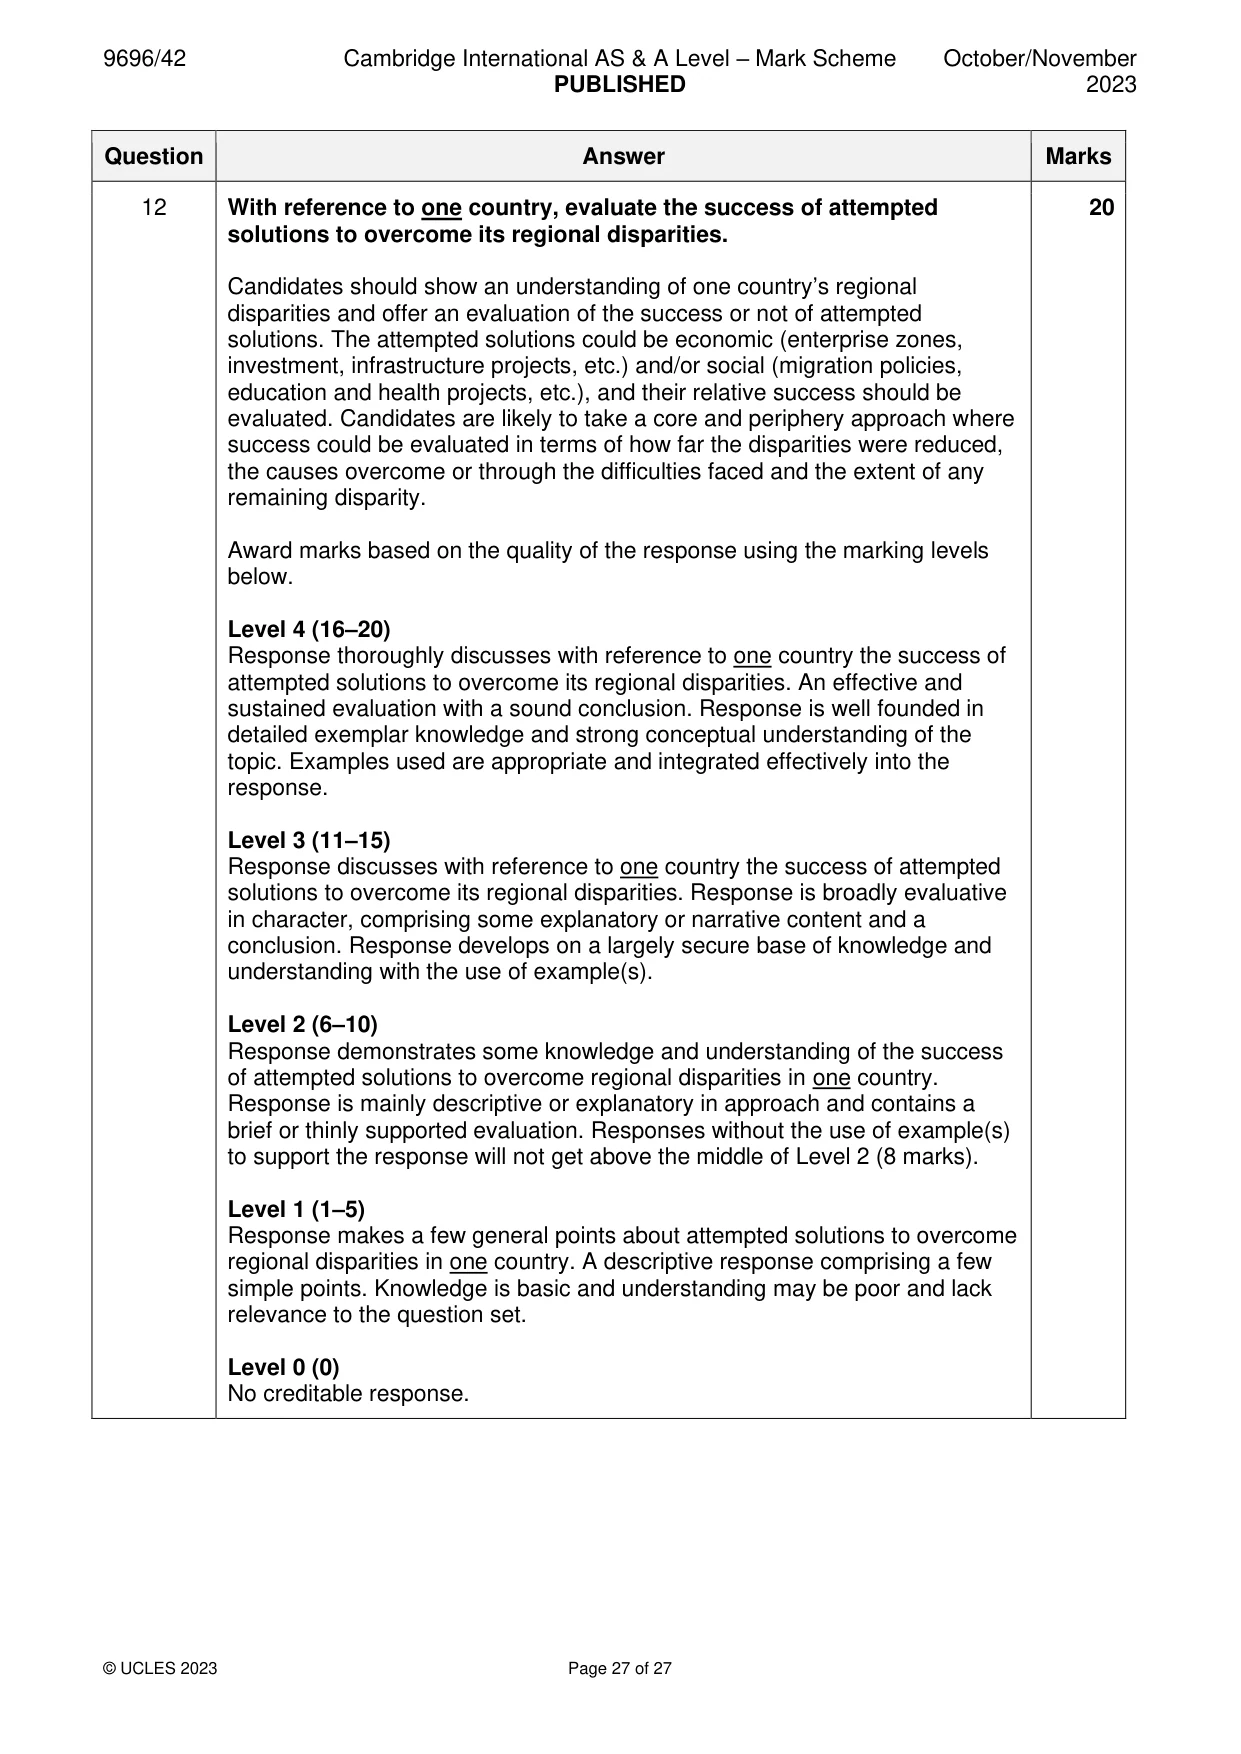
Q12 · With reference to one country, evaluate the success of attempted solutions to overcome…
12 With reference to one country, evaluate the success of attempted solutions to overcome its regional disparities. [20]
Mark scheme: 12 With reference to one country, evaluate the success of attempted 20 solutions to overcome its regional disparities. Candidates should show an understanding of one country’s regional disparities and offer an evaluation of the success or not of attempted solutions. The attempted solutions could be economic (enterprise zones, investment, infrastructure projects, etc.) and/or social (migration policies, education and health projects, etc.), and their relative success should be evaluated. Candidates are likely to take a core and periphery approach where success could be evaluated in terms of how far the disparities were reduced, the causes overcome or through the difficulties faced and the extent of any remaining disparity. Award marks based on the quality of the response using the marking levels below. Level 4 (16–20) Response thoroughly discusses with reference to one country the success of attempted solutions to overcome its regional disparities. An effective and sustained evaluation with a sound conclusion. Response is well founded in detailed exemplar knowledge and strong conceptual understanding of the topic. Examples used are appropriate and integrated effectively into the response. Level 3 (11–15) Response discusses with reference to one country the success of attempted solutions to overcome its regional disparities. Response is broadly evaluative in character, comprising some explanatory or narrative content and a conclusion. Response develops on a largely secure base of knowledge and understanding with the use of example(s). Level 2 (6–10) Response demonstrates some knowledge and understanding of the success of attempted solutions to overcome regional disparities in one country. Response is mainly descriptive or explanatory in approach and contains a brief or thinly supported evaluation. Responses without the use of example(s) to support the response will not get above the middle of Level 2 (8 marks). Level 1 (1–5) Response makes a few general points about attempted solutions to overcome regional disparities in one country. A descriptive response comprising a few simple points. Knowledge is basic and understanding may be poor and lack relevance to the question set. Level 0 (0) No creditable response.
What was in this paper
The subtopics covered by these 12 questions, and how many questions each got. Open one in a new tab to see every Cambridge question on it.
2International debt and international aid1Manufacturing and related service industry1National development1Sustainable energy supplies1The management of a degraded environment1The management of a tourist destination1The management of change in manufacturing industry1The management of regional development1Trade flows and trading patterns1Urban trends and issues of urbanisation1What you needed in this session
Cambridge’s own grade thresholds for 2023 Oct/Nov, Paper 4 · Variant 2. A higher threshold means an easier paper — the bar moves with how the cohort did.